research article open access nutrition … · nutrition surveillance using a small open cohort:...
TRANSCRIPT

Altmann et al. Emerg Themes Epidemiol (2016) 13:12 DOI 10.1186/s12982-016-0052-0
RESEARCH ARTICLE
Nutrition surveillance using a small open cohort: experience from Burkina FasoMathias Altmann1*, Christophe Fermanian2, Boshen Jiao3, Chiara Altare1, Martin Loada4 and Mark Myatt5
Abstract Background: Nutritional surveillance remains generally weak and early warning systems are needed in areas with high burden of acute under-nutrition. In order to enhance insight into nutritional surveillance, a community-based sentinel sites approach, known as the Listening Posts (LP) Project, was piloted in Burkina Faso by Action Contre la Faim (ACF). This paper presents ACF’s experience with the LP approach and investigates potential selection and observa-tional biases.
Methods: Six primary sampling units (PSUs) were selected in each livelihood zone using the centric systematic area sampling methodology. In each PSU, 22 children aged between 6 and 24 months were selected by proximity sam-pling. The prevalence of GAM for each month from January 2011 to December 2013 was estimated using a Bayesian normal–normal conjugate analysis followed by PROBIT estimation. To validate the LP approach in detecting changes over time, the time trends of MUAC from LP and from five cross-sectional surveys were modelled using polynomial regression and compared by using a Wald test. The differences between prevalence estimates from the two data sources were used to assess selection and observational biases.
Results: The 95 % credible interval around GAM prevalence estimates using LP approach ranged between +6.5 %/−6.0 % on a prevalence of 36.1 % and +3.5 %/−2.9 % on a prevalence of 10.8 %. LP and cross-sectional sur-veys time trend models were well correlated (p = 0.6337). Although LP showed a slight but significant trend for GAM to decrease over time at a rate of −0.26 %/visit, the prevalence estimates from the two data sources showed good agreement over a 3-year period.
Conclusions: The LP methodology has proved to be valid in following trends of GAM prevalence for a period of 3 years without selection bias. However, a slight observational bias was observed, requiring a periodical reselection of the sentinel sites. This kind of surveillance project is suited to use in areas with high burden of acute under-nutrition where early warning systems are strongly needed. Advocacy is necessary to develop sustainable nutrition surveillance system and to support the use of surveillance data in guiding nutritional programs.
Keywords: Nutrition, Surveillance, Burkina Faso, Selection bias, Observational bias, Humanitarian
© The Author(s) 2016. This article is distributed under the terms of the Creative Commons Attribution 4.0 International License (http://creativecommons.org/licenses/by/4.0/), which permits unrestricted use, distribution, and reproduction in any medium, provided you give appropriate credit to the original author(s) and the source, provide a link to the Creative Commons license, and indicate if changes were made. The Creative Commons Public Domain Dedication waiver (http://creativecommons.org/publicdomain/zero/1.0/) applies to the data made available in this article, unless otherwise stated.
BackgroundNutrition surveillance means “to watch over nutrition in order to make decisions that lead to improvements in nutrition in populations” [1]. Nutrition surveillance refers to a continuous process and focuses on monitor-ing trends over time, rather than providing one-time estimates of (e.g.) absolute levels of the prevalence of
malnutrition, in order to identify and respond to crises in a timely manner [2].
Although they have been recognized as an important component in fighting malnutrition, nutritional surveil-lance systems remain weak in most developing countries [3]. Reasons for this include (1) no common agreement on the best methods to implement nutrition surveillance, (2) a lack of confidence in surveillance data, and (3) lit-tle comparable data on the costs of different potentially effective systems that would justify investments in such a system [2, 4]. It is, therefore, essential for practitioners
Open Access
Emerging Themes inEpidemiology
*Correspondence: [email protected] 1 Action Contre la Faim, 16 Boulevard Douaumont, 75017 Paris, FranceFull list of author information is available at the end of the article

Page 2 of 10Altmann et al. Emerg Themes Epidemiol (2016) 13:12
to share experiences regarding nutritional surveillance in order to provide insights into what works and what does not work in the field.
Nutritional surveillance data tend to come from two main sources: administrative (e.g. health facility/feed-ing centre caseloads and schools health services reports) and repeated probability sample household surveys [2, 5]. Limitations of administrative data are well known. There may be a selection bias due to incomplete distribu-tion of facilities and populations that are covered by pro-grams contributing data [6]. Even when the facilities are well running, only people with better access may attend clinics or nutrition program sites, thus underestimating the true prevalence/incidence of the condition of inter-est. Furthermore, unless active case-finding is used, ben-eficiaries may tend to come to the facilities only when the disease is severe. This means that indicators may lag behind incidence, making surveillance data inappropri-ate for an early warning system. The second data source, repeated probability sample household surveys, is the most commonly used approach to nutrition surveillance [5, 7, 8]. Surveys provide a representative picture of the situation at a given time and allow comparisons over time and between geographical areas. However, unless they are repeated frequently enough, surveys may miss sea-sonal effect and cannot provide timely information on changes over time [9].
Less attention has been given to the community-based sentinel sites approach to nutrition surveillance. These surveillance systems are characterised by the selection of a small sample of communities from which a set of information is collected regularly. There are two main criticisms to the sentinel approach. First, the purposive sampling of selected sites according to predefined crite-ria (e.g. the most “vulnerable” settlements) results into non-representative estimates (likely overestimates) [4]. Second, an observational effect that acts to reduce preva-lence over time as the selected sites tend to be progres-sively positively affected by the inputs of the survey teams (e.g. giving education, advice and counselling, referral of cases for treatment, and treating illness) [10]. It is not clear, however, that a statistically representative sample, as might be used in a population survey, is an essential attribute of a surveillance system. It may, for example, be more useful to select and watch over communities that are vulnerable to shocks so as to detect potential crises early in their development. Experiences of sentinel sites nutrition surveillance have been reported from Sudan [11] and the Central African Republic [12].
This paper presents the experience of the international non-governmental organization Action Contre la Faim (ACF) with nutrition surveillance using a community-based sentinel sites approach, known as the Listening
Posts (LP) project. We established a surveillance system in order to estimate nutritional and food security needs and to identify when and where these needs were high-est. The system was set up to describe patterns over time, and also to provide accurate estimates of the point preva-lence of acute undernutrition and to provide predictions of the caseloads. In this paper, we report and examine our experience in Burkina Faso in order to assess the reliabil-ity and validity of the LP method compared to repeated cross-sectional surveys in terms of selection and obser-vation biases.
MethodsSelection of livelihood zonesCriteria for selecting the setting were as follow: existence of a programme implemented by ACF; availability of suf-ficient capacity to conduct surveillance; nationally and locally weak nutrition information systems in the gov-ernment sector; no other sentinel surveillance system in place in the government sector; involvement of the gov-ernment in the selection of the livelihood zone (LHZ); and “vulnerability” of LHZ on the basis of an Household Economy Approach (HEA) food security assessment [13]. The LHZ was defined as a geographical area where peo-ple share broadly the same patterns of access to food and income, and have the same access to local markets.
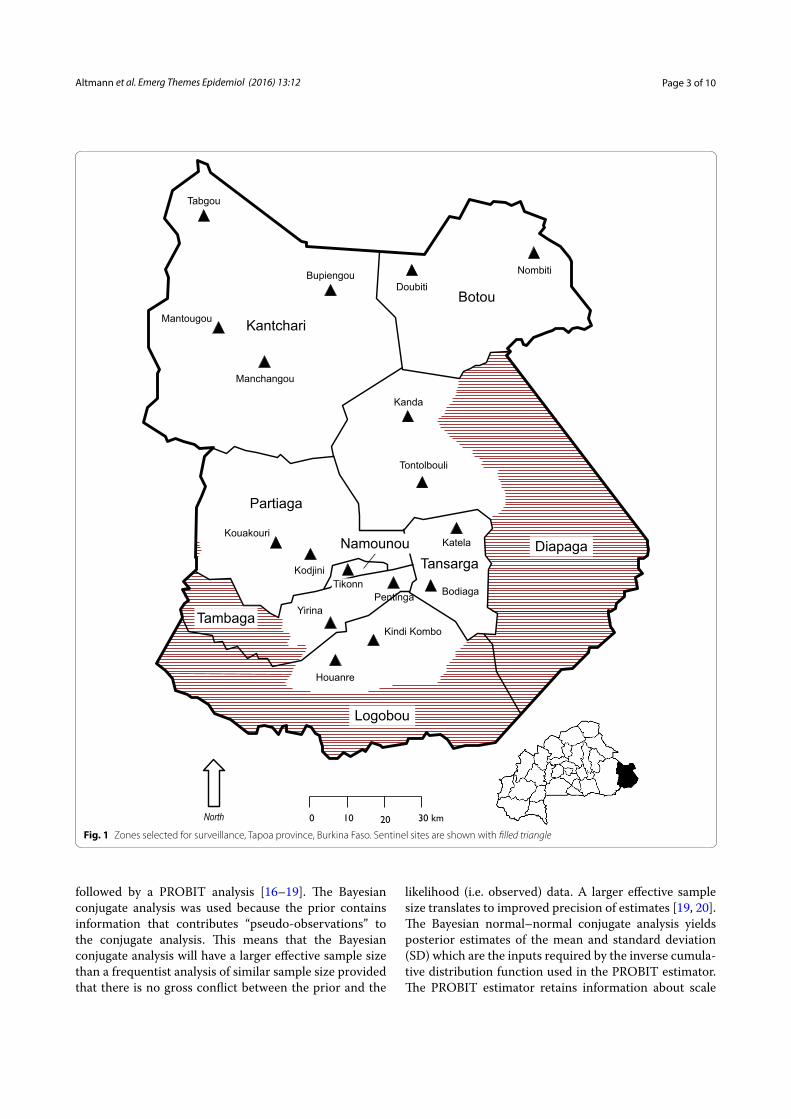
Based on our selection criteria, we piloted our meth-odology in Tapoa province (Burkina Faso). In 2011, Tapoa province had a population of about 400,000 peo-ple, 17.4 % of which were children under the age of five [14]. Prevalence of Global Acute Malnutrition (GAM) (defined as weight-for-height Z-score <−2) was estimated to be 12.3 % (9.5–15.9 %) in children aged between 6 and 59 months [15]. This is one of the highest GAM preva-lence in the country. Surveillance started in January 2011 in 3 LHZ (Fig. 1): (1) agro-pastoral (north) (2) subsistence farming (centre) (3) cash farming and hunting (south).
Sample size calculationThe sample size was calculated taking both accuracy and costs into account, keeping in mind that low cost is an important factor for the sustainability of surveillance systems. The following aspects were included in the cal-culation of the sample size: (1) age range was reduced to 6–24 months. Besides the fact that this reduced the size of the universe (small population), this age group is most vulnerable to acute malnutrition; (2) semi-longitudinal design: the use of an “open cohort” (see “top-up replace-ment and referral” below) decreased the required sample size through reduction of between round sampling vari-ation compared to taking a new sample at each round; (3) estimation of GAM was done using a Bayesian nor-mal–normal conjugate analysis with an objective prior
Page 3 of 10Altmann et al. Emerg Themes Epidemiol (2016) 13:12
followed by a PROBIT analysis [16–19]. The Bayesian conjugate analysis was used because the prior contains information that contributes “pseudo-observations” to the conjugate analysis. This means that the Bayesian conjugate analysis will have a larger effective sample size than a frequentist analysis of similar sample size provided that there is no gross conflict between the prior and the
likelihood (i.e. observed) data. A larger effective sample size translates to improved precision of estimates [19, 20]. The Bayesian normal–normal conjugate analysis yields posterior estimates of the mean and standard deviation (SD) which are the inputs required by the inverse cumula-tive distribution function used in the PROBIT estimator. The PROBIT estimator retains information about scale
Fig. 1 Zones selected for surveillance, Tapoa province, Burkina Faso. Sentinel sites are shown with filled triangle

Page 4 of 10Altmann et al. Emerg Themes Epidemiol (2016) 13:12
and variability that is lost by the classical approach when the data are coded to a case/not case binary variable. This retained information allows the PROBIT approach to return estimates with improved precision compared to the classical (i.e. case counting) approach [17, 18], mak-ing the method well suited to work with small samples. With these conditions, and using computer-based simu-lations using data derived from cross-sectional surveys, we calculated that a sample size of n = 96 from each LHZ could be expected to yield a 95 % credible interval (CI) of ±10 % or better at any level of prevalence. A sample size of n = 132 children was selected in order to ensure that useful precision is achieved.
Sampling and eligibility criteriaA two-stage cluster sample of children was taken from each selected LHZ. Six primary sampling units (PSUs), also called “Listening Posts”, were selected using the cen-tric systematic area sampling (CSAS) methodology, by which the sample selected was reasonably evenly distrib-uted across the survey area. This type of sample provides implicit stratification by spreading the sample properly among sub-groups of the population such as rural, urban, peri-urban populations, administrative areas, ethnic sub-populations, religious sub-populations, and socio-eco-nomic groups [21–25]. This tends to improve precision of survey estimates from survey data. In the second sam-pling stage, we selected 22 children from each Listening Post (PSUs) using the Expanded Program on Immuniza-tion (EPI) household sampling scheme: the first house-hold was selected by choosing a random direction from the centre of the community, counting the houses along that route, and picking one at random, and the sam-pling was continued by choosing the household nearest to the preceding one that included an eligible child [26]. All children aged between 6 and 24 months in selected households were included in the sample. Since a child falling into such a narrow age range would not be found in every household, the sample was spread widely across the PSU community [26]. This procedure provided the same advantage as implicit stratification by ensuring that all parts of the PSU were sampled.
Top-up replacement and referralWhen a child reached his or her second birthday, they were replaced by another child aged between 6 and 9 months not already in the cohort (the “top-up sample”) from the nearest household with an eligible child. Before being replaced, nutritional measurements were done and the survey questionnaire administered. A dead or lost-to-follow up (e.g. moved away) child was replaced by another child not already in the cohort and of similar age from the nearest household with an eligible child. These
procedures ensured that the age structure of the cohort remained constant between surveillance rounds so that prevalence estimates would not be influenced by aging of the surveillance cohort. All children with a mid-upper arm circumference (MUAC) below 125 mm, as well as sick children, were referred to the nearest health centre.
Data collectionTwo interviewers for the three LHZ were trained to perform the sampling protocol, the required anthropo-metric measurements, and apply the survey question-naire. Regular supervisions were conducted to ensure anthropometric measurements were done correctly. Each interviewer visited one Listening Post (PSU) per day, and performed interviews of mothers and measure-ments (weight and MUAC) of 22 children and top-up sampling when this was required. Data were collected during the first 2 weeks of each month. In order to avoid an interviewer bias, monthly rotations were organ-ized in the visited LP between the two interviewers. 36 monthly rounds of data collection were performed and are included in the analysis presented here. Anthropo-metric measurement (weight and MUAC), morbid-ity (prevalence of diarrhoea in the last 15 days), infant and young child feeding (IYCF) practices, food secu-rity, and water, sanitation and hygiene (WASH) indica-tors were collected using a paper based questionnaire. In this article, we will concentrate on the prevalence of global acute malnutrition (GAM), defined as MUAC <125 mm, which is recognized as a sensible indicator to capture variations of the nutrition status at community level [27]. One supervisor prepared the planning of the interviewer, the questionnaires, checked for missing data and validated the data for analysis. Data was entered into an Excel spread sheet, together with quality assurance mechanisms such as cross-field consistency checks, legal value, and range checks.
Data analysisDesign effect was calculated by dividing the standard error (SE) with clustering by the SE without clustering. For continuous variables, median and Inter-Quartile-Range (IQR) were calculated for the entire study period. The prevalence of GAM was estimated by MUAC with a case-defining threshold of 125 mm using a Bayesian nor-mal–normal conjugate analysis followed by a PROBIT estimation approach. In the work reported, an objec-tive prior was specified using the sex-combined median MUAC-for-age and the square of the sex-combined median negative z-score for children aged between 6 and 24 months taken from the WHO’s World Growth Standard (MGRS) reference population [28]. We used the population mean and variance parameter of the MGRS

Page 5 of 10Altmann et al. Emerg Themes Epidemiol (2016) 13:12
reference populations (i.e. 145 mm and 121 mm2, respec-tively). Using these parameters, the equation used to esti-mate the mean MUAC was:
where n is the number of children in the sample and x̄ is the mean MUAC observed in the survey.
We used these values (i.e. the posterior mean and vari-ance) to find the 95 % credible interval for the posterior mean using the inverse cumulative normal distribution (NORMINV) function in Microsoft Excel. We trans-lated the posterior mean and the associated 95 % cred-ible interval into a proportion (i.e. prevalence) using the cumulative normal distribution (NORMDIST) function in Microsoft Excel using a threshold value of 125 mm. By using this function, we estimated the probability that a child selected at random from the monitored population would have a MUAC below 125 mm (which equates to prevalence).
Data were analysed by the program manager and vali-dated by the ACF Department for Food and Livelihoods. For the purpose of surveillance, data were analysed on a monthly basis using means and estimated propor-tions of the different collected variables. When plotting the results as a time series, the effect of sampling varia-tion was reduced by applying a simple low-pass filter (i.e. smoothing using a 3 months moving average).
Comparison between LP and cross-sectional surveysThe external validity of the estimates from the LP survey was assessed by comparing the time trend and variability of LP data with that from other data sources. In Burkina Faso, available data included nutritional cross-sectional surveys using the Standardized Monitoring and Assess-ment of Relief and Transitions (SMART) methodology [29], conducted by ACF in Tapoa Province in March 2011, May 2012, December 2012, May 2013 and October 2013 (data not published but available upon request). In order to have the same age group as used for the LP sur-veillance system, only 6–24 months aged children were kept from the cross-sectional surveys.
First, the individual data of LP surveys from all the three LHZ were pooled. We modelled the time trends of continuous MUAC for both LP and cross-sectional data through forward stepwise curvilinear regression weighted by the population in each LHZ. Time (T), squared time (T2) and cubed time (T3) were entered into the model as independent variables. This led to the fol-lowing polynomial model:
(1)µ|survey data ∼ N
!
145+ nx̄
n+ 1,121
n+ 1
"
(2)Y = β0 + β1T+ β2T2 + β3T
3
where Y is the continuous MUAC of the individuals assessed at time T, β0 is the intercept of the model, β1, β2 and β3 are the coefficients of respective terms T, T2 and T3.
Second, in order to compare estimates from the LP and cross-sectional surveys, we built a regression model by pooling data from both the LP and cross-sectional sur-veys sources and adding a new binary variable (W) with the value one when the corresponding data were from LP survey and zero when from cross-sectional survey. This led to the following model:
where Y is the continuous MUAC of the individuals from both LP and cross-sectional data assessed at time T. β ′
0 is the intercept of model, β ′
1,β′2 and β ′
3 are the coefficients of respective terms T, T2 and T3, and W is the new vari-able mentioned above. Then we performed a Wald test to determine whether this new variable made a statistically significant improvement to the global regression model and to determine whether the coefficients in the LP and cross-sectional surveys models were significantly differ-ent from each other.
Third, we calculated the monthly mean MUAC for cross-sectional surveys and for LP separately, with pooled data weighted by the population of each LHZ. Using the Bayesian-PROBIT estimator, the prevalence of GAM was estimated for each data source, and the differences (D) in prevalence estimates between these two data sources plotted. We calculated the mean difference (D̄), the SD of the differences, and the estimated limits of agreement as D̄ ± 1.96 SD. Agreement between the results from cross-sectional surveys and LP data was defined as being within these estimated limits of agreement [30]. To investigate the trend for differences in GAM prevalence as a func-tion of time (observational bias), the associated least squares line was calculated using a simple regression of the form:
where Y is the absolute differences (D) in prevalence esti-mates between LP and cross-sectional surveys assessed at time T ′′,β ′′
0 is the intercept of regression line and β ′′1
is the coefficient associated with time. The time at which differences would become significant was estimated as the point where this line crossed the upper confidence limit for the mean.
ResultsCohort profileSample sizes varied over the study period and between LHZ (Table 1). Overall, median of the mean age was 15.9 months and did not change over time and between LHZ. Overall,
(3)Y = β ′0 + β ′
1T+ β ′2T
2 + β ′3T
3 + β ′4W
(4)Y = β ′′0 + β ′′
1T′′

Page 6 of 10Altmann et al. Emerg Themes Epidemiol (2016) 13:12
the SD around the mean MUAC had a median of 9.6 mm, without difference over time and between LHZ (Fig. 2).
Design effects were close to 1 over the study period and in all LHZs. The mean monthly replacement rate of the children in the cohort was 8.5 % (SD = 0.28 %) which is above the expected value due to aging of the cohort (1/18 = 5.6 %). The difference was explained by losses to follow up, defined as the absence of child at 3 consecutive visits before reaching their second birthday, which had a mean value of 2.8 % (SD = 0.17 %).
Global acute malnutrition95 % credible interval around GAM prevalence in a sin-gle LHZ ranged between +6.5 and −6.0 % on a prevalence
of 36.1 % and between +3.5 and −2.9 % on a prevalence of 10.8 %. These levels of precision are consistent with the surveillance round having an effective sample size of n = 227 and n = 362 respectively. Using n = 132 proved therefore to be suitable for the LP sample design and anal-ysis plan. The GAM prevalence estimates, based on mean MUAC, did not differ between the three LHZ’s (Fig. 3).
In the three LHZ of Tapoa province, GAM prevalence followed a seasonal variation with an increase during the dry season (January to May) and a decrease during the rainy season (June to September). Over the 3 years, GAM decreased during 2011, increased till the middle of 2013, and then decreased again during the last months of 2013 (Fig. 3).
Table 1 Characteristics of Listening Posts and cross-sectional surveys data sources, Tapoa Province, Burkina Faso, 2011–2013
DEFF design effect, IQR inter quartile range, LHZ livelihood zone, SD standard deviation
Characteristics/livelihood zone
Nord Centre South All 3 LHZ Cross-sectional surveys (3 LHZ)
Number of rounds, n 36 36 36 36 5
Sample size (number of children) median (IQR)
119 (116–132) 139 (135–144) 162 (145–164) 418 (410–423) 287 (275–367)
Mean age (months) median (IQR)
15.6 (15.2–15.9) 16.0 (15.4–16.2) 16.0 (15.9–16.2) 15.9 (15.4–16.2) 14.7 (14.4–15.1)
Mean MUAC (mm) median (IQR) 133.4 (132.0–134.0) 133.3 (131.8–134.4) 134.6 (132.6–135.4) 133.8 (132.3–134.7) 133.2 (132.9–133.6)
SD (mm), median (IQR) 9.98 (9.42–10.60) 9.11 (8.66–9.67) 9.68 (9.01–10.23) 9.60 (9.19–10.04) 10.73 (10.43–10.77)
DEFF, median (IQR) 0.97 (0.76–1.31) 0.96 (0.80–1.25) 1.22 (1.07–1.46) 1.18 (1.09–1.31) 1.06 (1.04–1.14)
Fig. 2 Mean MUAC and its standard deviation among 6–24 months aged children, in 3 Livelihood zones of Tapoa Province, Burkina Faso, 2011–2013

Page 7 of 10Altmann et al. Emerg Themes Epidemiol (2016) 13:12
External validityCharacteristics of collected data in pooled LP and pooled cross-sectional surveys are displayed in Table 1. While mean age was slightly higher in LP than in cross-sectional surveys, mean MUAC was slightly lower in cross-sec-tional surveys. The SD was lower for LP than cross-sec-tional surveys, with a median of 9.60 and 10.73 mm, respectively. Design effect had a median of 1.18 and 1.06, for LP and cross-sectional surveys, respectively.
Continuous MUAC as the dependent variable was explained by time, squared time and cubed time as inde-pendent variables together (Table 2), which is consistent with the shape of time-series results plotted in Fig. 3. The Wald test results showed that the values of MUAC were not significantly different (p = 0.6337) between LP and cross-sectional surveys models. Thus the time trends of continuous MUAC were similar between the two mod-els/data sources.
The monthly GAM was estimated with its 95 % credible intervals at five time points from cross-sectional surveys and LP surveys (Table 3). All differences (D) in preva-lence estimates between cross-sectional surveys and LP lay within estimated confidence limits (−8.47 to 5.38 %) (Fig. 4), indicating fair agreement between the two data-sets. However, the plot showed an increase as a function of time, namely as a function of the number of months; the corresponding equation was:
indicating a monthly increase of about 0.26 % in GAM prevalence for cross-sectional compared to LP.
Extrapolation of the line crossed the upper bor-der of the confidence interval of the mean at time t = 45.96 months, indicating that the difference in GAM prevalence would probably become significant 3 years and 10 months after the beginning of the surveillance.
DiscussionThis paper presents the methodology for nutrition sur-veillance that was tested by ACF in a rural area of Bur-kina Faso, using a small open cohort in community-based sentinel sites. It provides detailed information on how to implement it and assess the reliability of its data in term of selection and observational biases. This methodol-ogy has been shown to be valid in following trends for a period of 3 years without selection bias.
Criticisms on sentinel system address the representa-tiveness of the sample, including selection and observa-tional biases. In our study, we used CSAS sampling rather than a purposive sampling technique. CSAS sampling has been shown to approximate random sampling [21] and is thereby representative of the survey area. Although mean age of the cohort remained constant over time, we cannot exclude that a selection bias might have been introduced when lost to follow up children were replaced at each
y = 0.264045t − 6.744944
Fig. 3 Prevalence (by MUAC) and its 95 % Credible Intervals of Global Acute Malnutrition among 6–24 months aged children, in 3 Livelihood zones of Tapoa Province, Burkina Faso, 2011–2013
Table 2 Regression coefficients, confidence intervals and p value taking continuous MUAC as dependent vari-able, Tapoa province, Burkina Faso, 2011–2013
a Number of observations in LP model = 14,534b Number of observations in cross-sectional surveys model = 1623
Variables Coefficient (95 % CI) p value
LP modela
Time 1.1597 (0.9897, 1.3296) <0.001
Squared time −0.0653 (−0.0757, −0.0549) <0.001
Cubed time 0.0011 (0.0009, 0.0012) <0.001
Intercept 128.02 (127.27, 128.76) <0.001
Cross-sectional surveys modelb
Time 1.2149 (0.3633, 2.0661) 0.005
Squared time −0.0773 (−0.1328, −0.0219) 0.006
Cubed time 0.0013 (0.0003, 0.0023) 0.008
Intercept 129.87 (127.14, 132.60) <0.001

Page 8 of 10Altmann et al. Emerg Themes Epidemiol (2016) 13:12
round. Dataset comparisons between LP and repeated cross-sectional surveys did not detect any statistical dif-ference in estimating mean MUAC over a 3-year period in our setting. Post-hoc power analysis showed that for these comparisons, the working power was between 79 and 97 %, thus the corresponding tests were not under-powered. Moreover, the use of the Bayesian-PROBIT approach to estimate GAM has increased the precision of prevalence estimate compared to the use of a frequen-tist analysis and classical estimator. Using a reduced age-group (i.e. <2 years old) proved to be also interesting in term of reducing the design effect close to 1, probably by spreading the sample in each community and hence, increasing the heterogeneity in each cluster.
A higher decrease in GAM prevalence (0.26 % per visit) was observed in LP compared to cross-sectional surveys. It is probable that in the field, information provided to
families by our staff and referral of malnourished chil-dren have improved the nutritional status of the children within these sentinel villages. Likewise, the observational bias reported in a recent study piloted in Northern Nige-ria by Médecins sans Frontières (MSF) was a progres-sive deviation of the nutritional status of the sentinel site from that of the wider community it is presumed to represent [10]. In the MSF study, the prevalence of GAM decreased by 1.6 % (95 % CI 0.4–2.7 %; p = 0.012) relative to the prevalence observed during the previous visit. The smaller observational bias in our study might be partially explained by the normal–normal conjugate analysis that uses the same prior for both data sources (see limitations). Other explanations might include pro-gram coverage as well as impact of messages and refer-ral in these two contexts. The quality of the surveillance system improved over time which might explain why LP and cross-sectional survey estimates are more different at the beginning (i.e. March 2011) than in 2013. Globally we conclude that in the course of the LP surveys, there was a slight observational bias (defined as the difference in GAM prevalence between the two data sources) that would probably become statistically significant after a 3 year and 10 months period. It would seem reasonable to take a new sample of sentinel sites every 3 years.
The thresholds for GAM by MUAC are internationally agreed and apply to any child in the 6–59 months of age group. However, as surveillance systems do not focus on single estimates but rather look at trends, there were dif-ficulties in interpreting the curves during the first year, where no comparison was available. For the following years, the historical limit approach was applied. However, there is no clear guidance on how to use this approach in the nutrition sector, as it is more commonly used for infectious diseases [31].
While the system is still ongoing and has even been extended to Gnagna province, questions remain regard-ing its sustainability. The same system was set up in Montserrado, Liberia, and was stopped after 21 months. Reasons for stopping were: (1) low prevalence of GAM; (2) weak connection with ACF programs; (3) no possible
Table 3 Prevalence (by mean MUAC) and its 95 % Credible Interval of Global Acute Malnutrition among 6–24 months aged children, by Listening Posts and cross-sectional surveys, Tapoa province, Burkina Faso, 2011–2013
Time points Listening post surveys Cross-sectional surveys
Mean MUAC (SD) in mm Prevalence (%) (95 % CI) Mean MUAC (SD) in mm Prevalence (%) (95 % CI)
March 2011 130.6 (10.7) 30.12 (26.87, 33.52) 133.0 (11.7) 23.61 (20.21, 27.32)
May 2012 133.7 (10.2) 21.44 (18.69, 24.41) 134.8 (10.1) 19.08 (16.04, 22.46)
December 2012 132.9 (9.1) 23.01 (20.28, 26.12) 133.1 (10.7) 22.66 (19.11, 26.55)
May 2013 131.8 (9.6) 27.13 (24.03, 30.42) 132.2 (12.0) 25.40 (22.52, 28.47)
October 2013 135.8 (9.8) 18.41 (15.95, 21.08) 133.6 (10.4) 21.68 (18.80, 24.80)
Fig. 4 Difference in prevalence estimates between cross-sectional surveys and LP surveys, with mean and estimated 95 % limits of agreement, in 3 Livelihood zones of Tapoa province, Burkina Faso, 2011–2013
Page 9 of 10Altmann et al. Emerg Themes Epidemiol (2016) 13:12
integration of this methodology into the national system; (4) the challenging issue of urban sampling and the fact that few data were available to assess the validity of our results in greater Monrovia. In Burkina Faso, the Minis-try of Agriculture (MoA) was first interested to use this methodology to develop an early warning system (EWS) for food and nutrition. However, its capacities remain limited and there is actually no fund for a EWR. Further-more, they are still doubts that MoA is responsible to col-lect nutritional data. Alternatively, the system could be extended to other areas through other partners. Sugges-tions to improve the uptake include more regular work-shops, set up of a dedicated website and a better design of the newsletter.
The LP system provides monthly information that allows prompt interventions if needed. Alternative meth-odologies, such as cross-sectional surveys, are usually not frequent enough for early warning systems. Furthermore, cost of the LP system is limited with around 50,000 dol-lars per year for the 3 LHZ. In comparison, costs of cross-sectional surveys are around 20,000 dollars per survey. Finally, its set up is easier than repeated cross-sectional surveys. We think the LP methodology is adapted to areas with high burden of acute undernutrition and poor access to feeding centres that require continuous moni-toring and an early warning system.
There were some limitations in our study. It would have been better if the number and timing of the cross-sectional surveys were the same as surveillance rounds. It would have allowed us to better compare trends from LP and repeated-cross sectional data over shorter time periods. Furthermore, in order to compare with cross-sectional surveys’ area, we had to pool 3 LHZs, increas-ing the sample size. This has limited our ability to validate MUAC trends for each LHZ. However, it has improved the precision of the LP estimates, increasing our power. The use of the Bayesian normal–normal conjugate anal-ysis may have biased the posterior estimate towards the prior mode, which was the same for the surveil-lance data and the cross-sectional survey data. We use the same prior for all applications. The prior was, how-ever, tested with computer based simulations using data derived from cross-sectional surveys; we found that it did not introduce a bias even when used with relatively small likelihood survey sample sizes such as n = 96 and n = 132. Recent literature [17, 18] has identified small systematic biases in PROBIT estimates in given popula-tions. This is problematic when estimating prevalence in one-shot cross-sectional surveys. Systematic bias is less important for surveillance systems. Surveillance systems accept bias and attempt to keep it systematic (i.e. con-sistent) over time in order to observe patterns of change. To detect change, precision (reliability, repeatability) is
a more important issue than accuracy (bias) in surveil-lance applications. For a given sample size, the PROBIT method has greater precision than the more “conven-tional” methods [17, 18]. The Bayesian approach con-tributes some additional information (i.e. the prior) which also improves precision. The cohort approach also reduces between-round sampling variation. The use of the Bayesian PROBIT estimator and an open cohort in the LP method reflects the importance of precision in surveillance applications. Other methods, such as con-ventional prevalence method, can be used to analyze the data as a 6 × 22 cluster sample. They won’t, how-ever, provide the same precision as the Bayesian PROBIT estimator.
Finally, our study was not designed and did not aim to assess the Bayesian-PROBIT methodology in estimating GAM prevalence in comparison to SMART survey meth-odology. Further studies may be needed to validate this methodology in estimating GAM prevalence in different contexts.
ConclusionsThis paper presented a methodology for nutrition sur-veillance using a small open cohort from community-based sentinel sites in a rural setting of Burkina Faso. This methodology has proved to be valid in following trends of GAM prevalence over a 3 years period without selection bias; conversely, a slight but significant obser-vational bias was detected, requiring periodical reselec-tion of sentinel sites. We recommend this approach for areas with high burden of acute under-nutrition and poor access to feeding centres where early warning systems are strongly needed. Advocacy is necessary to develop sus-tainable nutrition surveillance system and to support the use of surveillance data in guiding nutritional programs.Authors’ contributionsMA coordinated the research and drafted the manuscript. CF and BJ under-took the statistical analyses. ML coordinated the field data collection. MM and CA critically revised the manuscript. All authors read and approved the final manuscript.
Author details1 Action Contre la Faim, 16 Boulevard Douaumont, 75017 Paris, France. 2 EHESP Sorbonne Paris Cité, Avenue du Professeur Léon-Bernard, 35043 Rennes, France. 3 Ecole des Hautes Etudes en Santé Publique, Avenue du Professeur Léon-Bernard, 35043 Rennes, France. 4 Action Contre la Faim, Ouagadougou, Burkina Faso. 5 Brixton Heath, Llawryglyn, Powys, Wales, UK.
AcknowledgementsThe history of this project and its methodology came first from a discussion between Rebecca Brown (ACF Nutrition senior advisor at that time), Claudine Prudhon (Epidemiologist at the World Health Organization) and Frances Mason (Save the Children France, SCF). The methodology was then developed by SCF (Anna Taylor, Alex Rees, Brian Kriz, Abigail Perry, Mickael Manske) and ACF (Rebecca Brown, Hélène Deret) with the support of Brixton Health (Mark Myatt). We are very thankful to all these people. We also thank the field teams of ACF in Burkina Faso, in particular the Listening Post team for gathering data and the ACF coordination team, Thomas Loreaux (Head of Mission) and Claire

Page 10 of 10Altmann et al. Emerg Themes Epidemiol (2016) 13:12
Gaillardou (Head of Department Disaster Risk Management) for supporting this project. We are also thankful to Chloe Milloz for her operational expertise and for reviewing. We wish to thank the village authorities and all the families from investigated villages for their participation in this project.
Competing interestsThe authors declare that they have no competing interests.
Availability of data and materialsThe data supporting our findings are available by asking directly to the cor-responding author.
Ethics approval and consent to participateEthical approval was obtained from the Institutional Review Board of the Ministry of Health in Burkina Faso (no 2010-028). A Memorandum of Under-standing was also signed with the Ministry of Agriculture and its regional office concerning the Listening Post project and ACF support in strength-ening the early warning system in Tapoa province. Data from nutritional cross-sectional surveys were collected with the agreement of the Ministry of Health of Burkina Faso. We followed the Declaration of Helsinki, aiming to provide assurance that the rights, integrity, and confidentiality of participants were protected. We obtained oral consent from participants or their parents or guardians. Participation was voluntary. We ensured privacy and confidentiality in the data collected from the participants both during and after the conduct of the study. We entered and analyzed all information anonymously and anonymised findings were shared with all stakeholders in Burkina Faso.
FundingThis study was funded by Action Contre la Faim (ACF). ACF collected the data, designed the study protocol, contributed to the interpretation of the data and preparation of the manuscript.
Received: 23 March 2016 Accepted: 19 October 2016
References 1. Mason JB, Mitchell JT. Nutritional surveillance. Bull World Health Organ.
1983;61:745–55. 2. McKinney P. Module 10: nutrition information and surveillance systems,
version 2. Emerg Nutr Netw. 2014. http://files.ennonline.net/attach-ments/2018/HTP-v2-module-10-technical-notes.pdf
3. Jerome NW, Ricci JA. Food and nutrition surveillance: an international overview. Am J Clin Nutr. 1997;65:1198S–202S.
4. Bilukha O, Prudhon C, Moloney G, Hailey P, Doledec D. Measuring anthro-pometric indicators through nutrition surveillance in humanitarian set-tings: options, issues, and ways forward. Food Nutr Bull. 2012;33:169–76.
5. Friedman G. Review of national nutrition surveillance systems. Food and Nutrition Technical Assistance III Project (2014).
6. Nnyepi M, Gobotswang KSM, Codjia P. Comparison of estimates of malnutrition in children aged 0–5 years between clinic-based nutrition surveillance and national surveys. J Public Health Policy. 2011;32:281–92. doi:10.1057/jphp.2011.32.
7. Action Contre la Faim (ACF), The United Nations Children’s Fund (UNICEF). Nutrition surveillance system in Karamoja region, Final report number 002. Uganda Ministry of Health Knowledge Management Portal 2010. http://library.health.go.ug/publications/service-delivery-child-health/food-and-nutrition/nutrition-surveillance-system-karamoja.
8. Action contre la faim (ACF). Mathare sentinel surveillance report 2009. http://www.actionagainsthunger.org/sites/default/files/publications/ACF-INT-Kenya-Nairobi-Mathare-2009-07-EN.pdf.
9. Chotard S, Mason JB, Oliphant NP, Mebrahtu S, Hailey P. Fluctuations in wasting in vulnerable child populations in the Greater Horn of Africa. Food Nutr Bull. 2010;31:S219–33.
10. Grellety E, Luquero FJ, Mambula C, Adamu HH, Elder G, Porten K. Obser-vational bias during nutrition surveillance: results of a mixed longitudinal and cross-sectional data collection system in Northern Nigeria. PLoS ONE. 2013;8:e62767. doi:10.1371/journal.pone.0062767.
11. The United Nations Children’s Fund, Sudan Federal Ministry of Health, the State Ministries of Health in North, South and West Darfur, UNICEF Sudan Nutrition Section. Darfur nutrition update, Summary Issue 30: covering October, November and December 2011; 2011.
12. Caleo GM, Sy AP, Balandine S, Polonsky J, Palma PP, Grais RF, et al. Sentinel site community surveillance of mortality and nutritional status in south-western Central African Republic, 2010. Popul Health Metr. 2012;10:18. doi:10.1186/1478-7954-10-18.
13. Save the Children. About the household economy approach: tools for food security and nutrition analysis n.d. http://www.heawebsite.org/about-household-economy-approach. Accessed 18 Feb 2016.
14. Ministère de l’économie et des finances - Institut national de la statistique et de la démographie. Annuaire statistique du Burkina Faso 2011. http://www.insd.bf/n/contenu/pub_periodiques/annuaires_stat/Annuaires_stat_nationaux_BF/Annuaire_stat_2011.pdf. Accessed 3 Feb 2016.
15. Ministry of Health. National Nutritional Survey in Burkina Faso 2011. http://www.unicef.org/bfa/french/enquete-nutritionnelle_nationale_du_burkina_faso_2011.pdf. Accessed 3 Feb 2016.
16. World Health Organisation (WHO). Physical status: the use and interpreta-tion of anthropometry, vol 854. Report of a WHO expert committee. World Health Organisation. 1995. p. 1–452.
17. Dale NM, Myatt M, Prudhon C, Briend A. Assessment of the PROBIT approach for estimating the prevalence of global, moderate and severe acute malnutrition from population surveys. Public Health Nutr. 2013;16:858–63. doi:10.1017/S1368980012003345.
18. Blanton CJ, Bilukha OO. The PROBIT approach in estimating the preva-lence of wasting: revisiting bias and precision. Emerg Themes Epidemiol. 2013;10:8. doi:10.1186/1742-7622-10-8.
19. Raiffa H, Schlaifer R. Applied statistical decision theory. Cambridge: Divi-sion of Research, Graduate School of Business Administration, Harvard University; 1961.
20. Western B, Jackman S. Bayesian inference for comparative research. Am Polit Sci Rev. 1994;88:412–23. doi:10.2307/2944713.
21. Milne A. The centric systematic area-sample treated as a random sample. Biometrics. 1959;15:270–97. doi:10.2307/2527674.
22. Myatt M, Feleke T, Sadler K, Collins S. A field trial of a survey method for estimating the coverage of selective feeding programmes. Bull World Health Organ. 2005;83:20–6.
23. Myatt M, Mai NP, Quynh NQ, Nga NH, Tai HH, Long NH, et al. Using lot quality-assurance sampling and area sampling to identify priority areas for trachoma control: Viet Nam. Bull World Health Organ. 2005;83:756–63.
24. Sadler K, Myatt M, Feleke T, Collins S. A comparison of the programme coverage of two therapeutic feeding interventions implemented in neighbouring districts of Malawi. Public Health Nutr. 2007;10:907–13. doi:10.1017/S1368980007711035.
25. Thompson, SK. Sampling. 3rd edn. Hoboken, New Jersey: Wiley; 2012. 26. Bennett S, Radalowicz A, Vella V, Tomkins A. A computer simulation of
household sampling schemes for health surveys in developing countries. Int J Epidemiol. 1994;23:1282–91.
27. Briend A, Hasan KZ, Aziz KM, Hoque BA, Henry FJ. Measuring change in nutritional status: a comparison of different anthropometric indices and the sample sizes required. Eur J Clin Nutr. 1989;43:769–78.
28. World Health Organization (WHO). The WHO Multicentre Growth Refer-ence Study (MGRS) n.d. http://www.who.int/childgrowth/mgrs/en/. Accessed 9 Jan 2014.
29. Action Contre la Faim. Measuring mortality, nutritional status and food security in crisis situations: the smart protocol 2006. http://smartmethod-ology.org/survey-planning-tools/smart-methodology/.
30. Bland JM, Altman DG. Statistical methods for assessing agreement between two methods of clinical measurement. Lancet. 1986;1:307–10.
31. Hutwagner L, Browne T, Seeman GM, Fleischauer AT. Comparing aberration detection methods with simulated data. Emerg Infect Dis. 2005;11:314–6. doi:10.3201/eid1102.040587.