research article observation of clouds using the csir
TRANSCRIPT
Research ArticleObservation of Clouds Using the CSIR Transportable LIDARA Case Study over Durban South Africa
Lerato Shikwambana12 and Venkataraman Sivakumar1
1School of Chemistry and Physics University of KwaZulu-Natal Private Bag X54001 Durban 4000 South Africa2CSIR National Laser Centre PO Box 395 Pretoria 0001 South Africa
Correspondence should be addressed to Lerato Shikwambana lshikwambanagmailcom
Received 29 February 2016 Revised 20 June 2016 Accepted 21 August 2016
Academic Editor Stefania Bonafoni
Copyright copy 2016 L Shikwambana and V Sivakumar This is an open access article distributed under the Creative CommonsAttribution License which permits unrestricted use distribution and reproduction in any medium provided the original work isproperly cited
The Council for Scientific and Industrial Research (CSIR) transportable Light Detection And Ranging (LIDAR) was used to collectdata over Durban (299∘S 309∘E) during 20ndash23 November 2012 Aerosol measurements have been carried out in the past overDurban however no cloud measurements using LIDAR have ever been performed Therefore this study further motivates thecontinuation of LIDAR for atmospheric research over Durban Low level clouds were observed on 20ndash22 November 2012 and highlevel clouds were observed on 23 November 2012The low level cloud could be classified as stratocumulus clouds whereas the highlevel clouds could be classified as cirrus clouds Low level cloud layers showed high extinction coefficients values ranging between00009 and 00044mminus1 whereas low extinction coefficients for high level clouds were observed at values ranging between 0000001and 0000002mminus1 Optical depth showed a high variability for 20 and 21 November 2012This indicates a change in the compositionandor thickness of the cloud For 22 and 23 November 2012 almost similar values of optical depth were observed Cloud-AerosolLIDAR and Infrared Pathfinder Satellite Observations (CALIPSO) revealed high level clouds while the CSIR LIDAR could notHowever the two instruments complement each other well to describe the cloudy condition
1 Introduction
The detection of clouds in satellite imagery has a numberof important applications in weather and climate stud-ies [1] In atmospheric remote sensing cloud detection isan important step for the inversion of the parameters inthe atmosphere such as temperature humidity and seasurface temperature to name a few [2] Equally impor-tant in sensed image processing cloud detection is animportant foundation for many applications such as for-est fires detection environmental pollution and water-body monitoring [3] The National Aeronautics and SpaceAdministration (NASA) has a constellation of satellitescalled the A-Train which has passive and active sensorsspecifically dedicated to the study of aerosol and cloudproperties from a three-dimensional perspective exploitingsimultaneous and collocated multisensor observations [4]The A-Train satellites include the Aqua satellite with itsModerate Resolution Imaging Spectroradiometer (MODIS
httpmodis-atmosgsfcnasagov) CloudSat with its CloudProfiling Radar (CPR httpcloudsatatmoscolostateedu)and the Cloud-Aerosol LIDAR and Infrared Pathfinder Satel-lite Observations (CALIPSO) all these instruments can beused to study clouds [5] Space-based observations have theadvantage of providing global spatial coverage but they do nothave sufficient temporal coverage to study many atmosphericprocesses [6] Ground-based observations are necessary forthe long-term monitoring of atmospheric parameters thatcannot be observed from available satellite-borne sensors [6]Ground-based instruments such as sun-photometers makedirect sun measurements at several wavelengths in the rangebetween 340 and 1020 nm with a 12∘ full field of view (FOV)which takes about 8 s to scan all wavelengths using a filterwheel [7] Ground-based radars are also used to detect andstudy different clouds For example Hollars et al [8] useda radar system for the retrievals of cloud-top heights fromthe Atmospheric Radiation Measurement (ARM) 35GHzMillimeter Wave Cloud Radar and compared it to those
Hindawi Publishing CorporationAdvances in MeteorologyVolume 2016 Article ID 4184512 9 pageshttpdxdoiorg10115520164184512
2 Advances in Meteorology
from the Geostationary Meteorological Satellite- (GMS-) 5Similar to ARM systems the Light Detection And Ranging(LIDAR) with high sensitivity and high temporal coveragecan be used for studying clouds [9] LIDAR retrieval ofatmospheric parameters is an effective tool to characterisethe time and spatial evolution of the atmospheric boundarylayers as well as to investigate the physics properties of thecloud composing particle [10] A laser ceilometer is anothertype of a ground-based instrument that can be used todetermine the height of a cloud base cloud cover and cloudvertical structure [11] A laser ceilometer has a similar typeof setup as the LIDAR it consists of a vertically pointinglaser and a receiver at the same location Many studies andobservations of clouds have been made around the worldusing various instruments However in South Africa only afew studies of this nature have been carried out using a trans-portable LIDAR system Transportable LIDAR systems havean advantage over static systems as they can be moved to thedesired locations where measurements are to be carried out
For South Africa it was found that the country could bedivided into three climatic regions the subtropical wet thesubtropical dry and the arid The subtropical wet region ischaracterised by hot summer temperatures and fully humidconditions this is observed in the eastern parts of SouthAfrica The subtropical dry regions are observed in thenorthern parts of South Africa and are characterised bywarm temperatures during dry summers The arid regionis observed in the western part of South Africa and ischaracterised by high temperatures [12] However a fulldescription of the division of climatic areas is defined byKoppen-Geiger climate classification [13] Figure 1 shows thedifferent climatic regions found in South Africa (httpkoep-pen-geigervu-wienacatpresenthtm) The Koppen-Geigerclimate classification is divided into three zones (1) themain climatic zone (2) precipitation and (3) temperatureThe colour scheme on the map indicates a combination ofthe three zones which gives a description of the climaticcondition of the area From the regions mentioned thesubtropical wet region offered the best location for ourcloud studies as it is humid and allows for a higher chanceof cloud formation Durban (299∘S 309∘E) was the citychosen as it met all the requirements Moreover there wereno cloud measurements reported using the LIDAR systemThe campaign measurements performed at Durban are tounderstand the aerosol-cloud interaction laterThe particularsite had a fixed LIDAR system at the University of KwaZulu-Natal but it is currently not operational Moorgawa et al [14]have made initial results on aerosols over Durban but therewere no cloud measurements reported using such LIDARThus the present study further motivates the continuation ofLIDAR for atmospheric research over Durban
In this study the CSIR transportable LIDAR systemand CALIPSO were used for observing cloud structure andstudying its properties In this paper we discuss the campaignmeasurements conducted in Durban South Africa duringthe end of the spring season We show the type of clouds thatwere observed from 20 to 23 November 2012 In Section 2 a
Durban
World map of Koppen-Geiger climate classificationUpdated with CRU TS 21 temperature and VASClimO v11
Af
Am As
Aw
BWk
BWh
BSh
BSk
Cfa
Cfb Cfc
Csa
Csb
Csc
Cwa
Cwb
Cwc
Dfa
Dfb Dfc
Dfd
Dsa
Dsb Dsc
Dsd
Dw
a
Dw
b
Dw
c
Dw
d EF ET
Main climatesA equatorialB aridC warm temperateD snowE polar
PrecipitationW desertS steppeF fully humidS summer dryW winter dryM monsoonal
precipitation data 1951 to 2000
TemperatureH hot aridK cold aridA hot summerB warm summerC cool summerD extremely continentalF polar frostT polar tundra
Figure 1 Koppen-Geiger climate classification of South Africa rep-resenting different climatic regions ([13] httpkoeppen-geigervu-wienacatpresenthtm)Themap also shows the city of Durban themeasurement site
description of the experimental site is givenThe instrumentsmethodology and results are discussed in Sections 3 4 and5 respectively Conclusions are then given in Section 6
2 Experimental Site
Durban is the largest urban city in the SouthAfrican provinceof KwaZulu-Natal and its time zone is UTC+0200 It issituated at the south-east of South Africa and it is boundto the east by the Indian Ocean (see Figure 1) The city hasa subtropical climate and experiences four seasons whichare summer (DecemberndashFebruary) autumn (MarchndashMay)winter (JunendashAugust) and spring (SeptemberndashNovember)The rainy season is during late November through Decemberand may extend to January
3 Instruments
31 CSIR Transportable LIDAR System The transportableMie LIDAR system at theCouncil for Scientific and IndustrialResearch (CSIR) in Pretoria (257461∘S 281881∘E) wasdeveloped in 2007 This LIDAR has been configured intomonostatic system thatmaximizes the overlap of the outgoing
Advances in Meteorology 3
Table 1 Specifications of the CALIPSO and CSIR LIDAR system
Feature CALIPSO CSIR LIDAR
LaserNd YAG
diode-pumpedQ-switched
frequency doubled
Nd YAG Q-switchedflash lamp-pumped
(ContinuumPL8010)
Wavelength 532 nm 1064 nm 532 nmPulse energy 110mJchannel 140mJRepetition rate 2025Hz 10HzReceiver telescope 1m diameter 0404m532 nm detectors PMT PMT1064 nm detectors APD mdashPolarization 532 nm 532 nmFOV 130120583rad 500 120583radVertical resolution 30ndash60m 10m
beam with the receiver field of view [16] The LIDAR systemhas been mounted in a transportable platform with a specialshock absorber frame to maximize stability [16 17] Figure 2shows the layout of the experiment with the three mainsections of the LIDAR system namely the transmissionreceiver and data acquisition sections Specifications of theCSIR LIDAR system are shown in Table 1 More details aboutthe LIDAR can be found in an earlier article on systemcharacteristics by Sharma et al [17]
32 CALIPSO The Cloud-Aerosol LIDAR and InfraredPathfinder Satellite Observations (CALIPSO) can provideinformation about the thickness of clouds and can deter-mine the height and types of aerosols CALIPSO consistsof three coaligned nadir-viewing instruments the Cloud-Aerosol LIDAR with Orthogonal Polarization (CALIOP)the Imaging Infrared Radiometer (IIR) and the Wide FieldCamera (WFC) CALIOP is a sensitive LIDAR that pro-vides high-resolution vertical profiles of aerosols and cloudsCALIOP products can be separated into two levels (a) level 1products are composed of calibrated and geolocated profilesof the attenuated backscatter returned signal and (b) level2 products which are derived from level 1 products and areclassified in three types layer products profile products andvertical feature mask [18] The CALIOP is sensitive to thepresence of thin cloud layers and its range resolution of 333mcan identify small boundary layer clouds especially in theabsence of optically thick high clouds where low clouds mostdramatically impact the fluxes of shortwave radiation [19]Table 1 shows the specifications of the CALIPSO
4 Data Analysis and Methodology
The LIDARmeasurements were carried out from 20 Novem-ber 2012 to 23 November 2012The time duration ofmeasure-ments depended on the weather situation for that day Forexample on 20 November 2012 the measurements were car-ried out from 1059 local time to around 1550 when it startedto drizzle the measurements were then discontinued Theweather varied for the different days of the measurements
The backscatter signals were collected and their inten-sities measured In general the received signal intensity isdescribed in terms of the LIDAR equation as given by Bangiaet al [20 21]
119875 (119903) = 119875119900
119888120591
2119860120573 (119903)
1199032
119890minus2int
119903
0
120590(119903
1015840
)119889119903
1015840
(1)
where 119875119900is the transmitted laser power in terms of photon
counts at 532 nm 119888 is the velocity of light 120591 is the pulseduration 119860 is the effective system receiver area 120573(119903) isthe backscattering coefficient 11199032 is the range dependencefactor that accounts for the decrease in solid angle subtendedwith the square of the range and 119890minus2int
119903
0
120590(119903
1015840
)119889119903
1015840
is the integratedtwo-way extinction of the signal as it propagates from theinstrument to the scattering volume at range 119903 and returnsback The method mostly used for inverting elastic LIDARreturns is the backward inversionmethodTheKlett inversionrequires an input value of the extinction coefficient at the farboundary of the LIDAR range This boundary value can bemeasured or assumed
The backscattering and extinction coefficients are givenby contribution of both aerosols and molecules and areexpressed as
120573 (119903) = 120573aer (119903) + 120573mol (119903)
120590 (119903) = 120590aer (119903) + 120590mol (119903) (2)
where subscripts (aer) and (mol) indicate aerosols andmolecules respectively Molecular contributions were cal-culated using data from CIRA 1986 standard atmospheremodel [20 21] The molecular backscatter coefficient 120573mol(119903)is estimated by considering the theoretical molecular LIDARratio 119878mol = 120590mol120573mol as (81205873)119904119903 under the condition ofzero molecular absorption [20 21] The backward inversionmethod followed is same as earlier research by Bangia et al[20 21]
The total backscatter coefficients are derived from thebackward inversion method and can be expressed as [20 21]
120573aer (119903) + 120573mol (119903) =119883 (119903) exp [minus2 (119878aer (119903) minus 119878mol) int
119903
119903119888
120573mol (119903) 119889119903]
119883 (119903119888) (120573aer (119903119888) + 120573mol (119903119888)) minus 2119878aer int
119903
119903119888
119883 (119903) exp [minus2 (119878aer (119903) minus 119878mol) int119903
119903119888
120573mol (1199031015840
) 1198891199031015840
] 119889119903
(3)
where 119883(119903) is the range normalized signal given by 119875(119903)1199032and 119903119888is the reference height One advantage of using the
backward inversion method is that when we start integratingfrom the far end of the LIDAR sounding path we can avoid
4 Advances in Meteorology
Focusing mirror
Photomultiplier tube
Motorised 3D translationstage with optical fibre
Transient recorder
Beam expanderNd YAG laser
Computer
Figure 2 Schematic layout of the CSIR-NLC mobile LIDAR system
producing negative values of 120573aer(119903) [22] For more detailsthe reader may refer to Bangia et al [20 21]
Aerosol optical depth (AOD) is calculated by integratingthe extinction coefficient from cloud base to its top [23]
AOD = int119885119905
119885119887
120572 (119903) 119889119903 (4)
where119885119905is the cloud top119885
119887is the cloud base and 120572(119903) is the
aerosol extinction coefficient
5 Results and Discussion
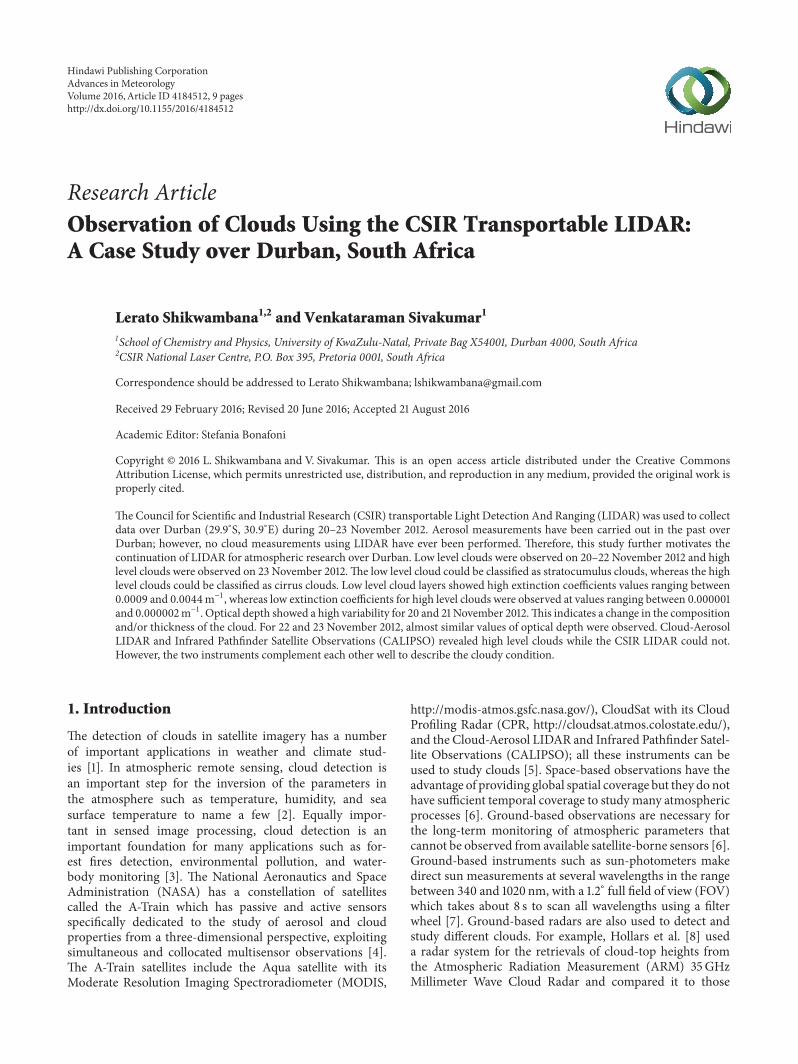
51 CSIR LIDAR Observations LIDAR measurements werecarried out on 20 21 22 and 23 November 2012 in Durban(see Figure 3) On 20 November 2012 the backscatter signalfrom the LIDAR (where red indicates a strong backscatter)revealed the presence of a cloud layerThe cloudwas observedat an altitude of around 500m from 1059 until it startedraining at around 1550 local time (see Figure 3(a))The cloudhad a thickness of about 100m (Note that the CSIR LIDARhas capability for providing range resolution of 10m) On 21November 2012 two layers of clouds at the heights of 600and 1400mwere observed between 1040 and 1200 local time(see Figure 3(b)) The backscatter signal indicated that thelower level cloud at 600m did not have a large amount ofliquid water content in it thus allowing the laser to penetratethrough it and enabled the detection of the other layer ofclouds at approximately 1400m The cloud at a height of600m showed a thickness of about 100mwhile the other layerat a height of 1400m indicated a thickness of approximately70m However the upper cloud layer could not be observedat the local time of 1301 until 1345 but a strong backscattersignal was observed at the height of 600mThis indicates thatthe laser might not penetrate through the clouds (opticallyopaque) thus the other layer could not be observed if therewere any On 22 November 2012 multilayered clouds werebriefly observed between 1310 and 1328 local time (see Fig-ure 3(c)) The lower level clouds were observed at 600m and
the upper level cloudswere observed at 1000mwith thicknessof about 100mOn 23November 2012 a single layer cloud at aheight of 10000ndash12000m was observed (see Figure 3(d))Thebackscatter signal was moderate at a height of 11000m andthe strength of the signal weakened with increasing height
A similar method used by Venema et al [24] to iden-tify clouds directly from the extinction coefficient profileswas used In this method the height at which the signaldecreasesincreases considerably is called cloud topbase Foraerosols the extinction coefficients profiles generally showa decrease in extinction coefficient values with increasingheight and clouds generally show sudden high values on theprofile The aerosol extinction coefficient profiles for 20 2122 and 23 November 2012 are shown in Figure 4 On 2021 and 22 November 2012 low level clouds were observedOn these days an aerosol layer was observed at altitudesof sim100ndash400m On 20 November 2012 a layer of cloudwas observed between 400 and 500m (see Figure 4(a)) anddemonstrated an extinction coefficient value of 0018mminus1On 21 November 2012 (see Figure 4(b)) multilayered cloudswere also observed Thin cloud layers at 600 700 and800m were observed from the extinction coefficient profileswhich were not so visible in Figure 4(b) These cloud layersshowed extinction coefficients values of 0003 00118 and00117mminus1 respectivelyTherewas also a cloud layer at 1500mwith an extinction coefficient value of 0009mminus1 On 22November 2012 (see Figure 4(c)) multiple layers of cloudswere observed at 600 1000 1200 and 1500m with extinctioncoefficients values of 00012 00044 00013 and 00009mminus1respectively On 23 November 2012 (see Figure 4(d)) cloudlayers at 10000 and 11000mminus1 with extinctions coefficientsvalues of 0000001 and 0000002mminus1 were observed Theextinction coefficients of low level clouds had values in therange of 0018ndash00009mminus1 depending upon the thickness ofcloud Thicker clouds showed higher values of extinctioncoefficients compared to thinner clouds
The temporal evolution of the aerosol optical depth(AOD) was retrieved for the four days of measurements in
Advances in Meteorology 5
Time (HHMMSS)
Hei
ght (
m)
105
902
120
854
124
350
200400600800
100012001400160018002000
0
1000
2000
3000
4000
5000
(a)
Time (HHMMSS)
104
018
111
538
115
058
200400600800
100012001400160018002000
050010001500200025003000350040004500
Hei
ght (
m)
(b)
Time (HHMMSS)
Hei
ght (
m)
131
038
140
408
143
948
200400600800
100012001400160018002000
0500100015002000250030003500
(c)
Time (HHMMSS)14
04
31
141
301
142
131
143
001
143
831
144
701
145
531
2000400060008000
10000120001400016000
20
40
60
80
100
120
Hei
ght (
m)
(d)
Figure 3 Height-time colour map of CSIR transportable LIDAR backscatter signal returns at daytime in Durban on (a) 20 November 2012(b) 21 November 2012 (c) 22 November 2012 and (d) 23 November 2012 UTC+0200
0200400600800
100012001400160018002000
0 0002 0004 0006 0008 001 0012 0014 0016 0018 002
Hei
ght (
m)
Clouds
Aerosol extinction coefficient (mminus1)
(a)
Clouds
0200400600800
100012001400160018002000
0 0002 0004 0006 0008 001 0012 0014 0016 0018 002
Hei
ght (
m)
Aerosol extinction coefficient (mminus1)
(b)
0200400600800
100012001400160018002000
0 0002 0004 0006 0008 001 0012 0014 0016 0018 002
Hei
ght (
m)
Clouds
Aerosol extinction coefficient (mminus1)
(c)
02000400060008000
10000120001400016000
0 01 02 03 04 05 06 07 08 09 1
Hei
ght (
m) Clouds
Aerosol extinction coefficient (mminus1) times10
minus4
(d)
Figure 4 The retrieved aerosol extinction coefficients using the LIDAR on (a) 20 November 2012 (b) 21 November 2012 (c) 22 November2012 and (d) 23 November 2012
6 Advances in Meteorology
105902 1538200
010203040506070809
1
Time (HHMMSS)
AOD
(a)
104018 1336580
010203040506070809
1
Time (HHMMSS)
AOD
(b)
131938 160858
010203040506070809
1
Time (HHMMSS)
AOD
(c)
140431 1455310
010203040506070809
1
Time (HHMMSS)
AOD
(d)
Figure 5 Temporal evolution of AOD on (a) 20 November 2012 (b) 21 November 2012 (c) 22 November 2012 and (d) 23 November 2012
Durban (see Figure 5) using equation (4) On 20 November2012 an overall increase of the AOD was observed from themorning (1059) to the afternoon (1540) from 035 to 06 (seeFigure 5(a)) On 21 November 2012 a similar trend was alsoobserved with AOD increasing from 03 to 1 (see Figure 5(b))However on 22 November 2012 a small change in AODwas observed from 01 to 015 (see Figure 5(c)) Platt et al[25] mentioned that the change in optical depth depends onthe nature of composition and the thickness of the cloudHowever on 23 November 2012 a steady AOD value of sim002was observed (see Figure 5(d))
52 Cirrus Clouds Observed on 23 November 2012 Through-out the campaign cirrus clouds were only observed on 23November 2012 Most of the clouds are found between theheights of 55 km and 125 km with height range thicknessesspanning 18ndash31 km see Figure 6 Sassen et al [26] and Jensenet al [27] have ascribed the outflows from cumulonimbusanvils to the formation of thick cirrus clouds to mid andhigh altitudes These type of clouds arise due to the verticalmixing of air from the entrainment and detrainment Ithas been previously suggested that the ice water gradient islargely destroyed due to sturdy mixing by the strong cloudcirculation [28] The optical properties of this cloud werecompared to cirrus clouds observed in the southern hemi-sphere see Table 2 From the reported cirrus clouds inTable 2it can be seen that the cirrus clouds over Durban had thelowest cloud height base of 55 km These are very low cirrusclouds but over time they were found to disappear Howeverthe average cloud thickness is similar to that observed by
Time (HHMMSS)
Hei
ght (
km)
140
431
141
301
142
131
143
001
143
831
144
701
145
531
468
101214
10
20
30
40
50
60Height of top
Height of base
Figure 6 Height-time colour map of CSIR transportable LIDARsignal returns illustrating the presence of cirrus cloud on 23November 2012 over DurbanThe cloud height top and cloud heightbottom are indicated by the thick dark lines
Lakkis et al [10] This correlation does somehow suggestthat the cirrus cloud properties may depend on climateconditions and geographical location However amore widerclimatological study needs to be carried out to confirm thedependence of climate conditions and geographical location
53 CALIPSO and CSIR LIDAR Comparison The only com-parable CALIPSO data which were available during the oper-ation of the CSIR LIDAR were on 20 and 22 November 2012For 21 and 23 November 2012 the satellite observations weretoo far from themeasurement site Figures 7(a) and 7(b) show
Advances in Meteorology 7
Table 2 Cirrus cloud properties observed by LIDAR
Location (AGL)(distance from shoreline)
Cloud top height(km) maximum
Cloud base height(km) minimum
Cloud thickness(km)
Distance totropopause (km)
Durban299∘S 309∘E
(8m)(plusmn14 km)
125 55 245 mdash
(Buenos Aires)Lakkis et al 2009 [10]
346∘S 585∘W(31m) 1182 963 241 038
(Punta Arenas)Immler and Schrems2002 [15]
531∘S 71∘W(30m) 95 88 14 17
minus32
83
minus31
64
minus30
45
minus29
26
minus28
07
minus26
88
minus25
69
minus24
49
minus23
30
02468
101214161820
Alti
tude
(km
)
Latitude
00
0001
000
020
0003
000
040
0005
000
060
0007
000
080
0009
000
10
0015
000
20
0025
000
30
0035
000
40
0045
000
50
0055
000
60
0065
000
70
0075
000
80
010
020
030
040
050
060
070
080
09 01
(a)
minus32
83
minus31
64
minus30
45
minus29
26
minus28
07
minus26
88
minus25
69
minus24
49
minus23
30
02468
101214161820
Alti
tude
(km
)
Latitude
00
0001
000
020
0003
000
040
0005
000
060
0007
000
080
0009
000
10
0015
000
20
0025
000
30
0035
000
40
0045
000
50
0055
000
60
0065
000
70
0075
000
80
010
020
030
040
050
060
070
080
09 01
(b)
Figure 7 Height-time colour map of CALIPSO-derived total attenuated backscatter at 532 nm on (a) 20 November 2012 at 1205 and (b) 22November 2012 at 1152 UTC+0200
colour coded time-height images of the daytime level 1 data at532 nm acquired by CALIPSO on 20 and 22 November 2012respectively On 20 November 2012 the nearest coincidencebetween the CSIR LIDAR and the CALIPSO occurred ataround 1205 local time The aerosol layer was observed ataround 1 km No clouds were observed in the lower partof the troposphere by the CALIPSO at the observation site(latitude minus299∘) However it has illustrated the presence ofclouds at 8ndash13 km with a thickness of sim3 km these cloudswere not observed by the CSIR LIDAR system This suggeststhat the thick cloud observed by the CSIR LIDAR causedmost of the photons of the laser to be absorbed and thus a fewphotons penetrating through the cloud As a result these fewphotons could not detect the clouds at those heights as theycould have been scattered or absorbed along the way On 22November 2012 a similar cloud at a height of 8ndash13 km wasobserved However on this day a layer of cloud was observedat the height of sim45 km by the CALIPSO The CSIR LIDARgives a better description of the atmospheric conditions in thefirst few kilometers of the troposphere for cloudy conditionswhereas the CALIPSO gives better information at the topof the troposphere Further it indirectly also addresses thestrength of the signal which is higher at lower heights (as it ispenetrating upward) while the satellite data looks downwardwhere the signal strength is higher at the top Thus the two
instruments complement each other to give a description ofclouds in the troposphere even for cloudy conditions
The mean extinction coefficient profiles from theCALIPSO level 2 aerosol product are shown in Figure 8 On20 November 2012 the highest value of extinction coefficientof sim008 kmminus1 was observed at a height of about 5 km (seeFigure 8(a)) From Figure 8(a) this indicates the presence ofa thin cloud at that altitude High level clouds at the heightsof 6ndash11 km were observed from the extinction coefficientdata However on the lower part of the troposphere a thicksingle layer of cloud at around 18 km was observed It canalso be observed that different layers of clouds were present atdifferent altitudes from 18 km to 11 kmThese however werenot so clear in Figures 3(a) and 3(c) The negative extinctioncoefficient values are found to be noise in the CALIPSOsignal when aerosol loading is low and background noise ishigh On 22 November 2012 the extinction coefficient profileshowed the presence of a thick cloud at around 3 km (seeFigure 7(b)) while the aerosol layer was observed at about15 km However no extinction coefficients were observed athigh altitudes indicating the absence of clouds
6 Conclusion
Campaign measurements over Durban (299∘S 309∘E) havebeen carried out due to favourable meteorological conditions
8 Advances in Meteorology
minus006 minus004 minus002 0 002 004 006 008 01
2
4
6
8
10
12
14A
ltitu
de (k
m)
Clouds
Clouds
Extinction coefficient (kmminus1)
(a)
0015 002 0025 003 0035 004 0045 005 0055
2
4
6
8
10
12
14
Alti
tude
(km
)
Clouds
Extinction coefficient (kmminus1)
(b)
Figure 8 Height profile of extinction coefficient observed from CALIPSO on (a) 20 November 2012 and (b) 22 November 2012
for cloud formations and to perform aerosol-cloud interac-tions studies in future Clouds over Durban (299∘S 309∘E)during the spring (early summer) season were observedusing a transportable LIDAR system Cloud layers on thelower atmosphere were observed on 20ndash22 November 2012while high level clouds were observed on 23 November 2012The low level cloud layers have high extinction coefficientsvalues ranging from 00009 to 00044mminus1 whereas lowextinction coefficients for high level clouds were observed atvalues ranging between 0000001 and 0000002mminus1 The vastdifference in the extinction coefficient suggests that there areremarkable differences in optical characteristics between lowand high level cloudsThe high level clouds could be classifiedas cirrus clouds based on the altitude they were detected atThe calculated AOD showed a high variability for 20 and 21November 2012 This indicates a change in the compositionandor thickness of the cloud However a constant valueof the optical depth on 23 November suggested a staticcloud composition andor thickness Comparable LIDARand CALIPSO data was available on 20 and 22 November2012 and indicated that the CALIPSO could observe high-level clouds while the CSIR LIDAR could not However thetwo instruments complement each other well to describe thecloudy condition
Competing Interests
The authors declare that they have no competing interests
Acknowledgments
The authors would like to thank Henk van Wyk and AmeethSharma for the technical support on the LIDAR systemCALIPSO data were obtained from the NASA LangleyResearch Centre Atmospheric Science Data Centre theauthors would like to acknowledge the NASA personnel forthe production of the data used in the present research Theauthors would also like to thank the African Laser Centre(ALC) project for funding the campaign measurements inDurban
References
[1] G Jedlovec ldquoAutomated detection of clouds in satelliteimageryrdquo in Advances in Geoscience and Remote Sensing pp303ndash316 InTech Rijeka Croatia 2009
[2] H Du Y Wang and Y Chen ldquoStudies on cloud detectionof atmospheric remote sensing image using ICA algorithmrdquoin Proceedings of the 2nd International Congress on Image andSignal Processing (CISP rsquo09) pp 1ndash4 IEEE Tianjin ChinaOctober 2009
[3] Y J Moghaddam and M Aghamohamadnia ldquoA novel methodfor cloud detection in MODIS imageryrdquo International Archivesof the Photogrammetry Remote Sensing and Spatial InformationSciences vol XL-1W3 pp 221ndash224 2013
[4] F Waquet J Riedi L C Labonnote et al ldquoAerosol remotesensing over clouds using a-train observationsrdquo Journal of theAtmospheric Sciences vol 66 no 8 pp 2468ndash2480 2009
[5] M Setvak K Bedka D T Lindsey et al ldquoA-Train observationsof deep convective storm topsrdquo Atmospheric Research vol 123pp 229ndash248 2013
[6] F Madonna A Amodeo A Boselli et al ldquoCIAO the CNR-IMAA advanced observatory for atmospheric researchrdquo Atmo-spheric Measurement Techniques vol 4 no 6 pp 1191ndash12082011
[7] J L Guerrero-Rascado M J Costa A M Silva and F J OlmoldquoRetrieval and variability analysis of optically thin cloud opticaldepths from a Cimel sun-photometerrdquo Atmospheric Researchvol 127 pp 210ndash220 2013
[8] S Hollars Q Fu J Comstock and T Ackerman ldquoCompari-son of cloud-top height retrievals from ground-based 35GHzMMCR and GMS-5 satellite observations at ARM TWPManussiterdquo Atmospheric Research vol 72 no 1ndash4 pp 169ndash186 2004
[9] B V Hai D V Trung N X Tuan D DThang and N T BinhldquoMonitoring cirrus cloud and tropopause height over Hanoiusing a compact LIDAR systemrdquo Communications in Physicsvol 22 no 4 pp 357ndash364 2012
[10] S G Lakkis M Lavorato and P O Canziani ldquoMonitoringcirrus clouds with lidar in the Southern Hemisphere a localstudy over Buenos Aires 1 Tropopause heightsrdquo AtmosphericResearch vol 92 no 1 pp 18ndash26 2009
[11] M Costa-Suros J Calbo J A Gonzalez and J Martin-VideldquoBehavior of cloud base height from ceilometer measurementsrdquoAtmospheric Research vol 127 pp 64ndash76 2013
Advances in Meteorology 9
[12] R K Kanike and V Sivakumar Remote Sensing of Aerosol Usinga Sunphotometer 2015
[13] M Kottek J Grieser C Beck B Rudolf and F Rubel ldquoWorldmap of the Koppen-Geiger climate classification updatedrdquoMeteorologische Zeitschrift vol 15 no 3 pp 259ndash263 2006
[14] AMoorgawaH BencherifMMMichaelis J Porteneuve andS Malinga ldquoThe Durban atmospheric LIDARrdquo Optics amp LaserTechnology vol 39 no 2 pp 306ndash312 2007
[15] F Immler and O Schrems ldquoLIDAR measurements of cirrusclouds in the northern and southernmidlatitudes during INCA(55∘N 53∘S) a comparative studyrdquoGeophysical Research Lettersvol 29 no 16 pp 56-1ndash56-4 2002
[16] V Sivakumar ldquoCSIRmdashNLC mobile LIDAR for atmosphericremote sensingrdquo in Remote SensingmdashAdvanced Techniques andPlatforms B Escalante-Ramirez Ed chapter 13 pp 289ndash312InTech Rijeka Croatia 2012
[17] A Sharma V Sivakumar C Bollig C van derWesthuizen andD Moema ldquoSystem description of the mobile LIDAR of theCSIR South Africardquo South African Journal of Science vol 105no 11-12 pp 456ndash462 2009
[18] F G S Lopes G L Mariano E Landulfo and V C Mari-ano ldquoImpacts of biomass burning in the atmosphere of thesoutheastern region of Brazil using remote sensing systemsrdquoin Atmospheric AerosolsmdashRegional CharacteristicsmdashChemistryand Physics F J S Lopes G L Mariano E Landulfo and E VC Mariano Eds pp 978ndash953 InTech Rijeka Croatia 2012
[19] B Medeiros L Nuijens C Antoniazzi and B Stevens ldquoLow-latitude boundary layer clouds as seen by CALIPSOrdquo Journal ofGeophysical Research Atmospheres vol 115 no 23 Article IDD23207 2010
[20] T Bangia A Omar R Sagar et al ldquoStudy of atmosphericaerosols over the central Himalayan region using a newlydeveloped Mie light detection and ranging system preliminaryresultsrdquo Journal of Applied Remote Sensing vol 5 no 1 ArticleID 053521 pp 1ndash12 2011
[21] T Bangia A Kumar R Sagar P K Agarwal and S K SinghldquoDevelopment of Mie LIDAR system and initial cloud obser-vations over Central Himalayan regionrdquo Scientific Research andEssays vol 6 no 4 pp 896ndash907 2011
[22] D Stoyanov I Grigorov G Kolarov Z Peshev and TDreischuh ldquoLIDAR atmospheric sensing by metal vapor andNdYAG lasersrdquo inAdvanced Photonic Sciences M Fadhali Edchapter 14 pp 345ndash374 InTech Rijeka Croatia 2012
[23] V Krishnakumar M Satyanarayana S R Radhakrishnan et alldquoLidar investigations on the optical and dynamical properties ofcirrus clouds in the upper troposphere and lower stratosphereregions at a tropical station Gadanki India (135∘N 792∘E)rdquoJournal of Applied Remote Sensing vol 8 no 1 Article ID083659 pp 1ndash21 2014
[24] V Venema H Russchenberg A Apituley A van Lammerenand L Ligthart ldquoCloud boundary height measurements usinglidar and radarrdquo Physics and Chemistry of the Earth Part BHydrology Oceans and Atmosphere vol 25 no 2 pp 129ndash1342000
[25] C M R Platt J D Spinhirne and W D Hart ldquoOptical andmicrophysical properties of a cold cirrus cloud evidence forregions of small ice particlesrdquo Journal of Geophysical Researchvol 94 no 8 pp 11151ndash11164 1989
[26] K Sassen A W Huggins A B Long J B Snider and R JMeitin ldquoInvestigations of awintermountain storm inUtah PartII mesoscale structure supercooled liquid water development
and precipitation processesrdquo Journal of Atmospheric Sciencesvol 47 pp 1323ndash1350 1990
[27] E J Jensen O B Toon H B Selkirk J D Spinhirne andM RSchoeberl ldquoOn the formation and persistence of subvisible cir-rus clouds near the tropical tropopauserdquo Journal of GeophysicalResearch Atmospheres vol 101 no 16 pp 21361ndash21375 1996
[28] V Sivakumar Y Bhavanikumar P B Rao et al ldquoLidar observedcharacteristics of the tropical cirrus cloudsrdquo Radio Science vol38 no 6 article 1094 2003
Submit your manuscripts athttpwwwhindawicom
Hindawi Publishing Corporationhttpwwwhindawicom Volume 2014
ClimatologyJournal of
EcologyInternational Journal of
Hindawi Publishing Corporationhttpwwwhindawicom Volume 2014
EarthquakesJournal of
Hindawi Publishing Corporationhttpwwwhindawicom Volume 2014
Hindawi Publishing Corporationhttpwwwhindawicom
Applied ampEnvironmentalSoil Science
Volume 2014
Mining
Hindawi Publishing Corporationhttpwwwhindawicom Volume 2014
Journal of
Hindawi Publishing Corporation httpwwwhindawicom Volume 2014
International Journal of
Geophysics
OceanographyInternational Journal of
Hindawi Publishing Corporationhttpwwwhindawicom Volume 2014
Journal of Computational Environmental SciencesHindawi Publishing Corporationhttpwwwhindawicom Volume 2014
Journal ofPetroleum Engineering
Hindawi Publishing Corporationhttpwwwhindawicom Volume 2014
GeochemistryHindawi Publishing Corporationhttpwwwhindawicom Volume 2014
Journal of
Atmospheric SciencesInternational Journal of
Hindawi Publishing Corporationhttpwwwhindawicom Volume 2014
OceanographyHindawi Publishing Corporationhttpwwwhindawicom Volume 2014
Advances in
Hindawi Publishing Corporationhttpwwwhindawicom Volume 2014
MineralogyInternational Journal of
Hindawi Publishing Corporationhttpwwwhindawicom Volume 2014
MeteorologyAdvances in
The Scientific World JournalHindawi Publishing Corporation httpwwwhindawicom Volume 2014
Paleontology JournalHindawi Publishing Corporationhttpwwwhindawicom Volume 2014
ScientificaHindawi Publishing Corporationhttpwwwhindawicom Volume 2014
Hindawi Publishing Corporationhttpwwwhindawicom Volume 2014
Geological ResearchJournal of
Hindawi Publishing Corporationhttpwwwhindawicom Volume 2014
Geology Advances in

2 Advances in Meteorology
from the Geostationary Meteorological Satellite- (GMS-) 5Similar to ARM systems the Light Detection And Ranging(LIDAR) with high sensitivity and high temporal coveragecan be used for studying clouds [9] LIDAR retrieval ofatmospheric parameters is an effective tool to characterisethe time and spatial evolution of the atmospheric boundarylayers as well as to investigate the physics properties of thecloud composing particle [10] A laser ceilometer is anothertype of a ground-based instrument that can be used todetermine the height of a cloud base cloud cover and cloudvertical structure [11] A laser ceilometer has a similar typeof setup as the LIDAR it consists of a vertically pointinglaser and a receiver at the same location Many studies andobservations of clouds have been made around the worldusing various instruments However in South Africa only afew studies of this nature have been carried out using a trans-portable LIDAR system Transportable LIDAR systems havean advantage over static systems as they can be moved to thedesired locations where measurements are to be carried out
For South Africa it was found that the country could bedivided into three climatic regions the subtropical wet thesubtropical dry and the arid The subtropical wet region ischaracterised by hot summer temperatures and fully humidconditions this is observed in the eastern parts of SouthAfrica The subtropical dry regions are observed in thenorthern parts of South Africa and are characterised bywarm temperatures during dry summers The arid regionis observed in the western part of South Africa and ischaracterised by high temperatures [12] However a fulldescription of the division of climatic areas is defined byKoppen-Geiger climate classification [13] Figure 1 shows thedifferent climatic regions found in South Africa (httpkoep-pen-geigervu-wienacatpresenthtm) The Koppen-Geigerclimate classification is divided into three zones (1) themain climatic zone (2) precipitation and (3) temperatureThe colour scheme on the map indicates a combination ofthe three zones which gives a description of the climaticcondition of the area From the regions mentioned thesubtropical wet region offered the best location for ourcloud studies as it is humid and allows for a higher chanceof cloud formation Durban (299∘S 309∘E) was the citychosen as it met all the requirements Moreover there wereno cloud measurements reported using the LIDAR systemThe campaign measurements performed at Durban are tounderstand the aerosol-cloud interaction laterThe particularsite had a fixed LIDAR system at the University of KwaZulu-Natal but it is currently not operational Moorgawa et al [14]have made initial results on aerosols over Durban but therewere no cloud measurements reported using such LIDARThus the present study further motivates the continuation ofLIDAR for atmospheric research over Durban
In this study the CSIR transportable LIDAR systemand CALIPSO were used for observing cloud structure andstudying its properties In this paper we discuss the campaignmeasurements conducted in Durban South Africa duringthe end of the spring season We show the type of clouds thatwere observed from 20 to 23 November 2012 In Section 2 a
Durban
World map of Koppen-Geiger climate classificationUpdated with CRU TS 21 temperature and VASClimO v11
Af
Am As
Aw
BWk
BWh
BSh
BSk
Cfa
Cfb Cfc
Csa
Csb
Csc
Cwa
Cwb
Cwc
Dfa
Dfb Dfc
Dfd
Dsa
Dsb Dsc
Dsd
Dw
a
Dw
b
Dw
c
Dw
d EF ET
Main climatesA equatorialB aridC warm temperateD snowE polar
PrecipitationW desertS steppeF fully humidS summer dryW winter dryM monsoonal
precipitation data 1951 to 2000
TemperatureH hot aridK cold aridA hot summerB warm summerC cool summerD extremely continentalF polar frostT polar tundra
Figure 1 Koppen-Geiger climate classification of South Africa rep-resenting different climatic regions ([13] httpkoeppen-geigervu-wienacatpresenthtm)Themap also shows the city of Durban themeasurement site
description of the experimental site is givenThe instrumentsmethodology and results are discussed in Sections 3 4 and5 respectively Conclusions are then given in Section 6
2 Experimental Site
Durban is the largest urban city in the SouthAfrican provinceof KwaZulu-Natal and its time zone is UTC+0200 It issituated at the south-east of South Africa and it is boundto the east by the Indian Ocean (see Figure 1) The city hasa subtropical climate and experiences four seasons whichare summer (DecemberndashFebruary) autumn (MarchndashMay)winter (JunendashAugust) and spring (SeptemberndashNovember)The rainy season is during late November through Decemberand may extend to January
3 Instruments
31 CSIR Transportable LIDAR System The transportableMie LIDAR system at theCouncil for Scientific and IndustrialResearch (CSIR) in Pretoria (257461∘S 281881∘E) wasdeveloped in 2007 This LIDAR has been configured intomonostatic system thatmaximizes the overlap of the outgoing
Advances in Meteorology 3
Table 1 Specifications of the CALIPSO and CSIR LIDAR system
Feature CALIPSO CSIR LIDAR
LaserNd YAG
diode-pumpedQ-switched
frequency doubled
Nd YAG Q-switchedflash lamp-pumped
(ContinuumPL8010)
Wavelength 532 nm 1064 nm 532 nmPulse energy 110mJchannel 140mJRepetition rate 2025Hz 10HzReceiver telescope 1m diameter 0404m532 nm detectors PMT PMT1064 nm detectors APD mdashPolarization 532 nm 532 nmFOV 130120583rad 500 120583radVertical resolution 30ndash60m 10m
beam with the receiver field of view [16] The LIDAR systemhas been mounted in a transportable platform with a specialshock absorber frame to maximize stability [16 17] Figure 2shows the layout of the experiment with the three mainsections of the LIDAR system namely the transmissionreceiver and data acquisition sections Specifications of theCSIR LIDAR system are shown in Table 1 More details aboutthe LIDAR can be found in an earlier article on systemcharacteristics by Sharma et al [17]
32 CALIPSO The Cloud-Aerosol LIDAR and InfraredPathfinder Satellite Observations (CALIPSO) can provideinformation about the thickness of clouds and can deter-mine the height and types of aerosols CALIPSO consistsof three coaligned nadir-viewing instruments the Cloud-Aerosol LIDAR with Orthogonal Polarization (CALIOP)the Imaging Infrared Radiometer (IIR) and the Wide FieldCamera (WFC) CALIOP is a sensitive LIDAR that pro-vides high-resolution vertical profiles of aerosols and cloudsCALIOP products can be separated into two levels (a) level 1products are composed of calibrated and geolocated profilesof the attenuated backscatter returned signal and (b) level2 products which are derived from level 1 products and areclassified in three types layer products profile products andvertical feature mask [18] The CALIOP is sensitive to thepresence of thin cloud layers and its range resolution of 333mcan identify small boundary layer clouds especially in theabsence of optically thick high clouds where low clouds mostdramatically impact the fluxes of shortwave radiation [19]Table 1 shows the specifications of the CALIPSO
4 Data Analysis and Methodology
The LIDARmeasurements were carried out from 20 Novem-ber 2012 to 23 November 2012The time duration ofmeasure-ments depended on the weather situation for that day Forexample on 20 November 2012 the measurements were car-ried out from 1059 local time to around 1550 when it startedto drizzle the measurements were then discontinued Theweather varied for the different days of the measurements
The backscatter signals were collected and their inten-sities measured In general the received signal intensity isdescribed in terms of the LIDAR equation as given by Bangiaet al [20 21]
119875 (119903) = 119875119900
119888120591
2119860120573 (119903)
1199032
119890minus2int
119903
0
120590(119903
1015840
)119889119903
1015840
(1)
where 119875119900is the transmitted laser power in terms of photon
counts at 532 nm 119888 is the velocity of light 120591 is the pulseduration 119860 is the effective system receiver area 120573(119903) isthe backscattering coefficient 11199032 is the range dependencefactor that accounts for the decrease in solid angle subtendedwith the square of the range and 119890minus2int
119903
0
120590(119903
1015840
)119889119903
1015840
is the integratedtwo-way extinction of the signal as it propagates from theinstrument to the scattering volume at range 119903 and returnsback The method mostly used for inverting elastic LIDARreturns is the backward inversionmethodTheKlett inversionrequires an input value of the extinction coefficient at the farboundary of the LIDAR range This boundary value can bemeasured or assumed
The backscattering and extinction coefficients are givenby contribution of both aerosols and molecules and areexpressed as
120573 (119903) = 120573aer (119903) + 120573mol (119903)
120590 (119903) = 120590aer (119903) + 120590mol (119903) (2)
where subscripts (aer) and (mol) indicate aerosols andmolecules respectively Molecular contributions were cal-culated using data from CIRA 1986 standard atmospheremodel [20 21] The molecular backscatter coefficient 120573mol(119903)is estimated by considering the theoretical molecular LIDARratio 119878mol = 120590mol120573mol as (81205873)119904119903 under the condition ofzero molecular absorption [20 21] The backward inversionmethod followed is same as earlier research by Bangia et al[20 21]
The total backscatter coefficients are derived from thebackward inversion method and can be expressed as [20 21]
120573aer (119903) + 120573mol (119903) =119883 (119903) exp [minus2 (119878aer (119903) minus 119878mol) int
119903
119903119888
120573mol (119903) 119889119903]
119883 (119903119888) (120573aer (119903119888) + 120573mol (119903119888)) minus 2119878aer int
119903
119903119888
119883 (119903) exp [minus2 (119878aer (119903) minus 119878mol) int119903
119903119888
120573mol (1199031015840
) 1198891199031015840
] 119889119903
(3)
where 119883(119903) is the range normalized signal given by 119875(119903)1199032and 119903119888is the reference height One advantage of using the
backward inversion method is that when we start integratingfrom the far end of the LIDAR sounding path we can avoid
4 Advances in Meteorology
Focusing mirror
Photomultiplier tube
Motorised 3D translationstage with optical fibre
Transient recorder
Beam expanderNd YAG laser
Computer
Figure 2 Schematic layout of the CSIR-NLC mobile LIDAR system
producing negative values of 120573aer(119903) [22] For more detailsthe reader may refer to Bangia et al [20 21]
Aerosol optical depth (AOD) is calculated by integratingthe extinction coefficient from cloud base to its top [23]
AOD = int119885119905
119885119887
120572 (119903) 119889119903 (4)
where119885119905is the cloud top119885
119887is the cloud base and 120572(119903) is the
aerosol extinction coefficient
5 Results and Discussion
51 CSIR LIDAR Observations LIDAR measurements werecarried out on 20 21 22 and 23 November 2012 in Durban(see Figure 3) On 20 November 2012 the backscatter signalfrom the LIDAR (where red indicates a strong backscatter)revealed the presence of a cloud layerThe cloudwas observedat an altitude of around 500m from 1059 until it startedraining at around 1550 local time (see Figure 3(a))The cloudhad a thickness of about 100m (Note that the CSIR LIDARhas capability for providing range resolution of 10m) On 21November 2012 two layers of clouds at the heights of 600and 1400mwere observed between 1040 and 1200 local time(see Figure 3(b)) The backscatter signal indicated that thelower level cloud at 600m did not have a large amount ofliquid water content in it thus allowing the laser to penetratethrough it and enabled the detection of the other layer ofclouds at approximately 1400m The cloud at a height of600m showed a thickness of about 100mwhile the other layerat a height of 1400m indicated a thickness of approximately70m However the upper cloud layer could not be observedat the local time of 1301 until 1345 but a strong backscattersignal was observed at the height of 600mThis indicates thatthe laser might not penetrate through the clouds (opticallyopaque) thus the other layer could not be observed if therewere any On 22 November 2012 multilayered clouds werebriefly observed between 1310 and 1328 local time (see Fig-ure 3(c)) The lower level clouds were observed at 600m and
the upper level cloudswere observed at 1000mwith thicknessof about 100mOn 23November 2012 a single layer cloud at aheight of 10000ndash12000m was observed (see Figure 3(d))Thebackscatter signal was moderate at a height of 11000m andthe strength of the signal weakened with increasing height
A similar method used by Venema et al [24] to iden-tify clouds directly from the extinction coefficient profileswas used In this method the height at which the signaldecreasesincreases considerably is called cloud topbase Foraerosols the extinction coefficients profiles generally showa decrease in extinction coefficient values with increasingheight and clouds generally show sudden high values on theprofile The aerosol extinction coefficient profiles for 20 2122 and 23 November 2012 are shown in Figure 4 On 2021 and 22 November 2012 low level clouds were observedOn these days an aerosol layer was observed at altitudesof sim100ndash400m On 20 November 2012 a layer of cloudwas observed between 400 and 500m (see Figure 4(a)) anddemonstrated an extinction coefficient value of 0018mminus1On 21 November 2012 (see Figure 4(b)) multilayered cloudswere also observed Thin cloud layers at 600 700 and800m were observed from the extinction coefficient profileswhich were not so visible in Figure 4(b) These cloud layersshowed extinction coefficients values of 0003 00118 and00117mminus1 respectivelyTherewas also a cloud layer at 1500mwith an extinction coefficient value of 0009mminus1 On 22November 2012 (see Figure 4(c)) multiple layers of cloudswere observed at 600 1000 1200 and 1500m with extinctioncoefficients values of 00012 00044 00013 and 00009mminus1respectively On 23 November 2012 (see Figure 4(d)) cloudlayers at 10000 and 11000mminus1 with extinctions coefficientsvalues of 0000001 and 0000002mminus1 were observed Theextinction coefficients of low level clouds had values in therange of 0018ndash00009mminus1 depending upon the thickness ofcloud Thicker clouds showed higher values of extinctioncoefficients compared to thinner clouds
The temporal evolution of the aerosol optical depth(AOD) was retrieved for the four days of measurements in
Advances in Meteorology 5
Time (HHMMSS)
Hei
ght (
m)
105
902
120
854
124
350
200400600800
100012001400160018002000
0
1000
2000
3000
4000
5000
(a)
Time (HHMMSS)
104
018
111
538
115
058
200400600800
100012001400160018002000
050010001500200025003000350040004500
Hei
ght (
m)
(b)
Time (HHMMSS)
Hei
ght (
m)
131
038
140
408
143
948
200400600800
100012001400160018002000
0500100015002000250030003500
(c)
Time (HHMMSS)14
04
31
141
301
142
131
143
001
143
831
144
701
145
531
2000400060008000
10000120001400016000
20
40
60
80
100
120
Hei
ght (
m)
(d)
Figure 3 Height-time colour map of CSIR transportable LIDAR backscatter signal returns at daytime in Durban on (a) 20 November 2012(b) 21 November 2012 (c) 22 November 2012 and (d) 23 November 2012 UTC+0200
0200400600800
100012001400160018002000
0 0002 0004 0006 0008 001 0012 0014 0016 0018 002
Hei
ght (
m)
Clouds
Aerosol extinction coefficient (mminus1)
(a)
Clouds
0200400600800
100012001400160018002000
0 0002 0004 0006 0008 001 0012 0014 0016 0018 002
Hei
ght (
m)
Aerosol extinction coefficient (mminus1)
(b)
0200400600800
100012001400160018002000
0 0002 0004 0006 0008 001 0012 0014 0016 0018 002
Hei
ght (
m)
Clouds
Aerosol extinction coefficient (mminus1)
(c)
02000400060008000
10000120001400016000
0 01 02 03 04 05 06 07 08 09 1
Hei
ght (
m) Clouds
Aerosol extinction coefficient (mminus1) times10
minus4
(d)
Figure 4 The retrieved aerosol extinction coefficients using the LIDAR on (a) 20 November 2012 (b) 21 November 2012 (c) 22 November2012 and (d) 23 November 2012
6 Advances in Meteorology
105902 1538200
010203040506070809
1
Time (HHMMSS)
AOD
(a)
104018 1336580
010203040506070809
1
Time (HHMMSS)
AOD
(b)
131938 160858
010203040506070809
1
Time (HHMMSS)
AOD
(c)
140431 1455310
010203040506070809
1
Time (HHMMSS)
AOD
(d)
Figure 5 Temporal evolution of AOD on (a) 20 November 2012 (b) 21 November 2012 (c) 22 November 2012 and (d) 23 November 2012
Durban (see Figure 5) using equation (4) On 20 November2012 an overall increase of the AOD was observed from themorning (1059) to the afternoon (1540) from 035 to 06 (seeFigure 5(a)) On 21 November 2012 a similar trend was alsoobserved with AOD increasing from 03 to 1 (see Figure 5(b))However on 22 November 2012 a small change in AODwas observed from 01 to 015 (see Figure 5(c)) Platt et al[25] mentioned that the change in optical depth depends onthe nature of composition and the thickness of the cloudHowever on 23 November 2012 a steady AOD value of sim002was observed (see Figure 5(d))
52 Cirrus Clouds Observed on 23 November 2012 Through-out the campaign cirrus clouds were only observed on 23November 2012 Most of the clouds are found between theheights of 55 km and 125 km with height range thicknessesspanning 18ndash31 km see Figure 6 Sassen et al [26] and Jensenet al [27] have ascribed the outflows from cumulonimbusanvils to the formation of thick cirrus clouds to mid andhigh altitudes These type of clouds arise due to the verticalmixing of air from the entrainment and detrainment Ithas been previously suggested that the ice water gradient islargely destroyed due to sturdy mixing by the strong cloudcirculation [28] The optical properties of this cloud werecompared to cirrus clouds observed in the southern hemi-sphere see Table 2 From the reported cirrus clouds inTable 2it can be seen that the cirrus clouds over Durban had thelowest cloud height base of 55 km These are very low cirrusclouds but over time they were found to disappear Howeverthe average cloud thickness is similar to that observed by
Time (HHMMSS)
Hei
ght (
km)
140
431
141
301
142
131
143
001
143
831
144
701
145
531
468
101214
10
20
30
40
50
60Height of top
Height of base
Figure 6 Height-time colour map of CSIR transportable LIDARsignal returns illustrating the presence of cirrus cloud on 23November 2012 over DurbanThe cloud height top and cloud heightbottom are indicated by the thick dark lines
Lakkis et al [10] This correlation does somehow suggestthat the cirrus cloud properties may depend on climateconditions and geographical location However amore widerclimatological study needs to be carried out to confirm thedependence of climate conditions and geographical location
53 CALIPSO and CSIR LIDAR Comparison The only com-parable CALIPSO data which were available during the oper-ation of the CSIR LIDAR were on 20 and 22 November 2012For 21 and 23 November 2012 the satellite observations weretoo far from themeasurement site Figures 7(a) and 7(b) show
Advances in Meteorology 7
Table 2 Cirrus cloud properties observed by LIDAR
Location (AGL)(distance from shoreline)
Cloud top height(km) maximum
Cloud base height(km) minimum
Cloud thickness(km)
Distance totropopause (km)
Durban299∘S 309∘E
(8m)(plusmn14 km)
125 55 245 mdash
(Buenos Aires)Lakkis et al 2009 [10]
346∘S 585∘W(31m) 1182 963 241 038
(Punta Arenas)Immler and Schrems2002 [15]
531∘S 71∘W(30m) 95 88 14 17
minus32
83
minus31
64
minus30
45
minus29
26
minus28
07
minus26
88
minus25
69
minus24
49
minus23
30
02468
101214161820
Alti
tude
(km
)
Latitude
00
0001
000
020
0003
000
040
0005
000
060
0007
000
080
0009
000
10
0015
000
20
0025
000
30
0035
000
40
0045
000
50
0055
000
60
0065
000
70
0075
000
80
010
020
030
040
050
060
070
080
09 01
(a)
minus32
83
minus31
64
minus30
45
minus29
26
minus28
07
minus26
88
minus25
69
minus24
49
minus23
30
02468
101214161820
Alti
tude
(km
)
Latitude
00
0001
000
020
0003
000
040
0005
000
060
0007
000
080
0009
000
10
0015
000
20
0025
000
30
0035
000
40
0045
000
50
0055
000
60
0065
000
70
0075
000
80
010
020
030
040
050
060
070
080
09 01
(b)
Figure 7 Height-time colour map of CALIPSO-derived total attenuated backscatter at 532 nm on (a) 20 November 2012 at 1205 and (b) 22November 2012 at 1152 UTC+0200
colour coded time-height images of the daytime level 1 data at532 nm acquired by CALIPSO on 20 and 22 November 2012respectively On 20 November 2012 the nearest coincidencebetween the CSIR LIDAR and the CALIPSO occurred ataround 1205 local time The aerosol layer was observed ataround 1 km No clouds were observed in the lower partof the troposphere by the CALIPSO at the observation site(latitude minus299∘) However it has illustrated the presence ofclouds at 8ndash13 km with a thickness of sim3 km these cloudswere not observed by the CSIR LIDAR system This suggeststhat the thick cloud observed by the CSIR LIDAR causedmost of the photons of the laser to be absorbed and thus a fewphotons penetrating through the cloud As a result these fewphotons could not detect the clouds at those heights as theycould have been scattered or absorbed along the way On 22November 2012 a similar cloud at a height of 8ndash13 km wasobserved However on this day a layer of cloud was observedat the height of sim45 km by the CALIPSO The CSIR LIDARgives a better description of the atmospheric conditions in thefirst few kilometers of the troposphere for cloudy conditionswhereas the CALIPSO gives better information at the topof the troposphere Further it indirectly also addresses thestrength of the signal which is higher at lower heights (as it ispenetrating upward) while the satellite data looks downwardwhere the signal strength is higher at the top Thus the two
instruments complement each other to give a description ofclouds in the troposphere even for cloudy conditions
The mean extinction coefficient profiles from theCALIPSO level 2 aerosol product are shown in Figure 8 On20 November 2012 the highest value of extinction coefficientof sim008 kmminus1 was observed at a height of about 5 km (seeFigure 8(a)) From Figure 8(a) this indicates the presence ofa thin cloud at that altitude High level clouds at the heightsof 6ndash11 km were observed from the extinction coefficientdata However on the lower part of the troposphere a thicksingle layer of cloud at around 18 km was observed It canalso be observed that different layers of clouds were present atdifferent altitudes from 18 km to 11 kmThese however werenot so clear in Figures 3(a) and 3(c) The negative extinctioncoefficient values are found to be noise in the CALIPSOsignal when aerosol loading is low and background noise ishigh On 22 November 2012 the extinction coefficient profileshowed the presence of a thick cloud at around 3 km (seeFigure 7(b)) while the aerosol layer was observed at about15 km However no extinction coefficients were observed athigh altitudes indicating the absence of clouds
6 Conclusion
Campaign measurements over Durban (299∘S 309∘E) havebeen carried out due to favourable meteorological conditions
8 Advances in Meteorology
minus006 minus004 minus002 0 002 004 006 008 01
2
4
6
8
10
12
14A
ltitu
de (k
m)
Clouds
Clouds
Extinction coefficient (kmminus1)
(a)
0015 002 0025 003 0035 004 0045 005 0055
2
4
6
8
10
12
14
Alti
tude
(km
)
Clouds
Extinction coefficient (kmminus1)
(b)
Figure 8 Height profile of extinction coefficient observed from CALIPSO on (a) 20 November 2012 and (b) 22 November 2012
for cloud formations and to perform aerosol-cloud interac-tions studies in future Clouds over Durban (299∘S 309∘E)during the spring (early summer) season were observedusing a transportable LIDAR system Cloud layers on thelower atmosphere were observed on 20ndash22 November 2012while high level clouds were observed on 23 November 2012The low level cloud layers have high extinction coefficientsvalues ranging from 00009 to 00044mminus1 whereas lowextinction coefficients for high level clouds were observed atvalues ranging between 0000001 and 0000002mminus1 The vastdifference in the extinction coefficient suggests that there areremarkable differences in optical characteristics between lowand high level cloudsThe high level clouds could be classifiedas cirrus clouds based on the altitude they were detected atThe calculated AOD showed a high variability for 20 and 21November 2012 This indicates a change in the compositionandor thickness of the cloud However a constant valueof the optical depth on 23 November suggested a staticcloud composition andor thickness Comparable LIDARand CALIPSO data was available on 20 and 22 November2012 and indicated that the CALIPSO could observe high-level clouds while the CSIR LIDAR could not However thetwo instruments complement each other well to describe thecloudy condition
Competing Interests
The authors declare that they have no competing interests
Acknowledgments
The authors would like to thank Henk van Wyk and AmeethSharma for the technical support on the LIDAR systemCALIPSO data were obtained from the NASA LangleyResearch Centre Atmospheric Science Data Centre theauthors would like to acknowledge the NASA personnel forthe production of the data used in the present research Theauthors would also like to thank the African Laser Centre(ALC) project for funding the campaign measurements inDurban
References
[1] G Jedlovec ldquoAutomated detection of clouds in satelliteimageryrdquo in Advances in Geoscience and Remote Sensing pp303ndash316 InTech Rijeka Croatia 2009
[2] H Du Y Wang and Y Chen ldquoStudies on cloud detectionof atmospheric remote sensing image using ICA algorithmrdquoin Proceedings of the 2nd International Congress on Image andSignal Processing (CISP rsquo09) pp 1ndash4 IEEE Tianjin ChinaOctober 2009
[3] Y J Moghaddam and M Aghamohamadnia ldquoA novel methodfor cloud detection in MODIS imageryrdquo International Archivesof the Photogrammetry Remote Sensing and Spatial InformationSciences vol XL-1W3 pp 221ndash224 2013
[4] F Waquet J Riedi L C Labonnote et al ldquoAerosol remotesensing over clouds using a-train observationsrdquo Journal of theAtmospheric Sciences vol 66 no 8 pp 2468ndash2480 2009
[5] M Setvak K Bedka D T Lindsey et al ldquoA-Train observationsof deep convective storm topsrdquo Atmospheric Research vol 123pp 229ndash248 2013
[6] F Madonna A Amodeo A Boselli et al ldquoCIAO the CNR-IMAA advanced observatory for atmospheric researchrdquo Atmo-spheric Measurement Techniques vol 4 no 6 pp 1191ndash12082011
[7] J L Guerrero-Rascado M J Costa A M Silva and F J OlmoldquoRetrieval and variability analysis of optically thin cloud opticaldepths from a Cimel sun-photometerrdquo Atmospheric Researchvol 127 pp 210ndash220 2013
[8] S Hollars Q Fu J Comstock and T Ackerman ldquoCompari-son of cloud-top height retrievals from ground-based 35GHzMMCR and GMS-5 satellite observations at ARM TWPManussiterdquo Atmospheric Research vol 72 no 1ndash4 pp 169ndash186 2004
[9] B V Hai D V Trung N X Tuan D DThang and N T BinhldquoMonitoring cirrus cloud and tropopause height over Hanoiusing a compact LIDAR systemrdquo Communications in Physicsvol 22 no 4 pp 357ndash364 2012
[10] S G Lakkis M Lavorato and P O Canziani ldquoMonitoringcirrus clouds with lidar in the Southern Hemisphere a localstudy over Buenos Aires 1 Tropopause heightsrdquo AtmosphericResearch vol 92 no 1 pp 18ndash26 2009
[11] M Costa-Suros J Calbo J A Gonzalez and J Martin-VideldquoBehavior of cloud base height from ceilometer measurementsrdquoAtmospheric Research vol 127 pp 64ndash76 2013
Advances in Meteorology 9
[12] R K Kanike and V Sivakumar Remote Sensing of Aerosol Usinga Sunphotometer 2015
[13] M Kottek J Grieser C Beck B Rudolf and F Rubel ldquoWorldmap of the Koppen-Geiger climate classification updatedrdquoMeteorologische Zeitschrift vol 15 no 3 pp 259ndash263 2006
[14] AMoorgawaH BencherifMMMichaelis J Porteneuve andS Malinga ldquoThe Durban atmospheric LIDARrdquo Optics amp LaserTechnology vol 39 no 2 pp 306ndash312 2007
[15] F Immler and O Schrems ldquoLIDAR measurements of cirrusclouds in the northern and southernmidlatitudes during INCA(55∘N 53∘S) a comparative studyrdquoGeophysical Research Lettersvol 29 no 16 pp 56-1ndash56-4 2002
[16] V Sivakumar ldquoCSIRmdashNLC mobile LIDAR for atmosphericremote sensingrdquo in Remote SensingmdashAdvanced Techniques andPlatforms B Escalante-Ramirez Ed chapter 13 pp 289ndash312InTech Rijeka Croatia 2012
[17] A Sharma V Sivakumar C Bollig C van derWesthuizen andD Moema ldquoSystem description of the mobile LIDAR of theCSIR South Africardquo South African Journal of Science vol 105no 11-12 pp 456ndash462 2009
[18] F G S Lopes G L Mariano E Landulfo and V C Mari-ano ldquoImpacts of biomass burning in the atmosphere of thesoutheastern region of Brazil using remote sensing systemsrdquoin Atmospheric AerosolsmdashRegional CharacteristicsmdashChemistryand Physics F J S Lopes G L Mariano E Landulfo and E VC Mariano Eds pp 978ndash953 InTech Rijeka Croatia 2012
[19] B Medeiros L Nuijens C Antoniazzi and B Stevens ldquoLow-latitude boundary layer clouds as seen by CALIPSOrdquo Journal ofGeophysical Research Atmospheres vol 115 no 23 Article IDD23207 2010
[20] T Bangia A Omar R Sagar et al ldquoStudy of atmosphericaerosols over the central Himalayan region using a newlydeveloped Mie light detection and ranging system preliminaryresultsrdquo Journal of Applied Remote Sensing vol 5 no 1 ArticleID 053521 pp 1ndash12 2011
[21] T Bangia A Kumar R Sagar P K Agarwal and S K SinghldquoDevelopment of Mie LIDAR system and initial cloud obser-vations over Central Himalayan regionrdquo Scientific Research andEssays vol 6 no 4 pp 896ndash907 2011
[22] D Stoyanov I Grigorov G Kolarov Z Peshev and TDreischuh ldquoLIDAR atmospheric sensing by metal vapor andNdYAG lasersrdquo inAdvanced Photonic Sciences M Fadhali Edchapter 14 pp 345ndash374 InTech Rijeka Croatia 2012
[23] V Krishnakumar M Satyanarayana S R Radhakrishnan et alldquoLidar investigations on the optical and dynamical properties ofcirrus clouds in the upper troposphere and lower stratosphereregions at a tropical station Gadanki India (135∘N 792∘E)rdquoJournal of Applied Remote Sensing vol 8 no 1 Article ID083659 pp 1ndash21 2014
[24] V Venema H Russchenberg A Apituley A van Lammerenand L Ligthart ldquoCloud boundary height measurements usinglidar and radarrdquo Physics and Chemistry of the Earth Part BHydrology Oceans and Atmosphere vol 25 no 2 pp 129ndash1342000
[25] C M R Platt J D Spinhirne and W D Hart ldquoOptical andmicrophysical properties of a cold cirrus cloud evidence forregions of small ice particlesrdquo Journal of Geophysical Researchvol 94 no 8 pp 11151ndash11164 1989
[26] K Sassen A W Huggins A B Long J B Snider and R JMeitin ldquoInvestigations of awintermountain storm inUtah PartII mesoscale structure supercooled liquid water development
and precipitation processesrdquo Journal of Atmospheric Sciencesvol 47 pp 1323ndash1350 1990
[27] E J Jensen O B Toon H B Selkirk J D Spinhirne andM RSchoeberl ldquoOn the formation and persistence of subvisible cir-rus clouds near the tropical tropopauserdquo Journal of GeophysicalResearch Atmospheres vol 101 no 16 pp 21361ndash21375 1996
[28] V Sivakumar Y Bhavanikumar P B Rao et al ldquoLidar observedcharacteristics of the tropical cirrus cloudsrdquo Radio Science vol38 no 6 article 1094 2003
Submit your manuscripts athttpwwwhindawicom
Hindawi Publishing Corporationhttpwwwhindawicom Volume 2014
ClimatologyJournal of
EcologyInternational Journal of
Hindawi Publishing Corporationhttpwwwhindawicom Volume 2014
EarthquakesJournal of
Hindawi Publishing Corporationhttpwwwhindawicom Volume 2014
Hindawi Publishing Corporationhttpwwwhindawicom
Applied ampEnvironmentalSoil Science
Volume 2014
Mining
Hindawi Publishing Corporationhttpwwwhindawicom Volume 2014
Journal of
Hindawi Publishing Corporation httpwwwhindawicom Volume 2014
International Journal of
Geophysics
OceanographyInternational Journal of
Hindawi Publishing Corporationhttpwwwhindawicom Volume 2014
Journal of Computational Environmental SciencesHindawi Publishing Corporationhttpwwwhindawicom Volume 2014
Journal ofPetroleum Engineering
Hindawi Publishing Corporationhttpwwwhindawicom Volume 2014
GeochemistryHindawi Publishing Corporationhttpwwwhindawicom Volume 2014
Journal of
Atmospheric SciencesInternational Journal of
Hindawi Publishing Corporationhttpwwwhindawicom Volume 2014
OceanographyHindawi Publishing Corporationhttpwwwhindawicom Volume 2014
Advances in
Hindawi Publishing Corporationhttpwwwhindawicom Volume 2014
MineralogyInternational Journal of
Hindawi Publishing Corporationhttpwwwhindawicom Volume 2014
MeteorologyAdvances in
The Scientific World JournalHindawi Publishing Corporation httpwwwhindawicom Volume 2014
Paleontology JournalHindawi Publishing Corporationhttpwwwhindawicom Volume 2014
ScientificaHindawi Publishing Corporationhttpwwwhindawicom Volume 2014
Hindawi Publishing Corporationhttpwwwhindawicom Volume 2014
Geological ResearchJournal of
Hindawi Publishing Corporationhttpwwwhindawicom Volume 2014
Geology Advances in
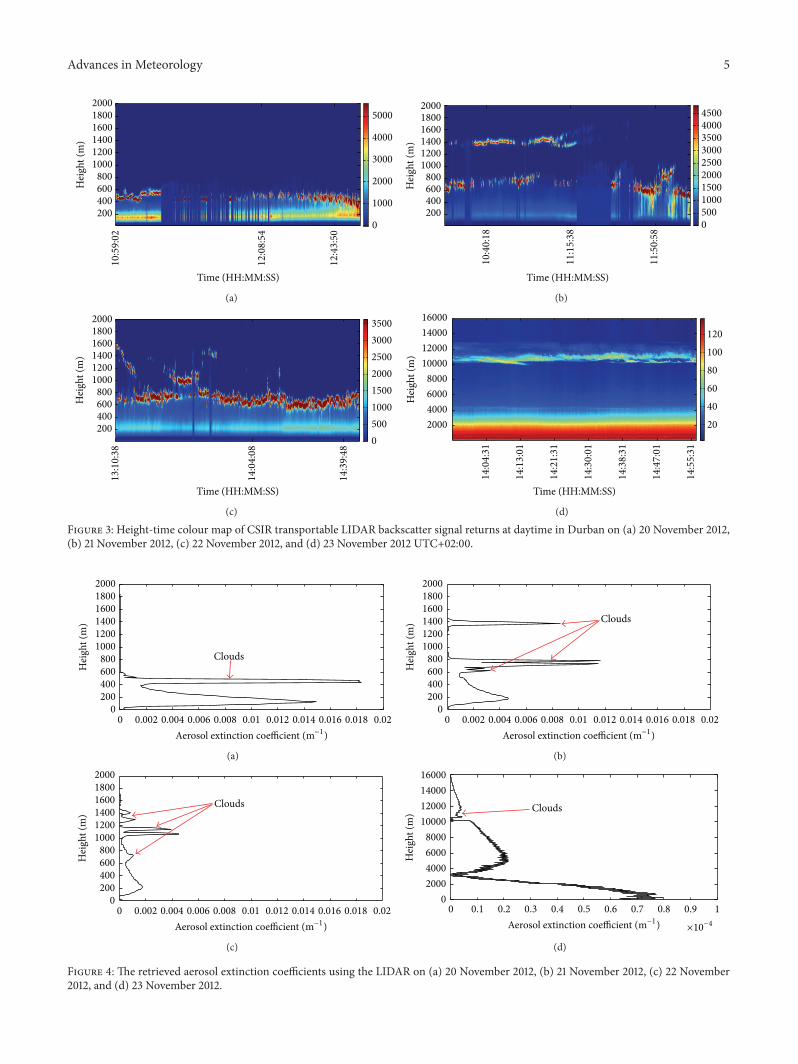
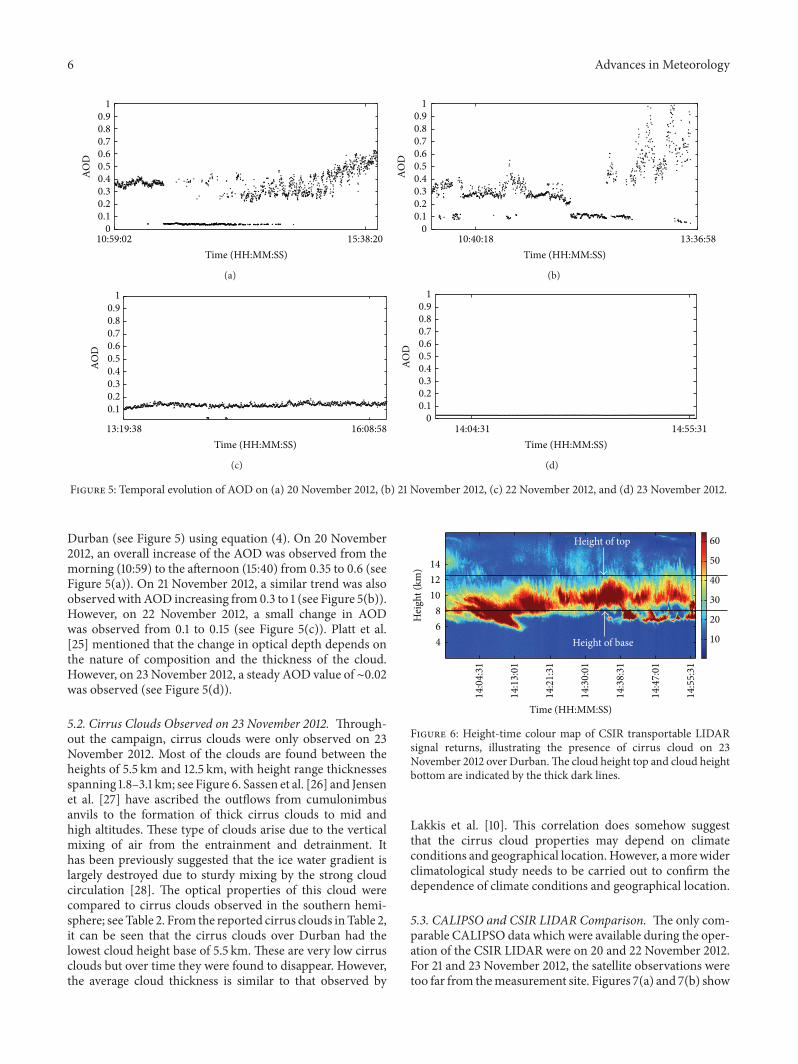
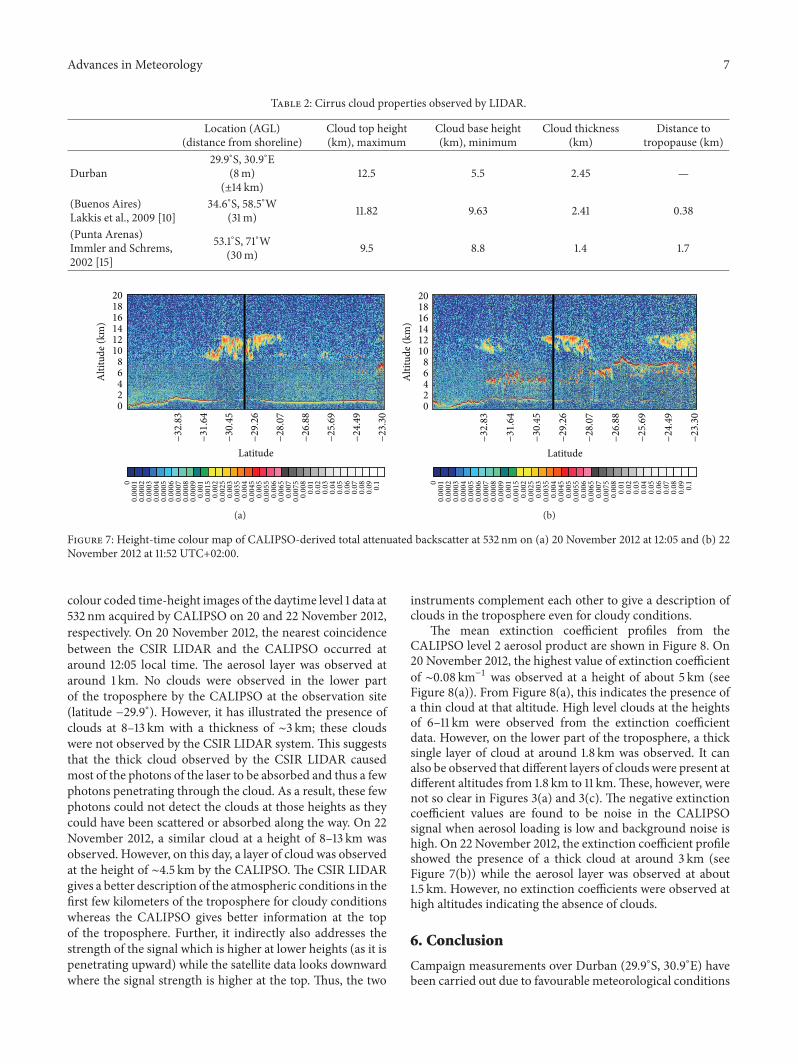
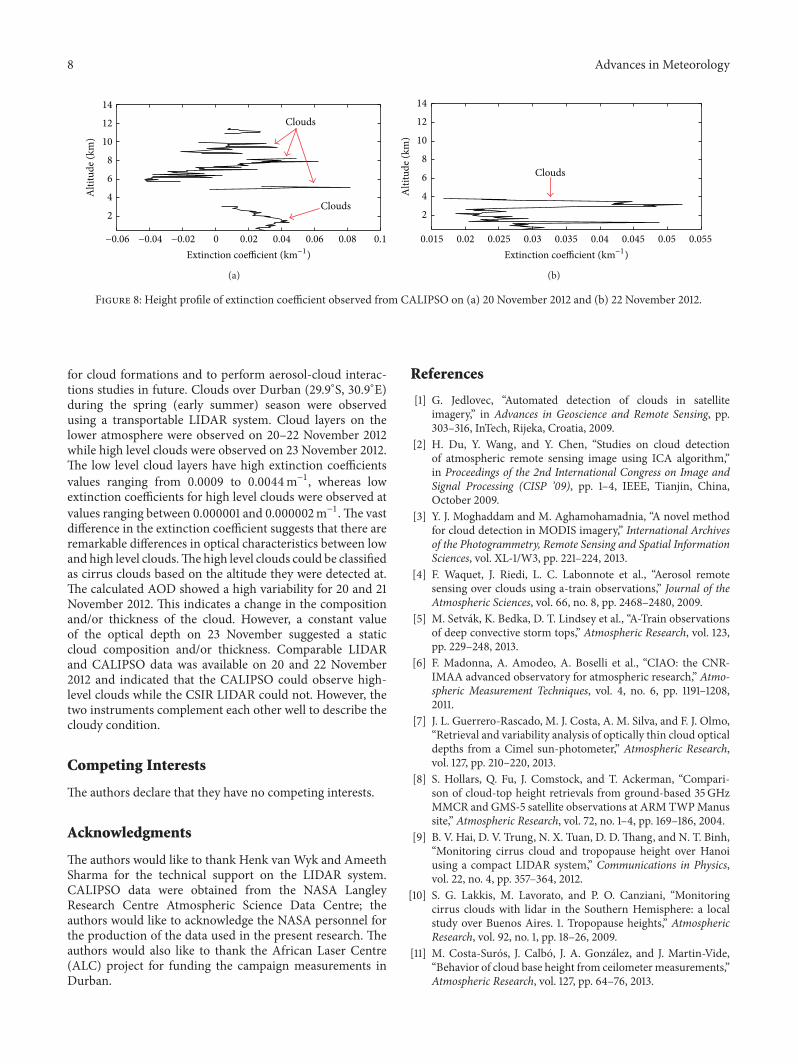