research article numerical simulation and clinical
TRANSCRIPT

Research ArticleNumerical Simulation and Clinical Implications ofStenosis in Coronary Blood Flow
Jun-Mei Zhang,1 Liang Zhong,1,2 Tong Luo,3 Yunlong Huo,4 Swee Yaw Tan,1,2
Aaron Sung Lung Wong,1,2 Boyang Su,1 Min Wan,1 Xiaodan Zhao,1 Ghassan S. Kassab,3
Heow Pueh Lee,5 Boo Cheong Khoo,5 Chang-Wei Kang,6 Te Ba,6 and Ru San Tan1,2
1 National Heart Center Singapore, 5 Hospital Drive, Singapore 1696092Duke-NUS Graduate Medical School Singapore, 8 College Road, Singapore 1698573Department of Biomedical Engineering, Indiana University-Purdue University Indianapolis, Indianapolis, IN 46202, USA4Department of Mechanics and Engineering Science, College of Engineering, Peking University, Beijing 100871, China5 Department of Mechanical Engineering, National University of Singapore, 1 Engineering Drive 2, Singapore 1175766 Fluid Dynamics Department, Institute of High Performance Computing, 1 Fusionopolis Way,No. 16-16 Connexis North, Singapore 138632
Correspondence should be addressed to Liang Zhong; [email protected]
Received 28 February 2014; Accepted 29 April 2014; Published 2 June 2014
Academic Editor: Bruno Levy
Copyright © 2014 Jun-Mei Zhang et al.This is an open access article distributed under the Creative Commons Attribution License,which permits unrestricted use, distribution, and reproduction in any medium, provided the original work is properly cited.
Fractional flow reserve (FFR) is the gold standard to guide coronary interventions. However it can only be obtained via invasiveangiography. The objective of this study is to propose a noninvasive method to determine FFRCT by combining computedtomography angiographic (CTA) images and computational fluid dynamics (CFD) technique. Utilizing the method, this studyexplored the effects of diameter stenosis (DS), stenosis length, and location on FFRCT.The baseline left anterior descending (LAD)model was reconstructed from CTA of a healthy porcine heart. A series of models were created by adding an idealized stenosis(with DS from 45% to 75%, stenosis length from 4mm to 16mm, and at 4 locations separately). Through numerical simulations, itwas found that FFRCT decreased (from 0.89 to 0.74), when DS increased (from 45% to 75%). Similarly, FFRCT decreased with theincrease of stenosis length and the stenosis located at proximal position had lower FFRCT than that at distal position.These findingsare consistent with clinical observations. Applying the same method on two patients’ CTA images yielded FFRCT close to the FFRvalues obtained via invasive angiography. The proposed noninvasive computation of FFRCT is promising for clinical diagnosis ofCAD.
1. Introduction
As themost common type of cardiovascular disease, coronaryartery disease (CAD) is caused by the build-up of plaqueson the endothelial walls of coronary arteries, which leadsto a reduction in arteries cross-sectional area and bloodsupply to themyocardium [1]. Pathology studies of CADhaverevealed that coronary stenosis is the predominant factorleading to cardiovascular-related events such as myocardialinfarction (MI), stroke, and unstable angina. Therefore it isvital to physiologically characterize and quantify functionalcoronary stenosis.
The rapid development of noninvasive imaging technolo-gies, such as computed tomography angiography (CTA) andmagnetic resonance imaging (MRI), has proven valuable tocharacterize the anatomic severity of CAD with fair costand less complication. Diameter stenosis (DS) is commonlyapplied to quantify the anatomic severity of CAD. It expressesthe ratio of the lumen diameter at a stenotic region overthat of a “normal” segment. However, DS cannot characterizehemodynamic functional significance of coronary stenosis onmyocardial blood supply. Among the stenoses discriminatedwith the threshold of 50% for DS, fewer than half areischemic [2].
Hindawi Publishing CorporationBioMed Research InternationalVolume 2014, Article ID 514729, 10 pageshttp://dx.doi.org/10.1155/2014/514729
2 BioMed Research International
In terms of hemodynamic indexes to quantify thefunctional significance of coronary stenosis, fractional flowreserve (FFR) is the gold standard to guide coronary inter-ventions [3–6] because of its significantly fewer follow-upcoronary events over DS. FFR is calculated as a ratio ofthe pressure distal versus pressure proximal to a stenosisfollowing vasodilation. Revascularization is commonly rec-ommended when the coronary stenosis leads to FFR ≤ 0.80.However, FFR can only be measured via invasive coronarycatheterization, which may result in higher medical cost andcomplications [4]. This is not ideal, because only one-thirdof the intermediate stenosis (DS = 40–70%) is classified asfunctional significant with FFR ≤ 0.80 [5].
In view of the abundant hemodynamic information pro-vided by computational fluid dynamics (CFD) simulations,considerable insights have been gained on understanding thephysiology of CAD through CFD studies [7]. Tremendousprogress has been made in applying the CFD method tosimulate the blood flow in patient-specific coronary arterymodels for elucidating the role of hemodynamics in CADdevelopment and progression [8–10].
As proper boundary conditions are necessary for CFDsimulations of CAD, both prescribed profiles [11, 12] andsophisticated reduced-ordered models [13–15] have beenattempted. For the latter, the downstream vasculature isrepresented by flow-dependent formulation. For example,the static pressure at the outlet may be calculated from thecorresponding flow rate and resistance. Since resistance, com-pliance, or impedance values of the downstream vasculatureare assumed to be decided by their own anatomy rather thanby the upstream stenosis, these parameters obtained fromthe normal vessel (without stenosis) can be applied to thediseased vessel [15].
With the development of CFD techniques, numerousCFD studies have been coupled with clinical imaging tech-niques to provide detailed hemodynamic information andlink CAD with vortices [16], wall shear stress (WSS) [12, 17],oscillatory shear index (OSI) [18], and so forth. However,the application of CFD method to predict clinical diagnosisindexes is still limited. A landmark study was carried out byHeartFlow Company [19–22] to derive noninvasive FFRCTfrom CT images by applying sophisticated reduced-orderedmodels as the boundary conditions for transient numericalsimulations. Because the calculation of FFR is based on thetime-averaged pressure over several cardiac cycles in clinics[23], this study explored a method to combine CT imagesand steady flow simulation for calculating noninvasive FFRCTwith lower computational cost. The method is firstly appliedon a left anterior descending (LAD) model reconstructedfrom CTA of a healthy porcine heart and then tested ontwo patient-specific left coronary artery trees reconstructedfrom patients’ CTA images to examine whether the approachcan be applied for noninvasively assessing the hemodynamicsignificance of coronary stenosis in clinics.
As the anatomical severity ofCAD is believed to be relatednot only to DS but also to the location and length of thestenosis, which can affect the hemodynamics [24], a series ofmodels were created by adding an idealized stenosis (with DSfrom 45% to 75%, stenosis length from 4mm to 16mm, and
at 4 locations separately) on the baseline porcine LADmodel.In this manner, the effects of DS, stenosis length, and location(proximal to distal) on FFRCT are investigated. The resultsmay be useful to aid the clinician in making the decision ofrevascularization.
This paper is organized as follows: the detailed com-putational methodologies were described in Section 2. InSection 3, the detailed hemodynamic information (flowpatterns, flow rate, pressure, and FFRCT distributions) fora series of stenosed porcine LAD models was provided toexplore the effect of DS, stenosis length, and location onFFRCT. The results of two case studies were also presented todemonstrate the applicability of the current methodologieson clinical diagnosis of human CAD. Finally, the conclusionswere drawn in Section 4.
2. Computational Methodologies
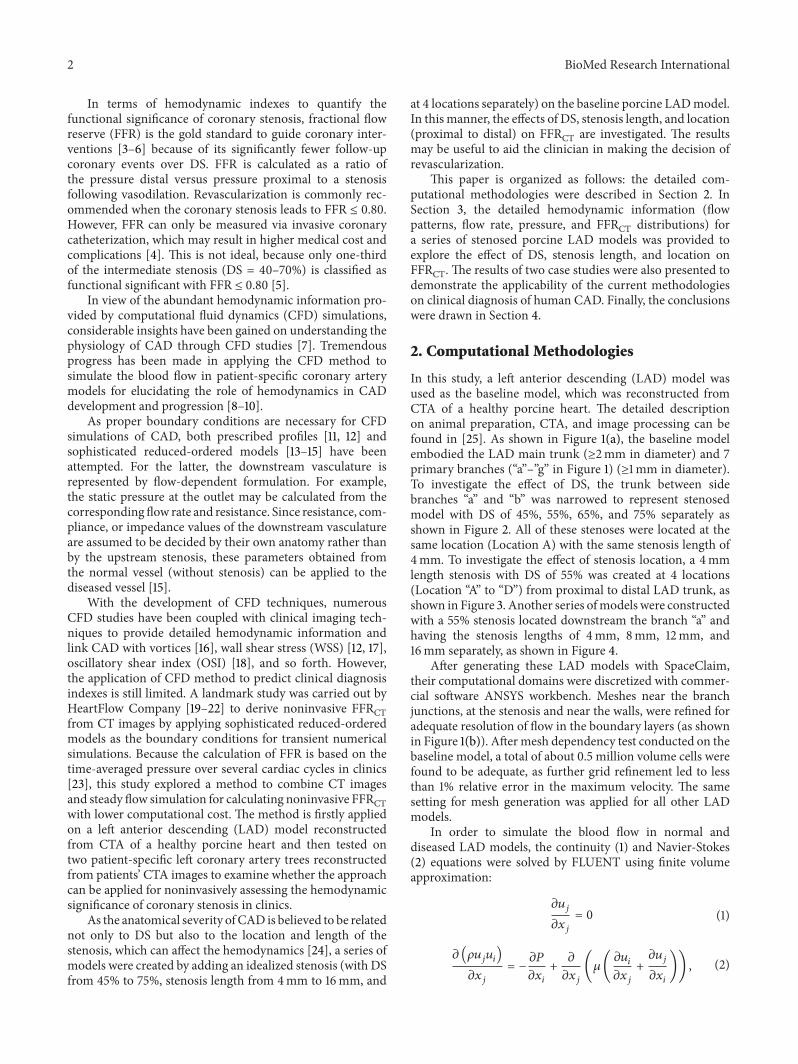
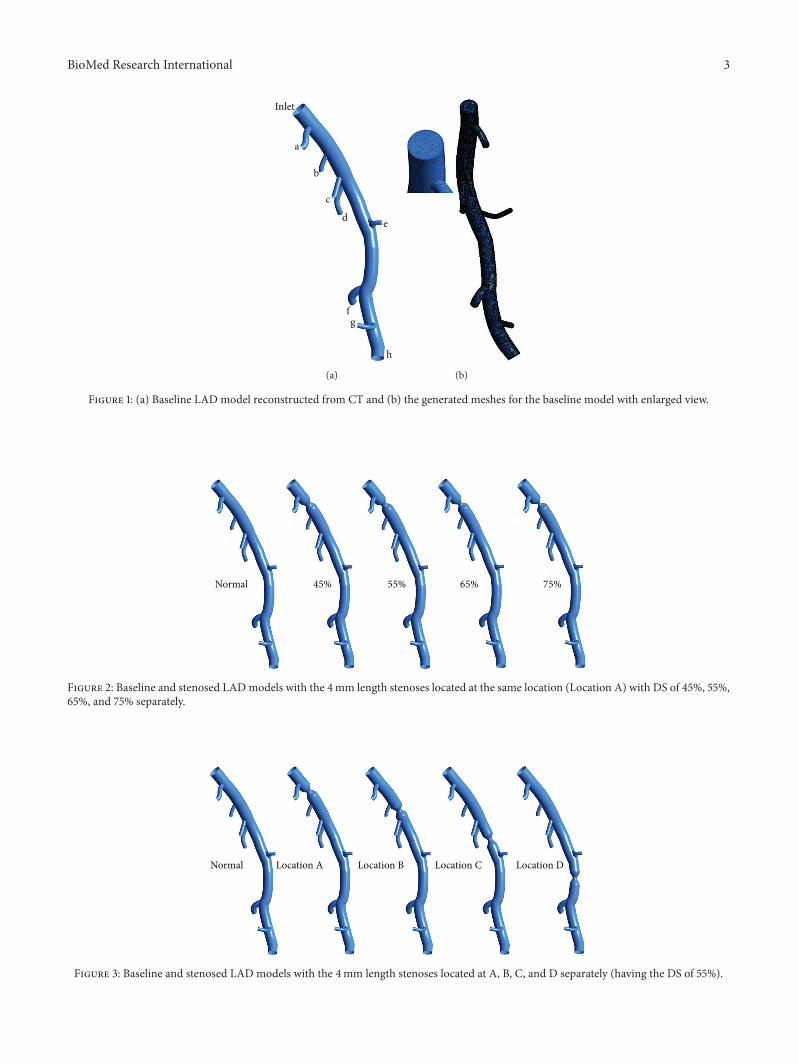
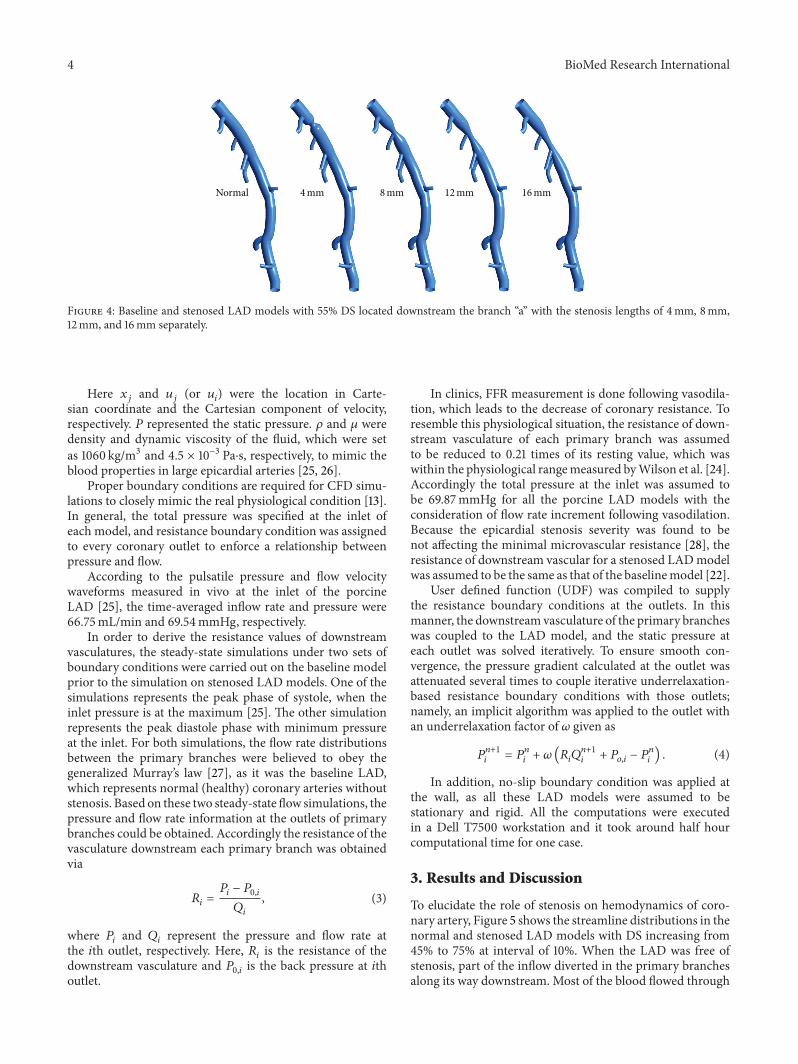
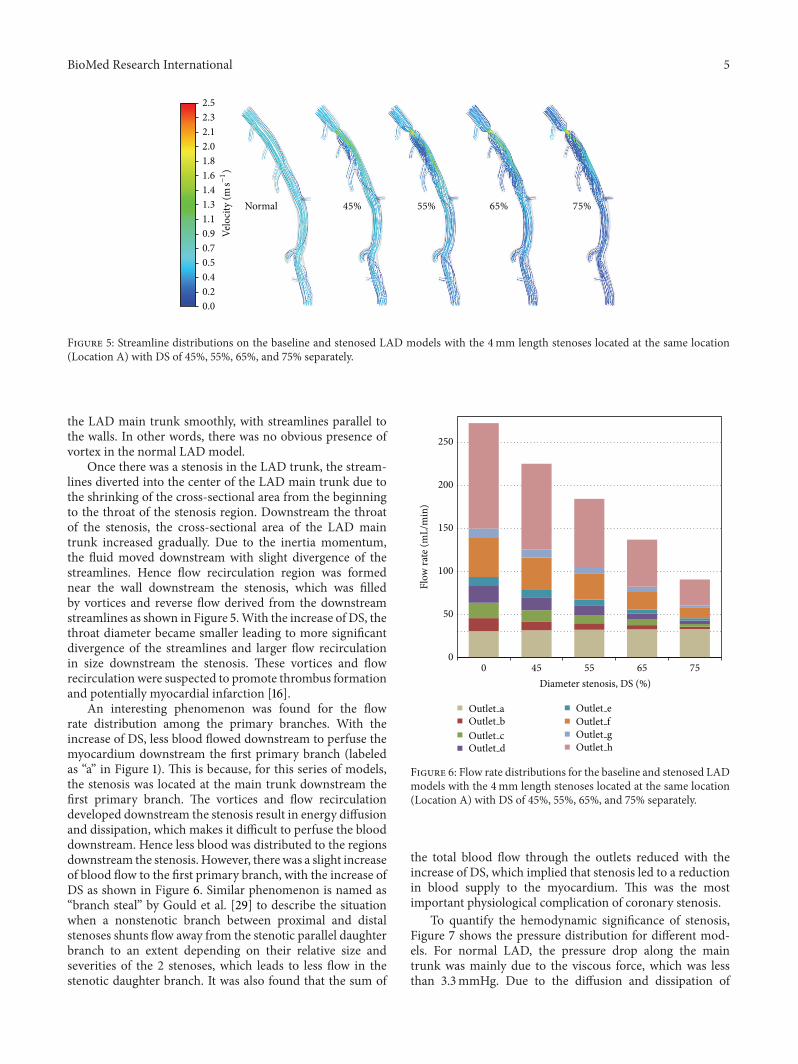
In this study, a left anterior descending (LAD) model wasused as the baseline model, which was reconstructed fromCTA of a healthy porcine heart. The detailed descriptionon animal preparation, CTA, and image processing can befound in [25]. As shown in Figure 1(a), the baseline modelembodied the LAD main trunk (≥2mm in diameter) and 7primary branches (“a”–”g” in Figure 1) (≥1mm in diameter).To investigate the effect of DS, the trunk between sidebranches “a” and “b” was narrowed to represent stenosedmodel with DS of 45%, 55%, 65%, and 75% separately asshown in Figure 2. All of these stenoses were located at thesame location (Location A) with the same stenosis length of4mm. To investigate the effect of stenosis location, a 4mmlength stenosis with DS of 55% was created at 4 locations(Location “A” to “D”) from proximal to distal LAD trunk, asshown in Figure 3. Another series ofmodels were constructedwith a 55% stenosis located downstream the branch “a” andhaving the stenosis lengths of 4mm, 8mm, 12mm, and16mm separately, as shown in Figure 4.
After generating these LAD models with SpaceClaim,their computational domains were discretized with commer-cial software ANSYS workbench. Meshes near the branchjunctions, at the stenosis and near the walls, were refined foradequate resolution of flow in the boundary layers (as shownin Figure 1(b)). Aftermesh dependency test conducted on thebaseline model, a total of about 0.5 million volume cells werefound to be adequate, as further grid refinement led to lessthan 1% relative error in the maximum velocity. The samesetting for mesh generation was applied for all other LADmodels.
In order to simulate the blood flow in normal anddiseased LAD models, the continuity (1) and Navier-Stokes(2) equations were solved by FLUENT using finite volumeapproximation:
𝜕𝑢𝑗
𝜕𝑥𝑗
= 0 (1)
𝜕 (𝜌𝑢𝑗𝑢𝑖)
𝜕𝑥𝑗
= −𝜕𝑃
𝜕𝑥𝑖
+𝜕
𝜕𝑥𝑗
(𝜇(𝜕𝑢𝑖
𝜕𝑥𝑗
+
𝜕𝑢𝑗
𝜕𝑥𝑖
)) , (2)
BioMed Research International 3
Inlet
a
b
c
d e
fg
h
(a) (b)
Figure 1: (a) Baseline LAD model reconstructed from CT and (b) the generated meshes for the baseline model with enlarged view.
Normal 45% 55% 65% 75%
Figure 2: Baseline and stenosed LADmodels with the 4mm length stenoses located at the same location (Location A) with DS of 45%, 55%,65%, and 75% separately.
Normal Location A Location B Location C Location D
Figure 3: Baseline and stenosed LAD models with the 4mm length stenoses located at A, B, C, and D separately (having the DS of 55%).
4 BioMed Research International
Normal 4mm 8mm 12mm 16mm
Figure 4: Baseline and stenosed LAD models with 55% DS located downstream the branch “a” with the stenosis lengths of 4mm, 8mm,12mm, and 16mm separately.
Here 𝑥𝑗 and 𝑢𝑗 (or 𝑢𝑖) were the location in Carte-sian coordinate and the Cartesian component of velocity,respectively. P represented the static pressure. 𝜌 and 𝜇 weredensity and dynamic viscosity of the fluid, which were setas 1060 kg/m3 and 4.5 × 10⁻³ Pa⋅s, respectively, to mimic theblood properties in large epicardial arteries [25, 26].
Proper boundary conditions are required for CFD simu-lations to closely mimic the real physiological condition [13].In general, the total pressure was specified at the inlet ofeach model, and resistance boundary condition was assignedto every coronary outlet to enforce a relationship betweenpressure and flow.
According to the pulsatile pressure and flow velocitywaveforms measured in vivo at the inlet of the porcineLAD [25], the time-averaged inflow rate and pressure were66.75mL/min and 69.54mmHg, respectively.
In order to derive the resistance values of downstreamvasculatures, the steady-state simulations under two sets ofboundary conditions were carried out on the baseline modelprior to the simulation on stenosed LAD models. One of thesimulations represents the peak phase of systole, when theinlet pressure is at the maximum [25]. The other simulationrepresents the peak diastole phase with minimum pressureat the inlet. For both simulations, the flow rate distributionsbetween the primary branches were believed to obey thegeneralized Murray’s law [27], as it was the baseline LAD,which represents normal (healthy) coronary arteries withoutstenosis. Based on these two steady-state flow simulations, thepressure and flow rate information at the outlets of primarybranches could be obtained. Accordingly the resistance of thevasculature downstream each primary branch was obtainedvia
𝑅𝑖 =𝑃𝑖 − 𝑃0,𝑖
𝑄𝑖
, (3)
where 𝑃𝑖 and 𝑄𝑖 represent the pressure and flow rate atthe 𝑖th outlet, respectively. Here, 𝑅𝑖 is the resistance of thedownstream vasculature and 𝑃0,𝑖 is the back pressure at 𝑖thoutlet.
In clinics, FFR measurement is done following vasodila-tion, which leads to the decrease of coronary resistance. Toresemble this physiological situation, the resistance of down-stream vasculature of each primary branch was assumedto be reduced to 0.21 times of its resting value, which waswithin the physiological rangemeasured byWilson et al. [24].Accordingly the total pressure at the inlet was assumed tobe 69.87mmHg for all the porcine LAD models with theconsideration of flow rate increment following vasodilation.Because the epicardial stenosis severity was found to benot affecting the minimal microvascular resistance [28], theresistance of downstream vascular for a stenosed LADmodelwas assumed to be the same as that of the baselinemodel [22].
User defined function (UDF) was compiled to supplythe resistance boundary conditions at the outlets. In thismanner, the downstream vasculature of the primary brancheswas coupled to the LAD model, and the static pressure ateach outlet was solved iteratively. To ensure smooth con-vergence, the pressure gradient calculated at the outlet wasattenuated several times to couple iterative underrelaxation-based resistance boundary conditions with those outlets;namely, an implicit algorithm was applied to the outlet withan underrelaxation factor of 𝜔 given as
𝑃𝑛+1𝑖 = 𝑃
𝑛𝑖 + 𝜔 (𝑅𝑖𝑄
𝑛+1𝑖 + 𝑃𝑜,𝑖 − 𝑃
𝑛𝑖 ) . (4)
In addition, no-slip boundary condition was applied atthe wall, as all these LAD models were assumed to bestationary and rigid. All the computations were executedin a Dell T7500 workstation and it took around half hourcomputational time for one case.
3. Results and Discussion
To elucidate the role of stenosis on hemodynamics of coro-nary artery, Figure 5 shows the streamline distributions in thenormal and stenosed LAD models with DS increasing from45% to 75% at interval of 10%. When the LAD was free ofstenosis, part of the inflow diverted in the primary branchesalong its way downstream. Most of the blood flowed through
BioMed Research International 5
Normal
2.52.32.12.01.81.61.41.31.10.90.70.50.40.20.0
45% 55% 65% 75%
Velo
city
(m s−
1)
Figure 5: Streamline distributions on the baseline and stenosed LAD models with the 4mm length stenoses located at the same location(Location A) with DS of 45%, 55%, 65%, and 75% separately.
the LAD main trunk smoothly, with streamlines parallel tothe walls. In other words, there was no obvious presence ofvortex in the normal LAD model.
Once there was a stenosis in the LAD trunk, the stream-lines diverted into the center of the LAD main trunk due tothe shrinking of the cross-sectional area from the beginningto the throat of the stenosis region. Downstream the throatof the stenosis, the cross-sectional area of the LAD maintrunk increased gradually. Due to the inertia momentum,the fluid moved downstream with slight divergence of thestreamlines. Hence flow recirculation region was formednear the wall downstream the stenosis, which was filledby vortices and reverse flow derived from the downstreamstreamlines as shown in Figure 5.With the increase of DS, thethroat diameter became smaller leading to more significantdivergence of the streamlines and larger flow recirculationin size downstream the stenosis. These vortices and flowrecirculation were suspected to promote thrombus formationand potentially myocardial infarction [16].
An interesting phenomenon was found for the flowrate distribution among the primary branches. With theincrease of DS, less blood flowed downstream to perfuse themyocardium downstream the first primary branch (labeledas “a” in Figure 1). This is because, for this series of models,the stenosis was located at the main trunk downstream thefirst primary branch. The vortices and flow recirculationdeveloped downstream the stenosis result in energy diffusionand dissipation, which makes it difficult to perfuse the blooddownstream. Hence less blood was distributed to the regionsdownstream the stenosis. However, there was a slight increaseof blood flow to the first primary branch, with the increase ofDS as shown in Figure 6. Similar phenomenon is named as“branch steal” by Gould et al. [29] to describe the situationwhen a nonstenotic branch between proximal and distalstenoses shunts flow away from the stenotic parallel daughterbranch to an extent depending on their relative size andseverities of the 2 stenoses, which leads to less flow in thestenotic daughter branch. It was also found that the sum of
0
50
100
150
200
250
0 45 55 65 75
Flow
rate
(mL/
min
)
Diameter stenosis, DS (%)
Outlet a Outlet eOutlet b Outlet fOutlet c Outlet gOutlet d Outlet h
Figure 6: Flow rate distributions for the baseline and stenosed LADmodels with the 4mm length stenoses located at the same location(Location A) with DS of 45%, 55%, 65%, and 75% separately.
the total blood flow through the outlets reduced with theincrease of DS, which implied that stenosis led to a reductionin blood supply to the myocardium. This was the mostimportant physiological complication of coronary stenosis.
To quantify the hemodynamic significance of stenosis,Figure 7 shows the pressure distribution for different mod-els. For normal LAD, the pressure drop along the maintrunk was mainly due to the viscous force, which was lessthan 3.3mmHg. Due to the diffusion and dissipation of

6 BioMed Research International
Normal 45% 55% 65% 75%
70
69
67
66
65
63
62
61
59
58
57
55
54
53
51
50
Pres
sure
(mm
Hg)
Figure 7: Pressure distributions on the baseline and stenosed LAD models with the 4mm length stenoses located at the same location(Location A) with DS of 45%, 55%, 65%, and 75% separately.
the recirculation vortices formed downstream the stenosis,the pressure therein decreasedmuchmore.With the increaseof DS, pressure downstream the stenosis became much loweras shown in Figure 7.
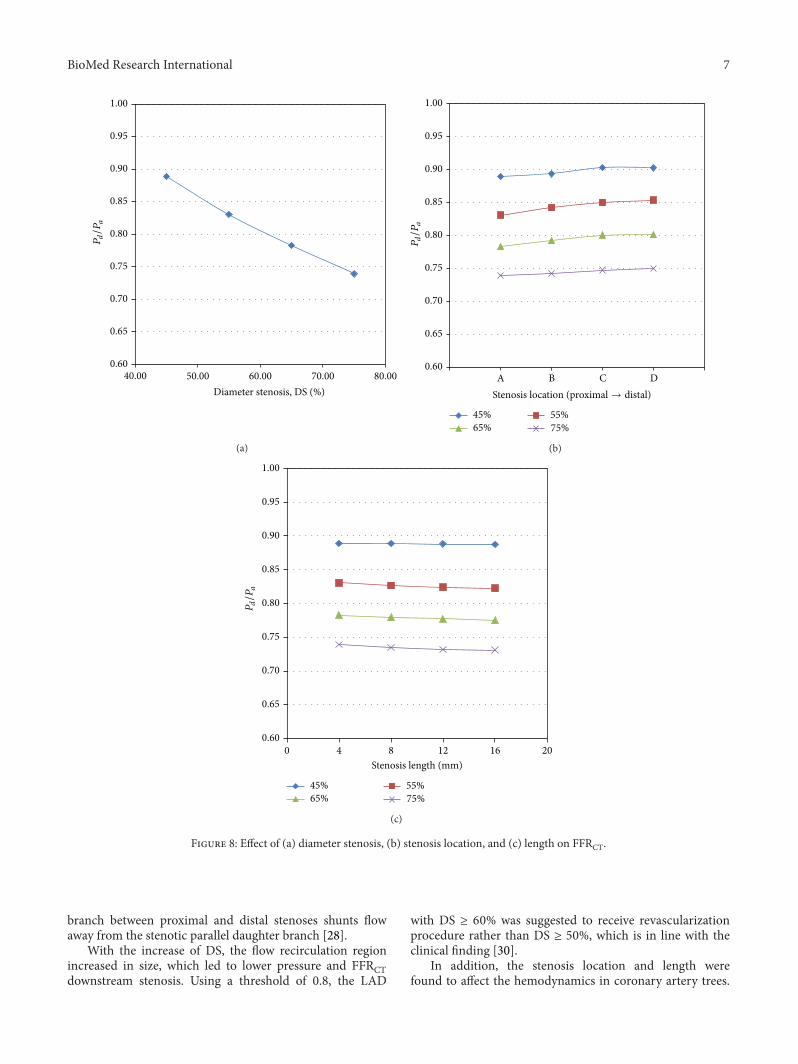
To resemble FFR values measured via invasive angiogra-phy, FFRCT is calculated as 𝑃𝑑/𝑃𝑎. Here 𝑃𝑑 and 𝑃𝑎 representthe pressure distal and proximal to the stenosis, respectively.As shown in Figure 8(a), FFRCT decreased from 0.89 to 0.74,when DS increased from 45% to 75%. As revascularizationis commonly recommended when coronary stenosis leads toFFR ≤ 0.8 in clinical applications [5], the LAD with DS ≥60% was suggested to receive revascularization proceduresaccording to Figure 8(a). This is in line with the clinicalfindings that the diagnostic performance of CTA can beimproved by rating coronary stenosis as significant with thethreshold of 60% rather than 50% [30].
To assess the effect of stenosis location and length on thehemodynamic severity of CAD, Figures 8(b) and 8(c) showthe relationship between stenosis location and length withFFRCT, respectively. Comparing with the stenosis locatedmore distally, those stenoses located at proximal portion ledto lower 𝑃𝑑/𝑃𝑎, namely, FFRCT.Therefore the stenosis locatedat proximal portion resulted in more significant reductionin blood supply to the myocardium, which was suspected topromote the further accumulation of plaques. This result isconsistent with the clinical findings that the adverse eventsof coronary artery disease occurred most frequently in aproximal position [31].
In addition, the FFRCT values decreased with the increaseof stenosis length, which implies higher fractional lossesover the stenosis. However the effect of lesion length onhemodynamics is not significant as shown in Figure 8(c).Similar finding was reported by Wilson et al. [24]. Howeverit is worth noting that fractional losses at longer stenosis maydepend on the ruggedness of the surface and local geometryof the stenosis in real life. Hence simulation on the realisticcoronary artery tree is critically important.
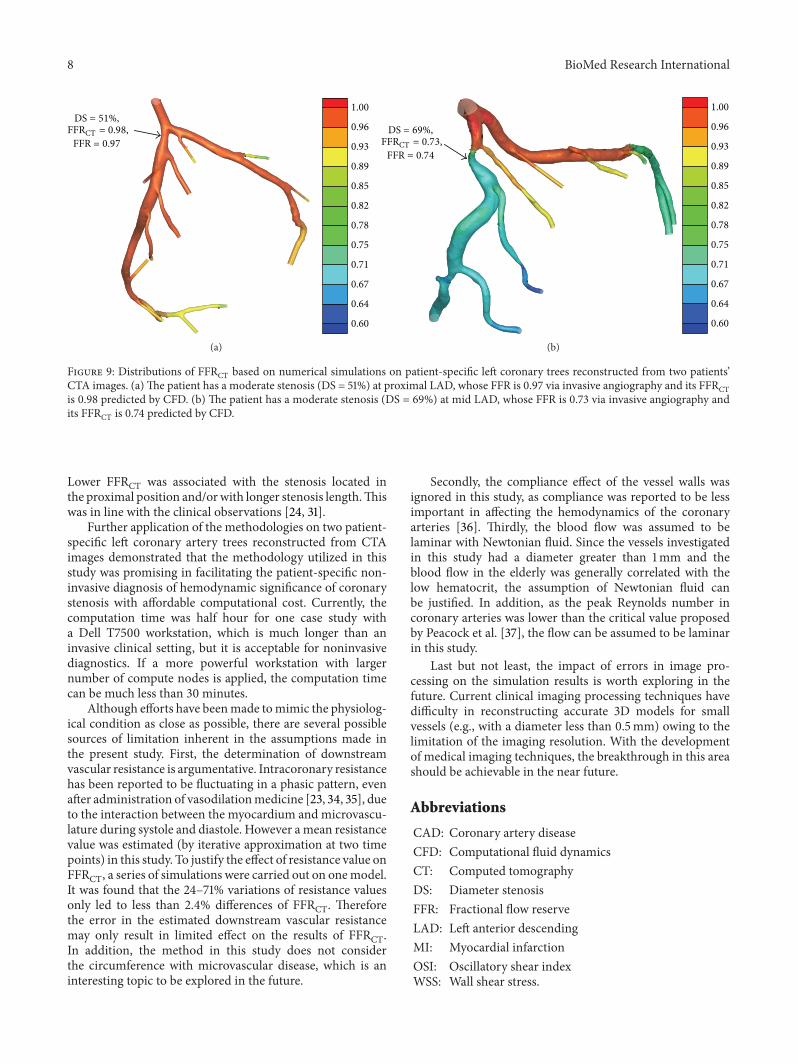
Therefore, we have also attempted to apply the same CFDmethodologies on the patients’ CTA images. The detailedinformation on image reconstruction and numerical simu-lation was presented in [32, 33]. Figures 9(a) and 9(b) showthe predicted FFRCT on the patient-specific left coronaryartery trees reconstructed from two patients’ CTA images,respectively. The first patient has a moderate stenosis atproximal LAD, which is not ischemia-causing, as its FFR was0.97 measured via invasive angiography. Its FFRCT predictedby CFD was 0.98. The other patient has an ischemia-causingmoderate stenosis at mid LAD, whose FFR was less than 0.8,that is, at 0.73, and its FFFCT was found to be 0.74. These twoexamples demonstrated that the noninvasive methodologiespresented in this study were applicable to assess the hemody-namic significance of stenosis in clinics.
4. Conclusions
In recent years, tremendous progress has been made oninvasive and noninvasive medical imaging techniques todiagnose the anatomical and hemodynamic significance ofcoronary stenosis. Although FFR is the gold standard todiagnose the hemodynamic significance of the CAD, itcan only be obtained via invasive coronary angiography.Combining CTA with CFD methods, the flow pattern andpressure distributions can be predicted for a baseline LADmodel reconstructed from theCTAof a healthy porcine heart.
By adding stenosis on this baseline model, the effects ofDS, stenosis location, and length on the hemodynamics ofstenosed coronary artery were explored. It was found thatthe flow recirculation vortices were formed downstream thethroat of stenosis due to the divergence of the streamline,which led to the decrease of flow rate and pressure down-stream the stenosis due to energy diffusion and dissipation.The phenomenon of “branch steal” was observed, which waspreviously reported by Gould et al. [29] when a nonstenotic
BioMed Research International 7
0.60
0.65
0.70
0.75
0.80
0.85
0.90
0.95
1.00
40.00 50.00 60.00Diameter stenosis, DS (%)
70.00 80.00
Pd/P
a
(a)
0.60
0.65
0.70
0.75
0.80
0.85
0.90
0.95
1.00
45% 55%65% 75%
A B C DStenosis location (proximal → distal)
Pd/P
a
(b)
0.60
0.65
0.70
0.75
0.80
0.85
0.90
0.95
1.00
0 4 8 12 16 20Stenosis length (mm)
Pd/P
a
45% 55%65% 75%
(c)
Figure 8: Effect of (a) diameter stenosis, (b) stenosis location, and (c) length on FFRCT.
branch between proximal and distal stenoses shunts flowaway from the stenotic parallel daughter branch [28].
With the increase of DS, the flow recirculation regionincreased in size, which led to lower pressure and FFRCTdownstream stenosis. Using a threshold of 0.8, the LAD
with DS ≥ 60% was suggested to receive revascularizationprocedure rather than DS ≥ 50%, which is in line with theclinical finding [30].
In addition, the stenosis location and length werefound to affect the hemodynamics in coronary artery trees.
8 BioMed Research International
1.00
0.96
0.93
0.89
0.85
0.82
0.78
0.75
0.71
0.67
0.64
0.60
DS = 51%,FFRCT = 0.98,
FFR = 0.97
(a)
1.00
0.96
0.93
0.89
0.85
0.82
0.78
0.75
0.71
0.67
0.64
0.60
DS = 69%,FFRCT = 0.73,
FFR = 0.74
(b)
Figure 9: Distributions of FFRCT based on numerical simulations on patient-specific left coronary trees reconstructed from two patients’CTA images. (a)The patient has a moderate stenosis (DS = 51%) at proximal LAD, whose FFR is 0.97 via invasive angiography and its FFRCTis 0.98 predicted by CFD. (b) The patient has a moderate stenosis (DS = 69%) at mid LAD, whose FFR is 0.73 via invasive angiography andits FFRCT is 0.74 predicted by CFD.
Lower FFRCT was associated with the stenosis located inthe proximal position and/orwith longer stenosis length.Thiswas in line with the clinical observations [24, 31].
Further application of the methodologies on two patient-specific left coronary artery trees reconstructed from CTAimages demonstrated that the methodology utilized in thisstudy was promising in facilitating the patient-specific non-invasive diagnosis of hemodynamic significance of coronarystenosis with affordable computational cost. Currently, thecomputation time was half hour for one case study witha Dell T7500 workstation, which is much longer than aninvasive clinical setting, but it is acceptable for noninvasivediagnostics. If a more powerful workstation with largernumber of compute nodes is applied, the computation timecan be much less than 30 minutes.
Although efforts have beenmade tomimic the physiolog-ical condition as close as possible, there are several possiblesources of limitation inherent in the assumptions made inthe present study. First, the determination of downstreamvascular resistance is argumentative. Intracoronary resistancehas been reported to be fluctuating in a phasic pattern, evenafter administration of vasodilationmedicine [23, 34, 35], dueto the interaction between the myocardium and microvascu-lature during systole and diastole. However amean resistancevalue was estimated (by iterative approximation at two timepoints) in this study. To justify the effect of resistance value onFFRCT, a series of simulations were carried out on onemodel.It was found that the 24–71% variations of resistance valuesonly led to less than 2.4% differences of FFRCT. Thereforethe error in the estimated downstream vascular resistancemay only result in limited effect on the results of FFRCT.In addition, the method in this study does not considerthe circumference with microvascular disease, which is aninteresting topic to be explored in the future.
Secondly, the compliance effect of the vessel walls wasignored in this study, as compliance was reported to be lessimportant in affecting the hemodynamics of the coronaryarteries [36]. Thirdly, the blood flow was assumed to belaminar with Newtonian fluid. Since the vessels investigatedin this study had a diameter greater than 1mm and theblood flow in the elderly was generally correlated with thelow hematocrit, the assumption of Newtonian fluid canbe justified. In addition, as the peak Reynolds number incoronary arteries was lower than the critical value proposedby Peacock et al. [37], the flow can be assumed to be laminarin this study.
Last but not least, the impact of errors in image pro-cessing on the simulation results is worth exploring in thefuture. Current clinical imaging processing techniques havedifficulty in reconstructing accurate 3D models for smallvessels (e.g., with a diameter less than 0.5mm) owing to thelimitation of the imaging resolution. With the developmentof medical imaging techniques, the breakthrough in this areashould be achievable in the near future.
Abbreviations
CAD: Coronary artery diseaseCFD: Computational fluid dynamicsCT: Computed tomographyDS: Diameter stenosisFFR: Fractional flow reserveLAD: Left anterior descendingMI: Myocardial infarctionOSI: Oscillatory shear indexWSS: Wall shear stress.
BioMed Research International 9
Conflict of Interests
The authors declare that there is no conflict of interestsregarding the publication of this paper.
Acknowledgments
This research is supported by the SingHealth Foundation,Singapore, under its Translational Research Grant, andadministered by the SingHealth (SHF/FG503P/2012) andby National Heart Center Singapore under its NHCS Cen-tre Grant Seed Funding (NHCS-CGSF/2014/003), and byBiomedical Research Council Research Grant (14/1/32/24/002).The financial supports of NMRC/EDG/1037/2011 by theNational Research Foundation, Singapore, under its Cooper-ative Basic Research Grant, and Duke-NUS-GCR/2013/0009,and by the Goh Cardiovascular Research Grant are gratefullyacknowledged. The authors acknowledge the support of allstaff at the National Heart Centre, Singapore, especially FongChing Teck, MaxWu Bing Huang, andHo Pei Yi and the staffin catheter laboratory and CT departments.
References
[1] T. Heitzer, T. Schlinzig, K. Krohn, T. Meinertz, and T. Munzel,“Endothelial dysfunction, oxidative stress, and risk of car-diovascular events in patients with coronary artery disease,”Circulation, vol. 104, no. 22, pp. 2673–2678, 2001.
[2] W. B. Meijboom, C. A. G. Van Mieghem, N. van Pelt et al.,“Comprehensive assessment of coronary artery stenoses: com-puted tomography coronary angiography versus conventionalcoronary angiography and correlation with fractional flowreserve in patients with stable angina,” Journal of the AmericanCollege of Cardiology, vol. 52, no. 8, pp. 636–643, 2008.
[3] N. H. J. Pijls, J. A. M. Van Son, R. L. Kirkeeide, B. De Bruyne,and K. L. Gould, “Experimental basis of determiningmaximumcoronary, myocardial, and collateral blood flow by pressuremeasurements for assessing functional stenosis severity beforeand after percutaneous transluminal coronary angioplasty,”Circulation, vol. 87, no. 4, pp. 1354–1367, 1993.
[4] N. P. Johnson, R. L. Kirkeeide, and K. L. Gould, “Is discordanceof coronary flow reserve and fractional flow reserve due tomethodology or clinically relevant coronary pathophysiology?”Cardiovascular Imaging, vol. 5, no. 2, pp. 193–202, 2012.
[5] P. A. L. Tonino, B. De Bruyne,N.H. J. Pijls et al., “Fractional flowreserve versus angiography for guiding percutaneous coronaryintervention,” The New England Journal of Medicine, vol. 360,no. 3, pp. 213–224, 2009.
[6] N. H. J. Pijls and J.-W. E. M. Sels, “Functional measurement ofcoronary stenosis,” Journal of the American College of Cardiol-ogy, vol. 59, no. 12, pp. 1045–1057, 2012.
[7] J. M. Zhang, L. Zhong, B. Su et al., “Perspective on CFDstudies of coronary artery disease lesions and hemodynamics—a review,” International Journal for Numerical Methods inBiomedical Engineering, 2014.
[8] U. Olgac, D. Poulikakos, S. C. Saur, H. Alkadhi, and V.Kurtcuoglu, “Patient-specific three-dimensional simulation ofLDL accumulation in a human left coronary artery in its healthyand atherosclerotic states,” American Journal of Physiology—Heart and Circulatory Physiology, vol. 296, no. 6, pp. H1969–H1982, 2009.
[9] E. Wellnhofer, J. Osman, U. Kertzscher, K. Affeld, E. Fleck, andL. Goubergrits, “Flow simulation studies in coronary arteries-Impact of side-branches,”Atherosclerosis, vol. 213, no. 2, pp. 475–481, 2010.
[10] T. Chaichana, Z. Sun, and J. Jewkes, “Computation of hemo-dynamics in the left coronary artery with variable angulations,”Journal of Biomechanics, vol. 44, no. 10, pp. 1869–1878, 2011.
[11] R. Torii, N. B. Wood, N. Hadjiloizou et al., “Stress phase angledepicts differences in coronary artery hemodynamics due tochanges in flow and geometry after percutaneous coronaryintervention,” American Journal of Physiology—Heart and Cir-culatory Physiology, vol. 296, no. 3, pp. H765–H776, 2009.
[12] H. Samady, P. Eshtehardi, M. C. McDaniel et al., “Coronaryartery wall shear stress is associated with progression and trans-formation of atherosclerotic plaque and arterial remodeling inpatients with coronary artery disease,” Circulation, vol. 124, no.7, pp. 779–788, 2011.
[13] I. E. Vignon-Clementel, C. A. Figueroa, K. E. Jansen, and C.A. Taylor, “Outflow boundary conditions for three-dimensionalfinite element modeling of blood flow and pressure in arteries,”Computer Methods in Applied Mechanics and Engineering, vol.195, no. 29-32, pp. 3776–3796, 2006.
[14] H. J. Kim, I. E. Vignon-Clementel, C. A. Figueroa et al.,“On coupling a lumped parameter heart model and a three-dimensional finite element aorta model,” Annals of BiomedicalEngineering, vol. 37, no. 11, pp. 2153–2169, 2009.
[15] H. J. Kim, I. E. Vignon-Clementel, J. S. Coogan, C. A. Figueroa,K. E. Jansen, and C. A. Taylor, “Patient-specific modeling ofblood flow and pressure in human coronary arteries,” Annalsof Biomedical Engineering, vol. 38, no. 10, pp. 3195–3209, 2010.
[16] D. G. Katritsis, A. Theodorakakos, I. Pantos et al., “Vortex for-mation and recirculation zones in left anterior descendingartery stenoses: computational fluid dynamics analysis,” Physicsin Medicine and Biology, vol. 55, no. 5, pp. 1395–1411, 2010.
[17] P. H. Stone, S. Saito, S. Takahashi et al., “Prediction of pro-gression of coronary artery disease and clinical outcomes usingvascular profiling of endothelial shear stress and arterial plaquecharacteristics: the PREDICTION study,” Circulation, vol. 126,no. 2, pp. 172–181, 2012.
[18] J. Knight, U. Olgac, S. C. Saur et al., “Choosing the optimalwall shear parameter for the prediction of plaque location—apatient-specific computational study in human right coronaryarteries,” Atherosclerosis, vol. 211, no. 2, pp. 445–450, 2010.
[19] B.-K. Koo, A. Erglis, J.-H. Doh et al., “Diagnosis of ischemia-causing coronary stenoses by noninvasive fractional flowreserve computed from coronary computed tomographicangiograms: results from the prospective multicenterDISCOVER-FLOW (Diagnosis of Ischemia-Causing StenosesObtained Via Noninvasive Fractional Flow Reserve) study,”Journal of the American College of Cardiology, vol. 58, no. 19,pp. 1989–1997, 2011.
[20] J. K. Min, B.-K. Koo, A. Erglis et al., “Usefulness of noninvasivefractional flow reserve computed from coronary computedtomographic angiograms for intermediate stenoses confirmedby quantitative coronary angiography,” American Journal ofCardiology, vol. 110, no. 7, pp. 971–976, 2012.
[21] J. K. Min, J. Leipsic, M. J. Pencina et al., “Diagnostic accuracy offractional flow reserve from anatomic CT angiography,” Journalof the American Medical Association, vol. 308, no. 12, pp. 1237–1245, 2012.
[22] C. A. Taylor, T. A. Fonte, and J. K. Min, “Computationalfluid dynamics applied to cardiac computed tomography for

10 BioMed Research International
noninvasive quantification of fractional flow reserve,” Journalof American College of Cardiology, vol. 61, no. 22, pp. 2233–2241,2013.
[23] S. Sen, J. Escaned, I. S. Malik et al., “Development and val-idation of a new adenosine-independent index of stenosisseverity from coronary waveintensity analysis: results of theADVISE (ADenosine Vasodilator Independent Stenosis Evalu-ation) study,” Journal of the American College of Cardiology, vol.59, no. 15, pp. 1392–1402, 2012.
[24] R. F. Wilson, M. L. Marcus, and C. W. White, “Predictionof the physiologic significance of coronary arterial lesions byquantitative lesion geometry in patients with limited coronaryartery disease,” Circulation, vol. 75, no. 4, pp. 723–732, 1987.
[25] Y. Huo, T. Wischgol, and G. S. Kassab, “Flow patterns in three-dimensional porcine epicardial coronary arterial tree,” Amer-ican Journal of Physiology—Heart and Circulatory Physiology,vol. 293, no. 5, pp. H2959–H2970, 2007.
[26] J.-M. Zhang, L. P. Chua, D. N. Ghista, S. C. M. Yu, and Y. S.Tan, “Numerical investigation and identification of susceptiblesites of atherosclerotic lesion formation in a complete coronaryartery bypass model,” Medical and Biological Engineering andComputing, vol. 46, no. 7, pp. 689–699, 2008.
[27] Y. Zhou, G. S. Kassab, and S. Molloi, “On the design of thecoronary arterial tree: a generalization of Murray’s law,” Physicsin Medicine and Biology, vol. 44, no. 12, pp. 2929–2945, 1999.
[28] W. Aarnoudse, W. F. Fearon, G. Manoharan et al., “Epicardialstenosis severity does not affect minimal microcirculatoryresistance,” Circulation, vol. 110, no. 15, pp. 2137–2142, 2004.
[29] K. L. Gould, R. Kirkeeide, and N. P. Johnson, “Coronary branchsteal experimental validation and clinical implications of inter-acting stenosis in branching coronary arteries,” Circulation:Cardiovascular Imaging, vol. 3, no. 6, pp. 701–709, 2010.
[30] O. F. Donati, P. Stolzmann, L. Desbiolles et al., “Coronary arterydisease: which degree of coronary artery stenosis is indicativeof ischemia?” European Journal of Radiology, vol. 80, no. 1, pp.120–126, 2011.
[31] S. Jost, J. W. Deckers, P. Nikutta et al., “Progression of coronaryartery disease is dependent on anatomic location and diameter,”Journal of the American College of Cardiology, vol. 21, no. 6, pp.1339–1346, 1993.
[32] J. M. Zhang, T. Luo, Y. Huo et al., “Area stenosis associated withnon-invasive fractional flow reserve obtained from CoronaryCT Images,” in Proceedings of the 35th Annual InternationalConference of the IEEE Engineering in Medicine and BiologySociety (EMBC ’13), pp. 3865–3868, 2013.
[33] L. Zhong, B. Su, J. M. Zhang et al., “Effects of stenosis on theporcine left anterior descending arterial tree,” in Proceedings ofthe 35th Annual International Conference of the IEEE Engineer-ing in Medicine and Biology Society (EMBC ’13), pp. 3869–3872,2013.
[34] J. E. Davies, Z. I. Whinnett, D. P. Francis et al., “Evidence ofa dominant backward-propagating “suction” wave responsiblefor diastolic coronary filling in humans, attenuated in leftventricular hypertrophy,” Circulation, vol. 113, no. 14, pp. 1768–1778, 2006.
[35] S. B. Bender, M. J. Van Houwelingen, D. Merkus, D. J. Duncker,and M. Harold Laughlin, “Quantitative analysis of exercise-induced enhancement of early- and late-systolic retrogradecoronary blood flow,” Journal of Applied Physiology, vol. 108, no.3, pp. 507–514, 2010.
[36] D. Zeng, E. Boutsianis, M. Ammann, K. Boomsma, S. Wilder-muth, and D. Poulikakos, “A study on the compliance of a right
coronary artery and its impact on wall shear stress,” Journal ofBiomechanical Engineering, vol. 130, no. 4, Article ID 041014, 11pages, 2008.
[37] J. Peacock, T. Jones, C. Tock, and R. Lutz, “The onset of tur-bulence in physiological pulsatile flow in a straight tube,”Experiments in Fluids, vol. 24, no. 1, pp. 1–9, 1998.

Submit your manuscripts athttp://www.hindawi.com
Hindawi Publishing Corporationhttp://www.hindawi.com Volume 2014
Anatomy Research International
PeptidesInternational Journal of
Hindawi Publishing Corporationhttp://www.hindawi.com Volume 2014
Hindawi Publishing Corporation http://www.hindawi.com
International Journal of
Volume 2014
Zoology
Hindawi Publishing Corporationhttp://www.hindawi.com Volume 2014
Molecular Biology International
GenomicsInternational Journal of
Hindawi Publishing Corporationhttp://www.hindawi.com Volume 2014
The Scientific World JournalHindawi Publishing Corporation http://www.hindawi.com Volume 2014
Hindawi Publishing Corporationhttp://www.hindawi.com Volume 2014
BioinformaticsAdvances in
Marine BiologyJournal of
Hindawi Publishing Corporationhttp://www.hindawi.com Volume 2014
Hindawi Publishing Corporationhttp://www.hindawi.com Volume 2014
Signal TransductionJournal of
Hindawi Publishing Corporationhttp://www.hindawi.com Volume 2014
BioMed Research International
Evolutionary BiologyInternational Journal of
Hindawi Publishing Corporationhttp://www.hindawi.com Volume 2014
Hindawi Publishing Corporationhttp://www.hindawi.com Volume 2014
Biochemistry Research International
ArchaeaHindawi Publishing Corporationhttp://www.hindawi.com Volume 2014
Hindawi Publishing Corporationhttp://www.hindawi.com Volume 2014
Genetics Research International
Hindawi Publishing Corporationhttp://www.hindawi.com Volume 2014
Advances in
Virolog y
Hindawi Publishing Corporationhttp://www.hindawi.com
Nucleic AcidsJournal of
Volume 2014
Stem CellsInternational
Hindawi Publishing Corporationhttp://www.hindawi.com Volume 2014
Hindawi Publishing Corporationhttp://www.hindawi.com Volume 2014
Enzyme Research
Hindawi Publishing Corporationhttp://www.hindawi.com Volume 2014
International Journal of
Microbiology