research article establishing land suitability...
TRANSCRIPT

Research ArticleEstablishing Land Suitability Criteria for Cashew(Anacardium occidentale L.) in Indonesia
Widiatmaka,1 Atang Sutandi,1 Anas Iswandi,1 Usman Daras,2
Muhammad Hikmat,3 and Ari Krisnohadi4
1 Department of Soil Science and Land Resources, Bogor Agricultural University, Campus of Dramaga, Bogor 16680, Indonesia2 Indonesian Agency for Agricultural Research and Development (IAARD), Ministry of Agriculture, Jl. Tentara Pelajar No. 3,Bogor 16111, Indonesia
3 Indonesian Center for Agricultural Land Resources Research and Development (ICALRRD), Ministry of Agriculture,Jl. Tentara Pelajar No. 12, Bogor 16114, Indonesia
4University of Tanjungpura, Pontianak 78124, Indonesia
Correspondence should be addressed to Widiatmaka; [email protected]
Received 19 February 2014; Revised 27 May 2014; Accepted 29 May 2014; Published 22 July 2014
Academic Editor: Davey Jones
Copyright © 2014 Widiatmaka et al. This is an open access article distributed under the Creative Commons Attribution License,which permits unrestricted use, distribution, and reproduction in any medium, provided the original work is properly cited.
Commodity development requires site selection which should be established prior to large scale development. The land suitabilitycriteria for cashew are not presently available. The relationship between the biophysical aspects, especially land and soil withcommodity productivity, is also not known in depth. The objective of this study is to establish the criteria of land suitability forcashew in Indonesia, based on its production and land characteristics. Cashew plantations in 5 provinces were sampled.The data ofproduction per tree per year were obtained from farmers, while the soil was sampled and analyzed in the laboratory. Age-adjustedcashew production was used as the yield response and plotted against land characteristics. Boundary lines resulting from the scatterof points were described; these lines produced the limits of land suitability criteria. The criteria were established using a projectionof the intersection between the boundary line and yield interval. The criteria were also built in accordance with the productivityindex of FAO for the internal boundary inside the S (suitable) class and by calculating the break-event point production for theboundary between S (suitable) and N (nonsuitable) order. The main result of this research is land suitability criteria for cashew.
1. Introduction
Thecashew (Anacardium occidentale L.) is a prospective com-modity in Indonesia, and its cultivation issues are relevant tothe country’s development both as an export commodity andin regard to environmental conservation. At the beginning ofIndonesia’s agricultural development, planting of the cashewwas implemented for greening programs and reforestation.With the increase of prices, issues of cashew developmentbegan to shift from land conservation to more economicconsiderations. Today, Indonesia is the fifth largest cashewproducer in the world after Nigeria, India, Cote d’Ivoire, andVietnam. Indonesia’s total cashew production in 2011 was114,789 tons, originating from 575,841Ha of plantations area[1].
One of the problems encountered in the developmentof cashew in Indonesia is the low productivity. AverageIndonesian cashew productivity in 2011 was 367 kg⋅Ha−1 [1,2]. In comparison, the production in Keralla, India, reached1,180 kg⋅Ha−1 [3], while Vietnam produced 672 kg⋅Ha−1 [4],and Nigeria produced 1,970 kg⋅Ha−1 [5]. Compared to thelong-term target production of this commodity in Indonesiaof >1,000 kg nuts⋅Ha−1⋅year−1 [6], actual average productionis very low. One of the efforts to increase productivity isplanting the commodity only on suitable land.
Land suitability analysis is a method generally used insite selection. The proper site selection should be establishedbefore any large scale development. Several methods havebeen developed in land suitability analysis, either qualitativeor quantitative [7, 8]. Among the various systems used in
Hindawi Publishing CorporationApplied and Environmental Soil ScienceVolume 2014, Article ID 743194, 14 pageshttp://dx.doi.org/10.1155/2014/743194
2 Applied and Environmental Soil Science
qualitative land evaluation, the maximum limitation systemis the most common one used in Indonesia. In this system,the degree of land use limitations is imposed by land charac-teristics on the basis of permanent properties. This methodexpresses the land suitability class qualitatively for any givenarea. A simple table of criteria is used, by matching landrequirements with land characteristics [7]. In other words,it is necessary to have criteria to assess the suitability ofland utilization. As of yet, quantitative criteria for cashew siteselection are not available. Inmany land evaluation referencesused in Indonesia [9–12], the criteria for this commodity havenot been included. Development of accurate criteria is thusnecessary.
Appropriate criteria should reflect the production, as theuse of inappropriate criteriamay cause errors in the diagnosisof land being evaluated. The use of inappropriate criteriaunder certain circumstances assessment often does not reflectthe factual growth in the field as well as the production. Insome cases, assessment of suitability results in an N (notsuitable) class, although the commodity growth in the fieldwas good. In some other cases, the assessment of suitabilitythat produces an S1 (highly suitable) class or an S2 (suitable)class was confronted by the fact that the plants do not growas well as their suitability classes indicate. This has beenfrequently reported in much research [13]. Hence, criteriaoutlining plant growth should be developed on the basis ofcrop production.
In the maximum limitation method, the evaluationsassess land qualities and land characteristics as compared toland use requirements, regardless of whether there is an inter-action between two or more land qualities or characteristics.If the correlation between land quality and land characteristicis built empirically, it will be costly and time-consuming to anexcessive degree.Therefore, it is necessary to look for quicker,cheaper, and more precise ways to develop criteria.
The objective of this study is to delineate the relationshipbetween cashew production and land characteristics to estab-lish land suitability criteria for cashew plantation.The criteriadeveloped should be reflective of plant productivity.
2. Materials and Methods
2.1. Logical Framework. Many studies have been conductedto reveal the relationship between plant growth and pro-duction with land factors [14, 15]. If a specific relationshipbetween growth factors and plant response exists, then max-imum growth and production can be obtained by optimizingsuch growth factors. The relationship is often tentativelyestablished with the goal of defining diagnostic models [16].Unfortunately, the relationship is often established undercontrolled conditions, in which only one variable is varied,while all other factors remain stable. As a consequence,the relationship is valid only for specific conditions underwhich the particular experiment was conducted. In fact, theinfluence of growth factors changes when environment andconditions are changed due to other factors. Thus, resultedmodels cannot be generalized.
108∘E 112∘E 116∘E 120∘E 124∘E
108∘E 112∘E 116∘E 120∘E 124∘E
6∘ S
10∘ S
6∘ S
10∘ S
Regency of sampling locations
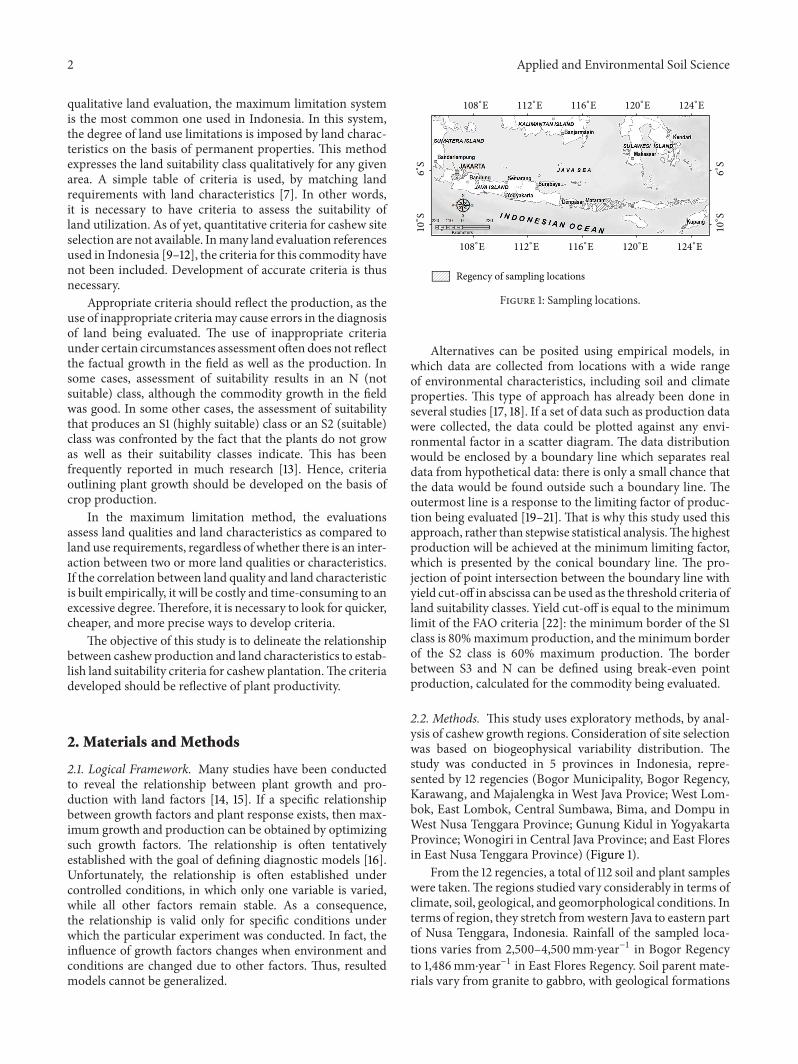
Figure 1: Sampling locations.
Alternatives can be posited using empirical models, inwhich data are collected from locations with a wide rangeof environmental characteristics, including soil and climateproperties. This type of approach has already been done inseveral studies [17, 18]. If a set of data such as production datawere collected, the data could be plotted against any envi-ronmental factor in a scatter diagram. The data distributionwould be enclosed by a boundary line which separates realdata from hypothetical data: there is only a small chance thatthe data would be found outside such a boundary line. Theoutermost line is a response to the limiting factor of produc-tion being evaluated [19–21]. That is why this study used thisapproach, rather than stepwise statistical analysis.Thehighestproduction will be achieved at the minimum limiting factor,which is presented by the conical boundary line. The pro-jection of point intersection between the boundary line withyield cut-off in abscissa can be used as the threshold criteria ofland suitability classes. Yield cut-off is equal to the minimumlimit of the FAO criteria [22]: the minimum border of the S1class is 80%maximum production, and theminimum borderof the S2 class is 60% maximum production. The borderbetween S3 and N can be defined using break-even pointproduction, calculated for the commodity being evaluated.
2.2. Methods. This study uses exploratory methods, by anal-ysis of cashew growth regions. Consideration of site selectionwas based on biogeophysical variability distribution. Thestudy was conducted in 5 provinces in Indonesia, repre-sented by 12 regencies (Bogor Municipality, Bogor Regency,Karawang, and Majalengka in West Java Provice; West Lom-bok, East Lombok, Central Sumbawa, Bima, and Dompu inWest Nusa Tenggara Province; Gunung Kidul in YogyakartaProvince; Wonogiri in Central Java Province; and East Floresin East Nusa Tenggara Province) (Figure 1).
From the 12 regencies, a total of 112 soil and plant sampleswere taken.The regions studied vary considerably in terms ofclimate, soil, geological, and geomorphological conditions. Interms of region, they stretch fromwestern Java to eastern partof Nusa Tenggara, Indonesia. Rainfall of the sampled loca-tions varies from 2,500–4,500mm⋅year−1 in Bogor Regencyto 1,486mm⋅year−1 in East Flores Regency. Soil parent mate-rials vary from granite to gabbro, with geological formations

Applied and Environmental Soil Science 3
varying from alluvium quarter in Karawang, West Java tosedimentary karstic material in Gunung Kidul, Yogyakarta.The provisional criteria built using data from 2 provinceshave been presented previously [23]. The present criteria arethe final criteria, developed from more diverse regions and awider range of data.
In such a diverse environment, field surveys were done toobtain soil properties and crop productivity. Data were takenon land characteristics and plant growth, demonstrating adiversity of land characteristics and production levels. Thefield study was done from 2007 to 2011: from 2007 to 2009for 9 regencies and from 2010 to 2011 for the 3 remainingregencies.
Soil samples (0–30 cm depth) were taken for laboratoryanalysis. All laboratory analysis was conducted in thelaboratory of the Department of Soil Science and LandResources, at Bogor Agricultural University, Indonesia.The soil laboratory analysis method followed the methoddescribed by [24]. The parameters analyzed were soiltexture (pipette method), cation exchange capacity (CEC)(NH4
OAc method), exchangeable Na, K, Ca, Mg (NH4
OAc,atomic absorption spectrophotometry), soil pH (pH-meter,1 : 1), organic carbon content (organic-C) (Walkley-Blackcombustion method), total nitrogen (total-N) (Kjeldahlmethod), available phosphorous (available-P) (Bray-1method), and exchangeable potassium (exchangeable-K)(NH4
OAc method). The land characteristics observed inthe field included drainage, effective soil depth, surfacerocks, and slope. Climatic characteristics were obtained frommeteorological stations in each regency.
Crop productivity was measured by units of weights ofspindle nuts per tree per year. The data of production pertree per year were obtained from farmers who were asked tomeasure, after trees in each sampling point were identifiedand selected.
In the field surveys, plant ageswere different for each sam-ple. Therefore, individual plant production data needs to beadjusted according to plant age. An age-adjusted productionmethod can be done by using the following equation [25]:
𝑌𝑡 =
Υ + (𝑌𝑖 −
𝑌) , (1)
where 𝑌𝑡 = age-adjusted production, 𝑌𝑖 = actual productionbased on observations, Υ = general mean, and 𝑌 = predictedproduction depending on age from the model, where themodel relation between yield and age 𝑌 = 𝑓(𝑡), where 𝑡 =time.
Age-adjusted productionwas then plottedwith land char-acteristics to construct a scatter diagram and scatter plotof pertinent boundary lines. Boundary lines and equationswere constructed from the outermost points so that the lineswrap around the data. For each land characteristic, at least5 outliers were taken. The boundary equation model wasselected according to the most suitable data, based on thehighest determination coefficient (𝑅2). The yield cut-off asa minimum value for the S1 class was 80% of maximumpossible production, while the minimum value of the S2 wasset at 60% and S3 class was limited by the level of productionat the break-even point of cashew production. In previous
research [26], the break-even point cashew production levelwas 24% of maximum production. Projection of the inter-section between the boundary line and yield cut-off becomescriteria of land suitability in the relevant class.
We used the 5 as the number of outermost points withthe following considerations: (i) to minimize the numberof points above the boundary limits and (ii) to maximizethe likelihood of developing statistically significant models.The choice of a number of boundary points to estimate aboundary line in one scatter diagram represents a compro-mise between the two targets of the big group sizes and ahigh number of boundary points [27]. For the same reason,other researches [28] used 10 points with a sample size of 252,which represented 3.97% of the samples. In our case, we used5 points in a sample size of 92 or 5.43% of the samples.
A validity test was performed for the accuracy of theresultant land suitability criteria.The validity test was done byusing a set of data not used in the preparation of the model,through the assessment of land suitability using the principleof maximum limiting factor, in which the final value of theland suitability classification was determined by the value ofthe lowest land characteristics. In this research, there were 92samples used for model development and 20 samples wereused for the validity test.The validation samples were selectedby stratified random sampling by taken 4 samples each from5 provinces.
3. Results and Discussion
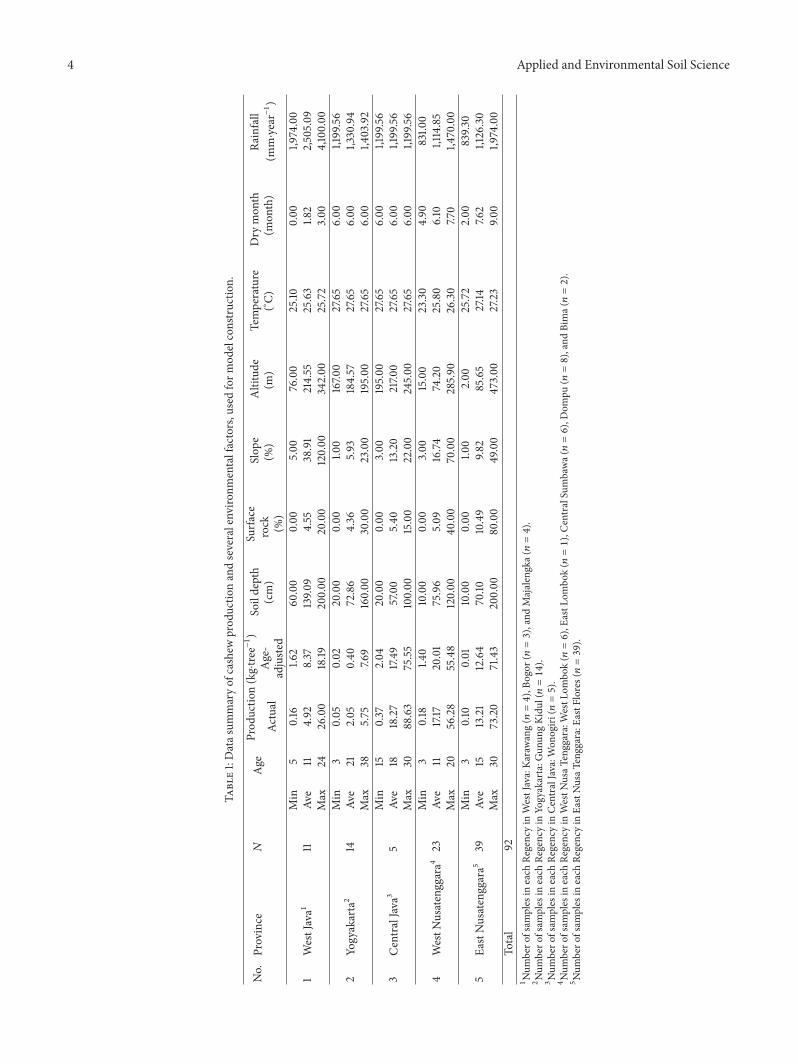
A summary of measurement results is presented in Table 1.Relationships between cashew production and tree age arepresented in Figure 2. Production was correlated with age,although the determination coefficient (𝑅2) was quite small(Figure 2(a)). The low 𝑅2 was due to environmental factors.The plant growth varies not only due to the age of the plant,but also to other environmental factors. After calibration,age has no effect (Figure 2(b)) and thus, for subsequentanalysis, confrontation was done between the data of landcharacteristics with age-adjusted production.
The distribution of age-adjusted production data showsthat themaximumproduction reaches 90.24 kg⋅tree−1⋅year−1.Based on this value, an interval of age-adjusted productionfor each land suitability class can be obtained, namely,(1) production in the S1 class at >72.19 kg⋅tree−1⋅year−1,(2) production in the S2 class between 54.15 and72.19 kg⋅tree−1⋅year−1, (3) production in the S3 class between21.30 and 54.15 kg⋅tree−1⋅year−1, and (4) production in the Nclass at <21.30 kg⋅tree−1⋅year−1.
Land elevation can be used as an indicator of air or soiltemperature. The higher the elevation is, the lower the airtemperature is.The relationship between air temperature andelevation can be formulated using the Braak formula [29].According to this reference, Indonesia’s lowland temperaturesvary between 25–27∘C, and the formula used is 𝑇 = 26∘C−(0.01 × elevation in meters × 0.6∘C).
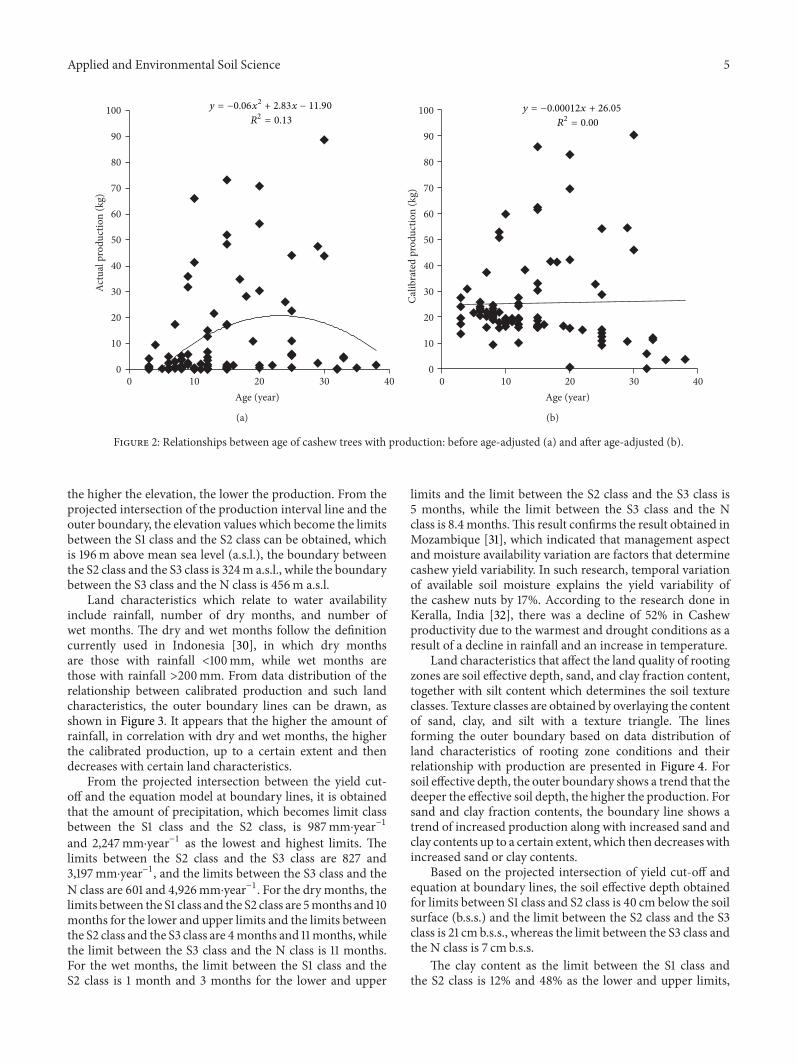
Outer boundary lines are constructed based on the datadistribution relationships of age-adjusted production withelevation (Figure 3). The pattern of lines showed a trend that
4 Applied and Environmental Soil Science
Table1:Datas
ummaryof
cashew
prod
uctio
nandseveralenviro
nmentalfactors,usedform
odelconstructio
n.
No.
Province
𝑁Age
Prod
uctio
n(kg⋅tre
e−1
)Soildepth
(cm)
Surfa
cerock (%)
Slop
e(%
)Altitude
(m)
Temperature
(∘ C)
Dry
mon
th(m
onth)
Rainfall
(mm⋅year−1
)Ac
tual
Age-
adjuste
d
1WestJava1
11Min
50.16
1.62
60.00
0.00
5.00
76.00
25.10
0.00
1,974.00
Ave
114.92
8.37
139.0
94.55
38.91
214.55
25.63
1.82
2,505.09
Max
2426.00
18.19
200.00
20.00
120.00
342.00
25.72
3.00
4,100.00
2Yo
gyakarta2
14Min
30.05
0.02
20.00
0.00
1.00
167.0
027.65
6.00
1,199.56
Ave
212.05
0.40
72.86
4.36
5.93
184.57
27.65
6.00
1,330.94
Max
385.75
7.69
160.00
30.00
23.00
195.00
27.65
6.00
1,403.92
3CentralJava3
5Min
150.37
2.04
20.00
0.00
3.00
195.00
27.65
6.00
1,199.56
Ave
1818.27
17.49
57.00
5.40
13.20
217.0
027.65
6.00
1,199.56
Max
3088.63
75.55
100.00
15.00
22.00
245.00
27.65
6.00
1,199.56
4WestN
usatenggara4
23Min
30.18
1.40
10.00
0.00
3.00
15.00
23.30
4.90
831.0
0Av
e11
17.17
20.01
75.96
5.09
16.74
74.20
25.80
6.10
1,114.85
Max
2056.28
55.48
120.00
40.00
70.00
285.90
26.30
7.70
1,470.00
5Ea
stNusatenggara5
39Min
30.10
0.01
10.00
0.00
1.00
2.00
25.72
2.00
839.3
0Av
e15
13.21
12.64
70.10
10.49
9.82
85.65
27.14
7.62
1,126.30
Max
3073.20
71.43
200.00
80.00
49.00
473.00
27.23
9.00
1,974.00
Total
921
Num
bero
fsam
ples
ineach
Regencyin
WestJava:Ka
rawang(𝑛=4),Bo
gor(𝑛=3),andMajalengka(𝑛=4).
2
Num
bero
fsam
ples
ineach
Regencyin
Yogyakarta:G
unun
gKidu
l(𝑛=14).
3
Num
bero
fsam
ples
ineach
Regencyin
CentralJava:W
onogiri
(𝑛=5).
4
Num
bero
fsam
ples
ineach
Regencyin
WestN
usaT
enggara:WestL
ombo
k(𝑛=6),Ea
stLo
mbo
k(𝑛=1),CentralSumbawa(𝑛=6),Dom
pu(𝑛=8),andBima(𝑛=2).
5
Num
bero
fsam
ples
ineach
Regencyin
EastNusaT
enggara:Ea
stFlores
(𝑛=39).
Applied and Environmental Soil Science 5
0
10
20
30
40
50
60
70
80
90
100
0 10 20 30 40
Actu
al p
rodu
ctio
n (k
g)
Age (year)
y = −0.06x2 + 2.83x − 11.90
R2 = 0.13
(a)
0
10
20
30
40
50
60
70
80
90
100
0 10 20 30 40
Calib
rate
d pr
oduc
tion
(kg)
Age (year)
y = −0.00012x + 26.05
R2 = 0.00
(b)
Figure 2: Relationships between age of cashew trees with production: before age-adjusted (a) and after age-adjusted (b).
the higher the elevation, the lower the production. From theprojected intersection of the production interval line and theouter boundary, the elevation values which become the limitsbetween the S1 class and the S2 class can be obtained, whichis 196m above mean sea level (a.s.l.), the boundary betweenthe S2 class and the S3 class is 324m a.s.l., while the boundarybetween the S3 class and the N class is 456m a.s.l.
Land characteristics which relate to water availabilityinclude rainfall, number of dry months, and number ofwet months. The dry and wet months follow the definitioncurrently used in Indonesia [30], in which dry monthsare those with rainfall <100mm, while wet months arethose with rainfall >200mm. From data distribution of therelationship between calibrated production and such landcharacteristics, the outer boundary lines can be drawn, asshown in Figure 3. It appears that the higher the amount ofrainfall, in correlation with dry and wet months, the higherthe calibrated production, up to a certain extent and thendecreases with certain land characteristics.
From the projected intersection between the yield cut-off and the equation model at boundary lines, it is obtainedthat the amount of precipitation, which becomes limit classbetween the S1 class and the S2 class, is 987mm⋅year−1and 2,247mm⋅year−1 as the lowest and highest limits. Thelimits between the S2 class and the S3 class are 827 and3,197mm⋅year−1, and the limits between the S3 class and theN class are 601 and 4,926mm⋅year−1. For the dry months, thelimits between the S1 class and the S2 class are 5months and 10months for the lower and upper limits and the limits betweenthe S2 class and the S3 class are 4months and 11months, whilethe limit between the S3 class and the N class is 11 months.For the wet months, the limit between the S1 class and theS2 class is 1 month and 3 months for the lower and upper
limits and the limit between the S2 class and the S3 class is5 months, while the limit between the S3 class and the Nclass is 8.4 months.This result confirms the result obtained inMozambique [31], which indicated that management aspectand moisture availability variation are factors that determinecashew yield variability. In such research, temporal variationof available soil moisture explains the yield variability ofthe cashew nuts by 17%. According to the research done inKeralla, India [32], there was a decline of 52% in Cashewproductivity due to the warmest and drought conditions as aresult of a decline in rainfall and an increase in temperature.
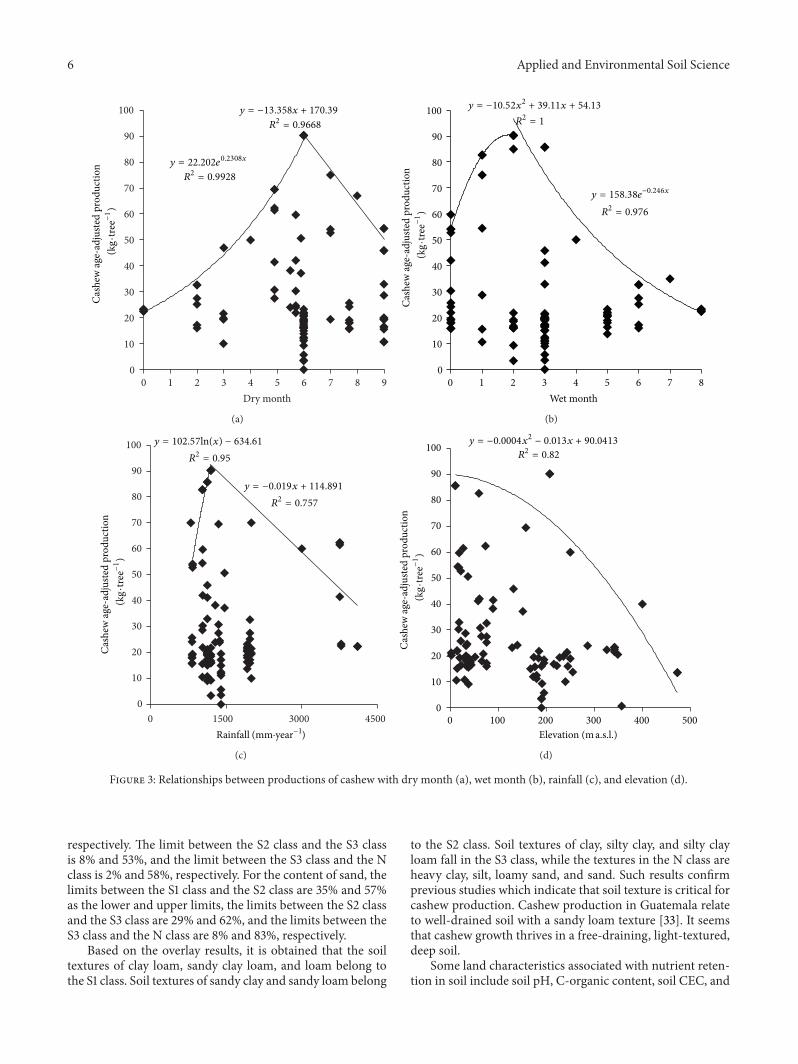
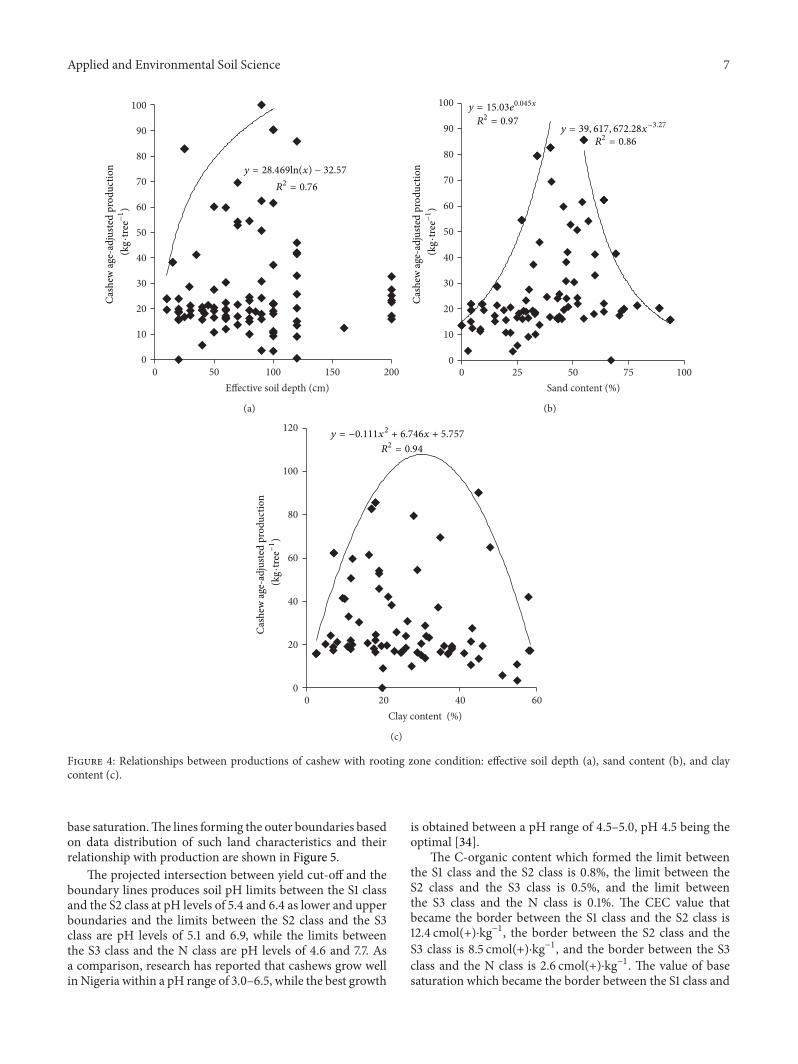
Land characteristics that affect the land quality of rootingzones are soil effective depth, sand, and clay fraction content,together with silt content which determines the soil textureclasses. Texture classes are obtained by overlaying the contentof sand, clay, and silt with a texture triangle. The linesforming the outer boundary based on data distribution ofland characteristics of rooting zone conditions and theirrelationship with production are presented in Figure 4. Forsoil effective depth, the outer boundary shows a trend that thedeeper the effective soil depth, the higher the production. Forsand and clay fraction contents, the boundary line shows atrend of increased production along with increased sand andclay contents up to a certain extent, which then decreaseswithincreased sand or clay contents.
Based on the projected intersection of yield cut-off andequation at boundary lines, the soil effective depth obtainedfor limits between S1 class and S2 class is 40 cm below the soilsurface (b.s.s.) and the limit between the S2 class and the S3class is 21 cmb.s.s., whereas the limit between the S3 class andthe N class is 7 cmb.s.s.
The clay content as the limit between the S1 class andthe S2 class is 12% and 48% as the lower and upper limits,
6 Applied and Environmental Soil Science
0
10
20
30
40
50
60
70
80
90
100
0 1 2 3 4 5 6 7 8 9Dry month
y = −13.358x + 170.39
R2 = 0.9668
y = 22.202e0.2308x
R2 = 0.9928
Cash
ew ag
e-ad
juste
d pr
oduc
tion
(kg·
tree−
1)
(a)
0
10
20
30
40
50
60
70
80
90
100
0 1 2 3 4 5 6 7 8Wet month
Cash
ew ag
e-ad
juste
d pr
oduc
tion
(kg·
tree−
1)
y = −10.52x2 + 39.11x + 54.13
R2 = 1
y = 158.38e−0.246x
R2 = 0.976
(b)
0
10
20
30
40
50
60
70
80
90
100
0 1500 3000 4500
Cash
ew ag
e-ad
juste
d pr
oduc
tion
(kg·
tree−
1)
y = 102.57ln(x) − 634.61
R2 = 0.95
y = −0.019x + 114.891
R2 = 0.757
Rainfall (mm·year−1)
(c)
0
10
20
30
40
50
60
70
80
90
100
0 100 200 300 400 500
Cash
ew ag
e-ad
juste
d pr
oduc
tion
(kg·
tree−
1)
y = −0.0004x2 − 0.013x + 90.0413
R2 = 0.82
Elevation (m a.s.l.)
(d)
Figure 3: Relationships between productions of cashew with dry month (a), wet month (b), rainfall (c), and elevation (d).
respectively. The limit between the S2 class and the S3 classis 8% and 53%, and the limit between the S3 class and the Nclass is 2% and 58%, respectively. For the content of sand, thelimits between the S1 class and the S2 class are 35% and 57%as the lower and upper limits, the limits between the S2 classand the S3 class are 29% and 62%, and the limits between theS3 class and the N class are 8% and 83%, respectively.
Based on the overlay results, it is obtained that the soiltextures of clay loam, sandy clay loam, and loam belong tothe S1 class. Soil textures of sandy clay and sandy loam belong
to the S2 class. Soil textures of clay, silty clay, and silty clayloam fall in the S3 class, while the textures in the N class areheavy clay, silt, loamy sand, and sand. Such results confirmprevious studies which indicate that soil texture is critical forcashew production. Cashew production in Guatemala relateto well-drained soil with a sandy loam texture [33]. It seemsthat cashew growth thrives in a free-draining, light-textured,deep soil.
Some land characteristics associated with nutrient reten-tion in soil include soil pH, C-organic content, soil CEC, and
Applied and Environmental Soil Science 7
0
10
20
30
40
50
60
70
80
90
100
0 50 100 150 200Effective soil depth (cm)
Cash
ew ag
e-ad
juste
d pr
oduc
tion
(kg·
tree−
1)
y = 28.469ln(x) − 32.57
R2 = 0.76
(a)
0
10
20
30
40
50
60
70
80
90
100
0 25 50 75 100Sand content (%)
Cash
ew ag
e-ad
juste
d pr
oduc
tion
(kg·
tree−
1)
y = 15.03e0.045x
R2 = 0.97y = 39, 617, 672.28x−3.27
R2 = 0.86
(b)
0
20
40
60
80
100
120
0 20 40 60Clay content (%)
Cash
ew ag
e-ad
juste
d pr
oduc
tion
(kg·
tree−
1)
y = −0.111x2 + 6.746x + 5.757
R2 = 0.94
(c)
Figure 4: Relationships between productions of cashew with rooting zone condition: effective soil depth (a), sand content (b), and claycontent (c).
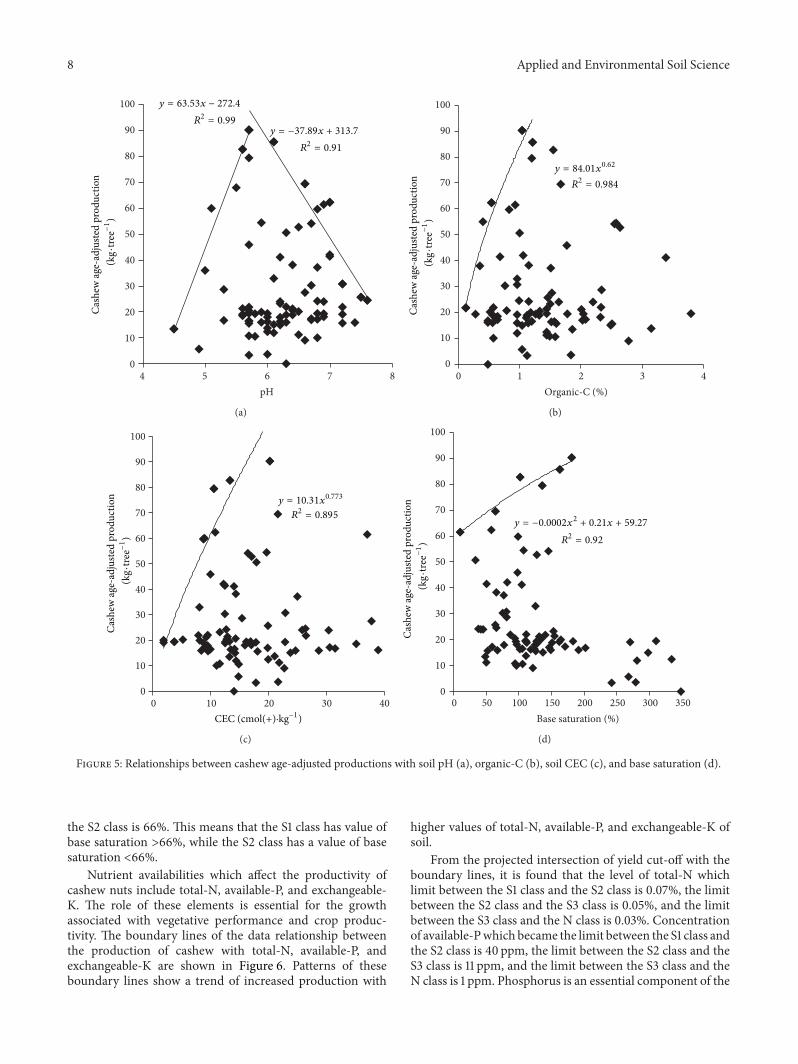
base saturation.The lines forming the outer boundaries basedon data distribution of such land characteristics and theirrelationship with production are shown in Figure 5.
The projected intersection between yield cut-off and theboundary lines produces soil pH limits between the S1 classand the S2 class at pH levels of 5.4 and 6.4 as lower and upperboundaries and the limits between the S2 class and the S3class are pH levels of 5.1 and 6.9, while the limits betweenthe S3 class and the N class are pH levels of 4.6 and 7.7. Asa comparison, research has reported that cashews grow wellin Nigeria within a pH range of 3.0–6.5, while the best growth
is obtained between a pH range of 4.5–5.0, pH 4.5 being theoptimal [34].
The C-organic content which formed the limit betweenthe S1 class and the S2 class is 0.8%, the limit between theS2 class and the S3 class is 0.5%, and the limit betweenthe S3 class and the N class is 0.1%. The CEC value thatbecame the border between the S1 class and the S2 class is12.4 cmol(+)⋅kg−1, the border between the S2 class and theS3 class is 8.5 cmol(+)⋅kg−1, and the border between the S3class and the N class is 2.6 cmol(+)⋅kg−1. The value of basesaturation which became the border between the S1 class and
8 Applied and Environmental Soil Science
0
10
20
30
40
50
60
70
80
90
100
4 5 6 7 8pH
Cash
ew ag
e-ad
juste
d pr
oduc
tion
(kg·
tree−
1)
y = 63.53x − 272.4
R2 = 0.99y = −37.89x + 313.7
R2 = 0.91
(a)
0
10
20
30
40
50
60
70
80
90
100
0 1 2 3 4Organic-C (%)
Cash
ew ag
e-ad
juste
d pr
oduc
tion
(kg·
tree−
1)
R2 = 0.984
y = 84.01x0.62
(b)
0
10
20
30
40
50
60
70
80
90
100
0 10 20 30 40
Cash
ew ag
e-ad
juste
d pr
oduc
tion
(kg·
tree−
1)
R2 = 0.895
CEC (cmol(+)·kg−1)
y = 10.31x0.773
(c)
0
10
20
30
40
50
60
70
80
90
100
0 50 100 150 200 250 300 350Base saturation (%)
Cash
ew ag
e-ad
juste
d pr
oduc
tion
(kg·
tree−
1)
y = −0.0002x2 + 0.21x + 59.27
R2 = 0.92
(d)
Figure 5: Relationships between cashew age-adjusted productions with soil pH (a), organic-C (b), soil CEC (c), and base saturation (d).
the S2 class is 66%. This means that the S1 class has value ofbase saturation >66%, while the S2 class has a value of basesaturation <66%.
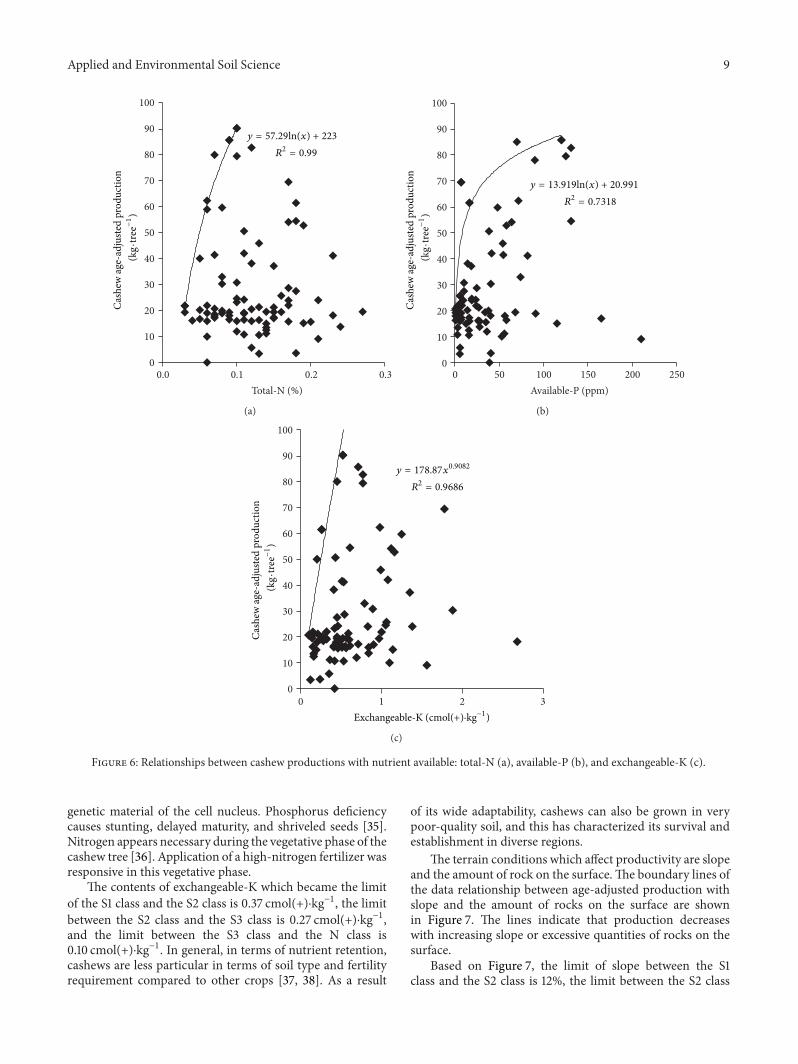
Nutrient availabilities which affect the productivity ofcashew nuts include total-N, available-P, and exchangeable-K. The role of these elements is essential for the growthassociated with vegetative performance and crop produc-tivity. The boundary lines of the data relationship betweenthe production of cashew with total-N, available-P, andexchangeable-K are shown in Figure 6. Patterns of theseboundary lines show a trend of increased production with
higher values of total-N, available-P, and exchangeable-K ofsoil.
From the projected intersection of yield cut-off with theboundary lines, it is found that the level of total-N whichlimit between the S1 class and the S2 class is 0.07%, the limitbetween the S2 class and the S3 class is 0.05%, and the limitbetween the S3 class and the N class is 0.03%. Concentrationof available-Pwhich became the limit between the S1 class andthe S2 class is 40 ppm, the limit between the S2 class and theS3 class is 11 ppm, and the limit between the S3 class and theN class is 1 ppm. Phosphorus is an essential component of the
Applied and Environmental Soil Science 9
0
10
20
30
40
50
60
70
80
90
100
0.0 0.1 0.2 0.3Total-N (%)
Cash
ew ag
e-ad
juste
d pr
oduc
tion
(kg·
tree−
1)
y = 57.29ln(x) + 223
R2 = 0.99
(a)
0
10
20
30
40
50
60
70
80
90
100
0 50 100 150 200 250Available-P (ppm)
Cash
ew ag
e-ad
juste
d pr
oduc
tion
(kg·
tree−
1)
y = 13.919ln(x) + 20.991
R2 = 0.7318
(b)
0
10
20
30
40
50
60
70
80
90
100
0 1 2 3
Cash
ew ag
e-ad
juste
d pr
oduc
tion
(kg·
tree−
1)
y = 178.87x0.9082
R2 = 0.9686
Exchangeable-K (cmol(+)·kg−1)
(c)
Figure 6: Relationships between cashew productions with nutrient available: total-N (a), available-P (b), and exchangeable-K (c).
genetic material of the cell nucleus. Phosphorus deficiencycauses stunting, delayed maturity, and shriveled seeds [35].Nitrogen appears necessary during the vegetative phase of thecashew tree [36]. Application of a high-nitrogen fertilizer wasresponsive in this vegetative phase.
The contents of exchangeable-K which became the limitof the S1 class and the S2 class is 0.37 cmol(+)⋅kg−1, the limitbetween the S2 class and the S3 class is 0.27 cmol(+)⋅kg−1,and the limit between the S3 class and the N class is0.10 cmol(+)⋅kg−1. In general, in terms of nutrient retention,cashews are less particular in terms of soil type and fertilityrequirement compared to other crops [37, 38]. As a result
of its wide adaptability, cashews can also be grown in verypoor-quality soil, and this has characterized its survival andestablishment in diverse regions.
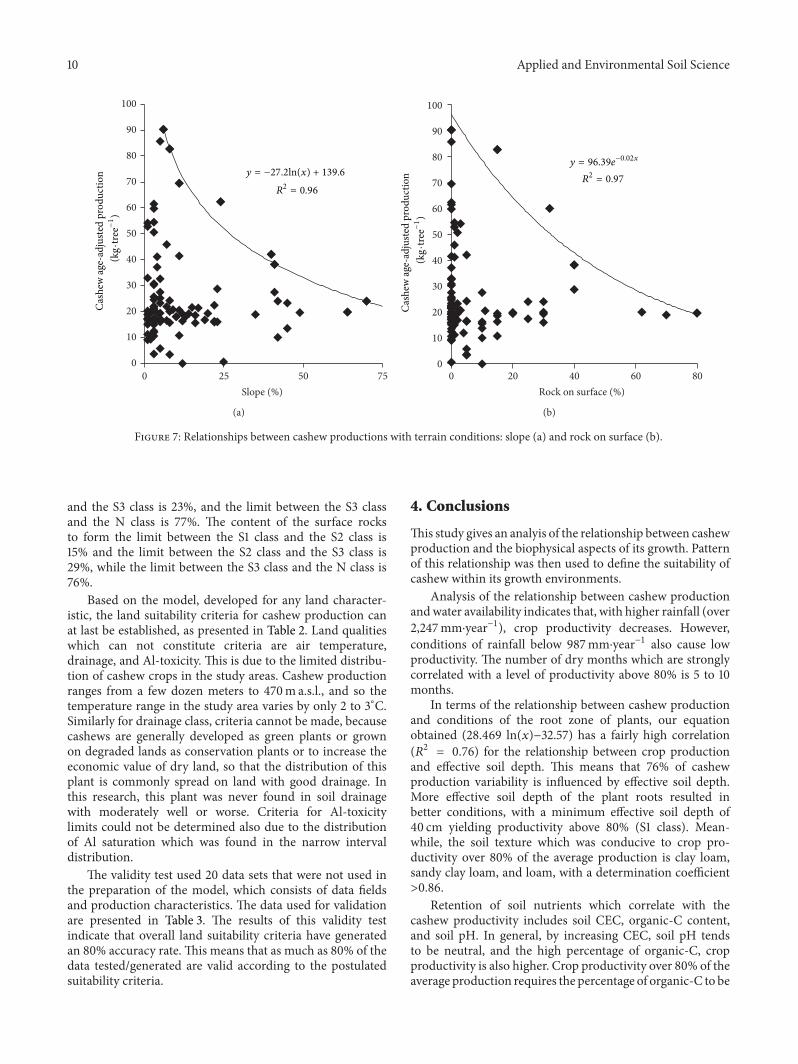
The terrain conditions which affect productivity are slopeand the amount of rock on the surface.The boundary lines ofthe data relationship between age-adjusted production withslope and the amount of rocks on the surface are shownin Figure 7. The lines indicate that production decreaseswith increasing slope or excessive quantities of rocks on thesurface.
Based on Figure 7, the limit of slope between the S1class and the S2 class is 12%, the limit between the S2 class
10 Applied and Environmental Soil Science
0
10
20
30
40
50
60
70
80
90
100
0 25 50 75Slope (%)
Cash
ew ag
e-ad
juste
d pr
oduc
tion
(kg·
tree−
1)
y = −27.2ln(x) + 139.6
R2 = 0.96
(a)
0
10
20
30
40
50
60
70
80
90
100
0 20 40 60 80Rock on surface (%)
Cash
ew ag
e-ad
juste
d pr
oduc
tion
(kg·
tree−
1)
y = 96.39e−0.02x
R2 = 0.97
(b)
Figure 7: Relationships between cashew productions with terrain conditions: slope (a) and rock on surface (b).
and the S3 class is 23%, and the limit between the S3 classand the N class is 77%. The content of the surface rocksto form the limit between the S1 class and the S2 class is15% and the limit between the S2 class and the S3 class is29%, while the limit between the S3 class and the N class is76%.
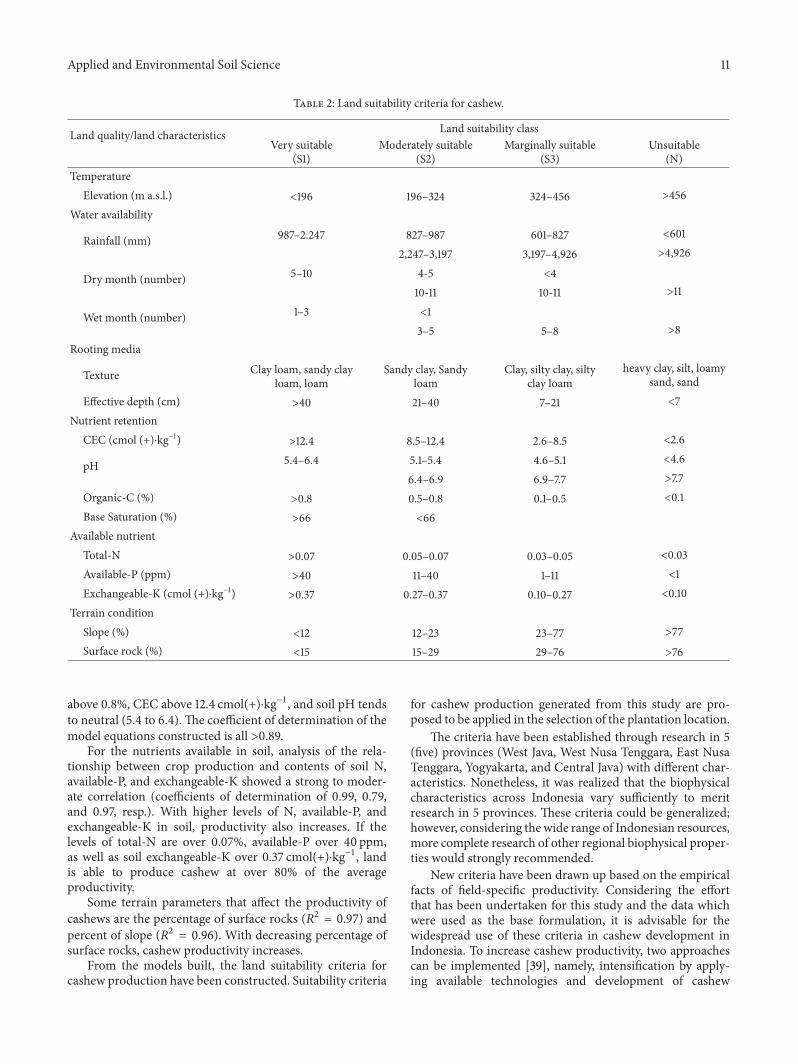
Based on the model, developed for any land character-istic, the land suitability criteria for cashew production canat last be established, as presented in Table 2. Land qualitieswhich can not constitute criteria are air temperature,drainage, and Al-toxicity. This is due to the limited distribu-tion of cashew crops in the study areas. Cashew productionranges from a few dozen meters to 470m a.s.l., and so thetemperature range in the study area varies by only 2 to 3∘C.Similarly for drainage class, criteria cannot be made, becausecashews are generally developed as green plants or grownon degraded lands as conservation plants or to increase theeconomic value of dry land, so that the distribution of thisplant is commonly spread on land with good drainage. Inthis research, this plant was never found in soil drainagewith moderately well or worse. Criteria for Al-toxicitylimits could not be determined also due to the distributionof Al saturation which was found in the narrow intervaldistribution.
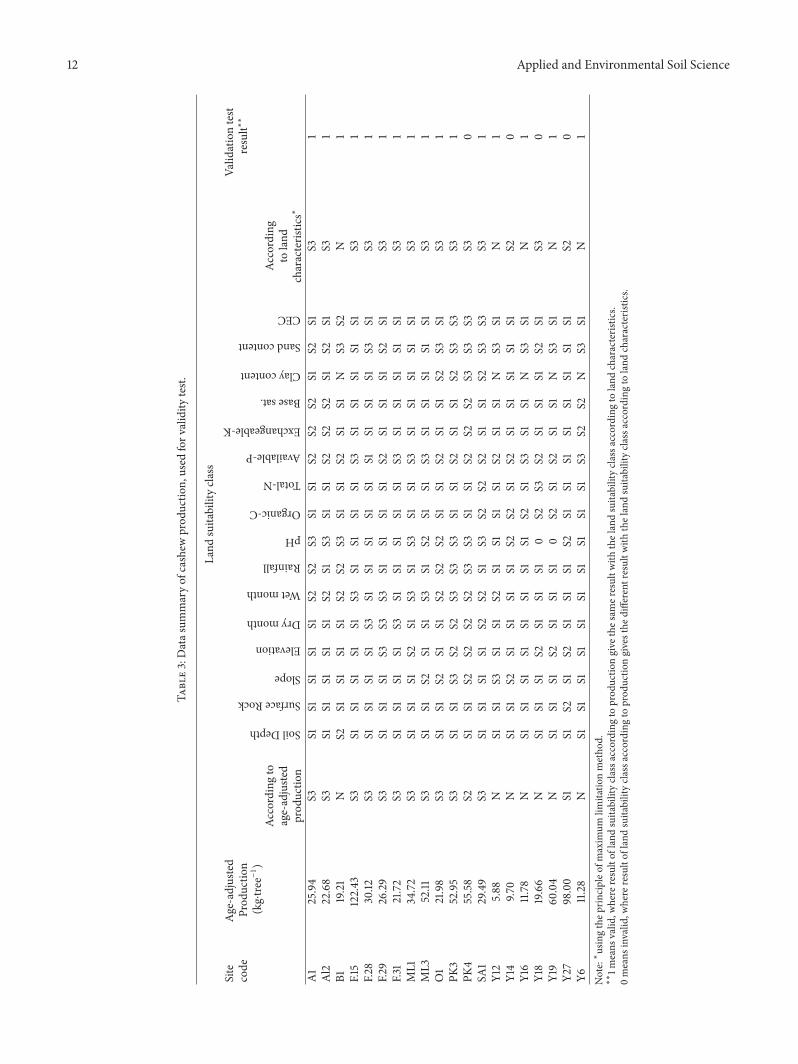
The validity test used 20 data sets that were not used inthe preparation of the model, which consists of data fieldsand production characteristics. The data used for validationare presented in Table 3. The results of this validity testindicate that overall land suitability criteria have generatedan 80% accuracy rate. This means that as much as 80% of thedata tested/generated are valid according to the postulatedsuitability criteria.
4. Conclusions
This study gives an analyis of the relationship between cashewproduction and the biophysical aspects of its growth. Patternof this relationship was then used to define the suitability ofcashew within its growth environments.
Analysis of the relationship between cashew productionandwater availability indicates that, with higher rainfall (over2,247mm⋅year−1), crop productivity decreases. However,conditions of rainfall below 987mm⋅year−1 also cause lowproductivity. The number of dry months which are stronglycorrelated with a level of productivity above 80% is 5 to 10months.
In terms of the relationship between cashew productionand conditions of the root zone of plants, our equationobtained (28.469 ln(𝑥)−32.57) has a fairly high correlation(𝑅2 = 0.76) for the relationship between crop productionand effective soil depth. This means that 76% of cashewproduction variability is influenced by effective soil depth.More effective soil depth of the plant roots resulted inbetter conditions, with a minimum effective soil depth of40 cm yielding productivity above 80% (S1 class). Mean-while, the soil texture which was conducive to crop pro-ductivity over 80% of the average production is clay loam,sandy clay loam, and loam, with a determination coefficient>0.86.
Retention of soil nutrients which correlate with thecashew productivity includes soil CEC, organic-C content,and soil pH. In general, by increasing CEC, soil pH tendsto be neutral, and the high percentage of organic-C, cropproductivity is also higher. Crop productivity over 80% of theaverage production requires the percentage of organic-C to be
Applied and Environmental Soil Science 11
Table 2: Land suitability criteria for cashew.
Land quality/land characteristics Land suitability classVery suitable
(S1)Moderately suitable
(S2)Marginally suitable
(S3)Unsuitable
(N)Temperature
Elevation (m a.s.l.)<196 196–324 324–456 >456
Water availability
Rainfall (mm) 987–2.247 827–987 601–827 <601
2,247–3,197 3,197–4,926 >4,926
Dry month (number) 5–10 4-5 <410-11 10-11 >11
Wet month (number) 1–3 <13–5 5–8 >8
Rooting media
Texture Clay loam, sandy clayloam, loam
Sandy clay, Sandyloam
Clay, silty clay, siltyclay loam
heavy clay, silt, loamysand, sand
Effective depth (cm)>40 21–40 7–21 <7
Nutrient retentionCEC (cmol (+)⋅kg−1)
>12.4 8.5–12.4 2.6–8.5 <2.6
pH 5.4–6.4 5.1–5.4 4.6–5.1 <4.6
6.4–6.9 6.9–7.7 >7.7Organic-C (%)
>0.8 0.5–0.8 0.1–0.5 <0.1Base Saturation (%)
>66 <66Available nutrient
Total-N>0.07 0.05–0.07 0.03–0.05 <0.03
Available-P (ppm)>40 11–40 1–11 <1
Exchangeable-K (cmol (+)⋅kg−1)>0.37 0.27–0.37 0.10–0.27 <0.10
Terrain conditionSlope (%)
<12 12–23 23–77 >77Surface rock (%)
<15 15–29 29–76 >76
above 0.8%, CEC above 12.4 cmol(+)⋅kg−1, and soil pH tendsto neutral (5.4 to 6.4). The coefficient of determination of themodel equations constructed is all >0.89.
For the nutrients available in soil, analysis of the rela-tionship between crop production and contents of soil N,available-P, and exchangeable-K showed a strong to moder-ate correlation (coefficients of determination of 0.99, 0.79,and 0.97, resp.). With higher levels of N, available-P, andexchangeable-K in soil, productivity also increases. If thelevels of total-N are over 0.07%, available-P over 40 ppm,as well as soil exchangeable-K over 0.37 cmol(+)⋅kg−1, landis able to produce cashew at over 80% of the averageproductivity.
Some terrain parameters that affect the productivity ofcashews are the percentage of surface rocks (𝑅2 = 0.97) andpercent of slope (𝑅2 = 0.96). With decreasing percentage ofsurface rocks, cashew productivity increases.
From the models built, the land suitability criteria forcashew production have been constructed. Suitability criteria
for cashew production generated from this study are pro-posed to be applied in the selection of the plantation location.
The criteria have been established through research in 5(five) provinces (West Java, West Nusa Tenggara, East NusaTenggara, Yogyakarta, and Central Java) with different char-acteristics. Nonetheless, it was realized that the biophysicalcharacteristics across Indonesia vary sufficiently to meritresearch in 5 provinces. These criteria could be generalized;however, considering the wide range of Indonesian resources,more complete research of other regional biophysical proper-ties would strongly recommended.
New criteria have been drawn up based on the empiricalfacts of field-specific productivity. Considering the effortthat has been undertaken for this study and the data whichwere used as the base formulation, it is advisable for thewidespread use of these criteria in cashew development inIndonesia. To increase cashew productivity, two approachescan be implemented [39], namely, intensification by apply-ing available technologies and development of cashew
12 Applied and Environmental Soil Science
Table3:Datas
ummaryof
cashew
prod
uctio
n,used
forv
alidity
test.
Site
code
Age-adjusted
Prod
uctio
n(kg⋅tre
e−1
)
Land
suitabilitycla
ssVa
lidationtest
result∗∗
Accordingto
age-adjuste
dprod
uctio
n
SoilDepth
SurfaceRock
Slope
Elevation
Drymonth
Wetmonth
Rainfall
pH
Organic-C
Total-N
Available-P
Exchangeable-K
Basesat.
Claycontent
Sandcontent
CEC
According
toland
characteris
tics∗
A1
25.94
S3S1
S1S1
S1S1
S2S2
S3S1
S1S2
S2S2
S1S2
S1S3
1Al2
22.68
S3S1
S1S1
S1S1
S2S1
S3S1
S1S2
S2S2
S1S2
S1S3
1B1
19.21
NS2
S1S1
S1S1
S2S2
S3S1
S1S2
S1S1
NS3
S2N
1F.15
122.43
S3S1
S1S1
S1S1
S3S1
S1S1
S1S3
S1S1
S1S1
S1S3
1F.2
830.12
S3S1
S1S1
S1S3
S1S1
S1S1
S1S1
S1S1
S1S3
S1S3
1F.2
926.29
S3S1
S1S1
S3S3
S3S1
S1S1
S1S2
S1S1
S1S2
S1S3
1F.3
121.72
S3S1
S1S1
S1S3
S1S1
S1S1
S1S3
S1S1
S1S1
S1S3
1ML1
34.72
S3S1
S1S1
S2S1
S3S1
S3S1
S1S3
S1S1
S1S1
S1S3
1ML3
52.11
S3S1
S1S2
S1S1
S3S1
S2S1
S1S3
S1S1
S1S1
S1S3
1O1
21.98
S3S1
S1S2
S1S1
S2S2
S2S1
S1S2
S1S1
S2S3
S1S3
1PK
352.95
S3S1
S1S3
S2S2
S3S3
S3S1
S1S2
S1S1
S2S3
S3S3
1PK
455.58
S2S1
S1S2
S2S2
S2S3
S3S1
S1S2
S2S2
S3S3
S3S3
0SA
129.49
S3S1
S1S1
S1S2
S2S1
S3S2
S2S2
S1S1
S2S3
S3S3
1Y12
5.88
NS1
S1S3
S1S1
S2S1
S1S1
S1S2
S1S1
NS3
S1N
1Y14
9.70
NS1
S1S2
S1S1
S1S1
S2S2
S1S2
S1S1
S1S1
S1S2
0Y16
11.78
NS1
S1S1
S1S1
S1S1
S1S2
S1S3
S1S1
NS3
S1N
1Y18
19.66
NS1
S1S1
S2S1
S1S1
0S2
S3S2
S1S1
S1S2
S1S3
0Y19
60.04
NS1
S1S1
S2S1
S1S1
0S2
S1S2
S1S1
NS3
S1N
1Y2
798.00
S1S1
S2S1
S2S1
S1S1
S2S1
S1S1
S1S1
S1S1
S1S2
0Y6
11.28
NS1
S1S1
S1S1
S1S1
S1S1
S1S3
S2S2
NS3
S1N
1Note:∗
usingthep
rincipleo
fmaxim
umlim
itatio
nmetho
d.∗∗
1means
valid
,where
resultof
land
suitabilityclassa
ccording
toprod
uctio
ngive
thes
amer
esultw
iththelandsuitabilityclassa
ccording
toland
characteris
tics.
0means
invalid
,where
resultof
land
suitabilityclassa
ccording
toprod
uctio
ngivesthe
different
resultwith
thelandsuitabilitycla
ssaccordingto
land
characteris
tics.

Applied and Environmental Soil Science 13
plantation in areas having suitability rates from fair to highlysuitable.
Conflict of Interests
The authors declare that there is no conflict of interestsregarding the publication of this paper.
Acknowledgments
The authors would like to acknowledge Ministry of Agricul-ture, Republic of Indonesia, for the funding of this researchunder the Project ofAgricultural ResearchPartnershipCoop-eration with Universities during 2007–2009 as well as Min-istry of Research and Technology, for the funding of thisresearch during 2010-2011 under the Project of Research andTechnology Incentive.
References
[1] D. J. P. Ditjenbun, “Perkembangan Luas Areal Perkebunan2008–2013,” Direktorat Jenderal Perkebunan, Departemen Per-tanian, 2013.
[2] S. Kurniati and E. A. Hadad, “Perkembangan penelitian bahantanaman jambu mete,” in Prosiding Forum Komunikasi IlmiahKomoditas JambuMente, pp. 104–114, Balai Penelitian TanamanRempah dan Obat, 1996.
[3] E. V. V. B. Rao, “Integrated production practices of Cashew inIndia,” FAOCorporateDocument Repository, 2013, http://www.fao.org/docrep/005/ac451e/ac451e04.htm.
[4] N. M. Chau, “Integrated production practices of Cashew inVietnam,” FAO Corporate Document Repository, 2013, http://www.fao.org/docrep/005/ac451e/ac451e0a.htm.
[5] FAO (Food and Agricultural Organization of the UnitedNations), Major Food and Agricultural Commodities and Pro-ducers—Countries by Commodity, 2011, http://www.fao.org/.
[6] Balitro (Balai Penelitian Tanaman Rempah dan Aneka Indus-tri), “Program Penelitian Balitro,” Balai Penelitian TanamanRempah dan Aneka Tanaman Industri, 2009.
[7] D. de la Rosa and C. van Diepen, “Qualitative and quantitativeland evaluation,” in 1.5. Land Use and Land Cover, W. Verheye,Ed., Encyclopedia of Life Support System (EOLSS-UNESCO),EOLSS, Oxford, UK, 2002.
[8] H. George,AnOverview of Land Evaluation and Land Use Plan-ning at FAO, FAO, Rome, Italy, 2005.
[9] D. Djaenudin, H. Marwan, H. Subagjo, and A. Hidayat, Techni-cal Guidance of Land Evaluation for Agricultural Commodities,Soil Research Institute, Agricultural Research andDevelopmentAgency, 2003.
[10] M. L. Rayes,Metode Inventarisasi Sumberdaya Lahan, PenerbitAndi, Yogyakarta, Indonesia, 2006.
[11] S. Hardjowigeno and Widiatmaka, Land Suitability Evaluationand Landuse Planning, Gadjahmada University Press, Yogya-karta, Indonesia, 2007.
[12] S. Ritung, F. Wahyunto, F. Agus, and H. Hidayat, EvaluasiKesesuaian Lahan dengan Contoh Peta Arahan PenggunaanLahan Kabupaten Aceh Barat, Balai Penelitian Tanah danWorldAgroforestry Centre (ICRAF), Bogor, Indonesia, 2007, (Indone-sian).
[13] A. Sutandi and B. Barus, “Permodelan kesesuaian lahan tana-man kunyit,” Jurnal Tanah dan Lingkungan, vol. 9, no. 1, pp. 20–26, 2007.
[14] J. Letey, “Relationship between soil physical properties and cropproduction,” Advances in Soil Science, vol. 1, pp. 277–294, 1985.
[15] S. Zare, M. Jafari, A. Tavili, H. Abbasi, and M. Rostampour,“Relationship between environmental factors and plant distri-bution in arid and semiarid area (Case Study: Shahriyar Ran-gelands, Iran),” American-Eurasian Journal of Agriculture &Environmental Science, vol. 10, no. 1, pp. 97–105, 2011.
[16] C. R. Escano, C. A. Jones, and G. Uehara, “Nutrient diagnosis incorn grown on hydric dystrandepts: I. Optimum nitrient tissueconcentrations,” Soil Science Society ofAmerica Journal, vol. 45,pp. 1135–1139, 1981.
[17] A. Etzinger, “Using empirical andmechanisticmodels to predictcrop suitability and productivity in climate change research,” inDecision andPolicyAnalysis, DAPA,CIAT,Nairobi, Kenya, 2013.
[18] E. A. Machado-Machado, “Empirical mapping of suitability todengue fever in Mexico using species distribution modeling,”Applied Geography, vol. 33, no. 1, pp. 82–93, 2012.
[19] J. L.Walworth,W. S. Letzsch, andM. E. Sumner, “Use of bound-ary lines in establishing diagnostic norms,” Soil Science Societyof America Journal, vol. 50, no. 1, pp. 123–128, 1986.
[20] M. E. Sumner and P. M. W. Farina, “Phosphorous interactionswith nutrients and lime in field cropping systems,” Advance inSoil Science, vol. 5, pp. 201–236, 1986.
[21] A. E. Milne, R. B. Ferguson, and R. M. Lark, “Estimating aboundary line model for a biological response by maximumlikelihood,” Annals of Applied Biology, vol. 149, no. 2, pp. 223–234, 2006.
[22] Food and Agricultural Organisation, A Framework for LandEvaluation, Soils Bulletin NO.32, Food and Agriculture Orga-nization, Rome, Italy, 1976.
[23] Widiatmaka, A. Sutandi, U. Daras, I. Anas, and A. Krisnohadi,“Exploration of land quality and productivity for developmentof land suitability criteria for cashew (Anacardium occidentale,L.),” in Proceedings of the 9th Congress of Indonesian Soil ScienceAssociation, pp. 270–279, 2007.
[24] K. H. Tan, Soil Sampling, Preparation and Analysis, Marcel Dek-ker, New York, NY, USA.
[25] R. A. Rathfon and J. A. Burger, “Diagnosis and Recommen-dation Integrated System (DRIS) nutrient norms for fraser firChristmas trees,” Forest Science, vol. 37, no. 4, pp. 998–1010, 1991.
[26] A. Krisnohadi, Pembangunan Kriteria Kesesuaian Lahan untukJambuMete (Anacardium occidentale L.) danOptimalisasiMan-ajemen Spesifik Lokasi Usaha Tani Jambu Mete di KabupatenDompu [M.S. thesis], Program Pascasarjana, Institut PertanianBogor, Bogor, Indonesia, 2008.
[27] U. Schmidt, H. Thoni, and M. Kaupenjohann, “Using a bound-ary line approach to analyze N2O flux data from agriculturalsoils,” Nutrient Cycling in Agroecosystems, vol. 57, no. 2, pp. 119–129, 2000.
[28] F. R. Blanco-Macıas, R. D. Magallanes-Quintanar, R. Valdez-Cepeda et al., “Comparison between CND norms and bound-ary-line approach nutrient standards: Opuntia ficus-indica L.Case,”Revista Chapingo SerieHorticultura, vol. 15, no. 2, pp. 217–223, 2009.
[29] E. C. J. Mohr, F. A. van Barren, and J. van Schuylenborgh, Tropi-cal Soils, W. Van Hoeve, The Hague, The Netherlands, 1972.
[30] R. L. Oldeman and I. Las,TheAgroclimatic Maps of Kalimantan,Maluku, Irian Jaya and Bali West and East Nusa Tenggara,
14 Applied and Environmental Soil Science
Central Research Institute for Agriculture, Bogor, Indonesia,1980.
[31] T.D. Tolla,Effect ofmoisture conditions andmanagement on pro-duction of Cashew: a case study in lower Limpopo, Mozambique[M.S. thesis], International Institute for Geo-Information Sci-ence and Earth Observation, Enschede,The Netherlands, 2004.
[32] C. S. Gopakumar, G. S. L. H. V. P. Rao, and P. B. Pushpalatha,“Effect of dry spell on cashew production in the humid tropics,”inProceeding of theNationalWorkshop onDroughtManagementin Plantation Crops, E. V. Nybe and G. S. L. H. V. P. Rao, Eds.,pp. 108–109, 2005.
[33] I. E. Duncan, “A review of the potential for development ofcashew production in Zona Paz region, Guatemala, CentralAmerica,” AGIL PROGRAM (Apoyo a la Generacion de Ingre-sos Locales), US Aid/Guatemala CAP income GenerationActivities in Rural Areas, Guatemala City, Guatemala, 2001.
[34] A. R. Owaiye and O. A. Olunloyo, “The effect of NPK fertilizercombinations on incidence of inflorescence blight disease ofcashew at Ochaja,” in Annual Report of Cocoa Research Instituteof Nigeria, p. 31, 1990.
[35] L. Thompson and F. Troeh, Soils and Soils Fertility, Mc-Graw-Hill, New York, NY, USA, 4th edition, 1978.
[36] P. O’Farrell, J. Armour, and D. Reid, “The effect of nitrogen oncashew in north Queensland,” RIRDC Publication noW02/001,RIRDC Project no DAQ-257A, 2002.
[37] J. G. Ohler, “Cashew Koninklijk Instituut Voor de Tropen Arm-sterdam,” Nigeria Agricultural Journal, p. 260, 1979.
[38] O. S. Ibiremo, M. O. Ogunlade, O. J. Oyetunji, and B. D.Adewale, “Dry matter yield and nutrient uptake of cashewseedlings as influenced by arbuscular mycorrhizal inoculation,organic and inorganic fertilizers in two soils in Nigeria,” ARPN: Journal of Agricultural and Biological Science, vol. 7, no. 3, pp.196–205, 2012.
[39] U. Daras, “Strategy and innovation of technology to increasecashew productivity in Nusa Tenggara (Indonesia),” Jurnal Pen-elitian dan Pengembangan Pertanian, vol. 26, no. 1, pp. 25–34,2007.

Submit your manuscripts athttp://www.hindawi.com
Forestry ResearchInternational Journal of
Hindawi Publishing Corporationhttp://www.hindawi.com Volume 2014
Environmental and Public Health
Journal of
Hindawi Publishing Corporationhttp://www.hindawi.com Volume 2014
Hindawi Publishing Corporationhttp://www.hindawi.com Volume 2014
EcosystemsJournal of
Hindawi Publishing Corporationhttp://www.hindawi.com Volume 2014
MeteorologyAdvances in
EcologyInternational Journal of
Hindawi Publishing Corporationhttp://www.hindawi.com Volume 2014
Marine BiologyJournal of
Hindawi Publishing Corporationhttp://www.hindawi.com Volume 2014
Hindawi Publishing Corporationhttp://www.hindawi.com
Applied &EnvironmentalSoil Science
Volume 2014
Advances in
Hindawi Publishing Corporationhttp://www.hindawi.com Volume 2014
Environmental Chemistry
Atmospheric SciencesInternational Journal of
Hindawi Publishing Corporationhttp://www.hindawi.com Volume 2014
Hindawi Publishing Corporationhttp://www.hindawi.com Volume 2014
Waste ManagementJournal of
Hindawi Publishing Corporation http://www.hindawi.com Volume 2014
International Journal of
Geophysics
Hindawi Publishing Corporationhttp://www.hindawi.com Volume 2014
Geological ResearchJournal of
EarthquakesJournal of
Hindawi Publishing Corporationhttp://www.hindawi.com Volume 2014
BiodiversityInternational Journal of
Hindawi Publishing Corporationhttp://www.hindawi.com Volume 2014
ScientificaHindawi Publishing Corporationhttp://www.hindawi.com Volume 2014
OceanographyInternational Journal of
Hindawi Publishing Corporationhttp://www.hindawi.com Volume 2014
The Scientific World JournalHindawi Publishing Corporation http://www.hindawi.com Volume 2014
Journal of Computational Environmental SciencesHindawi Publishing Corporationhttp://www.hindawi.com Volume 2014
Hindawi Publishing Corporationhttp://www.hindawi.com Volume 2014
ClimatologyJournal of