research article dual wavelength rp-hplc method for...
TRANSCRIPT
Hindawi Publishing CorporationJournal of Analytical Methods in ChemistryVolume 2013, Article ID 297285, 7 pageshttp://dx.doi.org/10.1155/2013/297285
Research ArticleDual Wavelength RP-HPLC Method for SimultaneousDetermination of Two Antispasmodic Drugs: An Application inPharmaceutical and Human Serum
Najmul Hasan,1 Mathurot Chaiharn,2 Sauleha Khan,3 Hira Khalid,4 Nawab Sher,3
Farhan Ahmed Siddiqui,5 and Muhammad Zain Siddiqui6
1 Department of Microbiology, Faculty of Science, University of Karachi, Karachi 75270, Pakistan2Division of Biotechnology, Faculty of Science, Maejo University, Chiang Mai 50290, Thailand3Department of Chemistry, Faculty of Science, University of Karachi, Karachi 75270, Pakistan4Department of Chemistry, Government College University, Lahore 54000, Pakistan5 Faculty of Pharmacy, Federal Urdu University of Science & Technology, Karachi 75300, Pakistan6Department of Chemistry, Faculty of Science, Federal Urdu University of Science & Technology, Karachi 75300, Pakistan
Correspondence should be addressed to Najmul Hasan; [email protected]
Received 8 May 2013; Revised 1 September 2013; Accepted 1 September 2013
Academic Editor: Krishna K. Verma
Copyright © 2013 Najmul Hasan et al. This is an open access article distributed under the Creative Commons Attribution License,which permits unrestricted use, distribution, and reproduction in any medium, provided the original work is properly cited.
A reverse phase stability indicating HPLC method for simultaneous determination of two antispasmodic drugs in pharmaceuticalparenteral dosage forms (injectable) and in serum has been developed and validated. Mobile phase ingredients consist ofAcetonitrile : buffer : sulfuric acid 0.1M (50 : 50 : 0.3 v/v/v), at flow rate 1.0mL/min using a Hibar 𝜇Bondapak ODS C
18column
monitored at dual wavelength of 266 nm and 205 nm for phloroglucinol and trimethylphloroglucinol, respectively. The drugswere subjected to stress conditions of hydrolysis (oxidation, base, acid, and thermal degradation). Oxidation degraded themolecule drastically while there was not so much significant effect of other stress conditions. The calibration curve was linearwith a correlation coefficient of 0.9999 and 0.9992 for PG and TMP, respectively. The drug recoveries fall in the range of98.56% and 101.24% with 10 pg/mL and 33 pg/mL limit of detection and limit of quantification for both phloroglucinol andtrimethylphloroglucinol. The method was validated in accordance with ICH guidelines and was applied successfully to quantifythe amount of trimethylphloroglucinol and phloroglucinol in bulk, injectable form and physiological fluid. Forced degradationstudies proved the stability indicating abilities of the method.
1. Introduction
Chemically, phloroglucinol (1,3,5-trihydroxybenzene, PG)and its methylated derivative tri-O-methylphloroglucinol(TMP), Figure 1, are established pharmaceutical agentsinhibit the action of catechol-O-methyl transferase, induc-ing relaxation of smooth muscles, and decreasing glycerol-induced abdominal pain and are also characterized by a swiftand strong spasmolytic activity, hence relieving pain. There-fore, PG is often used in combination with trimethylphlo-roglucinol as an antispasmodic drug and is regarded tobe effective in decreasing smooth muscle spasm. PG/TMPcombination is recommended against biliary calculi, severe
pain of urinary or gastrointestinal tract, pain of abdominalregion, spastic conditions of the female genital system, andpain in gynecology [1–7].
Literature survey reveals that some of the analyticalmethods for phloroglucinol are available including extractionand high-performance liquid chromatography (HPLC) [8–10], HPLC-mass spectrometry [11, 12], gas chromatography-mass spectrometry [13], and spectrophotometry [14]. Otherreported methods include titrimetry, spectrophotometry,paper chromatography, and flow injection analysis [15–20].
However, there is no simple and sensitive method tobe followed on industrial basis especially in general qualitycontrol laboratories. Previously mentioned methods involve
2 Journal of Analytical Methods in Chemistry
OH
OHHO
O
OO
Figure 1: Chemical structures of phloroglucinol and trimethylphlo-roglucinol.
complicated instrumentation and serialization. Therefore,they cannot be followed in the laboratories particularly thoseof third world countries. Hence our group already developeda cost effectivemethod for its fixed dose composition in tabletform [21], but still there was a need for an analytical methodwhich would help to determine the active pharmaceuticalingredients (APIs) in parenteral products and physiologicalfluid. Accordingly, the purpose of this write-up is to suggest asystematic approach for the development of a validated sim-ple, sensitive, and stability indicating RP-HPLC method thatshould meet the current ICH and regulatory requirements[22].
2. Experimental
The present method was designed to be easy to use, sensitive,and rapid. Separation and quantification of PG and TMP inpharmaceutical drug formulations and blood were achievedwith an isocratic elution andwith dual wavelength technique.
2.1. Apparatus and Materials. SIL 10A autoinjector HPLCsystem comprising of SCL 10A system, controller, SPD 20Aprominence UV/VIS detector, and Shimadzu LC 20 ATpump with LC Solutions software, was used. Separation wasperformed on a Hibar 𝜇Bondapak ODS C
18HPLC column
(4.6 × 250mm; 10 𝜇m bead size) and maintained at 25∘C. AUV-visible Shimadzu 1650 PC spectrophotometer with UVProbe software, ultrasonic cleaner (Elmasoni E 60H), Jenway3240 pHmeter, and Sartorius TE2145 analytical balance wereused in the research work. Throughout the work only amberglass flasks were used to avoid light effect on the solution ofPG and TMP standards and samples.
Trimethylphloroglucinol and phloroglucinol were kindgifts from aNational Pharmaceutical company, and sulphuricacid (Merck, Germany) and acetonitrile (HPLC grade) werepurchased from Fisher Scientific. The injectable contain-ing PG and TMP were obtained from commercial source(SPASFON Injection, SPADIX Injection, FUROSINOL Injec-tion, and ANAFORTAN PLUS Injection) labeled to contain10mg/mL and 0.01mg/mL of PG and TMP, respectively.Distilled water was procured through RO plant (Waterman,Pakistan).
2.2. Chromatographic Conditions. The HPLC analysis wascarried out at ambient temperature.The compoundwas chro-matographed isocratically with a mobile phase consistingof acetonitrile (HPLC grade): sodium n-heptane sulphonate(0.005M) : sulfuric acid 0.1M (50 : 50 : 0.3, v/v/v) with the
pH adjusted if required to 3.0 ± 0.1 using 0.1M sulfuric acidor 0.1M NaOH. While for sample and standard preparationdiluent was prepared from acetonitrile (HPLC grade): dis-tilled water (50 : 50, v/v%). The mobile phase was filteredby passing through a 0.45 𝜇m membrane filter (Millipore,Bedford, MA, USA) and degassed via sonication. The flowrate was 1.0mL/min, and the injected volume was 20 𝜇L. Theeffluentwasmonitored at dual wavelength of 266 and 205 nm.
3. Analytical Procedure
3.1. Standard Preparation. In a 100mL volumetric flask,about 10mg of TMP reference standard was weighed accu-rately and dissolved in diluent to have a stock solution of100 𝜇g/mL. Similarly in another 100mL volumetric flask,accurately 500mg of PG reference standard was weighed anddissolved in diluent, sonicated for 2 minutes, and let to coolto room temperature. Then, 5mL of TMP stock solution wasadded, and volume was made up to the mark with the samediluent. Finally 2mL of this solution was diluted in 100mLof diluent to get a 100𝜇g/mL of PG and 0.1𝜇g/mL of TMPworking standard solution. The standard was then filteredthrough 0.45𝜇m filter paper and injected into the HPLCsystem.
3.2. Sample Preparation of Injectable Solutions. For makinga sample of 100𝜇g/mL of PG and 0.1𝜇g/mL of TMP, 10ampoules were broken, and content was mixed to get anevenly homogenized stock sample. The sample volume wastaken accurately equivalent to 10mg of PG & 0.01mg of TMPin 100mL volumetric flask, and 50mL of diluent was added.The sample was sonicated for 1 minute and then diluent wasadded up to the mark and placed on stirrer for 5 minutes.The sample was then filtered through 0.45𝜇mfilter paper andinjected into the HPLC system.
3.3. Sample Preparation of Serum. Blood samples werecollected from healthy volunteers in evacuated glass tubethrough an indwelling cannula placed on forearm vein by atrained clinical laboratory technician. The volunteers werenot involved in any medication, smoking, and strenuousactivity. The blood was shaken and centrifuged at 6,000rpm for 30min to separate out plasma. 9mL acetonitrilewas added to 1mL plasma and centrifuged at 6,000 rpmfor 30min to deproteinate it. The supernatant serum thusobtained was stored at 20∘C and filtered for subsequentanalysis. For making a working sample solution of 12.5mL,stock sample was taken in 50mL flask followed by 30mLof serum addition. The sample thus obtained was stirredfor 10minutes and then diluent was added up to the mark.Further 2mL of this solution was diluted in 50mL of flaskwith the aid of diluent. All samples prepared were filteredthrough 0.45𝜇m membrane filter and injected in triplicateinto the HPLC system.
3.4. Sample Preparation for Degradation Studies. For thispurpose 5mL of the stock sample was diluted in 100mL dilu-ent to make a stock sample solution. For working purpose,
Journal of Analytical Methods in Chemistry 3
10mL of stock sample solution was diluted in four individual50mL volumetric flasks, and 15mL of degrading agent wereadded to each flask, with the exception of one to which onlydiluent was added; these included 0.1 NHCl, 0.1 N NaOH,and 30% H
2O2, and then to each flask diluent was added
up to the mark. All the four samples were placed in waterbath at 60∘C for one hour. The samples were then filteredthrough 0.45 𝜇mmembrane filter and injected into theHPLCsystem. Intentional degradation was attempted with stressconditions exposing the drugs to acid (0.1 NHCl), alkali(0.1 NNaOH), hydrogen peroxide (30%), and heat (60∘C)to evaluate the ability of the proposed method to separatedrugs from its degradation products. For all conditions thetemperature was kept constant at 60∘C for a period of onehour.
3.5. Stability Studies. For stability studies the commerciallyavailable injection (parenteral) samples in ampoules wereplaced at accelerated conditions of temperature that is at 40∘Cwith 75% relative humidity and at ambient conditions of 30∘Ctemperature with 65% relative humidity in environmentalchamber for six months.The stability protocol in Table 6 wasfollowed for six months.
3.6. Method Validation. ICH guidelines [22] were usedto perform method validation studies. Various proceduresincluding specificity, linearity, range, accuracy, and intradayand interday precision were evaluated.
To study linearity, twenty dilutions of standard weremade to prepare standard solution in range from 10% to200%, that is, from 10𝜇g/mL to 200𝜇g/mL of PG andfrom 0.01 𝜇g/mL to 0.2𝜇g/mL of TMP, respectively, drugscontent. The standard calibration curve was generated usingregression analysis with online help (http://wessa.net/). Forspecificity commonly used excipients in injection preparationwere spiked in a preweighed quantity of drugs to determinethe effect and interference of excipients in quantification ofthe drugs.
In order to find out the repeatability and reproducibilityof the method, precision was studied to find out intra- andinterday variations in the test method of PG and TMP inthe concentration range of 80–120 𝜇g/mL for PG and 0.08–0.12𝜇g/mL for TMP, respectively. Precision was determinedby analyzing corresponding bulk sample daily for a periodof three days and three times a day with an interval of 8hours against a freshly prepared standard. For determiningaccuracy the PG andTMP reference standardwere accuratelyweighed and spiked to the injection sample at three differentconcentration levels to gain 110%, 120%, and 130% of bothAPIs. At each level, samples were prepared in triplicate, andthe recovery percentage was determined.
Limit of detection and quantification (LOD and LOQ)for the method were established by sequentially diluting thestandard solutions at decreasing concentrations, in the rangeof 100–1 pg/mL for PG and 10–1 pg/mL for TMP. The limit ofdetectionwas defined as the concentration for which a signal-to-noise ratio of 3 was obtained, and for quantification limit, asignal-to-noise ratio of 10was considered.The standardswere
Phloroglucinol at 266 nm
Trimethylphloroglucinol at 205 nm
190 250 300 350 400(nm)
−0.312
0
1
2
33.262
Abso
rban
ce
11
2
2
3
78
4
34
5
5
6
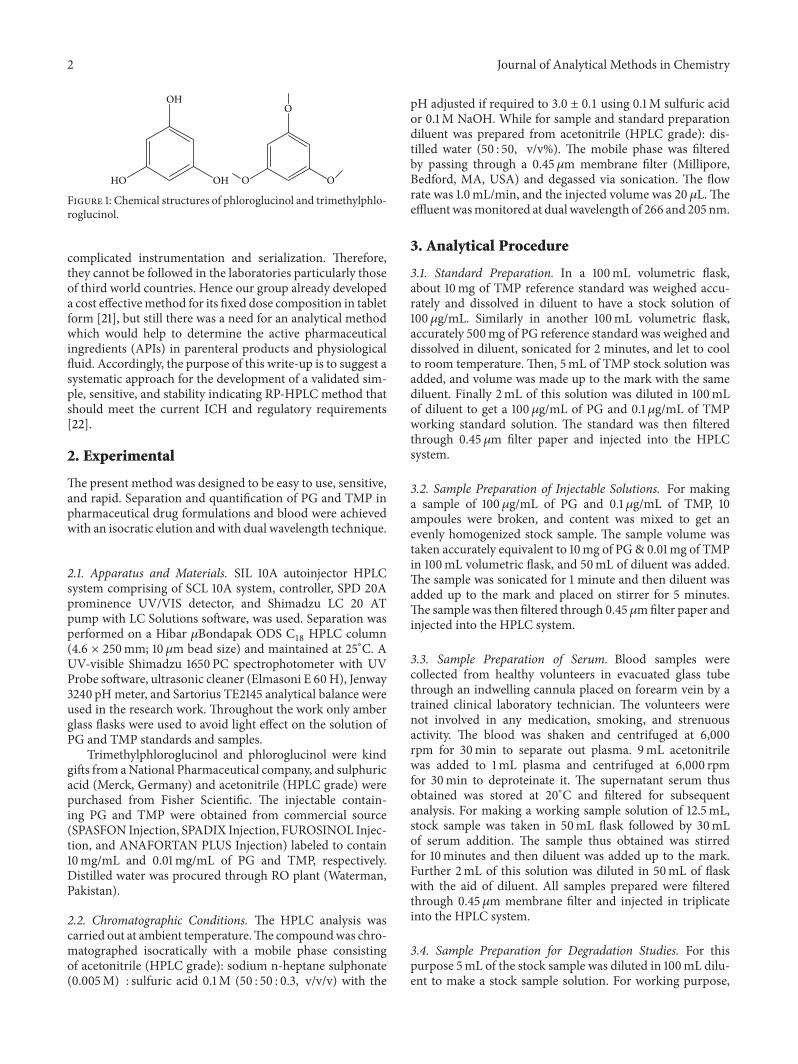
Figure 2: UV spectrum of PG (100𝜇g/mL) and TMP (0.1𝜇g mL−1).
injected in LC system, andmeasured signals from the dilutedstandards were compared with those of blank samples.
To study robustness, samples of injections were assayedwith deliberate variation in themethod parameters, such as inthe chromatographic conditions, like mobile phase, flow rate,and temperature so forth. Justification of system suitabilitywas established by calculating % relative standard deviationof replicate injections and analyzing the symmetry, resolutionof the standard peaks, and theoretical plates of the column.
4. Results and Discussion
The HPLC method development and its validation are theprioritized requirements for any drug available in the marketto ensure the quality of the products. A fewmethods are avail-able for determination of the APIs as described earlier, butmany of them are used only for certain definite objectives andlack generalization for simultaneous analytical applicationsin form of pharmaceutical products and serum. Similarlynone of them are as much sensitive as ours in terms of theirprecision, accuracy, limit of detection (LOD), and limit ofquantification (LOQ) especially as compared to [7, 9, 12, 14]whose LOD or LOQwas inmicrogram range only, while oursmethod is sensitive enough to be used for pharmacokineticstudies. Here, the LOD and LOQ for both APIs are 10 pg/mLand 33 pg/mL, respectively; however considering their ratioin sample formulation, the LOD and LOQ for PG are takenas 10 ng/mL and 33 ng/mL, respectively, and hence LOQand LOD for TMP can also be considered as the levels ofsensitivity of the method.
4.1. Method Development and Optimization. For developingan efficient method for the simultaneous analysis of PG andTMP, parameters such as detection wavelength, mobile phasecomposition, optimum pH, and concentration of the stan-dard solutions were comprehensively studied. Both PG andTMP were diluted in dilution solvent and then run throughUV spectrophotometer inUV range of 190 nm–400 nm to getmaximal wavelengths, Figure 2, wheremaximum absorbancewas gained, that is, 266 nm for both APIs.
However considering the difference of concentrationin both APIs that is 10 to 0.01mg/mL for PG and TMP,
4 Journal of Analytical Methods in Chemistry
Table 1: Calibration curve data and validation parameters.
Parameter InferencePhloroglucinol Trimethylphloroglucinol
Linearity range (𝜇g/mL) 10–200 0.01–0.2Correlation coefficient (𝑟) 0.9999 0.9992Regression equation (𝑦 = 𝑚𝑥 + 𝑐)Slope (𝑚) 402.66 3.12
Intercept (𝑐) 0 0For commercial formulation
Limit of detection (LOD) (ng/mL) 10 0.01Limit of quantification (LOQ) (ng/mL) 33 0.033
For method sensitivityLimit of detection (LOD) (pg/mL) 10 0.01Limit of quantification (LOQ) (pg/mL) 33 0.033
Table 2: Interday and intraday precision and recovery studies.
Active drugs PG TMP PG TMP PG TMP Interday RSD%∗
Nominal concentration (𝜇g/mL) 80 0.08 100 0.1 120 0.12 PG TMPDay 1 99.74 100.29 100.65 98.56 100.28 100.72 0.456 1.146Day 2 100.38 98.92 100.96 101.24 99.92 99.78 0.521 1.172Day 3 98.86 100.79 99.99 100.62 98.99 99.71 0.628 0.579Mean 99.66 100.34 100.53 100.14 99.73 100.1 0.488 0.139Intraday RSD% 0.76 0.97 0.49 1.4 0.66 0.56∗RSD%: relative standard deviation (should be less than 2.0).All results are expressed in percentage values.
Table 3: Contents of PG and TMP in the fixed dose combinationinjections.
Sample injection Content (%) ± S.D.PG TMP
SPASFON 99.75 ± 0.19 98.72 ± 0.43SPADIX 98.59 ± 0.81 97.97 ± 0.71FUROSINOL 100.19 ± 0.53 100.59 ± 0.19ANAFORTAN PLUS 99.41 ± 0.15 97.18 ± 0.38S.D.: standard deviation.
Table 4: Robustness of the method.
Chromatographicconditions Variation Retention time (minutes)
PG TMP
Temperature (∘C) 23 3.099 6.34627 3.217 6.381
Flow rate (mL/min.) 0.9 3.341 6.4131.1 2.89 5.994
Vol. of acetonitrile(%)
48 3.397 6.49952 2.982 5.619
respectively, therefore 205 nmwas used for TMP and 266 nmfor PG.
Mobile phase was selected in terms of its componentsand their proportions. The chromatographic parameters
were evaluated using a Hibar 𝜇Bondapak ODS C18
columnthe mobile phase composed of acetonitrile : buffer of givenproportion promoted a short run time (10min) without anyinterference, so this condition was adopted in subsequentanalysis.
The literature survey also revealed that almost all themethods developed so far have utilized acetonitrile as amajorcomponent in mobile phases. Acetonitrile is always preferreddue to the supreme solubility properties and UV absorbancecharacteristics, and there is no counterpart substitute foracetonitrile in the reverse phase HPLC and UV application.Therefore, keeping in view the chromatography type andthe detection wavelengths in use, acetonitrile was chosen foranalysis, though in our previous work [21] we used methanolfor its cost effectiveness.
4.2. Validation Studies. The linearity ranges were found tobe 10–200𝜇g/mL for PG and 0.01–0.2 𝜇g/mL for TMP. Theassaywas judged to be linear, as the correlation coefficientwas0.9999 and 0.9992 for PG andTMP, respectively, as calculatedby the least-square method. A linear correlation was foundbetween the peak areas and the concentrations of APIs, in theassayed range. The regression analysis data are presented inTable 1.
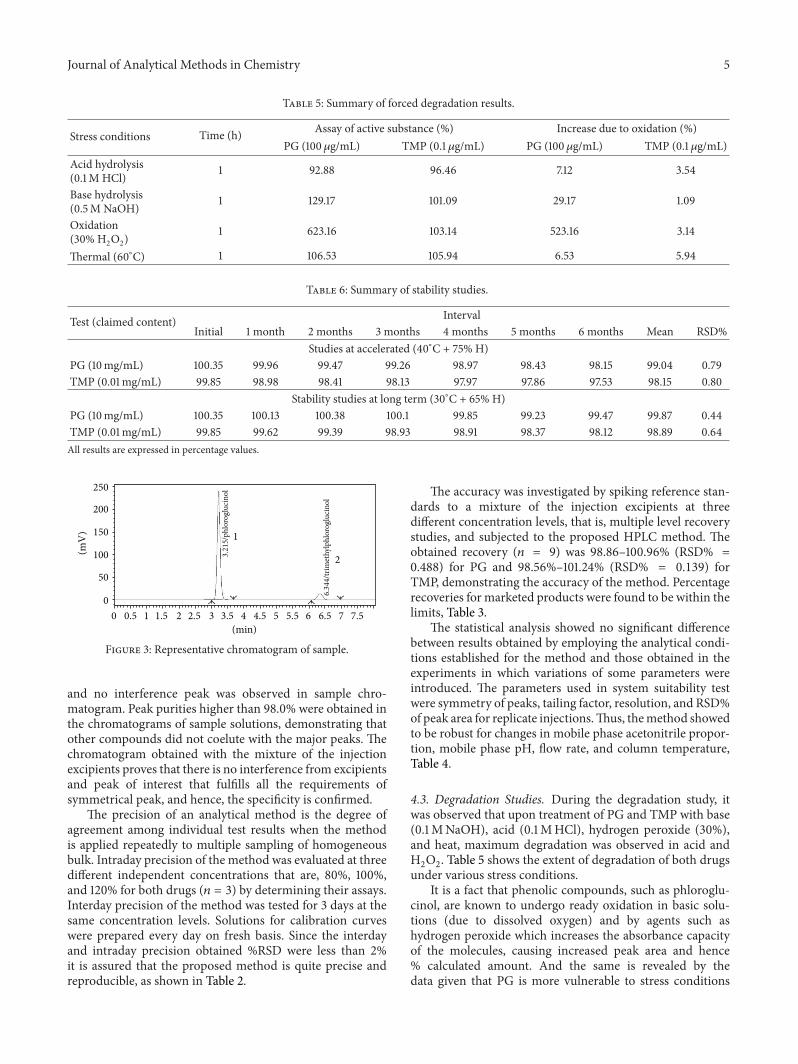
Chromatogram shown in Figure 3 proves specificity orselectivity of the assayed method, as the chromatograms insamples were found identical with standard chromatogram
Journal of Analytical Methods in Chemistry 5
Table 5: Summary of forced degradation results.
Stress conditions Time (h) Assay of active substance (%) Increase due to oxidation (%)PG (100𝜇g/mL) TMP (0.1 𝜇g/mL) PG (100𝜇g/mL) TMP (0.1 𝜇g/mL)
Acid hydrolysis(0.1M HCl) 1 92.88 96.46 7.12 3.54
Base hydrolysis(0.5M NaOH) 1 129.17 101.09 29.17 1.09
Oxidation(30% H2O2)
1 623.16 103.14 523.16 3.14
Thermal (60∘C) 1 106.53 105.94 6.53 5.94
Table 6: Summary of stability studies.
Test (claimed content) IntervalInitial 1 month 2 months 3 months 4 months 5 months 6 months Mean RSD%
Studies at accelerated (40∘C + 75% H)PG (10mg/mL) 100.35 99.96 99.47 99.26 98.97 98.43 98.15 99.04 0.79TMP (0.01mg/mL) 99.85 98.98 98.41 98.13 97.97 97.86 97.53 98.15 0.80
Stability studies at long term (30∘C + 65% H)PG (10mg/mL) 100.35 100.13 100.38 100.1 99.85 99.23 99.47 99.87 0.44TMP (0.01mg/mL) 99.85 99.62 99.39 98.93 98.91 98.37 98.12 98.89 0.64All results are expressed in percentage values.
0 0.5 1 1.5 2 2.5 3 3.5 4 4.5 5 5.5 6 6.5 7 7.5(min)
0
50
100
150
200
250
(mV
)
6.34
4/tr
imet
hylp
hlor
oglu
cino
l
3.21
5/ph
loro
gluc
inol
1
2
Figure 3: Representative chromatogram of sample.
and no interference peak was observed in sample chro-matogram. Peak purities higher than 98.0% were obtained inthe chromatograms of sample solutions, demonstrating thatother compounds did not coelute with the major peaks. Thechromatogram obtained with the mixture of the injectionexcipients proves that there is no interference from excipientsand peak of interest that fulfills all the requirements ofsymmetrical peak, and hence, the specificity is confirmed.
The precision of an analytical method is the degree ofagreement among individual test results when the methodis applied repeatedly to multiple sampling of homogeneousbulk. Intraday precision of the method was evaluated at threedifferent independent concentrations that are, 80%, 100%,and 120% for both drugs (𝑛 = 3) by determining their assays.Interday precision of the method was tested for 3 days at thesame concentration levels. Solutions for calibration curveswere prepared every day on fresh basis. Since the interdayand intraday precision obtained %RSD were less than 2%it is assured that the proposed method is quite precise andreproducible, as shown in Table 2.
The accuracy was investigated by spiking reference stan-dards to a mixture of the injection excipients at threedifferent concentration levels, that is, multiple level recoverystudies, and subjected to the proposed HPLC method. Theobtained recovery (𝑛 = 9) was 98.86–100.96% (RSD% =0.488) for PG and 98.56%–101.24% (RSD% = 0.139) forTMP, demonstrating the accuracy of the method. Percentagerecoveries for marketed products were found to be within thelimits, Table 3.
The statistical analysis showed no significant differencebetween results obtained by employing the analytical condi-tions established for the method and those obtained in theexperiments in which variations of some parameters wereintroduced. The parameters used in system suitability testwere symmetry of peaks, tailing factor, resolution, and RSD%of peak area for replicate injections.Thus, themethod showedto be robust for changes in mobile phase acetonitrile propor-tion, mobile phase pH, flow rate, and column temperature,Table 4.
4.3. Degradation Studies. During the degradation study, itwas observed that upon treatment of PG and TMP with base(0.1MNaOH), acid (0.1MHCl), hydrogen peroxide (30%),and heat, maximum degradation was observed in acid andH2O2. Table 5 shows the extent of degradation of both drugs
under various stress conditions.It is a fact that phenolic compounds, such as phloroglu-
cinol, are known to undergo ready oxidation in basic solu-tions (due to dissolved oxygen) and by agents such ashydrogen peroxide which increases the absorbance capacityof the molecules, causing increased peak area and hence% calculated amount. And the same is revealed by thedata given that PG is more vulnerable to stress conditions
6 Journal of Analytical Methods in Chemistry
0 0.5 1 1.5 2 2.5 3 3.5 4 4.5 5 5.5 6 6.5 7 7.5(min)
0
50
100
150
200
250(m
V)
6.34
4/tr
imet
hylp
hlor
oglu
cino
l
3.21
5/ph
loro
gluc
inol
12
(a)
0
50
100
150
200
(mV
)
0 1 2 3 4 5 6 7 8(min)
6.35
6/tr
imet
hylp
hlor
oglu
cino
l
3.22
9/ph
loro
gluc
inol
1 2
3.65
4/
4.05
9/
(b)
00
255075
100125150175200
1 2 3 4 5 6 7 8(min)
(mV
)
6.37
0/tr
imet
hylp
hlor
oglu
cino
l
3.25
6/ph
loro
gluc
inol
12
(c)
6.34
6/tr
imet
hylp
hlor
oglu
cino
l
3.09
9/ph
loro
gluc
inol
12
0 1 2 3 4 5 6 7 8(min)
0
250
500
750
1000
(mV
)
(d)
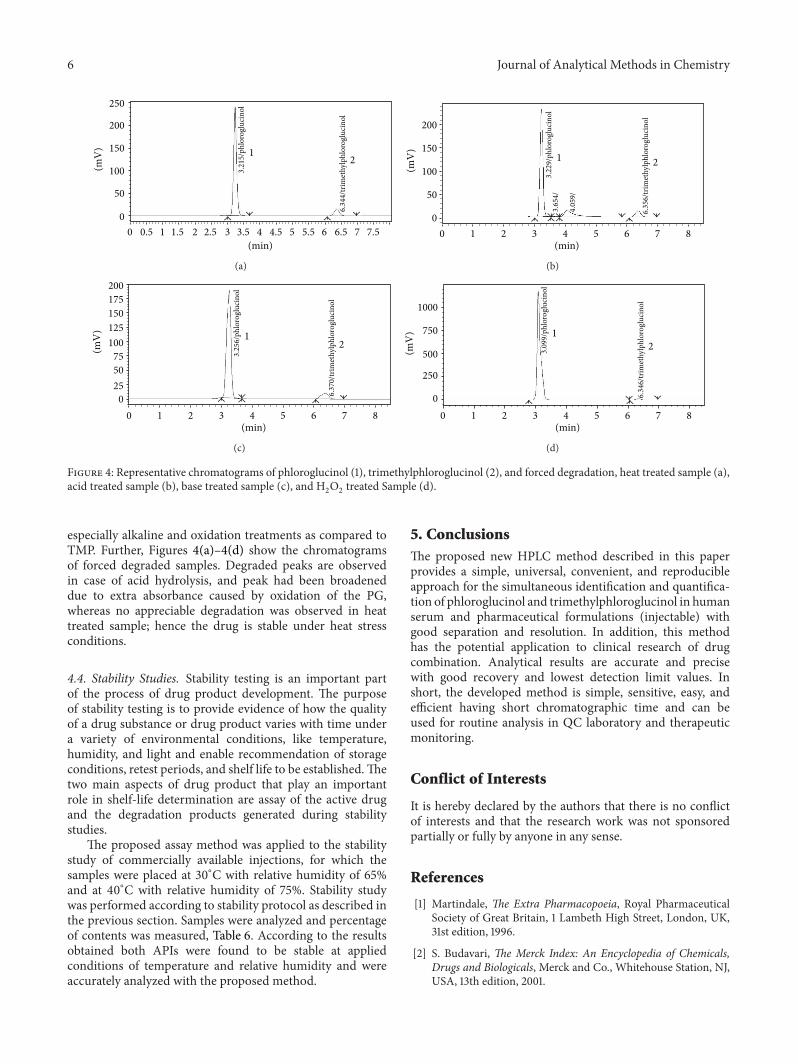
Figure 4: Representative chromatograms of phloroglucinol (1), trimethylphloroglucinol (2), and forced degradation, heat treated sample (a),acid treated sample (b), base treated sample (c), and H
2O2treated Sample (d).
especially alkaline and oxidation treatments as compared toTMP. Further, Figures 4(a)–4(d) show the chromatogramsof forced degraded samples. Degraded peaks are observedin case of acid hydrolysis, and peak had been broadeneddue to extra absorbance caused by oxidation of the PG,whereas no appreciable degradation was observed in heattreated sample; hence the drug is stable under heat stressconditions.
4.4. Stability Studies. Stability testing is an important partof the process of drug product development. The purposeof stability testing is to provide evidence of how the qualityof a drug substance or drug product varies with time undera variety of environmental conditions, like temperature,humidity, and light and enable recommendation of storageconditions, retest periods, and shelf life to be established.Thetwo main aspects of drug product that play an importantrole in shelf-life determination are assay of the active drugand the degradation products generated during stabilitystudies.
The proposed assay method was applied to the stabilitystudy of commercially available injections, for which thesamples were placed at 30∘C with relative humidity of 65%and at 40∘C with relative humidity of 75%. Stability studywas performed according to stability protocol as described inthe previous section. Samples were analyzed and percentageof contents was measured, Table 6. According to the resultsobtained both APIs were found to be stable at appliedconditions of temperature and relative humidity and wereaccurately analyzed with the proposed method.
5. ConclusionsThe proposed new HPLC method described in this paperprovides a simple, universal, convenient, and reproducibleapproach for the simultaneous identification and quantifica-tion of phloroglucinol and trimethylphloroglucinol in humanserum and pharmaceutical formulations (injectable) withgood separation and resolution. In addition, this methodhas the potential application to clinical research of drugcombination. Analytical results are accurate and precisewith good recovery and lowest detection limit values. Inshort, the developed method is simple, sensitive, easy, andefficient having short chromatographic time and can beused for routine analysis in QC laboratory and therapeuticmonitoring.
Conflict of Interests
It is hereby declared by the authors that there is no conflictof interests and that the research work was not sponsoredpartially or fully by anyone in any sense.
References
[1] Martindale, The Extra Pharmacopoeia, Royal PharmaceuticalSociety of Great Britain, 1 Lambeth High Street, London, UK,31st edition, 1996.
[2] S. Budavari, The Merck Index: An Encyclopedia of Chemicals,Drugs and Biologicals, Merck and Co., Whitehouse Station, NJ,USA, 13th edition, 2001.
Journal of Analytical Methods in Chemistry 7
[3] TheUnited States Pharmacopoeia, USP 27, NF 22, United StatesPharmacopeial Convention, Rockville, Md, USA, 2004.
[4] H. Yu-hua and X. G. Ping, “Clinic application of trimethylphlo-roglucinol during vaginal delivery,”Chinese Journal ofMedicinalGuide, vol. 4, 2004.
[5] D. Sasaki, A. Kido, and Y. Yoshida, “Effect of antispasmodicdrugs on the colonic motility. II: clinical study in man,”International Journal of Clinical Pharmacology Therapy andToxicology, vol. 22, no. 7, pp. 338–341, 1984.
[6] S. Tabassum, B. Afridi, and Z. Aman, “Phloroglucinol for accel-eration of labour: double blind, randomized controlled trial,”Journal of the Pakistan Medical Association, vol. 55, no. 7, pp.270–273, 2005.
[7] D. Louvel, M. Delvaux, G. Staumont et al., “Intracolonic injec-tion of glycerol: a model for abdominal pain in irritable bowelsyndrome?” Gastroenterology, vol. 110, no. 2, pp. 351–361, 1996.
[8] S. T. Cargnin, J. de Matos Nunes, J. S. Haas et al., “Supercriticalfluid extraction and high performance liquid chromatographicdetermination of benzopyrans and phloroglucinol derivative inHypericum polyanthemum,” Journal of Chromatography B, vol.878, no. 1, pp. 83–87, 2009.
[9] Y. Cui and C. Y. W. Ang, “Supercritical fluid extraction andhigh-performance liquid chromatographic determination ofphloroglucinols in St. John’s wort (Hypericum perforatum L.),”Journal of Agricultural and Food Chemistry, vol. 50, no. 10, pp.2755–2759, 2002.
[10] A. Tolonen, A. Hohtola, and J. Jalonen, “Fast high-performanceliquid chromatographic analysis of naphthodianthrones andphloroglucinols from Hypericum perforatum extracts,” Phyto-chemical Analysis, vol. 14, no. 5, pp. 306–309, 2003.
[11] H. Kim, H. Roh, H. J. Lee et al., “Determination of phlo-roglucinol in human plasma by high-performance liquidchromatography-mass spectrometry,” Journal of Chromatogra-phy B, vol. 792, no. 2, pp. 307–312, 2003.
[12] A. R. Bilia,M.C. Bergonzi, G.Mazzi, and F. F. Vincieri, “Analysisand stability of the constituents of Artichoke and St. John’s worttinctures by HPLC-DAD and HPLC-MS,” Drug Developmentand Industrial Pharmacy, vol. 28, no. 5, pp. 609–619, 2002.
[13] C. Lartigue-Mattei, C. Lauro-Marty, M. Bastide et al.,“Determination of phloroglucinol in human plasma bygas chromatography-mass spectrometry,” Journal of Chro-matography, vol. 617, no. 1, pp. 140–146, 1993.
[14] Z. Li, H. Ma, H. Lu, and G. Tao, “Determination of formalde-hyde in foodstuffs by flow injection spectrophotometry usingphloroglucinol as chromogenic agent,” Talanta, vol. 74, no. 4,pp. 788–792, 2008.
[15] D.Amin andW.A. Bashir, “Titrimetric determination of phenolresorcinol and phloroglucinol,” Talanta, vol. 31, no. 4, pp. 283–284, 1984.
[16] G. Dollo, F. Chevanne, P. Le Corre, C. Chemtob, and R. LeVerge, “Bioavailability of pholoroglucinol in man,” Journal dePharmacie de Belgique, vol. 54, no. 3, pp. 75–82, 1999.
[17] A. K. Chatterjee and L. N. Gibbins, “Determination of phlo-roglucinol in the presence of phloretin using amodified vanillinreagent,” Analytical Biochemistry, vol. 30, no. 3, pp. 436–442,1969.
[18] H. Cui, C.-G. Xie, and C.-Z. Lai, “A novel chemiluminescentmethod for determination of phloroglucinol,” Luminescence,vol. 18, no. 6, pp. 318–323, 2003.
[19] A. Penttila and J. Sundman, “Paper chromatographic separationof the phloroglucinol derivatives from Dryopteris species,”The
Journal of Pharmacy and Pharmacology, vol. 13, pp. 531–535,1961.
[20] C.-G. Xie and H.-F. Li, “Determination of phloroglucinol by anew flow injection chemiluminescence method,”Guang Pu XueYu Guang Pu Fen Xi, vol. 24, no. 12, pp. 1521–1523, 2004.
[21] N. Hasan, N. S. Afridi, S. Khan, M. Z. Siddiqui, and M.Chaiharn, “Simultaneous determination of two antispasmodicdrugs in bulk, pharmaceutical products and body fluid by avalidated, acetonitrile free, cost effective and stability indicat-ing reverse phase high performance liquid chromatographicmethod,” Analytical Chemistry, vol. 11, no. 7, pp. 274–281, 2012.
[22] ICH-Q2B Guideline for Industry, Validation of AnalyticalProcedure: Methodology. International Conference on Har-monisation, 2005.

Submit your manuscripts athttp://www.hindawi.com
Hindawi Publishing Corporationhttp://www.hindawi.com Volume 2014
Inorganic ChemistryInternational Journal of
Hindawi Publishing Corporation http://www.hindawi.com Volume 2014
International Journal ofPhotoenergy
Hindawi Publishing Corporationhttp://www.hindawi.com Volume 2014
Carbohydrate Chemistry
International Journal of
Hindawi Publishing Corporationhttp://www.hindawi.com Volume 2014
Journal of
Chemistry
Hindawi Publishing Corporationhttp://www.hindawi.com Volume 2014
Advances in
Physical Chemistry
Hindawi Publishing Corporationhttp://www.hindawi.com
Analytical Methods in Chemistry
Journal of
Volume 2014
Bioinorganic Chemistry and ApplicationsHindawi Publishing Corporationhttp://www.hindawi.com Volume 2014
SpectroscopyInternational Journal of
Hindawi Publishing Corporationhttp://www.hindawi.com Volume 2014
The Scientific World JournalHindawi Publishing Corporation http://www.hindawi.com Volume 2014
Medicinal ChemistryInternational Journal of
Hindawi Publishing Corporationhttp://www.hindawi.com Volume 2014
Chromatography Research International
Hindawi Publishing Corporationhttp://www.hindawi.com Volume 2014
Applied ChemistryJournal of
Hindawi Publishing Corporationhttp://www.hindawi.com Volume 2014
Hindawi Publishing Corporationhttp://www.hindawi.com Volume 2014
Theoretical ChemistryJournal of
Hindawi Publishing Corporationhttp://www.hindawi.com Volume 2014
Journal of
Spectroscopy
Analytical ChemistryInternational Journal of
Hindawi Publishing Corporationhttp://www.hindawi.com Volume 2014
Journal of
Hindawi Publishing Corporationhttp://www.hindawi.com Volume 2014
Quantum Chemistry
Hindawi Publishing Corporationhttp://www.hindawi.com Volume 2014
Organic Chemistry International
ElectrochemistryInternational Journal of
Hindawi Publishing Corporation http://www.hindawi.com Volume 2014
Hindawi Publishing Corporationhttp://www.hindawi.com Volume 2014
CatalystsJournal of