research article data envelopment analysis with uncertain...
TRANSCRIPT

Research ArticleData Envelopment Analysis with Uncertain Inputs and Outputs
Meilin Wen,1,2 Linhan Guo,1,2 Rui Kang,1,2 and Yi Yang1,2
1 Science and Technology on Reliability and Environmental Engineering Laboratory, Beijing 100191, China2 School of Reliability and Systems Engineering, Beihang University, Beijing 100191, China
Correspondence should be addressed to Linhan Guo; [email protected]
Received 27 June 2014; Accepted 15 July 2014; Published 5 August 2014
Academic Editor: Xiang Li
Copyright © 2014 Meilin Wen et al. This is an open access article distributed under the Creative Commons Attribution License,which permits unrestricted use, distribution, and reproduction in any medium, provided the original work is properly cited.
Data envelopment analysis (DEA), as a useful management and decision tool, has been widely used since it was first inventedby Charnes et al. in 1978. On the one hand, the DEA models need accurate inputs and outputs data. On the other hand, inmany situations, inputs and outputs are volatile and complex so that they are difficult to measure in an accurate way. The conflictleads to the researches of uncertain DEA models. This paper will consider DEA in uncertain environment, thus producing a newmodel based on uncertain measure. Due to the complexity of the new uncertain DEA model, an equivalent deterministic model ispresented. Finally, a numerical example is presented to illustrate the effectiveness of the uncertain DEA model.
1. Introduction
Data envelopment analysis is a mathematical programmingtechnique that measures the relative efficiency of decisionmaking units with multiple inputs and outputs, which wasinitialized by Charnes et al. [1]. This was followed by varietyof theory research work, including Banker et al. [2], Charneset al. [3], Petersen [4], and Tone [5]. More DEA papers canrefer to Seiford [6] in which 500 references are documented.
The original DEAmodels assume that inputs and outputsare measured by exact values. However, in many situations,such as in a manufacturing system, a production process, ora service system, inputs and outputs are volatile and complexso that they are difficult to measure in an accurate way. Thusmany researchers tried to model DEAwith various uncertaintheories. Probability theory is the earliest theory which wasused to establish the stochastic DEA models. Sengupta [7]generalized the stochastic DEA model using the expectedvalue. Banker [8] incorporated statistical elements into DEA,thus developing a statisticalmethod.Many papers [9–13] haveemployed the chance-constrained programming to DEA inorder to accommodate stochastic variations in data. Fuzzytheory is another theory which was used to deal with theuncertainty in DEA. As one of the DEA initiators, Cooper etal. [14–16] introduced how to deal with imprecise data such as
bounded data, ordinal data, and ratio bounded data in DEA.Kao and Liu [17] developed amethod to find themembershipfunctions of the fuzzy efficiency scores when some inputsor inputs are fuzzy numbers. Entani et al. [18] proposed aDEA model with an interval efficiency by the pessimisticand the optimistic values. Many researchers have introducedpossibility measure [19] into DEA [20, 21].
A lot of surveys showed that human uncertainty doesnot behave like fuzziness. For example, we say “the input isabout 10.” Generally, we employ fuzzy variable to describethe concept of “about 10;” then there exists a membershipfunction, such as a triangular one (9, 10, 11). Based onthis membership function, we can obtain that “the input isexactly 10” with possibility measure 1. On the other hand,the opposite event of “not exactly 10” has the same possibilitymeasure. The conclusion that “not 10” and “exactly 10” havethe same possibility measure is not appropriate.This inspiredLiu [22] to found an uncertainty theory which has becomea branch of axiomatic mathematics for modeling humanuncertainty. This paper will apply the uncertainty theory toDEA to deal with human uncertainty, thus producing someuncertain DEA models.
In this paper, we will assume the inputs and outputs areuncertain variables and propose some uncertain DEA mod-els. The rest of this paper is organized as follows. Section 2
Hindawi Publishing CorporationJournal of Applied MathematicsVolume 2014, Article ID 307108, 7 pageshttp://dx.doi.org/10.1155/2014/307108

2 Journal of Applied Mathematics
will introduce some basic concepts and properties aboutuncertain variables. Then an uncertain DEA model as wellas its equivalent crisp model will be presented in Section 3.Finally, a numerical example will be given to illustrate theuncertain DEA model in Section 4.
2. Preliminaries
Uncertainty theory was founded by Liu [22] in 2007 andrefined by Liu [23] in 2010. As extensions of uncertainty the-ory, uncertain process, and uncertain differential equations[24], uncertain calculus [25] were proposed. Besides, uncer-tain programming was first proposed by Liu [26] in 2009,which wants to deal with the optimal problems involvinguncertain variable. This work was followed by an uncertainmultiobjective programming, an uncertain goal program-ming [27], and an uncertain multilevel programming [28].Since that, uncertainty theory was used to solve variety ofreal optimal problems, including finance [29–31], reliabilityanalysis [32, 33], graph [34, 35], and train scheduling [36,37]. In this section, we will state some basic concepts andresults on uncertain variables.These results are crucial for theremainder of this paper.
Let Γ be a nonempty set, and let Ł be a 𝜎-algebra overΓ. Each element Λ ∈ Ł is assigned a number 𝑀{Λ} ∈
[0, 1]. In order to ensure that the number 𝑀{Λ} has cer-tain mathematical properties, Liu [22] presented the fouraxioms.
Axiom 1. 𝑀{Γ} = 1 for the universal set Γ.
Axiom 2. 𝑀{Λ} + 𝑀{Λ𝑐
} = 1 for any event Λ.
Axiom 3. For every countable sequence of events Λ1, Λ2, . . .,
we have
𝑀{
∞
⋃
𝑖=1
Λ𝑖} ≤
∞
∑
𝑖=1
𝑀{Λ𝑖} . (1)
Axiom 4. Let (Γ𝑘, Ł𝑘,𝑀𝑘) be uncertainty spaces for 𝑘 =
1, 2, . . .. Then the product uncertain measure 𝑀 is an uncer-tain measure satisfying
𝑀{
∞
∏
𝑘=1
Λ𝑘} =
∞
⋀
𝑘=1
𝑀𝑘{Λ𝑘} , (2)
where Λ𝑘are arbitrarily chosen events from Ł
𝑘for 𝑘 =
1, 2, . . ., respectively.If the set function 𝑀 satisfies the first three axioms, it is
called an uncertain measure.
Definition 1 (see Liu [22]). Let Γ be a nonempty set, letŁ be a 𝜎-algebra over Γ, and let 𝑀 be an uncertainmeasure. Then the triplet (Γ, Ł,𝑀) is called an uncertaintyspace.
Definition 2 (see Liu [22]). An uncertain variable 𝜉 is ameasurable function from an uncertainty space (Γ, Ł,𝑀) to
the set of real numbers; that is, for any Borel set 𝐵 of realnumbers, the set
{𝜉 ∈ 𝐵} = {𝛾 ∈ Γ | 𝜉 (𝛾) ∈ 𝐵} (3)
is an event.
Definition 3 (see Liu [22]). The uncertainty distributionΦ ofan uncertain variable 𝜉 is defined by
Φ (𝑥) = 𝑀 {𝜉 ≤ 𝑥} (4)
for any real number 𝑥.
Example 4. The linear uncertain variable 𝜉 ∼ L(𝑎, 𝑏) has anuncertainty distribution
Φ (𝑥) =
{{{{{{
{{{{{{
{
0, if 𝑥 ≤ 𝑎,
(𝑥 − 𝑎)
(𝑏 − 𝑎), if 𝑎 ≤ 𝑥 ≤ 𝑏,
1, if 𝑥 ≥ 𝑏.
(5)
Example 5. An uncertain variable 𝜉 is called zigzag if it has azigzag uncertainty distribution
Φ (𝑥) =
{{{{{{{{{{{
{{{{{{{{{{{
{
0, if 𝑥 ≤ 𝑎,
(𝑥 − 𝑎)
2 (𝑏 − 𝑎), if 𝑎 ≤ 𝑥 ≤ 𝑏,
(𝑥 + 𝑐 − 2𝑏)
2 (𝑐 − 𝑏), if 𝑏 ≤ 𝑥 ≤ 𝑐,
1, if 𝑥 ≥ 𝑐
(6)
denoted byZ(𝑎, 𝑏, 𝑐), where 𝑎, 𝑏, 𝑐 are real numbers with 𝑎 <
𝑏 < 𝑐.
Definition 6 (see Liu [25]). The uncertain variables𝜉1, 𝜉2, . . . , 𝜉
𝑛are said to be independent if
𝑀{
𝑛
⋂
𝑖=1
(𝜉𝑖∈ 𝐵𝑖)} =
𝑛
⋀
𝑖=1
𝑀{𝜉𝑖∈ 𝐵𝑖} (7)
for any Borel sets 𝐵1, 𝐵2, . . . , 𝐵
𝑛.
Definition 7 (see Liu [23]). An uncertainty distribution Φ
of an uncertain variable 𝜉 is said to be regular if its inversefunction Φ
−1
(𝛼) exists and is unique for each 𝛼 ∈ (0, 1). Inthis case, the inverse function Φ
−1
(𝛼) is called the inverseuncertainty distribution of 𝜉.
Example 8. The inverse uncertainty distribution of a zigzaguncertain variableZ(𝑎, 𝑏, 𝑐) is
Φ−1
(𝛼) = {(1 − 2𝛼) 𝑎 + 2𝛼𝑏, if 𝛼 ≤ 0.5,
(2 − 2𝛼) 𝑏 + (2𝛼 − 1) 𝑐, if 𝛼 > 0.5.(8)
Theorem 9 (see Liu [23]). Let 𝜉1, 𝜉2, . . . , 𝜉
𝑛be independent
uncertain variables with regular uncertainty distributions

Journal of Applied Mathematics 3
Φ1, Φ2, . . . , Φ
𝑛, respectively. If 𝑓 is a strictly increasing func-
tion, then
𝜉 = 𝑓 (𝜉1, 𝜉2, . . . , 𝜉
𝑛) (9)
is an uncertain variable with inverse uncertainty distribution
Ψ−1
(𝛼) = 𝑓 (Φ−1
1(𝛼) , Φ
−1
2(𝛼) , . . . , Φ
−1
𝑛(𝛼)) . (10)
Example 10. Let 𝜉 be an uncertain variable with regularuncertainty distribution Φ. Since 𝑓(𝑥) = 𝑎𝑥 + 𝑏 is a strictlyincreasing function for any constants 𝑎 > 0 and 𝑏, the inverseuncertainty distribution of 𝑎𝜉 + 𝑏 is
Ψ−1
(𝛼) = 𝑎Φ−1
1(𝛼) + 𝑏. (11)
Example 11. Let 𝜉1, 𝜉2, . . . , 𝜉
𝑛be independent uncertain vari-
ables with regular uncertainty distributions Φ1, Φ2, . . . , Φ
𝑛,
respectively. Since
𝑓 (𝑥1, 𝑥2, . . . , 𝑥
𝑛) = 𝑥1+ 𝑥2+ ⋅ ⋅ ⋅ + 𝑥
𝑛(12)
is a strictly increasing function, the sum
𝜉 = 𝜉1+ 𝜉2+ ⋅ ⋅ ⋅ + 𝜉
𝑛(13)
is an uncertain variable with inverse uncertainty distribution
Ψ−1
(𝛼) = Φ−1
1(𝛼) + Φ
−1
2(𝛼) + ⋅ ⋅ ⋅ + Φ
−1
𝑛(𝛼) . (14)
Theorem 12 (see Liu [23]). Assume the constraint function𝑔(𝑥, 𝜉
1, 𝜉2, . . . , 𝜉
𝑛) is strictly increasing with respect
to 𝜉1, 𝜉2, . . . , 𝜉
𝑘and strictly decreasing with respect to
𝜉𝑘+1
, 𝜉𝑘+2
, . . . , 𝜉𝑛. If 𝜉1, 𝜉2, . . . , 𝜉
𝑛are independent uncertain
variables with uncertainty distributions Φ1, Φ2, . . . , Φ
𝑛,
respectively, then the chance constraint
𝑀{𝑔 (𝑥, 𝜉1, 𝜉2, . . . , 𝜉
𝑛) ≤ 0} ≥ 𝛼 (15)
holds if and only if
𝑔 (𝑥,Φ−1
1(𝛼) , . . . , Φ
−1
𝑘(𝛼) , Φ
−1
𝑘+1(1 − 𝛼) , . . . , Φ
−1
𝑛(1 − 𝛼))
≤ 0.
(16)
3. DEA Model
In many situations, inputs and outputs are volatile andcomplex so that they are difficult to measure in an accurateway. This inspired many researchers to apply probability toDEA. As we know, probability or statistics needs a largeamount of historical data. In the vast majority of real cases,the sample size is too small (even no sample) to estimate aprobability distribution.Then we have to invite some domainexperts to evaluate their degree of belief that each event willoccur. This section will give some researches to empiricaluncertain DEA using the theory introduced in Section 2.Thenew symbols and notations are given as follows:
DMU𝑖: the 𝑖th DMU, 𝑖 = 1, 2, . . . , 𝑛;
DMU0: the target DMU;
𝑥𝑘= (𝑥𝑘1, 𝑥𝑘2, . . . , 𝑥
𝑘𝑝): the uncertain inputs vector of
DMU𝑘, 𝑘 = 1, 2, . . . , 𝑛;
Φ𝑘𝑖(𝑥): the uncertainty distribution of 𝑥
𝑘𝑖, 𝑘 =
1, 2, . . . , 𝑛, 𝑖 = 1, 2, . . . , 𝑝;𝑥0= (𝑥01, 𝑥02, . . . , 𝑥
0𝑝): the inputs vector of the target
DMU0;
Φ0𝑖(𝑥): the uncertainty distribution of 𝑥
0𝑖, 𝑖 =
1, 2, . . . , 𝑝;𝑦𝑘= (𝑦𝑘1, 𝑦𝑘2, . . . , 𝑦
𝑘𝑞): the uncertain outputs vector
of DMU𝑘, 𝑘 = 1, 2, . . . , 𝑛;
Ψ𝑘𝑗(𝑥): the uncertainty distribution of 𝑦
𝑘𝑗, 𝑘 =
1, 2, . . . , 𝑛, 𝑗 = 1, 2, . . . , 𝑞;𝑦0
= (𝑦01, 𝑦02, . . . , 𝑦
0𝑞): the outputs vector of the
target DMU0;
Ψ0𝑗(𝑥): the uncertainty distribution of 𝑦
0𝑗, 𝑗 =
1, 2, . . . , 𝑞.
3.1. Uncertainty Distributions of Inputs and Outputs. Liuand Ha [38] proposed a questionnaire survey for collectingexpert’s experimental data. It is based on expert’s experimen-tal data rather than historical data. The starting point is toinvite one expert who is asked to complete a questionnaireabout themeaning of an uncertain input (output) 𝜉 like “Howmany is the input (output).”
We first ask the domain expert to choose a possible value𝑥 that the uncertain input 𝜉 may take and then quiz him,
“How likely is 𝜉 less than or equal to 𝑥?”
Denote the expert’s belief degree by 𝛼. An expert’sexperimental data (𝑥, 𝛼) is thus acquired from the domainexpert.
Repeating the above process, we can obtain the followingexpert’s experimental data:
(𝑥1, 𝛼1) , (𝑥2, 𝛼2) , . . . , (𝑥
𝑛, 𝛼𝑛) (17)
that meet the following consistence condition (perhaps aftera rearrangement):
𝑥1< 𝑥2< ⋅ ⋅ ⋅ < 𝑥
𝑛, 0 ≤ 𝛼
1≤ 𝛼2≤ ⋅ ⋅ ⋅ 𝛼
𝑛≤ 1. (18)
Based on those expert’s experimental data, Liu and Ha[38] suggested an empirical uncertainty distribution,
Φ (𝑥)
=
{{{{
{{{{
{
0, if 𝑥 ≤ 𝑥1,
𝛼𝑖+
(𝛼𝑖+1
− 𝛼𝑖) (𝑥 − 𝑥
𝑖)
𝑥𝑖+1
− 𝑥𝑖
, if 𝑥𝑖≤ 𝑥 ≤ 𝑥
𝑖+1, 1 ≤ 𝑖 < 𝑛,
1, if 𝑥 > 𝑥𝑛.
(19)
Assume there are 𝑚 domain experts and each producesan uncertainty distribution. Then we may get 𝑚 uncertaintydistributions Φ
1(𝑥), Φ
2(𝑥), . . . , Φ
𝑚(𝑥). The Delphi method
4 Journal of Applied Mathematics
was originally developed in the 1950s by the RAND Cor-poration based on the assumption that group experience ismore valid than individual experience.Wang et al. [39] recastthe Delphi method as a process to determine the uncertaintydistribution. The main steps are listed as follows.
Step 1. The 𝑚 domain experts provide their expert’s experi-mental data,
(𝑥𝑖𝑗, 𝛼𝑖𝑗) , 𝑗 = 1, 2, . . . , 𝑛
𝑖, 𝑖 = 1, 2, . . . , 𝑚. (20)
Step 2. Use the 𝑖th expert’s experimental data(𝑥𝑖1, 𝛼𝑖1), (𝑥𝑖2, 𝛼𝑖2), . . . , (𝑥
𝑖𝑛𝑖, 𝛼𝑖𝑛𝑖) to generate the 𝑖th expert’s
uncertainty distributionΦ𝑖.
Step 3. ComputeΦ(𝑥) = 𝑤1Φ1(𝑥)+𝑤
2Φ2(𝑥)+⋅ ⋅ ⋅+𝑤
𝑚Φ𝑚(𝑥),
where 𝑤1, 𝑤2, . . . , 𝑤
𝑚are convex combination coefficients.
Step 4. If |𝛼𝑖𝑗− Φ(𝑥
𝑖𝑗)| are less than a given level 𝜀 > 0, then
go to Step 5. Otherwise, the 𝑖th expert receives the summary(Φ and reasons) and then provides a set of revised expert’sexperimental data. Go to Step 2.
Step 5. The last Φ is the uncertainty distribution of the input(output).
3.2. Uncertain DEAModel. Similar to traditional DEAmodel[3], the objective of the uncertain DEA model is to max-imize the total slacks in inputs and outputs subject to theconstraints. Then the uncertain DEA model can be given asfollows:
max𝑝
∑
𝑖=1
𝑠−
𝑖+
𝑞
∑
𝑗=1
𝑠+
𝑗
subject to: 𝑀{
𝑛
∑
𝑘=1
𝑥𝑘𝑖𝜆𝑘≤ 𝑥0𝑖− 𝑠−
𝑖} ≥ 𝛼, 𝑖 = 1, 2, . . . , 𝑝,
𝑀{
𝑛
∑
𝑘=1
𝑦𝑘𝑗𝜆𝑘≥ 𝑦0𝑗
+ 𝑠+
𝑗} ≥ 𝛼, 𝑗 = 1, 2 . . . , 𝑞,
𝑛
∑
𝑘=1
𝜆𝑘= 1,
𝜆𝑘≥ 0, 𝑘 = 1, 2, . . . , 𝑛,
𝑠−
𝑖≥ 0, 𝑖 = 1, 2 . . . , 𝑝,
𝑠+
𝑗≥ 0, 𝑗 = 1, 2, . . . , 𝑞.
(21)
Definition 13 (𝛼-efficiency). DMU0is 𝛼-efficient if 𝑠
−∗
𝑖and
𝑠+∗
𝑗are zero for 𝑖 = 1, 2, . . . , 𝑝 and 𝑗 = 1, . . . , 𝑞, where 𝑠
−∗
𝑖
and 𝑠+∗
𝑗are optimal solutions of (21).
Since the uncertain measure is involved, this definition isdifferent from traditional efficiency definition. For instance,as determined by the choice of 𝛼, there is a risk that DMU
0
will not be efficient even when the condition of Definition 13is satisfied.
Since 𝑗 = 0 is one of the DMU𝑗, we can always get a
solution with 𝜆0
= 1, 𝜆𝑗
= 0 (𝑗 ̸= 0), and all slacks zero.Thus this uncertain DEA model has feasible solution and theoptimal value 𝑠
−∗
𝑖= 𝑠+∗
𝑗= 0 for all 𝑖, 𝑗.
3.3. Deterministic Model. Model (21) is an uncertain pro-gramming model, which is too complex to compute directly.This section will give its equivalent crisp model to simplifythe computation process.
Theorem 14. Assume that 𝑥1𝑖, 𝑥2𝑖, . . . , 𝑥
𝑛𝑖are independent
uncertain inputs with uncertainty distributionΦ1𝑖, Φ2𝑖, . . . , Φ
𝑛𝑖for each 𝑖, 𝑖 = 1, 2, . . . , 𝑝, and 𝑦
1𝑖, 𝑦2𝑖, . . . , 𝑦
𝑛𝑖
are independent uncertain outputs with uncertaintydistribution Ψ
1𝑗, Ψ2𝑗, . . . , Ψ
𝑛𝑗for each 𝑗, 𝑗 = 1, 2, . . . , 𝑞.
Then
𝑀{
𝑛
∑
𝑘=1
𝑥𝑘𝑖𝜆𝑘≤ 𝑥0𝑖− 𝑠−
𝑖} ≥ 𝛼, 𝑖 = 1, 2, . . . , 𝑝,
𝑀{
𝑛
∑
𝑘=1
𝑦𝑘𝑗𝜆𝑘≥ 𝑦0𝑗
+ 𝑠+
𝑗} ≥ 𝛼, 𝑗 = 1, 2 . . . , 𝑞
(22)
holds if and only if
𝑛
∑
𝑘=1,𝑘 ̸=0
𝜆𝑘Φ−1
𝑘𝑖(𝛼) + 𝜆
0Φ−1
0𝑖(1 − 𝛼) ≤ Φ
−1
0𝑖(1 − 𝛼) − 𝑠
−
𝑖,
𝑖 = 1, 2, . . . , 𝑝,
𝑛
∑
𝑘=1,𝑘 ̸=0
𝜆𝑘Ψ−1
𝑘𝑗(1 − 𝛼) + 𝜆
0Ψ−1
0𝑗(𝛼) ≥ Ψ
−1
0𝑗(𝛼) + 𝑠
−
𝑗,
𝑗 = 1, 2, . . . , 𝑞.
(23)
Proof. Without loss of generality, let 𝑖 = 1 and 𝑥0= 𝑥1; then
we will consider the equation
𝑀{
𝑛
∑
𝑘=1
𝑥𝑘1𝜆𝑘≤ 𝑥11
− 𝑠−
𝑖} ≥ 𝛼. (24)
Rewrite (24) as
𝑀{
𝑛
∑
𝑘=2
𝑥𝑘1𝜆𝑘− (1 − 𝜆
1) 𝑥11
≤ −𝑠−
𝑖} ≥ 𝛼. (25)
Since −(1 − 𝜆1)𝑥11
is an uncertain variable which isdecreasing with respect to 𝑥
11, its inverse uncertainty distri-
bution is
Υ−1
11(𝛼) = − (1 − 𝜆
1)Φ−1
11(1 − 𝛼) , 0 < 𝛼 < 1. (26)
For each 2 ≤ 𝑘 ≤ 𝑛, 𝑥𝑘1𝜆𝑘is an uncertain variable whose
inverse uncertainty distribution is
Υ−1
𝑘1(𝛼) = 𝜆
𝑘Φ−1
𝑘1(𝛼) , 0 < 𝛼 < 1. (27)
Journal of Applied Mathematics 5
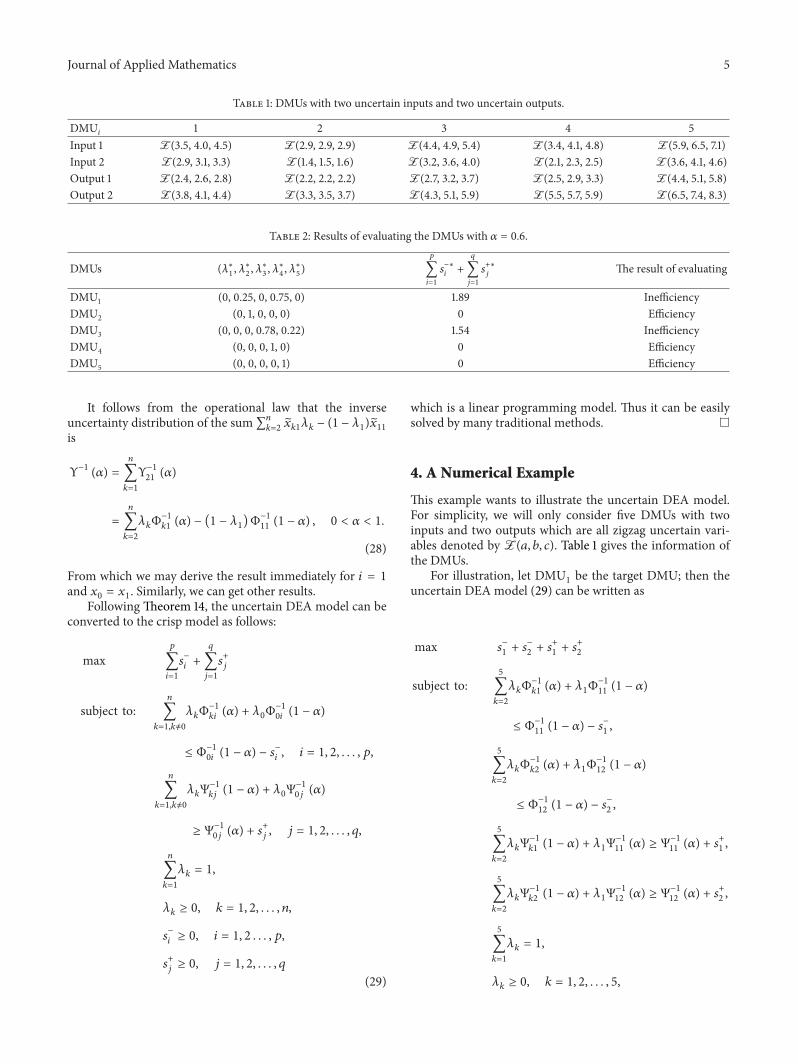
Table 1: DMUs with two uncertain inputs and two uncertain outputs.
DMU𝑖
1 2 3 4 5Input 1 Z(3.5, 4.0, 4.5) Z(2.9, 2.9, 2.9) Z(4.4, 4.9, 5.4) Z(3.4, 4.1, 4.8) Z(5.9, 6.5, 7.1)Input 2 Z(2.9, 3.1, 3.3) Z(1.4, 1.5, 1.6) Z(3.2, 3.6, 4.0) Z(2.1, 2.3, 2.5) Z(3.6, 4.1, 4.6)Output 1 Z(2.4, 2.6, 2.8) Z(2.2, 2.2, 2.2) Z(2.7, 3.2, 3.7) Z(2.5, 2.9, 3.3) Z(4.4, 5.1, 5.8)Output 2 Z(3.8, 4.1, 4.4) Z(3.3, 3.5, 3.7) Z(4.3, 5.1, 5.9) Z(5.5, 5.7, 5.9) Z(6.5, 7.4, 8.3)
Table 2: Results of evaluating the DMUs with 𝛼 = 0.6.
DMUs (𝜆∗
1, 𝜆∗
2, 𝜆∗
3, 𝜆∗
4, 𝜆∗
5)
𝑝
∑
𝑖=1
𝑠−∗
𝑖+
𝑞
∑
𝑗=1
𝑠+∗
𝑗The result of evaluating
DMU1 (0, 0.25, 0, 0.75, 0) 1.89 InefficiencyDMU2 (0, 1, 0, 0, 0) 0 EfficiencyDMU3 (0, 0, 0, 0.78, 0.22) 1.54 InefficiencyDMU4 (0, 0, 0, 1, 0) 0 EfficiencyDMU5 (0, 0, 0, 0, 1) 0 Efficiency
It follows from the operational law that the inverseuncertainty distribution of the sum∑
𝑛
𝑘=2𝑥𝑘1𝜆𝑘− (1 − 𝜆
1)𝑥11
is
Υ−1
(𝛼) =
𝑛
∑
𝑘=1
Υ−1
21(𝛼)
=
𝑛
∑
𝑘=2
𝜆𝑘Φ−1
𝑘1(𝛼) − (1 − 𝜆
1)Φ−1
11(1 − 𝛼) , 0 < 𝛼 < 1.
(28)
From which we may derive the result immediately for 𝑖 = 1
and 𝑥0= 𝑥1. Similarly, we can get other results.
Following Theorem 14, the uncertain DEA model can beconverted to the crisp model as follows:
max𝑝
∑
𝑖=1
𝑠−
𝑖+
𝑞
∑
𝑗=1
𝑠+
𝑗
subject to:𝑛
∑
𝑘=1,𝑘 ̸=0
𝜆𝑘Φ−1
𝑘𝑖(𝛼) + 𝜆
0Φ−1
0𝑖(1 − 𝛼)
≤ Φ−1
0𝑖(1 − 𝛼) − 𝑠
−
𝑖, 𝑖 = 1, 2, . . . , 𝑝,
𝑛
∑
𝑘=1,𝑘 ̸=0
𝜆𝑘Ψ−1
𝑘𝑗(1 − 𝛼) + 𝜆
0Ψ−1
0𝑗(𝛼)
≥ Ψ−1
0𝑗(𝛼) + 𝑠
+
𝑗, 𝑗 = 1, 2, . . . , 𝑞,
𝑛
∑
𝑘=1
𝜆𝑘= 1,
𝜆𝑘≥ 0, 𝑘 = 1, 2, . . . , 𝑛,
𝑠−
𝑖≥ 0, 𝑖 = 1, 2 . . . , 𝑝,
𝑠+
𝑗≥ 0, 𝑗 = 1, 2, . . . , 𝑞
(29)
which is a linear programming model. Thus it can be easilysolved by many traditional methods.
4. A Numerical Example
This example wants to illustrate the uncertain DEA model.For simplicity, we will only consider five DMUs with twoinputs and two outputs which are all zigzag uncertain vari-ables denoted by Z(𝑎, 𝑏, 𝑐). Table 1 gives the information ofthe DMUs.
For illustration, let DMU1be the target DMU; then the
uncertain DEA model (29) can be written as
max 𝑠−
1+ 𝑠−
2+ 𝑠+
1+ 𝑠+
2
subject to:5
∑
𝑘=2
𝜆𝑘Φ−1
𝑘1(𝛼) + 𝜆
1Φ−1
11(1 − 𝛼)
≤ Φ−1
11(1 − 𝛼) − 𝑠
−
1,
5
∑
𝑘=2
𝜆𝑘Φ−1
𝑘2(𝛼) + 𝜆
1Φ−1
12(1 − 𝛼)
≤ Φ−1
12(1 − 𝛼) − 𝑠
−
2,
5
∑
𝑘=2
𝜆𝑘Ψ−1
𝑘1(1 − 𝛼) + 𝜆
1Ψ−1
11(𝛼) ≥ Ψ
−1
11(𝛼) + 𝑠
+
1,
5
∑
𝑘=2
𝜆𝑘Ψ−1
𝑘2(1 − 𝛼) + 𝜆
1Ψ−1
12(𝛼) ≥ Ψ
−1
12(𝛼) + 𝑠
+
2,
5
∑
𝑘=1
𝜆𝑘= 1,
𝜆𝑘≥ 0, 𝑘 = 1, 2, . . . , 5,
6 Journal of Applied Mathematics
Table 3: Results of evaluating the DMUs with different confidence level 𝛼.
𝛼 DMU1 DMU2 DMU3 DMU4 DMU5
0.5 Inefficiency Efficiency Inefficiency Efficiency Efficiency0.6 Inefficiency Efficiency Inefficiency Efficiency Efficiency0.7 Inefficiency Efficiency Inefficiency Efficiency Efficiency0.8 Inefficiency Efficiency Efficiency Efficiency Efficiency0.9 Efficiency Efficiency Efficiency Efficiency Efficiency
𝑠−
1≥ 0,
𝑠−
2≥ 0,
𝑠+
1≥ 0,
𝑠+
2≥ 0.
(30)
Table 2 shows the results of evaluating DMUs with con-fidence level 𝛼 = 0.6. The results can be interpreted in thefollowing way: DMU
1and DMU
3are inefficient, whereas
DMU2, DMU
4, and DMU
5are efficient. Moreover, DMU
3
is more efficient than DMU1from the total slacks ∑𝑝
𝑖=1𝑠−∗
𝑖+
∑𝑞
𝑗=1𝑠+∗
𝑗, since they are both inefficient.
Uncertain efficiencies obtained from model (30) fordifferent confidence levels 𝛼 are shown in Table 3. DMU
1is
inefficient at all confidence levels, whereas DMU2, DMU
4,
and DMU5are always efficient at all levels. It can be seen that
the number of the efficient DMUs is affected by the confi-dence level 𝛼. The higher the confidence level 𝛼 is, the biggerthe number of efficient DMUs is. This phenomena indicatethat uncertain DEA is more complex than the traditionalDEA because of the inherent uncertainty contained in inputsand outputs.
5. Conclusion
Due to its widely practical used background, data envelop-ment analysis (DEA) has become a pop area of research.Since the data cannot be preciselymeasured in some practicalcases, many papers have been published when the inputs andoutputs are uncertain. This paper has given some researchesto uncertain DEA model. A new DEA model as well as itsequivalent deterministic model was presented. For illustra-tion, a numerical example was designed.
Conflict of Interests
The authors declare that they have no conflict of interestsregarding the publication of this paper.
Acknowledgment
This work was supported by National Natural Science Foun-dation of China (nos. 71201005 and 61104132).
References
[1] A. Charnes, W. W. Cooper, and E. Rhodes, “Measuring theefficiency of decision making units,” European Journal of Oper-ational Research, vol. 2, no. 6, pp. 429–444, 1978.
[2] R. D. Banker, A. Charnes, andW.W. Cooper, “Some models forestimating technical and scale efficiencies in data envelopmentanalysis,” Management Science, vol. 30, no. 9, pp. 1078–1092,1984.
[3] A. Charnes, W. W. Cooper, B. Golany, L. Seiford, and J.Stutz, “Foundations of data envelopment analysis for Pareto-Koopmans efficient empirical production functions,” Journal ofEconometrics, vol. 30, no. 1-2, pp. 91–107, 1985.
[4] N. C. Petersen, “Data envelopment analysis on a relaxed set ofassumptions,” Management Science, vol. 36, no. 3, pp. 305–314,1990.
[5] K. Tone, “A slacks-based measure of efficiency in data envelop-ment analysis,” European Journal of Operational Research, vol.130, no. 3, pp. 498–509, 2001.
[6] L. M. Seiford, “A DEA bibliography (1978–1992),” in DataEnvelopment Analysis:Theory,Methodology andApplications, A.Charnes, W. W. Cooper, A. Lewin, and L. Seiford, Eds., KluwerAcademic Publishers, Boston, Mass, USA, 1994.
[7] J. K. Sengupta, “Efficiency measurement in stochastic input-output systems,” International Journal of Systems Science, vol. 13,no. 3, pp. 273–287, 1982.
[8] R. D. Banker, “Maximum likelihood, consistency and dataenvelopment analysis. A statistical foundation,” ManagementScience, vol. 39, no. 10, pp. 1265–1273, 1993.
[9] O. Olesen and N. C. Petersen, “Chance constrained efficiencyevaluation,”Management Science, vol. 141, pp. 442–457, 1995.
[10] R. D. Banker, Stochastic Data Envelopment Analysis, Carnegie-Mellon University, Pittsburgh, Pennsylvania, 1986.
[11] S. Grosskopf, “Statistical inference and nonparametric effi-ciency: a selective survey,” Journal of Productivity Analysis, vol.7, no. 2-3, pp. 161–176, 1996.
[12] W. W. Cooper, Z. Huang, and S. X. Li, “Satisficing DEA modelsunder chance constraints,” Annals of Operations Research, vol.66, pp. 279–295, 1996.
[13] W.W. Cooper, Z. M. Huang, V. Lelas, S. X. Li, and O. B. Olesen,“Chance constrained programming formulations for stochasticcharacterizations of efficiency and dominance in DEA,” Journalof Productivity Analysis, vol. 9, no. 1, pp. 53–79, 1998.
[14] W. W. Cooper, K. S. Park, and G. Yu, “Idea and AR-IDEA:models for dealing with imprecise data in DEA,” ManagementScience, vol. 45, no. 4, pp. 597–607, 1999.
[15] W.W. Cooper, K. S. Park, and G. Yu, “An illustrative applicationof idea (imprecise data envelopment analysis) to a Koreanmobile telecommunication company,”Operations Research, vol.49, no. 6, pp. 807–820, 2001.

Journal of Applied Mathematics 7
[16] W. W. Cooper, K. S. Park, and G. Yu, “IDEA (imprecise dataenvelopment analysis) with CMDs (columnmaximumdecisionmaking units),”The Journal of the Operational Research Society,vol. 52, no. 2, pp. 176–181, 2001.
[17] C. Kao and S. Liu, “Fuzzy efficiency measures in data envelop-ment analysis,” Fuzzy Sets and Systems, vol. 113, no. 3, pp. 427–437, 2000.
[18] T. Entani, Y. Maeda, and H. Tanaka, “Dual models of intervalDEA and its extension to interval data,” European Journal ofOperational Research, vol. 136, no. 1, pp. 32–45, 2002.
[19] L. A. Zadeh, “Fuzzy sets as a basis for a theory of possibility,”Fuzzy Sets and Systems, vol. 1, no. 1, pp. 3–28, 1978.
[20] P. Guo and H. Tanaka, “Fuzzy DEA: a perceptual evaluationmethod,” Fuzzy Sets and Systems, vol. 119, no. 1, pp. 149–160,2001.
[21] S. Lertworasirikul, S. Fang, J. A. Joines, and H. L. W. Nut-tle, “Fuzzy data envelopment analysis (DEA): a possibilityapproach,” Fuzzy Sets and Systems, vol. 139, no. 2, pp. 379–394,2003.
[22] B. Liu, Uncertainty Theory, Springer, Berlin, Germany, 2ndedition, 2007.
[23] B. Liu, UncertaintyTheory: A Branch of Mathematics for Model-ing Human Uncertainty, Springer, Berlin, Germany, 2010.
[24] B. Liu, “Fuzzy process, hybrid process and uncertain process,”Journal of Uncertain Systems, vol. 2, no. 1, pp. 3–16, 2008.
[25] B. Liu, “Some research problems in uncertainty theory,” Journalof Uncertain Systems, vol. 3, no. 1, pp. 3–10, 2009.
[26] B. Liu,Theory and Practice of Uncertain Programming, Springer,Berlin, Germany, 2nd edition, 2009.
[27] B. Liu andX.W.Chen, “Uncertainmultiobjective programmingand uncertain goal programming,” Tech. Rep., 2013.
[28] B. Liu and K. Yao, “Uncertain multilevel programming: algo-rithm and application,” http://orsc.edu.cn/online/120114.pdf.
[29] X. Chen and B. Liu, “Existence and uniqueness theoremfor uncertain differential equations,” Fuzzy Optimization andDecision Making, vol. 9, no. 1, pp. 69–81, 2010.
[30] J. Peng and K. Yao, “A new option pricing model for stocksin uncertainty markets,” International Journal of OperationsResearch, vol. 7, no. 4, pp. 213–224, 2010.
[31] B. Liu, “Extreme value theorems of uncertain process withapplication to insurance riskmodel,” Soft Computing, vol. 17, no.4, pp. 549–556, 2013.
[32] B. Liu, “Uncertain risk analysis and uncertain reliability analy-sis,” Journal of Uncertain Systems, vol. 4, no. 3, pp. 163–170, 2010.
[33] Z. G. Zeng, M. L. Wen, and R. Kang, “Belief reliability: anew metrics for products'reliability,” Fuzzy Optimization andDecision Making, vol. 12, no. 1, pp. 15–27, 2013.
[34] X. L. Gao, “Cycle index of uncertain graph,” Information, vol. 16,no. 2, pp. 1131–1138, 2013.
[35] X. L. Gao and Y. Gao, “Connectedness index of uncertaingraph,” International Journal of Uncertainty, Fuzziness andKnowlege-Based Systems, vol. 21, no. 1, pp. 127–137, 2013.
[36] X. Li, D. Wang, K. Li, and Z. Gao, “A green train schedul-ing model and fuzzy multi-objective optimization algorithm,”Applied Mathematical Modelling, vol. 37, no. 4, pp. 2063–2073,2013.
[37] X. Li and K. Lo Hong, “An energy-efficient scheduling andspeed control approach for metro rail operations,” Transporta-tion Research B: Methodological, vol. 64, pp. 73–89, 2014.
[38] Y.H. Liu andM.H.Ha, “Expected value of function of uncertainvariables,” Journal of Uncertain Systems, vol. 13, pp. 181–186,2010.
[39] X. S. Wang, Z. C. Gao, and H. Y. Guo, “Delphi method forestimating uncertainty distributions,” Information. An Interna-tional Interdisciplinary Journal, vol. 15, no. 2, pp. 449–460, 2012.

Submit your manuscripts athttp://www.hindawi.com
Hindawi Publishing Corporationhttp://www.hindawi.com Volume 2014
MathematicsJournal of
Hindawi Publishing Corporationhttp://www.hindawi.com Volume 2014
Mathematical Problems in Engineering
Hindawi Publishing Corporationhttp://www.hindawi.com
Differential EquationsInternational Journal of
Volume 2014
Applied MathematicsJournal of
Hindawi Publishing Corporationhttp://www.hindawi.com Volume 2014
Probability and StatisticsHindawi Publishing Corporationhttp://www.hindawi.com Volume 2014
Journal of
Hindawi Publishing Corporationhttp://www.hindawi.com Volume 2014
Mathematical PhysicsAdvances in
Complex AnalysisJournal of
Hindawi Publishing Corporationhttp://www.hindawi.com Volume 2014
OptimizationJournal of
Hindawi Publishing Corporationhttp://www.hindawi.com Volume 2014
CombinatoricsHindawi Publishing Corporationhttp://www.hindawi.com Volume 2014
International Journal of
Hindawi Publishing Corporationhttp://www.hindawi.com Volume 2014
Operations ResearchAdvances in
Journal of
Hindawi Publishing Corporationhttp://www.hindawi.com Volume 2014
Function Spaces
Abstract and Applied AnalysisHindawi Publishing Corporationhttp://www.hindawi.com Volume 2014
International Journal of Mathematics and Mathematical Sciences
Hindawi Publishing Corporationhttp://www.hindawi.com Volume 2014
The Scientific World JournalHindawi Publishing Corporation http://www.hindawi.com Volume 2014
Hindawi Publishing Corporationhttp://www.hindawi.com Volume 2014
Algebra
Discrete Dynamics in Nature and Society
Hindawi Publishing Corporationhttp://www.hindawi.com Volume 2014
Hindawi Publishing Corporationhttp://www.hindawi.com Volume 2014
Decision SciencesAdvances in
Discrete MathematicsJournal of
Hindawi Publishing Corporationhttp://www.hindawi.com
Volume 2014 Hindawi Publishing Corporationhttp://www.hindawi.com Volume 2014
Stochastic AnalysisInternational Journal of