research article application of response surface...
TRANSCRIPT

Research ArticleApplication of Response Surface Methodology for Optimizationof Urea Grafted Multiwalled Carbon Nanotubes in EnhancingNitrogen Use Efficiency and Nitrogen Uptake by Paddy Plants
Norazlina Mohamad Yatim1 Azizah Shaaban1 Mohd Fairuz Dimin1
Faridah Yusof2 and Jeefferie Abd Razak3
1Engineering Materials Department Faculty of Manufacturing Engineering Universiti Teknikal Malaysia MelakaHang Tuah Jaya 76100 Durian Tunggal Melaka Malaysia2Department of Biotechnology Engineering Kulliyyah of Engineering International Islamic University MalaysiaPO Box 10 50728 Kuala Lumpur Malaysia3Carbon Research Technology Research Group Engineering Materials Department Faculty of Manufacturing EngineeringUniversiti Teknikal Malaysia Melaka Hang Tuah Jaya 76100 Durian Tunggal Melaka Malaysia
Correspondence should be addressed to Norazlina Mohamad Yatim ly2110hotmailcom
Received 6 June 2016 Accepted 20 July 2016
Academic Editor Valery Khabashesku
Copyright copy 2016 Norazlina Mohamad Yatim et al This is an open access article distributed under the Creative CommonsAttribution License which permits unrestricted use distribution and reproduction in any medium provided the original work isproperly cited
Efficient use of urea fertilizer (UF) as important nitrogen (N) source in the worldrsquos rice production has been a concern Carbon-based materials developed to improve UF performance still represent a great challenge to be formulated for plant nutritionAdvanced N nanocarrier is developed based on functionalized multiwall carbon nanotubes (f-MWCNTs) grafted with UF toproduce urea-multiwall carbon nanotubes (UF-MWCNTs) for enhancing the nitrogen uptake (NU) and use efficiency (NUE)The grafted N can be absorbed and utilized by rice efficiently to overcome the N loss from soil-plant systems The individual andinteraction effect between the specified factors of f-MWCNTs amount (010ndash060wt) and functionalization reflux time (12ndash24 hrs)with the corresponding responses (NUE NU) were structured via the Response Surface Methodology (RSM) based on five-levelCCD The UF-MWCNTs with optimized 05 wt f-MWCNTs treated at 21 hrs reflux time achieve tremendous NUE up to 96and NU at 1180mgpot Significant model terms (119901 value lt 005) for NUE and NU responses were confirmed by the ANOVAHomogeneous dispersion of UF-MWCNTs was observed via FESEM and TEM The chemical changes were monitored by FT-IRand Raman spectroscopy Hence this UF-MWCNTsrsquo approach provides a promising strategy in enhancing plant nutrition for rice
1 Introduction
Nitrogen (N) had a critical role in paddy growth and pro-ductivity as it is required for the synthesis of many essentialmolecules including nucleic acids (DNA and RNA) aminoacids and proteins [1ndash3] Referring to the InternationalFertilizer Association (IFA) in the Fertilizer Outlook forthe years of 2013ndash2017 the global N demand was projectedto grow into 1075 million metric tons of N This scenarioshows the larger demand for N by the agricultural sectorEven though N based fertilizers were supplied directly tothe crops in the form of liquid and pelletized however
increasing the NUE and NU was tremendously difficultas plants normally take up N in the form of nitrate orammonium ions [4] It was reported that between 50 and 70of the nitrogenous fertilizer is lost through leaching and gasemission of ammonia and nitrogen oxides to the atmosphere[5] These may contribute to unfavourable environmentalimpact and higher operational cost to farmers Uncontrolledapplications of UF create an adverse effect on aquatic lifedue to eutrophication which had caused an excessive algaegrowth Therefore high NUE and NU of fertilizer N areimportant characteristics to ensure enough and lower cost Nsource for efficient paddy growth
Hindawi Publishing CorporationJournal of NanotechnologyVolume 2016 Article ID 1250739 14 pageshttpdxdoiorg10115520161250739
2 Journal of Nanotechnology
Recent development in carbon nanomaterials includ-ing MWCNTs as smart delivery system for efficient plantgrowth was widely explored due to their interface with plantorganelles imparting new and enhanced function of this partEarlier research on smart delivery systems in agriculturewas reported on the delivery of pesticides encapsulated incarbon NMs for UV-shielding [6] and assisted delivery ofgenetic material for crop improvement [7] The potentialapplications of nanomaterials in the agricultural sector havebeen highlighted in the previous research conducted byGhormade et al [8] and Wilson et al [9] Nanomaterialshad potential applications in assisting the control and slowrelease of fertilizer due to their unique properties of specifictargets with multifunctional characteristics avoiding biolog-ical barriers for a high effect [10] In fact nanomaterials hadbeen proven to be able to increase the agriculture yield byoptimizing the nutrient management of the plants [11ndash16]Nanomaterials delivery system is targeting the plant to takeup nutrients efficiently and enhance the germination rate ofplants by improving the intake of water as well as oxygen[17 18] Hence leaching and losses of nutrients to unintendedtargets like soil are reduced
Owing to their special physicochemical propertiesMWCNTs having transport properties [19] and unique abilityas molecular delivery through plant cells wall [20] whichstimulates crop growth improve the soil environment andpromote crop growth metabolism [21ndash23] These scenariosmade MWCNTs very promising for recent progress in theagricultural research activities and utilization Research onthe impact of carbon-based nanomaterials combined withfertilizer on plants was reported by Liu et al [24] They hadfound that the presence of nanomaterials has increased theyield and quality of winter wheat crop indicating a significantsaving effect on the utilization of nitrogenous type fertilizer Astudy of the effects of carbon nanomaterials fertilizer on laterice by Yin-fei et al [25] in the double rice season area at thesouth of China revealed that the use of carbon NMs fertilizerwould increase the number of glume flowers per year fertilityand the rice yield Concurrently the carbon nanomaterialsfertilizer was observed to slow down the fertilizer releaserate hence reducing the amount of fertilizer utilizationimproving the NUE These positive results agreed well withthe role of carbon nanomaterials in fertilizer application forthe enhancement of plant growth and yield Hence thisencouraged further research to be undertaken in exploringthe potential of nanomaterials to be integrated or embeddedwith fertilizer for the sake of agricultural field This efforthad improved the efficacy of nitrogenous based fertilizerespecially in urea for paddy growth purposes
In this study development of such enhanced UF com-bined with f-MWCNTs was systematically structured bythe statistical design for an optimum operational conditiondetermination The empirical statistical technique utilizingthe Response Surface Methodology (RSM) was applied todetermine the regression model and optimum operatingcondition as well as the interaction effects of design factorsonto the desired responses studied [26ndash28] This analysisapproach is suitable for a multifactor experiment in deter-mining the correlation effects between the factors of the
most optimum processing condition The objective of thiswork is to determine the effects of several design factors likef-MWCNTs wt and functionalization reflux time on theperformance of UF-MWCNTs in terms of their NUE NUand Total Dry Weight (TDW) using the CCD approach viaRSM analysis by Design Expert 90 Stat Ease USA
2 Materials and Methods
21Materials Chemical vapour deposition grownMWCNTswere purchased from a commercial source (stock 214 CahayaTech (M) Private Ltd) The MWCNTs were characterized bythe company as follows purity of 95 outside diameter of10ndash20 nm inside diameter of 5ndash10 nm and length rangingfrom 05 120583m to 10 120583m Analytical chemical grade (Merck) ofnitric acid (HNO
3) (69) was used as received Rice plants
(code MR219) were collected from farmers at Tanah MerahKelantan Malaysia MR219 paddy variety was selected inthis work considering the varietyrsquos common availability inthe Malaysian local market and easy-growing nature MR219was derived between the MR137 and MR151 with maturationperiod of 105ndash111 days after sowing This variety was releasedfor the commercialization by the Malaysian AgriculturalResearch and Development Institute (MARDI) on the yearof 2001 [29]
22 Preparation of UF-MWCNTs Fertilizer Typically 150mgof as-received MWCNTs was added to a 500-mL roundbottom flask containing 450mL of nitric acid for function-alization process After being refluxed at 100∘C for 12 15 1821 and 24 h the suspension was naturally cooled down toroom temperature The black solution known as f-MWCNTswas vacuum-filtered using a 3 120583m particle retention filterpaper and washed with deionized water to remove excessHNO
3until it became neutral The f-MWCNTs were dried
in a vacuum oven at 105∘C for at least 2 hrs Various amounts(01ndash06 wt) of f-MWCNTs were sonicated and then stirredtogether with urea for 6 hrs at 150 rpm to produce UF-MWCNTsThe samples were dried in oven at 70∘C for at least5 hours
23 Plant Materials and Growth Conditions TheMR219 riceseeds were rinsed thoroughly soaked for 24 hrs in water andgerminated in plastic containers Seedlings were transferredinto pots containing rice field soil of 02 N-content Aftersowing the UF-MWCNTs fertilizer was applied three times(at 14 35 and 55 days) with a rate of 120 kg haminus1 Ordinaryfertilizers such as phosphorus (DAP) and potassium (muriateof potash) were applied once at a rate of 50 kghaminus1
24 Optimization by Response Surface Methodology (RSM)In order to determine the optimum level of design parametersfor UF-MWCNTs fertilizer production Central CompositeDesign (CCD) of RSM was applied The selected designparameters used are in accordance with the previous workreported by [30] The weight of f-MWCNTs and func-tionalization reflux time were assessed at five levels minus1682minus1 0 +1 and +1682 as presented in Table 1 A total of13 experiments (refer to Table 2) were conducted for the
Journal of Nanotechnology 3
Table 1 Experimental codes and levels of independent variables forRSM optimization
Variables Units Levelsminus1682 minus1 0 +1 +1682
MWCNTs1198831
wt 01 02 03 05 06Functionalizationreflux time119883
2
Hour 12 15 18 21 24
Table 2 Experimental design matrix
Run Factor 1MWCNTs (wt)
Factor 2Functionalizationreflux time (hour)
1 06 18002 03 18003 03 24004 03 18005 03 18006 03 12007 05 21008 01 15009 02 180010 01 210011 03 180012 05 150013 03 1800
optimization of two chosen design factors The responseswere NUE NU and TDW with three replications for everyset of trials
25 Statistical Analysis and Modelling The experimentalresults were fitted into the second-order polynomial regres-sion equation (refer to (1)) and the analysis of variance(ANOVA) was conducted
119884 = 120573∘+sum
119894
120573119894119883119894+sum
119894119894
1205731198941198941198832
119894119894+sum
119894119895
120573119894119895119883119894119883119895 (1)
in which 119884119894is the predicted response 119883
119894and 119883
119895are inde-
pendent variables 120573∘is the offset term 120573
119894is the 119894th linear
coefficient 120573119894119894is the 119894th quadratic coefficient and 120573
119894119895is the
119894119895th interaction coefficient [31]The statistical software package Design Expert 9 (Stat
Ease Inc Minneapolis MN USA) was used for the regres-sion analysis of the experimental data and also to plotthe response surface graphs The multiple coefficients ofcorrelation 119877 and the determination coefficient of corre-lation 1198772 were calculated to evaluate the performance ofthe regression equation [32] The fitted polynomial equationwas then expressed in the form of three-dimensional (3D)surface plots in order to illustrate the relationship betweenthe responses and the experimental levels of each designfactors tested in this study The point optimization methodwas employed in order to optimize the level of each variable
for maximum response The optimum levels of the selectedvariables were obtained by analyzing the response surfaceplots [33]
26 Morphological Observation Using Transmission ElectronMicroscopy (TEM) and Field Emission Scanning ElectronMicroscope (FESEM) Samples were cut with Leica UltracutUCTultramicrotome into ultrathin sections of approximately80 nm thick and then cooled using liquid N before beingplaced onto copper grid Next morphological studies wereconducted by using Hitachi HT-7700 Transmission Elec-tron Microscopy (TEM) Further Field Emission ScanningElectron Microscope (FESEM) was performed using modelHitachi SU8000 where point and mapping for elementalcomposition were also carried out using Energy DispersiveX-Ray (EDX) Analysis
27 Chemical Characterization Fourier transformed-IR (FT-IR) spectra were used to confirm the functional groups of f-MWCNTs and UF-MWCNTs fertilizer obtained on a JascoFTIR-6100 with attenuated total reflectance (ATR) methodEach sample was scanned with resolution 4 cmminus1 withinthe range 400ndash4000 cmminus1 to obtain the spectrum Ramanspectroscopy was carried out with excitation laser source532 nm UniRAM-3500 micro Raman Mapping chamber
28 Plant Yield Analysis Harvested plants were dried in anoven at 100∘C for 24 hours and individual weights wererecorded as Total Dry Weight (TDW) Consequently theywere ground for total N-content analysis According to theKjeldahlmethod [6] the content of N (119908N) inmilligrams pergram is calculated using the following formula
119908N =(V1minus V0) 119888 (119867
+)119872N100
(119898 times 119898119905)
(2)
where V1is the volume in mL of the sulfuric acid used in the
titration of the sample V0is the volume in millilitres of the
sulfuric acid used in the titration of the blank test 119888(119867+) isthe concentration of119867+ in the sulfuric acid in moles per litre(eg if 001molL sulfuric acid is used 119888(119867+) = 002molL)119872N is the molar mass of N in grams per mole (14) 119898 is themass of test sample and 119898
119905is the dry residue expressed as
g100 g on the basis of oven dried material according to thestandard of the spatial material
Furthermore NUE analysis was carried out in isotopic-aided fertilizer experiments where UF-MWCNTs fertilizerlabelled with 15N urea isotope (5 atom Isotec) is usedand the amount of N fertilizer that a plant has taken up isdeterminedTheplant samples for 15Nwere analyzed by usingemission spectrometer detector (NO
17) FAN (Fischer Anal-
ysen Instrumente) Germany In this way N fertilizer uptakeand use by paddy can be studied Basically 2 atom 15Nureawas enough to be detected by the emission spectrometerFertilizer N utilization by crops and retention in the soil were
4 Journal of Nanotechnology
calculated using 15N direct technique calculation as showedin [34]
Ndff =atom15Nexcess
(plant)
atom15Nexcess(fertilizer)
times 100
N uptake by plant = Dry weightplant timesN100
Fertilizer N uptake by plant
= N uptake by plant timesNdffplant100
Fertilizer N utilization by plant
=Fertilizer N uptake by plant
N appliedtimes 100
(3)
where Ndff is fraction of N in the plant derived from the 15Nlabelled fertilizer
3 Results and Discussion
31 The Morphological Observation of f-MWCNTs and UF-MWCNTs Using Transmission Electron Microscopy (TEM)The morphologies of f-MWCNTs and urea-MWCNTs (UF-MWCNTs) were shown in Figures 1(a)ndash1(f) Prior to strongacid treatment the f-MWCNTs exhibit the presence of manyopened endsrsquo tube without significantly altering their side-walls structure Figure 1(a) had revealed that the morphologyof f-MWCNTs up to 21 hrs oxidation period still retainedtheir hollow nanotubes structure with proper alignmentof multiwalls Besides the f-MWCNTs having relativelyhigh concentration of COOH groups on the MWCNTswhich have been confirmed through FT-IR evaluation laterappeared to possess long tubes and separated into individualnanotubes By careful examination the nitric acid treatmentlimits functionalization processmostly to the opening of tubecaps and formation of functional groups at the defect sitesalong the sidewalls as can be seen in Figures 1(b) and 1(c)However it was also reported that the carboxylic functionalgroups that were detected at the open end and at the sidewallof MWCNTs were introducing the damage on the tube wallsand shorten the tubes length [35] Yet as revealed in Figures1(b) and 1(c) under less vigorous conditions of refluxingin nitric acid shortening of the tubes might be minimizedAdditionally the presence of carboxyl groups and attachmentof UF on f-MWCNTs lead to a reduction of van der Waalsinteractions among the tubes which strongly facilitates theseparation of nanotube bundles into individual tubes as canbe seen clearly in Figures 1(a) and 1(d)
Furthermore the two-step functionalization of nan-otubes through the oxidative introduction of carboxyl groupsfollowed by the formation of amide or ester linkages throughthe interaction with UF does allow for a significant effecton the restructuring aligned MWCNTs By comparisonFigure 1(d) showed clearly rougher and nonaligned sidewallswith shorter MWCNTs after being grafted with UFThere arealso more opened end tubes observed Additionally grafting
the amide groups on the carboxyl groups at the f-MWCNTssurfaces does not change the hollow nanotubes structure
By examining carefully f-MWCNTs (Figures 1(a)ndash1(c))and UF-MWCNTs (Figures 1(d)ndash1(f)) there were differencesin their open end tubes Figures 1(e) and 1(f) reveal that theopenings of f-MWCNTs after grafting with UF were not inuniform cutting and broader in area This might be stronglythe effect of grafting process which occured at the openend nanotubes where most carboxyl groups were availableafter nitric acid treatment Though the size of inside andoutside diameter of nanotubes does not show significantchanges the hollow structure of f-MWCNTs grafted withUF seems to be narrower due to unaligned sidewalls Theseresults could indicate that even grafting process as reactionof f-MWCNTs with UF further opening more nanotubesends modifying their sidewalls and cutting the MWCNTsinto shorter nanotubes still retains their nanotubes structureto be explored as unique mobile properties for efficient Ndelivery
32 Dispersion Observation of UF-MWCNTs Using FieldEmission Scanning Electron Microscope (FESEM) Figure 2illustrates FESEM micrographs of UF-MWCNTs fertilizerGenerally as shown clearly in Figure 2(a) the morphol-ogy of UF shows much bigger particle range from 10 to100 120583m compared to f-MWCNTs (10ndash20 nm) Using highermagnification their dispersion behaviour was illustrated inFigures 2(b) and 2(c) f-MWCNTs were found dispersedhomogeneously on the surface of urea particles This excel-lent biocompatibility is conveyed by hydrophilic propertiespossessed by f-MWCNTs affording a stable dispersion [36]in UF This makes the UF surfaces become rougher andabundant with f-MWCNTs attached However addition of f-MWCNTs in a small quantity (01ndash06 wt) results in theirhomogeneous dispersion performance shown only at certainurea particles The f-MWCNTs are able to penetrate intothe bigger particles of UF and chemically interact withthem Positively this observation will be managed to exposethe properties of UF-MWCNTs for agriculture applicationeffectively
Additionally usingmuchhighermagnification of FESEMthe individual tubular structures of f-MWCNTswere observedclearly in Figure 2(d) instead of being agglomerated amongeach other These findings were important to promote theability of f-MWCNTs to be N molecular carrier in UF-MWCNTs fertilizer into the plant cell wall This is in agree-ment with Liu et al [20] that reported that nonbundled f-MWCNTs can penetrate plant cell wall with no apparentcell death observed Also aggregates MWCNTs that willretain exist in the soil and reveal toxicity properties werereported elsewhere [37ndash39] They will clump together andcause cells apoptosis and increase of response oxidative stress(ROS) and when reaching living cells resulted in cell viabilityreduction and cell death even in low concentration [40]Hence thismorphological observation is important to ensurethat the f-MWCNTs are separated into individual tubes wheninteracting with UF Furthermore their ability to be mobilefreely and carry N efficiently for plant nutrition can beutilized significantly
Journal of Nanotechnology 5
1 120583m
(a)
100 nm
885 nm 148 nm
(b)
100 nm
177 nm
849nm
126 nm
696nm
(c)
1 120583m
(d)
100 nm
162 nm392nm
(e)
100 nm
589 nm
215 nm
(f)
Figure 1 TEMmicrographs of (andashc) functionalized multiwall carbon nanotubes and (dndashf) urea grafted multiwall carbon nanotubes
33 Surface Functional Group Determination by FourierTransformed Infrared Spectroscopy (FT-IR) FT-IR aims tostudy any spectral changes in position or shape that occurredafter grafting f-MWCNTs with UFThrough careful examina-tion on the FT-IR spectra of f-MWCNTs and UF-MWCNTsillustrated in Figure 3 it is strongly suggested that covalentbonds occurred between NH
2groups of UF and carboxyl
groups of f-MWCNTs upon reactions between urea and f-MWCNTs The spectra of f-MWCNTs mainly characterized
by bands at 3300ndash2500 (O-H stretching vibration) 1700ndash1725 cmminus1 (C=O stretching vibration) and 1210ndash1320 cmminus1(C-O stretching vibration) correspond to the vibrationof the carboxylic acid groups [41] In the IR spectra ofUF-MWCNTs the bands around 1640ndash1690 cmminus1 1510ndash1600 cmminus1 1376ndash1388 cmminus1 and 1120ndash1290 cmminus1 could beassigned to C=O stretching vibration N-H bending CH
2
bending and C-N stretching These spectral characteristicsare attributed to amide [41]
6 Journal of Nanotechnology
Urea
f-MWCNTs
50120583m
(a)
5120583m
(b)
5120583m
(c)
5120583m
(d)
Figure 2 FESEMmicrographs of UF-MWCNTs fertilizer
20
40
60
80
100
120
900 1200 1500 1800 2100 2400 2700 3000 3300 3600
Tran
smitt
ance
()
O-H
CO-H C=OC-O
N-H bendingN-C-N
stretching
N-H stretching
(a) f-MWCNTs
(a)
(b)
(c)
Wavenumber (cmminus1)
(b) UF-MWCNTs (05 wt)(c) UF-MWCNTs (01wt)
Figure 3 FT-IR spectra of (a) f-MWCNTs and UF-MWCNTs with(b) 05 wt f-MWCNTs and (c) 01 wt f-MWCNTs
Basically the chemically inactive outer walls ofMWCNTswill be activated through functionalization process on theirsidewalls Chemical functionalization is based on the pro-duction of covalent bond between the functional groups withthe carbon of MWCNTs [42] It can be performed at the endcaps of nanotubes or at their sidewalls which may have manydefects
Any changes in peak position or shape reveal a changehas happened in the distribution of frequencies includedin that particular vibration mode By comparing the FT-IR spectra of f-MWCNTs with UF-MWCNTs it could be
seen that the transmission peak of O-H stretching vibrationat 3018 in the IR spectrum of f-MWCNTs disappeared inthe IR spectrum of both UF-MWCNTs at different amountstrongly indicating that theO-H groups in f-MWCNTsmightbe replaced with the amino groups in the UF during thefunctionalization process Also C=O (1739 cmminus1) and C-O (1219 cmminus1) stretching vibration attributed to f-MWCNTswere observed to be replaced with new shape of transmissionpeak that appears corresponding to N-H bending and C-Nstretching vibration at 1519 and 1219 cmminus1 respectively aftergrafting process with UF Similar observation was reportedby Gao et al [43] that claimed that NH
2groups from UF can
react with the carboxyl groups (COOH) on the surface of f-MWCNTs and produce amide groups Thus the results fromthe FT-IR spectra confirm that chemical functionalizationhas occurred between f-MWCNTs andUF instead of physicalfunctionalization (noncovalent) only
34 Raman Spectroscopy Analysis Raman spectroscopy anal-ysis is highly sensitive to the morphology structures ofgraphitic materials such as MWCNTs and aims to determineparticular spectral changes induced by covalent functional-ization Figure 4 depicts Raman analysis of f-MWCNTs incomparison to pristine MWCNTsThree characteristic peaksconcernedwithMWCNTswere theirD-band at 133333 cmminus1G-band at 1572 cmminus1 and second-order harmonic G1015840-band at267754 cmminus1 [44 45] Clearly from Figure 4 the tangentialG-band derived from the graphite-like in-plane mode [46]was still retained after functionalization at 21 hrs reflux timerevealing that the graphitic carbon structure with sp2 bonds
Journal of Nanotechnology 7
7800
8300
8800
1080 1280 1480 1680 1880 2080 2280
(a)
(b)
2480 2680
7800
8300
8800
1080 1280 1480 1680 1880 2080 2280 2480 2680
133333 1572 267754D-band G-band
Raman shift (cmminus1)
Raman shift (cmminus1)
G998400-band
Figure 4 Raman spectra of (a) 21 hrs f-MWCNTs in comparison to(b) MWCNTs
of f-MWCNTs was preserved Besides the presence of irreg-ularities in the structure is showed by lower D-band and G1015840-band compared to G-band observed in Figure 4 reflecting f-MWCNTs samples with high purification and low impuritiesBasically the Raman spectra ofMWCNT are usually showinga very intense D-band and a significant broadening effect[47] which is similar to the spectra of chars and carbonblacks Referring to Figure 4 it was observed that covalentfunctionalization of f-MWCNTs does not generally resultin obvious changes in D-band-to-G-band intensity ratios(119868D119868G) Similar observationwas also reported elsewhere [48ndash50] This reveals that functionalization process is resultingmuch in opening the end cap of multiwall nanotubes onlyrather than destructing the whole multiwall structure
Figure 5 shows the Raman spectra of UF-MWCNTs incomparison to conventional UF Here the Raman spectra arecollected over the 900ndash1700 cmminus1 spectral range correspond-ing to fundamental modes associated with C-N molecularbonds [51 52] The most pronounced Raman feature in thespectrum subjected to UF is a strong sharp and narrow peakaround sim1000 cmminus1 for both UF-MWCNTs and UF samplesThis is the characterization Raman peak for highly crystallinestructure of urea [53] Urea bands centered at around sim1000 and sim1170 cmminus1 correspond to N-C-N stretching andNH2rocking respectively [54 55] These two important
bands correlated with UFweremaintained after grafting with21 hrs f-MWCNTs revealing the success of grafting process inproducing high performance UF-MWCNTs fertilizer
Significantly the characteristic absorption peak for 21 hrsf-MWCNTs which is D-band at 133333 cmminus1 was stronglyattenuated with new peak observed at 1459 cmminus1 for UF-MWCNTs after urea was grafted to f-MWCNTs Further-more the G-band at 1572 cmminus1 for f-MWCNTs was split intotwo peaks at 15425 and 15711 cmminus1 for UF-MWCNTs sampleThis observation might be strongly correlated to graftingprocess of N from UF to f-MWCNTs that takes place atopened end tubes and significantly changes their graphiticstructure
Table 3 Results of CCD
Run Response 1NUE
Response 2NU
Response 3TDW
1 8629 118212 236952 8616 110000 185003 8520 134475 181414 8500 110000 175005 8625 118160 182226 8385 125630 153637 9635 136355 170528 7138 97784 152119 8650 118502 1981710 8109 113447 2009511 8667 118741 1740912 7546 108731 1619313 9000 118900 17388
35 Statistical Analysis of Responses Studied The optimumconditions for fertilizer NU NUE and TDW of rice growthwere determined by means of the Central Composite Design(CCD) of RSM The overall results are shown in Table 3For UF-MWCNTs fertilizer the obtained responses werevaried between 71 and 96 978 and 1363mgpot and 152and 237 gpot for NUE NU and TDW respectively Severalresearchers have conducted studies on NUE attainments forrice plant under N fertilizer treatments [56ndash58] RecentlyHashim et al [56] reported that the NUE of MR219Malaysian local rice variety under standard UF treatmentreached up to 50 The remaining 50 of N from theapplied fertilizer either remained in the soil or was lostto the environment Similarly low NUE by rice also werereported elsewhere [59 60] Accordingly the NUE of UFfor rice treatment is still relatively low and led to uncon-trolled utilization in larger amount as to ensure efficient ricegrowth and high rice yield Thus apparently application ofUF-MWCNTs to rice plants enhances the NUE responsesignificantly Subsequently the results ofNUENU andTDWas responses for rice treated with UF-MWCNTs structuredby RSM with CCD were presented in Table 3 and theircorresponding equations are listed in Table 4
The analysis of variance for response surface quadraticmodel of NUE to test its adequacy was shown in Table 5 Themodelling equation in terms of both coded and actual factorsto represent the NUE (119884
1) was listed in Table 4 that was
evaluated by the regression coefficients 119865-values 119901 valuescorrelation coefficient (119877) and the determination coefficient(1198772) The proposed model suggests that the amount of f-MWCNTs (119883
1) and the functionalization reflux time (119883
2)
had a significant effect on NUE response The coefficientof determination value (1198772 = 08805) indicates that theresponse model can explain about 88 of the total variationsAdditionally the coefficient of adjusted determination value(Adj 1198772 = 07952) was also high enough to indicate thesignificance of the selected model The model 119865-value of1032 implies that the model is significant It means that
8 Journal of Nanotechnology
Table 4 Final equations to predict the responses as a function of specified design factors (a1198831and b1198832) in terms of coded and actual factors
for parameters
Responses Coded factors Actual factors
Nitrogen use efficiency (NUE) (1198841)
1198841= 864 + 483119883
1+ 444119883
2
+ 27911988311198832minus 339119883
2
1minus 174119883
2
2
1198841= 723759 minus 892803119883
1
+ 7062141198832+ 465833119883
11198832
minus 84644471198832
1minus 019386119883
2
2
Nitrogen uptake (1198842)
1198842= 118123 + 8147119883
1+ 5081119883
2
+ 299011988311198832minus 5894119883
2
1+ 2856119883
2
2
1198842= 191897352 + 39443873119883
1
minus 112272171198832+ 4983750119883
11198832
minus 1473607191198832
1+ 317386119883
2
2
Total Dry Weight (TDW) (1198843)
1198843= 17520 + 168119883
1
+ 9421198832minus 1006119883
11198832
+ 15251198832
1minus 383119883
2
2
1198843= 7785286 + 8147131119883
1
+ 23480601198832minus 1677083119883
11198832
+ 381374621198832
1minus 042530119883
2
2
a1198831 is amount of f-MWCNTs
b1198832 is functionalization reflux time
Table 5 Analysis of variance for NUE using CCD
Source Sum of squares Degree of freedom Mean square 119865-value 119901 valueModel 46290 5 9258 1032 00040a1198831
11967 1 11967 1334 00082b1198832
23674 1 23674 2639 0001311988311198832
3125 1 3125 348 010421198832
15266 1 5266 587 00459
1198832
27380 1 7380 823 00241
Residual 6280 7 897Lack-of-Fit 6280 3 2093Pure error 0000 4 0000Cor total 52570 12119877-Squared = 08805 Adj 119877-Squared = 07952 Pred 119877-Squared = minus11297 Adeq Precision = 11202a1198831 is amount of f-MWCNTs
b1198832 is functionalization reflux time
0
40000
80000
120000
160000
200000
860 1060 1260 1460 1660 1860 2060 2260
10053
11736 1459415425
15711
Raman shift (cmminus1)
(a)
050000
100000150000200000250000300000350000
860 1060 1260 1460 1660 1860 2060 2260
10091
11756 1537715769
Raman shift (cmminus1)
(b)
Figure 5 Raman spectra of (a) UF-MWCNTs in comparison to (b) UF
there is only about 040 chance that 119865-value this largecould occur due to noise 119901 values less than 00500 indicatethat the model terms are also significant In this case theindividual effects of 119883
1 1198832 11988321 and 1198832
2are significant
model terms However insignificant 119901 value was found forthe interaction (119883
11198832) between the design factors Even an
insignificant 119901 value does not automatically specify that the
particular research project has ldquofailed to disprove the nullhypothesisrdquo [61] but here in this case conclusions shouldonly be made after consideration of other significant factorsand primary objectives of the study Hence the amount off-MWCNTs (119883
1) and the functionalization reflux time (119883
2)
had a significant positive effect individually onNUE responseby paddy NUE response increasedwith increasing amount of
Journal of Nanotechnology 9
Table 6 Analysis of variance for N uptake using CCD
Source Sum of squares Degree of freedom Mean square 119865-value 119901 valueModel 9396846 5 1879369 518 00263a1198831
3408830 1 3408830 939 00182b1198832
3098495 1 3098495 854 0022311988311198832
357664 1 357664 099 035391198832
11596055 1 1596055 440 00742
1198832
21978029 1 1978029 545 00522
Residual 2540124 7 362875Lack-of-Fit 2423177 3 807726 2763 00039Pure error 116947 4 29237Cor total 1194119864 + 005 12119877-Squared = 07872 Adj 119877-Squared = 06352 Pred 119877-Squared = minus21426 Adeq Precision = 8519a1198831 is amount of f-MWCNTs
b1198832 is functionalization reflux time
Table 7 Analysis of variance for Total Dry Weight (TDW) using CCD
Source Sum of squares Degree of freedom Mean square 119865-value 119901 valueModel 360626 5 72125 210 01799a1198831
1457 1 1457 0042 08426b1198832
106390 1 106390 310 0121611988311198832
40502 1 40502 118 031321198832
1106903 1 106903 312 01208
1198832
235518 1 35518 104 03427
Residual 240072 7 34296Lack-of-Fit 240027 3 80009 705421 lt00001Pure error 045 4 011Cor total 600698 12119877-Squared = 06003 Adj 119877-Squared = 03149 Pred 119877-Squared = minus23503 Adeq Precision = 5643a1198831 is amount of f-MWCNTs
b1198832 is functionalization reflux time
f-MWCNTs (1198831) and the functionalization reflux time while
the interaction between 1198831and 119883
2had a negative effect on
NUE responseAnegative ldquoPredR-Squaredrdquo implies that the overallmean
is a better predictor of NUE than the current model ldquoAdeqPrecisionrdquo which measures the signal-to-noise ratio was atabout 11202 indicating an adequate signal A ratio greaterthan 4 is desirable Hence this model can be used to navigatethe design space
Furthermore the ANOVA for response surface quadraticmodel of NU to test its adequacy was presented in Table 6The modelling equations in terms of both coded and actualfactors to represent theNU (119884
2) were listed inTable 4 Similar
to NUE the proposed model suggests that the amount of f-MWCNTs (119883
1) and functionalization reflux time (119883
2) had a
significant effect onNUby paddy treatedwithUF-MWCNTsHere the coefficient of determination value (1198772 = 07872)indicates that the response model can explain about 79of the total variations which is lower than NUE responseAdditionally the coefficient of adjusted determination value(Adj 1198772 = 06352) was also high enough to indicate thesignificance of the model The model 119865-value of 518 implies
that the model is significant There is only a 263 chancethat 119865-value this large could occur due to noise 119901 value of00263 which is less than 00500 implies that themodel termis significant In comparison with NUE in this case 119883
1and
1198832only are significantmodel terms Individually the increase
in amount of f-MWCNTs and the functionalization refluxtime positively increase the NU response by paddy while theinteraction between the ldquoLack-of-Fit119865-valuerdquo of 2763 impliesthat there is only 039 chance that a ldquoLack-of-Fit 119865-valuerdquothis large could occur due to noise Again a negative ldquoPred119877-Squaredrdquo suggests that the overall mean is a better predictorofNU than the current suggestedmodel Furthermore ldquoAdeqPrecisionrdquo of 8519 indicates an adequate signal Thus thismodel also can be used to navigate the design space
Next the ANOVA for response surface quadratic modelof TDW to test its adequacy was shown in Table 7 The mod-elling equations in terms of both coded and actual factors torepresent the TDW (119884
3) were listed in Table 3 Contradicting
with NUE and NU responses the proposed model suggestedthat the amount of f-MWCNTs (119883
1) and functionalization
reflux time (1198832) had not provided a significant effect onTDW
of paddy treated with UF-MWCNTs Here the model shows
10 Journal of Nanotechnology
Normal plot of residualsN
orm
al
pro
babi
lity
99
95
90
80
70
50
30
20
10
5
1
Externally studentized residualsminus1000 minus500 000 500 1000
(a)
Normal plot of residuals
Nor
mal
p
roba
bilit
y
99
95
90
80
70
50
30
20
10
5
1
Externally studentized residualsminus1000 minus800 minus600 minus400 minus200 000 200 400 600
(b)
Figure 6 Design Expert plot Normal probability plot of the standardized residual for NUE (a) and NU (b)
that the coefficient of determination value (1198772 = 06003)indicates that the TDW response model only can explainabout 60 of the total variations which is much lower thanNUE andNU responsesMoreover the coefficient of adjusteddetermination value (Adj 1198772 = 03149) was also too low toindicate the significance of the model It means that about6851 of total variation of the TDW response was notexplained by the model The model 119865-value of 210 impliesthat the model is not significantly relative to the noise factorThis result implies that there is a 1799 chance that 119865-valuethis large could occur due to noise 119901 values of less than00500 indicate that model terms are significant Howeverin this case no significant model terms were detected TheldquoLack-of-Fit 119865-valuerdquo of 705421 implies that there is onlyabout 001 chance that a ldquoLack-of-Fit 119865-valuerdquo this largecould occur due to noise Thus TDW of paddy treatedwithUF-MWCNTs are considered insignificantmodel termswhich have limited influence on this optimizationmodels forthe development of UF-MWCNTs fertilizer
In order to further ensure that the selected model pro-vides an adequate approximation of the real system thenormal probability plots of the studentized residuals anddiagnostics are provided by theDesign Expert 9 softwareThenormal probability plots illustrated in Figure 6 demonstratethat the normal probability plots of the studentized residualsfor two quadratic models which are significant model termsincluding NUE (Figure 6(a)) and NU (Figure 6(b)) bypaddy treated with UF-MWCNTs A normal probability plotindicates that if the residuals follow a normal distribution thepoints will be scattered following a straight line for each of theresponses [62] Consequently the data for both NUE andNUresponses can be possibly reflected as normally distributed inthe models
36 Treatment Efficiency Evaluation The 3D response sur-face plots are useful in assessing both individual and inter-action relationships between independent variables and theresponses [63] These plots were obtained by computations
using the Design Expert 9 software and were depicted inFigure 7 As shown by contour plots in Figures 7(a)ndash7(d) the maximum observed NUE and NU responses ofUF-MWCNTs by rice were 9635 and 136355mgpotrespectively at 050wt amount of f-MWCNTs and 21 hrsof functionalization reflux time The increment of UF-MWCNTs for NUE and NU is accredited to the increase inf-MWCNTs amount and functionalization reflux time until05 wt MWCNTs and 21-hour functionalization reflux timeaccordingly and results in decrease in value of NUE and NUresponses of UF-MWCNTs at further increment Hence theincreases of both f-MWCNTs amount and functionalizationreflux time until optimum values are two main factors affect-ing the UF-MWCNTs NUE and NU responses by paddyAccording to the optimization process using Design Expert9 the desired goals for each responses (NUE and NU) werechosen to be maximized to achieve the highest performanceof UF-MWCNTs fertilizer
Finally the confirmation report from the design softwarebased on the 95 confidence level presents the optimumdesign factors (MWCNTs and functionalization refluxtime) (Table 8) and respective desired responses (NUE andN uptake) (Table 9) for the development of UF-MWCNTsfertilizer As shown in Table 8 the optimum value of f-MWCNTs and functionalization reflux time for maximumperformance of UF-MWCNTs fertilizer were confirmed tobe 050wt and 21 hrs respectively Additionally referring toTable 8 9334 NUE 131304mgpot NU and 18767 gpotTDW of paddy are predicted based on the model underoptimized operational condition of design factors The desir-ability function value was observed to be 0684 for theseoptimum design factors
4 Conclusion
In conclusion the functionalization of MWCNTs by strongacid treatment resulted in the formation of opened ends tubesstill retaining their hollow sidewalls structure as observed
Journal of Nanotechnology 11
Table 8 Optimization results for design factors of UF-MWCNTs fertilizer
Factors Name Level Low level High levela1198831
f-MWCNTs 050 010 050b1198832
Functionalization reflux time 2100 1500 2100Confidence level = 95a1198831 is amount of f-MWCNTs
b1198832 is functionalization reflux time
Table 9 Optimization results for maximum responses of UF-MWCNTs fertilizer
Responses Pred mean Std dev SE Pred 95 PI low 95 PI high DesirabilityNUE 9334 299529 373 8452 10215 0684NU 131304 602391 7494 113583 149025TDW 18767 185192 2304 13319 24215
NU
E (
)
100
95
90
85
80
75
70
B functionalization reflux time
(hour)
21
20
19
18
17
16
15 A MWCNTs (wt)
01
02
03
04
05
(a)
NUE ()B
func
tiona
lizat
ion
reflu
x tim
e (ho
ur)
21
20
19
18
17
16
15
A MWCNTs (wt)01 02 03 04 05
5
90
85
80
80
(b)
B functionalization reflux time
(hour)
21
20
19
18
17
16
15 A MWCNTs (wt)
01
02
03
04
05
Nup
take
(mg
pot)
1400
1300
1200
1100
1000
900
(c)
N uptake (mgpot)
B fu
nctio
naliz
atio
n re
flux
time (
hour
)
21
20
19
18
17
16
15
5
1200
1100
1300
A MWCNTs (wt)01 02 03 04 05
(d)
Figure 7 3D response surface plot of NUE (a) and NU (c) coupled with contour plots of NUE (b) and NU (d) of paddy as a function off-MWCNTs () and functionalization reflux time (hour)
12 Journal of Nanotechnology
viamorphological evaluation using FESEM followed by TEMand further confirmed through FT-IR and Raman spec-troscopy analysis These conditions also strongly facilitatethe separation of nanotube bundles into individual tubesencouraging excellent biocompatibility between f-MWCNTsand UF Furthermore using RSM with CCD approachthe ANOVA of two quadratic models demonstrates thatresponses including NUE and NU by rice treated withUF-MWCNTs are significant model terms with 119901 valueof less than 005 Insignificant model term like TDW wasexcluded from the study to improve the models of optimiza-tion process for development of UF-MWCNTs fertilizer forenhancement of the plant growth Apparently RSM withCCDprovides valuable information regarding the interactionbetween design factors which were f-MWCNTs wt andfunctionalization reflux time which helps for recognitionof possible optimum values of the chosen design factorsThe optimum design factors obtained at 050wt amountof f-MWCNTs which have reflux in nitric acid for 21 hrsfor functionalization process needed for the developmentof UF-MWCNTs show great performances up to 96 NUEand 1180mgpot for NU This new urea-MWCNTs (UF-MWCNTs) approach delivers a promising improvement inNU and NUE for efficient plant nutrition of rice
Competing Interests
The authors declare that they have no competing interests
Acknowledgments
Authors acknowledged the Long Term Research GrantScheme (LRGS) byMinistry of EducationMalaysia awardedto Universiti Teknikal Malaysia Melaka (UTeM) Project 3under the OneBaja Project (Universiti Teknologi Petronas)for supporting and funding this work
References
[1] X Fan D Xie J Chen et al ldquoOver-expression of OsPTR6 inrice increased plant growth at different nitrogen supplies butdecreased nitrogen use efficiency at high ammonium supplyrdquoPlant Science vol 227 pp 1ndash11 2014
[2] P J Lea and J-F Morot-Gaudry Eds Plant Nitrogen Springer2001
[3] E Epstein Mineral Nutrition of Plants Principles and Perspec-tives 1972
[4] M E Trenkel Slow and Controlled Released and StabilizedFertilizer an Option for Enhancing Nitrogen Use Efficiency inAgriculture vol 53 2nd edition 2010
[5] LMMaene inProceedings of the 45thAnnualMeeting FertilizerIndustry Roundtable 1995
[6] Z-Z Li J-F Chen F Liu et al ldquoStudy of UV-shieldingproperties of novel porous hollow silica nanoparticle carriersfor avermectinrdquoPestManagement Science vol 63 no 3 pp 241ndash246 2007
[7] P S Vijayakumar O U Abhilash B M Khan and B L VPrasad ldquoNanogold-loaded sharp-edged carbon bullets as plant-gene carriersrdquoAdvanced FunctionalMaterials vol 20 no 15 pp2416ndash2423 2010
[8] V Ghormade M V Deshpande and K M Paknikar ldquoPerspec-tives for nano-biotechnology enabled protection and nutritionof plantsrdquo Biotechnology Advances vol 29 no 6 pp 792ndash8032011
[9] M A Wilson N H Tran A S Milev G S K Kannangara HVolk and G Q M Lu ldquoNanomaterials in soilsrdquo Geoderma vol146 no 1-2 pp 291ndash302 2008
[10] R Nair S H Varghese B G Nair T Maekawa Y Yoshida andD S Kumar ldquoNanoparticulatematerial delivery to plantsrdquoPlantScience vol 179 no 3 pp 154ndash163 2010
[11] A Perez-de-Luque and D Rubiales ldquoNanotechnology for par-asitic plant controlrdquo Pest Management Science vol 65 no 5 pp540ndash545 2009
[12] M Garcıa T Forbe and E Gonzalez ldquoPotential applications ofnanotechnology in the agro-food sectorrdquo Ciencia e Tecnologiade Alimentos vol 30 no 3 pp 573ndash581 2010
[13] R Sharon M Choudhary and A Kumar ldquoNanotechnology inagricultural diseasesd and food safetyrdquo Journal of Phytology vol2 pp 83ndash92 2010
[14] A Bhattacharyya A Bhaumik P U Rani S Mandal andT T Epidi ldquoNano-particlesmdasha recent approach to insect pestcontrolrdquo African Journal of Biotechnology vol 9 no 24 pp3489ndash3493 2010
[15] B Srilatha ldquoNanotechnology in agriculturerdquo Journal ofNanomedicine amp Nanotechnology vol 2 no 7 article 123 2011
[16] L Rashidi and K Khosravi-Darani ldquoThe applications of nan-otechnology in food industryrdquo Critical Reviews in Food Scienceand Nutrition vol 51 no 8 pp 723ndash730 2011
[17] L Zheng F Hong S Lu and C Liu ldquoEffect of nano-TiO2
on strength of naturally aged seeds and growth of spinachrdquoBiological Trace Element Research vol 104 no 1 pp 83ndash91 2005
[18] L R Khot S Sankaran J M Maja R Ehsani and E W Schus-ter ldquoApplications of nanomaterials in agricultural productionand crop protection a reviewrdquo Crop Protection vol 35 pp 64ndash70 2012
[19] J V Anguita D C CoxM Ahmad Y Y Tan J Allam and S RP Silva ldquoHighly transmissive carbon nanotube forests grown atlow substrate temperaturerdquoAdvanced Functional Materials vol23 no 44 pp 5502ndash5509 2013
[20] Q Liu B ChenQWang et al ldquoCarbon nanotubes asmoleculartransporters for walled plant cellsrdquoNano Letters vol 9 no 3 pp1007ndash1010 2009
[21] C M Lu C Y Zhang and J Q Wen ldquoResearch of the effect ofnanometer materials on germination and growth enhancementof glycine max and its mechanismrdquo Soybean Science vol 21 no3 pp 168ndash172 2002
[22] A-X Liu Q-M Lu Y-J Cao Z-W Liao andQ-H Xu ldquoEffectsof composite nanomaterials on rice growthrdquo Journal of PlantNutrition and Fertilizer vol 13 no 2 pp 344ndash347 2007
[23] Z J F Xiao Qiang Z S Qing Z D Fu and W Y JunldquoEffects of slowcontrolled release fertilizers felted and coatedby nanomaterials on crop yield and qualityrdquo Plant Nutrition andFertilizer Science vol 5 pp 951ndash955 2008
[24] Z M Liu J Zhang and Y D Zhang ldquoStudy on applicationof nanometer biotechnology on the yield and quality of winterwheatrdquo Journal of Anhui Agricultural Sciences vol 35 pp 15578ndash15580 2008
[25] Q Yin-fei S Cai-hong Q Cai-fei et al ldquoPrimarily study ofthe effects of nanometer carbon fertilizer synergist on the latericerdquo Acta Agriculturae Boreali-Sinica supplement 2 pp 249ndash253 2010
Journal of Nanotechnology 13
[26] J A Razak S H Ahmad C T Ratnam M A MahamoodJ Yaakub and N Mohamad ldquoEffects of EPDM-g-MAH com-patibilizer and internal mixer processing parameters on theproperties of NREPDM blends an analysis using responsesurface methodologyrdquo Journal of Applied Polymer Science vol132 no 27 Article ID 42199 2015
[27] R Chakravarti and V Sahai ldquoOptimization of compactin pro-duction in chemically defined production medium by Penicil-lium citrinum using statistical methodsrdquo Process Biochemistryvol 38 no 4 pp 481ndash486 2002
[28] N Mohamad A Muchtar M J Ghazali D H J Mohd andC H Azhari ldquoEpoxidized natural rubber-alumina nanoparticlecomposites optimization of mixer parameters via responsesurface methodologyrdquo Journal of Applied Polymer Science vol115 no 1 pp 183ndash189 2010
[29] D Talei A Valdiani M Maziah and M Mohsenkhah ldquoGer-mination response of MR 219 rice variety to different exposuretimes and periods of 2450MHz microwave frequencyrdquo TheScientific World Journal vol 2013 Article ID 408026 7 pages2013
[30] N M Yatim A Shaaban M F Dimin and F Yusof ldquoStatisticalevaluation of the production of urea fertilizer-multiwalledcarbon nanotubes using plackett burman experimental designrdquoProcediamdashSocial and Behavioral Sciences vol 195 pp 315ndash3232015
[31] L V A Reddy Y-J Wee J-S Yun and H-W Ryu ldquoOpti-mization of alkaline protease production by batch cultureof Bacillus sp RKY3 through Plackett-Burman and responsesurface methodological approachesrdquo Bioresource Technologyvol 99 no 7 pp 2242ndash2249 2008
[32] J Zhang and N-F Gao ldquoApplication of response surfacemethodology inmedium optimization for pyruvic acid produc-tion of Torulopsis glabrata TP19 in batch fermentationrdquo Journalof ZhejiangUniversity SCIENCEB vol 8 no 2 pp 98ndash104 2007
[33] A I Khuri and J A Cornell Response Surfaces Designs andAnalyses CRC Press 2nd edition 1996
[34] J Zhang Z Li K Li W Huang and L Sang ldquoNitrogen useefficiency under different field treatments on maize fields incentral China a lysimeter and 15N studyrdquo Journal of WaterResource and Protection vol 4 no 8 pp 590ndash596 2012
[35] H Hu B Zhao M E Itkis and R C Haddon ldquoNitric acidpurification of single-walled carbon nanotubesrdquo The Journal ofPhysical Chemistry B vol 107 no 50 pp 13838ndash13842 2003
[36] V Georgakilas A Demeslis E Ntararas et al ldquoHydrophilicnanotube supported graphene-water dispersible carbon super-structure with excellent conductivityrdquo Advanced FunctionalMaterials vol 25 no 10 pp 1481ndash1487 2015
[37] PWick P Manser L K Limbach et al ldquoThe degree and kind ofagglomeration affect carbon nanotube cytotoxicityrdquo ToxicologyLetters vol 168 no 2 pp 121ndash131 2007
[38] C A Poland R Duffin I Kinloch et al ldquoCarbon nanotubesintroduced into the abdominal cavity of mice show asbestos-like pathogenicity in a pilot studyrdquo Nature Nanotechnology vol3 no 7 pp 423ndash428 2008
[39] P Patlolla A Knighten and B Tchounwou ldquoMulti-walled car-bon nanotubes induce cytotoxicity genotoxicity and apoptosisin normal human dermal fibroblast cellsrdquo Ethnicity amp Diseasevol 20 pp 1ndash17 2010
[40] X-M Tan C Lin and B Fugetsu ldquoStudies on toxicity of multi-walled carbon nanotubes on suspension rice cellsrdquo Carbon vol47 no 15 pp 3479ndash3487 2009
[41] B Wei L Zhang and G Chen ldquoA multi-walled carbonnanotubepoly(urea-formaldehyde) composite prepared by insitu polycondensation for enhanced electrochemical sensingrdquoNew Journal of Chemistry vol 34 no 3 pp 453ndash457 2010
[42] I-Y Jeon DW Chang N A Kumar and J-B Baek ldquoFunction-alization of carbon nanotubesrdquo in Carbon Nanotubes-PolymerNanocomposites InTech Rijeka Croatia 2011
[43] C Gao Y Z Jin H Kong et al ldquoPolyurea-functionalizedmultiwalled carbon nanotubes synthesis morphology andRaman spectroscopyrdquo Journal of Physical Chemistry B vol 109no 24 pp 11925ndash11932 2005
[44] M ZdrojekWGebicki C Jastrzebski TMelin andAHuczkoldquoStudies of multiwall carbon nanotubes using Raman spec-troscopy and atomic force microscopyrdquo Solid State Phenomenavol 99-100 pp 265ndash268 2004
[45] L Bokobza and J Zhang ldquoRaman spectroscopic characteriza-tion of multiwall carbon nanotubes and of compositesrdquo ExpressPolymer Letters vol 6 no 7 pp 601ndash608 2012
[46] G S Duesberg I Loa M Burghard K Syassen and S RothldquoPolarized Raman spectroscopy on isolated single-wall carbonnanotubesrdquo Physical Review Letters vol 85 no 25 pp 5436ndash5439 2000
[47] Z Syrgiannis A Bonasera E Tenori et al ldquoChemicalmodifica-tion of carbon nanomaterials (SWCNTs DWCNTs MWCNTsand SWCNHs) with diphenyl dichalcogenidesrdquo Nanoscale vol7 no 14 pp 6007ndash6013 2015
[48] S Botti S Laurenzi L Mezi A Rufoloni and M G Santoni-cola ldquoSurface-enhanced Raman spectroscopy characterisationof functionalised multi-walled carbon nanotubesrdquo PhysicalChemistry Chemical Physics vol 17 no 33 pp 21373ndash213802015
[49] W Zhou S Sasaki and A Kawasaki ldquoEffective control of nan-odefects in multiwalled carbon nanotubes by acid treatmentrdquoCarbon vol 78 pp 121ndash129 2014
[50] S L H Rebelo A Guedes M E Szefczyk A M Pereira J PAraujo and C Freire ldquoProgress in the Raman spectra analysisof covalently functionalized multiwalled carbon nanotubesunraveling disorder in graphitic materialsrdquo Physical ChemistryChemical Physics vol 18 no 18 pp 12784ndash12796 2016
[51] D Lin-Vien N B ColthupWG Fateley and J G GrasselliTheHandbook of Infrared and Raman Characteristic Frequencies ofOrganic Molecules Elsevier 1991
[52] Y Sun Comparison and Combination of Near-Infrared andRaman Spectra for PLS and NAS Quantitation of Glucose Ureaand Lactate University of Iowa Iowa City Iowa USA 2013
[53] M Mowry D Palaniuk C C Luhrs and S Osswald ldquoInsituRaman spectroscopy and thermal analysis of the formation ofnitrogen-doped graphene from urea and graphite oxiderdquo RSCAdvances vol 3 no 44 pp 21763ndash21775 2013
[54] X Hoccart and G Turrell ldquoRaman spectroscopic investigationof the dynamics of urea-water complexesrdquo The Journal ofChemical Physics vol 99 no 11 pp 8498ndash8503 1993
[55] R L Frost J Kristof L Rintoul and J T Kloprogge ldquoRamanspectroscopy of urea and urea-intercalated kaolinites at 77KrdquoSpectrochimica ActamdashPart A Molecular and Biomolecular Spec-troscopy vol 56 no 9 pp 1681ndash1691 2000
[56] M M Hashim M K Yusop R Othman and S A WahidldquoCharacterization of nitrogen uptake pattern in malaysian riceMR219 at different growth stages using 15N isotoperdquo RiceScience vol 22 no 5 pp 250ndash254 2015
14 Journal of Nanotechnology
[57] Z Dong L Wu J Chai Y Zhu Y Chen and Y Zhu ldquoEffectsof nitrogen application rates on rice grain yield nitrogen-useefficiency and water quality in paddy fieldrdquo Communications inSoil Science and Plant Analysis vol 46 no 12 pp 1579ndash15942015
[58] G Chen S Guo H J Kronzucker and W Shi ldquoNitrogen useefficiency (NUE) in rice links to NH4+ toxicity and futile NH4+cycling in rootsrdquo Plant and Soil vol 369 no 1-2 pp 351ndash3632013
[59] B Singh K F Bronson Y Singh T S Khera and E PasuquinldquoNitrogen-15 balance as affected by rice straw management ina rice-wheat rotation in northwest Indiardquo Nutrient Cycling inAgroecosystems vol 59 no 3 pp 227ndash237 2001
[60] D J Hatch Controlling Nitrogen Flows and Losses WageningenAcademic Publishers 2004
[61] Jaykaran D Saxena P Yadav andN D Kantharia ldquoNonsignifi-cant P values cannot prove null hypothesis absence of evidenceis not evidence of absencerdquo Journal of Pharmacy and BioalliedSciences vol 3 no 3 pp 465ndash466 2011
[62] S S Abu Amr H A Aziz and M J Bashir ldquoApplication ofresponse surfacemethodology (RSM) for optimization of semi-aerobic landfill leachate treatment using ozonerdquo Applied WaterScience vol 4 no 3 pp 231ndash239 2014
[63] A Fakhri ldquoApplication of response surface methodology tooptimize the process variables for fluoride ion removal usingmaghemite nanoparticlesrdquo Journal of Saudi Chemical Societyvol 18 no 4 pp 340ndash347 2014
Submit your manuscripts athttpwwwhindawicom
ScientificaHindawi Publishing Corporationhttpwwwhindawicom Volume 2014
CorrosionInternational Journal of
Hindawi Publishing Corporationhttpwwwhindawicom Volume 2014
Polymer ScienceInternational Journal of
Hindawi Publishing Corporationhttpwwwhindawicom Volume 2014
Hindawi Publishing Corporationhttpwwwhindawicom Volume 2014
CeramicsJournal of
Hindawi Publishing Corporationhttpwwwhindawicom Volume 2014
CompositesJournal of
NanoparticlesJournal of
Hindawi Publishing Corporationhttpwwwhindawicom Volume 2014
Hindawi Publishing Corporationhttpwwwhindawicom Volume 2014
International Journal of
Biomaterials
Hindawi Publishing Corporationhttpwwwhindawicom Volume 2014
NanoscienceJournal of
TextilesHindawi Publishing Corporation httpwwwhindawicom Volume 2014
Journal of
NanotechnologyHindawi Publishing Corporationhttpwwwhindawicom Volume 2014
Journal of
CrystallographyJournal of
Hindawi Publishing Corporationhttpwwwhindawicom Volume 2014
The Scientific World JournalHindawi Publishing Corporation httpwwwhindawicom Volume 2014
Hindawi Publishing Corporationhttpwwwhindawicom Volume 2014
CoatingsJournal of
Advances in
Materials Science and EngineeringHindawi Publishing Corporationhttpwwwhindawicom Volume 2014
Smart Materials Research
Hindawi Publishing Corporationhttpwwwhindawicom Volume 2014
Hindawi Publishing Corporationhttpwwwhindawicom Volume 2014
MetallurgyJournal of
Hindawi Publishing Corporationhttpwwwhindawicom Volume 2014
BioMed Research International
MaterialsJournal of
Hindawi Publishing Corporationhttpwwwhindawicom Volume 2014
Nano
materials
Hindawi Publishing Corporationhttpwwwhindawicom Volume 2014
Journal ofNanomaterials
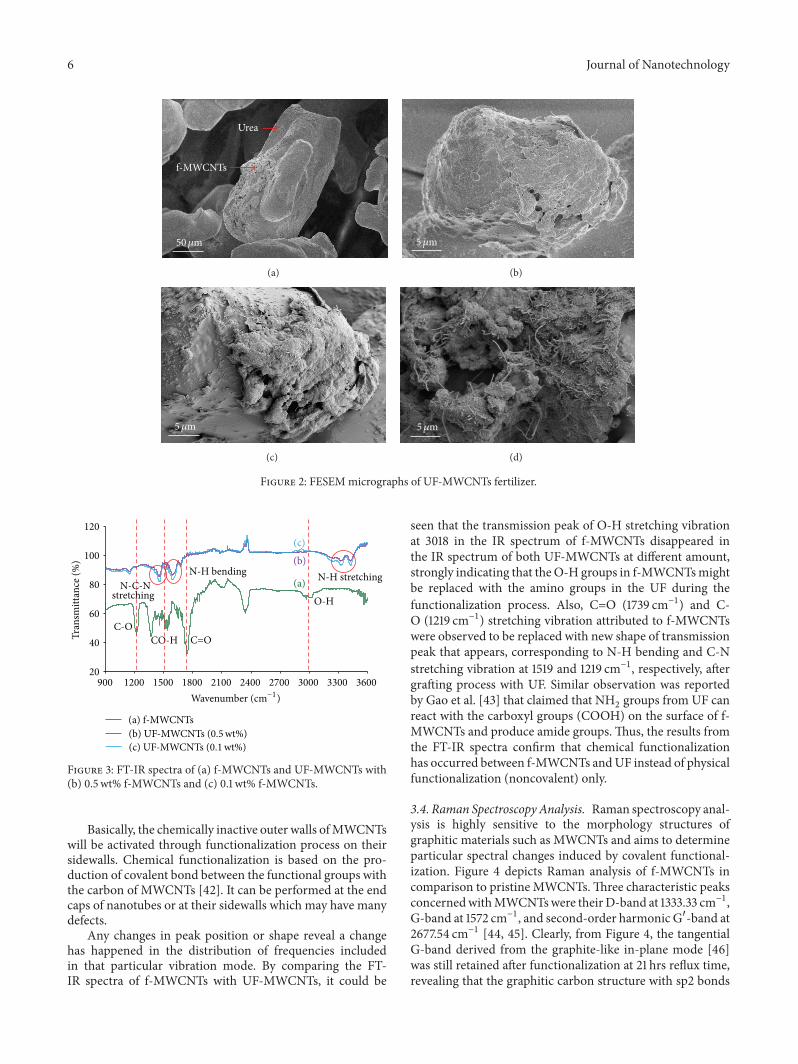
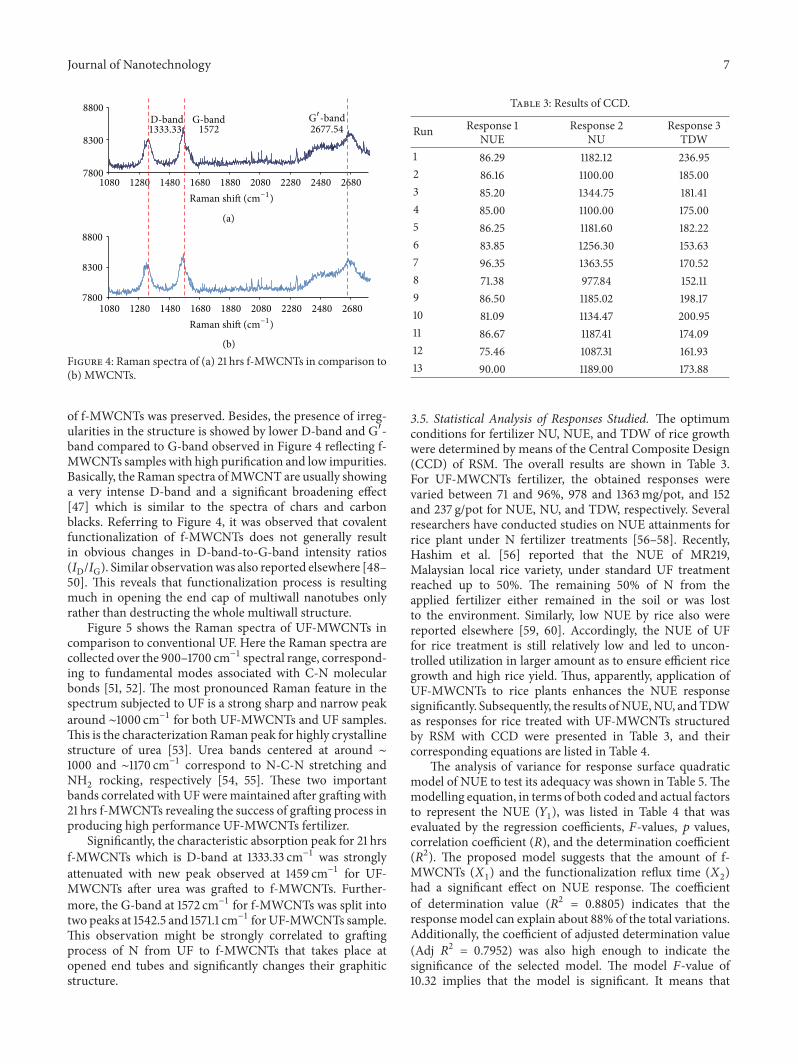
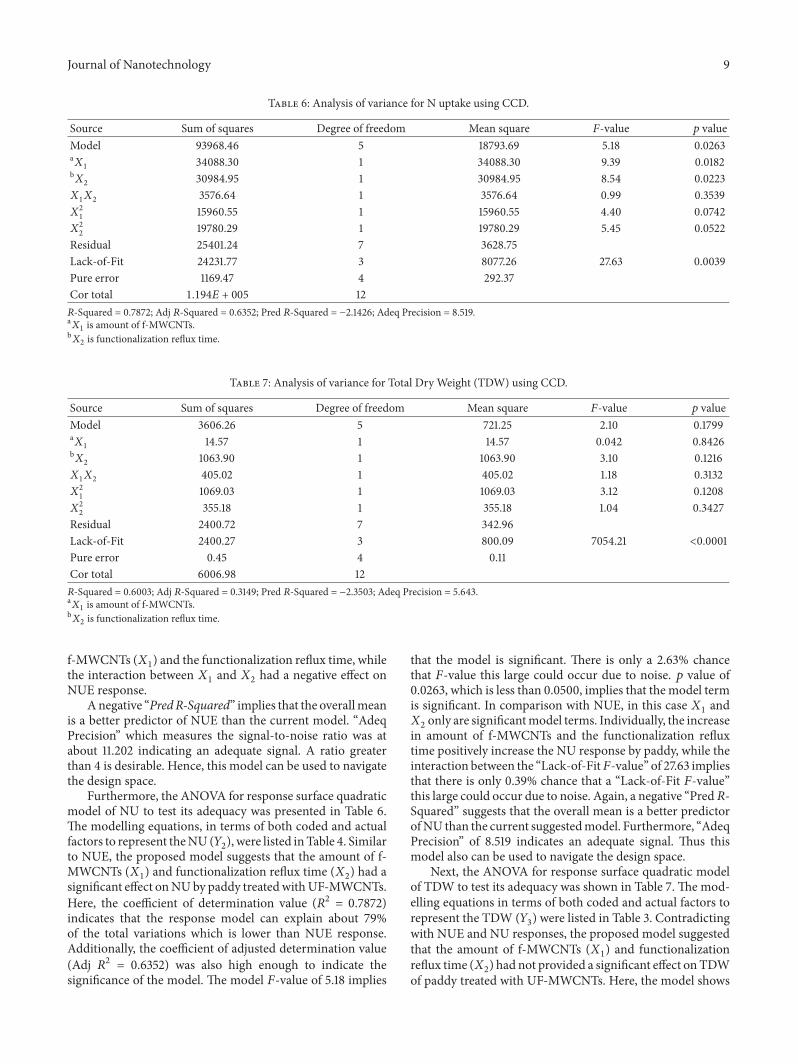
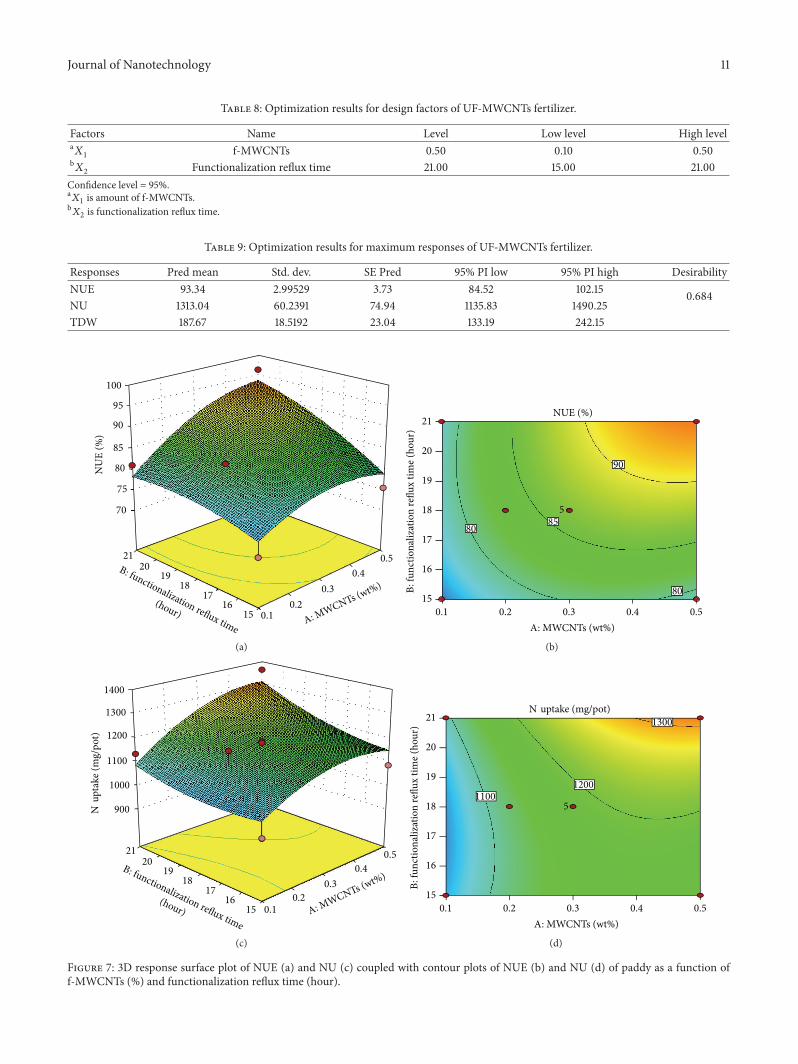