research article a gradient boosting algorithm...
TRANSCRIPT

Hindawi Publishing CorporationComputational and Mathematical Methods in MedicineVolume 2013, Article ID 873595, 8 pageshttp://dx.doi.org/10.1155/2013/873595
Research ArticleA Gradient Boosting Algorithm for Survival Analysis viaDirect Optimization of Concordance Index
Yifei Chen,1 Zhenyu Jia,2,3,4 Dan Mercola,4,5 and Xiaohui Xie1,6
1 Department of Computer Science, University of California Irvine, Irvine, CA 92697, USA2Department of Statistics, The University of Akron, Akron, OH 44325, USA3Department of Family and Community Medicine, Northeast Ohio Medical University, Rootstown, OH 44272, USA4Department of Pathology and Laboratory Medicine, University of California Irvine, Irvine, CA 92697, USA5 Institute for Clinical and Translational Cancer Biology, University of California Irvine, Irvine, CA 92697, USA6 Institute for Genomics and Bioinformatics, University of California Irvine, Irvine, CA 92697, USA
Correspondence should be addressed to Xiaohui Xie; [email protected]
Received 9 September 2013; Accepted 8 October 2013
Academic Editor: Lev Klebanov
Copyright © 2013 Yifei Chen et al. This is an open access article distributed under the Creative Commons Attribution License,which permits unrestricted use, distribution, and reproduction in any medium, provided the original work is properly cited.
Survival analysis focuses on modeling and predicting the time to an event of interest. Many statistical models have been proposedfor survival analysis. They often impose strong assumptions on hazard functions, which describe how the risk of an event changesover time depending on covariates associated with each individual. In particular, the prevalent proportional hazardsmodel assumesthat covariates are multiplicatively related to the hazard. Here we propose a nonparametric model for survival analysis that doesnot explicitly assume particular forms of hazard functions. Our nonparametric model utilizes an ensemble of regression trees todetermine how the hazard function varies according to the associated covariates. The ensemble model is trained using a gradientboosting method to optimize a smoothed approximation of the concordance index, which is one of the most widely used metricsin survival model performance evaluation. We implemented our model in a software package called GBMCI (gradient boostingmachine for concordance index) and benchmarked the performance of our model against other popular survival models with alarge-scale breast cancer prognosis dataset. Our experiment shows that GBMCI consistently outperforms other methods based ona number of covariate settings. GBMCI is implemented in R and is freely available online.
1. Introduction
Survival analysis focuses on developing diagnostic and prog-nostic models to analyze the effect of covariates on theoutcome of an event of interest, such as death or diseaserecurrence in disease studies. The analysis is often carriedout using regression methods to estimate the relationshipbetween the covariates and the time to event variable. Inclinical trials, time to events is usually represented by survivaltimes, which measure how long a patient with a localizeddisease is alive or disease-free after treatment, such as surgeryor surgery plus adjuvant therapy. The covariates used inpredicting survival times often include clinical features, suchas age, disease status, and treatment type. More recently,molecular features, such as expression of genes, and geneticfeatures, such as mutations in genes, are increasingly being
included in the set of covariates. Survival analysis also hasapplications inmany other fields. For instance, it is often usedto model machine failure in mechanical systems. Dependingon specific circumstances, survival timesmay also be referredto as failure times.
A major complication for survival analysis is that thesurvival data are often incomplete due to censoring, becauseof which standard statistical and machine learning tools onregression cannot be readily applied.Themost common typeof censoring occurring in clinical trials is right censoring,where the survival time is known to be longer than a certainvalue but its precise value is unknown. This can be due tomultiple reasons. For instance, a patientmightwithdraw froma clinical trial or a clinical trialmight end early such that somepatients are not followed up with afterwards.
2 Computational and Mathematical Methods in Medicine
Many statistical methods have been developed for sur-vival analysis. One major category of these methods adoptsa likelihood-based approach. An essential component ofthe models in this category is the estimation of the hazardfunction 𝜆(𝑡), defined as the event rate at time 𝑡 conditionalon survival up to time 𝑡. Different models often imposedifferent assumptions on the forms of the hazard function.In particular, the proportional hazards (PH) model (alsocalled the Cox model), one of the most prevalent modelsin survival analysis, assumes that different covariates con-tribute multiplicatively to the hazard function [1–4]. To relaxthe proportional hazards assumption and allow for morecomplicated relationships between covariates, parametricmodels based on artificial neural networks (ANN) [5–8] andensembles of tree models based on boosting [9–12] have alsobeen proposed. In order to handle the censored data, all thesemodels use an approximation of the likelihood function,called the Cox partial likelihood, to train the predictivemodel. The partial likelihood function is computationallyconvenient to use; however, it is unclear how well the fulllikelihood can be approximated by the partial likelihood.
Many other methods aiming at optimizing a differentclass of objective functions rather than the partial likelihoodhave also been proposed. Some of these methods adapt exist-ing regression models to estimate the relationship betweensurvival times and covariates, by taking the censored data intoaccount in training the models [13, 14], while others adopt aclassification-based framework and train their models usingonly the rank information associated with the observedsurvival times [8, 15, 16]. Recently, random survival forests[17, 18], a new ensemble-of-trees model based upon bagging,became popular in survival analysis.They resort to predictingeither the cumulative hazard function or the log-transformedsurvival time.
In clinical decision making, physicians and researchersare often more interested in evaluating the relative risk of adisease between patients with different covariates than theabsolute survival times of these patients. For this purpose,Harrell et al. introduced the important concept of concor-dance index (C-index, concordance C, or simply CI) as ameasure of the separation between two survival distributions[19, 20]. Given two survival distributions, the C-index com-putes the fraction of pairs of patients with consistent riskorders over the total number of validly comparable pairs.Because of its focus on assessing the accuracy of relative risk,the C-index is widely adopted in survival model performanceevaluation, where the order of predicted survival times iscompared to the order of the observed ones [21–23].
Our goal in this paper is to develop a new survivalmodel to capture the relationship between survival times andcovariates by directly optimizing the C-index between thepredicted and observed survival times. Although both theCox model based on partial likelihood and the ranked-basedmethods mentioned above also utilize only the order infor-mation between survival times, the C-index based methodprovides a more principled way of combining all pairwiseorder information into a single metric. There have beenprior attempts in directly learning the C-index for survivalanalysis, including a neural network based model [21] and
an extension of the Cox model trained using a lower boundof C-index [22]. However, both methods impose parametricassumptions on the effect of covariates on survival times. Ourcontribution here is to adopt a nonparametric approach tomodel the relationship between survival times and covariatesby using an ensemble of trees and to train the ensemblemodelby learning the C-index.
In the following, we will provide a detailed descrip-tion of our ensemble survival model based on learningthe C-index. We will derive an algorithm to train themodel using the gradient boosting method originally pro-posed by Friedman [9]. The algorithm is implemented inan R software package called GBMCI (gradient boostingmachine for concordance index), which is freely availableat https://github.com/uci-cbcl/GBMCI. We benchmark theperformance of GBMCI using a large-scale breast cancerprognosis dataset and show that GBMCI outperforms severalpopular survival models, including the Cox PH model, thegradient boosting PHmodel, and the random survival forest,in a number of covariate settings.
2. Materials and Methods
2.1. Survival Analysis. We review the basic concepts of sur-vival analysis here. For a systematic treatment, see [24, 25].In survival analysis, the time to event (death, failure, etc.)𝑡 is typically modeled as a random variable, which followssome probability density distribution 𝑝(𝑡). The density canbe characterized by the survival function 𝑆(𝑡) = Pr(𝑇 >
𝑡) = ∫∞
𝑡
𝑝(𝑇)d𝑇 for 𝑡 > 0. The survival function capturesthe probability that the event does not happen until time𝑡. A closely-related concept is the hazard function 𝜆(𝑡) =
limΔ𝑡→0
(Pr(𝑡 < 𝑇 < 𝑡 + Δ𝑡 | 𝑇 > 𝑡))/Δ𝑡 = 𝑝(𝑡)/𝑆(𝑡), whichmeasures the event rate at time 𝑡 conditioned on survival until𝑡. One can further show that 𝑆(𝑡) = 𝑒−∫
𝑡
0𝜆(𝜏)d𝜏.
The likelihood function for right-censored survival datais expressed as
𝐿 (𝜃; {𝑥𝑖, 𝑡𝑖, 𝛿𝑖}𝑛
𝑖=1) = ∏
𝑖∈𝐸
𝑝 (𝑡𝑖| 𝑥𝑖, 𝜃)∏
𝑗∈𝐶
𝑆 (𝑡𝑗| 𝑥𝑗, 𝜃)
=
𝑛
∏
𝑖=1
𝜆(𝑡𝑖| 𝑥𝑖, 𝜃)𝛿𝑖
𝑆 (𝑡𝑖| 𝑥𝑖, 𝜃) .
(1)
Note the augmentation of our notation (we will follow thisconvention in the following context unless otherwise stated):𝜃 is the set of regression parameters of the survival/hazardmodel; 𝛿
𝑖, 𝑖 = 1, . . . , 𝑛, indicates whether the event happens
(𝛿 = 1), or not (𝛿 = 0, i.e., the data is censored); 𝑥𝑖, 𝑖 =
1, . . . , 𝑛, are the explanatory covariates that affect the survivaltime; 𝐸 is the set of data whose events are observed; and𝐶 is the set of censored data. The full maximum-likelihoodapproach would optimize 𝐿 over the functional space of 𝑆(or 𝜆) and parameter space of 𝜃. Unfortunately, this is oftenintractable.
2.1.1. Proportional Hazard Model. In his seminal work [1, 2],Cox introduced the proportional hazard (PH) model 𝜆(𝑡 |
𝑥, 𝜃) = 𝜆0(𝑡) exp{𝑥𝑇𝜃}. 𝜆
0(𝑡) is the baseline hazard function;

Computational and Mathematical Methods in Medicine 3
exp{𝑥𝑇𝜃} is the relative hazard, which summarizes the effectof covariates. Cox observed that under the PH assumption,it suffices to estimate 𝜃 without the necessity of specifying𝜆0(𝑡) and optimizing the likelihood (1). Instead, he proposed
to optimize the so-called Cox partial likelihood
𝐿𝑝(𝜃; {𝑥
𝑖, 𝑡𝑖, 𝛿𝑖}𝑛
𝑖=1) = ∏
𝑖∈𝐸
exp {𝜃𝑇𝑥𝑖}
∑𝑗:𝑡𝑗≥𝑡𝑖
exp {𝜃𝑇𝑥𝑗}. (2)
The Cox model has become very popular in evaluatingthe covariates’ effect on survival data and is generalized tohandle time-varying covariates and time-varying coefficients[3, 4]. However, the proportional hazards assumption andthe maximization of the partial likelihood remain two mainlimitations. Nonlinearmodels, for example,multilayer neuralnetworks [5–7], have been proposed to replace 𝜃𝑇𝑥. However,they still assume parametric forms of the hazard function andattempt to optimize the partial likelihood.
2.1.2. Concordance Index. The C-index is a commonly usedperformance measure of survival models. Intuitively, it is thefraction of all pairs of patients whose predictions have correctorders over the pairs that can be ordered. Formally, the C-index is
CI = 1
|P|∑
(𝑖,𝑗)∈P
𝐼 (𝐹 (𝑥𝑖) < 𝐹 (𝑥
𝑗))
=1
|P|∑
𝑖∈𝐸
∑
𝑗:𝑡𝑗>𝑡𝑖
𝐼 (𝐹 (𝑥𝑖) < 𝐹 (𝑥
𝑗)) .
(3)
P is the set of validly orderable pairs, where 𝑡𝑖< 𝑡𝑗; |P| is
the number of pairs in P; 𝐹(𝑥) is the prediction of survivaltime; 𝐼 is the indicator function of whether the condition inparentheses is satisfied or not. In the PH setting, the predictedsurvival time can be equivalently represented by the negativelog relative hazard.TheC-index estimates the probability thatthe order of the predictions of a pair of comparable patientsis consistent with their observed survival information.
2.2. Gradient Boosting Machine. The gradient boostingmachine (GBM) is an ensemble learning method, whichconstructs a predictive model by additive expansion ofsequentially fitted weak learners [9, 10]. The general problemis to learn a functional mapping 𝑦 = 𝐹(𝑥; 𝛽) from data{𝑥𝑖, 𝑦𝑖}𝑛
𝑖=1, where 𝛽 is the set of parameters of 𝐹, such
that some cost function ∑𝑛
𝑖=1Φ(𝑦𝑖, 𝐹(𝑥𝑖; 𝛽)) is minimized.
Boosting assumes 𝐹(𝑥) follows an “additive” expansion form𝐹(𝑥) = ∑
𝑀
𝑚=0𝜌𝑚𝑓(𝑥; 𝜏
𝑚), where 𝑓 is called the weak or base
learner with a weight 𝜌 and a parameter set 𝜏. Accordingly,{𝜌𝑚, 𝜏𝑚}𝑀
𝑚=1compose the whole parameter set 𝛽. They are
learnt in a greedy “stage-wise” process: (1) set an initialestimator 𝑓
0(𝑥); (2) for each iteration 𝑚 ∈ {1, 2, . . . ,𝑀},
solve (𝜌𝑚, 𝜏𝑚) = argmin
𝜌,𝜏∑𝑛
𝑖=1Φ(𝑦𝑖, 𝐹𝑚−1
(𝑥𝑖) + 𝜌𝑓(𝑥
𝑖; 𝜏)).
GBM approximates (2) with two steps. First, it fits 𝑓(𝑥; 𝜏𝑚)
by
𝜏𝑚= argmin
𝜏
𝑛
∑
𝑖=1
(𝑔𝑖𝑚− 𝑓(𝑥
𝑖; 𝜏))2
, (4)
where
𝑔𝑖𝑚= −[
𝜕Φ (𝑦𝑖, 𝐹 (𝑥𝑖))
𝜕𝐹 (𝑥𝑖)
]
𝐹(𝑥)=𝐹𝑚−1(𝑥)
. (5)
Second, it learns 𝜌 by
𝜌𝑚= argmin
𝜌
𝑛
∑
𝑖=1
Φ(𝑦𝑖, 𝐹𝑚−1
(𝑥𝑖) + 𝜌𝑓 (𝑥
𝑖; 𝜏𝑚)) . (6)
Then, it updates 𝐹𝑚(𝑥) = 𝐹
𝑚−1(𝑥) + 𝜌
𝑚𝑓(𝑥; 𝜏
𝑚). In practice,
however, shrinkage is often introduced to control overfitting,and the update becomes 𝐹
𝑚(𝑥) = 𝐹
𝑚−1(𝑥) + ]𝜌
𝑚𝑓(𝑥; 𝜏
𝑚),
where 0 < ] ≤ 1. If the weak learner is the regressiontree, the complexity of𝑓(𝑥) is determined by tree parameters,for example, the tree size (or depth), and the minimumnumber of samples in terminal nodes. Besides using propershrinkage and tree parameters, one could improve the GBMperformance by subsampling, that is, fitting each base learneron a random subset of the training data.Thismethod is calledstochastic gradient boosting [10].
Compared to parametric models such as generalized lin-ear models (GLM) [26] and neural networks, GBM does notassume any functional form of 𝐹 but uses additive expansionto build up the model. This nonparametric approach givesmore freedom to researchers. GBM combines predictionsfrom the ensemble of weak learners and so tends to yieldmore robust results than the single learner. Empirically, italso works better than the bagging-based random forests[27], probably due to its functional optimization motivation.However, it requires the cost function Φ to be differentiablewith respect to 𝐹. GBM has been implemented in the popularopen-source R package “gbm” [12] which supports severalregression models.
2.2.1. Boosting the Proportional Hazard Model. Ridgeway [11]adapted GBM for the Cox model. The cost function is thenegative log partial likelihood:
Φ(𝑦, 𝐹) = −
𝑛
∑
𝑖=1
𝛿𝑖
{
{
{
𝐹 (𝑥𝑖) − log( ∑
𝑗:𝑡𝑗≥𝑡𝑖
𝑒𝐹(𝑥𝑗)
)}
}
}
. (7)
One can then apply (4), (5), and (6) to learn each additivemodel. In the “gbm” package, this cost function correspondsto the “coxph” distribution and is further optimized to refitterminal nodes with Newton’s method. We denote this par-ticular GBM algorithm as GBMCOX and its implementationin the “gbm” package as “gbmcox.”
2.3. Concordance Index Learning via Gradient Boosting. Wenow propose a gradient boosting algorithm to learn the C-index. As the C-index is a widely used metric to evaluatesurvival models, previous works [21, 22] have investigated thepossibility to optimize it, instead of Cox’s partial likelihood.However, these works are limited to parametric models, suchas linear models or neural networks. Our key contributionis to tackle the problem from a nonparametric ensembleperspective based on gradient boosting.

4 Computational and Mathematical Methods in Medicine
Optimizing the C-index directly is difficult because ofits discrete nature, that is, the summation over indicatorfunctions in (3).We resort to the differentiable approximationproposed in [21], which adopts the logistic sigmoid functionin each term.We call it the smoothed concordance index (SCI).Specifically,
SCI = 1
|P|∑
(𝑖,𝑗)∈P
1
1 + 𝑒𝛼(𝐹(𝑥
𝑖)−𝐹(𝑥
𝑗))
, (8)
where 𝛼 is a hyperparameter that controls the steepness of thesigmoid function (accordingly, the approximability of SCI toCI) and 𝐹(𝑥) is the prediction of survival time. LetΦ(𝑦, 𝐹) =−SCI. Then, at each iteration𝑚 > 0 of gradient boosting,
𝑔𝑖𝑚= [
𝜕SCI𝜕𝐹(𝑥𝑖)]
𝐹(𝑥)=𝐹𝑚−1(𝑥)
=𝛼
|P|{ ∑
(𝑘,𝑖)∈P
𝑒𝛼(𝐹𝑚−1(𝑥𝑘)−𝐹𝑚−1(𝑥𝑖))
[1 + 𝑒𝛼(𝐹𝑚−1(𝑥𝑘)−𝐹𝑚−1(𝑥𝑖))]2
− ∑
(𝑖,𝑗)∈P
𝑒𝛼(𝐹𝑚−1(𝑥𝑖)−𝐹𝑚−1(𝑥𝑗))
[1 + 𝑒𝛼(𝐹𝑚−1(𝑥𝑖)−𝐹𝑚−1(𝑥𝑗))]2
}
}
}
.
(9)
So the base learner 𝑓(𝑥; 𝜏𝑚) can be fitted using {𝑔
𝑖𝑚}𝑛
𝑖=1and
(4). Next,
𝜌𝑚=argmax
𝜌
1
|P|∑
(𝑖,𝑗)∈P
1
1+𝑒𝛼(𝐹𝑚−1(𝑥𝑖)+𝜌𝑓(𝑥
𝑖;𝜏𝑚)−𝐹𝑚−1(𝑥𝑗)−𝜌𝑓(𝑥
𝑗;𝜏𝑚))
.
(10)
Although differentiable, SCI has a complicated error surfaceand is neither convex nor concave.This brings two problems.First, the algorithm’s performance depends on its initializa-tion which may lead to different local optima; second, itis difficult to find the global solution of 𝜌
𝑚in (10). In our
implementation, we set the initial estimation {𝑓0(𝑥𝑖)}𝑛
𝑖=1as
the prediction from a fitted PH model and use line searchto detect 𝜌
𝑚locally. Empirically, we have found that these
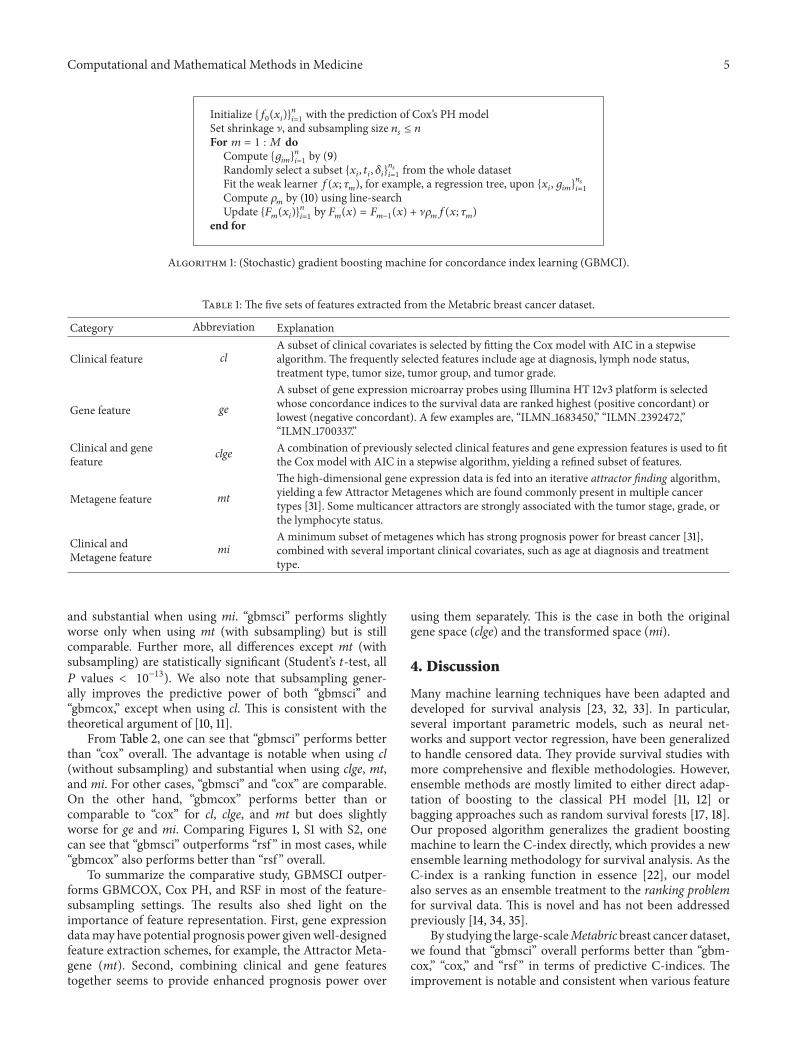
heuristics work well for the algorithm.Algorithm 1, named as GBMCI, summarizes our whole
algorithm, which also incorporates the stochastic boostingmechanism [10]. Note that ensemble size𝑀 is an importantparameter that requires tuning, as small𝑀 may not capturethe true model, while large 𝑀 makes the algorithm apt tooverfitting. In practice, it is often selected by cross validation.We implement GBMCI in the “gbm” package, under a newdistribution called “sci,” which shares the same regression treeengine and complete software architecture as “gbmcox” does.We name our implementation of GBMCI as “gbmsci.”
3. Results
3.1. Dataset and Feature Extraction. We illustrate the utility ofGBMCI on a large breast cancer dataset, which was originallyreleased by Curtis et al. [28]. The dataset was adopted bythe Sage Dream Breast Cancer Challenge (BCC) [29], whereit was named Metabric. It contains gene expressions, copy
number variations, clinical information, and survival dataof 1,981 breast cancer patients. The gene expression dataconsist of 49,576 microarray probes; the copy number dataconsist of 18,538 SNP probes; the clinical data contain 25clinical covariates; the survival data contain the survival timeand status (dead or censored). Following the convention ofBCC, we reserve 1001 patients for training and the other 980for testing. We applied several successful feature selectionschemes from the top competitors in BCC. See Table 1 fordetails on how these features were generated.
3.2. Experimental Settings. As a boosting model, GBMCI’smain competitor is the boosted proportional hazard modelGBMCOX. As they share identical software environmentwith a common regression tree engine, the comparisonshould be reliable and reasonable. For baseline evaluation, weinvestigate the performance of the PH model with a stepwiseAkaike information criterion (AIC) model selection scheme(denoted as “cox”). In addition, we also consider the popularrandom survival forest (RSF) approach by Ishwaran et al. [18],which is implemented in the R package randomSurvivalForest[30] (denoted as “rsf ”). We use the concordance index as theevaluation criteria. All experiments are performed in R 2.15.1software environment.
For “gbmsci,” the hyperparameter 𝛼 controls how wellSCI approximates CI. Large 𝛼 valuesmake the approximationgood, but the gradient can be very large or even ill definedand vice versa. In practice, we find 𝛼 = 1 strikes a goodbalance between approximability and numerical stability.The line-search range is [0, 100] along the gradient direc-tion. The shrinkage ] in “gbm” is 0.001 by default. In ourexperiments, we find ] = 0.002 works well for “gbmcox”and ] = 1 does for “gbmsci.” We do not essentially applyshrinkage for “gbmsci,” because the small line-search range[0, 100] does not necessarily detect the global optimal 𝜌,thus it implicitly contributes to shrinkage. This is mainly forcomputational efficiency purpose. “gbmsci” and “gbmcox”share other important parameter configurations: maximumnumber of trees is 1500 (actual number is automaticallytuned by 5-fold cross validation); tree depth is 6; 𝑛
𝑠/𝑛 (see
Algorithm 1) is 1 or 0.5. For “rsf,” the number of trees is 1500;other parameters use default configurations.
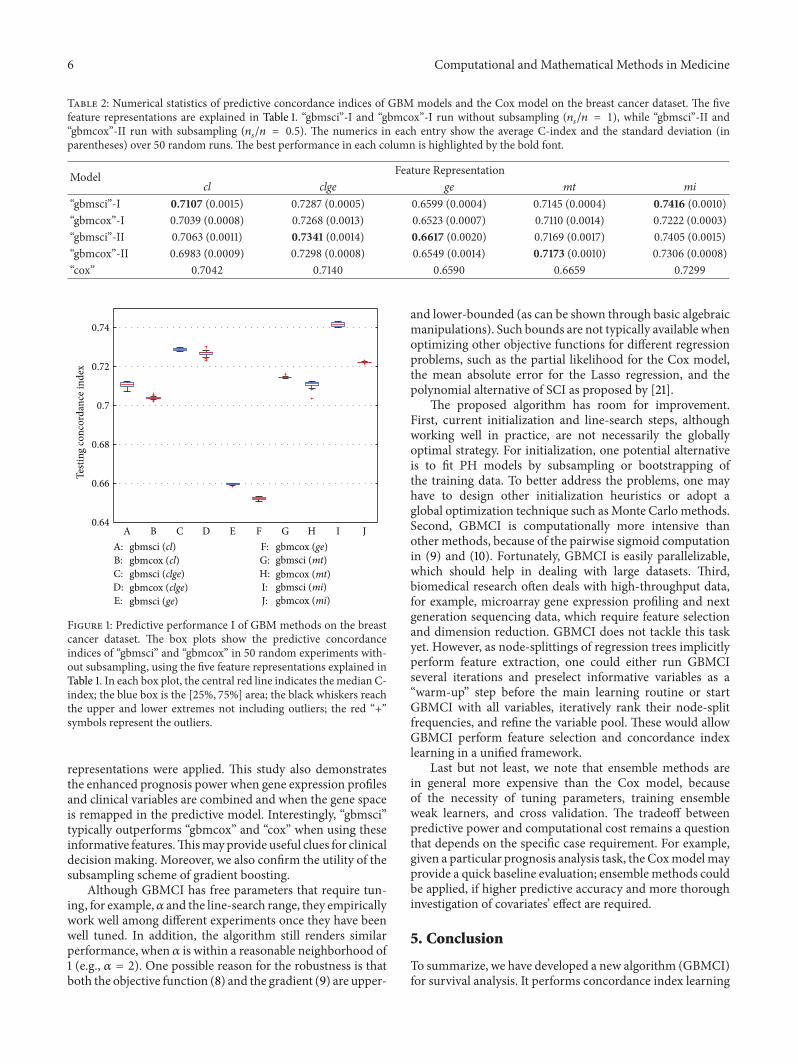
3.3. Empirical Comparison. Each method is tested usingthe five feature representations in Table 1. For “gbmsci” and“gbmcox”, as cross validation introduces randomness by par-titioning the training data, we repeat the experiment 50 times.Their predictive concordance indices are shown in Figures 1and S1 (see Figure S1 in Supplementary Material availableonline at http://dx.doi.org/10.1155/2013/873595). For “cox”, thepredictive concordance indices are shown in Table 2, whichalso summarizes the performances of “gbmsci” and “gbmcox.”For “rsf,” we also do 50 random tests because of bootstrappingwhen growing trees. The predictive concordance indices areshown in Figure S2.
Figures 1 and S1 show that “gbmsci” fairly consistentlyoutperforms “gbmcox.” The advantage is notable when usingthe features of cl, clge, ge, and mt (without subsampling)
Computational and Mathematical Methods in Medicine 5
Initialize {𝑓0(𝑥𝑖)}𝑛
𝑖=1with the prediction of Cox’s PH model
Set shrinkage ], and subsampling size 𝑛𝑠≤ 𝑛
For 𝑚 = 1 : 𝑀 doCompute {𝑔
𝑖𝑚}𝑛
𝑖=1by (9)
Randomly select a subset {𝑥𝑖, 𝑡𝑖, 𝛿𝑖}𝑛𝑠
𝑖=1from the whole dataset
Fit the weak learner 𝑓(𝑥; 𝜏𝑚), for example, a regression tree, upon {𝑥
𝑖, 𝑔𝑖𝑚}𝑛𝑠
𝑖=1
Compute 𝜌𝑚by (10) using line-search
Update {𝐹𝑚(𝑥𝑖)}𝑛
𝑖=1by 𝐹𝑚(𝑥) = 𝐹
𝑚−1(𝑥) + ]𝜌
𝑚𝑓(𝑥; 𝜏
𝑚)
end for
Algorithm 1: (Stochastic) gradient boosting machine for concordance index learning (GBMCI).
Table 1: The five sets of features extracted from the Metabric breast cancer dataset.
Category Abbreviation Explanation
Clinical feature clA subset of clinical covariates is selected by fitting the Cox model with AIC in a stepwisealgorithm. The frequently selected features include age at diagnosis, lymph node status,treatment type, tumor size, tumor group, and tumor grade.
Gene feature geA subset of gene expression microarray probes using Illumina HT 12v3 platform is selectedwhose concordance indices to the survival data are ranked highest (positive concordant) orlowest (negative concordant). A few examples are, “ILMN 1683450,” “ILMN 2392472,”“ILMN 1700337.”
Clinical and genefeature clge A combination of previously selected clinical features and gene expression features is used to fit
the Cox model with AIC in a stepwise algorithm, yielding a refined subset of features.
Metagene feature mtThe high-dimensional gene expression data is fed into an iterative attractor finding algorithm,yielding a few Attractor Metagenes which are found commonly present in multiple cancertypes [31]. Some multicancer attractors are strongly associated with the tumor stage, grade, orthe lymphocyte status.
Clinical andMetagene feature mi
A minimum subset of metagenes which has strong prognosis power for breast cancer [31],combined with several important clinical covariates, such as age at diagnosis and treatmenttype.
and substantial when using mi. “gbmsci” performs slightlyworse only when using mt (with subsampling) but is stillcomparable. Further more, all differences except mt (withsubsampling) are statistically significant (Student’s 𝑡-test, all𝑃 values < 10
−13). We also note that subsampling gener-ally improves the predictive power of both “gbmsci” and“gbmcox,” except when using cl. This is consistent with thetheoretical argument of [10, 11].
From Table 2, one can see that “gbmsci” performs betterthan “cox” overall. The advantage is notable when using cl(without subsampling) and substantial when using clge, mt,and mi. For other cases, “gbmsci” and “cox” are comparable.On the other hand, “gbmcox” performs better than orcomparable to “cox” for cl, clge, and mt but does slightlyworse for ge and mi. Comparing Figures 1, S1 with S2, onecan see that “gbmsci” outperforms “rsf ” in most cases, while“gbmcox” also performs better than “rsf ” overall.
To summarize the comparative study, GBMSCI outper-forms GBMCOX, Cox PH, and RSF in most of the feature-subsampling settings. The results also shed light on theimportance of feature representation. First, gene expressiondatamay have potential prognosis power givenwell-designedfeature extraction schemes, for example, the Attractor Meta-gene (mt). Second, combining clinical and gene featurestogether seems to provide enhanced prognosis power over
using them separately. This is the case in both the originalgene space (clge) and the transformed space (mi).
4. Discussion
Many machine learning techniques have been adapted anddeveloped for survival analysis [23, 32, 33]. In particular,several important parametric models, such as neural net-works and support vector regression, have been generalizedto handle censored data. They provide survival studies withmore comprehensive and flexible methodologies. However,ensemble methods are mostly limited to either direct adap-tation of boosting to the classical PH model [11, 12] orbagging approaches such as random survival forests [17, 18].Our proposed algorithm generalizes the gradient boostingmachine to learn the C-index directly, which provides a newensemble learning methodology for survival analysis. As theC-index is a ranking function in essence [22], our modelalso serves as an ensemble treatment to the ranking problemfor survival data. This is novel and has not been addressedpreviously [14, 34, 35].
By studying the large-scaleMetabric breast cancer dataset,we found that “gbmsci” overall performs better than “gbm-cox,” “cox,” and “rsf ” in terms of predictive C-indices. Theimprovement is notable and consistent when various feature
6 Computational and Mathematical Methods in Medicine
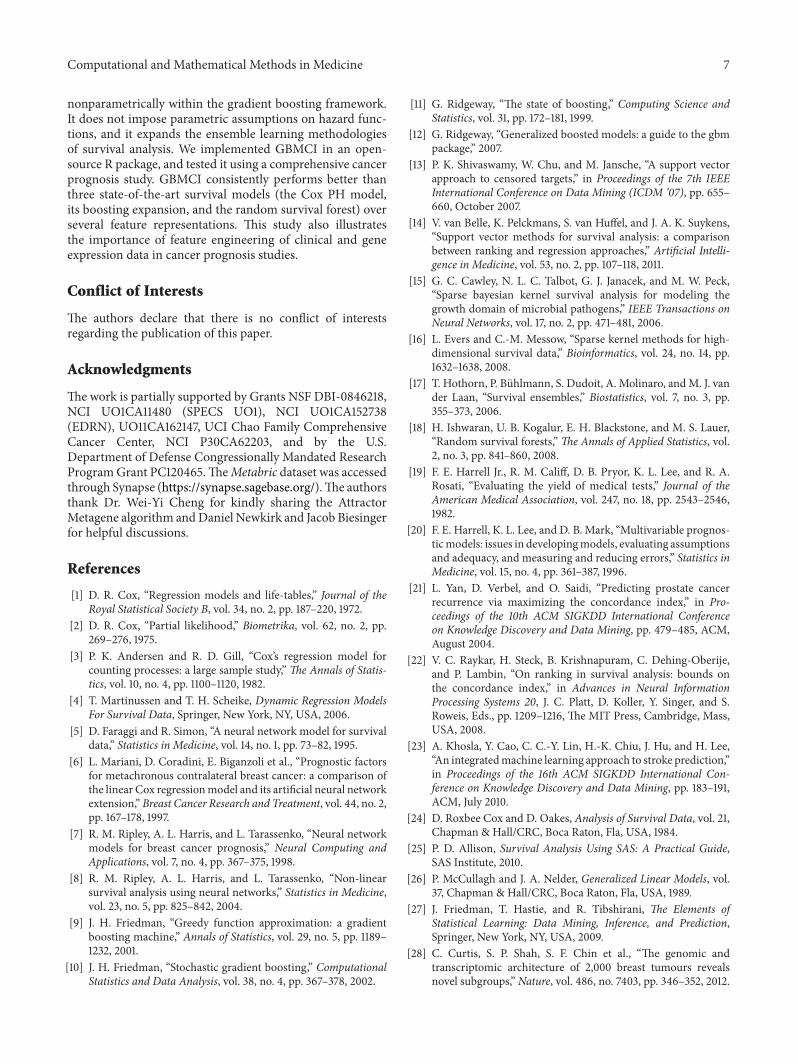
Table 2: Numerical statistics of predictive concordance indices of GBM models and the Cox model on the breast cancer dataset. The fivefeature representations are explained in Table 1. “gbmsci”-I and “gbmcox”-I run without subsampling (𝑛
𝑠/𝑛 = 1), while “gbmsci”-II and
“gbmcox”-II run with subsampling (𝑛𝑠/𝑛 = 0.5). The numerics in each entry show the average C-index and the standard deviation (in
parentheses) over 50 random runs. The best performance in each column is highlighted by the bold font.
Model Feature Representationcl clge ge mt mi
“gbmsci”-I 0.7107 (0.0015) 0.7287 (0.0005) 0.6599 (0.0004) 0.7145 (0.0004) 0.7416 (0.0010)“gbmcox”-I 0.7039 (0.0008) 0.7268 (0.0013) 0.6523 (0.0007) 0.7110 (0.0014) 0.7222 (0.0003)“gbmsci”-II 0.7063 (0.0011) 0.7341 (0.0014) 0.6617 (0.0020) 0.7169 (0.0017) 0.7405 (0.0015)“gbmcox”-II 0.6983 (0.0009) 0.7298 (0.0008) 0.6549 (0.0014) 0.7173 (0.0010) 0.7306 (0.0008)“cox” 0.7042 0.7140 0.6590 0.6659 0.7299
0.64
0.66
0.68
0.7
0.72
0.74
A B C D E F G H I J
Testi
ng co
ncor
danc
e ind
ex
A: gbmsci (cl)gbmcox (cl)B:
C: gbmsci (clge)D: gbmcox (clge)E: gbmsci (ge)
F: gbmcox (ge)G: gbmsci (mt)H: gbmcox (mt)I: gbmsci (mi)J: gbmcox (mi)
Figure 1: Predictive performance I of GBM methods on the breastcancer dataset. The box plots show the predictive concordanceindices of “gbmsci” and “gbmcox” in 50 random experiments with-out subsampling, using the five feature representations explained inTable 1. In each box plot, the central red line indicates themedian C-index; the blue box is the [25%, 75%] area; the black whiskers reachthe upper and lower extremes not including outliers; the red “+”symbols represent the outliers.
representations were applied. This study also demonstratesthe enhanced prognosis power when gene expression profilesand clinical variables are combined and when the gene spaceis remapped in the predictive model. Interestingly, “gbmsci”typically outperforms “gbmcox” and “cox” when using theseinformative features.Thismayprovide useful clues for clinicaldecision making. Moreover, we also confirm the utility of thesubsampling scheme of gradient boosting.
Although GBMCI has free parameters that require tun-ing, for example,𝛼 and the line-search range, they empiricallywork well among different experiments once they have beenwell tuned. In addition, the algorithm still renders similarperformance, when 𝛼 is within a reasonable neighborhood of1 (e.g., 𝛼 = 2). One possible reason for the robustness is thatboth the objective function (8) and the gradient (9) are upper-
and lower-bounded (as can be shown through basic algebraicmanipulations). Such bounds are not typically available whenoptimizing other objective functions for different regressionproblems, such as the partial likelihood for the Cox model,the mean absolute error for the Lasso regression, and thepolynomial alternative of SCI as proposed by [21].
The proposed algorithm has room for improvement.First, current initialization and line-search steps, althoughworking well in practice, are not necessarily the globallyoptimal strategy. For initialization, one potential alternativeis to fit PH models by subsampling or bootstrapping ofthe training data. To better address the problems, one mayhave to design other initialization heuristics or adopt aglobal optimization technique such asMonte Carlo methods.Second, GBMCI is computationally more intensive thanother methods, because of the pairwise sigmoid computationin (9) and (10). Fortunately, GBMCI is easily parallelizable,which should help in dealing with large datasets. Third,biomedical research often deals with high-throughput data,for example, microarray gene expression profiling and nextgeneration sequencing data, which require feature selectionand dimension reduction. GBMCI does not tackle this taskyet. However, as node-splittings of regression trees implicitlyperform feature extraction, one could either run GBMCIseveral iterations and preselect informative variables as a“warm-up” step before the main learning routine or startGBMCI with all variables, iteratively rank their node-splitfrequencies, and refine the variable pool. These would allowGBMCI perform feature selection and concordance indexlearning in a unified framework.
Last but not least, we note that ensemble methods arein general more expensive than the Cox model, becauseof the necessity of tuning parameters, training ensembleweak learners, and cross validation. The tradeoff betweenpredictive power and computational cost remains a questionthat depends on the specific case requirement. For example,given a particular prognosis analysis task, the Coxmodelmayprovide a quick baseline evaluation; ensemblemethods couldbe applied, if higher predictive accuracy and more thoroughinvestigation of covariates’ effect are required.
5. Conclusion
To summarize, we have developed a new algorithm (GBMCI)for survival analysis. It performs concordance index learning
Computational and Mathematical Methods in Medicine 7
nonparametrically within the gradient boosting framework.It does not impose parametric assumptions on hazard func-tions, and it expands the ensemble learning methodologiesof survival analysis. We implemented GBMCI in an open-source R package, and tested it using a comprehensive cancerprognosis study. GBMCI consistently performs better thanthree state-of-the-art survival models (the Cox PH model,its boosting expansion, and the random survival forest) overseveral feature representations. This study also illustratesthe importance of feature engineering of clinical and geneexpression data in cancer prognosis studies.
Conflict of Interests
The authors declare that there is no conflict of interestsregarding the publication of this paper.
Acknowledgments
Thework is partially supported by Grants NSF DBI-0846218,NCI UO1CA11480 (SPECS UO1), NCI UO1CA152738(EDRN), UO11CA162147, UCI Chao Family ComprehensiveCancer Center, NCI P30CA62203, and by the U.S.Department of Defense Congressionally Mandated ResearchProgramGrant PC120465.TheMetabric dataset was accessedthrough Synapse (https://synapse.sagebase.org/).The authorsthank Dr. Wei-Yi Cheng for kindly sharing the AttractorMetagene algorithm andDaniel Newkirk and Jacob Biesingerfor helpful discussions.
References
[1] D. R. Cox, “Regression models and life-tables,” Journal of theRoyal Statistical Society B, vol. 34, no. 2, pp. 187–220, 1972.
[2] D. R. Cox, “Partial likelihood,” Biometrika, vol. 62, no. 2, pp.269–276, 1975.
[3] P. K. Andersen and R. D. Gill, “Cox’s regression model forcounting processes: a large sample study,” The Annals of Statis-tics, vol. 10, no. 4, pp. 1100–1120, 1982.
[4] T. Martinussen and T. H. Scheike, Dynamic Regression ModelsFor Survival Data, Springer, New York, NY, USA, 2006.
[5] D. Faraggi and R. Simon, “A neural network model for survivaldata,” Statistics in Medicine, vol. 14, no. 1, pp. 73–82, 1995.
[6] L. Mariani, D. Coradini, E. Biganzoli et al., “Prognostic factorsfor metachronous contralateral breast cancer: a comparison ofthe linear Cox regressionmodel and its artificial neural networkextension,” Breast Cancer Research and Treatment, vol. 44, no. 2,pp. 167–178, 1997.
[7] R. M. Ripley, A. L. Harris, and L. Tarassenko, “Neural networkmodels for breast cancer prognosis,” Neural Computing andApplications, vol. 7, no. 4, pp. 367–375, 1998.
[8] R. M. Ripley, A. L. Harris, and L. Tarassenko, “Non-linearsurvival analysis using neural networks,” Statistics in Medicine,vol. 23, no. 5, pp. 825–842, 2004.
[9] J. H. Friedman, “Greedy function approximation: a gradientboosting machine,” Annals of Statistics, vol. 29, no. 5, pp. 1189–1232, 2001.
[10] J. H. Friedman, “Stochastic gradient boosting,” ComputationalStatistics and Data Analysis, vol. 38, no. 4, pp. 367–378, 2002.
[11] G. Ridgeway, “The state of boosting,” Computing Science andStatistics, vol. 31, pp. 172–181, 1999.
[12] G. Ridgeway, “Generalized boosted models: a guide to the gbmpackage,” 2007.
[13] P. K. Shivaswamy, W. Chu, and M. Jansche, “A support vectorapproach to censored targets,” in Proceedings of the 7th IEEEInternational Conference on Data Mining (ICDM ’07), pp. 655–660, October 2007.
[14] V. van Belle, K. Pelckmans, S. van Huffel, and J. A. K. Suykens,“Support vector methods for survival analysis: a comparisonbetween ranking and regression approaches,” Artificial Intelli-gence in Medicine, vol. 53, no. 2, pp. 107–118, 2011.
[15] G. C. Cawley, N. L. C. Talbot, G. J. Janacek, and M. W. Peck,“Sparse bayesian kernel survival analysis for modeling thegrowth domain of microbial pathogens,” IEEE Transactions onNeural Networks, vol. 17, no. 2, pp. 471–481, 2006.
[16] L. Evers and C.-M. Messow, “Sparse kernel methods for high-dimensional survival data,” Bioinformatics, vol. 24, no. 14, pp.1632–1638, 2008.
[17] T. Hothorn, P. Buhlmann, S. Dudoit, A. Molinaro, andM. J. vander Laan, “Survival ensembles,” Biostatistics, vol. 7, no. 3, pp.355–373, 2006.
[18] H. Ishwaran, U. B. Kogalur, E. H. Blackstone, and M. S. Lauer,“Random survival forests,”The Annals of Applied Statistics, vol.2, no. 3, pp. 841–860, 2008.
[19] F. E. Harrell Jr., R. M. Califf, D. B. Pryor, K. L. Lee, and R. A.Rosati, “Evaluating the yield of medical tests,” Journal of theAmerican Medical Association, vol. 247, no. 18, pp. 2543–2546,1982.
[20] F. E. Harrell, K. L. Lee, and D. B. Mark, “Multivariable prognos-ticmodels: issues in developingmodels, evaluating assumptionsand adequacy, and measuring and reducing errors,” Statistics inMedicine, vol. 15, no. 4, pp. 361–387, 1996.
[21] L. Yan, D. Verbel, and O. Saidi, “Predicting prostate cancerrecurrence via maximizing the concordance index,” in Pro-ceedings of the 10th ACM SIGKDD International Conferenceon Knowledge Discovery and Data Mining, pp. 479–485, ACM,August 2004.
[22] V. C. Raykar, H. Steck, B. Krishnapuram, C. Dehing-Oberije,and P. Lambin, “On ranking in survival analysis: bounds onthe concordance index,” in Advances in Neural InformationProcessing Systems 20, J. C. Platt, D. Koller, Y. Singer, and S.Roweis, Eds., pp. 1209–1216, The MIT Press, Cambridge, Mass,USA, 2008.
[23] A. Khosla, Y. Cao, C. C.-Y. Lin, H.-K. Chiu, J. Hu, and H. Lee,“An integratedmachine learning approach to stroke prediction,”in Proceedings of the 16th ACM SIGKDD International Con-ference on Knowledge Discovery and Data Mining, pp. 183–191,ACM, July 2010.
[24] D. Roxbee Cox and D. Oakes, Analysis of Survival Data, vol. 21,Chapman & Hall/CRC, Boca Raton, Fla, USA, 1984.
[25] P. D. Allison, Survival Analysis Using SAS: A Practical Guide,SAS Institute, 2010.
[26] P. McCullagh and J. A. Nelder, Generalized Linear Models, vol.37, Chapman & Hall/CRC, Boca Raton, Fla, USA, 1989.
[27] J. Friedman, T. Hastie, and R. Tibshirani, The Elements ofStatistical Learning: Data Mining, Inference, and Prediction,Springer, New York, NY, USA, 2009.
[28] C. Curtis, S. P. Shah, S. F. Chin et al., “The genomic andtranscriptomic architecture of 2,000 breast tumours revealsnovel subgroups,” Nature, vol. 486, no. 7403, pp. 346–352, 2012.
8 Computational and Mathematical Methods in Medicine
[29] A. A. Margolin, E. Bilal, E. Huang et al., “Systematic analysisof challenge-driven improvements in molecular prognosticmodels for breast cancer,” Science Translational Medicine, vol.5, no. 181, pp. 181re1–181re1, 2013.
[30] H. Ishwaran and U. B. Kogalur, “Random survival forests for r,”New Functions for Multivariate Analysis, p. 25, 2007.
[31] W. Y. Cheng, T. H. Ou Yang, and D. Anastassiou, “Biomolecularevents in cancer revealed by attractormetagenes,” PLoS Compu-tational Biology, vol. 9, no. 2, Article ID e1002920, 2013.
[32] B. Zupan, J. Demsar, M. W. Kattan, J. R. Beck, and I. Bratko,“Machine learning for survival analysis: a case study on recur-rence of prostate cancer,” Artificial Intelligence in Medicine, vol.20, no. 1, pp. 59–75, 2000.
[33] M. W. Kattan, “Comparison of Cox regression with othermethods for determining prediction models and nomograms,”The Journal of Urology, vol. 170, no. 6, pp. S6–S10, 2003.
[34] Y. Freund, R. Iyer, R. E. Schapire, and Y. Singer, “An efficientboosting algorithm for combining preferences,” Journal ofMachine Learning Research, vol. 4, no. 6, pp. 933–969, 2004.
[35] C. J. C. Burges, K. M. Svore, P. N. Bennett, A. Pastusiak, and Q.Wu, “Learning to rank using an ensemble of lambda-gradientmodels,” Journal of Machine Learning Research, vol. 14, pp. 25–35, 2011.

Submit your manuscripts athttp://www.hindawi.com
Stem CellsInternational
Hindawi Publishing Corporationhttp://www.hindawi.com Volume 2014
Hindawi Publishing Corporationhttp://www.hindawi.com Volume 2014
MEDIATORSINFLAMMATION
of
Hindawi Publishing Corporationhttp://www.hindawi.com Volume 2014
Behavioural Neurology
EndocrinologyInternational Journal of
Hindawi Publishing Corporationhttp://www.hindawi.com Volume 2014
Hindawi Publishing Corporationhttp://www.hindawi.com Volume 2014
Disease Markers
Hindawi Publishing Corporationhttp://www.hindawi.com Volume 2014
BioMed Research International
OncologyJournal of
Hindawi Publishing Corporationhttp://www.hindawi.com Volume 2014
Hindawi Publishing Corporationhttp://www.hindawi.com Volume 2014
Oxidative Medicine and Cellular Longevity
Hindawi Publishing Corporationhttp://www.hindawi.com Volume 2014
PPAR Research
The Scientific World JournalHindawi Publishing Corporation http://www.hindawi.com Volume 2014
Immunology ResearchHindawi Publishing Corporationhttp://www.hindawi.com Volume 2014
Journal of
ObesityJournal of
Hindawi Publishing Corporationhttp://www.hindawi.com Volume 2014
Hindawi Publishing Corporationhttp://www.hindawi.com Volume 2014
Computational and Mathematical Methods in Medicine
OphthalmologyJournal of
Hindawi Publishing Corporationhttp://www.hindawi.com Volume 2014
Diabetes ResearchJournal of
Hindawi Publishing Corporationhttp://www.hindawi.com Volume 2014
Hindawi Publishing Corporationhttp://www.hindawi.com Volume 2014
Research and TreatmentAIDS
Hindawi Publishing Corporationhttp://www.hindawi.com Volume 2014
Gastroenterology Research and Practice
Hindawi Publishing Corporationhttp://www.hindawi.com Volume 2014
Parkinson’s Disease
Evidence-Based Complementary and Alternative Medicine
Volume 2014Hindawi Publishing Corporationhttp://www.hindawi.com