research and technology transfer activity report
TRANSCRIPT

F I S C A L Y EA R 2020
R ES EA RC H A N D T EC H N O LO GY T R A N S F E R AC T I V I T YR E P O RT

A B O U T T H I S R E P O R T
The Arizona Board of Regents’ Research and Technology Transfer Activity Report is an annual report examining the research and technology transfer activities at Arizona’s public universities, including the facilities used and personnel engaged to support these activities. Research expenditures are reported in total, by funding source and research discipline. Research expenditures data is complimented with comparative national market share and rankings information. The technology transfer activities reported span the technology transfer process from discovery through commercialization.
Data in this report utilizes the definitions and standards established by related national surveys. Research expenditures and research personnel are reported consistent with the National Science Foundation’s annual Higher Education Research and Development Survey. Research facilities data reflect the National Science Foundation’s biannual Survey of Science and Engineering Research Facilities. Technology transfer activities are reported under the Association of University Technology Managers’ annual Licensing Activity Survey standards.
The technology transfer portions of this report are required by ABOR Policy 6-909.10.
A B O U T T H E A R I Z O N A B O A R D O F R E G E N T SThe Arizona Board of Regents is committed to ensuring access for qualified residents of Arizona to undergraduate and graduate institutions; promoting the discovery, application, and dissemination of new knowledge; extending the benefits of university activities to Arizona’s citizens outside the university; and maximizing the benefits derived from the state’s investment in education.
M E M B E R SLarry Penley, ChairLyndel Manson, Chair ElectKarrin Taylor Robson, SecretaryRon Shoopman, TreasurerBill RidenourFred DuValKathryn Hackett KingCecilia MataAnthony Rusk, Student RegentNikhil Dave, Student RegentGov. Doug Ducey, Ex-OfficioSuperintendent Kathy Hoffman, Ex-Officio
A B O R E X E C U T I V E D I R E C T O RJohn Arnold

3
7
13
15
21
23
29
Executive Summary
Arizona State University Research Expenditures
Arizona State University Technology Transfer
Northern Arizona University Research Expenditures
Northern Arizona University Technology Transfer
University of Arizona Research Expenditures
University of Arizona Research Technology Transfer
TA B L E O F C O N T E N T S

3 | RESEARCH AND TECHNOLOGY TRANSFER ACTIVITY REPORT
E X E C U T I V E S U M M A RY
Research focused on COVID-19 was instrumental to the state’s response to and management of the pandemic during fiscal year 2020. From creating a clinically approved and certified COVID-19 testing lab in two weeks to making 3D personal protective equipment when it was in short supply, creating a smartphone based test for the virus and the state’s first FDA-approved saliva-based test, the universities’ research efforts proved critical to the state. Through the Arizona COVID-19 Genomics Union, the state’s public universities and the Translational Genomics Research Institute (TGen) are tracking the virus, how it evolves and spreads.
Pivoting the efforts of hundreds of researchers at the universities to aid in the pandemic was crucial, yet the research enterprise accomplished additional major milestones during the year. OSIRIS-REx travelled to the asteroid Bennu and collected a sample before beginning the long trek back to Earth. Research at the universities encompassed issues affecting Arizona today – forest and ecosystem health, fighting obesity, predicting climate trends and heat waves, addressing health inequities, filling critical gaps in health care and advancing cybersecurity among myriad additional innovations at the universities.
A core mission among Arizona’s public universities is the discovery of new knowledge, and all three of the universities are internationally recognized for their research activity. Arizona State University and the University of Arizona are among the nation’s elite 131 universities classified as “R1: Doctoral Universities - Very High Research Activity,” and Northern Arizona University is among the nation’s exceptional 135 universities designated “R2: Doctoral Universities - High Research Activity.”1
The universities’ research missions are crucial as the research created at Arizona’s public universities is an essential part of Arizona’s economic future and the means by which new technologies are created and discoveries are made, thereby enhancing the lives of Arizonans. The universities’ research activities in fiscal year 2020 also provided wages and tuition support for almost 20,000 faculty, staff and students.
Research expenditures across Arizona’s public universities continue to grow. In fiscal year 2020, Arizona public universities research activity – as measured by research expenditures – grew year-over- year by $55.1 million or 3.8 percent to exceed $1.488 billion.
Arizona State University
ASU continues its decade-long trend of being one of the fastest growing research enterprises in the country. The university’s research activity – as measured by research expenditures – totaled over $673.4 million in fiscal year 2020, exceeding fiscal year 2019’s expenditures by $33.8 million or 5.3 percent. While ASU missed this year’s projected metric target, the institution has surpassed annual metric targets for the past nine years and has cumulatively exceeded its goals by $185 million over the past decade.
ASU’s total research expenditures ranking continued to improve, rising from 44th in 2016 to 43rd in 2019 among all U.S. universities and from 27th in 2016 to 26th in 2019 among public universities. ASU is now ranked sixth nationally in total research expenditures for universities without a medical school.
ASU ranked third in NASA funded expenditures and 23rd in National Science Foundation funded expenditures.
1 See The Carnegie Classification of Institutions of Higher Education at https://carnegieclassifications.iu.edu/index.php

RESEARCH AND TECHNOLOGY TRANSFER ACTIVITY REPORT | 4
Northern Arizona University
NAU continued its steady growth in research. The university’s research activity – as measured by research expenditures – totaled over $64.5 million in fiscal year 2020, surpassing its fiscal year 2019 expenditures by $5.6 million or 9.5 percent. The university exceeded its fiscal year 2020 annual metric target by $25 million, and over the past decade the university has grown its annual research expenditures by $35.7 million or 124 percent.
The university’s total research expenditure ranking rose significantly, improving from 213th in 2016 to 191st in 2019 among all U.S. universities and 156th in 2016 to 139th in 2019 among U.S. public universities.
NAU is ranked 68th in USDA funded research, and 87th in NASA funded research. NAU also ranks 79th nationally in geoscience, atmospheric and ocean sciences. NAU significantly improved its ranking in computer sciences, increasing from 296th in 2016 to 126th in 2019.
The university’s top disciplines for research expenditures are in biological and biomedical sciences, health sciences, and natural resources and conservation.
In technology transfer, NAU again exceeded its enterprise goal for invention disclosures in 2020, receiving 43 disclosures - 10 more than their goal for the fiscal year. New patent applications, U.S. patents received, and licenses and options executed all remained steady, and NAU formed its first startup since 2017.
University of Arizona
UArizona experienced a substantial increase in its research over the prior three years. In fiscal year 2020, the university’s research activity – as measured by research expenditures – totaled $750.1 million, surpassing its fiscal year 2019 expenditures by $15.8 million or 2.2 percent and exceeding its enterprise goal for the year by $96.4 million. The university’s annual research expenditures have increased by $163.5 million or 27.9 percent over the past decade.
ASU is ranked among the top 10 universities in research expenditures in the disciplines of social sciences and geosciences, atmospheric and ocean sciences, and is the No. 1 university in the country in research expenditures for transdisciplinary, multidisciplinary and other sciences expenditures. ASU is also ranked among the top 30 universities in research expenditures in computer science, engineering, mathematics and statistics, psychology, and non-science and engineering disciplines.
ASU’s top disciplines for research expenditures are transdisciplinary, multidisciplinary and other sciences, geological and Earth sciences, and biological and biomedical sciences as well as electrical, electronic and communications engineering.
ASU’s technology transfer and commercialization activities garnered worldwide recognition, including ranking 10th for U.S. patents issued to U.S. universities. The university entered into 78 license and option agreements in 2020, which was slightly down from fiscal year 2019, but exceeded its annual metric target of 70 agreements. ASU’s invention disclosures, U.S. patents issued, and startup companies formed all increased.

5 | RESEARCH AND TECHNOLOGY TRANSFER ACTIVITY REPORT
UArizona’s total research expenditure ranking continues to improve, rising from 38th in 2016 to 34th in 2019 among all U.S. universities, and from 23rd in 2016 to 19th in 2019 among U.S. public universities.
The university is ranked sixth in NASA funded research, 26th in USDA funded research and 28th in National Science Foundation funded research.
UArizona continued to improve its national rankings in physical sciences from sixth in 2016 to fourth in 2019 and maintained top 50 rankings in computer sciences, geosciences, atmospheric and ocean sciences, life sciences, social sciences, and transdisciplinary, multidisciplinary and other sciences.
The university’s top disciplines for research expenditures are biological and biomedical sciences, health sciences, and astronomy and astrophysics.
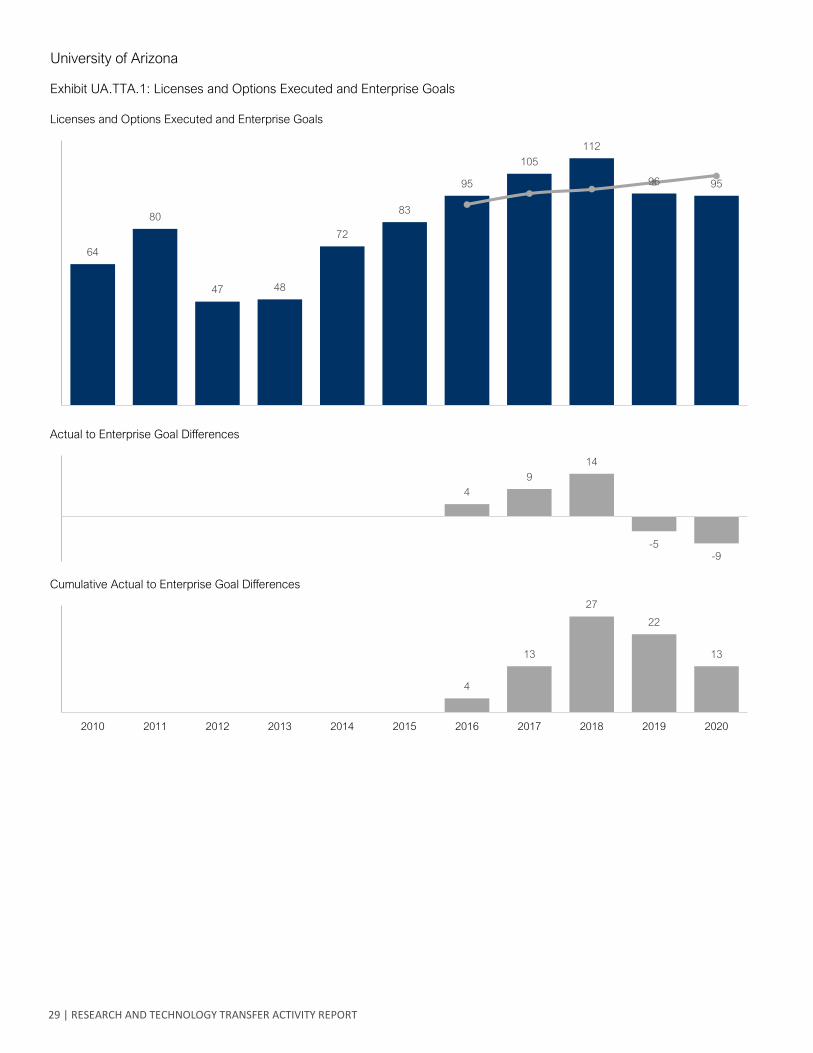
UArizona’s technology transfer and commercialization activities remained steady in fiscal year 2020. The university entered into 95 license and option agreements. This is in line with the number of licenses and options executed in fiscal year 2019, but nine agreements short of its metric target for the year. Licensing and options income however, increased from $5.9 million to $7.3 million year-over-year, extending its continuous advance from $2 million in 2016. In fiscal year 2020, UArizona was also issued 87 U.S. patents – an increase of 31 from 2019, and the university formed 19 startups.

Arizona Public University Enterprise
Exhibit E.R.1: Total Research Expenditures and Enterprise Goals
Total Research Expenditures and Enterprise Goals in Millions
Actual to Enterprise Goal Differences in Millions
Cumulative Actual to Enterprise Goal Differences in Millions
0.0
-12.7 -25.7 -55.4
-166.6-214.6
44.9 46.1
136.1 150.994.7
0.0
-12.7 -38.4-93.9
-260.5
-475.1-430.2
-384.0
-247.9
-96.9
-2.2
2010 2011 2012 2013 2014 2015 2016 2017 2018 2019 2020
944.8996.6
1,039.4 1,065.1 1,047.31,099.8
1,162.31,213.5
1,357.71,432.8
1,487.9
RESEARCH AND TECHNOLOGY TRANSFER REPORT | 6

Arizona State University
Exhibit ASU.R.1: Research Expenditures and Enterprise Goals
Research Expenditures and Enterprise Goals in Millions
Actual to Enterprise Goal Differences in Millions
Cumulative Actual to Enterprise Goal Differences in Millions
Exhibit ASU.R.2: Other Sponsored Project Expenditures
Other Sponsored Project Expenditures in Millions
0.06.7
16.0 15.2 11.7 13.4
36.924.4
55.2
32.2
-26.6
0.0 6.722.6
37.8 49.5 62.999.8
124.2
179.4211.7
185.0
2010 2011 2012 2013 2014 2015 2016 2017 2018 2019 2020
329.3355.2
386.0 405.2426.7
458.4
518.2545.0
617.7639.6
673.4
38.846.4
52.246.1
52.7 54.2 56.2 54.6 53.248.1
60.8
2010 2011 2012 2013 2014 2015 2016 2017 2018 2019 2020
7 | RESEARCH AND TECHNOLOGY TRANSFER ACTIVITY REPORT

Arizona State University
Exhibit ASU.R.3: Research Expenditures National Comparisons
Total Research Expenditures
Total Research Expenditures at Public Universities
Total Research Expenditures excluding Medical School
Research Expenditures at Institutions without a Medical School
Total Research Expenditures at Institutions without a Medical School
Exhibit NAU.R.4: Research Personnel and Facilities National Comparisons
Exhibit ASU.R.4: Research Personnel and Facilities
Total Research Personnel Including Faculty, Staff and Students
Total Research Facilities Net Assignable Square Feet In Thousands
Expenditures Market Share National Ranking
Expenditures Market Share National Ranking
518.2 545.0617.7 639.6 673.4 0.720% 0.765%
44 43
518.2 545.0617.7 639.6 673.4 1.102% 1.194%
2219
518.2 545.0617.7 639.6 673.4
2016 2020
2.524% 2.787%
2016 2020
76
2016 2020
518.2 545.0617.7 639.6 673.4 1.097% 1.169%
27 26
7,2928,792 8,736 9,783 9,539 0.782%
0.995%
37
22
983 987 9871,189 1,189
2016 2020
0.458%0.523%
2016 2020
6151
2016 2020
RESEARCH AND TECHNOLOGY TRANSFER ACTIVITY REPORT | 8

Arizona State University
Exhibit ASU.R.5: Research Expenditures by Sponsor Group
Federal Government
State and Local Government
Nonprofit
Business
Other External Sources
Institutional
Expenditures Market Share National Ranking
212.4 227.6254.4 267.1 278.2
0.546% 0.599%57 55
31.5 31.9 32.7 36.3 40.8
24.9 30.5 47.9 61.7 62.7
17.7 16.6 15.2 17.1 18.1
26.6 29.3 27.9 23.5 24.9
205.1 209.0239.6 234.0 248.7
2016 2020
0.782% 0.807%
0.539%
1.086%
0.420%0.339%
1.209%
0.870%
1.142% 1.108%
2016 2020
39 36
53
25
66 74
20
30
18 19
2016 2020
9 | RESEARCH AND TECHNOLOGY TRANSFER ACTIVITY REPORT

Arizona State University
Exhibit ASU.R.6: Federal Research Expenditures by Federal Agency
Department of Agriculture
Department of Defense
Department of Energy
Department of Health and Human Services (including NIH)
National Aeronautics and Space Administration
National Science Foundation
Other Federal
Expenditures Market Share National Ranking
1.1 1.5 1.6 2.5 2.0
0.094%
0.201%
10077
32.2 28.1 25.734.8
45.4
17.3 17.8 15.6 14.5 16.4
56.866.2 71.4
59.2 59.9
27.1 33.6
51.665.5
58.2
19.2 18.6 22.3 28.3 27.0
2016 2020
0.606% 0.523%
0.978%0.745%
0.275% 0.243%
0.597%
0.870%
2016 2020
33 38
29
42
86 93
10
3
45
23
2016 2020
23 23
1.819%
3.982%
1.146% 1.170%58.6 61.9 66.2 62.4
69.1
RESEARCH AND TECHNOLOGY TRANSFER ACTIVITY REPORT | 10

Arizona State University
Exhibit ASU.R.7: Total Research Expenditures by Broad Discipline
Computer and Information Sciences
Engineering
Geosciences, Atmospheric, and Ocean Sciences
Life Sciences
Mathematics and Statistics
Physical Sciences
Psychology
Social Sciences
Transdisciplinary, Multidisciplinary and Other Sciences
Non-Science and Engineering
Market Share National RankingExpenditures
17.0 16.3 19.0 21.9 22.2
0.815% 0.827%30 28
127.3 135.2 142.2 152.4 155.0
44.2 53.8 82.3 83.7 73.5
89.9 106.2 125.0 101.1 103.6
5.4 5.9 6.6 6.4 5.9
19.3 26.4 24.8 26.1 25.6
17.9 18.4 19.2 19.0 17.6
71.8 70.0 80.1 86.6 84.0
48.5 52.3 60.3 75.5 107.4
76.8 60.7 58.3 67.0 78.4
2016 2020
1.118% 1.152%
4.475%8.208%
0.787% 0.822%
0.394% 0.468%
1.467% 1.430%
3.021% 3.074%
1.429%2.620%
0.220% 0.209%
1.841% 1.369%
2016 2020
19 20
19
7
107 109
36 30
63 60
1611
4 4
4
1
714
2016 2020
11 | RESEARCH AND TECHNOLOGY TRANSFER ACTIVITY REPORT

Arizona State University
Exhibit ASU.R.8: Total Research Expenditures by Detailed Discipline
Research Discipline % of Discipline % of Total
Computer and Information Sciences 22,231,000 100.0% 3.3%Computer and Information Sciences 22,231,000 100.0% 3.3%
Engineering 155,015,000 100% 23.0%Aerospace, Aeronautical and Astronautical Engineering 0 0.0% 0.0%Bioengineering and Biomedical Engineering 12,067,000 7.8% 1.8%Chemical Engineering 6,998,000 4.5% 1.0%Civil Engineering 26,738,000 17.2% 4.0%Electrical, Electronic and Communications Engineering 52,719,000 34.0% 7.8%Industrial and Manufacturing Engineering 3,092,000 2.0% 0.5%Mechanical Engineering 11,303,000 7.3% 1.7%Metallurgical and Materials Engineering 6,100,000 3.9% 0.9%Other Engineering 35,998,000 23.2% 5.3%
Geosciences, Atmospheric and Ocean Sciences 73,544,000 100.0% 10.9%Atmospheric Science and Meteorology 0 0.0% 0.0%Geological and Earth Sciences 73,544,000 100.0% 10.9%Ocean Sciences and Marine Sciences 0 0.0% 0.0%Other Geosciences, Atmospheric, and Ocean Sciences 0 0.0% 0.0%
Life Sciences 103,558,000 100.0% 15.4%Agricultural Sciences 0 0.0% 0.0%Biological and Biomedical Sciences 63,293,000 61.1% 9.4%Health Sciences 39,268,000 37.9% 5.8%Natural Resources and Conservation 457,000 0.4% 0.1%Other Life Sciences 540,000 0.5% 0.1%
Mathematics and Statistics 5,942,000 100.0% 0.9%Mathematics and Statistics 5,942,000 100.0% 0.9%
Physical Sciences 25,619,000 100.0% 3.8%Astronomy and Astrophysics 0 0.0% 0.0%Chemistry 13,030,000 50.9% 1.9%Materials Science 0 0.0% 0.0%Physics 12,338,000 48.2% 1.8%Other Physical Sciences 251,000 1.0% 0.0%
Psychology 17,645,000 100.0% 2.6%Psychology 17,645,000 100.0% 2.6%
Social Sciences 83,980,000 100.0% 12.5%Anthropology 14,943,000 17.8% 2.2%Economics 8,585,000 10.2% 1.3%Political Science and Government 16,566,000 19.7% 2.5%Sociology, Demography and Population Studies 4,850,000 5.8% 0.7%Other Social Sciences 39,036,000 46.5% 5.8%
Other Sciences 107,393,000 100.0% 15.9%Transdisciplinary, Multidisciplinary and Other Sciences 107,393,000 100.0% 15.9%
Non-Science and Engineering 78,430,000 100.0% 11.6%Business Management and Business Administration 20,895,000 26.6% 3.1%Communication and Communications Technologies 5,797,000 7.4% 0.9%Education 29,988,000 38.2% 4.5%Humanities 7,714,000 9.8% 1.1%Law 4,490,000 5.7% 0.7%Social Work 6,217,000 7.9% 0.9%Visual and Performing Arts 3,329,000 4.2% 0.5%Other Non-Science and Engineering 0 0.0% 0.0%
2020 Expenditures
RESEARCH AND TECHNOLOGY TRANSFER ACTIVITY REPORT | 12

Arizona State University
Exhibit ASU.TTA.1: Licenses and Options Executed and Enterprise Goals
Licenses and Options Executed and Enterprise Goals
Actual to Enterprise Goal Differences
Cumulative Actual to Enterprise Goal Differences
19
30
9 93
19
4958
67 70
2010 2011 2012 2013 2014 2015 2016 2017 2018 2019 2020
55
7380
88 90
81 83
97
7881
78
13 | RESEARCH AND TECHNOLOGY TRANSFER ACTIVITY REPORT

Arizona State University
Exhibit ASU.TTA.2: Invention Disclosures
Invention Disclosures Received
Exhibit ASU.TTA.3: Patents
New Patent Applications US Patents Issued
Exhibit ASU.TTA.4: Licenses and Options
Licenses and Options Executed Licences and Options Income (in Millions)
Intellectual Property Income 2016 2017 2018 2019 2020Licenses and Options Income 10,907,198 770,443 750,757 673,945 801,741Legal Fees Reimbursed 1,204,692 1,439,171 1,698,294 2,115,725 1,595,385Other Revenue 357 219,596 3,608 4,827,623 297,664Total 12,112,247 2,429,210 2,452,659 7,617,293 2,694,790
Royalty Distributions 2016 2017 2018 2019 2020Inventors -1,520,699 -188,875 -258,026 -188,069 -133,068Laboratories and Units -855,257 -114,923 -149,979 -130,679 -58,690University -1,158,996 -119,217 -170,570 -128,903 -92,426Undistributed 16,878 151,984 14,422 27,200 11,050Total -1,997,375 -82,156 -306,127 -232,382 -140,066
Exhibit ASU.TTA.5: Startups
Startups Cumulative Active Startups
269 277 285 301 306
2016 2020
162 183 188228 232
2016 2020
83 9778 81 78
2016 2020
13 15 17 18 19
2016 2020
6085
123 129 135
2016 2020
10.91
0.77 0.75 0.67 0.80
2016 2020
56 5869 78
2016 2020
RESEARCH AND TECHNOLOGY TRANSFER ACTIVITY REPORT | 14

Northern Arizona University
Exhibit NAU.R.1: Research Expenditures and Enterprise Goals
Research Expenditures and Enterprise Goals in Millions
Actual to Enterprise Goal Differences in Millions
Cumulative Actual to Enterprise Goal Differences in Millions
Exhibit NAU.R.2: Other Sponsored Project Expenditures
Other Sponsored Project Expenditures in Millions
0.0 0.0
-4.1 -3.1 -3.4 -1.2
5.711.1
16.320.9
25.0
0.0 0.0
-4.0 -7.1 -10.5 -11.6 -6.0
5.1
21.4
42.3
67.3
2010 2011 2012 2013 2014 2015 2016 2017 2018 2019 2020
28.830.8
28.130.5 31.6
35.2
39.6
46.3
52.9
58.9
64.5
42.9
35.029.6
34.2 33.436.2 37.7
34.8 35.4 33.931.2
2010 2011 2012 2013 2014 2015 2016 2017 2018 2019 2020
15 | RESEARCH AND TECHNOLOGY TRANSFER ACTIVITY REPORT

Northern Arizona University
Exhibit NAU.R.3: Research Expenditures National Comparisons
Total Research Expenditures
Total Research Expenditures at Public Universities
Total Research Expenditures excluding Medical School
Research Expenditures at Institutions without a Medical School
Total Research Expenditures at Institutions without a Medical School
Exhibit NAU.R.4: Research Personnel and Facilities National Comparisons
Exhibit NAU.R.4: Research Personnel and Facilities
Total Research Personnel Including Faculty, Staff and Students
Total Research Facilities Net Assignable Square Feet In Thousands
Expenditures Market Share National Ranking
Expenditures Market Share National Ranking
39.6 46.3 52.9 58.9 64.50.055%
0.070%
213 191
39.6 46.3 52.9 58.9 64.50.084%
0.110%
190173
39.6 46.3 52.9 58.9 64.5
2016 2020
0.193%
0.257%
2016 2020
98 87
2016 2020
39.6 46.3 52.9 58.9 64.50.084%
0.108%
156 139
922 8471,096
1,250 1,2490.099%
0.127%
195 172
165201 201
237 237
2016 2020
0.077%0.104%
2016 2020
246207
2016 2020
RESEARCH AND TECHNOLOGY TRANSFER ACTIVITY REPORT | 16

Northern Arizona University
Exhibit NAU.R.5: Research Expenditures by Sponsor Group
Federal Government
State and Local Government
Nonprofit
Business
Other External Sources
Institutional
Expenditures Market Share National Ranking
23.4 26.0 29.636.0 39.4 0.060%
0.081%
202169
4.7 6.3 8.2 7.8 7.3
1.4 2.1 1.4 1.4 1.4
0.4 0.5 0.5 0.6 0.5
0.0 0.3 0.1 0.1 0.2
9.6 11.1 13.0 13.1 15.6
2016 2020
0.117%0.173%
0.030%0.025%
0.009%0.011%
0.002%0.004%
0.054%0.062%
2016 2020
127111
211 215
300264
322277
216 205
2016 2020
17 | RESEARCH AND TECHNOLOGY TRANSFER ACTIVITY REPORT

Northern Arizona University
Exhibit NAU.R.6: Federal Research Expenditures by Federal Agency
Department of Agriculture
Department of Defense
Department of Energy
Department of Health and Human Services (including NIH)
National Aeronautics and Space Administration
National Science Foundation
Other Federal
Expenditures Market Share National Ranking
3.1 3.3 3.1 3.7 4.4
0.256%0.305%
71 68
3.3 3.2 3.45.4
6.9
1.1 1.7 2.3 2.0 1.9
4.8 4.26.3
9.2 9.6
0.9 1.3 2.0 2.7 3.7
4.2 4.1 5.1 4.5 3.9
2016 2020
0.061%0.080%
0.062%
0.101%
0.023%
0.038%
0.132% 0.139%
2016 2020
170147
164143
224185
156
87
154 155
2016 2020
156133
0.058%
0.165%
0.118%0.159%
6.08.2 7.5 8.5 9.1
RESEARCH AND TECHNOLOGY TRANSFER ACTIVITY REPORT | 18

Northern Arizona University
Exhibit NAU.R.7: Total Research Expenditures by Broad Discipline
Computer and Information Sciences
Engineering
Geosciences, Atmospheric, and Ocean Sciences
Life Sciences
Mathematics and Statistics
Physical Sciences
Psychology
Social Sciences
Transdisciplinary, Multidisciplinary and Other Sciences
Non-Science and Engineering
Expenditures Market Share National Ranking
0.2 0.7 0.9 3.4 2.7 0.007%
0.128%296
126
3.4 3.5 4.5 2.6 5.0
9.1 4.4 9.7 8.0 7.4
23.632.3 32.0 36.2 38.9
0.0 0.0 0.0 0.0 0.0
1.3 2.8 3.8 5.6 7.1
0.2 0.2 0.3 0.8 0.7
0.4 0.7 0.4 0.7 0.4
0.6 1.1 0.6 0.4 0.4
0.8 0.7 0.8 1.2 1.9
2016 2020
0.029%0.020%
0.058% 0.046%
0.000% 0.000%
0.027%0.101%
0.015%0.056%
0.017%0.026%
0.295% 0.250%
0.058% 0.075%
0.019% 0.024%
2016 2020
211 224
74 79
168 151
531 560
248159
269 193
259 237
138 147
333 308
2016 2020
19 | RESEARCH AND TECHNOLOGY TRANSFER ACTIVITY REPORT

Northern Arizona University
Exhibit NAU.R.8: Total Research Expenditures by Detailed Discipline
Research Discipline % of Discipline % of Total
Computer and Information Sciences 2,671,000 100.0% 4.1%Computer and Information Sciences 2,671,000 100.0% 4.1%
Engineering 4,996,000 100% 7.8%Aerospace, Aeronautical and Astronautical Engineering 0 0.0% 0.0%Bioengineering and Biomedical Engineering 1,566,000 31.3% 2.4%Chemical Engineering 27,000 0.5% 0.0%Civil Engineering 231,000 4.6% 0.4%Electrical, Electronic and Communications Engineering 2,172,000 43.5% 3.4%Industrial and Manufacturing Engineering 0 0.0% 0.0%Mechanical Engineering 376,000 7.5% 0.6%Metallurgical and Materials Engineering 41,000 0.8% 0.1%Other Engineering 583,000 11.7% 0.9%
Geosciences, Atmospheric and Ocean Sciences 7,408,000 100.0% 11.5%Atmospheric Science and Meteorology 133,000 1.8% 0.2%Geological and Earth Sciences 4,778,000 64.5% 7.4%Ocean Sciences and Marine Sciences 48,000 0.6% 0.1%Other Geosciences, Atmospheric, and Ocean Sciences 2,449,000 33.1% 3.8%
Life Sciences 38,862,000 100.0% 60.3%Agricultural Sciences 2,273,000 5.8% 3.5%Biological and Biomedical Sciences 23,741,000 61.1% 36.8%Health Sciences 5,180,000 13.3% 8.0%Natural Resources and Conservation 6,508,000 16.7% 10.1%Other Life Sciences 1,160,000 3.0% 1.8%
Mathematics and Statistics 0 0.0% 0.0%Mathematics and Statistics 0 0.0% 0.0%
Physical Sciences 7,064,000 100.0% 11.0%Astronomy and Astrophysics 4,687,000 66.4% 7.3%Chemistry 799,000 11.3% 1.2%Materials Science 478,000 6.8% 0.7%Physics 941,000 13.3% 1.5%Other Physical Sciences 159,000 2.3% 0.2%
Psychology 725,000 100.0% 1.1%Psychology 725,000 100.0% 1.1%
Social Sciences 419,000 100.0% 0.7%Anthropology 114,000 27.2% 0.2%Economics 141,000 33.7% 0.2%Political Science and Government 14,000 3.3% 0.0%Sociology, Demography and Population Studies 55,000 13.1% 0.1%Other Social Sciences 95,000 22.7% 0.1%
Other Sciences 403,000 100.0% 0.6%Transdisciplinary, Multidisciplinary and Other Sciences 403,000 100.0% 0.6%
Non-Science and Engineering 1,908,000 100.0% 3.0%Business Management and Business Administration 363,000 19.0% 0.6%Communication and Communications Technologies 87,000 4.6% 0.1%Education 1,171,000 61.4% 1.8%Humanities 68,000 3.6% 0.1%Law 0 0.0% 0.0%Social Work 165,000 8.6% 0.3%Visual and Performing Arts 54,000 2.8% 0.1%Other Non-Science and Engineering 0 0.0% 0.0%
2020 Expenditures
RESEARCH AND TECHNOLOGY TRANSFER ACTIVITY REPORT | 20

Northern Arizona University
Exhibit NAU.TTA.1: Invention Disclosures Received and Enterprise Goals
Invention Disclosures Received and Enterprise Goals
Actual to Enterprise Goal Differences
Cumulative Actual to Enterprise Goal Differences
23
19 20 19
10
23
42
62
8191
2010 2011 2012 2013 2014 2015 2016 2017 2018 2019 2020
912
17 18
2427
50
46
50 50
43
21 | RESEARCH AND TECHNOLOGY TRANSFER ACTIVITY REPORT

Northern Arizona University
Exhibit NAU.TTA.2: Invention Disclosures
Invention Disclosures Received
Exhibit NAU.TTA.3: Patents
New Patent Applications US Patents Issued
Exhibit NAU.TTA.4: Licenses and Options
Licenses and Options Executed Licences and Options Income (in Millions)
Intellectual Property Income 2016 2017 2018 2019 2020Licenses and Options Income 5,286 30,070 40,549 10,500 5,561Legal Fees Reimbursed 0 14,902 13,079 15,515 5,542Other Revenue 3,236 0 40,548 0 20,000Total 8,522 44,972 94,176 26,015 31,103
Royalty Distributions 2016 2017 2018 2019 2020Inventors -19,430 0 0 -2,619 0Laboratories and Units 0 0 0 0 0University -26,287 0 0 0 0Undistributed 0 30,070 0 0 0Total -26,287 30,070 0 0 0
Exhibit NAU.TTA.5: Startups
Startups Cumulative Active Startups
50 46 50 5043
2016 2020
17 18 19 17 17
2016 2020
1
32
43
2016 2020
0
3
0 01
2016 2020
6 6
1519 17
2016 2020
0.01
0.030.04
0.01 0.01
2016 2020
2
4
1
3
2016 2020
RESEARCH AND TECHNOLOGY TRANSFER ACTIVITY REPORT | 22

University of Arizona
Exhibit UA.R.1: Research Expenditures and Enterprise Goals
Research Expenditures and Enterprise Goals in Millions
Actual to Enterprise Goal Differences in Millions
Cumulative Actual to Enterprise Goal Differences in Millions
Exhibit UA.R.2: Other Sponsored Project Expenditures
Other Sponsored Project Expenditures in Millions
0.0
-19.4 -37.6 -67.5
-175.9-226.8
2.3 10.764.6
97.8 96.4
0.0
-19.4-57.1
-124.6
-300.5
-527.3 -525.0 -514.3-449.7
-351.9
-255.5
2010 2011 2012 2013 2014 2015 2016 2017 2018 2019 2020
586.6610.6 625.4 629.5
588.1 606.2 604.5 622.2
687.1734.3 750.1
82.9
107.4 113.6 115.1 115.7 115.4 111.2
83.6 79.392.2
73.0
2010 2011 2012 2013 2014 2015 2016 2017 2018 2019 2020
23 | RESEARCH AND TECHNOLOGY TRANSFER ACTIVITY REPORT

University of Arizona
Exhibit UA.R.3: Research Expenditures National Comparisons
Total Research Expenditures
Total Research Expenditures at Public Universities
Total Research Expenditures excluding Medical School
Research Expenditures at Institutions without a Medical School
Total Research Expenditures from Medical School
Exhibit NAU.R.4: Research Personnel and Facilities National Comparisons
Exhibit UA.R.4: Research Personnel and Facilities
Total Research Personnel Including Faculty, Staff and Students
Total Research Facilities Net Assignable Square Feet In Thousands
Expenditures Market Share National Ranking
Expenditures Market Share National Ranking
604.5 622.2 687.1 734.3 750.1 0.840% 0.878%
38 34
411.5 405.2473.8 525.8 554.1 0.875% 0.981%
3125
193.0 217.0 213.3 208.5 196.0
2016 2020
0.780% 0.697%
2016 2020
44 49
2016 2020
604.5 622.2 687.1 734.3 750.1 1.280% 1.342%
2319
7,884 7,968 8,412 8,681 8,717 0.846% 0.883%
30 30
1,730 1,698 1,698 1,621 1,621
2016 2020
0.806%0.713%
2016 2020
2936
2016 2020
RESEARCH AND TECHNOLOGY TRANSFER ACTIVITY REPORT | 24

University of Arizona
Exhibit UA.R.5: Research Expenditures by Sponsor Group
Federal Government
State and Local Government
Nonprofit
Business
Other External Sources
Institutional
Expenditures Market Share National Ranking
263.0 273.6 291.8327.0 328.8
0.676% 0.733%
46 42
23.0 19.6 25.9 26.1 33.2
31.7 35.6 35.5 33.4 34.7
13.7 12.4 17.2 22.9 23.0
91.4 93.8 102.3 104.3 107.1
181.7 187.2 214.4 220.6 223.2
2016 2020
0.572% 0.580%
0.687%0.588%
0.326%0.452%
4.147% 3.865%
1.011% 1.045%
2016 2020
5346
4453
7361
67
27 25
2016 2020
25 | RESEARCH AND TECHNOLOGY TRANSFER ACTIVITY REPORT

University of Arizona
Exhibit UA.R.6: Federal Research Expenditures by Federal Agency
Department of Agriculture
Department of Defense
Department of Energy
Department of Health and Human Services (including NIH)
National Aeronautics and Space Administration
National Science Foundation
Other Federal
Expenditures Market Share National Ranking
11.0 11.5 11.4 16.1 15.7
0.911%
1.315%
35
26
20.7 22.6 25.0 31.1 29.2
10.2 14.0 11.7 8.6 9.8
96.8 107.7126.1
145.4 148.7
49.3 43.3 48.2 55.6 60.5
20.0 18.2 16.6 16.0 16.6
2016 2020
0.389%0.467%
0.574%0.446%
0.469%0.595%
0.621%0.491%
2016 2020
52 48
5062
6550
86
43
57
2016 2020
26 28
3.306% 3.383%
1.075% 1.018%
55.0 56.3 52.8 54.3 48.2
RESEARCH AND TECHNOLOGY TRANSFER ACTIVITY REPORT | 26

University of Arizona
Exhibit UA.R.7: Total Research Expenditures by Broad Discipline
Computer and Information Sciences
Engineering
Geosciences, Atmospheric, and Ocean Sciences
Life Sciences
Mathematics and Statistics
Physical Sciences
Psychology
Social Sciences
Transdisciplinary, Multidisciplinary and Other Sciences
Non-Science and Engineering
Market Share National RankingExpenditures
8.4 9.7 13.1 12.4 14.3
0.403% 0.468% 63 51
62.9 62.9 70.1 75.6 79.5
32.1 29.7 28.9 31.1 31.1
323.1 348.5 399.8 426.4 432.7
2.7 2.7 2.2 2.4 3.1
125.2 126.4 127.8 139.3 149.0
2.4 2.6 2.6 2.7 2.8
22.5 20.1 19.8 19.5 17.2
13.2 7.4 7.6 6.0 7.6
12.1 12.2 15.0 19.0 12.9
2016 2020
0.552% 0.571%
1.220%0.654%
0.387% 0.316%
2.552% 2.501%
0.198% 0.201%
0.945% 0.691%
1.037% 0.973%
0.790% 0.883%
0.289%0.388%
2016 2020
46 51
28 29
41 38
58 73
64
123 119
2837
2140
96 80
2016 2020
27 | RESEARCH AND TECHNOLOGY TRANSFER ACTIVITY REPORT

University of Arizona
Exhibit UA.R.8: Total Research Expenditures by Detailed Discipline
Research Discipline % of Discipline % of Total
Computer and Information Sciences 14,259,000 100.0% 1.9%Computer and Information Sciences 14,259,000 100.0% 1.9%
Engineering 79,463,000 100% 10.6%Aerospace, Aeronautical and Astronautical Engineering 1,601,000 2.0% 0.2%Bioengineering and Biomedical Engineering 8,552,000 10.8% 1.1%Chemical Engineering 5,811,000 7.3% 0.8%Civil Engineering 2,914,000 3.7% 0.4%Electrical, Electronic and Communications Engineering 39,690,000 49.9% 5.3%Industrial and Manufacturing Engineering 4,178,000 5.3% 0.6%Mechanical Engineering 5,097,000 6.4% 0.7%Metallurgical and Materials Engineering 7,902,000 9.9% 1.1%Other Engineering 3,718,000 4.7% 0.5%
Geosciences, Atmospheric and Ocean Sciences 31,148,000 100.0% 4.2%Atmospheric Science and Meteorology 5,223,000 16.8% 0.7%Geological and Earth Sciences 22,911,000 73.6% 3.1%Ocean Sciences and Marine Sciences 2,390,000 7.7% 0.3%Other Geosciences, Atmospheric, and Ocean Sciences 624,000 2.0% 0.1%
Life Sciences 432,666,000 100.0% 57.7%Agricultural Sciences 50,726,000 11.7% 6.8%Biological and Biomedical Sciences 212,637,000 49.1% 28.3%Health Sciences 156,165,000 36.1% 20.8%Natural Resources and Conservation 13,135,000 3.0% 1.8%Other Life Sciences 3,000 0.0% 0.0%
Mathematics and Statistics 3,098,000 100.0% 0.4%Mathematics and Statistics 3,098,000 100.0% 0.4%
Physical Sciences 149,039,000 100.0% 19.9%Astronomy and Astrophysics 121,809,000 81.7% 16.2%Chemistry 14,511,000 9.7% 1.9%Materials Science 3,434,000 2.3% 0.5%Physics 9,230,000 6.2% 1.2%Other Physical Sciences 55,000 0.0% 0.0%
Psychology 2,754,000 100.0% 0.4%Psychology 2,754,000 100.0% 0.4%
Social Sciences 17,221,000 100.0% 2.3%Anthropology 3,443,000 20.0% 0.5%Economics 1,789,000 10.4% 0.2%Political Science and Government 503,000 2.9% 0.1%Sociology, Demography and Population Studies 3,904,000 22.7% 0.5%Other Social Sciences 7,582,000 44.0% 1.0%
Other Sciences 7,566,000 100.0% 1.0%Transdisciplinary, Multidisciplinary and Other Sciences 7,566,000 100.0% 1.0%
Non-Science and Engineering 12,856,000 100.0% 1.7%Business Management and Business Administration 3,813,000 29.7% 0.5%Communication and Communications Technologies 71,000 0.6% 0.0%Education 2,823,000 22.0% 0.4%Humanities 4,500,000 35.0% 0.6%Law 373,000 2.9% 0.0%Social Work 0 0.0% 0.0%Visual and Performing Arts 140,000 1.1% 0.0%Other Non-Science and Engineering 1,136,000 8.8% 0.2%
2020 Expenditures
RESEARCH AND TECHNOLOGY TRANSFER ACTIVITY REPORT | 28
University of Arizona
Exhibit UA.TTA.1: Licenses and Options Executed and Enterprise Goals
Licenses and Options Executed and Enterprise Goals
Actual to Enterprise Goal Differences
Cumulative Actual to Enterprise Goal Differences
49
14
-5-9
4
13
27
22
13
2010 2011 2012 2013 2014 2015 2016 2017 2018 2019 2020
64
80
47 48
72
83
95
105112
96 95
29 | RESEARCH AND TECHNOLOGY TRANSFER ACTIVITY REPORT

University of Arizona
Exhibit UA.TTA.2: Invention Disclosures
Invention Disclosures Received
Exhibit UA.TTA.3: Patents
New Patent Applications US Patents Issued
Exhibit UA.TTA.4: Licenses and Options
Licenses and Options Executed Licences and Options Income (in Millions)
Intellectual Property Income 2016 2017 2018 2019 2020Licenses and Options Income 2,015,807 2,703,261 4,141,604 5,901,957 7,333,122Legal Fees Reimbursed 697,099 629,368 651,410 828,539 993,655Other Revenue 0 0 0 0 0Total 2,712,906 3,332,629 4,793,014 6,730,496 8,326,777
Royalty Distributions 2016 2017 2018 2019 2020Inventors -631,552 -946,141 -1,403,012 -1,904,368 -2,435,343Laboratories and Units -604,742 -865,044 -1,276,847 -1,708,098 -2,157,018University -507,454 -729,881 -1,383,993 -1,839,490 -2,365,761Undistributed 272,058 150,000 77,751 450,000 375,000Total -840,138 -1,444,925 -2,583,089 -3,097,588 -4,147,779
Exhibit UA.TTA.5: Startups
Startups Cumulative Active Startups
250 261 275 284 263
2016 2020
138 139 135 133 119
2016 2020
95 105 11296 95
2016 2020
14 15 1611
19
2016 2020
3647
3656
87
2016 2020
2.02 2.704.14
5.907.33
2016 2020
84 96 100 108
2016 2020
RESEARCH AND TECHNOLOGY TRANSFER ACTIVITY REPORT | 30

2700 N CENTRAL AVE., SUITE 400 | PHOENIX, AZ 85004 | AZREGENTS.EDU