research and development: national trends and ... chapter 4. research and development: national...
TRANSCRIPT

Chapter 4Research and Development:
National Trends and International Comparisons
� 4-1
Highlights .....................................................................................................................................4-4Trends in National R&D Performance .....................................................................................4-4R&D and GDP Growth .............................................................................................................4-4U.S. Business R&D ..................................................................................................................4-4R&D by Multinational Companies ...........................................................................................4-5Exports and Imports of R&D-Related Services ........................................................................4-5Federal R&D .............................................................................................................................4-5Federal R&E Tax Credit ...........................................................................................................4-5International R&D Comparisons ..............................................................................................4-5
Introduction ..................................................................................................................................4-7Chapter Organization ................................................................................................................4-7
Trends in National R&D Performance ........................................................................................4-7Trends in U.S. R&D Performance and R&D Intensity ............................................................4-7Performers of R&D ...................................................................................................................4-8Sources of R&D Funding .......................................................................................................4-12R&D by Character of Work ...................................................................................................4-15R&D, GDP Growth, and Innovation-Related Metrics ............................................................4-17
U.S. Business R&D....................................................................................................................4-17Domestic R&D Performance and Funding Sources ...............................................................4-18Domestic R&D Performance Funded by Others ....................................................................4-19Domestic R&D Performance by Size of Company ................................................................4-19Largest Domestic R&D-Performing Industries ......................................................................4-21Business Activities for Domestic R&D ..................................................................................4-21
R&D Performed Abroad by U.S.-Owned Companies ..............................................................4-25R&D by Multinational Companies ...........................................................................................4-25
U.S. Affiliates of Foreign Companies ....................................................................................4-25U.S. MNCs Parent Companies and Their Foreign Affiliates .................................................4-26
Exports and Imports of R&D-Related Services .........................................................................4-27Federal R&D ..............................................................................................................................4-28
Federal R&D Budget by National Objectives ........................................................................4-28Federal Spending on R&D by Agency ...................................................................................4-31Federal Spending on Research by Field .................................................................................4-33Federal R&E Tax Credits .......................................................................................................4-35
Federal Technology Transfer and Other Innovation-Related Programs ...................................4-37Federal Technology Transfer ..................................................................................................4-38Small Business Innovation-Related Programs ........................................................................4-38
International R&D Comparisons ...............................................................................................4-40Global Patterns of R&D Expenditures ...................................................................................4-40Comparison of Country R&D Intensities ...............................................................................4-42R&D by Performing Sector and Source of Funds ..................................................................4-44Government R&D Priorities ...................................................................................................4-46Business R&D Focus .............................................................................................................4-48Business Support for Academic R&D ....................................................................................4-52

4-2 � Chapter 4. Research and Development: National Trends and International Comparisons
List of TablesTable 4-1. U.S. R&D expenditures, by performing sector and source of funding: 2004–09 ......4-9Table 4-2. Annual rates of growth in U.S. R&D expenditures, total and by performing
sectors: 1989–2009................................................................................................................4-10Table 4-3. U.S. R&D expenditures, by performing sector, source of funds, and character
of work: 2009 ........................................................................................................................4-14Table 4-4. U.S. R&D expenditures, by character of work and performing sectors:
1979–2009 .............................................................................................................................4-16Table 4-5. U.S. average annual real GDP growth rates, unadjusted and R&D adjusted:
1959–2007 .............................................................................................................................4-17Table 4-6. Domestic R&D performed by the company, by industry and company
size: 2008 ..............................................................................................................................4-19Table 4-7. Sources of funds for domestic R&D performed by the company, by
selected industry and company size: 2008 ............................................................................4-20Table 4-8. Business R&D performed in the United States by the company, paid for
by the company and by others, by industry group: 2008 ......................................................4-22Table 4-9. Domestic R&D performance paid for by the company for top 10 business
activities: 2008 ......................................................................................................................4-24Table 4-10. Domestic R&D performance paid for by others for top 10 business
activities: 2008 ......................................................................................................................4-24Table 4-11. R&D performed abroad by U.S.-owned companies: 2008 .....................................4-25Table 4-12. R&D performed by majority-owned affiliates of foreign companies
in the United States, by selected NAICS industry of affiliate and country: 2008 ................4-26Table 4-13. R&D performed by U.S. multinational companies: 1999–2008 ............................4-27Table 4-14. R&D performed abroad by majority-owned foreign affiliates of U.S.
parent companies, by selected NAICS industry of affiliate and region/country/ economy: 2008 ......................................................................................................................4-29
Table 4-15. U.S. trade balance in research, development, and testing services, by affiliation: 2006–09 ...............................................................................................................4-30
List of SidebarsMeasured and Unmeasured R&D ................................................................................................4-8Location of R&D Performance by State ....................................................................................4-11Recent Developments in Innovation-Related Metrics ...............................................................4-18U.S. Business R&D and Innovation Survey ..............................................................................4-23Foreign Direct Investment in R&D ............................................................................................4-25Linking MNC Data from International Investment and Business R&D Surveys ......................4-26Federal Budgetary Concepts and Related Terms .......................................................................4-30Tracking R&D: The Gap between Performer- and Source-Reported Expenditures ..................4-34Major Federal Legislation Related to Technology Transfer and Commercializing R&D .........4-39Federal Technology Transfer: Activities and Metrics ...............................................................4-40Comparing International R&D Expenditures ............................................................................4-42R&D Intensity and the Composition of Gross Domestic Product ..............................................4-44Global R&D Expenses of Public Corporations ........................................................................4-51Government Funding Mechanisms for Academic Research .....................................................4-52
Conclusion .................................................................................................................................4-53Notes ..........................................................................................................................................4-53Glossary .....................................................................................................................................4-55References ..................................................................................................................................4-56

Science and Engineering Indicators 2012 � 4-3
List of FiguresFigure 4-1. U.S. total R&D expenditures: 1953–2009 ..............................................................4-10Figure 4-2. Ratio of U.S. R&D to gross domestic product, roles of federal and
nonfederal funding for R&D: 1953–2009 .............................................................................4-10Figure 4-3. Shares of U.S. total R&D expenditures, by performing sector and funding
source: 2009 ..........................................................................................................................4-13Figure 4-4. U.S. R&D, by performing and funding sectors: 1953–2009 ...................................4-13Figure 4-5. U.S. total R&D expenditures, by source of funding: 1953–2009 ...........................4-15Figure 4-6. U.S. R&D by character of work, basic research by performing sector,
and basic research by source of funds: 2009 .........................................................................4-17Figure 4-7. Domestic R&D performed and paid for by the company as a percentage
of domestic net sales: 2008 ...................................................................................................4-19Figure 4-8. Shares of domestic R&D performed in the United States, by industry
group: 2008 ...........................................................................................................................4-23Figure 4-9. Regional shares of R&D performed abroad by foreign affiliates of U.S.
MNCs: 1997–2008 ................................................................................................................4-28Figure 4-10. Federal budget authority for R&D, by budget function: FY 1980–2010 ..............4-31Figure 4-11. Federal obligations for R&D and R&D plant: FY 1980–2009 .............................4-33Figure 4-12. Federal obligations for R&D, by agency and character of work: FY 2009 .........4-36Figure 4-13. Federal obligations for research, by agency and major S&E field: FY 2009 .......4-37Figure 4-14. Global R&D expenditures by region: 2009 ..........................................................4-43Figure 4-15. Gross domestic expenditures on R&D by the United States, EU,
and selected other countries: 1981–2009 ..............................................................................4-44Figure 4-16. Gross expenditures on R&D as share of gross domestic product, for
selected countries: 1981–2009 ..............................................................................................4-46Figure 4-17. Share of industrial R&D, by industry sector and selected country: 2007–10 .......4-50Figure 4-18. Academic R&D financed by business, for selected countries: 1981–2009 ..........4-52Figure 4-A. Differences in U.S. performer-reported and agency-reported federal R&D:
1985–2009 .............................................................................................................................4-34Figure 4-B. Composition of gross domestic product, for selected countries/economies,
by sector: 2010 ......................................................................................................................4-44
Table 4-16. Federal obligations for R&D and R&D plant, by agency and performer: FY 2009 .................................................................................................................................4-32
Table 4-17. Federal obligations for R&D, by agency and character of work: FY 2009 ...........4-35Table 4-18. Federal laboratory technology transfer activity indicators, total and
selected U.S. agencies: FY 2004 and FY 2009 .....................................................................4-41Table 4-19. International comparisons of gross domestic expenditures on R&D and
R&D share of gross domestic product, by region and selected country/economy: 2009 or most recent year .......................................................................................................4-45
Table 4-20. Expenditures on R&D as share of gross domestic product for all R&D, nondefense R&D, and basic research, by selected country/economy: 2009 or most recent year .............................................................................................................................4-47
Table 4-21. Gross expenditures on R&D by performing sector, by selected country/ economy: 2009 or most recent year ......................................................................................4-47
Table 4-22. Gross expenditures on R&D by funding source, by selected country/ economy: 2009 or most recent year ......................................................................................4-48
Table 4-23. Government R&D support by major socioeconomic objectives, by selected region/country: 1981–2009 ................................................................................4-49
Table 4-A. Top 10 U.S. states in R&D performance, by sector and intensity: 2008 .................4-12Table 4-B. Global R&D spending by top 20 corporations: 2009 ..............................................4-51

4-4 � Chapter 4. Research and Development: National Trends and International Comparisons
Trends in National R&D PerformanceGrowth in total U.S. R&D performance slowed noticeably in 2009, compared to the last several years, but the broader trend remains that R&D spending growth continues to sig-nificantly outpace growth of the U.S. economy as a whole.
� Overall R&D performed in the United States in 2009 to-taled an estimated $400 billion (current dollars)—some-what below the $403 billion level in 2008, but well above the $377 billion in 2007. Adjusted for inflation, the 2009 estimate represents a $6 billion or 1.7% decline from 2008.
� The 2009 slowdown primarily reflects a drop in business R&D in the face of the 2008–09 financial crisis and the economic recession. At the same time, R&D spending in other performing sectors continued to rise, notably for federal and academic R&D, in part because of the one-time federal R&D funding increase appropriated in the American Recovery and Reinvestment Act of 2009.
� U.S. R&D performance has increased largely uninter-rupted since 1953. Over the last 5 years (2004–09), annual growth in U.S. R&D spending averaged 5.8%, compared to annual average growth of 3.3% for U.S. gross domes-tic product (GDP). Indeed, over the last several decades, average annual growth in R&D spending has substantially outpaced that of GDP.
The business sector continues to account for most of both U.S. R&D performance and R&D funding.
� The business sector performed an estimated $282 billion of R&D in 2009, or 71% of the U.S. total, drawing on business, federal sources, and other sources of R&D support. The business sector itself provided an estimated $247 billion of funding for R&D in 2009, or 62% of the U.S. total; almost all of which supported R&D performed by business.
� The levels of business R&D performance and funding were both higher in 2008 than in 2009 ($291 billion and $259 billion, respectively). Even with the decline in 2009, expanded business spending has accounted for most of the nation’s R&D growth over the last 5 years.
� The academic sector is the second-largest performer of U.S. R&D, accounting for an estimated $54 billion in 2009, or about 14% of the national total.
� The federal government is the second-largest funder of U.S. R&D, providing an estimated $124 billion, or 31% of the U.S. total in 2009.
U.S. R&D is dominated by development activities, large-ly performed by the business sector. The business sector also performs the majority of applied research, but most basic research is conducted at universities and colleges and funded by the federal government.
� In 2009, basic research was about 19% ($76 billion) of to-tal U.S. R&D performance, applied research was about 18% ($71 billion), and development was about 63% ($253 billion).
� Universities and colleges historically have been the main performers of U.S. basic research—and accounted for about 53% of all U.S. basic research in 2009. The federal govern-ment remains the primary source of basic research funding, accounting for about 53% of all such funding in 2009.
� The business sector is the predominant performer of ap-plied research, accounting for 58% of all U.S. applied research in 2009. Business is also the largest source of funding for applied research, providing 48% in 2009.
� Development is by far the largest component of U.S. R&D. Funding for development comes primarily from the busi-ness sector, 78% in 2009; nearly all of the rest comes from the federal government.
R&D and GDP GrowthTreating R&D as an investment, rather than as an ex-pense, affects estimates of GDP growth.
� When R&D is treated as an investment, estimates of aver-age annual GDP growth between 1959 and 2007 are 0.07 points higher than when R&D is treated as an expense.
� The difference in estimated average annual growth is high-er in recent periods: 0.17 percentage points for 1995 to 2001 and 0.12 percentage points from 2002 to 2007.
U.S. Business R&DDomestic R&D performed by the business sector reached $291 billion in 2008.
� More than three-quarters of U.S. business R&D is per-formed in six industry groups—four in manufacturing (chemicals, computer and electronic products, aerospace and defense, and automotive) and two in services (software and computer-related products, and R&D services).
Highlights

R&D by Multinational CompaniesThe majority of R&D by U.S. multinational companies (MNCs) continues to be performed in the United States. Outside the United States, R&D by U.S.-owned for-eign affiliates is performed mostly in Western Europe, Canada, and Japan, followed more recently by other lo-cations in the Asia-Pacific region.
� In 2008, U.S. MNC parent companies and their majori-ty-owned foreign affiliates performed $236.1 billion in R&D worldwide, according to the Bureau of Economic Analysis. This included $199.1 billion performed by the parent companies in the United States and $37.0 billion by their majority-owned foreign affiliates.
� The share of R&D performed by Asia-located affiliates (other than in Japan) increased from 5.3% to 14.4% from 1997 to 2008. In particular, the share of U.S.-owned af-filiates R&D performed in China, South Korea, Singapore, and India rose from a half percentage point or less in 1997 to 4% for China, just under 3% for South Korea, and just under 2% each for Singapore and India in 2008.
� Majority-owned affiliates of foreign MNCs located in the United States (U.S. affiliates) performed $40.5 billion of R&D in 2008 virtually unchanged from the $41.0 billion they performed in 2007. Since 1999, the share of these companies in total business R&D has fluctuated narrowly between 13% and 15%.
Exports and Imports of R&D-Related ServicesTrends in cross-border transactions in research, devel-opment, and testing (RDT) services are another indica-tor of global linkages.
� In 2009, U.S. RDT exports and imports stood at $18.2 bil-lion and $15.8 billion, respectively, for a balance of $2.5 billion.
� In 2008, the proportion of RDT exports ($17.4 billion) to domestic U.S. business R&D performance ($290.7 billion) was 5.6%. This proportion was about 3.8% in 2001.
� Most transactions in RDT services—around 85% of total annual RDT exports—occur within multinational companies.
Federal R&DFederal spending on R&D has continued to grow, al-though at a slower pace, when adjusted for inflation, in the last several years. Defense continues to account for more than half of annual federal R&D spending. Health-related R&D accounts for the majority of federal nonde-fense R&D.
� Eight federal agencies accounted for 97% of federal R&D spending in FY 2009: the departments of Commerce, Defense, Energy, Health and Human Services, and Homeland Security, and the National Science Foundation and National Air and Space Administration. Federal ob-ligations for R&D have increased annually since the late 1990s. When adjusted for inflation, growth has been flatter after FY 2005.
� In FY 2009, federal obligations for R&D reached $133.3 billion and an additional $3.6 billion for R&D plant. The American Recovery and Reinvestment Act of 2009 obli-gated an additional $8.7 billion for R&D and $1.4 billion for R&D plant for the same fiscal year.
� In the last 10 years, federal funding for basic and applied research has grown faster in the life sciences, mathemat-ics/computer sciences, and psychology than in other fields. In the environmental sciences, growth has not kept pace with inflation.
� Over the last two decades, the greatest change in federal R&D priorities has been the rise in health-related R&D, which currently accounts for just over half of nondefense R&D spending.
Federal R&E Tax CreditTo counteract potential business underinvestment in R&D, the federal government makes available tax cred-its for companies that expand their R&D activities.
� Business research and experimentation (R&E) tax credit claims were about $8.3 billion both in 2007 and in 2008.
� Five industries accounted for 75% of R&E credit claims in 2008: computer and electronic products; chemicals, includ-ing pharmaceuticals and medicines; transportation equip-ment, including motor vehicles and aerospace; information, including software; and professional, scientific, and techni-cal services, including computer and R&D services.
International R&D ComparisonsThe top three R&D-performing countries: United States, China—now the second largest R&D performer—and Japan represented just over half of the estimated $1.28 trillion in global R&D in 2009.
� The United States, the largest single R&D-performing country, accounted for about 31% of the 2009 global total, down from 38% in 1999.
� Asian countries—including China, India, Japan, Malaysia, Singapore, South Korea, Taiwan, and Thailand—repre-sented 24% of the global R&D total in 1999 but accounted for 32% in 2009, including China (12%) and Japan (11%).
Science and Engineering Indicators 2012 � 4-5

4-6 � Chapter 4. Research and Development: National Trends and International Comparisons
� The pace of real growth over the past 10 years in China’s over-all R&D remains exceptionally high at about 20% annually.
� The European Union accounted for 23% total global R&D in 2009, down from 27% in 1999.
Wealthy economies generally devote larger shares of their GDP to R&D than do less developed economies.
� The U.S. R&D/GDP ratio (or R&D intensity) was about 2.9% in 2009 and has fluctuated between 2.6% and 2.8% during the past 10 years, largely reflecting changes in busi-ness R&D spending.
� In 2009, the United States ranked eighth in R&D inten-sity—surpassed by Israel, Sweden, Finland, Japan, South Korea, Switzerland, and Taiwan—all of which perform far less R&D annually than the United States.
� Among the top European R&D-performing countries, Germany reported a 2.8% R&D/GDP ratio in 2008; France, 2.2%; and the United Kingdom, 1.9%.
� The Japanese and South Korean R&D/GDP ratios were among the highest in the world in 2008, each at about 3.3%. China’s ratio remains relatively low, at 1.7%, but has more than doubled from 0.8% in 1999.

Science and Engineering Indicators 2012 � 4-7
IntroductionResearch and development activities are an important in-
put to commercial innovation and the objectives of govern-ment agencies. R&D is part of a class of intangible inputs that also include software, higher education, and worker training. Intangibles are at least as important sources of long-term economic growth as are physical investments in machinery, equipment, and other infrastructure (Corrado et al. 2006; Jorgenson 2007; Van Ark and Hulten 2007). Indeed, the America COMPETES Act1 specifically recognizes the role of innovation, STEM education, entrepreneurship, and technol-ogy transfer based on federally performed or funded R&D in strengthening U.S. competitiveness.
This chapter focuses on R&D, presenting data on public and private funding and performance in the United States. It also examines related international investments or transac-tions involving R&D financing or performance.
Chapter OrganizationThis chapter is organized into eight main sections. A sec-
tion on trends in national R&D performance is followed by four sections on the business sector. Business R&D, the second sec-tion, covers domestic R&D in detail. The third section covers foreign operations of U.S.-owned companies. The fourth sec-tion examines R&D by U.S. multinational companies (MNCs) and foreign-owned MNCs with U.S. activities, and the fifth de-scribes international transactions in R&D services.
The sixth section presents patterns of federal government R&D, including mission areas such as defense, energy, and health, and concludes with federal tax incentives for busi-ness R&D. This is followed by a section on selected federal programs to aid small businesses and activities in technology transfer and commercialization.
The eighth and last section discusses international com-parisons of R&D, including national R&D expenditures by performer and source (including universities), national R&D intensities, and government R&D priorities across member countries of the Organisation for Economic Cooperation and Development (OECD). The chapter also includes two ap-pendix tables (appendix tables 4-1 and 4-2) that contain in-formation on how R&D comparisons across time and among different countries can be made.
Trends in National R&D PerformanceThe U.S. R&D system consists of a variety of perform-
ers and sources of funding, including businesses, the federal government, universities and colleges, other (nonfederal) gov-ernment, and nonprofit organizations. Organizations that per-form R&D often receive significant levels of outside funding; those that fund R&D may also be significant performers. (See sidebar, “Measured and Unmeasured R&D.”) The discussion throughout this section examines current levels and key trends in U.S. R&D performance and funding (see Glossary for defi-nitions).2 Supporting this section is a series of appendix tables
(appendix tables 4-3 through 4-10) that report core data on U.S. national patterns of R&D funding and performance.
Trends in U.S. R&D Performance and R&D Intensity
Overall spending on R&D conducted in the United States in calendar year 2009 is estimated to have totaled $400.5 bil-lion, somewhat below the 2008 level of $403.0 billion, but well above the $377.0 billion in 2007 (current dollars) (table 4-1). Adjusted for inflation, the 2009 level is a $6 billion or 1.7% decline from 2008.3
The 2009 spending slowdown primarily reflects a drop in business R&D in both current and constant dollars in the face of the 2008–09 financial crisis and economic reces-sion. However, R&D spending in other sectors continued to rise, in both current and constant dollar terms. Some of this was the effect—notably for federal and academic R&D and R&D infrastructure—of the one-time $18.3 billion fund-ing increase appropriated in the American Recovery and Reinvestment Act of 2009 (ARRA, Public Law 111-5, en-acted in February 2009).
The 2009 slowdown in spending growth notwithstanding, increases in national R&D spending have occurred largely uninterrupted since 1953 in both current and real dollars (figure 4-1). U.S. R&D spending crossed the $100 billion (current dollars) threshold in 1984, passed $200 billion in 1997, exceeded $300 billion in 2004, and was at or above $400 billion in both 2008 and 2009.
The year-over-year rate of R&D funding growth outpaced that of gross domestic product in each of the last 3 years—even during the economic downturn (table 4-2). Over the last 5 years (2004–09), annual growth in the total of R&D spending averaged 5.8%, compared to GDP at 3.3%. And, similarly, growth in total R&D spending outpaces that of GDP when the averaging period is either 10 or 20 years. The same relative findings prevail when the dollars are adjusted for inflation (table 4-2).
R&D intensity—a country’s national R&D expenditures expressed as a percentage of its GDP—provides another gauge of overall national R&D performance and is a widely used target-setting tool internationally.
In 2009, the U.S. R&D/GDP ratio was nearly 2.9%, ris-ing from around 2.8% in 2008 and 2.7% in 2007 (figure 4-2). The ratio has ranged from 1.4% in 1953 to a high of nearly 2.9% in 1964 and has fluctuated in the range of 2.1% to 2.8% in the subsequent years.
Most of this continuity in the U.S. R&D/GDP ratio re-flects the growth in nonfederal R&D spending, which rose from about 0.6% of GDP in 1953 to just below 2.0% in the last several years. The increase reflects the growing role of business R&D in the national R&D system and, more broad-ly, the growing prominence of R&D-derived goods and ser-vices in the national and global economies.
The peaks and valleys in the U.S. R&D/GDP ratio also reflect changing federal R&D priorities. The ratio’s drop from its peak in 1964 resulted largely from federal cutbacks

4-8 � Chapter 4. Research and Development: National Trends and International Comparisons
in defense and space R&D programs. From 1975 to 1979, gains in energy R&D activities worked to keep the ratio sta-ble. Beginning in the late 1980s, cuts in defense-related R&D lowered the federal R&D/GDP ratio, which was counterbal-anced by a steady or rising nonfederal ratio. Since 2000, in-creased federal spending for, notably, defense and biomedical research have helped to push upward the federal ratio.
Performers of R&DThe National Science Foundation (NSF) tracks the R&D
spending patterns of all the major performers in the overall U.S. R&D system: businesses, intramural R&D activities of federal agencies, federally funded R&D centers (FFRDCs), universities and colleges, and other nonprofit organiza-tions. For state-level detail see sidebar, “Location of R&D Performance by State” and chapter 8.
The statistics on U.S. R&D discussed in this section re-flect the National Science Foundation’s periodic National Patterns of R&D Resources reports and data series with a comprehensive account of total U.S. R&D performance. The National Patterns data, in turn, derive from five ma-jor NSF surveys of organizations that perform the bulk of U.S. R&D. These are:
� Survey of Federal Funds for R&D
� Survey of R&D Expenditures at Federally Funded R&D Centers
� Business R&D and Innovation Survey
� Survey of R&D Expenditures at Universities and Colleges
� Survey of R&D Funding and Performance by Nonprofit Organizations
National Patterns integrates the R&D spending and fund-ing data from these separate surveys into U.S. R&D totals, which are calculated on a calendar-year basis, disaggregated for the main performing sectors and funding sources. Due to practical constraints, some elements of R&D performance are omitted from the U.S. totals. In evaluating R&D perfor-mance trends over time and in international comparisons, it is important to be aware of these omissions.
To reduce cost and respondent burden, the U.S. busi-ness R&D estimates are derived from a survey of R&D-performing companies with five or more employees. Accordingly, no estimates of R&D performance currently are available for companies with fewer than five employ-ees. (NSF is currently working on the design and imple-mentation of a Microbusiness Innovation and Science and Technology (MIST) Survey, which will collect data from companies with fewer than five employees.)
Social science R&D had, until 2008, been excluded from the U.S. business R&D statistics. R&D in the hu-manities and other non-S&E fields (such as law) has been excluded from the U.S. academic R&D statistics. (Other countries include both in their national statistics, making their national R&D expenditures relatively larger when compared with those of the United States.) Changes are now underway in both these respects in the U.S. surveys.
NSF’s new U.S. Business R&D and Innovation Survey (see BRDIS sidebar later in this chapter), fielded for the first time in 2009 (to collect 2008 data), now includes social science R&D ($1.2 billion in 2008) and will also better capture the full range of business R&D funded by others. NSF is also now fielding a redesigned Higher Education R&D Survey (starting with the 2010 academic fiscal year), which will include non-S&E R&D expendi-tures in the reported totals.
The statistics for academic R&D track research ex-penditures that are separately budgeted and accounted (notably, sponsored research). But U.S. universities generally do not maintain records for the “departmental research” performed by faculty, which then cannot be included in the academic R&D totals. This can be a sig-nificant limitation in international R&D comparisons, as department research estimates are often included in the national statistics of other countries. (For a further discus-sion, see sidebar “Government Funding Mechanisms for Academic Research” later in this chapter.)
Likewise, the activity of individuals performing R&D on their own time and not under the auspices of a corpo-ration, university, or other organization is omitted from official U.S. R&D statistics.
Statistics on R&D performance by state governments had only been sporadically collected until 2006 and 2007, when NSF and the U.S. Census Bureau first fielded a sur-vey on this topic (now being conducted every 2 years; state government R&D performance totals only several hundred million dollars annually). Finally, NSF has not fielded a full survey on R&D performance by nonprofit organizations since 1998—the National Patterns perfor-mance figures for this sector in the national R&D totals are estimated.
The National Center for Science and Engineering Statistics has commissioned the National Research Council’s Committee on National Statistics (CNSTAT) to form a panel to review the methodologies used in de-veloping the National Patterns dataset. The panel began work in mid-2011.
Measured and Unmeasured R&D

Science and Engineering Indicators 2012 � 4-9
Business Sector The business sector is by far the largest performer of U.S.
R&D. R&D performed by businesses in the United States totaled an estimated $282.4 billion in 2009 (table 4-1), about 71% of total U.S. R&D (figure 4-3). This predominance of
the business sector has long been the case (figure 4-4), with shares of national R&D performance ranging from 69% to 75% over the course of the last 20 years. The business sector is also the nation’s largest R&D funder, accounting for about 62% of the U.S. total.
Table 4-1U.S. R&D expenditures, by performing sector and source of funding: 2004–09
Sector 2004 2005 2006 2007 2008 2009
Current $millions
All performing sectors ............................................ 302,503 324,993 350,162 376,960 403,040 400,458Business ............................................................. 208,301 226,159 247,669 269,267 290,681 282,393Federal government ............................................ 37,685 39,568 41,611 43,906 44,674 46,151
Federal intramurala .......................................... 24,898 26,322 28,240 29,859 29,839 30,901FFRDCs ........................................................... 12,788 13,246 13,371 14,047 14,835 15,250
Industry administeredb ................................. 2,485 2,601 3,122 5,165 6,346 6,446U&C administeredb ...................................... 7,659 7,817 7,306 5,567 4,766 4,968Nonprofit administered ................................ 2,644 2,828 2,943 3,316 3,724 3,835
Universities and colleges .................................... 43,122 45,190 46,955 49,010 51,650 54,382Other nonprofit organizations ............................. 13,394 14,077 13,928 14,777 16,035 17,531
All funding sectors .................................................. 302,503 324,993 350,162 376,960 403,040 400,458Business ............................................................. 191,266 207,680 227,057 246,679 258,626 247,357Federal government ............................................ 91,656 96,276 100,768 105,822 117,611 124,432Universities and colleges .................................... 7,936 8,578 9,285 9,959 10,707 11,436Nonfederal government ...................................... 2,883 2,922 3,021 3,265 3,518 3,675Other nonprofit organizations ............................. 8,761 9,538 10,031 11,235 12,578 13,559
Constant 2005 $millions
All performing sectors ............................................ 312,548 324,993 339,202 354,864 371,184 364,951Business ............................................................. 215,218 226,159 239,917 253,484 267,706 257,355Federal government ............................................ 38,937 39,568 40,308 41,332 41,143 42,059
Federal intramurala .......................................... 25,724 26,322 27,356 28,109 27,480 28,161FFRDCs ........................................................... 13,212 13,246 12,953 13,224 13,663 13,897
Industry administeredb ................................. 2,568 2,601 3,024 4,862 5,844 5,875U&C administeredb ...................................... 7,913 7,817 7,078 5,241 4,389 4,528Nonprofit administered ................................ 2,732 2,828 2,851 3,121 3,429 3,495
Universities and colleges .................................... 44,554 45,190 45,485 46,137 47,568 49,561Other nonprofit organizations ............................. 13,839 14,077 13,492 13,911 14,767 15,977
All funding sectors .................................................. 312,548 324,993 339,202 354,864 371,184 364,951Business ............................................................. 197,617 207,680 219,950 232,220 238,184 225,425Federal government ............................................ 94,700 96,276 97,614 99,619 108,315 113,399Universities and colleges .................................... 8,200 8,578 8,995 9,375 9,861 10,422Nonfederal government ...................................... 2,979 2,922 2,926 3,074 3,240 3,349Other nonprofit organizations ............................. 9,052 9,538 9,717 10,576 11,584 12,356
FFRDC = federally funded research and development center; U&C = universities and colleges
a Includes expenditures of federal intramural R&D and costs associated with administering extramural R&D.b Los Alamos National Laboratory (approximately $2 billion in annual R&D expenditures in recent years) became industry administered in June 2006; previously, it was U&C administered. Lawrence Livermore National Laboratory (more than $1 billion in annual R&D expenditures in recent years) became industry administered in October 2007; previously, it was U&C administered. These shifts in administration category are a main reason for the changes apparent in the R&D performer figures across 2006, 2007, and 2008.
NOTES: Data are based on annual reports by performers except for the nonprofit sector. Expenditure levels for academic and federal government performers are calendar-year approximations based on fiscal year data. For federal government expenditures, the approximation is equal to 75% of the amount reported in the same fiscal year plus 25% of the amount reported in the subsequent fiscal year. For academic expenditures, the respective percentages are 50 and 50, because those fiscal years generally begin on July 1 instead of October 1. Some of the figures for other nonprofit organizations are estimated and may later be revised.
SOURCE: National Science Foundation, National Center for Science and Engineering Statistics, National Patterns of R&D Resources (annual series). See appendix tables 4-3 and 4-7.
Science and Engineering Indicators 2012

4-10 � Chapter 4. Research and Development: National Trends and International Comparisons
Table 4-2Annual rates of growth in U.S. R&D expenditures, total and by performing sectors: 1989–2009(Percent)
Longer term trend Most recent years
Expenditures and gross domestic product 1989–2009 1999–2009 2004–09 2006–07 2007–08 2008–09
Current dollars
Total R&D, all performers ........................... 5.3 5.0 5.8 7.7 6.9 -0.6Business ................................................. 5.3 4.5 6.3 8.7 8.0 -2.9Federal government ................................ 3.6 5.7 4.1 5.5 1.8 3.3
Federal intramurala .............................. 3.6 5.6 4.4 5.7 -0.1 3.6FFRDCs ............................................... 3.6 5.8 3.6 5.1 5.6 2.8
Universities and colleges ........................ 6.4 6.8 4.7 4.4 5.4 5.3Other nonprofit organizations ................. 8.1 7.9 5.5 6.1 8.5 9.3
Gross domestic product............................. 4.8 4.1 3.3 4.9 1.9 -2.5
Constant 2005 dollars
Total R&D, all performers ........................... 2.9 2.6 3.1 4.6 4.6 –1.7Business ................................................. 3.0 2.1 3.6 5.7 5.6 –3.9Federal government ................................ 1.3 3.2 1.6 2.5 –0.5 2.2
Federal intramurala .............................. 1.3 3.2 1.8 2.8 –2.2 2.5FFRDCs ............................................... 1.3 3.3 1.0 2.1 3.3 1.7
Universities and colleges ........................ 4.0 4.3 2.2 1.4 3.1 4.2Other nonprofit organizations ................. 5.7 5.4 2.9 3.1 6.2 8.2
Gross domestic product............................. 2.4 1.7 0.7 1.9 –0.3 –3.5aIncludes expenditures of federal intramural R&D as well as costs associated with administering extramural R&D.
NOTE: Longer term trend rates are calculated as compound annual growth rates.
SOURCE: National Science Foundation, National Center for Science and Engineering Statistics, National Patterns of R&D Resources (annual series).
Science and Engineering Indicators 2012
Figure 4-1U.S. total R&D expenditures: 1953–2009Dollars (billions)
NOTE: Some figures involve estimates and may later be revised.
SOURCE: National Science Foundation, National Center for Science and Engineering Statistics, National Patterns of R&D Resources (annual series). See appendix table 4-3.
Science and Engineering Indicators 2012
1953 1961 1969 1977 1985 1993 2001 20090
50
100
150
200
250
300
350
400
450
Current dollars
Constant 2005 dollars
Figure 4-2Ratio of U.S. R&D to gross domestic product, roles of federal and nonfederal funding for R&D: 1953–2009Percent
GDP = gross domestic product
NOTES: Some figures involve estimates and may later be revised. Federal R&D/GDP ratios represent the federal government as a funder of R&D by all performers; the nonfederal ratios reflect all other sources of R&D funding.
SOURCE: National Science Foundation, National Center for Science and Engineering Statistics, National Patterns of R&D Resources (annual series).
Science and Engineering Indicators 2012
1953 1961 1969 1977 1985 1993 2001 20090
0.5
1.0
1.5
2.0
2.5
3.0
Total R&D/GDP
Federal R&D/GDP
Nonfederal R&D/GDP

Science and Engineering Indicators 2012 � 4-11
A decline of business R&D performance from $290.7 bil-lion in 2008 to $282.4 billion in 2009 was the first such year-to-year decline since 2002. Nevertheless, business R&D performance rose on average (table 4-2) at 6.3% annually from 2004 to 2009, outpacing the growth rates of both total U.S. R&D (5.8%) and gross domestic product (3.3%). After adjusting for inflation, business R&D grew at a 3.6% annual rate, total R&D at 3.1%, and U.S. GDP at 0.7%).
Universities and CollegesUniversities and colleges performed $54.4 billion of
R&D in 2009 (table 4-1). This was almost 14% of total U.S. R&D spending that year, making academia the second- largest performer of U.S. R&D (figure 4-3).
Academic R&D spending increased in each of the last 5 years (in both current dollars and constant dollars). The academic share in total U.S. R&D has ranged between 11% and 14% over the past 20 years.
Universities and colleges have a special niche in the na-tion’s R&D system: they performed more than half (53%) of the nation’s basic research in 2009. Academic institutions also rely much more extensively than the business sector on exter-nal sources of funding, particularly the federal government, at about 60%, to support the R&D they perform. (See chapter 5 for an extensive analysis of academic R&D.)
Distribution of R&D expenditures among the U.S. statesIn 2008, the 10 states with the largest R&D expendi-
ture levels accounted for about 62% of U.S. R&D expen-ditures that can be allocated to the states: California, New Jersey, Texas, Massachusetts, Washington, New York, Maryland, Michigan, Pennsylvania, and Illinois (table 4-A).* California alone accounted for 22% of the U.S. total, exceeding the next-highest state, Massachusetts, by almost 4 times. The top 20 states accounted for 84% of the R&D total; the 20 lowest-ranking states, around 5% (see appendix tables 4-11 and 4-12).
The states with the biggest R&D expenditures are not necessarily those with the greatest relative concentration of R&D. Among those with the highest R&D/GDP ra-tios in 2008 were New Mexico, the District of Columbia, Maryland, and Massachusetts (table 4-A). New Mexico is the location of a number of major government research fa-cilities. The District of Columbia is home to major federal science and technology agencies with intramural research labs and R&D management activities. Maryland is also the site of many government research facilities and grow-ing research universities. Massachusetts benefits from both leading research universities and thriving high-technology industries. California has relatively high R&D intensity, but nonetheless is ninth from the top. (Chapter 8 provides ad-ditional information on R&D related activities in the states.)
U.S. R&D performance by sector and stateThe proportion of R&D performed by each of the main
R&D-performing sectors (business, universities and col-leges, federal intramural and FFRDCs) varies across the states, but the states that lead in total R&D also tend to be well represented in each of these sectors (table 4-A).
In 2008, R&D performed by the business sector ac-counted for about 73% of the U.S. R&D total that could be allocated to specific states. Of the top 10 states in to-tal R&D performance, 9 are also in the top 10 in indus-try R&D. Connecticut, 8th in business-sector R&D and
home to substantial pharmaceutical R&D activity, sur-passes Maryland in the business R&D ranking.
University-performed R&D accounts for 14% of the allocable U.S. total and mirrors the distribution of over-all R&D performance. Only New Jersey and Washington fall out of the top 10 total R&D states, replaced by North Carolina and Ohio.
Federal R&D performance (including both intramural and FFRDCs)—about 12% of the U.S. total—is more con-centrated geographically than that in other sectors. Only 5 states—Maryland, California, New Mexico, the District of Columbia, and Virginia—account for 65% of all federal R&D performance.** This figure rises to 80% when the other 5 of the top 10 states—Massachusetts, Tennessee, Washington, Illinois, and Alabama—are included.
Federal R&D accounts for the bulk of total R&D in several states, including New Mexico, which is home to the nation’s two largest FFRDCs (Los Alamos and Sandia National Laboratories) and Tennessee (36%) home to Oak Ridge National Laboratory. The high fig-ures for Maryland (55%), the District of Columbia (80%), and Virginia (37%) reflect the concentration of federal facilities and federal R&D administrative offices in the national capital area.
* The latest data available on the distribution of U.S. R&D perfor-mance by state are for 2008. Total U.S. R&D expenditures that year are estimated at $403.0 billion. Of this total, $372.7 billion could be attrib-uted to one of the 50 states or the District of Columbia. This state-attrib-uted total differs from the U.S. total for a number of reasons: some busi-ness R&D expenditures cannot be allocated to any of the 50 states or the District of Columbia because respondents did not answer the question related to location; nonfederal sources of nonprofit R&D expenditures (an estimated $8.4 billion in 2008) could not be allocated by state; state-level university R&D data have not been adjusted for double-counting of R&D passed from one academic institution to another; and state-level university and federal R&D performance data are not converted from fiscal to calendar years.
** Federal intramural R&D includes costs associated with the admin-istration of intramural and extramural programs by federal personnel, as well as actual intramural R&D performance. This is a main reason for the large amount of federal intramural R&D in the District of Columbia.
Location of R&D Performance by State

4-12 � Chapter 4. Research and Development: National Trends and International Comparisons
Location of R&D Performance by State—continued
Table 4-A
Top 10 U.S. states in R&D performance, by sector and intensity: 2008
All R&Da R&D intensity (R&D/GDP ratio)
Rank State
Amount (current
$millions) Business U&CFederal intramural
and FFRDCb StateR&D/GDP
(%)
GDP (current $billions)
1 California 81,323 California California Maryland New Mexico 7.58 78.02 New Jersey 20,713 New Jersey New York California District of Columbia 6.15 96.83 Texas 20,316 Texas Texas New Mexico Maryland 5.92 280.54 Massachusetts 20,090 Massachusetts Maryland District of Columbia Massachusetts 5.53 363.15 Washington 16,696 Washington Pennsylvania Virginia Connecticut 5.10 222.26 Maryland 16,605 Michigan Massachusetts Massachusetts Washington 4.96 336.37 New York 16,486 New York North Carolina Tennessee New Jersey 4.28 484.38 Michigan 15,507 Connecticut Illinois Washington New Hampshire 4.24 58.89 Pennsylvania 13,068 Pennsylvania Ohio Illinois California 4.22 1,925.5
10 Illinois 11,961 Illinois Michigan Alabama Michigan 4.12 376.2
FFRDC = federally funded research and development center; GDP = gross domestic product; U&C = universities and colleges
aIncludes in-state total R&D performance of business sector, universities and colleges, federal agencies, FFRDCs, and federally financed nonprofit R&D. bIncludes costs associated with administration of intramural and extramural programs by federal personnel and actual intramural R&D performance.
NOTES: Small differences in parameters for state rankings may not be significant. Rankings do not account for the margin of error of the estimates from sample surveys.
SOURCES: National Science Foundation, National Center for Science and Engineering Statistics, National Patterns of R&D Resources (annual series). State GDP data are from the U.S. Bureau of Economic Analysis. See appendix tables 4-11 and 4-12.
Science and Engineering Indicators 2012
Sector ranking
Federal Agencies and FFRDCsR&D performed by the federal government includes the
activities of agency intramural research laboratories and fed-erally funded research and development centers (FFRDCs). The figures for intramural R&D also include expenditures for agency planning and administration of both intramural and extramural R&D projects. Federal agencies’ intramural R&D performance is funded entirely by the federal government. FFRDCs are R&D-performing organizations that are exclu-sively or substantially financed by the federal government. An FFRDC is operated to provide R&D capability to serve agency mission objectives or, in some cases, to provide major facilities at universities for research and associated training purposes. Each FFRDC is administered by an industrial firm, a university, a nonprofit institution, or a consortium.
R&D spending by federal intramural labs and FFRDCs was $46.2 billion in 2009, about 12% of all U.S. R&D (table 4-1). Of this amount, $30.9 billion (8% of all U.S. R&D) was intramural and $15.3 billion (4%) was R&D by FFRDCs.
Spending on this federal R&D performance grew rapidly from 2001 to 2003, primarily reflecting increased defense spending following the terrorist attacks in the United States on September 11, 2001. A slower pace of growth has pre-vailed, however, since then.
The volume of the federal government’s R&D perfor-mance is small compared with that of the U.S. business sector. Nonetheless, the $46.2 billion performance total in 2009 exceeds domestic R&D expenditures of every country except Japan, China, and Germany. And this figure does not
include government investments in R&D infrastructure and equipment, which support the maintenance and operation of unique research facilities and the conduct of research activi-ties that would be too costly or risky for a single company or university to undertake.
Other Nonprofit OrganizationsR&D performed in the United States by nonprofit orga-
nizations other than universities and certain FFRDCs is es-timated at $17.5 billion in 2009. This amount represents just over 4% of all U.S. R&D in that year, a share that has been fairly stable since 2000.
Sources of R&D FundingFunds that support the conduct of R&D in the United
States come from a variety of sources, including businesses, federal and other governments, academic institutions, and other nonprofit organizations. The mix of funding sources varies by performer.
R&D Funding by BusinessThe business sector, the largest performer of U.S. R&D,
is also its largest funder, at about $247.4 billion in 2009 or about 62% of the U.S. total (table 4-1, figure 4-3), virtu-ally all in support of business R&D.4 The business sector’s predominant role in funding R&D began in the early 1980s, when its support began to exceed 50% of all U.S. R&D funding (figure 4-5)—a share that has continually increased over the last 30 years. Just about all business funding for

Science and Engineering Indicators 2012 � 4-13
R&D (98%) is directed toward business R&D performance (table 4-3). The small remainder has gone to academic and other nonprofit performers. (For a fuller discussion, see the “U.S. Business R&D” section later in this chapter.)
R&D Funding by the Federal GovernmentThe federal government was once the predominant spon-
sor of the nation’s R&D, funding some 67% of all U.S. R&D in 1964 (figure 4-5). But the federal share decreased in sub-sequent years to less than half in 1979 and to a low of 25% in 2000. Changing business conditions and expanded fed-eral funding of health, defense, and counterterrorism R&D pushed it back up above 30% in 2009.
The federal government remains a major source of funds for all U.S. performer sectors except private business, where
its role (while not negligible) is substantially overshadowed by business’s own funds.
In 2009, according to the reports of R&D performers,5
the federal government provided an estimated $124.4 bil-lion (current dollars) of R&D funds, about 31% of all U.S. spending on R&D that year (table 4-1).
In 2009, the largest recipient of federal R&D funding, $46.2 billion, was federal agencies and their FFRDCs (table 4-3). FFRDCs also received about $400 million from non-federal sources, less than 1% of their total support.
Figure 4-3Shares of U.S. total R&D expenditures, by performing sector and funding source: 2009
NOTES: Some figures involve estimates and may later be revised. National R&D expenditures are estimated to be $400.5 billion in 2009. Federal performing sector includes federal agencies and federally funded research and development centers. State and local government support to business is included in business support for business performance.
SOURCE: National Science Foundation, National Center for Science and Engineering Statistics, National Patterns of R&D Resources (annual series). See appendix tables 4-3 and 4-7.
Science and Engineering Indicators 2012
Funding source
Performing sector
Business 61.7%
Federalgovernment
31.1%
Other nonprofit organizations 3.4%Universities and colleges
2.9%
Nonfederal government 0.9%
Business 70.5%
Federalgovernment
11.5%
Universities andcolleges 13.6%
Other nonprofit organizations 4.4%
Figure 4-4U.S. R&D, by performing and funding sectors: 1953–2009
NOTES: Some figures involve estimates and may later be revised. Current dollar figures are converted to constant dollars based on the implicit gross domestic product price deflator. Federal performers of R&D include federal agencies and federally funded research and development centers. Other funding includes support from universities and colleges, nonfederal government, and nonprofit organizations. State and local government funding to businesses is included in business support for business R&D performance.
SOURCE: National Science Foundation, National Center for Science and Engineering Statistics, National Patterns of R&D Resources (annual series). See appendix tables 4-3 and 4-7.
Science and Engineering Indicators 2012
Performing sector
Funding sector
Constant 2005 dollars (billions)
1953 1961 1969 1977 1985 1993 2001 20090
50
100
150
200
250
300
350
400
Business
U.S. total
Federal government
Universities and colleges
Nonprofit
0
50
100
150
200
250
300
350
400
Business
U.S. total
Federal government
Other
1953 1961 1969 1977 1985 1993 2001 2009

4-14 � Chapter 4. Research and Development: National Trends and International Comparisons
Table 4-3U.S. R&D expenditures, by performing sector, source of funds, and character of work: 2009
Source of funds ($millions)
Performing sector and character of work Total BusinessFederal
governmentUniversities and colleges
Other nonprofit
organizations
Total expenditures
(% distribution)
R&D ............................................................. 400,458 247,357 124,431 15,111 13,559 100.0Business .................................................. 282,393 242,820 39,573 ** ** 70.5Federal government ................................. 46,150 ** 46,150 ** ** 11.5
Federal intramural ................................ 30,901 ** 30,901 ** ** 7.7FFRDCs ................................................ 15,249 ** 15,249 ** ** 3.8
Industry administered ........................ 6,446 ** 6,446 ** ** 1.6U&C administered ............................. 4,968 ** 4,968 ** ** 1.2Nonprofit administered ...................... 3,835 ** 3,835 ** ** 1.0
Universities and colleges ......................... 54,383 3,279 31,575 15,111 4,418 13.6Other nonprofit organizations .................. 17,532 1,258 7,133 ** 9,141 4.4Percent distribution by source ................. 100.0 61.8 31.1 3.8 3.4 –
Basic research ......................................... 75,970 16,486 40,451 10,800 8,233 100.1Business ............................................... 14,784 13,444 1,340 ** ** 19.5Federal government ............................. 11,373 ** 11,373 ** ** 15.0
Federal intramural ........................... 5,507 ** 5,507 ** ** 7.2FFRDCs .......................................... 5,866 ** 5,866 ** ** 7.7
Industry administered .................. 2,550 ** 2,550 ** ** 3.4U&C administered ........................ 1,808 ** 1,808 ** ** 2.4Nonprofit administered ................ 1,508 ** 1,508 ** ** 2.0
Universities and colleges ..................... 40,544 2,344 24,242 10,800 3,158 53.4Other nonprofit organizations .............. 9,269 698 3,496 ** 5,075 12.2Percent distribution by source ............. 100.0 21.7 53.2 14.2 10.8 –
Applied research ...................................... 71,330 34,344 30,101 3,535 3,350 100.1Business ............................................... 41,055 33,258 7,797 ** ** 57.6Federal government ............................. 12,665 ** 12,665 ** ** 17.8
Federal intramural ........................... 8,006 ** 8,006 ** ** 11.2FFRDCs .......................................... 4,659 ** 4,659 ** ** 6.5
Industry administered .................. 1,930 ** 1,930 ** ** 2.7U&C administered ........................ 1,289 ** 1,289 ** ** 1.8Nonprofit administered ................ 1,440 ** 1,440 ** ** 2.0
Universities and colleges ..................... 11,912 767 6,577 3,535 1,033 16.7Other nonprofit organizations .............. 5,698 319 3,062 ** 2,317 8.0Percent distribution by source ............. 100.0 48.1 42.2 5.0 4.7 –
Development ............................................ 253,161 196,527 53,882 776 1,976 100.0Business ............................................... 226,554 196,118 30,436 ** ** 89.5Federal government ............................. 22,115 ** 22,115 ** ** 8.7
Federal intramural ........................... 17,389 ** 17,389 ** ** 6.9FFRDCs .......................................... 4,726 ** 4,726 ** ** 1.9
Industry administered .................. 1,967 ** 1,967 ** ** 0.8U&C administered ........................ 1,872 ** 1,872 ** ** 0.7Nonprofit administered ................ 887 ** 887 ** ** 0.4
Universities and colleges ..................... 1,927 168 756 776 227 0.8Other nonprofit organizations .............. 2,565 241 575 ** 1,749 1.0Percent distribution by source ............. 100.0 77.6 21.3 0.3 0.8 –
** = small to negligible amount, included in other funding sectors
FFRDC = federally funded research and development center; U&C = universities and colleges
NOTES: Funding for FFRDC performance is chiefly federal, but any nonfederal support is included in the federal figures. State and local government support to business is included in business support for business performance. State and local government support to U&C ($3,675 million) is included in U&C support for U&C performance. Some figures for other nonprofit organizations are estimates and may later be revised.
SOURCE: National Science Foundation, National Center for Science and Engineering Statistics, National Patterns of R&D Resources (annual series). See appendix tables 4-3–4-10.
Science and Engineering Indicators 2012

Science and Engineering Indicators 2012 � 4-15
R&D by Character of Work R&D encompasses a range of activities: from funda-
mental research in the physical, life, and social sciences; to research addressing such critical societal issues as global climate change, energy efficiency, and health care; to the development of platform or general-purpose technologies and new goods and services. Because the activities are so diverse, it helps to classify them in separate categories when analyzing R&D expenditures. The most widely used clas-sifications distinguish among basic research, applied re-search, and (experimental) development (see definitions in Glossary).6 Nevertheless, these categories are not always mutually exclusive and any particular R&D activity may have aspects of more than one category.
Basic ResearchIn 2009, spending on basic research activities amounted
to about $76.0 billion (19%) of the $400.5 billion of total U.S. R&D (table 4-4, figure 4-6). The basic research share has gradually moved upward, from about 14% in 1979 to 19% in 2009 (table 4-4).
Universities and colleges continue to occupy a unique po-sition in U.S. basic research. They are the primary performer of U.S. basic research (53% in 2009), while also training the next generation of researchers (table 4-4). The business sector performs nearly 20%; the federal government (agency intramural labs and FFRDC s), 15%; and other nonprofit or-ganizations, 12%.
The federal government remains by far the prime source of funding for basic research, accounting for about 53% of all such funding in 2009 (table 4-3). Universities and col-leges themselves provide about 14% of the funding. Other nonprofit organizations provide 11%.
Business’s $16.5 billion devoted to basic research is small by comparison to its $247.4 billion of funding for total R&D in 2009, but it still accounted for about 22% of the overall funding for basic research.
Business views about performing basic research involve considerations about the appropriability of results, commer-cialization risks, and uncertain investment returns. However, involvement in basic research can help boost human capital, attract and retain talent, absorb external knowledge, and strengthen innovation capacity. Businesses that invest most heavily in basic research are those whose new products are most directly tied to ongoing science and technological ad-vances, such as the pharmaceuticals and scientific R&D ser-vice sectors.
Applied ResearchApplied research activities accounted for about 18%
($71.3 billion) of total U.S. R&D in 2009, modestly under the amount spent on basic research that year (table 4-4). Looking back over two decades, the share of applied re-search is somewhat lower at present than in the past: 23% 5 years ago, 21% 10 years ago, and 23% 20 years ago.
The second largest recipient was the business sector, for which, in 2009, the federal government provided $39.6 billion of the $282.4 billion that funded business R&D. Through the early 1960s, more than half of the nation’s business R&D had been funded by the federal government. This share fell below 10% by 2000 and had rebounded to 143% by 2009 (appendix table 4-3).
Federal funds to academia provided $31.6 billion (58%) of the $54.4 billion spent on academic R&D in 2009. Of the $17.5 billion spent on R&D by other nonprofit organizations, $7.1 billion (about 41%) was supported by federal funds.
R&D Funding from Other SourcesThe balance of R&D funding from other sources is
small: $28.6 billion in 2009, or about 7% of all funding. This includes academia’s own institutional funds (which support academic institution’s own R&D), other nonprofits (the majority of which fund their own R&D, but also con-tribute to academic research), and state and local govern-ments (primarily for academic research).
Nonetheless, this segment of funding has been growing fairly rapidly for some time. From 1999 to 2009, growth in funding from these sectors averaged 5.4% per year in real-dollar terms—ahead of the pace of funding growth in both the federal and business sectors. Most R&D funded by these nonfederal sources is performed by the academic sector, which also provided about one-fifth of its own total spending on R&D.
Figure 4-5U.S. total R&D expenditures, by source of funding: 1953–2009Percent
NOTES: Some figures involve estimates and may later be revised. Other includes universities and colleges, state and local government, and other nonprofit organizations.
SOURCE: National Science Foundation, National Center for Science and Engineering Statistics, National Patterns of R&D Resources (annual series). See appendix table 4-7.
Science and Engineering Indicators 2012
1953 1961 1969 1977 1985 1993 2001 20090
10
20
30
40
50
60
70
80
Business
Federal government
Other

4-16 � Chapter 4. Research and Development: National Trends and International Comparisons
The business sector performed 90% ($226.6 billion) of this development total, and the federal government (agency intramural labs, FFRDCs), another 9%—much of it defense-related, with the federal government the main consumer. By contrast, academic and other nonprofit organizations per-form very little of U.S. development, each performing less than 1% of the total in 2009.
The business sector also provided about three-quarters (78%) of development funding ($196.5 billion) in 2009, near-ly all of it in support of business development activities (table 4-3). The federal government provided 21% ($53.9 billion) of the funding, with more than half going to business develop-ment—especially in defense-related industries—and most of the remainder going to federal intramural labs and FFRDCs.
Universities and colleges and other nonprofit organiza-tions provide small amounts of funding to support develop-ment performance in their own sectors.
The business sector performed 58% of all applied re-search in 2009; the federal government (federal agency in-tramural labs and FFRDCs), 18%; universities and colleges, another 17%; nonprofit organizations, 8% (table 4-4).
Business provided the bulk of funding for applied re-search in 2009, 48%. The federal government provided 42%, and academia and other nonprofit organizations each contributed around 5%.
Business sectors that perform relatively large amounts of applied research include chemicals and aerospace. The federal funding is spread broadly across all the performers, with the largest amounts (in 2009) going to federal intramu-ral labs, the business sector, and universities and colleges.
DevelopmentDevelopment, the most sizable component of U.S. R&D,
accounted for 63% ($253.2 billion) of total national R&D in 2009 (table 4-4).7 Development’s share of total national R&D has been near or above 60% for several decades.
Table 4-4U.S. R&D expenditures, by character of work and performing sectors: 1979–2009
Character of work and sector 1979 1989 1999 2004 2009
$billions
All R&D ....................................................... 55.4 141.9 245.0 302.5 400.5 Basic ....................................................... 7.8 21.9 38.9 56.1 76.0 Applied .................................................... 12.1 32.3 52.0 69.2 71.3 Development ........................................... 35.4 87.7 154.4 177.2 253.2
Percent distribution
All R&D ....................................................... 100.0 100.0 100.0 100.0 100.0Basic ....................................................... 14.1 15.4 15.9 18.5 19.0Applied .................................................... 21.8 22.8 21.2 22.9 17.8Development ........................................... 63.9 61.8 63.0 58.6 63.2
Basic research ........................................ 100.0 100.0 100.0 100.0 100.0Business .............................................. 13.5 22.0 17.1 14.0 19.5Federal intramural ............................... 14.2 10.5 8.6 8.4 7.2FFRDCs ............................................... 14.7 12.9 9.6 8.9 7.7Universities and colleges .................... 48.9 46.7 54.0 57.0 53.4Other nonprofit organizations ............. 8.8 7.9 10.8 11.8 12.2
Applied research ..................................... 100.0 100.0 100.0 100.0 100.0Business .............................................. 57.7 69.1 70.4 65.7 57.6Federal intramural ............................... 20.0 11.0 10.6 10.8 11.2FFRDCs ............................................... 5.0 3.2 3.2 4.5 6.5Universities and colleges .................... 11.7 13.0 11.1 13.0 16.7Other nonprofit organizations ............. 5.6 3.6 4.7 6.1 8.0
Development ........................................... 100.0 100.0 100.0 100.0 100.0Business .............................................. 81.9 82.9 89.9 87.5 89.5Federal intramural ............................... 11.1 10.7 6.0 7.2 6.9FFRDCs ............................................... 4.0 4.1 2.1 2.6 1.9Universities and colleges .................... 1.3 1.4 0.9 1.2 0.8Other nonprofit organizations ............. 1.7 0.9 1.0 1.5 1.0
FFRDC = federally funded research and development center
SOURCE: National Science Foundation, National Center for Science and Engineering Statistics, National Patterns of R&D Resources (annual series).
Science and Engineering Indicators 2012

Science and Engineering Indicators 2012 � 4-17
R&D, GDP Growth, and Innovation-Related Metrics
Intangible inputs such as R&D are important sources of long-term economic growth (Corrado et al. 2006; Jorgenson 2007; Van Ark and Hulten 2007). The role of R&D in U.S. GDP has been estimated based on a methodology published in the Bureau of Economic Analysis (BEA)/NSF R&D Satellite Account (Lee and Schmidt 2010). This methodol-ogy treats R&D as an investment rather than as an expense. Using this methodology, a preliminary estimate of R&D on inflation-adjusted GDP from 1959 to 2007 suggests faster average annual GDP growth of 0.07 percentage point over treatment of R&D as an expense.8
Over this period, the difference in average growth esti-mates using these two methodologies was higher in the im-mediate post-War boom, dropped to almost zero from 1974 to 1994 (a period that includes the productivity slowdown of the 1970s), and then increased relative to the overall aver-age since 1995—years associated with IT-led productivity growth (Jorgenson et al. 2005b) (table 4-5). For other data developments activities, see sidebar, “Recent Developments in Innovation-Related Metrics.”
U.S. Business R&DBusinesses engage in R&D with a variety of objectives
and partners on a global basis. Most business R&D is aimed at developing new and improved goods, services, and pro-cesses; maintaining or increasing market share; and im-proving operating efficiency. Such activities reflect firms’ perceptions of the market’s demand and expectations about the profitability of new or newly applied technology.
Businesses located in the United States, both domestic- and foreign-owned, performed $290.7 billion in R&D in the United States in 2008 (table 4-6).9 Among these, companies that owned firms outside the United States performed an
Figure 4-6U.S. R&D by character of work, basic research by performing sector, and basic research by source of funds: 2009
NOTES: Some figures involve estimates and may later be revised. National R&D expenditures estimated at $400.5 billion in 2009. National basic research expenditures estimated at $76.0 billion in 2009. Federal performers include federal agencies and federally funded research and development centers. State and local government support to industry included in industry support for industry performance. State and local government support to universities and colleges included in universities and colleges support of universities and college performance.
SOURCE: National Science Foundation, National Center for Science and Engineering Statistics, National Patterns of R&D Resources (annual series). See appendix tables 4-3, 4-6, and 4-8.
Science and Engineering Indicators 2012
Basic research, by performing sector
Basic research, by source of funds
U.S. total R&D, by character of work
Basic research 19.0%
Appliedresearch17.8%
Development63.2%
Business 19.5%
Federalgovernment
15.0%
Other nonprofitorganizations 12.2%
Business 21.7%
Other nonprofitorganizations 10.8%
Universities andcolleges 53.3%
Universitiesand colleges
14.2%
Federalgovernment 53.3%
Table 4-5U.S. average annual real GDP growth rates, unadjusted and R&D adjusted: 1959–2007 (Percent)
PeriodUnadjusted real GDPa
R&D-adjusted real GDPb Difference
1959–2007 ..... 3.32 3.39 0.071959–73 ..... 4.20 4.33 0.131974–94 ...... 3.02 3.03 0.011995–2001 ... 3.76 3.93 0.172002–07 ...... 2.75 2.87 0.12
GDP = gross domestic product
aAs published in the national income and product accounts.bReal GDP with R&D treated as investment, deflated by aggregate output price index. Double-counting of R&D software removed.
SOURCE: Bureau of Economic Analysis estimates in Lee and Schmidt (2010).
Science and Engineering Indicators 2012

4-18 � Chapter 4. Research and Development: National Trends and International Comparisons
additional $61.5 billion abroad (appendix table 4-14). This section will also cover details on funding sources (appendix table 4-15).
Domestic R&D Performance and Funding Sources
U.S. business R&D performance can be paid with funds from company-owned units, other businesses not owned by the company, and other external sources. Internal and external funders may be located in the United States or abroad.
U.S. business R&D performance totaled $290.7 billion in 2008, including $232.5 billion (80%) from businesses’ own funds and $58.2 billion (20%) paid for by others not owned by the company, regardless of the location of funders (table 4-6).
Companies in manufacturing industries performed $203.8 billion of R&D domestically representing 70% of
all business R&D performed in the United States in 2008; nonmanufacturing industries performed $86.9 billion. The split between own company funds and funding by others for manufacturing and nonmanufacturing industries was similar to the split for overall business R&D (about 80% and 20%).
Businesses vary in R&D intensity—how much R&D they do relative to production, value added, or sales—across in-dustry and size. In this section, business R&D intensity is the ratio of domestic R&D performed and paid for by the com-pany to domestic net sales. In 2008, the ratio across all busi-nesses within scope of the Business R&D and Innovation Survey (BRDIS) was 3.0%; 3.5% for manufacturers and 2.2% for companies in nonmanufacturing industries (appen-dix table 4-16). Some industries have considerably higher R&D intensities, such as the computer and electronic prod-ucts, chemicals, and information industries (figure 4-7).
Innovation is defined as the introduction of new or significantly improved products (goods or services), pro-cesses, organizational methods, and marketing methods in internal business practices or in the open marketplace (OECD/Eurostat 2005). R&D and other intangible invest-ments such as investments in software, higher education, and worker training are key inputs driving innovation. Improved and internationally comparable measurements of these inputs and associated outcomes have been identified as important components in evidence-based policymak-ing. New analytical and policy questions suggest the need for continuous enhancements (NRC 2005, 2007; OECD 2010c, 2010d). Questions include how innovation address-es ultimate social and economic goals, how it may affect (or be affected by) business cycles (economic downturns and recovery), business dynamics (new or small firms), and globalization (Filippetti and Archibugi 2011; Hasan and Tucci 2010; OECD 2010b, 2010c, 2010d; Stiglitz et al. 2009). Ongoing research and data development initia-tives in innovation-related metrics include:
� As part of its Innovation Strategy in support of econom-ic growth and recovery, the OECD* has been working on a measurement agenda for innovation, including links between innovation and macroeconomic perfor-mance (OECD 2010c). International statistical manuals have been updated or developed. The latter include an updated United Nations System of National Accounts (SNA) manual (EU et al. 2009), which recognizes R&D and other intangibles as investments or capital assets, and a new OECD Handbook on the treatment of intan-gibles in national economic accounts (OECD 2010a).
� In the United States, the Commerce Department’s Bureau of Economic Analysis and NSF’s National Center for
Science and Engineering Statistics (NCSES) have jointly developed an R&D Satellite Account** which consid-ers R&D as a capital investment with long-term bene-fits rather than an expense (that is, it capitalizes R&D). This work will guide the incorporation of R&D in U.S. GDP and other national income and product accounts (NIPAs) in 2013, consistent with the revised SNA manu-al (Aizcorbe et al. 2009; Jorgenson et al. 2006).
� NCSES’s new Business R&D and Innovation Survey covers global activities of U.S.-located companies on a broad range of R&D, employment, intellectual property (IP), technology transfer, and innovation variables. See sidebar, “U.S. Business R&D and Innovation Survey.”
� NSF Science of Science and Innovation Policy (SciSIP) program supports theoretical and empirical research designed to advance the scientific basis of science and innovation policy. SciSIP-funded research aims to develop, improve, and expand theories, mod-els, analytical tools, data, and metrics bearing on sci-ence policy and innovation.
� STAR METRICS (Science and Technology for America’s Reinvestment: Measuring the Effect of Research on Innovation, Competitiveness, and Science) is an in-teragency project conducted under the auspices of the White House Office of Science Technology and Policy (OSTP).*** It seeks to build an infrastructure to integrate data on R&D inputs, outputs, and outcomes in order to analyze the impacts of science investments (Lane and Bertuzzi 2011).
* http://www.oecd.org/innovation/strategy ** http://www.bea.gov/national/newinnovation.htm *** https://www.starmetrics.nih.gov; http://scienceofscience
policy.net
Recent Developments in Innovation-Related Metrics

Science and Engineering Indicators 2012 � 4-19
Domestic R&D Performance Funded by Others
Of the $58.2 billion (20% of $290.7 billion) in funding by others outside of individual companies, the U.S. federal gov-ernment accounted for $36.4 billion, independent domestic firms $12.2 billion, and $8.9 billion was funded by compa-nies located outside of the United States (both independent companies and foreign parents). Other nonfederal sources accounted for less than $1 billion.
Federal R&D funding figures prominently in two de-fense-related industries. The aerospace products and parts industry performed $25.8 billion in federally funded R&D, almost 70% of their $36.9 billion in domestically performed R&D in 2008. The navigational, measuring, electromedical, and control instruments industry performed $3.6 billion in federally funded R&D, almost a quarter of its $15.5 billion of domestic R&D performance (table 4-7 and appendix table 4-15).
Domestic R&D Performance by Size of Company
Small companies, those with 5–499 domestic employees, performed $58.1 billion (20%) of $290.7 billion in U.S. busi-ness R&D performance; 80% ($46.4 billion) of the domestic
Table 4-6Domestic R&D performed by the company, by industry and company size: 2008(Millions of U.S. dollars)
Industry and company size
Domestic R&D performance
NAICS code TotalPaid for bycompany
Paid for by others
All industries ......................................................................... 21–23, 31–33, 42–81 290,681 232,505 58,176Manufacturing industries .................................................. 31–33 203,754 164,386 39,368Nonmanufacturing industries ............................................ 21–23, 42–81 86,925 68,118 18,807
All companies ....................................................................... 21–23, 31–33, 42–81 290,681 232,505 58,176Small companies (number of domestic employees)a ........ — 58,136 46,395 11,741
5–99 ............................................................................... — 33,256 24,890 8,366100–249 ......................................................................... — 14,662 12,933 1,729250–499 ......................................................................... — 10,218 8,572 1,646
Medium and large companies (number of domestic employees) .................................................................. — 232,544 186,110 46,434
500–999 ......................................................................... — 11,886 9,673 2,2131,000–4,999 ................................................................... — 46,337 39,010 7,3275,000–9,999 ................................................................... — 24,764 20,358 4,40610,000–24,999 ............................................................... — 48,737 43,049 5,68825,000 or more .............................................................. — 100,820 74,020 26,800
NAICS = North American Industry Classification System
aUpper bound based on U.S. Small Business Administration’s definition of a small business; Business R&D and Innovation Survey does not include companies with fewer than five domestic employees.
NOTES: Detail may not add to total because of rounding. Industry classification based on dominant business code for domestic R&D performance where available. For companies that did not report business codes, classification used for sampling was assigned.
SOURCE: National Science Foundation, National Center for Science and Engineering Statistics and Census Bureau, Business R&D and Innovation Survey (2008).
Science and Engineering Indicators 2012
Figure 4-7Domestic R&D performed and paid for by the company as a percentage of domestic net sales: 2008
SOURCE: National Science Foundation, National Center for Science and Engineering Statistics and U.S. Census Bureau, Business R&D and Innovation Survey (2008).
Science and Engineering Indicators 2012
Percent0 2 6 8 10 12 4
Transportationequipment
Electrical equipment,appliances, and components
Machinery
Professional, scientific,and technical services
Information
Chemicals
Computer andelectronic products

4-20 � Chapter 4. Research and Development: National Trends and International Comparisons
R&D performance by small companies was paid for with their own funds, the remainder by other business or organizations, regardless of location (table 4-6). The largest companies, those with 25,000 or more domestic employees, performed $100.8 billion (35%) of U.S. business R&D, with 73% of that amount ($74.0 billion) paid for with their own funds.
The domestic operations of small companies were more R&D intensive (6.3%) than the domestic operations of the largest companies (2.3%) in 2008 (appendix table 4-16).10
Table 4-7Sources of funds for domestic R&D performed by the company, by selected industry and company size: 2008(Millions of U.S. dollars)
Industry and company size
R&D paid for by the company
R&D paid for by others
NAICS code Total TotalU.S. federal government
Nonfederal sourcesa
All industries ................................................................ 21–23, 31–33, 42–81 290,681 232,505 58,176 36,360 21,816Manufacturing .......................................................... 31–33 203,754 164,386 39,368 31,102 8,266
Chemicals ............................................................ 325 58,249 55,042 3,207 197 3,010Pharmaceuticals and medicines ....................... 3254 48,131 45,169 2,962 137 2,825Other chemicals ................................................ other 325 10,118 9,873 245 60 185
Computer and electronic products ...................... 334 60,463 52,912 7,551 4,646 2,905Navigational, measuring, electromedical, and control instruments ................................ 3345 15,460 10,463 4,997 3,635 1,362Other computer and electronic products ......... other 334 45,003 42,449 2,554 1,011 1,543
Transportation equipment .................................... 336 50,552 23,039 27,513 25,941 i 1,572Aerospace products and parts ......................... 3364 36,941 10,371 26,570 25,805 i 765Other transportation equipment ....................... other 336 13,611 12,668 943 136 807
Other manufacturing ............................................ other 31–33 34,490 33,393 1,097 318 779
Nonmanufacturing ................................................... 21–23, 42–81 86,925 68,118 18,807 5,258 13,549Professional, scientific, and technical services .... 54 37,954 20,539 17,415 4,844 12,571
Scientific research and development services ... 5417 17,913 8,708 9,205 2,115 7,090Other professional, scientific, and technical services ......................................................... other 54 20,041 11,831 8,210 2,729 5,481
Other nonmanufacturing ...................................... other 21–23, 42–81 48,971 47,579 1,392 414 978
All companies .............................................................. 21–23, 31–33, 42–81 290,681 232,505 58,176 36,360 21,816Small companies (number of domestic employees)b .... — 58,136 46,395 11,741 4,117 7,624
5–99 ......................................................................... — 33,256 24,890 8,366 2,667 5,699100–249 ................................................................... — 14,662 12,933 1,729 718 1,011250–499 ................................................................... — 10,218 8,572 1,646 732 914
Medium and large companies (number of domestic employees) ............................. — 232,544 186,110 46,434 32,243 14,191
500–999 ................................................................... — 11,886 9,673 2,213 747 1,4661,000–4,999 ............................................................. — 46,337 39,010 7,327 2,162 i 5,1655,000–9,999 ............................................................. — 24,764 20,358 4,406 1,168 3,23810,000–24,999 ......................................................... — 48,737 43,049 5,688 3,024 2,66425,000 or more ........................................................ — 100,820 74,020 26,800 25,142 i 1,658
i = more than 50% of the estimate is a combination of imputation and reweighting to account for nonresponse
NAICS = North American Industry Classification System
aCompanies located in the United States funded $12.2 billion; $8.9 billion was funded by companies located outside of the United States, including R&D paid for by the foreign parents of U.S. affiliates. For manufacturing industries, the amounts were $3.4 billion and $4.7 billion, respectively, and for nonmanufacturing industries, $8.7 billion and $4.2 billion, respectively.bUpper bound based on U.S. Small Business Administration's definition of a small business; the Business R&D and Innovation Survey does not include companies with fewer than five domestic employees.
NOTES: Detail may not add to total because of rounding. Industry classification based on dominant business code for domestic R&D performance where available. For companies that did not report business codes, classification used for sampling was assigned.
SOURCE: National Science Foundation, National Center for Science and Engineering Statistics and Census Bureau, Business R&D and Innovation Survey (2008).
Science and Engineering Indicators 2012

Science and Engineering Indicators 2012 � 4-21
Largest Domestic R&D-Performing IndustriesBusiness R&D intensity is generally greater in the manu-
facturing sector (3.5% overall) than in nonmanufacturing (2.2%). Nonetheless, R&D plays a large role in some service industries and R&D intensity in some manufacturing sectors is relatively low (appendix table 4-16).
Six industry groups—four in manufacturing (chemicals, computer and electronic products, aerospace and defense manufacturing, and automotive manufacturing) and two in services (software and computer-related products, and R&D services)—accounted for three-quarters of both 2008 to-tal business R&D performed in the United States ($225.8 billion) and company-funded/company-performed R&D ($173.3 billion) in the United States. They also accounted for 96% ($34.8 billion) of federally funded U.S. business R&D in 2008 (table 4-8).11
Chemicals (Including Pharmaceuticals)The chemical industries accounted for the largest share
of business R&D performed in the United States—20% or $58.2 billion of $290.7 billion in 2008 (figure 4-8). Within the chemicals industry, the largest subsector is pharmaceuti-cals and medicines. In 2008, pharmaceutical companies per-formed $45.2 billion of company-funded R&D in the United States and $10.9 billion abroad (appendix table 4-14).
Software and Computer-Related ServicesSoftware and computer-related services industries—
software publishing, computer systems design and Internet service providers, web search portals and data processing ser-vices industries—performed $46.9 billion of domestic R&D in 2008, making it the second largest industry group for do-mestic R&D performance, and $8.5 billion abroad. The R&D of these industries, 16% of business R&D performance in the United States, combined with that of the computer and elec-tronic product manufacturers (below), accounted for 32% of all business R&D performed in the United States in 2008 (ta-ble 4-8). As computing, information technology, and Internet-linked activity has become more integrated with every sector of the economy, the demand for services associated with these technologies has increased.
Computer and Electronic ProductsCompanies in the computer and electronic product manu-
facturing industries include producers of communications equipment, semiconductors, computers and computer pe-ripherals, and components for such products.12 The design and use of integrated circuits and the application of highly specialized miniaturization technologies are common ele-ments in the production processes of the computer and elec-tronic products sector. In 2008, companies in this industry group performed $45.0 billion of R&D, or 15% of all do-mestic business R&D, and $13.0 billion abroad. Funds for domestic R&D came mostly from the companies themselves ($42.4 billion) and relatively little ($2.6 billion) came from other sources. Two relatively high R&D-intensive 4-digit
NAICS (North American Industry Classification System) industries are included in this group, semiconductor and communications equipment manufacturing. Their domestic R&D/domestic sales ratios were 20% and 13%, respectively (appendix table 4-16).
Aerospace and Defense ManufacturingAlthough it is common to refer to the “defense industry,”
the NAICS system does not include such a classification. Thus, to approximate the cost of defense-related R&D, in-cluded here are data on aerospace products and parts plus federally funded R&D in the following industries: naviga-tional, measuring, electromedical, and control instruments, as well as other transportation manufacturing industries. Companies in this “defense sector” perform the majority of the Department of Defense’s (DOD’s) extramural R&D (table 4-8). In 2008, these industries reported performing $40.7 billion of R&D in the United States. Federally funded R&D accounted for 73% ($29.6 billion) of the sector total and 81% of all federally funded business R&D performed in the United States. This total accounts for more than half of the $56.0 billion in DOD outlays for FY 2008 (NSF 2010d).
R&D and Related ServicesThe R&D and related services group includes companies
that provide scientific R&D, engineering, and architectural services to other firms or for their own use.13 Companies in this group performed $21.3 billion of R&D in the United States during 2008; $10.1 billion paid for from company funds and $11.2 billion paid for by others.14 Of the $11.2 bil-lion paid for by others, $3.0 billion was funded by the U.S. federal government, the highest amount outside the aero-space and defense manufacturing group (table 4-8).
Automotive ManufacturingCompanies in automotive manufacturing industries re-
ported performing $14 billion of company-funded R&D in 2008, accounting for 5% of all such R&D performed by businesses in the United States (table 4-8). In 2008, out of the about 4,000 companies in the automobiles, bodies, trail-ers, and parts industries (NAICS 3361, 3362, and 3363), 13 reported domestic R&D performed by the company of $100 million or more, collectively representing 84% of R&D per-formed by that group of industries.
Business Activities for Domestic R&DIndustry-based data above are the result of classifying
each company’s R&D in only one industry. However, com-panies in different industries and even in the same indus-try perform R&D relating to a variety of different business lines of activities. For example, a company classified as a pharmaceutical company may also perform R&D in medical equipment. A feature of BRDIS is the collection of informa-tion on R&D performed by business activity—both R&D paid for by the company and paid for by others. See sidebar,

4-22 � Chapter 4. Research and Development: National Trends and International Comparisons
Table 4-8Business R&D performed in the United States by the company, paid for by the company and by others, by industry group: 2008(Millions of U.S. dollars)
Industry
R&D paid for by the
company
R&D paid for by others
Total TotalU.S. federal government
Nonfederal sources
All ................................................................................. 290,681 232,505 58,176 36,360 21,816Highlighted industries .............................................. 225,813 L 173,318 52,495 L 34,788 L 17,707
Chemicals ............................................................ 58,249 55,042 3,207 197 3,010Basic chemicals ................................................ 4,074 4,012 62 33 29Pharmaceuticals and medicines ....................... 48,131 45,169 2,962 137 2,825Soap, cleaning compound, and toilet preparation .................................................... 2,108 2,099 9 6 3Other chemicals ................................................ 3,936 3,762 174 21 153
Software and computer-related servicesa ............ 46,935 42,727 4,208 961 3,247Software publishers .......................................... 28,221 27,665 556 176 380Computer systems design and related services .......................................................... 12,146 8,569 3,577 784 2,793Internet service providers, web search portals, and data processing services ........................ 6,568 6,493 75 1 74
Computer and electronic productsb ..................... 45,003 42,449 2,554 1,011 1,543Communications equipment ............................ 12,903 11,484 1,419 D DSemiconductor and other electronic components ................................................... 22,324 21,588 736 D DComputer and peripheral equipment and other computer and electronic products ................ 9,776 9,377 399 D D
Aerospace and defense manufacturingc .............. 40,712 10,371 30,341 i 29,576 i 765Aerospace products and parts ......................... 36,941 10,371 26,570 i 25,805 i 765Navigational, measuring, electromedical, and control instruments (U.S. federal government funded only) ................................................... 3,635 — 3,635 3,635 —Transportation equipment (U.S. federal government funded only) ............................... 136 — 136 i 136 i —
R&D and related servicesd .................................... 21,335 10,086 11,249 3,043 8,206Architectural, engineering, and related services .... 3,422 1,378 2,044 928 1,116Scientific research and development services ... 17,913 8,708 9,205 2,115 7,090
Automotive manufacturinge .................................. 13,579 L 12,643 936 L D 936Automobiles, bodies, trailers, and parts ........... 13,140 L 12,234 906 L D 906Other transportation equipment (not aerospace or defense related) ......................................... 439 L 409 30 L D 30
All other .................................................................... 64,868 L 59,187 5,681 L 1,572 L 4,109
D = suppressed to avoid disclosure of confidential information; i = more than 50% of the estimate is a combination of imputation and reweighting to account for nonresponse; L = lower-bound estimate, potential disclosure of individual company operations only allows lower-bound estimates for some industry groups
NAICS = North American Industry Classification System
aIncludes domestic R&D performance for software publishers (NAICS 5112), computer systems design and related service industries (NAICS 5415), and Internet service providers, web search portals, and data processing services (NAICS 518).bIncludes domestic R&D performance for the computer and electronics industry (NAICS 334), except for federal R&D for the navigational, measuring, electromedical, and control instruments industry (NAICS 3345), which is included in the aerospace and defense manufacturing sector.cIncludes domestic R&D performance for the aerospace products and parts industry (NAICS 3364), plus all federal R&D for the navigational, measuring, electromedical, and control instruments (NAICS 3345) and transportation equipment manufacturing industries.dIncludes domestic R&D performance for the architectural, engineering, and related services (NAICS 5413) and scientific R&D services industries (NAICS 5417).eIncludes domestic R&D performance for automobiles, bodies, trailers, and parts (NAICS 3361-3363) and transportation equipment (NAICS 336) industries, except federally funded components that are included in the aerospace and defense manufacturing group.
NOTES: Detail may not add to total because of rounding. Industry classification based on dominant business code for domestic R&D performance where available. For companies that did not report business codes, classification used for sampling was assigned.
SOURCE: National Science Foundation, National Center for Science and Engineering Statistics and Census Bureau, Business R&D and Innovation Survey (2008).
Science and Engineering Indicators 2012

Science and Engineering Indicators 2012 � 4-23
Figure 4-8Shares of domestic R&D performed in the United States, by industry group: 2008
SOURCE: National Science Foundation, National Center for Science and Engineering Statistics and U.S. Census Bureau, Business R&D and Innovation Survey (2008).
Science and Engineering Indicators 2012
Chemicals 20.0%
Software andcomputer-
related services16.1%
Computer and electronicproducts 15.5%
Aerospace and defensemanufacturing 14.0%
R&D and relatedservices 7.3%
Automotivemanufacturing
4.7%
All other 22.3%
“U.S. Business R&D and Innovation Survey.”15 The num-ber of these activities is large, as indicated in appendix table 4-17, but most companies performed R&D in only one busi-ness activity area. However, some companies, especially large diversified firms, performed R&D in multiple business activity areas. In BRDIS, 92% of companies reported do-mestic R&D paid for by the company related to only one business activity; 4% related to two business activities, and 4% related to three or more business activities. For domestic R&D paid for by others, the percentages were 91%, 6%, and 3%, respectively.
The top 10 business activities for which companies used their own funds to perform R&D in the United States ac-counted for 60% of these companies’ R&D funds ($140.6 billion of $232.5 billion) (table 4-9). The top 10 activities for which companies used others’ funds to perform R&D ac-counted for 68% of the total amount of company-performed R&D paid for by others (table 4-10).
To better understand and measure how R&D is con-ducted in today’s innovation- and global-based economy (NRC 2005), NSF and the U.S. Census Bureau launched a new Business R&D and Innovation Survey (BRDIS). BRDIS expands on R&D data collected by its predeces-sor, the Survey of Industrial Research and Development, to cover (among other areas) global R&D funding or ex-penses by U.S.-located businesses, and introduces pre-liminary innovation and intellectual property questions that will be further developed.
Chapters 3, 4, 6, and 8 in this edition of Science and Engineering Indicators include selected preliminary data from the 2008 pilot survey. Detailed 2008 estimates and data for subsequent survey cycles are available at http://www.nsf.gov/statistics/industry/. BRDIS questionnaires are available at http://www.nsf.gov/statistics/question.cfm#13. Listed below are the main data collection areas.
� Company information:
� Measures of R&D activity paid for by the company:
activity
costs, and location
equipment)
� Measures related to R&D management and strategy:
and development)
� Measures of company R&D activity funded by others:
organization, type of cost, state, and location (do-mestic vs. foreign)
� Measures of R&D employment:
-cupation and sex
visa (H-1B, L-1, etc.)
� Measures of intellectual property (IP), technology transfer, and innovation:
-cantly improve existing goods, services, methods of production and distribution, or support systems
-ties and importance of types of IP protection
For more information see NSF 2008, 2010a, 2010b, and 2010c.
U.S. Business R&D and Innovation Survey

4-24 � Chapter 4. Research and Development: National Trends and International Comparisons
Table 4-9Domestic R&D performance paid for by the company for top 10 business activities: 2008(Millions of U.S. dollars)
Business activity Business codea R&D paid for by the company
All business activities ................................................................................... 21100–81390 232,505Top 10 business activities ......................................................................... — 140,632
Pharmaceutical, medicinal, botanical, and biological products (except diagnostic) manufacturing ..................................................... 32541 41,593Software publishers (except Internet) ................................................... 51120 23,860Semiconductor and other electronic components manufacturing .................................................................................... 33440 22,674Computers and peripheral equipment manufacturing .......................... 33410 9,223Medical equipment and supplies manufacturing .................................. 33910 8,521Scientific research and development services ...................................... 54170 8,464Computer systems design and related services ................................... 54150 8,384Motor vehicles manufacturing ............................................................... 33610 8,305Telephone apparatus manufacturing ..................................................... 33421 5,424Radio and television broadcasting and wireless communications equipment manufacturing....................................... 33422 4,184
All other business activities including undistributed amounts .................. — 91,873aBusiness codes and descriptions based on North American Industry Classification System industry definitions.
NOTES: Data tabulated independent of the industry classification of the company. Detail may not add to total because of rounding
SOURCE: National Science Foundation, National Center for Science and Engineering Statistics and Census Bureau, Business R&D and Innovation Survey (2008).
Science and Engineering Indicators 2012
Table 4-10Domestic R&D performance paid for by others for top 10 business activities: 2008(Millions of U.S. dollars)
Business activity Business codea R&D paid for by others
All business activities ................................................................................... 21100–81390 58,176Top 10 business activities ......................................................................... — 39,776
Scientific research and development services ...................................... 54170 8,093Aircraft manufacturing ........................................................................... 33641 5,881Architectural, engineering, and related services ................................... 54130 5,558Search, detection, navigation, guidance, aeronautical, and nautical system and instruments manufacturing ........................ 33452 4,962Guided missiles, space vehicles, and parts manufacturing .................. 33644 4,725Computer systems design and related services ................................... 54150 3,085Pharmaceutical, medicinal, botanical, and biological products (except diagnostic) manufacturing ..................................................... 32541 2,797Aircraft engine and engine parts manufacturing ................................... 33642 1,918Electromedical, electrotherapeutic, and irradiation apparatus manufacturing .................................................................................... 33451 1,899Radio and television broadcasting and wireless communications equipment manufacturing....................................... 33422 858
All other business activities including undistributed amounts .................. — 18,400aBusiness codes and descriptions based on North American Industry Classification System industry definitions.
NOTES: Data tabulated independent of the industry classification of the company. Detail may not add to total because of rounding.
SOURCE: National Science Foundation, National Center for Science and Engineering Statistics and Census Bureau, Business R&D and Innovation Survey (2008).
Science and Engineering Indicators 2012

Science and Engineering Indicators 2012 � 4-25
R&D Performed Abroad by U.S.-Owned Companies
Foreign operations of U.S. businesses performed $61.5 billion in R&D outside the United States, based on 2008 BRDIS pilot survey. Of this performance abroad, $56.9 bil-lion was paid by the own company and $4.6 billion was paid by others outside of the company (table 4-11).16
By far, the industry that performed the most R&D outside of the United States was the pharmaceuticals and medicines industry ($10.9 billion), based on BRDIS data (appendix table 4-14). Other industries with high levels of R&D per-formed abroad were automobiles, automobile bodies, trail-ers, and parts manufacturers ($8.4 billion), semiconductor and other electronic components manufacturers ($7.1 bil-lion), and software publishers ($6.3 billion).
R&D by Multinational Companies This section covers statistics on R&D performed by ma-
jority-owned affiliates of foreign multinational corporations (MNCs) located in the United States, and R&D performed by U.S. MNCs and their majority-owned foreign affiliates, collected by the Bureau of Economic Analysis (BEA). See sidebar, “Foreign Direct Investment in R&D.”
R&D arising from foreign direct investment (FDI) activi-ties is quantitatively important since MNCs are the largest performers of business R&D in the United States (discussed below) and in other economies (Dunning and Lundan 2009). Both home country and international opportunities and poli-cies affect R&D and other innovation-related activities by MNCs (Breznitz 2009; Athukorala and Kohpaiboon 2010). In turn, MNC activities influence the ultimate impacts of na-tional and international R&D on national economic growth and productivity.
The majority of R&D by U.S. MNCs continues to be per-formed in the United States. Outside the United States, R&D by U.S.-owned foreign affiliates is performed mostly in Western Europe, Canada, and Japan, followed more recent-ly by other locations in the Asia-Pacific region. Information on character of work for MNCs’ R&D is presented in the
sidebar, “Linking MNC Data from International Investment and Business R&D Surveys.”
U.S. Affiliates of Foreign CompaniesMajority-owned affiliates of foreign MNCs located in
the United States (U.S. affiliates) performed $40.5 billion of R&D or 13.9% of the $290.7 in U.S. business R&D per-formed in 2008 (preliminary BEA estimate).17 Since 1999, the share of these companies in U.S.-located business R&D,
Table 4-11R&D performed abroad by U.S.-owned companies: 2008(Millions of U.S. dollars)
Foreign performance
Industry NAICS code Total Paid for by company Paid for by others
All industries ............................................ 21–23, 31-33, 42–81 61,475 56,899 4,576Manufacturing industries ..................... 31–33 46,572 45,274 1,298Nonmanufacturing industries ............... 21–23, 42–81 14,903 11,625 3,278
NAICS = North American Industry Classification System
SOURCE: National Science Foundation, National Center for Science and Engineering Statistics and Census Bureau, Business R&D and Innovation Survey (2008).
Science and Engineering Indicators 2012
Foreign direct investment (FDI) is one of several channels for the creation, exploitation, and diffusion of new knowledge along with international trade, li-censing, and technology partnerships (Saggi 2002). Direct investment is defined as ownership or control of 10% or more of the voting securities of a business (affiliate) in another country. The cross-country loca-tion of R&D activities via FDI is driven by factors ranging from costs and long-term market and techno-logical opportunities to infrastructure and policy con-siderations, such as human resources and intellectual property protection.
Statistics on R&D by affiliates of foreign compa-nies located in the United States, and by foreign af-filiates of U.S. MNCs and their parent companies, are from BEA’s Survey of Foreign Direct Investment in the United States (FDIUS) and BEA’s Survey of U.S. Direct Investment Abroad (USDIA). Affiliate data presented in this section cover majority-owned affili-ates, that is, those in which the ownership stake of par-ent companies totals more than 50%. Annual changes in FDI R&D reflect a combination of mergers and acquisitions; newly built factories, service centers, or laboratories; and activities in existing facilities. Data exclude commercial banks, savings institutions, credit unions, bank holding companies, and financial hold-ing companies
Foreign Direct Investment in R&D
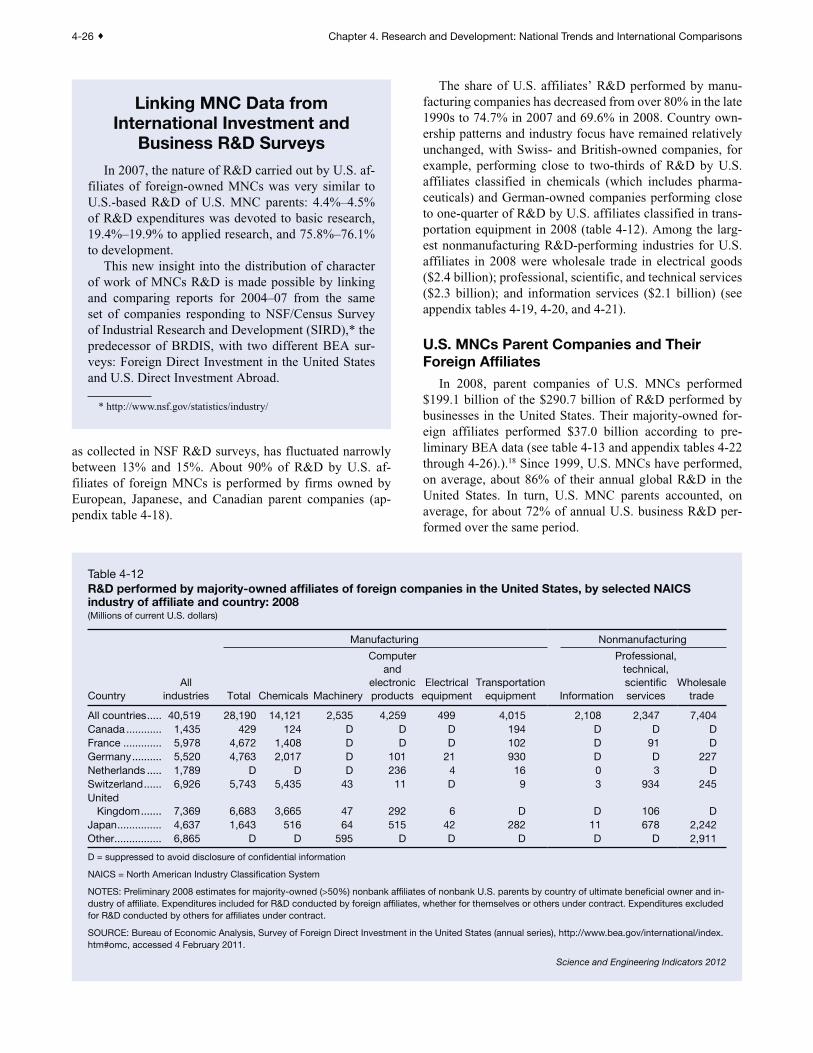
4-26 � Chapter 4. Research and Development: National Trends and International Comparisons
as collected in NSF R&D surveys, has fluctuated narrowly between 13% and 15%. About 90% of R&D by U.S. af-filiates of foreign MNCs is performed by firms owned by European, Japanese, and Canadian parent companies (ap-pendix table 4-18).
The share of U.S. affiliates’ R&D performed by manu-facturing companies has decreased from over 80% in the late 1990s to 74.7% in 2007 and 69.6% in 2008. Country own-ership patterns and industry focus have remained relatively unchanged, with Swiss- and British-owned companies, for example, performing close to two-thirds of R&D by U.S. affiliates classified in chemicals (which includes pharma-ceuticals) and German-owned companies performing close to one-quarter of R&D by U.S. affiliates classified in trans-portation equipment in 2008 (table 4-12). Among the larg-est nonmanufacturing R&D-performing industries for U.S. affiliates in 2008 were wholesale trade in electrical goods ($2.4 billion); professional, scientific, and technical services ($2.3 billion); and information services ($2.1 billion) (see appendix tables 4-19, 4-20, and 4-21).
U.S. MNCs Parent Companies and Their Foreign Affiliates
In 2008, parent companies of U.S. MNCs performed $199.1 billion of the $290.7 billion of R&D performed by businesses in the United States. Their majority-owned for-eign affiliates performed $37.0 billion according to pre-liminary BEA data (see table 4-13 and appendix tables 4-22 through 4-26).).18 Since 1999, U.S. MNCs have performed, on average, about 86% of their annual global R&D in the United States. In turn, U.S. MNC parents accounted, on average, for about 72% of annual U.S. business R&D per-formed over the same period.
Table 4-12R&D performed by majority-owned affiliates of foreign companies in the United States, by selected NAICS industry of affiliate and country: 2008(Millions of current U.S. dollars)
Manufacturing Nonmanufacturing
CountryAll
industries Total Chemicals Machinery
Computer and
electronic products
Electrical equipment
Transportation equipment Information
Professional, technical, scientific services
Wholesale trade
All countries ..... 40,519 28,190 14,121 2,535 4,259 499 4,015 2,108 2,347 7,404Canada ............ 1,435 429 124 D D D 194 D D D France ............. 5,978 4,672 1,408 D D D 102 D 91 D Germany .......... 5,520 4,763 2,017 D 101 21 930 D D 227Netherlands ..... 1,789 D D D 236 4 16 0 3 D Switzerland ...... 6,926 5,743 5,435 43 11 D 9 3 934 245United
Kingdom ....... 7,369 6,683 3,665 47 292 6 D D 106 D Japan ............... 4,637 1,643 516 64 515 42 282 11 678 2,242Other ................ 6,865 D D 595 D D D D D 2,911
D = suppressed to avoid disclosure of confidential information
NAICS = North American Industry Classification System
NOTES: Preliminary 2008 estimates for majority-owned (>50%) nonbank affiliates of nonbank U.S. parents by country of ultimate beneficial owner and in-dustry of affiliate. Expenditures included for R&D conducted by foreign affiliates, whether for themselves or others under contract. Expenditures excluded for R&D conducted by others for affiliates under contract.
SOURCE: Bureau of Economic Analysis, Survey of Foreign Direct Investment in the United States (annual series), http://www.bea.gov/international/index.htm#omc, accessed 4 February 2011.
Science and Engineering Indicators 2012
In 2007, the nature of R&D carried out by U.S. af-filiates of foreign-owned MNCs was very similar to U.S.-based R&D of U.S. MNC parents: 4.4%–4.5% of R&D expenditures was devoted to basic research, 19.4%–19.9% to applied research, and 75.8%–76.1% to development.
This new insight into the distribution of character of work of MNCs R&D is made possible by linking and comparing reports for 2004–07 from the same set of companies responding to NSF/Census Survey of Industrial Research and Development (SIRD),* the predecessor of BRDIS, with two different BEA sur-veys: Foreign Direct Investment in the United States and U.S. Direct Investment Abroad.
* http://www.nsf.gov/statistics/industry/
Linking MNC Data from International Investment and
Business R&D Surveys

Science and Engineering Indicators 2012 � 4-27
R&D by foreign affiliates of U.S. MNCs has gradually shifted from traditional host countries, including Japan, to-wards other Asian venues. The combined share of Europe, Canada, and Japan as hosts of R&D by U.S.-owned foreign affiliates declined from about 90% in the mid- and late 1990s to around 80% since 2006. European-located affili-ates have performed about two-thirds of R&D by affiliates of U.S. MNCs since 2003, after declining in the late 1990s and early 2000s (figure 4-9 and appendix table 4-22).
On the other hand, the share of R&D performed by Asia-located affiliates (other than in Japan) increased from about 5% to 14% from 1997 to 2008. In particular, the share of U.S.-owned affiliates’ R&D performed in China, South Korea, Singapore, and India rose from a half percentage point or less in 1997 to 4% for China, just under 3% for South Korea, and just under 2% each for Singapore and India in 2008.
Manufacturing affiliates accounted for 80% of foreign affiliates’ R&D in 2008, including two-thirds performed in three industries: transportation equipment (25%), chemicals (including pharmaceuticals) (24%), and computer and elec-tronic products (17%) (table 4-14). Professional, technical, and scientific services accounted for another 11% and infor-mation services for 5% (see appendix tables 4-23 and 4-24).
The country and industry distribution of U.S. MNCs’ foreign R&D is related, among other factors, to historical S&T strengths in the host countries. United Kingdom and Germany, for example, hosted 20.4% and 12.0% of U.S.-owned overseas R&D in chemicals (which includes pharma-ceuticals), whereas affiliates located in Germany performed almost two-fifths of R&D by transportation equipment af-filiates (table 4-14).
Within the professional, technical, and scientific services industry, affiliates located in the UK performed 22.3% of
foreign affiliates’ R&D total, followed by Canada (12.5%) and India (6.3%), according to available country detail. Lastly, about four-fifths of affiliates’ R&D in information services (which includes software and Internet publishing and telecommunications) in 2008 was performed in three areas: Ireland (30.7%), Canada (22.3%), and Asia outside Japan (25.5%).
Exports and Imports of R&D-Related Services
Cross-border transactions of business services, published by BEA as part of international transactions accounts, in-clude research, development, and testing (RDT) services under the category of business, professional, and technical services. RDT services include commercial and noncom-mercial research as well as product development and testing services. In 2009, U.S. RDT exports and imports stood at $18.2 billion and $15.8 billion, respectively, for a balance of $2.5 billion (appendix table 4-27).19
Transactions in RDT services provide insights into busi-ness R&D-related transactions, including exchanges among unaffiliated or independent companies (unaffiliated trade) and trade within MNCs (affiliated trade). As described below, most transactions in these R&D-related services occur within multinational corporations. Further, the patterns of U.S. RDT exports and imports differ for U.S. and foreign MNCs.
Most RDT trade occurs within companies. Since 2001, when affiliated RDT trade data were first available, trans-actions among MNCs members (parent companies and subsidiaries) have represented around 85% of total RDT exports annually. This share is consistent with the large role of MNCs (including U.S. parents and foreign-owned
Table 4-13R&D performed by U.S. multinational companies: 1999–2008
Location of R&D performed (current US$millions)
Shares of U.S. MNCs R&D performance (%)
YearUnited States
(by parents of U.S. MNCs)Outside United States
(by MOFAs)Total by
U.S. MNCs United StatesOutside United
States
1999.................. 126,291 18,144 144,435 87.4 12.62000.................. 135,467 20,457 155,924 86.9 13.12001.................. 143,017 19,702 162,719 87.9 12.12002.................. 136,977 21,063 158,040 86.7 13.32003.................. 139,884 22,793 162,677 86.0 14.02004.................. 164,189 25,840 190,029 86.4 13.62005.................. 177,598 27,653 205,251 86.5 13.52006.................. 184,428 29,583 214,011 86.2 13.82007.................. 203,678 34,446 238,124 85.5 14.52008.................. 199,105 36,991 236,096 84.3 15.7
MNC = multinational company; MOFA = majority-owned foreign affiliate
NOTE: MOFAs are affiliates in which combined ownership of all U.S. parents is >50%.
SOURCE: Bureau of Economic Analysis. Survey of Foreign Direct Investment in the United States (annual series).
Science and Engineering Indicators 2012

4-28 � Chapter 4. Research and Development: National Trends and International Comparisons
companies) in U.S. business R&D performance. (See sec-tion “R&D by Multinational Companies.”) Likewise, with-in-company imports accounted for 66% to 78% of total RDT imports annually over the same period. The large share of this affiliated or within-company RDT trade reflects the need for management control and proprietary protection in cross-border transactions involving intangible assets.
Foreign MNCs with operations in the U.S. are export-ing more RDT services to their foreign parents (and other members of the foreign MNCs) compared with their level of imports. Foreign MNCs with activities in the U.S. reported average annual net exports of $3.9 billion between 2006 and 2009, with net exports fluctuating between $3.4 billion to $4.5 billion over this period. On the other hand, U.S. MNC parents imported annually about the same or slightly more of those services relative to their exports over the same period (table 4-15).20 In 2009, U.S. parents imported $602 million more RDT services from their foreign affiliates than they exported to their affiliates.
Europe accounted for about half of U.S. total RDT ex-ports and imports in 2009 (appendix table 4-27). Latin America was the second largest destination of RDT exports (23%) whereas Asia was the second largest origin of RDT imports (about 30%). The latter included 9.1% of RDT im-ports from India in 2009 (compared with 4.6% in 2006), 8.6% from Japan (compared with 5.9% in 2006), and 5.4% from China (compared with 1.0% in 2006).
Federal R&DThe U.S. government supports the nation’s R&D sys-
tem through various policy tools. The most direct is federal performance and funding of R&D. This section provides statistics on these federally performed or funded activi-ties, including budget authority by national objectives, ob-ligations by agency, and obligations by research field (for definition of these terms see sidebar, “Federal Budgetary Concepts and Related Terms”). This section also covers fed-eral tax credits for business R&D.
Federal R&D Budget by National ObjectivesFederal support for the nation’s R&D spans a range of
broad objectives, including defense, health, space, energy, natural resources/environment, general science, and vari-ous other categories. To assist the president and Congress in planning and setting the federal budget and its components, the Office of Management and Budget classifies agency bud-get requests into specific categories called budget functions. These functions include a number of categories that distin-guish the various R&D objectives. Descriptions of the bud-get authority provided annually to federal agencies in terms of these R&D budget functions afford a useful picture of the present priorities and trends in federal support for U.S. R&D.
In FY 2009, budget authority for federal agency spend-ing on R&D totaled an estimated $156.0 billion, includ-ing a one-time $15.1 billion increase provided under the American Recovery and Investment Act of 2009 (appendix tables 4-28 and 4-29).
Defense-Related R&DAs in previous years, defense was the largest of the R&D
budget functions, accounting for 55% ($85.2 billion) of the total. Defense R&D is supported primarily by the Department
Figure 4-9Regional shares of R&D performed abroad by foreign affiliates of U.S. MNCs: 1997–2008
MNC = multinational company; OWH = other Western Hemisphere
NOTES: Data for majority-owned affiliates. Preliminary estimates for 2008.
SOURCE: Bureau of Economic Analysis, Survey of U.S. Direct Investment Abroad (annual series).
Science and Engineering Indicators 2012
Percent
1997 1998 1999 2000 2001 2002 2003 2004 2005 2006 2007 20080
65
70
75
Europe
1997 1998 1999 2000 2001 2002 2003 2004 2005 2006 2007 20080
2
4
6
8
10
12
14
Canada
Japan
1997 1998 1999 2000 2001 2002 2003 2004 2005 2006 2007 20080
2
4
6
8
10
12
14
16
Asia/Pacific excluding Japan
Latin America/OWH
Middle EastAfrica

Science and Engineering Indicators 2012 � 4-29
of Defense (DOD), but also includes some R&D by the Department of Energy (DOE) and the Department of Justice (where some R&D by the Federal Bureau of Investigation comes under a defense category).
Defense has accounted for the majority of R&D budget authority throughout the last two decades (figure 4-10, ap-pendix table 4-28); the share has fluctuated year to year in
the 50%–70% range. In FY 1980, it roughly equaled non-defense R&D, but by FY 1985 it was more than double. From 1986 to 2001, nondefense R&D surged, and the share of defense R&D shrank to 53%. After September 11, 2001, defense R&D became more prominent, accounting for 59% of the federal R&D budget in FY 2008. The drop to 55% in FY 2009 reflects chiefly the effect of the one-time ARRA
Table 4-14R&D performed abroad by majority-owned foreign affiliates of U.S. parent companies, by selected NAICS industry of affiliate and region/country/economy: 2008(Millions of current U.S. dollars)
Manufacturing
Region/country/ economy
All industries Total Chemicals Machinery
Computer and
electronic products
Electrical equipment, appliances,
and components
Transportation equipment Information
Professional, technical, scientific services
Wholesale trade
All countries ........... 36,991 29,385 8,754 1,457 6,354 586 9,163 1,954 3,963 1,461Canada .............. 3,040 1,981 685 28 482 19 653 436 494 78Europe ............... 24,155 19,416 6,255 1,076 2,762 313 6,601 870 2,680 1,089
Belgium .......... 1,259 891 783 24 D 15 14 * 350 12France ............ 2,171 1,878 448 133 501 35 456 45 188 53Germany......... 7,039 6,485 1,051 388 858 132 3,527 D 194 D Ireland ............ 1,503 848 438 0 313 0 2 599 D D Italy ................. 582 475 246 52 22 4 73 * D D Netherlands .... 1,484 1,267 778 41 73 D D D D D Sweden .......... 1,576 1,478 33 12 59 D D D D 7Switzerland ..... 1,123 728 262 88 173 24 D D 229 118United
Kingdom...... 5,157 3,844 1,790 185 464 49 912 76 884 341Latin America/ OWH ................ 1,465 1,354 371 40 191 D 642 1 37 29Brazil .............. 791 770 175 35 D 0 444 1 4 16Mexico ........... 329 D 80 4 7 D 169 * D 3
Africa .................. 57 44 14 1 * 0 23 2 * 2South
Africa ........... 43 34 13 * * 0 D 2 * 2Middle East ........ 1,063 869 D D 650 0 0 5 174 15
Israel ............... 1,060 867 D D 650 0 0 D 174 D Asia and Pacific .............. 7,210 5,722 D D 2,268 D 1,244 640 578 247Australia ......... 923 851 234 10 6 20 D 7 20 41China .............. 1,517 1,180 D 24 965 66 40 D D 43Hong Kong ..... 102 52 9 0 10 5 0 5 37 7India ............... 582 222 58 D D D 32 D 250 D Japan ............. 1,872 1,529 930 64 244 D 81 142 D D Malaysia ......... 360 358 3 * 345 1 0 0 * 2Singapore ....... 621 390 30 1 343 1 2 D D 9South Korea ... 966 931 34 17 207 D D 7 7 D Taiwan ............ 102 D D 1 48 5 2 D 8 8Thailand .......... 69 67 7 3 27 0 17 0 0 2
* = $500,000; D = suppressed to avoid disclosure of confidential information
NAICS = North American Industry Classification System; OWH = other Western Hemisphere
NOTES: Preliminary 2008 estimates for majority-owned (>50%) nonbank affiliates of nonbank U.S. parents by country of ultimate beneficial owner and industry of affiliate. Expenditures included for R&D conducted by foreign affiliates, whether for themselves or others under contract. Expenditures excluded for R&D conducted by others for affiliates under contract.
SOURCE: Bureau of Economic Analysis, Survey of U.S. Direct Investment Abroad (annual series), http://www.bea.gov/international/index.htm#omc, accessed 4 February 2011.
Science and Engineering Indicators 2012
Nonmanufacturing

4-30 � Chapter 4. Research and Development: National Trends and International Comparisons
spending authority that expanded health, energy, and gen-eral science research.
Nondefense R&DBudget authority for nondefense R&D totaled $70.8 bil-
lion in FY 2009, or about 45% of the total that year (ap-pendix table 4-28). Nondefense R&D includes health, space research/technology, energy, general science, natural re-sources/environment, transportation, agriculture, educa-tion, international affairs, veterans’ benefits, and a number
of other small categories related to economic and gover-nance matters.
The most striking change in federal R&D priorities over the past two decades has been the considerable increase in health-related R&D—which now accounts for well over half of all nondefense R&D (figure 4-10). Health R&D has risen from about 12% of total federal R&D budget authority in FY 1980 to 21% in FY 2008 and 26% in FY 2009 because of the ARRA increment. The increase in share accelerated after 1998, when policymakers set the National Institutes of Health (NIH) budget on course to double by FY 2003.
The budget allocation for space-related R&D peaked in the 1960s, during the height of the nation’s efforts to surpass the Soviet Union in space exploration. It stood at 10%–11% of total R&D authority throughout the 1990s. The loss of the space shuttle Columbia and its entire crew in February 2003 prompted curtailment of manned space missions. In FY 2005, the space R&D share was down to about 6%; by FY 2009, it had declined to around 4%.
Federal nondefense R&D classified as general science had about a 4% share of total federal R&D in the mid 1990s, growing to 8% in FY 2009. However, this change reflected chiefly a reclassification, starting in FY 1998, of several DOE programs from energy to general science.
Federal Budget for Basic ResearchIn FY 2009, federal budget authority for all basic re-
search totaled $36.4 billion (appendix table 4-29). This represented some 23% of the $156.0 billion of total federal budget authority for R&D that year. The vast majority of basic research reflects the budgets of agencies with non-defense objectives, such as general science (notably NSF), health (NIH), and space research and technology (NASA).
Over the past several years, budget authority levels for basic research have been mostly flat, after adjusting for inflation, excepting the 2009 ARRA boost. In FY 2002, basic research budget authority was $25.8 billion (constant 2005 dollars); in FY 2008, $26.4 billion; and $33.0 billion in FY 2009.
Budget authority. This refers to the funding authority conferred by federal law to incur financial obligations that will result in outlays. The basic forms of budget authority are appropriations, contract authority, and borrowing authority.
Obligations. Federal obligations represent the dollar amounts for orders placed, contracts and grants award-ed, services received, and similar transactions during a given period, regardless of when funds were appropri-ated or payment was required.
Outlays. Federal outlays represent the dollar amounts for checks issued and cash payments made during a given period, regardless of when funds were appropri-ated or obligated.
R&D plant. In general, R&D plant refers to the acqui-sition of, construction of, major repairs to, or alterations in structures, works, equipment, facilities, or land for use in R&D activities. Data included in this section re-fer to obligated federal dollars for R&D plant.
Federal Budgetary Concepts and Related Terms
Table 4-15U.S. trade balance in research, development, and testing services, by affiliation: 2006–09(Millions of current U.S. dollars)
Affiliation 2006 2007 2008 2009
Total ........................................................................................................ 3,534 2,593 1,142 2,481Unaffiliated .......................................................................................... –660 –1,008 –1,473 –1,020Affiliated .............................................................................................. 4,193 3,601 2,615 3,500
By U.S. parents from/to their foreign affiliates ................................ –334 185 –1,100 –602By U.S. affiliates from/to their foreign parent groupsa .................... 4,528 3,416 3,715 4,103
aIn addition to transactions with its foreign parent, U.S. affiliates’ exports and imports include transactions with other members of their foreign parent group.
NOTES: Trade balance is exports minus imports. Positive amounts represent a trade surplus; negative amounts represent a trade deficit.
SOURCE: Bureau of Economic Analysis, U.S. International Services, http://www.bea.gov/international/international_services.htm, accessed 4 February 2011.
Science and Engineering Indicators 2012

Science and Engineering Indicators 2012 � 4-31
Federal Spending on R&D by AgencyBudget authority, discussed above, lays out the themes of
the broad federal spending plan. Federal obligations reflect federal dollars as they are spent, that is, the implementation of the plan by federal agencies (see appendix tables 4-30 and 4-31).
In FY 2009, federal obligations for R&D and R&D plant together totaled an estimated $137.0 billion: $133.3 bil-lion for R&D and an additional $3.6 billion for R&D plant (table 4-16). Federal obligations for R&D have, in gen-eral, increased annually on a current-dollar basis since the
mid-1990s (figure 4-11). Earlier figures are $68.2 billion for R&D in FY 1995 and an additional $2.3 billion for R&D plant, $75.9 billion and $4.5 billion in FY 2000, $118.9 billion and $3.8 billion in FY 2005 (appendix table 4-30). When adjusted for inflation, however, the growth has been slower after FY 2005. NSF’s latest statistics indicate that the boost to R&D from the ARRA appropriations translated to an additional $10.1 billion of federal R&D obligations in FY 2009—$8.7 billion for R&D, another $1.4 billion for R&D plant, with the main recipients the Department of Health and Human Services (HHS), NSF, and DOE (table 4-16).
(The figures for federal funding of U.S. R&D cited in table 4-1 earlier in this chapter are somewhat lower. These earlier figures are based on performers’ reports of their R&D expenditures from federal funds. This difference between performer and source of funding reports of the level of R&D expenditures has been present in the U.S. data for more than 15 years and reflects various technical issues. See sidebar, “Tracking R&D: The Gap between Performer- and Source-Reported Expenditures.”)
Fifteen federal departments and a dozen other agencies engage in and/or fund R&D in the U.S.21 Seven departments/agencies that reported spending on R&D in excess of $1 bil-lion annually accounted for 97% of the total (table 4-16). Another eight of the departments/agencies reported spend-ing above $100 million annually.
Department of DefenseIn FY 2009, DOD obligated a total of $68.2 billion for
R&D and R&D plant (table 4-16)—which represented half (50%) of all federal spending on R&D and R&D plant that year. Nearly the entire DOD total was R&D spending ($68.1 billion) with the remainder spent on R&D plant.
Twenty-seven percent ($18.7 billion) of the total was spending by the department’s intramural labs, related agency R&D program activities, and FFRDCs (table 4-16). Extramural performers—private businesses, universities/colleges, state/local governments, other nonprofit organiza-tions, and foreign performers—accounted for 73% ($49.5 billion) of the obligations, with the bulk going to business firms ($46.3 billion).
Considering just the R&D component, relatively small amounts were spent on basic research ($1.7 billion, 3%) and applied research ($5.1 billion, 7%) in FY 2009 (table 4-17). The vast majority of obligations, $61.3 billion (90%), went to development. Furthermore, the bulk of this DOD develop-ment ($54.9 billion) was allocated for “major systems devel-opment,” which includes the main activities in developing, testing, and evaluating combat systems (figure 4-12). The remaining DOD development ($6.4 billion) was allocated for “advanced technology development,” which is more similar to other agencies’ development obligations.
Department of Health and Human ServicesHHS is the main federal source of spending for health-
related R&D. In FY 2009, the department obligated an esti-mated $35.7 billion for R&D and R&D plant, or 26% of the
Figure 4-10Federal budget authority for R&D, by budget function: FY 1980–2010
NOTES: Data for FY 2010 are preliminary. Data for FY 2009 include the additional federal funding for R&D appropriated by the American Recovery and Reinvestment Act of 2009. Other includes all nondefense functions not separately graphed, such as agriculture and transportation.1998 increase in general science and decrease in energy, and 2000 decrease in space were results of reclassification.
SOURCE: National Science Foundation, National Center for Science and Engineering Statistics, Federal R&D Funding by Budget Function (FY 2009–11). See appendix table 4-28.
Science and Engineering Indicators 2012
Budget function
Nondefense budget function
Curent dollars (billions)
20102007200420011995 1998199219891980 1983 19860
20
40
60
80
100
120
140
160
Total
Defense
Nondefense
1980 1983 1986 1989 1992 1995 1998 2001 2004 2007 20100
5
10
15
20
25
30
35
40
45Health
Space
Energy
General science
Other

4-32 � Chapter 4. Research and Development: National Trends and International Comparisons
total of federal obligations that year. Nearly all of this was for R&D ($35.6 billion). Furthermore, much of the total, $34.6 billion, represented the R&D activities of the NIH. Obligations from the ARRA-appropriated funds totaled $4.9 billion for HHS in FY 2009, the largest by far of all the federal agencies (table 4-16). Again, nearly all of this was NIH R&D.
For the department as a whole, R&D and R&D plant obligations for agency intramural activities and FFRDCs accounted for 21% ($7.5 billion) of the total. Extramural performers accounted for 79% ($28.2 billion). Universities and colleges ($20.5 billion) and other nonprofit organiza-tions ($5.3 billion) conducted the most sizable of these ex-tramural activities (appendix table 4-31).
Nearly all of HHS R&D funding is allocated to re-search—almost 53% for basic research and 47% for applied research (table 4-17).
Department of EnergyDOE obligated an estimated $11.6 billion for R&D and
R&D plant in FY 2009, about 8% of the federal obligations total that year. Of this amount, $9.9 billion was for R&D and $1.7 billion for R&D plant. Obligations this year stemming from the ARRA appropriation totaled $2.2 billion, the third largest among the agencies (behind HHS and NSF).
The department’s intramural laboratories and FFRDCs accounted for 77% of the total obligations. Many of DOE’s research activities require specialized equipment and facili-ties available only at its intramural laboratories and FFRDCs. Accordingly, DOE invests more resources in its intramural laboratories and FFRDCs than other federal agencies. The 23% of obligations to extramural performers were chiefly to businesses and universities/colleges.
For the $9.9 billion obligated to R&D, basic research accounted for 41%, applied research 32%, and develop-ment 27%. DOE R&D activities are rather evenly distrib-uted among defense (much of it funded by the department’s
Table 4-16Federal obligations for R&D and R&D plant, by agency and performer: FY 2009(Millions of dollars)
Total by performers
Agency Total R&DR&D plant R&D
R&D plant
Intramural and
FFRDCs Percent of total
Extramural performers
Percent of total
All agencies .......................................... 136,996.5 133,349.0 3,647.5 8,714.1 1,367.8 42,954.7 31.4 94,041.8 68.6Department of Defense ..................... 68,230.2 68,113.0 117.2 184.2 0.0 18,695.1 27.4 49,535.1 72.6Department of Health and
Human Services ............................ 35,735.9 35,584.0 151.9 4,889.0 49.7 7,546.7 21.1 28,189.2 78.9Department of Energy ....................... 11,562.2 9,889.9 1,672.3 1,393.4 813.2 8,853.3 76.6 2,709.0 23.4National Science Foundation ............ 6,924.8 6,095.2 829.6 1,807.6 388.5 303.8 4.4 6,618.2 95.6National Aeronautics and Space
Administration .............................. 5,937.1 5,937.0 0.1 314.7 0.0 1,958.1 33.0 3,979.0 67.0Department of Agriculture ................ 2,347.2 2,269.7 77.5 0.4 11.0 1,576.9 67.2 770.3 32.8Department of Commerce ................ 1,533.3 1,146.9 386.4 46.0 98.7 1,181.4 77.0 351.9 23.0Department of Homeland Security ... 983.6 672.5 311.1 0.0 0.0 596.5 60.6 387.0 39.3Department of Transportation .......... 846.3 826.0 20.3 0.0 0.0 280.5 33.2 565.7 66.8Department of the Interior................. 738.8 732.4 6.4 59.6 0.0 602.5 81.6 136.3 18.4Environmental Protection Agency .... 552.8 552.8 0.0 0.0 0.0 414.1 74.9 138.8 25.1Department of Veterans Affairs......... 510.0 510.0 0.0 0.0 0.0 510.0 100.0 0.0 0.0Department of Education .................. 322.4 322.4 0.0 0.0 0.0 15.6 4.8 306.7 95.2Smithsonian Institution ..................... 226.7 152.0 74.7 0.0 6.7 226.7 100.0 0.0 0.0Agency for International
Development ................................. 160.1 160.1 0.0 0.0 0.0 10.6 6.6 149.5 93.4All other agencies ............................. 385.1 385.1 0.0 19.2 0.0 183.0 47.5 204.9 53.2
FFRDC = federally funded research and development center
NOTES: Table lists all agencies with R&D obligations greater than $100 million in FY 2009. Data include obligations from the additional federal R&D funding appropriated by the American Recovery and Reinvestment Act of 2009. R&D is basic research, applied research, and development; does not include R&D plant. Intramural activities include actual intramural R&D performance and costs associated with planning and administration of both intramural and extramural programs by federal personnel. Extramural performers includes federally funded R&D performed in the United States and U.S. territories by industry, universities and colleges, other nonprofit institutions, state and local governments, and foreign organizations. All other agencies includes Department of Housing and Urban Development, Department of Justice, Department of Labor, Department of State, Department of the Treasury, Appalachian Regional Commission, Federal Communications Commission, Federal Trade Commission, Library of Congress, National Archives and Records Commission, Nuclear Regulatory Commission, and Social Security Administration.
SOURCE: National Science Foundation, National Center for Science and Engineering Statistics, Federal Funds for Research and Development (FY 2009–11). See appendix table 4-31.
Science and Engineering Indicators 2012
ARRA funds

Science and Engineering Indicators 2012 � 4-33
National Nuclear Security Administration), energy, and gen-eral science (much of which is funded by the department’s Office of Science).
National Science FoundationNSF obligated $6.9 billion for R&D and R&D plant in
FY 2009, or 5% of the federal total. Extramural performers, chiefly universities and colleges ($6.6 billion), represented 96% of this total. ARRA-related obligations were $2.2 bil-lion (R&D and R&D plant), the second largest among the agencies. Basic research accounted for about 92% of the R&D component. NSF is the federal government’s primary source of funding for academic basic science and engineer-ing research and the second-largest federal source (after HHS) of R&D funds for universities and colleges.
National Aeronautics and Space AdministrationNASA obligated an estimated $5.9 billion to R&D in
FY 2009, 4% of the federal total. Sixty-seven percent of these obligations were for extramural R&D, given chiefly to industry performers. Agency intramural R&D and that by FFRDCs represented 33% of the NASA obligations total. By character of work, 71% of the NASA R&D obligations funded development activities; 17%, basic research; and 12%, applied research.
Department of AgricultureUSDA obligated an estimated $2.3 billion for R&D in
FY 2009, with the main focus on life sciences. The agen-cy is also one of the largest research funders in the social sciences, particularly agricultural economics. Of USDA’s
total obligations for FY 2009, about 67% ($1.6 billion) funded R&D by agency intramural performers, chiefly the Agricultural Research Service. Basic research accounts for about 41%; applied research, 51%; and development, 8%.
Department of CommerceDOC obligated an estimated $1.5 billion for R&D in
FY 2009, most of which represented the R&D and R&D plant spending of the National Oceanic and Atmospheric Administration (NOAA) and the National Institute of Standards and Technology (NIST). Seventy-seven percent of this total was for agency intramural R&D; 23% went to extramural performers, primarily businesses and universi-ties/colleges. For the R&D component, 12% was basic re-search; 72%, applied research; and 16%, development.
Department of Homeland SecurityDHS obligated an estimated $1.0 billion for R&D and
R&D plant in FY 2009, nearly all of which was for activities by the department’s Science and Technology Directorate. Sixty-one percent of this obligations total was for agency intramural and FFRDC activities. Just over 39% was con-ducted by extramural performers—mainly businesses, but also universities/colleges and other nonprofit organizations. Of the obligations for R&D, 15% was basic research; 37%, applied research; and 48%, development.
Other AgenciesThe eight other departments/agencies obligating more
than $100 million annually for R&D in FY 2009 were the Departments of Education, Interior, Justice, Transportation, and Veterans Affairs; and the Environmental Protection Agency, Agency for International Development, and Smith-sonian Institution (tables 4-16 and 4-17). These agencies varied with respect to the character of the research and the roles of intramural, FFRDC, and extramural performers.
Federal Spending on Research by FieldFederal agencies’ research covers the whole range of sci-
ence and engineering fields. These fields vary in their fund-ing levels and have different growth paths (see appendix tables 4-34 and 4-35).
Funding for basic and applied research combined account-ed for $63.7 billion (about 48%) of the $133.3 billion total of federal obligations for R&D in FY 2009 (table 4-17). Of this amount, $33.3 billion (52% of $63.7 billion) supported re-search in the life sciences (figure 4-13; appendix table 4-34). The fields with the next-largest amounts were engineering ($10.3 billion, 16%) and the physical sciences ($5.8 billion, 9%), followed by environmental sciences ($3.8 billion, 6%), and mathematics and computer sciences ($3.6 billion, 6%). The balance of federal obligations for research in FY 2009 supported psychology, the social sciences, and all other sci-ences ($7.0 billion overall, or 11% of the total for research).
HHS accounted for the largest share (56%) of federal ob-ligations for research in FY 2009 (appendix table 4-34). Most
Figure 4-11Federal obligations for R&D and R&D plant: FY 1980–2009Current dollars (billions)
NOTES: Data for FY 2009 include obligations from the additional federal R&D funding appropriated by the American Recovery and Reinvestment Act of 2009.
SOURCE: National Science Foundation, National Center for Science and Engineering Statistics, Federal Funds for Research and Development (FY 2009–11). See appendix table 4-30.
Science and Engineering Indicators 2012
1980 1985 1988 1991 1994 1997 2000 2003 2006 20090
20
40
60
80
100
120
140
160
R&D and R&D plant
R&D
R&D plant
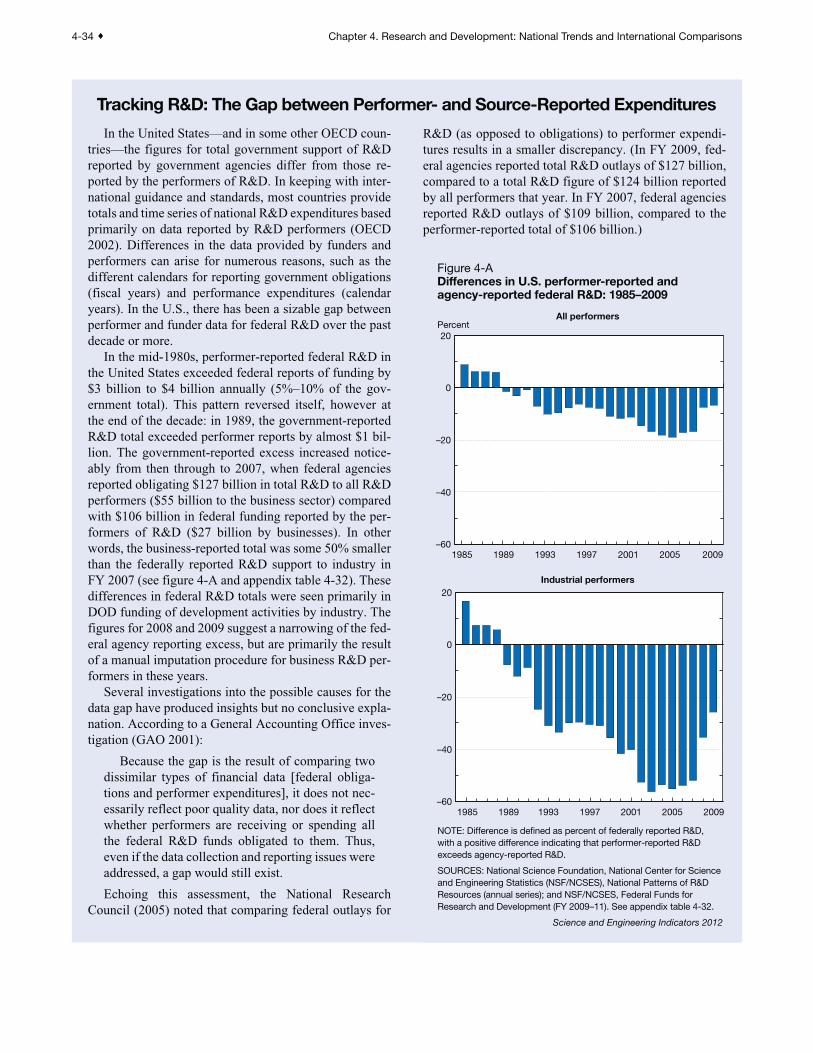
4-34 � Chapter 4. Research and Development: National Trends and International Comparisons
In the United States—and in some other OECD coun-tries—the figures for total government support of R&D reported by government agencies differ from those re-ported by the performers of R&D. In keeping with inter-national guidance and standards, most countries provide totals and time series of national R&D expenditures based primarily on data reported by R&D performers (OECD 2002). Differences in the data provided by funders and performers can arise for numerous reasons, such as the different calendars for reporting government obligations (fiscal years) and performance expenditures (calendar years). In the U.S., there has been a sizable gap between performer and funder data for federal R&D over the past decade or more.
In the mid-1980s, performer-reported federal R&D in the United States exceeded federal reports of funding by $3 billion to $4 billion annually (5%–10% of the gov-ernment total). This pattern reversed itself, however at the end of the decade: in 1989, the government-reported R&D total exceeded performer reports by almost $1 bil-lion. The government-reported excess increased notice-ably from then through to 2007, when federal agencies reported obligating $127 billion in total R&D to all R&D performers ($55 billion to the business sector) compared with $106 billion in federal funding reported by the per-formers of R&D ($27 billion by businesses). In other words, the business-reported total was some 50% smaller than the federally reported R&D support to industry in FY 2007 (see figure 4-A and appendix table 4-32). These differences in federal R&D totals were seen primarily in DOD funding of development activities by industry. The figures for 2008 and 2009 suggest a narrowing of the fed-eral agency reporting excess, but are primarily the result of a manual imputation procedure for business R&D per-formers in these years.
Several investigations into the possible causes for the data gap have produced insights but no conclusive expla-nation. According to a General Accounting Office inves-tigation (GAO 2001):
Because the gap is the result of comparing two dissimilar types of financial data [federal obliga-tions and performer expenditures], it does not nec-essarily reflect poor quality data, nor does it reflect whether performers are receiving or spending all the federal R&D funds obligated to them. Thus, even if the data collection and reporting issues were addressed, a gap would still exist.
Echoing this assessment, the National Research Council (2005) noted that comparing federal outlays for
R&D (as opposed to obligations) to performer expendi-tures results in a smaller discrepancy. (In FY 2009, fed-eral agencies reported total R&D outlays of $127 billion, compared to a total R&D figure of $124 billion reported by all performers that year. In FY 2007, federal agencies reported R&D outlays of $109 billion, compared to the performer-reported total of $106 billion.)
Tracking R&D: The Gap between Performer- and Source-Reported Expenditures
Percent
Figure 4-ADifferences in U.S. performer-reported and agency-reported federal R&D: 1985–2009
NOTE: Difference is defined as percent of federally reported R&D, with a positive difference indicating that performer-reported R&D exceeds agency-reported R&D.
SOURCES: National Science Foundation, National Center for Science and Engineering Statistics (NSF/NCSES), National Patterns of R&D Resources (annual series); and NSF/NCSES, Federal Funds for Research and Development (FY 2009–11). See appendix table 4-32.
Science and Engineering Indicators 2012
All performers
Industrial performers
1985 1989 1993 1997 2001 2005 2009–60
–40
–20
0
20
1985 1989 1993 1997 2001 2005 2009–60
–40
–20
0
20

Science and Engineering Indicators 2012 � 4-35
of this amount funded research in medical and related life sci-ences, primarily through NIH. The five next-largest federal agencies for research funding that year were DOE (11%), DOD (11%), NSF (10%), USDA (3%), and NASA (3%).
DOE’s $7.2 billion in research obligations provided funding for research in the physical sciences ($2.6 billion) and engineering ($2.5 billion), along with mathematics and computer sciences ($1.0 billion). DOD’s $6.8 billion of re-search funding emphasized engineering ($3.5 billion), but also included mathematics and computer sciences ($0.9 billion), physical sciences ($0.8 billion) and life sciences ($0.9 billion). NSF—not a mission agency in the tradi-tional sense—is charged with “promoting the health of sci-ence.” Consequently, it had a relatively diverse $6.1 billion research portfolio that allocated about $1.0 billion to $1.3 billion in each of the following fields: environmental, life, mathematics/computer, and physical sciences; and engineer-ing. Lesser amounts were allocated to psychology and the social and other sciences. USDA’s $2.1 billion was directed primarily at the life (agricultural) sciences ($1.7 billion). NASA’s $1.7 billion for research emphasized engineering ($0.6 billion), followed by the physical sciences ($0.5 bil-lion) and environmental sciences ($0.4 billion).
Growth in federal research obligations has slowed since 2004. Federal obligations for research in all S&E fields ex-panded on average at 3.6% annually (in current dollars) over the last 5 years (FY 2004–09), a much higher 6.6% over the last 10 years, and 5.8% over the last 20 years (appendix table 4-35). Adjusted for inflation, the 2004–09 average growth turns into an average annual increase of only 0.9%, which contrasts with a 10-year real growth of 4.1% and 3.3% over the last 20 years.
Since the late 1990s, growth in federal research obliga-tions in the life sciences and psychology has exceeded the S&E average, leading to growing shares for these fields. Growth for the mathematics and computer sciences was just below the S&E average. The shares of research funding go-ing to physical sciences, behavioral and other social scienc-es, and engineering, declined. Environmental sciences grew slower than both total research and inflation.
Federal R&E Tax CreditsThe federal government makes available tax credits for
companies that expand their R&D activities, as a way of counteracting potential business underinvestment in R&D.
Table 4-17Federal obligations for R&D, by agency and character of work: FY 2009(Millions of current dollars)
Percent of total R&D
Agency Total R&D Basic
research Applied research Development
Basic research
Applied research Development
All agencies .................................................... 133,349.0 32,877.9 30,830.9 69,640.2 24.7 23.1 52.2Department of Defense ............................... 68,113.0 1,735.0 5,071.4 61,306.5 2.5 7.4 90.0Department of Health and
Human Services ...................................... 35,584.0 18,772.2 16,717.7 94.1 52.8 47.0 0.3Department of Energy ................................. 9,889.9 4,061.0 3,127.2 2,701.8 41.1 31.6 27.3National Science Foundation ...................... 6,095.2 5,623.9 471.3 0.0 92.3 7.7 0.0National Aeronautics and Space Administration ......................................... 5,937.0 1,021.6 681.8 4,233.5 17.2 11.5 71.3Department of Agriculture .......................... 2,269.7 924.0 1,154.0 191.7 40.7 50.8 8.4Department of Commerce .......................... 1,146.9 138.3 820.8 187.8 12.1 71.6 16.4Department of Transportation .................... 826.0 0.0 586.7 239.2 0.0 71.0 29.0Department of the Interior........................... 732.4 47.1 610.5 74.8 6.4 83.4 10.2Department of Homeland Security ............. 672.5 101.3 245.9 325.3 15.1 36.6 48.4Environmental Protection Agency .............. 552.8 83.7 384.4 84.7 15.1 69.5 15.3Department of Veterans Affairs................... 510.0 203.3 274.0 32.7 39.9 53.7 6.4Department of Education ............................ 322.4 4.2 198.4 119.7 1.3 61.5 37.1Agency for International Development ....... 160.1 0.6 159.6 0.0 0.4 99.7 0.0Smithsonian Institution ............................... 152.0 152.0 0.0 0.0 100.0 0.0 0.0All other agencies ....................................... 385.1 9.7 327.2 48.4 2.5 85.0 12.6
NOTES: Table lists all agencies with R&D obligations greater than $100 million in FY 2009. Data include obligations from the additional federal R&D funding appropriated by the American Recovery and Reinvestment Act of 2009 (ARRA). ARRA funds obligated for R&D totaled $8,714.1 million in FY 2009: $5,115.9 million for basic research, $2,611.3 million for applied research, and $987 million for development. All other agencies includes Department of Housing and Urban Development, Department of Justice, Department of Labor, Department of State, Department of the Treasury, Appalachian Regional Commission, Federal Communications Commission, Federal Trade Commission, Library of Congress, National Archives and Records Commission, Nuclear Regulatory Commission, and Social Security Administration.
SOURCE: National Science Foundation, National Center for Science and Engineering Statistics, Federal Funds for Research and Development (FY 2009–11). See appendix table 4-31.
Science and Engineering Indicators 2012

4-36 � Chapter 4. Research and Development: National Trends and International Comparisons
Governments stimulate the conduct of R&D through tax in-centives—allowances, exemptions, deductions, or tax cred-its—each of which can be designed with differing criteria for eligibility, allowable expenses, and baselines (OECD 2003). In the United States, federal tax incentives for qualified busi-ness R&D expenditures include a deduction under Internal Revenue Code (IRC) Section 174 (C.F.R. Title 26) and a re-search and experimentation (R&E) tax credit under Section 41.22 The latter was established in 1981 by the Economic Recovery Tax Act (Public Law 97-34). It was last renewed by the Tax Relief, Unemployment Insurance Reauthorization, and Job Creation Act of 2010, through 31 December 2011.23 The Obama administration has proposed making this credit permanent (U.S Department of Treasury 2011).
Along with the United States, over 20 OECD countries offer fiscal incentives for business R&D (OECD 2011b). Fiscal incentives for R&D are typically predicated on R&D’s role in economic growth along with the recognition that R&D can generate social benefits well beyond those captured by companies investing in such activities (see Hemphill 2009 and references therein).
In the United States there were about $8.3 billion in business R&E tax credit claims both in 2007 and in 2008 (see appendix table 4-36).24 Five industries accounted for 75% of these claims in 2008: computer and electronic prod-ucts; chemicals, including pharmaceuticals, and medicines;
transportation equipment, including motor vehicles and aerospace; information, including software; and profes-sional, scientific, and technical services, including com-puter and R&D services.
Since 1998, R&E credit claims have grown at about the same average annual rate as has company-funded domestic R&D, keeping the ratio of R&E credit claims to company-funded domestic R&D in a narrow range (3.3% in 2008).25 In 2008, more than 12,700 corporate returns claimed at least one component of the R&E tax credit (appendix table 4-37). Corporations with more than $250 million in business re-ceipts accounted for 14% of returns claiming the credit in 2008 and 82% of the dollar value of all claims. In 2001, they had accounted for 9% of returns and 73% of dollar claims.26
The federal R&E tax credit encompasses a regular cred-it and as many as two forms of alternative credit formulas since 1996.27 Under the regular credit, companies can take a 20% credit for qualified research above a base amount for activities undertaken in the United States (IRC section 41(a)(1)). Thus, the regular credit is characterized as a fixed-base incremental credit. An incremental design is intended to encourage firms to spend more on R&D than they oth-erwise would by lowering after-tax costs (Guenther forth-coming). Expenses paid or incurred for qualified research include company-funded expenses for wages paid, sup-plies used in the conduct of qualified research, and certain
Figure 4-12Federal obligations for R&D, by agency and character of work: FY 2009
DOC = Department of Commerce; DOD = Department of Defense; DOE = Department of Energy; DHS = Department of Homeland Security; HHS = Department of Health and Human Services; NASA = National Aeronautics and Space Administration; NSF = National Science Foundation; USDA = Department of Agriculture
NOTES: Detail may not add to total because of rounding. Includes obligations from the additional federal R&D funding appropriated by the American Recovery and Reinvestment Act of 2009.
SOURCE: National Science Foundation, National Center for Science and Engineering Statistics, Federal Funds for Research and Development (FY 2009–11). See appendix table 4-31.
Science and Engineering Indicators 2012
Other than DOD DOD
Basic research 3%
Applied research 7%
Advancedtechnologydevelopment 9%
Major systemsdevelopment 81%
Basic research 48%
Applied research 39%
Development 13%
DOD 51%
HHS 27%
NASA 4%USDA 2%
DOE 7%
NSF 5%
DOC 1%DHS 1% Other 3%

Science and Engineering Indicators 2012 � 4-37
Figure 4-13Federal obligations for research, by agency and major S&E field: FY 2009Current dollars (billions)
0 5 10 15
Total, all agencies HHS DOD
20 25 30 35
DOE NASA NSF
USDA DOC Other agencies
Other sciences necSocial sciences
PsychologyMath/computer sciencesEnvironmental sciences
Physical sciencesEngineering
Life sciences
Other sciences necSocial sciences
PsychologyMath/computer sciencesEnvironmental sciences
Physical sciencesEngineering
Life sciences
Other sciences necSocial sciences
PsychologyMath/computer sciencesEnvironmental sciences
Physical sciencesEngineering
Life sciences
0 0.5 1.0 1.5 2.0 2.5 3.0 3.5 4.0
0 0.5 1.0 1.5 2.0 2.5 3.0 3.5 4.00 0.5 1.0 1.5 2.0 2.5 3.0 3.5 4.00 0.5 1.0 1.5 2.0 2.5 3.0 3.5 4.0
0 0.5 1.0 1.5 2.0 2.5 3.0 3.5 4.00 0.5 1.0 1.5 2.0 2.5 3.0 3.5 4.00 0.5 1.0 1.5 2.0 2.5 3.0 3.5 4.0
DOC = Department of Commerce; DOD = Department of Defense; DOE = Department of Energy; HHS = Department of Health and Human Services; NASA = National Aeronautics and Space Administration; nec = not elsewhere classified; NSF = National Science Foundation; USDA = Department of Agriculture
NOTES: Scale differs for Total, all agencies and HHS compared to other agencies listed. Includes obligations from the additional federal R&D funding appropriated by the American Recovery and Reinvestment Act of 2009. Research includes basic and applied research.
SOURCE: National Science Foundation, National Center for Science and Engineering Statistics, Federal Funds for Research and Development (FY 2009–11). See appendix table 4-34.
Science and Engineering Indicators 2012
0 5 10 15 20 25 30 35
contract expenses. Further, research “must be undertaken for discovering information that is technological in nature, and its application must be intended for use in developing a new or improved business component.”28 The credit covers U.S.-performed R&D by both domestic and foreign-owned firms and excludes R&D conducted abroad by U.S. compa-nies. Activities generally disallowed for the purposes of the credit include those conducted after the beginning of com-mercial production and adapting an existing product or pro-cess. Research in the social sciences, arts, or humanities and research funded by another entity is also excluded.
Federal Technology Transfer and Other Innovation-Related Programs This section reviews data on two types of federal pro-
grams that support public-private collaboration for technol-ogy transfer and innovation.29 (For academic patents and related knowledge diffusion indicators, see chapter 5; for in-ternational business licensing fees and royalties, see chapter 6.) The first type includes federal programs for technology transfer from R&D funded and performed by agencies and laboratories. The second type supports new or small U.S. companies in R&D or technology deployment with R&D funds or technical assistance.
In the late 1970s, concerns about the strength of U.S. industries and their ability to be competitive in the global

4-38 � Chapter 4. Research and Development: National Trends and International Comparisons
economy intensified. Issues included the question of wheth-er inventions from federally funded academic research were adequately exploited for the benefit of the national economy and the need to create or strengthen public-private R&D partnerships. Since the 1980s, several U.S. policies have facilitated cross-sector R&D collaboration and technol-ogy transfer. One major policy thrust was to enhance for-mal mechanisms for transferring knowledge arising from federally funded and performed R&D (Crow and Bozeman 1998; NRC 2003). Other policies addressed federally funded academic R&D, the transition of early-stage technologies into the marketplace, and R&D and innovation by small or minority-owned businesses. For an overview of these ini-tiatives, see sidebar, “Major Federal Legislation Related to Technology Transfer and Commercializing R&D.”
Federal Technology TransferFederal technology transfer refers to the various pro-
cesses through which inventions and other intellectual as-sets arising from federal laboratory R&D are conveyed to outside parties for further development and commercial applications. Technology transfer may also involve linking R&D capabilities and the resources of federal laboratories with outside public or private organizations for mutual ben-efit (FLC 2006).
In response to the Stevenson-Wydler Act of 1980 (as amended) federal agencies with laboratory operations have active efforts to engage in technology transfer as defined above, identify and manage intellectual assets created by their R&D, and participate in collaborative R&D relation-ships with nonfederal parties (including private businesses, universities, nonprofit organizations) consistent with agency mission goals. Federal labs have also been required to have technology transfer offices (termed an Office of Research and Technology Applications or ORTA) to assist in iden-tifying transfer opportunities and establishing appropri-ate arrangements for relationships with nonfederal parties (see sidebar “Federal Technology Transfer: Activities and Metrics”).
Six agencies continue to account for most of the annual total of federal technology transfer activities: DOD, HHS, DOE, NASA, USDA, and DOC. Statistics for these six agencies in FYs 2004 and 2009, spanning the main activ-ity areas of invention disclosures and patenting, intellectual property licensing, and collaborative relationships for R&D, appear in table 4-18.30 (Similar statistics for a larger set of agencies, going back over time to FY 2001, appear in ap-pendix table 4-38.)
As is apparent in the distribution of the statistics across the activity types in table 4-18, most agencies engage in all of the transfer activity types to some degree, but there are differences in the emphases. Some agencies are more in-tensive in patenting and licensing activities (such as HHS, DOE, and NASA); some place greater emphasis on transfer through collaborative R&D relationships (such as USDA and DOC). Some agencies have unique transfer authorities
which can confer practical advantages. NASA, for example, can establish collaborative R&D relationships through spe-cial authorities it has under the Space Act of 1958; USDA has a number of special options for establishing R&D col-laborations other than through CRADAs; DOE’s contractor-operated national labs, with their nonfederal staffs, are not constrained by the normal federal limitation on copyright by federal employees and are able to use copyright to protect and transfer computer software. In general, the mix of tech-nology transfer activities pursued by each agency reflects a broad range of considerations such as agency mission pri-orities, technologies principally targeted for development, intellectual property protection tools and policies, and the types of external parties through which transfer and collabo-ration are chiefly pursued.
Small Business Innovation-Related ProgramsThis section focuses on several small business programs.
The Small Business Innovation Research (SBIR) program was established by the Small Business Innovation Development Act of 198231 to stimulate technological innovation by in-creasing the participation of small companies in Federal R&D projects, increase private sector commercialization of innova-tion derived from federal R&D, and foster participation by minority and disadvantaged persons in technological innova-tion. The Small Business Technology Transfer (STTR) pro-gram was created in 1992 to stimulate cooperative R&D and federal technology transfer.32 SBIR and STTR are both ad-ministered by the Small Business Administration (SBA). The last portion of this section covers the Technology Innovation Program (TIP), created by the America COMPETES Act of 2007 and administered by NIST.
The focus on smaller or startup R&D-based companies in these programs is an example of the promotion of innova-tion-based entrepreneurship via public-private partnerships that enable not only financing but also R&D collaboration and commercialization opportunities (Gilbert et al. 2004; Link and Scott 2010).
According to the SBIR statute, federal agencies with ex-tramural R&D obligations exceeding $100 million must set aside a fixed percentage of such obligations (2.5% since FY 1997) for projects involving small business (those with few-er than 500 employees). In FY 2009, SBIR awards totaled $1.9 billion (SBA 2010). In FY 2008, 11 federal agencies awarded a total of $1.8 billion to about 5,400 SBIR projects (appendix tables 4-39 and 4-40). DOD provides about 50% of total SBIR funds annually, followed by HHS (around 30% since 1999), consistent with their large extramural R&D budgets.
The SBIR program is structured in three phases. Phase I evaluates the scientific and technical merit and feasibility of ideas. Phase II builds on phase I findings, is subject to further scientific and technical review, and requires a com-mercialization plan. During phase III, the results from phase II R&D are further developed and introduced into private markets or federal procurement using private or non-SBIR

Science and Engineering Indicators 2012 � 4-39
Technology Innovation Act of 1980 (Stevenson-Wydler Act) (Public Law 96-480)—established technology trans-fer as a federal government mission by directing federal labs to facilitate the transfer of federally-owned and orig-inated technology to nonfederal parties.
University and Small Business Patent Procedures Act of 1980 (Bayh-Dole Act) (Public Law 96-517)—permitted small businesses, universities, and nonprofits to obtain titles to inventions developed with federal funds. Also permitted government-owned and government-operated laboratories to grant exclusive patent rights to commer-cial organizations.
Small Business Innovation Development Act of 1982 (Public Law 97-219)—established the Small Business Innovation Research (SBIR) program, which required federal agencies to set aside funds for small businesses to engage in R&D connected to agency missions.
National Cooperative Research Act of 1984 (Public Law 98-462)—encouraged U.S. firms to collaborate in gener-ic precompetitive research by establishing a rule of rea-son for evaluating the antitrust implications of research joint ventures.
Patent and Trademark Clarification Act of 1984 (Public Law 98-620)—provided further amendments to the Stevenson-Wydler Act and the Bayh-Dole Act regarding the use of pat-ents and licenses to implement technology transfer.
Federal Technology Transfer Act of 1986 (Public Law 99-502)—enabled federal laboratories to enter coopera-tive research and development agreements (CRADAs) with outside parties and to negotiate licenses for patented inventions made at the laboratory.
Executive Order 12591, Facilitating Access to Science and Technology (1987)—issued by President Reagan, this executive order sought to ensure that the federal lab-oratories implemented technology transfer.
Omnibus Trade and Competitiveness Act of 1988 (Public Law 100-418)—in addition to measures on trade and in-tellectual property protection, the act directed attention to public-private cooperation on R&D, technology trans-fer, and commercialization. It also established NIST’s Manufacturing Extension Partnership (MEP) program.
National Competitiveness Technology Transfer Act of 1989 (Public Law 101-189)—amended the Federal Technology Transfer Act to expand the use of CRADAs
to include government-owned, contractor-operated feder-al laboratories and to increase nondisclosure provisions.
Small Business Innovation Development Act of 1992 (Public Law 102-564)—extended the existing SBIR pro-gram, increased the percentage of an agency’s budget to be devoted to SBIR, and increased the amounts of the awards. Also established the Small Business Technology Transfer (STTR) program to enhance the opportunities for collaborative R&D efforts between government-owned/contractor-operated federal laboratories and small businesses, universities, and nonprofit partners.
National Cooperative Research and Production Act of 1993 (Public Law 103-42)—relaxed restrictions on coop-erative production activities, which enable research joint venture participants to work together in the application of technologies that they jointly acquire.
National Technology Transfer and Advancement Act of 1995 (Public Law 104-113)—amended the Stevenson-Wydler Act to make CRADAs more attractive to federal laboratories, scientists, and private industry.
Technology Transfer Commercialization Act of 2000 (Public Law 106-404)—broadened CRADA licensing authority to make such agreements more attractive to pri-vate industry and increase the transfer of federal technol-ogy. Established procedures for performance reporting and monitoring by federal agencies on technology trans-fer activities.
America COMPETES Act of 2007 (America Creating Opportunities to Meaningfully Promote Excellence in Technology, Education, and Sciences [COMPETES] Act) (Public Law 110-69)—authorized increased investment in R&D; strengthened educational opportunities in sci-ence, technology, engineering, and mathematics from el-ementary through graduate school; and further developed the nation’s innovation infrastructure. Among other mea-sures, the act established NIST’s Technology Innovation Program (TIP) and called for a President’s Council on Innovation and Competitiveness.
America COMPETES Reauthorization Act of 2010 (Public Law 111–358)—updates the America COMPETES Act of 2007 and authorizes additional funding to science, technol-ogy, and education programs over the succeeding 3 years. The Act’s numerous provisions broadly directed strength-ening the foundation of the U.S. economy, creating new jobs, and increasing U.S. competitiveness abroad.
Major Federal Legislation Related to Technology Transfer and Commercializing R&D

4-40 � Chapter 4. Research and Development: National Trends and International Comparisons
federal funding.33 Several participating R&D agencies also offer bridge funding to phase III and other commercializa-tion support for startups (NRC 2008:208–216).34
Federal agencies with extramural R&D budgets exceed-ing $1 billion are required to set aside 0.3% of their extra-mural R&D budget for STTR awards. The program is also structured in three phases and involves R&D performed
jointly by small businesses, universities, and nonprofit re-search organizations. In FY 2008, federal agencies awarded 734 STTR grants valued at $240 million (appendix tables 4-39 and 4-41).
The Technology Innovation Program was set up for “the purpose of assisting U.S. businesses and institutions of higher education or other organizations, such as national laboratories and nonprofit research institutions, to support, promote, and accelerate innovation in the United States through high-risk, high-reward research in areas of critical national need.”35 Two areas of focus in recent funding competitions were advanced manufacturing materials and advanced sensors to support monitoring and assessment of civil infrastructure, such as water pipelines, roads, bridges, and tunnels. From FY 2008 to FY 2010, TIP made 38 competitive awards involving 78 participants including small businesses and universities. Over this period, awards reached $281 million, including $136 mil-lion from TIP and $145 million in industry-cost sharing funds (appendix table 4-42).
International R&D ComparisonsData on R&D expenditures by country and region provide
a broad picture of the changing distribution of R&D capabili-ties and activities around the world. R&D data available from the OECD cover the organization’s 34 member countries and 7 nonmembers.36 The United Nations Educational, Scientific, and Cultural Organization’s (UNESCO’s) Institute for Statistics provides data on additional countries. The discus-sion in this section draws on both of these datasets.
International comparisons necessarily involve currency conversions. The analysis in this section follows the interna-tional convention of converting foreign currencies into U.S. dollars via purchasing power parity (PPP) exchange rates. (See sidebar, “Comparing International R&D Expenditures.”)
Global Patterns of R&D ExpendituresWorldwide R&D expenditures totaled an estimated
$1,276 billion (purchasing power parities) in 2009. The cor-responding estimate, 5 years earlier in 2004 was $873 bil-lion. Ten years earlier, in 1999, it was $641 billion. By these figures, growth in these global totals has been rapid, averag-ing nearly 8% annually over the last 5 years and 7% over the last 10 years.
Overall, global R&D performance remains highly con-centrated in three geographic regions, North America, Asia, and Europe (figure 4-14). North America (United States, Canada, Mexico) accounted for 34% ($433 billion) of worldwide R&D performance in 2009; the combination of East/Southeast and South Asia (including China, Taiwan, Japan, India, South Korea), 32% ($402 billion); and Europe, including (but not limited to) European Union (EU) coun-tries, 25% ($319 billion). The remainder, approximately 10%, reflects the R&D of countries in the regions of Central and South America, Central Asia, Middle East, Australia/Oceania, and Africa.
Federal technology transfer can take a variety of forms (FLC 2006), including the following:
Commercial transfer. Movement of knowledge or technology developed by a federal lab to private orga-nizations in the commercial marketplace.
Scientific dissemination. Publications, conference papers, and working papers, distributed through scientific/technical channels; other forms of data dissemination.
Export of resources. Federal lab personnel made available to outside organizations with R&D needs through collaborative agreements or other service mechanisms.
Import of resources. Outside technology or expertise brought in by a federal lab to enhance the existing in-ternal capabilities.
Dual use. Development of technologies, products, or families of products with both commercial and federal applications.
Federal tech transfer metrics cover activities among three main classes of intellectual asset management and transfer:
Invention disclosure and patenting. Counts of inven-tion disclosures filed (typically, an inventing scientist or engineer filing a written notice of the invention with the lab’s technology transfer office), patent ap-plications filed with the U.S. Patent and Trademark Office (or abroad), and patents granted.
Licensing. Licensing of intellectual property, such as patents or copyrights, to outside parties.
Collaborative relationships for R&D. Including, but not limited to, Cooperative Research and Development Agreements (CRADAs)
In addition, the statutory annual tech transfer perfor-mance reporting by agencies with federal labs, estab-lished by the Technology Transfer Commercialization Act of 2000, provides data on downstream outcomes and impacts.
Federal Technology Transfer: Activities and Metrics

Science and Engineering Indicators 2012 � 4-41
The geographic concentration is more apparent when looking at specific countries (table 4-19). Three countries account for more than half of global R&D. The United States is by far the largest R&D performer ($402 billion in 2009), accounting for about 31% of the global total, but down from 38% in 1999. China became the second larg-est performer ($154 billion) in 2009, accounting for about 12% of the global total. Japan moved down to third, at 11% ($138 billion). The largest EU performers spend compara-tively less: Germany ($83 billion, 6%), France ($48 billion, 4%), and the United Kingdom ($40 billion, 3%). The most recent figure available for South Korea is 2008, with $44 billion of R&D—in recent years South Korea has typically been among the top seven R&D performing countries, rep-resenting 3%–4% of the global total. Taken together, these top seven countries account for about 71% of the global to-tal. Russia, Italy, Canada, India, Brazil, Taiwan, and Spain
comprise a next lower rung, with national R&D expendi-tures ranging from $20 billion to $33 billion.
Besides the generally vigorous pace at which the global total of R&D is now growing, the other major trend has been the rapid expansion of R&D performance in the regions of East/Southeast Asia and South Asia, including countries such as China, India, Japan, Malaysia, Singapore, South Korea, Taiwan, and Thailand. The R&D performed in these two Asian regions represented only 24% of the global R&D total in 1999, but accounted for 32% in 2009, including China (12%) and Japan (11%).
China continues to exhibit the most dramatic R&D growth pattern (figure 4-15). The World Bank revised China’s PPP exchange rate in late 2007, significantly lowering the dollar value of its R&D expenditures. Nonetheless, the pace of real growth over the past 10 years (1999–2009) in China’s over-all R&D remains exceptionally high at about 20% annually.
Table 4-18
Federal laboratory technology transfer activity indicators, total and selected U.S. agencies: FY 2004 and FY 2009
Technology transfer activity All federal labs DOD HHS DOE NASA USDA DOC
FY 2009
Invention disclosures and patentingInventions disclosed .................................. 4,422 831 389 1,439 1,373 153 49Patent applications .................................... 2,080 690 156 919 126 117 19Patents issued ........................................... 1,494 404 397 520 114 21 7
LicensingAll licenses, total active in fiscal year ........ 10,913 432 1,584 5,752 2,497 316 40
Invention licenses ................................... 4,226 386 1,304 1,452 504 316 40Other intellectual property licenses ........ 6,730 46 327 4,300 1,993 0 0
Collaborative relationships for R&D ..............CRADAs, total active in fiscal year ............ 7,733 2,870 457 744 1 233 2,386
Traditional CRADAs ............................... 4,219 2,247 284 744 1 191 77Other collaborative R&D relationships ....... 16,319 1 0 0 2,743 9,960 3,608
FY 2004Invention disclosures and patenting
Inventions disclosed .................................. 5,454 1,369 461 1,617 1,612 142 25Patent applications .................................... 1,768 517 216 661 207 81 12Patents issued ........................................... 1,391 426 167 520 189 50 12
LicensingAll licenses, total active in fiscal year ........ 7,567 369 1,424 4,345 861 296 125
Invention licenses ................................... 3,804 364 1,173 1,362 338 296 125Other intellectual property licenses ........ 3,775 5 251 2,983 523 0 0
Collaborative relationships for R&DCRADAs, total active in fiscal year ............ 6,015 2,833 220 610 0 205 1,969
Traditional CRADAs ............................... 3,546 2,425 119 610 0 185 67Other collaborative R&D relationships ....... 7,454 0 0 0 3,987 1,166 2,301
CRADA = Cooperative Research and Development Agreement; DOC = Department of Commerce; DOD = Department of Defense; DOE = Department of Energy; HHS = Department of Health and Human Services; NASA = National Aeronautics and Space Administration; USDA = U.S. Department of Agriculture
NOTES: Other federal agencies not listed but included in the All federal labs totals are the Department of Homeland Security, Department of the Interior, Department of Transportation, Department of Veterans Affairs, and Environmental Protection Agency. Invention licenses refers to inventions that are patented or could be patented. Other intellectual property (IP) refers to IP protected through mechanisms other than a patent, e.g., copyright. Total CRADAs refers to all agreements executed under CRADA authority (15 USC 3710a). Traditional CRADAs are collaborative R&D partnerships between a federal lab and one or more nonfederal organizations. Federal agencies have varying authorities for other kinds of collaborative R&D relationships.
SOURCE: National Institute of Standards and Technology, Federal Laboratory Technology Transfer, Fiscal Year 2009 Summary Report to the President and the Congress, March 2011, https://www.nist.gov/sites/default/files/documents/2017/05/09/Federal-Lab-TT-Report-FY2009.pdf See also appendix table 4-38.
Science and Engineering Indicators 2012

4-42 � Chapter 4. Research and Development: National Trends and International Comparisons
The rate of growth in South Korea’s R&D has also been relatively high, averaging nearly 10% annually over the 10-year period. Growth in Japan has been slower, at an annual average rate of 4.0%.
By comparison, while the U.S. remains atop the list of the world’s R&D performing nations, its pace of growth in R&D performance has averaged 5.0% over the same 1999–2009 period, and its share of global R&D has declined from 38% to 31% over this time. Total R&D by EU nations has been growing (current dollars) over the same 10 years at an aver-age annual rate of 5.8%. The pace of growth during the same period for Germany, France, and the United Kingdom has been somewhat slower, averaging 5.3%, 4.5%, and 4.5%, re-spectively. The EU countries accounted for 23% total global R&D in 2009, down from 27% in 1999.37
Comparison of Country R&D IntensitiesR&D intensity provides another basis for international
comparisons of R&D performance. This approach does not require conversion of a country’s currency to a standard international benchmark yet still provides a way to adjust for differences in the sizes of national economies. (For ad-ditional background on R&D intensity and how it is affected
by the economic make-up of a country, see sidebar, “R&D Intensity and the Composition of Gross Domestic Product.”)
Total R&D/GDP RatiosThe U.S. R&D/GDP ratio was just under 2.9% in 2009
(table 4-19). At this level, the United States is eighth among the economies tracked by the OECD and UNESCO. Israel continues to have the highest ratio, at 4.3%—although Finland is not far back at 4%. Sweden, Japan, and South Korea all have ratios well above 3%; Switzerland and Taiwan are slightly above the U.S. figure.
The R&D/GDP ratio in the United States has ranged from 1.4% in 1953 to a high of 2.9% in 1964, and has fluctuated in the range of 2.6% to 2.7% in recent years (figure 4-16). Most of the growth over time in the U.S. R&D/GDP ratio can be attributed to increases in nonfederal R&D spending, financed primarily by business. Nonfederally financed R&D increased from about 0.6% of GDP in 1953 to about 2.0% of GDP in 2009. This increase in the nonfederal R&D/GDP ra-tio reflects the growing role of business R&D in the national R&D system and, more broadly, the growing prominence of R&D-derived products and services in the national and global economies.
Comparisons of international R&D statistics are hampered by the lack of R&D-specific exchange rates. Two approaches are commonly used to facilitate inter-national R&D comparisons: (1) express national R&D expenditures as a percentage of GDP or (2) convert all expenditures to a single currency. The first method is straightforward but permits only gross comparisons of R&D intensity. The second method permits absolute level-of-effort comparisons and finer-grain analyses but entails choosing an appropriate method of currency con-version. The choice is between market exchange rates (MERs) and purchasing power parities (PPPs), both of which are available for a large number of countries over an extended period.
MERs represent the relative value of currencies for cross-border trade of goods and services but may not accurately reflect the cost of non-traded goods and ser-vices. They are also subject to currency speculation, political events, wars or boycotts, and official currency intervention.
PPPs were developed to overcome these shortcomings (Ward 1985). They take into account the cost differences of buying a similar market basket of goods and services covering tradables and nontradables. The PPP basket is assumed to be representative of total GDP across coun-tries. PPPs are the preferred international standard for calculating cross-country R&D comparisons and are used in all official R&D tabulations of the OECD.*
Because MERs tend to understate the domestic pur-chasing power of developing countries’ currencies, PPPs can produce substantially larger R&D estimates than MERs for these countries. For example, China’s 2006 R&D expenditures (as reported to the OECD) are $38 bil-lion using MERs but $87 billion using PPPs. (Appendix table 4-2 lists the relative difference between MERs and PPPs for a number of countries.)
However, PPPs for large, developing countries such as India and China are often rough approximations and have other shortcomings. For example, structural differ-ences and income disparities between developing and developed countries may result in PPPs based on mark-edly different sets of goods and services. In addition, the resulting PPPs may have very different relationships to the cost of R&D in different countries.
R&D performance in developing countries often is con-centrated geographically in the most advanced cities and regions in terms of infrastructure and level of educated workforce. The costs of goods and services in these areas can be substantially greater than for the country as a whole.
*Recent research raises some questions about the use of GDP PPPs for deflating R&D expenditures. In analyzing the manufacturing R&D inputs and outputs of six industrialized OECD countries, Dougherty et al. (2007) conclude that “the use of an R&D PPP will yield comparative costs and R&D intensities that vary substantially from the current prac-tice of using GDP PPPs, likely increasing the real R&D performance of the comparison countries relative to the United States.” The issue remains unresolved.
Comparing International R&D Expenditures

Science and Engineering Indicators 2012 4-43
Among other top seven R&D-performing countries, total R&D/GDP ratios over the 1999–2009 period show mixed trends (figure 4-16). Compared with 1999 R&D/GDP ratios, the 2009 ratios were substantially higher in Japan, Germany, and South Korea. (However, Japan’s rising ratio reflects the confluence of declining GDP and largely flat R&D spending.) Most notably, China’s ratio more than doubled over this 10-year period. For the United Kingdom, the 2009 ratio remained about the same, and for France, it slightly increased.
In addition to the United States, countries in Nordic and Western Europe and the most advanced areas of Asia have R&D/GDP ratios above 1.5%. This pattern broadly reflects the global distribution of wealth and level of economic de-velopment. Countries with high incomes tend to emphasize the production of high-technology goods and services and are also those that invest heavily in R&D activities. Private sectors in low-income countries often have a low concentra-tion of high-technology industries, resulting in low overall R&D spending and, therefore, low R&D/GDP ratios.
Nondefense R&D and Basic ResearchFurther perspective is provided by the ratio of nondefense
R&D expenditures to GDP. This ratio more directly mea-sures civilian R&D intensity and is useful when comparing
nations with substantially different financial commitments to national defense. Table 4-20 provides such figures for the top seven R&D performing nations, for 2009 or most recent data year. The U.S. ratio (2.3% in 2009) ranks ahead of that for the United Kingdom and France but lags behind Japan, South Korea, and Germany. (Data on this metric for China are not currently available.)
Another perspective comes from the extent to which spending on basic research accounts for a country’s total R&D/GDP ratio. Estimates of the relative volume of ba-sic research spending can provide a glimpse of the extent to which R&D resources are directed toward advancing the scientific knowledge base.
In 2009, the U.S. basic research/R&D ratio is about 0.6% and accounts for about a fifth of the total R&D/GDP ratio (table 4-20). France’s basic research ratio is slightly below the U.S. figure and accounts for just over a quarter of its total ra-tio. South Korea’s basic research ratio is close to the U.S. and French figures. The basic research ratios for Japan, the United Kingdom, and, especially, China are below the U.S. figure.
World total = $1,276
PPP = purchasing power parity
NOTES: Foreign currencies converted to U.S. dollars through purchasing power parities. Some country figures are estimated. Countries are grouped according to the regions described by The World Factbook, www.cia.gov/library/publications/the-world-factbook/index.html
SOURCES: National Science Foundation, National Center for Science and Engineering Statistics, estimates, July 2011. Based on data from Organisation for Economic Co-operation and Development, Main Science and Technology Indicators (2011/1); and United Nations Educational, Scientific, and Cultural Organization (UNESCO) Institute for Statistics, http://stats.uis.unesco.org/unesco/ReportFolders/ReportFolders.aspx, table 25, accessed 13 July 2011.
Science and Engineering Indicators 2012
South America $31 (2.4%)
Africa$9 (0.7%)
North America $433 (33.9%)
Europe$319 (25.0%)
South Asia$34 (2.6%)
Australia& Oceania$22 (1.8%)
Middle East$26 (2.0%)
Central Asia$33 (2.6%)
East, SoutheastAsia $369 (28.9%)
Central America & Caribbean $0.6 (<0.1%)
Figure 4-14Global R&D expenditures by region: 2009U.S. PPP dollars (billions)

4-44 � Chapter 4. Research and Development: National Trends and International Comparisons
R&D by Performing Sector and Source of Funds
The business sector is the predominant R&D perform-er for all seven of the top R&D performing nations (table 4-21).38 For the U.S., the business sector accounted for 70% of gross expenditures on R&D in 2009. Japan’s business sector was the highest, accounting for almost 76% of the country’s total R&D. China and South Korea were also well above the U.S. level. France and the United Kingdom were somewhat lower, at, respectively, 62% and 60%.
R&D performance by the government ranges over 9%–19% of total national R&D for the seven countries. Japan (9%) and the United Kingdom (9%) are on the lower end of this range. China (19%) and France (16%) are at the high end. The U.S., South Korea, and Germany lie in between.
Academic R&D ranges from 8% to 28% of total national R&D performance for these countries. China is the low point, at 8%. The United Kingdom is the highest, at 28%. The U.S. (14%), Japan (13%), and South Korea (11%) have lower shares; Germany (18%) and France (21%), higher shares.
The structure of a nation’s economy can be a consid-eration in interpreting and comparing national R&D in-tensity statistics. That is, the relative prominence of major sectors such as agriculture, manufacturing, and services can directly influence the ratio of overall R&D expendi-tures to gross domestic product. Businesses and organi-zations differ widely in their relative need for investment in the latest science and technology. So, countries whose overall GDP depends more heavily on advanced technol-ogy industries will typically exhibit higher R&D/GDP ra-tios than other countries.
Agriculture is a comparatively small component (6% or less) for all but 2 of the top 14 R&D performing coun-tries (figure 4-B). The exceptions are India, where agri-culture currently accounts for about 16% of its GDP, and China, where it is 10%. Industrial production (manufac-turing) is 20%–30% of GDP for all but three of the coun-tries. China is a much higher 47%; South Korea is 39% and Russia 34%. Services are 60%–70% of national GDP for all but 2 of the 14 countries. China is substantially less services-dependent, at 44% of GDP, and India is some-what less so, at 55%.
R&D Intensity and the Composition of Gross Domestic Product
Figure 4-BComposition of gross domestic product, for selected countries/economies, by sector: 2010
NOTES: Data are estimates. Latest data for South Korea are 2008. Fourteen largest R&D performing countries (see table 4-20).
SOURCE: Central Intelligence Agency, The World Factbook, https://www.cia.gov/library/publications/the-world-factbook/index.html, accessed 16 March 2011.
Science and Engineering Indicators 2012
Agriculture Industry Services
100806040Percent
200
Spain
Brazil
Taiwan
Italy
Russia
Canada
India
UnitedKingdom
France
SouthKorea
Germany
China
Japan
UnitedStates
Figure 4-15Gross domestic expenditures on R&D by the United States, EU, and selected other countries: 1981–2009Constant PPP dollars (billions)
EU = European Union; PPP = purchasing power parity
NOTES: Data not available for all countries in all years. Data for United States in this figure reflect international standards for calculating gross expenditures on R&D, which vary slightly from NSF approach to tallying U.S. total R&D. Data for Japan for 1996 onward may not be consistent with earlier data due to changes in methodology. EU data for all years based on current 27 EU member countries.
SOURCE: Organisation for Economic Co-operation and Develop-ment, Main Science and Technology Indicators (2011/1). See appendix table 4-43.
Science and Engineering Indicators 2012
1981 1985 1989 1993 1997 2001 2005 20090
50
100
150
200
250
300
350
400
450
United States
EU
Germany
France
United Kingdom
Japan
China
South Korea

Science and Engineering Indicators 2012 � 4-45
With regard to the funding of R&D, the business sector is again the predominant source for all seven of the top R&D performing nations (table 4-22). In 2009, funding for about 75% of Japan’s total national R&D came from the business sector. The corresponding figures for South Korea, China, and Germany are also high, in the 67%–73% range. R&D
funding from business is lower, but still predominant, in the U.S., at 60%. The corresponding figures for France (51%) and the United Kingdom (45%) are notably lower.
Government is the second major source of R&D fund-ing for these seven countries. France is the highest, at 39%. The lowest is Japan at 18%. The United Kingdom (33%),
Table 4-19International comparisons of gross domestic expenditures on R&D and R&D share of gross domestic product, by region and selected country/economy: 2009 or most recent year
GERD GERD/GDP GERD GERD/GDPRegion/country/economy (PPP $millions) (%) Region/country/economy (PPP $millions) (%)
North America Middle EastUnited States (2009)a ................ 401,576.5 2.88 Israel (2009) .............................. 8,810.1 4.28Canada (2009) ........................... 24,551.3 1.92 Turkey (2009) ............................ 8,681.2 0.85Mexico (2007) ........................... 5,719.6 0.37 Iran (2008) ................................. 6,465.2 0.79
South America AfricaBrazil (2008) .............................. 21,649.4 1.08 South Africa (2008) ................... 4,689.3 0.93Argentina (2007) ........................ 2,678.8 0.51 Egypt (2009) .............................. 997.3 0.21Chile (2004) ............................... 1,227.7 0.68 Morocco (2006) ......................... 765.1 0.64
Tunisia (2009) ............................ 1,048.5 1.21Europe
Germany (2009) ........................ 82,730.7 2.78 Central AsiaFrance (2009) ............................ 47,953.5 2.21 Russian Federation (2009) ........ 33,368.1 1.24United Kingdom (2009) ............. 40,279.5 1.85Italy (2009) ................................ 24,752.6 1.27 South AsiaSpain (2009) .............................. 20,496.4 1.38 India (2007) ............................... 24,439.4 0.76Sweden (2009) .......................... 12,494.9 3.62 Pakistan (2009) ......................... 2,055.2 0.46Netherlands (2009) .................... 12,273.8 1.82Switzerland (2008) .................... 10,512.7 3.00 East, Southeast AsiaAustria (2009) ............................ 8,931.3 2.75 Japan (2009) ............................. 137,908.6 3.33Belgium (2009) .......................... 7,684.9 1.96 China (2009) .............................. 154,147.4 1.70Finland (2009) ........................... 7,457.8 3.96 South Korea (2008) ................... 43,906.4 3.36Denmark (2009) ......................... 6,283.8 3.02 Taiwan (2009) ............................ 21,571.8 2.93Norway (2009) ........................... 4,734.1 1.76 Singapore (2009) ....................... 5,626.5 2.35Poland (2009) ............................ 4,874.9 0.68 Malaysia (2006) ......................... 2,090.9 0.64Portugal (2009) .......................... 4,411.0 1.66 Thailand (2007) ......................... 1,120.8 0.21Czech Republic (2009) .............. 4,094.8 1.53Ireland (2009) ............................ 3,164.6 1.79 Australia, OceaniaUkraine (2009) ........................... 2,485.7 0.86 Australia (2008) ......................... 18,755.0 2.21Hungary (2009) ......................... 2,333.8 1.15 New Zealand (2007) .................. 1,422.5 1.17Romania (2009) ......................... 1,471.5 0.47Greece (2007) ........................... 1,867.9 0.59 Selected country groupsBelarus (2009) ........................... 813.3 0.65 EU (2009) .................................. 297,889.6 1.90Slovenia (2009) ......................... 1,043.6 1.86 OECD (2008) ............................. 965,629.1 2.33Croatia (2009) ........................... 743.1 0.84 G-20 countries (2009) ............... 1,181,263.7 2.01Luxembourg (2009) ................... 708.5 1.68Slovak Republic (2009) ............. 595.5 0.48
EU = European Union; GDP = gross domestic product; GERD = gross expenditures (domestic) on R&D; OECD = Organisation for Economic Co-operation and Development; PPP = purchasing power parity
a Figures for the United States in this table may differ slightly from those cited earlier in the chapter. Data here reflect international standards for calculat-ing GERD, which vary slightly from NSF protocol for tallying U.S. total R&D.
NOTES: Year of data listed in parentheses. Foreign currencies converted to dollars through purchasing power parities. Countries with annual GERD of $500 million or more. Countries are grouped according to the regions described by the The CIA World Factbook, www.cia.gov/library/publications/the-world-factbook/index.html. No countries in the Central America/Caribbean region had annual GERD of $500 million or more. Data for Israel are civilian R&D only. See sources below for GERD statistics on additional countries.
SOURCES: OECD, Main Science and Technology Indicators (2011/1); United Nations Educational, Scientific, and Cultural Organization (UNESCO) Insti-tute for Statistics, http://stats.uis.unesco.org/unesco/ReportFolders/ReportFolders.aspx, table 25, accessed 13 July 2011.
Science and Engineering Indicators 2012

4-46 � Chapter 4. Research and Development: National Trends and International Comparisons
Germany (28%), and United States (31%) are on the higher side. South Korea (25%) and China (23%) are in between.
Funding from abroad refers to funding from businesses, universities, governments, and other organizations located outside of the country. Table 4-22 shows this funding cat-egory for selected OECD countries. For the U.S., data on funding from abroad is available only for the business sector.
Government R&D PrioritiesThe mix of government funding for R&D across dif-
fering objectives (e.g., defense, health, space, general re-search) provides insights into government R&D priorities. The OECD compiles such statistics annually on its member countries and selected others: government budget appropria-tions or outlays for R&D (GBAORD). GBAORD indicators for the United States and other top R&D performing coun-tries appear in table 4-23, broken down by a number of ma-jor socioeconomic objectives.
Defense is an objective for government funding of R&D for all the top R&D-performing countries, but the share
varies widely (table 4-23). Defense accounted for 52% of U.S. federal R&D support in 2009, but was markedly lower elsewhere: a smaller but still sizable 28% in France and 18% in the United Kingdom, 17% in South Korea, and below 6% in both Germany and Japan.
Defense has remained the focus of more than 50% of the federal R&D budget in the United States for much of the past 25 years. It was 63% in 1990 as the long Cold War period drew to a close, but dropped in subsequent years. The defense share of government R&D funding for the other countries over the past 25 years has generally declined or remained at a stable, low level.
The health and environment objective now accounts for some 56% of nondefense federal R&D budget support in the United States and 29% in the United Kingdom. For both coun-tries, the share has expanded dramatically over the share pre-vailing several decades ago. The health and environment share is currently 19% in South Korea, 15% in France, and 10% or less in Germany and Japan. The funding under this objective goes primarily into the health arena in the United States and the United Kingdom (appendix table 4-45). In the other countries, it is more balanced between health and the environment.
The economic development objective encompasses agri-culture, fisheries and forestry, industry, infrastructure, and energy. The share of nondefense government R&D support allocated to economic development has generally declined over the past 25 years across the OECD countries. In the United States, it was 36% of all nondefense federal sup-port for R&D in 1981, dropping to 13% in 2009.39 In the United Kingdom, it was 39% in 1981, declining to 9% in 2009. Despite a decline, support for this objective remains substantial in some countries: 23% in Germany and 24% in France (both with particular attention to industrial produc-tion and technology) and 31% in Japan (notably in energy and industrial production and technology). South Korea cur-rently has by far the largest share for this objective, 52%, with a particularly strong emphasis in recent years on indus-trial production and technology.
The civil space objective now accounts for 11% of nonde-fense federal R&D funding in the United States. The share has been above or around 20% in the United States for much of the past 25 years. The share in France is currently about 13%, and has been around that level for almost 20 years. The share has been well below 10% for the rest of the top R&D countries.
Both the non-oriented research and general university funds (GUF) objectives reflect government funding for R&D by academic, government, and other performers that is direct-ed chiefly at the general advancement of knowledge in the natural sciences, engineering, social sciences, humanities, and related fields. For some of the countries, the sum of these two objectives currently represents by far the largest part of non-defense GBAORD: Germany (58%), Japan (54%), the United Kingdom (54%), and France (45%). The corresponding 2009 shares for the United States (18%) and South Korea (23%) are substantially smaller. Nevertheless, cross-national compari-sons of these particular indicators can be difficult, since some countries (notably the U.S.) do not use the GUF mechanism to
Figure 4-16Gross expenditures on R&D as share of gross domestic product, for selected countries: 1981–2009
GDP = gross domestic product
NOTES: Top seven R&D performing countries. Data not available for all countries for all years. Figures for the United States reflect international standards for calculating gross expenditures on R&D, which differ slightly from the NSF protocol for tallying U.S. total R&D. Data for Japan, for 1996 onward, may not be consistent with earlier data due to changes in methodology.
SOURCE: Organisation for Economic Co-operation and Develop-ment, Main Science and Technology Indicators (2011/1). See appendix table 4-43.
Science and Engineering Indicators 2012
Total R&D/GDPPercent
1981 1985 1989 1993 1997 2001 2005 20090
0.5
1.0
1.5
2.0
2.5
3.0
3.5
4.0
United StatesGermanyFranceUnited Kingdom
Japan
China
South Korea
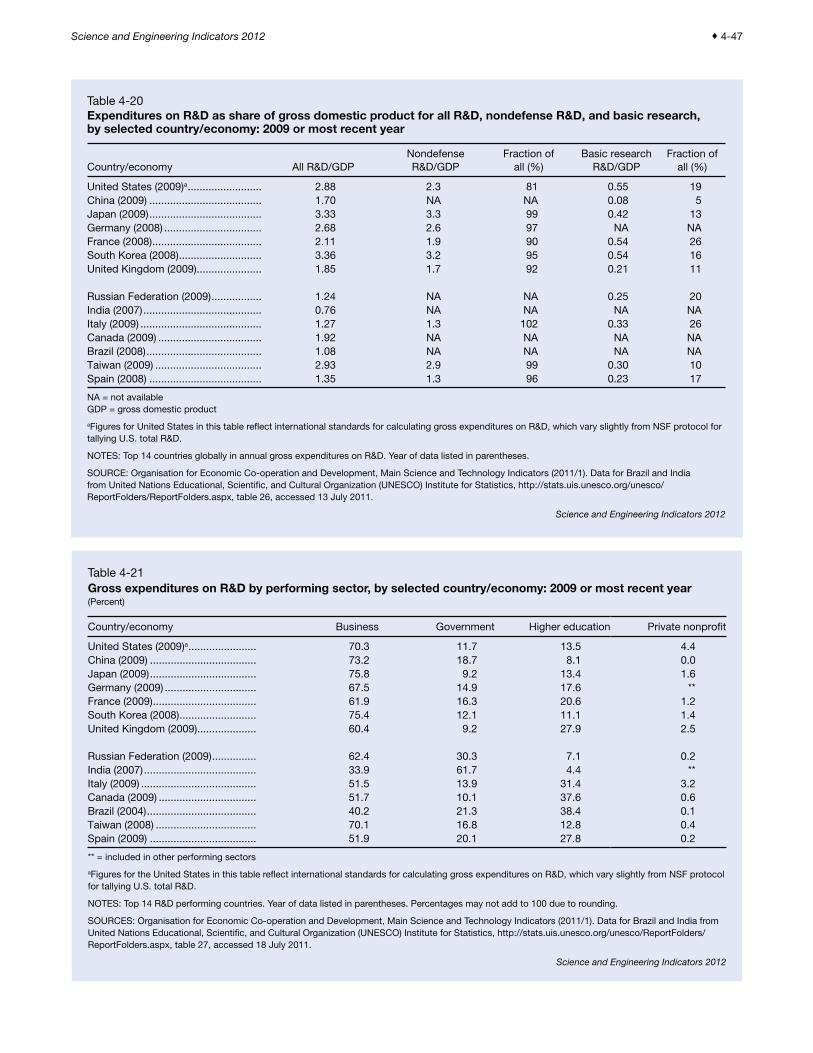
Science and Engineering Indicators 2012 � 4-47
Table 4-20Expenditures on R&D as share of gross domestic product for all R&D, nondefense R&D, and basic research, by selected country/economy: 2009 or most recent year
Country/economy All R&D/GDPNondefense R&D/GDP
Fraction of all (%)
Basic research R&D/GDP
Fraction of all (%)
United States (2009)a ......................... 2.88 2.3 81 0.55 19China (2009) ...................................... 1.70 NA NA 0.08 5Japan (2009) ...................................... 3.33 3.3 99 0.42 13Germany (2008) ................................. 2.68 2.6 97 NA NAFrance (2008) ..................................... 2.11 1.9 90 0.54 26South Korea (2008) ............................ 3.36 3.2 95 0.54 16United Kingdom (2009) ...................... 1.85 1.7 92 0.21 11
Russian Federation (2009) ................. 1.24 NA NA 0.25 20India (2007) ........................................ 0.76 NA NA NA NAItaly (2009) ......................................... 1.27 1.3 102 0.33 26Canada (2009) ................................... 1.92 NA NA NA NABrazil (2008) ....................................... 1.08 NA NA NA NATaiwan (2009) .................................... 2.93 2.9 99 0.30 10Spain (2008) ...................................... 1.35 1.3 96 0.23 17
NA = not available GDP = gross domestic product
aFigures for United States in this table reflect international standards for calculating gross expenditures on R&D, which vary slightly from NSF protocol for tallying U.S. total R&D.
NOTES: Top 14 countries globally in annual gross expenditures on R&D. Year of data listed in parentheses.
SOURCE: Organisation for Economic Co-operation and Development, Main Science and Technology Indicators (2011/1). Data for Brazil and India from United Nations Educational, Scientific, and Cultural Organization (UNESCO) Institute for Statistics, http://stats.uis.unesco.org/unesco/ ReportFolders/ReportFolders.aspx, table 26, accessed 13 July 2011.
Science and Engineering Indicators 2012
Table 4-21Gross expenditures on R&D by performing sector, by selected country/economy: 2009 or most recent year(Percent)
Country/economy Business Government Higher education Private nonprofit
United States (2009)a ....................... 70.3 11.7 13.5 4.4China (2009) .................................... 73.2 18.7 8.1 0.0Japan (2009) .................................... 75.8 9.2 13.4 1.6Germany (2009) ............................... 67.5 14.9 17.6 **France (2009) ................................... 61.9 16.3 20.6 1.2South Korea (2008) .......................... 75.4 12.1 11.1 1.4United Kingdom (2009) .................... 60.4 9.2 27.9 2.5
Russian Federation (2009) ............... 62.4 30.3 7.1 0.2India (2007) ...................................... 33.9 61.7 4.4 **Italy (2009) ....................................... 51.5 13.9 31.4 3.2Canada (2009) ................................. 51.7 10.1 37.6 0.6Brazil (2004) ..................................... 40.2 21.3 38.4 0.1Taiwan (2008) .................................. 70.1 16.8 12.8 0.4Spain (2009) .................................... 51.9 20.1 27.8 0.2
** = included in other performing sectors
aFigures for the United States in this table reflect international standards for calculating gross expenditures on R&D, which vary slightly from NSF protocol for tallying U.S. total R&D.
NOTES: Top 14 R&D performing countries. Year of data listed in parentheses. Percentages may not add to 100 due to rounding.
SOURCES: Organisation for Economic Co-operation and Development, Main Science and Technology Indicators (2011/1). Data for Brazil and India from United Nations Educational, Scientific, and Cultural Organization (UNESCO) Institute for Statistics, http://stats.uis.unesco.org/unesco/ReportFolders/ReportFolders.aspx, table 27, accessed 18 July 2011.
Science and Engineering Indicators 2012

4-48 � Chapter 4. Research and Development: National Trends and International Comparisons
fund general advancement of knowledge R&D, do not sepa-rately account for GUF funding (e.g., South Korea), and/or more typically direct R&D funding to project-specific grants or contracts (which are then assigned to the more specific socioeconomic objectives). For a further discussion of this topic, see the sidebar “Government Funding Mechanisms for Academic Research” later in this chapter.
Finally, the education and society objective represents a comparatively small component of nondefense government R&D funding for all seven of the countries. However, it is notably higher in Germany (4%), France (4%), and the United Kingdom (6%), than in the United States (2%) and Japan (1%). South Korea is in between at 3%.
Business R&D Focus Business R&D varies substantially among countries in
terms of both industry concentration and sources of fund-ing. Because businesses account for the largest share of to-tal R&D performance in the United States and most OECD countries, differences in business structure can help explain international differences in more aggregated statistics such as R&D/GDP. For example, countries with higher concen-trations of R&D-intensive industries (such as communica-tion, television, and radio equipment manufacturing) are likely to also have higher R&D/GDP ratios than countries whose business structures are weighted more heavily toward less R&D-intensive industries.
Using internationally comparable data, no one indus-try accounted for more than 19% of total business R&D in the United States in 200840 (figure 4-17 and appendix table 4-46), based on OECD’s Analytical Business Enterprise R&D-Statistical Analysis Database (ANBERD-STAN) (OECD 2011a). This is largely a result of the size of busi-ness R&D expenditures in the United States, which makes it difficult for any one sector to dominate. However, the di-versity of R&D investment by industry in the United States is also an indicator of how the nation’s accumulated stock of knowledge and well-developed S&T infrastructure have made it an attractive location for R&D performance in a broad range of industries.
Compared with the United States, smaller economies shown in figure 4-17 display much higher concentration in particular industries. For example, in South Korea, one of the world’s top producers of communication, TV, and radio equipment industry, which includes semiconductors, this in-dustry accounted for 46% of the country’s business R&D.41
The spread of global production networks and value chains is also reflected in these indicators. Automotive man-ufacturers rank among the largest R&D-performing com-panies in the world (see sidebar, “Global R&D Expenses of Public Corporations”). The automotive industry has also highly distributed production and technical sites globally. Thus, countries that are home to major automotive MNCs and/or serve as host countries for MNCs affiliates, their
Table 4-22Gross expenditures on R&D by funding source, by selected country/economy: 2009 or most recent year(Percent)
Country/economy Business Government Other domestic From abroad
United States (2009)a ...................................... 59.7 31.3 7.2 1.9China (2009) ................................................... 71.7 23.4 NA 1.3Japan (2009) ................................................... 75.3 17.7 6.6 0.4Germany (2008) .............................................. 67.3 28.4 0.3 4.0France (2008) .................................................. 50.7 38.9 2.3 8.0South Korea (2008) ......................................... 72.9 25.4 1.4 0.3United Kingdom (2009) ................................... 44.5 32.6 6.3 16.6
Russian Federation (2009) .............................. 26.6 66.5 0.5 6.5India (2007) ..................................................... 33.9 66.1 ** NAItaly (2008) ...................................................... 45.2 42.9 4.1 7.8Canada (2009) ................................................ 47.6 33.4 12.1 6.9Brazil (2008) .................................................... 43.9 54.0 2.2 NATaiwan (2009) ................................................. 69.7 28.9 1.3 *Spain (2008) ................................................... 45.0 45.6 3.8 5.7
NA = not available; * = <0.05%.; ** = included in other funding sectors
aFigures for the United States in this table reflect international standards for calculating gross expenditures on R&D, which vary slightly from NSF protocol for tallying U.S. total R&D. Figures for funding from abroad based primarily on funding for business R&D.
NOTES: Top 14 R&D performing countries. Year of data listed in parentheses. Percentages may not add to 100 due to rounding. For the United States, data on R&D funding from abroad are not separately identified and instead are included in sector totals. In most other countries, funding from abroad is a distinct and separate category.
SOURCES: Organisation for Economic Co-operation and Development, Main Science and Technology Indicators (2011/1). Data for Brazil and India from United Nations Educational, Scientific, and Cultural Organization (UNESCO) Institute for Statistics, http://stats.uis.unesco.org/unesco/ReportFolders/ReportFolders.aspx, table 28, accessed 18 July 2011.
Science and Engineering Indicators 2012

Science and Engineering Indicators 2012 � 4-49
Table 4-23Government R&D support by major socioeconomic objectives, by selected region/country: 1981–2009
Percent of nondefense
Region/country and year
GBAORD (current US$ millions, PPP) Defense Nondefense
Economic development
programs
Health and
environment
Education and
societyCivil
space Non-oriented
research
General university
funds (GUF)
United States1981 ...................... 33,735.0 54.6 45.4 36.1 31.2 3.6 20.3 8.7 na1990 ...................... 63,781.0 62.6 37.4 22.2 40.2 3.4 24.2 10.1 na2000 ...................... 83,612.5 51.6 48.4 13.4 49.9 1.8 20.9 13.8 na2009 ...................... 164,292.0 51.6 48.4 13.3 55.9 1.5 11.4 17.8 na
EU1981 ...................... na na na na na na na na na1990 ...................... na na na na na na na na na2000 ...................... 73,559.9 13.1 86.9 22.7 11.6 3.4 6.1 15.7 34.92008 ...................... 110,238.5 9.6 90.4 23.5 14.8 5.9 4.9 17.3 33.8
Germany1981 ...................... 8,572.5 8.9 91.1 34.9 9.6 4.5 4.5 46.5 0.01990 ...................... 13,269.1 13.5 86.5 25.9 10.8 2.9 6.8 15.2 37.62000 ...................... 16,806.2 7.8 92.2 21.6 9.4 3.9 5.1 17.5 42.42009 ...................... 25,857.8 5.7 94.3 23.0 10.3 4.1 5.4 18.2 39.6
France1981 ...................... 8,531.3 38.4 61.6 37.9 13.3 2.0 6.7 39.1 0.01990 ...................... 13,228.6 40.0 60.0 32.8 9.3 0.8 13.0 24.6 18.92000 ...................... 14,738.0 21.4 78.6 17.7 9.7 1.1 13.2 27.4 28.52008 ...................... 16,171.9 28.3 71.7 24.3 15.0 3.6 12.5 6.4 39.0
United Kingdom1981 ...................... 6,731.2 46.3 53.7 38.5 13.1 1.5 3.8 10.6 29.61990 ...................... 8,113.8 43,5 56.5 31.9 18.1 4.0 5.5 10.3 29.82000 ...................... 10,357.6 36.2 63.8 12.1 28.3 6.4 3.5 18.8 30.42009 ...................... 15,146.3 18.3 81.7 9.3 28.8 5.7 2.3 23.8 30.1
Japan1981 ...................... NA NA NA NA NA NA NA NA NA1990 ...................... 10,142.0 5.4 94.6 33.9 4.5 1.1 6.9 8.4 45.12000 ...................... 21,223.0 4.1 95.9 33.4 6.6 1.0 5.8 14.6 37.02009 ...................... 31,072.5 3.7 96.3 30.5 7.2 1.0 7.5 18.3 35.5
China1981 ...................... NA NA NA NA NA NA NA NA NA1990 ...................... NA NA NA NA NA NA NA NA NA2000 ...................... NA NA NA NA NA NA NA NA NA2009 ...................... NA NA NA NA NA NA NA NA NA
South Korea1981 ...................... NA NA NA NA NA NA NA NA NA1990 ...................... NA NA NA NA NA NA NA NA NA2000 ...................... 5,024.7 20.5 79.5 53.4 14.8 3.8 3.1 24.9 **2009 ...................... 13,209.6 16.7 83.3 52.0 18.6 2.8 3.7 22.8 **
** = included in other categories; na = not applicable; NA = not available
EU = European Union; GBAORD = government budget appropriations or outlays for R&D; PPP = purchasing power parity
NOTES: Foreign currencies converted to dollars through purchasing power parities. Most recent data available for France and the EU are 2008. EU data for all years based on current 27 member countries. GBAORD data are not yet available for China. The socioeconomic objective categories are aggregates of the 14 categories identified by Eurostat’s 2007 Nomenclature for the Analysis and Comparison of Scientific Programs and Budgets (NABS).
SOURCES: National Science Foundation, National Center for Science and Engineering Statistics, special tabulations (August 2010) of federal R&D budget authority by spending category; Organisation for Economic Co-operation and Development, Main Science and Technology Indicators (2011/1). See appendix table 4-45.
Science and Engineering Indicators 2012
Percent of GBAORD

4-50 � Chapter 4. Research and Development: National Trends and International Comparisons
Figure 4-17Share of industrial R&D, by industry sector and selected country: 2007–10
Science and Engineering Indicators 2012
Pharmaceuticals Motor vehiclesCommunication, TV,and radio equipment
All services R&D services Computer and related services
Percent
NOTES: Source data for U.S. business R&D in this figure are preliminary (NSF 2010a); final U.S. statistics were used elsewhere in chapter 4. Countries listed in descending order by amount of total business R&D. Data years are in parentheses.
SOURCES: Organisation for Economic Co-operation and Development, Analytical Business Enterprise R&D (ANBERD)-Statistical Analysis Database (STAN)-R&D Expenditure in Industry, http://www.oecd.org/document/17/0,3746,en_2649_34451_1822033_1_1_1_1,00.html, accessed 27 July 2011; National Science Foundation, National Center for Science and Engineering Statistics and U.S. Census Bureau, Business R&D and Innovation Survey (2008).
Slovak Republic (2009)
Slovenia (2008)
Greece (2007)
Hungary (2008)
Portugal (2008)
Czech Republic (2009)
Norway (2008)
Mexico (2007)
Turkey (2008)
Belgium (2007)
Austria (2007)
Australia (2010)
Italy (2010)
United Kingdom (2008)
France (2007)
South Korea (2008)
Germany (2008)
Japan (2009)
United States (2008)
0 10 20 30 40 50 60 0 10 20 30 40 50 600 10 20 30 40 50 60

Science and Engineering Indicators 2012 � 4-51
Most firms that make significant investments in R&D track their R&D expenses separately in their ac-counting records and financial statements. The annual reports of public corporations often include data on these R&D expenses. Research organizations and consulting companies interested in tracking and ranking businesses compile R&D expenditures and related operations and performance data. According to one such ranking, the 20 public corporations with the largest reported world-wide R&D expenditures spent $129 billion on R&D in 2009 (Booz & Company 2010). The six companies with the largest reported R&D expenses—Roche Holding, Microsoft, Nokia, Toyota, Pfizer, and Novartis—each spent between $7.4 billion and $9.1 billion (table 4-B).
Eight companies in the computing and electronic sector spent a total of $50.4 billion (39% of the total for the top 20). Seven companies in the health sector spent a total of $49.5 billion (38% of the total). The remaining five com-panies on the list are automobile manufacturers and they reported combined spending of $29.1 billion on R&D (23% of the total). The top 20 companies are headquar-tered in 8 countries, with 9 headquartered in the United States. In addition, most companies in this list have pro-duction, distribution, and/or research and technical fa-cilities in multiple countries. (For related industry-level information, see “R&D by Multinational Companies” in this chapter and chapter 6.)
Global R&D Expenses of Public Corporations
Table 4-BGlobal R&D spending by top 20 corporations: 2009
R&D rank Company CountryR&D expense
($millions)Sales
($millions)R&D intensity
(%)
1................ Roche Holding AG Switzerland 9,120 45,606 20.1 2................ Microsoft Corp United States 9,010 58,437 15.4 3................ Nokia OYJ Finland 8,240 57,150 14.4 4................ Toyota Motor Corp Japan 7,822 204,363 3.8 5................ Pfizer Inc United States 7,739 50,009 15.5 6................ Novartis AG Switzerland 7,469 44,267 16.9 7................ Johnson & Johnson United States 6,986 61,897 11.3 8................ Sanofi-Aventis SA France 6,391 40,866 15.6 9................ GlaxoSmithKline PLC United Kingdom 6,187 44,422 13.910................ Samsung Electronics Co Ltd South Korea 6,002 109,541 5.511................ General Motors Co United States 6,000 104,589 5.712................ International Business Machines United States 5,820 95,759 6.113................ Intel Corp United States 5,653 35,127 16.114................ Merck & Co Inc United States 5,613 27,428 20.515................ Volkswagen AG Germany 5,359 146,677 3.716................ Siemens AG Germany 5,285 103,866 5.117................ Cisco Systems Inc United States 5,208 36,117 14.418................ Panasonic Corp Japan 5,143 79,994 6.419................ Honda Motor Co Ltd Japan 4,996 92,516 5.420................ Ford Motor Co United States 4,900 118,308 4.1
SOURCE: Booz & Company, The global innovation1000-how the top innovators keep winning (2010). http://www.booz.com/media/file/sb61_10408-R.pdf and http://www.booz.com/media/file/keep_winning_11_2010.pdf. Both accessed 10 August 2011.
Science and Engineering Indicators 2012
part suppliers, or technical contractors, may have relatively larger share of motor vehicles R&D, as shown for Germany, the Czech Republic, and Turkey.
A significant trend in both U.S. and international busi-ness R&D activity has been the growth of R&D in the ser-vice sector. According to national statistics for recent years, the service sector accounted for 30% or more of all business R&D in 8 of the 19 OECD countries shown in figure 4-17 and less than 10% in only one of the countries. In the United States, service industries accounted for 32% of all business R&D in 2008.42
Internationally comparable data for selected non-OECD members are also available from the same database
(ANBERD-STAN) (OECD 2011a). Percentage shares by industry of total business R&D for China, the Russian Federation, Singapore, South Africa, and Taiwan are giv-en in appendix table 4-46. Among these economies, the communication, television, and radio equipment industry, which includes semiconductors, accounted for over 50% of all business R&D in Singapore (2008). Motor vehicle R&D accounted for 5% of business R&D in South Africa (2007); pharmaceutical R&D accounted for 3% in China (2009) and R&D in the computer, office and accounting machines industry accounted for 3% of the business R&D performed in Taiwan (2009). Among OECD countries, the service sector accounted for as little as 8% of business R&D

4-52 � Chapter 4. Research and Development: National Trends and International Comparisons
U.S. universities generally do not maintain data on de-partmental research (i.e., research that is not separately budgeted and accounted). As such, U.S. R&D totals are understated relative to the R&D effort reported for other countries. The national totals for Europe, Canada, and Japan include the research component of general uni-versity fund (GUF) block grants provided by all levels of government to the academic sector. These funds can support departmental R&D programs that are not sepa-rately budgeted. GUF is not equivalent to basic research. The U.S. federal government does not provide research support through a GUF equivalent, preferring instead to support specific, separately budgeted R&D projects. However, some state government funding probably does support departmental research, not separately accounted, at U.S. public universities.
The treatment of GUF is one of the major areas of difficulty in making international R&D comparisons. In many countries, governments support academic research
primarily through large block grants that are used at the discretion of each higher education institution to cover administrative, teaching, and research costs. Only the R&D component of GUF is included in national R&D statistics, but problems arise in identifying the amount of the R&D component and the objective of the research. Moreover, government GUF support is in addition to support provided in the form of earmarked, directed, or project-specific grants and contracts (funds that can be assigned to specific socioeconomic categories).
In several large European countries (France, Germany, Italy, and the United Kingdom), GUF accounts for 50% or more of total government R&D funding to universi-ties. In Canada, GUF accounts for about 38% of govern-ment academic R&D support. Thus, international data on academic R&D reflect not only the relative international funding priorities but also the funding mechanisms and philosophies regarded as the best methods for financing academic research.
Government Funding Mechanisms for Academic Research
Figure 4-18Academic R&D financed by business, for selected countries: 1981–2009Percent
NOTES: Top seven R&D performing countries. Data not available for all countries for all years. Data for Japan for 1996 onward may not be consistent with earlier data due to changes in methodology. Data for China for 2001 and 2002 are estimated by National Science Foundation.
SOURCE: Organisation for Economic Co-operation and Development, Main Science and Technology Indicators (2011/1).
Science and Engineering Indicators 2012
1981 1985 1989 1993 1997 2001 2005 20090
5
10
15
20
25
30
35
40
United States
Germany
France
United Kingdom
Japan
China
South Korea
in South Korea (2008) to as much as 65% in Israel (2010). For the non-OECD economies examined here, the percent-age of business R&D accounted for by the service sectors ranged from 7% in Taiwan (2009) to 86% in the Russian Federation (2009).
Business Support for Academic R&DFor most countries, the government is (and has long
been) the largest source of academic research funding. (See sidebar, “Government Funding Mechanisms for Academic Research.”) Nevertheless, business support for academic R&D has increased over the past 25 years among the OECD countries as a whole. It was around 3% in the early 1980s, nearly 6% in 1990, almost 7% in 2000, and still around 7% in 2007.
In the United States, business support for academic R&D was about 4% in the early 1980s and rose to about 7% later in that decade and through the 1990s, but has dropped to below 6% since 2000. Some commentators note concern about this recent trend of decline, given the significant role that academic basic research plays in providing a founda-tion for technological innovation that is important to the national economy.
The proportion of academic R&D financed by business is more varied among the other top R&D-performing countries (figure 4-18). Among the other top seven R&D-performing countries, the highest figure for business support of academ-ic R&D is currently in China (37%). The figures are also high in Germany (15%) and South Korea (12%), whereas Japan, France, and the United Kingdom occupy the low end, with figures under 5%.

Science and Engineering Indicators 2012 � 4-53
ConclusionGrowth in global R&D has been rapid, averaging 7% an-
nually over the last 10 years, reaching an estimated $1,276 billion (in purchasing power parities) in 2009. The United States is by far the largest R&D performer, accounting for about 31% of the global total, but down from 38% in 1999. Average annual growth in U.S. R&D spending has outpaced U.S. GDP growth over the last several decades. However, in 2009 U.S. R&D spending was somewhat below the 2008 level. The 2009 slowdown primarily reflects a drop in busi-ness R&D in the face of the 2008–09 financial crisis and the economic recession. On the other hand, U.S. R&D spend-ing in other performing sectors continued to rise, notably for federal and academic R&D, in part because of the one-time federal R&D funding increase appropriated in the American Recovery and Reinvestment Act of 2009.
The other major trend has been the rapid expansion of R&D performance in Asia. The region represented 24% of the global R&D total in 1999 but accounted for 32% in 2009, including China (12%) and Japan (11%). The pace of real growth over the past 10 years in China’s overall R&D remains exceptionally high at about 20% annually. The rate of growth in South Korea’s R&D has also been relatively high, averaging nearly 10% annually over the 10-year pe-riod. Growth in Japan has been slower, at an annual average rate of 4.0%.
The R&D/GDP ratio, or R&D intensity, constitutes an-other basis for international comparisons. The U.S. ratio was about 2.9% in 2009 and has fluctuated between 2.6% and 2.8% during the prior 10 years, largely reflecting changes in business R&D spending. In 2009, the United States ranked eighth in R&D intensity—surpassed by Israel, Sweden, Finland, Japan, South Korea, Switzerland, and Taiwan (but all perform far less R&D annually than the U.S.). China’s ratio remains relatively low, at 1.7%, but has more than dou-bled from 0.8% in 1999.
The majority of R&D by U.S. MNCs continues to be per-formed in the United States. Indeed, parent companies of U.S. MNCs performed just over two-thirds of U.S. business R&D. U.S. MNCs performed most of their foreign R&D in Europe, Canada, and Japan. However, from 1997 to 2008 the share of R&D performed by U.S. majority-owned affili-ates in Asia (other than Japan) more than doubled, includ-ing increases in the share performed in China, South Korea, Singapore, and India.
Notes1. America Creating Opportunities to Meaningfully
Promote Excellence in Technology, Education, and Science [COMPETES] Act (Public Law 110-69, January 4, 2007) and America COMPETES Reauthorization Act of 2010 (Public Law 111-358, January 4, 2011).
2. For an annotated compilation of definitions of R&D by U.S. statistical agencies, tax statutes, accounting bodies, and other official sources, see NSF (2006).
3. Adjustments for inflation reported in this chapter are based on the GDP implicit price deflator. GDP deflators are calculated on an economy-wide rather than an R&D-specific basis. As such, they should be interpreted as measures of real resources engaged in R&D rather than in other activities, such as consumption or physical investment. They are not a measure of cost changes in performing R&D. See appendix table 4-1 for GDP deflators used in this chapter.
4. R&D funding by business in this section refers to nonfederal funding for domestic business R&D plus busi-ness funding for U.S. academic R&D and nonprofit R&D performers.
5. Federal support for R&D reported by federal agen-cies in the form of obligations differs from expenditures of federal R&D funds reported by R&D performers. For a dis-cussion of the reasons for, and the magnitude of these dis-crepancies, see sidebar “Tracking R&D: The Gap Between Performer- and Source-Reported Expenditures” later in this chapter.
6. Contemporary discussions often note the extensive feedback loops among basic research, applied research, and development that prevail in the conduct of R&D. On this basis, there is often-heard criticism that this standard trio is simplistic and erroneously implies a linear progression. Even so, an alternative framework has yet to be identified to wide acceptance. Accordingly, the chapter relies for its analysis on the standard trio of categories, which have been longstanding, widely used, and internationally comparable (OECD 2002).
7. The OECD notes that in measuring R&D, the greatest source of error often is the difficulty of locating the cutoff point between experimental development and the related ac-tivities required to realize an innovation (OECD 2002, para-graph 111). Most definitions of R&D set the cutoff at the point when a particular product or process reaches “market readiness.” At this point, the defining characteristics of the product or process are substantially set (at least for manu-facturers if not also for services), and further work is primar-ily aimed at developing markets, engaging in preproduction planning, and streamlining the production or control system.
8. These estimates measure solely the direct impact of R&D investment. Although indirect productivity impacts of R&D are included in BEA’s industry output measures, es-timates of the impact of R&D based on the R&D Satellite Account do not separately identify spillovers, the indirect benefits to firms that did not pay for the R&D. For R&D spillovers in the context of national accounts measures, see Sveikauskas (2007).
9. The sample for the Business R&D and Innovation Survey (BRDIS) was selected to represent all for-profit non-farm companies with five or more domestic employees, pub-licly or privately held, that perform or fund R&D or engage in innovative activities in the United States. For worldwide expense data from this survey, see appendix table 4-13.
10. Recall that BRDIS excludes companies with fewer than five domestic employees.

4-54 � Chapter 4. Research and Development: National Trends and International Comparisons
11. Because federal R&D funding is concentrated among a few companies in a small number of industries than is R&D in general, estimates for federally funded business R&D are often suppressed. Consequently, the percentage of federally funded business R&D for these six industry groups is based on a lower bound estimate.
12. Estimates for computer and electronic product man-ufacturing in this section refer to NAICS 334 except the federally funded R&D component of navigational, mea-suring, electromedical, and control instruments industry (NAICS 3345), which is included in aerospace and defense manufacturing.
13. Specifically, this industry group includes domestic R&D performance for architectural, engineering, and related services (NAICS 5413) and scientific R&D services indus-tries (NAICS 5417).
14. Although companies in the R&D and related-services sector and their R&D activities are classified as nonmanu-facturing, they serve many manufacturing industries. For example, many biotechnology companies in this sector li-cense their technology to companies in the pharmaceutical manufacturing industry. The R&D of a research firm that is a subsidiary of a manufacturing company rather than an in-dependent contractor would be classified as R&D in a manu-facturing industry. Consequently, growth in R&D services may, in part, reflect a more general pattern of industry’s in-creasing reliance on outsourcing and contract R&D.
15. Data are tabulated independent of the industry clas-sification of the company.
16. Funded by others outside the company includes fund-ed by foreign parents.
17. See appendix tables 4-18 through 4-21.18. The BEA estimate for R&D performance by major-
ity-owned foreign affiliates of U.S. MNCs is much lower than the $61.5 billion based on BRDIS 2008. BEA, NSF, and the Census Bureau are researching measures of R&D by foreign affiliates as part of the R&D linking project, which is discussed in sidebar “Linking MNC Data from International Investment and Business R&D Surveys.” This research should lead to improvements in both data sets.
19. Data in this section cover international transactions in RDT services by U.S.-located companies from BEA’s Survey of Transactions in Selected Services and Intangible Assets with Foreign Persons. Separate data for R&D versus “testing” services are not available (further, testing services may have both R&D and non-R&D components). Other fee-based measures on intangibles trade include international licensing and royalty payments and receipts (see chapter 6). RDT services cover activities by companies in any indus-trial classification, not just companies classified in services or in NAICS 5417 (Scientific research and development ser-vices). For further methodological information, see http://www.bea.gov/surveys/iussurv.htm.
20. U.S. RDT exports by foreign MNCs in 2008 were about 16% of their U.S. R&D performance as reported in the section “R&D by Multinational Companies,” whereas
the corresponding ratio for U.S. parents was 4%. Thus a sub-stantial share of foreign-owned R&D in the U.S. is appar-ently devoted to service foreign parents and other members of the foreign MNC. See Moris (2009) for caveats on these cross-survey comparisons.
21. Federal agencies also sponsor FFRDCs; see appendix table 4-33.
22. For information on R&D credits at the state level, see NSB (2008, chapter 4) and Wilson (2009).
23. See Section 731 of H. R. 4853, Public Law 111-312. The statute also renewed the credit retroactively for activities after December 31 2009, given that the credit had expired on the latter date according to the Emergency Economic Stabilization Act of 2008 (H.R.1424, Public Law 110-343, Division C, Title III, Section 301). This credit has now been extended 14 times despite its temporary status since its inception.
24. Based on data from the Internal Revenue Service/Statistics of Income (IRS/SOI). Data are sample-based es-timates and are subject to sampling and nonsampling errors. For statistical methodology, see section 3 in IRS (2010).
25. This percentage is based on company and other non-federal funds for business R&D.
26. Based on IRS/SOI figures B and C in http://www.irs.gov/taxstats/article/0,,id=164402,00.html (accessed 25 February 2011). See also IRS (2008).
27. The alternative incremental tax credit was in place from 1996 to 2008; a simplified alternative credit has been in place since 2006. See IRS (2008) and Guenther (forthcoming).
28. See IRS tax form 6765 at http://www.irs.gov/pub/irs-pdf/f6765.pdf.
29. Science or research parks, another example of public-private collaboration, may facilitate knowledge diffusion, technology development and deployment, and entrepreneur-ship by involving universities, government laboratories, and business startups. Two recent U.S. workshops focused on science parks. A December 2007 NSF workshop was aimed at fostering a better understanding and measurement of sci-ence parks’ activities, including the role of science parks in the national innovation system. Participants identified a need for systematic studies on topics such as the social ben-efits of public investment in science parks, ways in which the university-science park interaction engenders entrepre-neurial activity, and lessons that U.S. science parks can learn from comparative studies with European and Asian parks. For material from this workshop, see http://www.nsf.gov/statistics/workshop/sciencepark07. A subsequent workshop sponsored by the National Academies explored international models and best practices in science parks (NRC 2009).
30. Notably missing among these indicators are techni-cal articles published in professional journals, conference papers, and other kinds of scientific communications. Most federal lab scientists, engineers, and managers view this tra-ditional form of new knowledge dissemination as an essen-tial tech transfer component. Nevertheless, few agencies and

Science and Engineering Indicators 2012 � 4-55
their associated federal labs regularly tabulate and report this information.
31. P.L. 97–219. At the time of writing, SBIR was autho-rized until November 18, 2011 (Public Law 112–36).
32. Small Business Technology Transfer Act of 1992 (Public Law 102-564, Title II).
33. To obtain federal funding under this program, a small company applies for a phase I SBIR grant of up to $100,000 for up to 6 months to assess the scientific and technical fea-sibility of ideas with commercial potential. If the concept shows further potential, the company may receive a phase II grant of up to $750,000 over a period of up to 2 years for further development.
34. SBA’s Federal and State Technology (FAST) part-nership program also provides support associated with SBIR/STTR. The Consolidated Appropriations Act of 2010 (Public Law 111-117) authorized $2 million for FAST. In October 2010, SBA granted $100,000 awards to 20 state and local economic development agencies, business develop-ment centers, and colleges and universities. The program is designed to help socially and economically disadvantaged firms compete in SBIR and STTR. The project and budget periods are for 12 months, starting September 30, 2010. See SBA Press Release No. 10-62, http://www.sba.gov/about-sba-services/7367/11391, accessed 4 March 2011.
35. Public Law 110-69, Section 3012. See NSB (2010) pages 4–57 and appendix table 4-47 of that publication for information and data on the predecessor program, the Advanced Technology Program.
36. See appendix tables 4-43 through 4-46.37. EU real growth over 1999–2009 and the 1999 share
are based on all current 27 EU member countries.38. For related 2008 data, see appendix table 4-44.39. Some analysts argue that the low nondefense
GBAORD share for economic development in the United States reflects the expectation that businesses will finance industrial R&D activities with their own funds. Moreover, government R&D that may be useful to industry is often funded with other purposes in mind, such as defense and space, and is therefore classified under other socioeconomic objectives.
40. Data for the United States included in the Organisation for Economic Co-operation and Development’s Analytical Business Enterprise R&D (ANBERD)-Statistical Analysis Database (STAN) are preliminary (NSF 2010a); final sta-tistics were used for the business R&D analyses earlier in chapter 4.
41. For information on global valued added, trade, and re-lated statistics for high technology industries, see chapter 6.
42. Share in OECD/ANBERD based on preliminary U.S. business R&D data (NSF 2010a); final U.S. statistics were used elsewhere in chapter 4.
GlossaryAffiliate: A company or business enterprise located in
one country but owned or controlled (in terms of 10% or more of voting securities or equivalent) by a parent com-pany in another country; may be either incorporated or unincorporated.
Applied research: The objective of applied research is to gain knowledge or understanding to meet a specific, recog-nized need. In industry, applied research includes investiga-tions to discover new scientific knowledge that has specific commercial objectives with respect to products, processes, or services.
Basic research: The objective of basic research is to gain more comprehensive knowledge or understanding of the subject under study without specific applications in mind. Although basic research may not have specific applications as its goal, it can be directed in fields of present or potential interest. This is often the case with basic research performed by industry or mission-driven federal agencies.
Development: Development is the systematic use of the knowledge or understanding gained from research directed toward the production of useful materials, devices, systems, or methods, including the design and development of proto-types and processes.
Company-funded R&D: R&D paid for with a com-pany’s own funds, no matter the location of R&D activity or who performs or conducts the R&D (the company itself or others outside the funding company). Company-funded R&D is also known as R&D expense for certain tax, ac-counting, and data collection purposes.
EU: Prior to 2004, the European Union (EU) consisted of 15 member nations: Austria, Belgium, Denmark, Finland, France, Germany, Greece, Ireland, Italy, Luxembourg, Netherlands, Portugal, Spain, Sweden, and the United Kingdom. In 2004, the membership expanded to include an additional 10 countries: Cyprus, Czech Republic, Estonia, Hungary, Latvia, Lithuania, Malta, Poland, Slovakia, and Slovenia. Bulgaria and Romania were added in January 2007, bringing the total of current EU member countries to 27.
Federally funded research and development center (FFRDC): R&D-performing organizations that are exclu-sively or substantially financed by the federal government either to meet a particular R&D objective or, in some in-stances, to provide major facilities at universities for re-search and associated training purposes. Each FFRDC is administered by an industrial firm, a university, or a non-profit institution.
Foreign affiliate: Company located outside the United States but owned by a U.S. parent company.
Foreign direct investment (FDI): Ownership or control of 10% or more of the voting securities (or equivalent) of a business located outside the home country.
General university fund (GUF): Block grants provided by all levels of government in Europe, Canada, and Japan to the academic sector that can be used to support depart-mental R&D programs that are not separately budgeted; the

4-56 � Chapter 4. Research and Development: National Trends and International Comparisons
U.S. federal government does not provide research support through a GUF equivalent.
Gross domestic product (GDP): The market value of goods and services produced within a country. It is one of the main measures in the NIPAs.
Innovation: The introduction of new or significantly improved products (goods or services), processes, organiza-tional methods, and marketing methods in internal business practices or in the open marketplace (OECD/Eurostat 2005).
Majority-owned affiliate: Company owned or con-trolled, by more than 50% of the voting securities (or equiv-alent), by its parent company.
Multinational company (MNC): A parent company and its foreign affiliates.
National income and product accounts (NIPAs): The economic accounts of a country that display the value and composition of national output and the distribution of in-comes generated in this production.
Organisation for Economic Co-operation and Development (OECD): An international organization of 34 countries, headquartered in Paris, France. The member coun-tries are Australia, Austria, Belgium, Canada, Chile, Czech Republic, Denmark, Estonia, Finland, France, Germany, Greece, Hungary, Iceland, Ireland, Israel, Italy, Japan, Korea, Luxembourg, Mexico, Netherlands, New Zealand, Norway, Poland, Portugal, Slovak Republic, Slovenia, Spain, Sweden, Switzerland, Turkey, United Kingdom, and United States. Among its many activities, the OECD com-piles social, economic, and science and technology statistics for all member and selected nonmember countries.
Public-private partnership: Collaboration between private or commercial organizations and at least one pub-lic or nonprofit organization such as a university, research institute, or government laboratory. Examples include coop-erative research and development agreements (CRADAs), industry-university alliances, and science parks.
R&D: Research and development, also called research and experimental development; comprises creative work undertaken on a systematic basis to increase the stock of knowledge—including knowledge of man, culture, and so-ciety—and its use to devise new applications (OECD 2002).
R&D intensity: A measure of R&D expenditures rela-tive to size, production, financial, or other characteristic for a given R&D-performing unit (e.g., country, sector, com-pany). Examples include R&D to GDP ratio, company-funded R&D to net sales ratio, and R&D expenditures per employee.
Technology transfer: The process by which technology or knowledge developed in one place or for one purpose is applied and exploited in another place for some other pur-pose. In the federal setting, technology transfer is the pro-cess by which existing knowledge, facilities, or capabilities developed under federal research and development funding are utilized to fulfill public and private needs.
U.S. affiliate: Company located in the United States but owned by a foreign parent.
ReferencesAizcorbe AM, Moylan CE, Robbins CA. 2009. Toward bet-
ter measurement of innovation and intangibles. Survey of Current Business 89 (January):10–23. http://www.bea.gov/national/newinnovation.htm. Accessed 1 November 2011.
Athukorala P, Kohpaiboon A. 2010. Globalization of R&D by US-based multinational enterprises. Research Policy 39:1335–47.
Booz & Company. 2010. The Global Innovation 1000—How the Top Innovators Keep Winning. http://www.booz.com/media/file/sb61_10408-R.pdf and http://www.booz.com/media/file/keep_winning_11_2010.pdf. Both accessed 10 August 2011.
Breznitz D. 2009. National institutions and the globalized political economy of technological change: An introduc-tion. Review of Policy Research 26(1, 2):1–11.
Corrado CA, Hulten CR, Sichel DE. 2006. Intangible capital and economic growth. Finance and Economics Discussion Series. Washington, DC: Federal Reserve Board.
Crow M, Bozeman B. 1998. Limited by Design—R&D Laboratories in the U.S. National Innovation System. New York: Columbia University Press.
Dougherty S, Inklarr R, McGuckin R, Van Ark B. 2007. International comparisons of R&D expenditures: Does an R&D PPP make a difference? National Bureau of Economic Research Working Paper 12829. Cambridge, MA.
Dunning JH, Lundan SM. 2009. The internationalization of corporate R&D: A review of the evidence and some policy implications for home countries. Review of Policy Research 26(1, 2):13–33.
European Commission (EU), International Monetary Fund, Organisation for Economic Co-operation and Development, United Nations, and World Bank. 2009. System of National Accounts 2008. New York.
Federal Laboratory Consortium (FLC) for Technology Transfer. 2006. FLC Technology Transfer Desk Reference. Cherry Hill, NJ. http://www.federallabs.org/pdf/T2_Desk_Reference.pdf. Accessed 1 November 2011.
Filippetti A, Archibugi D. 2011. Innovation in times of cri-sis: National systems of innovation, structure, and de-mand. Research Policy 40(2):179–92.
General Accounting Office (GAO). 2001. Research and Development: Reported Gap Between Data From Federal Agencies and Their R&D Performers: Results From Noncomparable Data. GAO-01-512R. Washington, DC.
Gilbert BA, Audretsch DB, McDougall PP. 2004. The emergence of entrepreneurship policy. Small Business Economics 22(3, 4):313–23.
Guenther G. Forthcoming. Research and Experimentation Tax Credit. Washington, DC: Congressional Research Service.
Hasan I, Tucci CL. 2010. The innovation–economic growth nexus: Global evidence. Research Policy 39(10):1264–76.
Hemphill TA. 2009. The U.S. research & experimentation tax credit: The case for an effective R&D investment

Science and Engineering Indicators 2012 � 4-57
policy incentive. Innovation: Management, Policy & Practice 11(3):341–56.
Internal Revenue Service (IRS). 2008. The Credit for Increasing Research Activities: Statistics from Tax Years 2004-2005. SOI Bulletin. Summer:182–92. http://www.irs.gov/pub/irs-soi/04-05crreac.pdf.
Internal Revenue Service (IRS). 2010. 2007 Statistics of Income—Corporation Income Tax Returns. Washington, DC. http://www.irs.gov/pub/irs-soi/07coccr.pdf. Accessed 25 February 2011.
Jorgenson DW, Ho MS, Stiroh KJ. 2005b. Productivity, Volume 3: Information Technology and the American Growth Resurgence. Cambridge, MA: The MIT Press.
Jorgenson DW, Landefeld JS, Nordhaus WD, editors. 2006. A New Architecture for the U.S. National Accounts. Chicago: University of Chicago Press.
Jorgenson DW. 2007. Information technology and the G7 economies. In: Berndt ER, Hulten CR, editors. Hard-to-Measure Goods and Services: Essays in Honor of Zvi Griliches. Chicago: University of Chicago Press.
Lane J, Bertuzzi S. 2011. Measuring the results of science investments. Science 331(6018):678–80.
Lee J, Schmidt AG. 2010. Research and development satel-lite account update: Estimates for 1959–2007. Survey of Current Business 90(12):16–55.
Link AN, Scott JT. 2010. Government as entrepreneur: Evaluating the commercialization success of SBIR proj-ects. Research Policy 39:589–601.
Moris F. 2009. R&D exports and imports: New data and methodological issues. In: Reinsdorf M, Slaughter M, editors. International Flows of Invisibles: Trade in Services and Intangibles in the Era of Globalization. Studies in Income and Wealth, vol. 69, National Bureau of Economic Research. Chicago: University of Chicago Press.
National Research Council (NRC). 2000. Improving Access to and Confidentiality of Research Data. Mackie C, Bradburn N, editors. Washington, DC: National Academies Press.
National Research Council (NRC). 2003. Government-Industry Partnerships for the Development of New Technologies. Washington, DC: National Academies Press.
National Research Council (NRC). 2005. Measuring Research and Development Expenditures in the U.S. Economy. Brown LD, Plewes TJ, Gerstein MA, editors. Washington, DC: National Academies Press.
National Research Council (NRC). 2007. Understanding Business Dynamics: An Integrated Data System for America’s Future. Haltiwanger J, Lynch LM, Mackie C, editors. Washington, DC: National Academies Press.
National Research Council (NRC). 2008. An Assessment of the SBIR Program. Wessner CW, editor. Washington, DC: National Academies Press.
National Research Council (NRC). 2009. Understanding Research, Science and Technology Parks: Global Best
Practices. Wessner CW, editor. Washington, DC: National Academies Press. http://www.nap.edu/catalog.php?record_id=12546.
National Science Board (NSB). 2008. Research and develop-ment: National trends and international linkages. Science and Engineering Indicators 2008. NSB 08–01. Arlington, VA: National Science Foundation. http://www.nsf.gov/statistics/seind08/. Accessed 1 November 2011.
National Science Board (NSB). 2010. Research and develop-ment: National trends and international linkages. Science and Engineering Indicators 2010. NSB 10-01. Arlington, VA: National Science Foundation. http://www.nsf.gov/statistics/seind10/
National Science Foundation (NSF). 2006. Definitions of research and development: An annotated compilation of official sources. Arlington, VA. http://www.nsf.gov/statistics/randdef/.
National Science Foundation (NSF). 2008. NSF announc-es new U.S. business R&D and innovation survey. NSF InfoBrief 09-304. Arlington, VA. http://www.nsf.gov/statistics/infbrief/nsf09304. Accessed 10 March 2011.
National Science Foundation (NSF). 2010a. U.S. businesses report 2008 worldwide R&D expense of $330 billion: Findings from new NSF survey. NSF InfoBrief 10-322. Arlington, VA. http://www.nsf.gov/statistics/infbrief/nsf10322.
National Science Foundation (NSF). 2010b. New employ-ment statistics from the 2008 business R&D and innova-tion survey. NSF InfoBrief 10-326. Arlington, VA. http://www.nsf.gov/statistics/infbrief/nsf10326/.
National Science Foundation (NSF). 2010c. NSF releases new statistics on business innovation. NSF InfoBrief 11-300. Arlington, VA. http://www.nsf.gov/statistics/infbrief/nsf11300. Accessed 10 March 2011.
National Science Foundation (NSF). 2010d. Federal Funds for Research and Development: Fiscal Years 2007–09. Detailed statistical tables. NSF 10-305. Arlington, VA. http://www.nsf.gov/statistics/nsf10305/.
Organisation for Economic Co-operation and Development (OECD). 2002. Proposed Standard Practice for Surveys on Research and Experimental Development (Frascati Manual). Paris.
Organisation for Economic Co-operation and Development (OECD). 2003. Tax incentives for research and develop-ment: Trends and issues. Paris.
Organisation for Economic Co-operation and Development (OECD)/Eurostat. 2005. Oslo Manual. Paris.
Organisation for Economic Co-operation and Development (OECD). 2010a. Handbook on Deriving Capital Measures of Intellectual Property Products. Paris.
Organisation for Economic Co-operation and Development (OECD). 2010b. Handbook on Economic Globalisation Indicators. Paris.
Organisation for Economic Co-operation and Development (OECD). 2010c. Measuring Innovation—A New Perspective. Paris.

4-58 � Chapter 4. Research and Development: National Trends and International Comparisons
Organisation for Economic Co-operation and Development (OECD). 2010d. The OECD Innovation Strategy—Getting a Head Start on Tomorrow. Paris.
Organisation for Economic Co-operation and Development (OECD). 2011a. Analytical Business Enterprise R&D (ANBERD)-Statistical Analysis Database (STAN)-R&D Expenditure in Industry. Paris. http://www.oecd.org/document/17/0,3746,en_2649_34451_1822033_1_1_1_1,00.html. Accessed 27 July 2011.
Organisation for Economic Co-operation and Development (OECD). 2011b. R&D Tax Incentives and Government Forgone Tax Revenue: A Cross-Country Comparison. DSTI/EAS/STP/NESTI(2010)22. Paris.
Saggi K. 2002. Trade, foreign direct investment, and international technology transfer: A survey. World Bank Research Observer 17:191–235.
Small Business Administration (SBA), Office of Advocacy. 2010. The Small Business Economy: A Report to the President. Washington, DC: U.S. Government Printing Office. http://www.sba.gov/sites/default/files/sb_econ2010.pdf. Accessed 28 February 2010.
Stiglitz JE, Sen A, Fitoussi J-P. 2009. Report by the Commission on the Measurement of Economic Performance and Social Progress. Paris. http://www.stiglitz-sen-fitoussi.fr/.
Sveikauskas L. 2007. R&D and Productivity Growth: A Review of the Literature. Washington, DC: Bureau of Labor Statistics. Working Paper 408. http://www.bls.gov/ore/pdf/ec070070.pdf. Accessed 1 November 2011.
United States Department of the Treasury, Office of Tax Policy. 2011. Investing in U.S. Competitiveness: The Benefits of Enhancing the Research and Experimentation (R&E) Tax Credit. Washington, DC.
Van Ark B, Hulten C. 2007. Innovation, intangibles, and economic growth: towards a comprehensive accounting of the knowledge economy. Paper prepared for “Productivity and Innovation” Statistics Sweden Conference.
Ward M. 1985. Purchasing Power Parities and Real Expenditures in the OECD. Paris: OECD.
Wilson D. 2009. Beggar thy neighbor? The in-state, out-of-state, and aggregate effects of R&D tax credits. Review of Economics and Statistics 91(2):431–36.