res2004 119 e - uqar
TRANSCRIPT

C S A S
Canadian Science Advisory Secretariat
S C C S
Secrétariat canadien de consultation scientifique
* This series documents the scientific basis for the evaluation of fisheries resources in Canada. As such, it addresses the issues of the day in the time frames required and the documents it contains are not intended as definitive statements on the subjects addressed but rather as progress reports on ongoing investigations.
* La présente série documente les bases scientifiques des évaluations des ressources halieutiques du Canada. Elle traite des problèmes courants selon les échéanciers dictés. Les documents qu’elle contient ne doivent pas être considérés comme des énoncés définitifs sur les sujets traités, mais plutôt comme des rapports d’étape sur les études en cours.
Research documents are produced in the official language in which they are provided to the Secretariat. This document is available on the Internet at:
Les documents de recherche sont publiés dans la langue officielle utilisée dans le manuscrit envoyé au Secrétariat. Ce document est disponible sur l’Internet à:
http://www.dfo-mpo.gc.ca/csas/
ISSN 1499-3848 (Printed / Imprimé) © Her Majesty the Queen in Right of Canada, 2004
© Sa majesté la Reine, Chef du Canada, 2004
Research Document 2004/119
Document de recherche 2004/119
Not to be cited without Permission of the authors *
Ne pas citer sans autorisation des auteurs *
Assessing Ballast Water Exchange Zones on the Scotian Shelf and Gulf of Maine
Évaluation des zones d’échange des eaux de ballast sur le Plateau néo-écossais et dans le golfe du Maine
D. Brickman, B.D. Petrie and P.C. Smith
Fisheries and Oceans Canada Bedford Institute of Oceanography
1 Challenger Drive Dartmouth, NS
B2Y 4A2

i
TABLE OF CONTENTS / TABLE DES MATIÈRES ABSTRACT .............................................................................................................iii RÉSUMÉ................................................................................................................ iv INTRODUCTION..................................................................................................... 1 FISHERIES RESOURCES...................................................................................... 1 GENERAL CIRCULATION IN SS/GOM REGION................................................... 2 SS/GOM DRIFTER DATA....................................................................................... 3
Surface drifting buoys .......................................................................................... 3 Residence and transition times in SS region ....................................................... 4
VESSEL TRAFFIC PATTERNS IN EASTERN CANADA........................................ 4 CIRCULATION MODELLING SYSTEM .................................................................. 5 THE DISPERSION PROBLEM ............................................................................... 6
General results .................................................................................................... 7 ADVICE: SPECIFIC RECOMMENDATIONS .......................................................... 7 SUMMARY.............................................................................................................. 9 REFERENCES...................................................................................................... 11

ii
iii
ABSTRACT This paper assesses the risk of various alternate ballast water exchange zones in the Scotian Shelf (SS) and Gulf of Maine (GoM) region of Maritime Canada. The authors assembled available drifter data to look at drift and dispersion on the shelf. These data were too sparse to formulate useful advice about particular traffic corridors. Therefore, a numerical circulation model of the SS/GoM was used to assess dispersion along various vessel routes on the shelf. Model output formed the basis of the advice on ballast water exchange in Maritime Canada. The preferred option for alternative ballast water exchange would occur off the shelf (beyond the 1000 m isobath). This is based on the existence of a persistent shelfbreak current that acts as a barrier to onshelf transport. Recognizing that ships transiting the north-south coastal route often do not normally travel offshelf, we propose the following: • For ships that can travel beyond the 1000 m isobath without a major course diversion,
we recommend that they do so. Vessels should exchange in waters deeper than 1000 m, west of Sable Island and the Gully and away from the entrance to N.E. Channel. The nominal coordinates of this zone, starting from the most southeast point and proceeding counter-clockwise, are as follows: (-60.0,43.0), (-60.25,43.40), then following the 1000 m isobath to (-62.90,42.75), (-66.0,41.25), then following the 1000 m isobath to (-69.25,39.90) (-68.75,39.38);
• For ships that can not reach the 1000 m isobath without a major diversion: o Traffic transiting to/from the Bay of Fundy should exchange in the Gulf of
Maine, in water deeper than 100 m; o Traffic crossing the Gulf of Maine and using a coastal route on the Scotian
Shelf should exchange in the Gulf of Maine, in water deeper than 100 m; o Considering that safe, complete ballast water exchange requires between
350 and 400 nautical miles, the full length of the alternate ballast water exchange zones may be necessary.

iv
RÉSUMÉ
Ce document porte sur l’évaluation du risque associé à diverses zones d’échange des eaux de ballast dans la région du Plateau néo-écossais et du golfe du Maine des provinces maritimes. Les auteurs ont compilé les données disponibles de bouées dérivantes afin d’examiner la dérive et la dispersion sur le plateau. Ces données étaient trop peu nombreuses pour formuler des avis utiles relatifs à certains couloirs de circulation. Par conséquent, un modèle numérique de circulation sur le Plateau néo-écossais et dans le golfe du Maine a été utilisé pour évaluer la dispersion le long de diverses routes empruntées par les navires sur ce plateau. Les sorties du modèle ont servi de base pour les avis relatifs à l’échange des eaux de ballast dans les provinces maritimes. L’option privilégiée en ce qui a trait aux zones d’échange de remplacement consiste à faire en sorte que les échanges soient effectués au large du plateau (au-delà de l’isobathe de 1 000 m). Cette option est fondée sur la présence d’un courant persistant près du rebord du plateau qui empêche le transport vers le plateau. Reconnaissant que les navires qui transitent par la route côtière nord-sud ne circulent habituellement pas à l’extérieur du plateau, nous proposons ce qui suit : • Les navires qui peuvent circuler au-delà de l’isobathe de 1 000 m sans dévier de leur
route de façon importante devraient le faire. Les navires devraient procéder à l’échange de leurs eaux de ballast dans des eaux de plus de 1 000 m de profondeur, à l’ouest de l’île de Sable et du Goulet et loin de l’entrée du chenal Nord-Est. Les coordonnées nominales de cette zone, à partir du point le plus au sud-est et en allant dans le sens antihoraire, sont comme suit : (-60.0,43.0), (-60.25,43.40), puis en suivant l’isobathe de 1 000 m à (-62.90,42.75), (-66.0,41.25), puis en suivant l’isobathe de 1 000 m à (-69.25,39.90) (-68.75,39.38);
• Les navires qui ne peuvent se rendre à l’isobathe de 1 000 m sans dévier de leur route de façon importante devraient procéder de la façon suivante :
o Le trafic en direction et en provenance de la baie de Fundy devrait effectuer l’échange dans le golfe du Maine, là où la profondeur de l’eau excède 100 m;
o Le trafic traversant le golfe du Maine et empruntant un itinéraire côtier sur le Plateau néo-écossais devrait procéder à l’échange dans le golfe du Maine, là où la profondeur de l’eau excède 100 m;
o Considérant qu’un échange sécuritaire et complet des eaux de ballast s’échelonne sur de 350 à 400 milles marins, toute la zone d’échange de remplacement pourrait être nécessaire pendant la manœuvre.

1
INTRODUCTION Vessel ballast water is used for providing stability, maintaining trim, compensating for weight during load transfers and loss, and reducing stress on hulls. The intake of ballast water at a given location and subsequent release at another location has been identified as a principal mechanism for introducing non-indigenous species (NIS) into aquatic ecosystems worldwide. The Canadian guidelines for ballast water exchange encourage ships to perform mid-ocean exchange (MOE), outside of Canada’s Exclusive Economic Zone (EEZ), in waters deeper than 2000m. The rational for MOE is based on the assumption that coastal species will be efficiently replaced by mid-ocean ones which have a low probability of survival upon release in the adverse temperature and salinity conditions of the coastal environment. However, ballast water exchange efficiency is highly variable, ranging from 40-98% (Carver and Mallet 2004, Wonham et al. 2001, Locke et al. 1993), and species abundance and the number of potentially harmful NIS do not necessarily decrease during this process. Nevertheless, MOE is still considered preferable whenever possible. The authors were assigned the task of assessing the risk of various alternate ballast water exchange zones in the Scotian Shelf (SS) and Gulf of Maine (GoM) region of Maritime Canada. Previous directives focused on the shelfbreak as a possible alternate ballast water exchange zone. However, investigation of principal vessel tracks in eastern Canada (see below) and consideration of the response of industry (Langevin 2003) indicated that offshelf exchange would be impractical in many instances. Therefore, we expanded our mandate to include an analysis of dispersion along principal vessel corridors in order to determine whether there are any particularly desirable exchange zones under typical traffic patterns. We assembled available drifter data to look at drift and dispersion on the shelf. These data were considered too sparse to formulate useful advice about particular traffic corridors. A numerical circulation model of the SS/GoM was used to assess dispersion along various vessel routes on the shelf. Model output formed the basis of our advice on ballast water exchange in Maritime Canada. We start by describing the fisheries resources in eastern Canada that may be adversely affected by ballast water exchange processes. Then we provide an overview of the circulation on the eastern seaboard, including an analysis of available drifter data. Next, information on vessel traffic patterns is presented, from which we derive principal vessel tracks along which to study dispersion. A brief description of the circulation modelling system and some basic output is provided. This is followed by a precise description of the problem from a modelling perspective. The last two sections constitute our advice on alternate ballast water exchange zones in Maritime Canada.
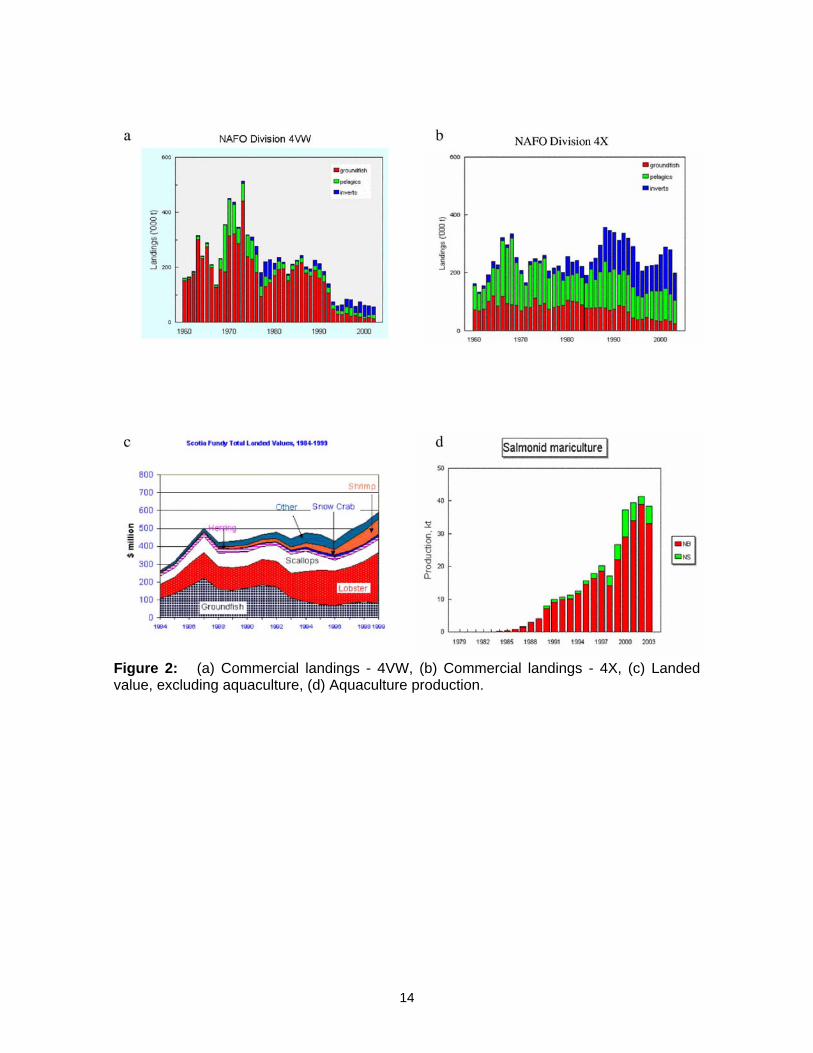
FISHERIES RESOURCES The fisheries in the Scotia-Fundy region (Figure 1, top) include inshore, onshelf (mostly bank), and offshelf/deepsea components. On the eastern SS (NAFO division 4VW) commercial landings plummeted in the 1990’s due to the collapse of the groundfish fishery (predominately cod) (Figure 2a). In the western Scotian Shelf/Bay of Fundy region (division 4X) total landings have been more stable through time, although groundfish have

2
declined there as well (Figure 2b). Both divisions are characterized by absolute and relative increases in invertebrate landings during the past 2 decades. The landed value of the Scotia-Fundy fishery has increased in the last 20 years, despite the groundfish decline, to a value of about 600M$ (Figure 2c). The most significant fisheries change is in aquaculture (mostly salmonids) which has increased from virtually zero in the early 1980’s to ~40kt (Figure 2d), with a value of ~200M$, or about 25% of the combined harvested value. The wholesale value of fish and fish products is estimated at about 1.4B$ (see http://www.mar.dfo-mpo.gc.ca/communications/ maritimes/newmediae/ overview.htm). The conclusion is that fisheries still make a significant contribution to the maritime economy, and that we should be particularly careful regarding the introduction of NIS in shelf waters.
GENERAL CIRCULATION IN SS/GOM REGION The near-surface circulation off the northeast coast of North America (i.e. north of Cape Hatteras) consists of two primary opposing flows (Figure 1, bottom) – a broad, complex southwestward current exists over the continental shelf and slope regions, punctuated by localized, gyre-like flows around isolated banks and other topographic features. This shelf water is generally colder and fresher than the offshore waters. Prominent features include the Nova Scotian Current, which emanates from the Gulf of St. Lawrence and flows along the coast of Nova Scotia. At Halifax, the Current splits, with one branch continuing along the coast and a second moving across the shelf to join the shelf break current near the 200 m isobath on the outer shelf. At the eastern edge of the Northeast Channel, the main branch of the shelfbreak current turns shoreward into the Gulf of Maine following the eastern side of the Channel. On the western side of the Channel, an eastward flow along the northern flank of Georges Bank passes clockwise around the Northeast Peak of the Bank and merges into the shelfbreak current which flows southwestward to the New England Shelf and into the Mid-Atlantic Bight. In the deeper waters off the shelf, the primary current is the Gulf Stream, which carries warm, saline waters from the southwest to the northeast. At the Tail of the Grand Bank (�50W), the Gulf Stream splits into two branches, one of which continues eastward to close the subtropical gyre of the North Atlantic, and another which turns northward to form the North Atlantic Current that crosses the Atlantic at more northerly latitudes. Between the Gulf Stream and the shelf waters lie the moderately warm and saline slope waters, which are separated from the shelf waters by a sharp discontinuity known as the shelf-slope front. The prevailing mean currents in the slope waters are eastward, as in the Gulf Stream, but much weaker. However, the slope waters are populated by strong eddy-like structures and other mesoscale features, such as warm-core rings which are shed by the Gulf Stream. Fratantoni (2001), from analysis of historical drifter data, found a strong offshore gradient of eddy kinetic energy (EKE) in the slope waters, especially in the regions off the Scotian Shelf and the southeast Grand Banks. Increased EKE implies stronger horizontal dispersion and mixing, suggesting that the slope water (i.e. offshelf) should be considered as the preferred area to exchange ballast water. One way to assess the risk of invasion by alien species is by considering the salinity and temperature compatibility of the source versus release regions. The annual mean salinity, in the top 20m, on the Scotian Shelf is 31.4 PSU, varying between 31.8 in March and 30.9 in September. The mean temperature in this layer is 7.4C, with a minimum of 1.2C in March and a maximum of 15.5C in September. While it is beyond the scope of this report

3
to pursue the source/release compatibility problem in any detail, it is useful to note that the range of environmental conditions found on the Shelf are not completely dissimilar to those found on the eastern seaboard of the U.S. and northern Europe.
SS/GOM DRIFTER DATA
Surface drifting buoys There are very few releases of surface drifting buoys on the Scotian Shelf and within the Gulf of Maine. The results from this meager dataset are summarized in Table 1 below in terms of the number of drifters, the length of time they were tracked, their initial separation in terms of their root mean square distance from their centre of mass, their separation rate, an estimate of their equivalent eddy diffusivity and the month the data were collected. Estimates of eddy diffusivity require more than 2 buoys. A sample of the data is shown in Figure 3.
Table 1: Surface Drifter Statistics
# drifters Duration Initial RMS Separation Rate ∆ Variance Month (days) Separation (km) (km/d) /2∆t(m2/s)
Cabot Strait 18 1 7.9 -0.8 - Nov 17 2 7.9 0.6 - Nov 4 4 9.3 9.2 220 Dec 9 1 7.9 11.7 510 Dec 2 2 2.9 1.1 - Dec 7 2 7.2 12.9 1200 Dec
Scotian Shelf 9 22 27.3 2.8 490 Oct-Nov 3 4 9.9 -0.2 - Oct 6 4 6.5 1.0 44 Oct 9 7 67.7 2.2 800 Nov 9 8 27.3 0.8 7.4 Oct 9 3 41.2 7.9 890 Nov
Central Gulf of Maine 2 8 9.9 6.5 - June 2 9 15.8 3.4 - June-July
Western Gulf of Maine 2 6 19.8 0.8 - June-July 2 5 22.8 11.9 - July
We note that the buoys’ tracks generally agreed with the mean circulation expected in the region, i.e. flow out of the Gulf of St. Lawrence onto the Scotian Shelf and southwestward drift on the central Scotian Shelf. The separation rate for drifters ranged from -0.8 km/d (convergence!) to 13 km/d at Cabot Strait, and up to 8 km/d on the Scotian Shelf, and about 5 km/d in the central Gulf of Maine. Equivalent eddy diffusivities derived from the rate of increase of separation variance were erratic: negative to about 1000 m2/s at Cabot Strait and on the Scotian Shelf. This reflects the complexity of the region where flows have significant horizontal shears (e.g. Cabot Strait outflow and the Nova Scotia Current), and

4
that some of the releases were not designed to examine eddy diffusion processes (initial separations too large). On the other hand, they provide some crude in situ estimates of potential spreading of a near surface discharge.
Residence and transition times in SS region Historical surface drifter data from the archives of the Canadian Marine Environmental Data Service (MEDS) were used to estimate the likelihood that a particle released in a region of the SS would reach any other region of the shelf, and the typical timescale over which this transition would occur. Specifically, for the Scotian Shelf, the offshore was divided into five sub-zones, delimited by either an isobath or the historical position of the shelf-slope front (Figure 4). The transition statistics for all sub-zones are summarized in Table 2 (below) and Figure 5. The latter shows that on-offshelf exchange is biased, with ∼50% of buoys released onshelf (zone E) transiting the offshelf zone (A) while only ∼5% of buoys released offshelf travel onshelf. The data show mean residence and transition times for offshelf and onshelf zones (A and E) of between 2–4 weeks, with considerable variability. It is expected that these timescales are sufficient for ballast water contaminants or foreign species to dilute to very low concentrations, both horizontally and vertically within the water column, and therefore to present much less serious risk than they did at the time of the original exchange. Although dilution may decrease the risk, there is still a risk of asexual reproduction, as well as the risk that foreign species will be carried toward coastal areas. Table 2: Residence and transit times estimated from historical drift tracks for sub-zones A-E of the Scotian Shelf. Residence times (average and range, in days) lie on the axis of the matrix; off-axis estimates are for transit times from one sub-zone to another.
# days for
buoy To get to
starting in A B C D E A 16.4 (0.2-291.5) 9.3 (0.2-126) 12.5 (0.5-141) 14.4 (4.8-224.3) 20.2 (5.9-255.3) B 2.1 (0-54) 2.6 (0-61.4) 3 (0-40.9) 5.1 (0.3-56.4) 6.8 (1.3-87.4) C 5.5 (0.8-35.1) 3.8 (0.2-29.4) 3.6 (0.2-29.4) 1.4 (0-28.7) 5 (1.3-46.5) D 7.2 (1.3-35.6) 6 (0.6-31.3) 1.4 (0-28.7) 1.2 (0-31) 1 (0-31) E 28.5 (3.4-131.5) 24 (2.4-131.5) 21.1 (1.1-192.5) 16.3 (0.2-191.7) 19.7 (0.2-191.7)
VESSEL TRAFFIC PATTERNS IN EASTERN CANADA
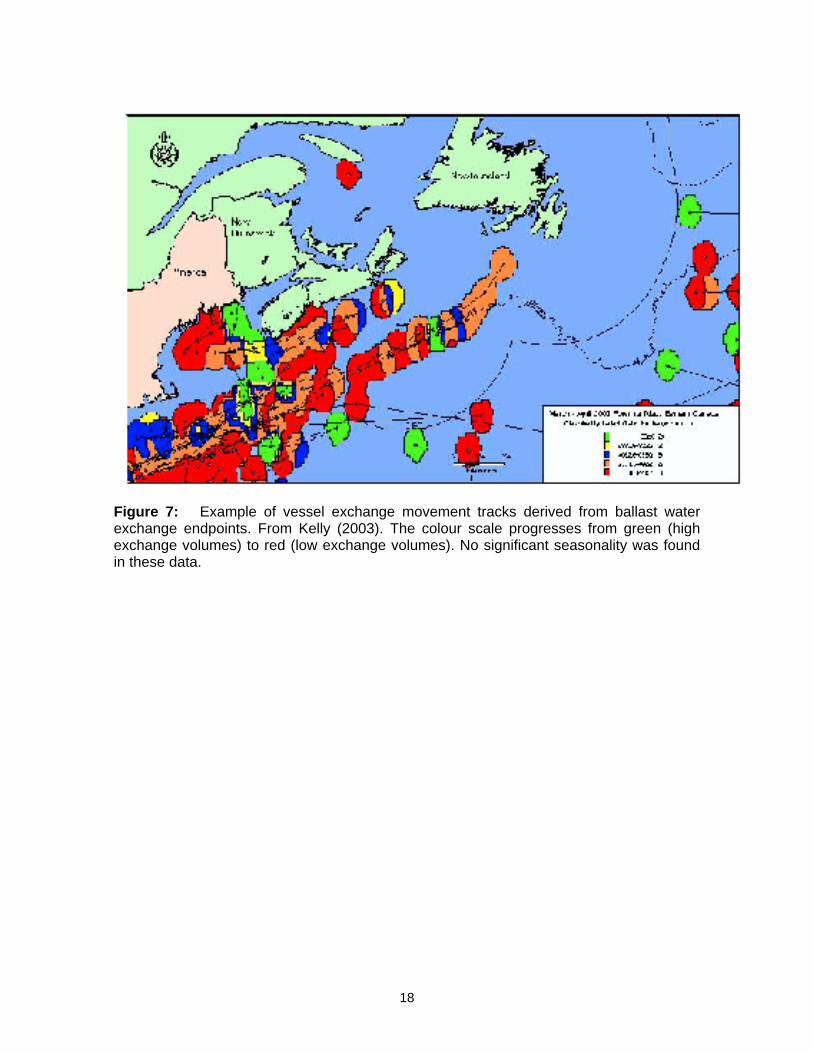
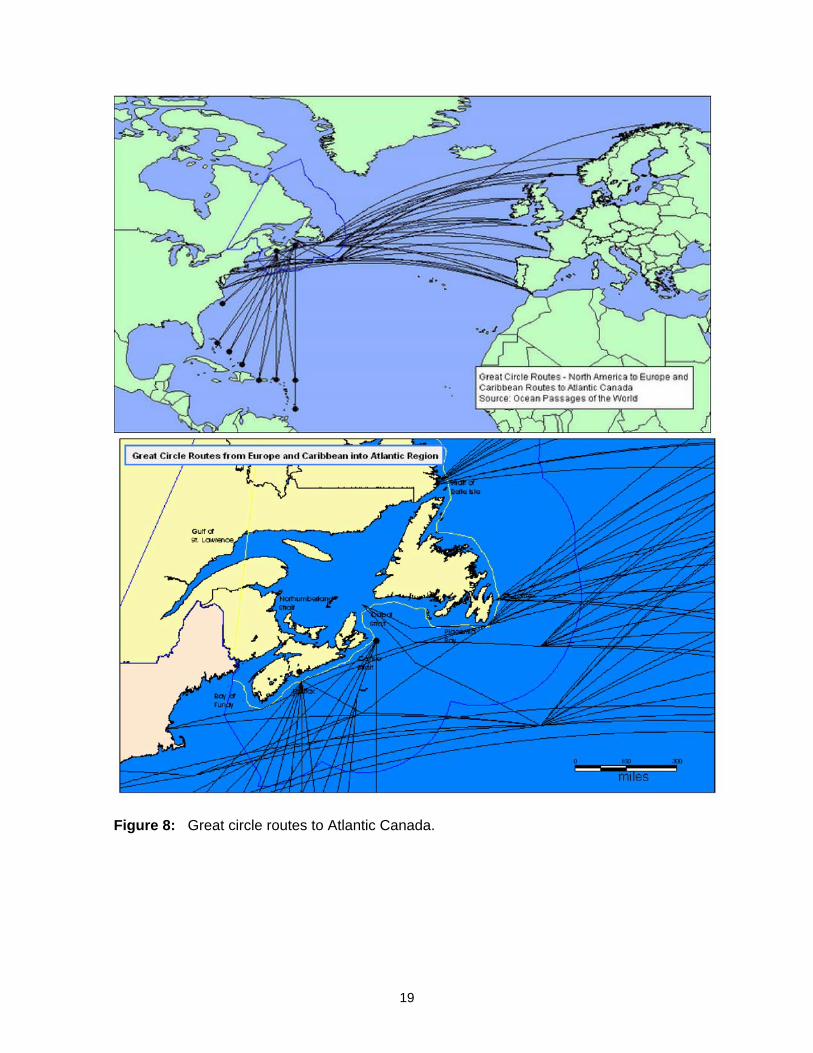
The determination of relevant vessel corridors in this study is based entirely on the analyses of Bernard Kelly as contained in Kelly (2002) and Kelly (2003). In the former, Kelly analyzed vessel tracks based on the Eastern Canada Traffic System (ECAREG) data set, and derived vessel transect density maps for eastern Canada (Figure 6). In the latter, he extracted ballast water exchange endpoints from Ballast Water Reporting Forms to create vessel exchange movement tracks (Figure 7). When these maps are combined with the great circle routes (Figure 8) a generally consistent picture emerges of vessel traffic following great circle routes in the open ocean, converging to great circle route destination points on the eastern seaboard after which they follow rhumblines (lines of constant compass angle). Overlays of vessel density and exchange tracks allow a weighting of the various shelf corridors. For example the high density corridors identified

5
as coming from UK–N.Sea, SP–PO, and N.Africa, which enter Cabot St. (Figure 6), do not correspond with significant onshelf exchange – consistent with possible open ocean exchange for these routes. The Kelly maps were translated into a set of corridors along which to simulate dispersion (Figure 9). Following Kelly (2002) we divide corridors into regions of origin, the exception being the offshelf corridor (brown line on figure). Note that corridors crossing Georges Bank are considered to emanate from a point south of Nantucket Shoals, consistent with a destination point for eastern U.S. traffic. All the corridors in Figure 9 were simulated by the dispersion model. However based on the endpoint exchange analysis not all results will be reported. Note that although we have no problems with the quality of the Kelly analysis, a more complete analysis would be preferable. Unfortunately, time constraints made this impossible.
CIRCULATION MODELLING SYSTEM The model used in this study was a version of CANDIE – a 3D, non-linear, prognostic, z-level model with a free surface (Sheng et al. 1998, Lu et al. 2001). The model uses a Smagorinsky scheme to compute horizontal diffusivity and has a vertical diffusivity that depends on the surface forcing and stratification. Vertical resolution ranges from 4m in the top 20m, 5m from 20-50m, and increases thereafter. The bottom layer is a partial cell that matches the bathymetry. Horizontal resolution was 5km. The model was configured to run on a SS/GoM domain (Figure 10) and simulate the climatological seasonal cycle of circulation. Velocity forcing at the open boundaries was determined from a combination of published and unpublished studies (Saucier et al. 2003, Drinkwater et al. 1979, J. Chassé pers comm., F. Dupont pers comm.) and thermal wind analysis. The result was constant velocity forcing at all in/outflow locations except Laurentian Channel where an analytic seasonal cycle was applied. The surface was forced by restoring boundary conditions on temperature and salinity based on monthly values determined from the BIO database, interpolated in time to provide daily forcing. The above constitute forcing on seasonal timescales. One tidal component (M2) was modelled in order to better simulate mixing, and reproduce the known tidal residual field. The wind stress field from the Ocean Model Intercomparison Project (OMIP) dataset (Röske 2001) was used as the primary forcing for sub-tidal variability on the shelf. This (daily) dataset, based on an analysis of a 15 year ECMWF atmospheric reanalysis run, provides a 360 day cyclical year of forcing representing climatological storminess across the globe (Figures 11 and 12). Daily model output is saved, averaged over the last tidal cycle of the day, providing 360 realizations of the flow. The model is able to reproduce the main climatological features of the circulation on the SS and GoM (Figure 13, and see Hannah et al. 2001) – e.g. the gyres around Western and Georges Bank, the NS current and GoM coastal current – and prognostically simulate transports through the Cabot Strait, Halifax, and Cape Sable Island sections (Figure 14) that are consistent with published data (Smith 1983, Anderson and Smith 1989, Loder at al. 2003). Note that the variability in transport, and its seasonality, follows the energy in the windstress field (Figure 12). Figure 15 shows a 3 day sequence of flows in response to the passage of the storm shown in Figure 11, and illustrates the

6
type of variability possible in the shelf circulation. A more complete description of the modelling system is in preparation by author Brickman.
THE DISPERSION PROBLEM Open ocean ballast water exchange occurs while the vessel is moving, and takes between 18 and 36 hours (Carver and Mallet 2004). At typical vessel speeds this translates into a distance of roughly 300-500 km. We call this exchange distance a corridor “segment”. Ballast water contains a diverse suite of organisms – bacteria, phytoplankton, zooplankton, ichthyoplankton – ranging in size from micrometers to centimeters. These organisms exhibit a range of buoyant behaviours – neutrally and non-neutrally buoyant, buoyancy adjusting, vertically migrating, etc. This suite of possibilities renders the detailed modelling of dispersion an intractable problem. As a compromise, we adopt the simple approach of modelling the exchange of ballast water as the release of a passive tracer into the surface layer of the model ocean. Our goal is to determine whether there are segments along the principal vessel corridors that are best, by some definition, for exchanging ballast water. It is obvious that the definition of best is subject to discussion. We consider that quantitatively the best segment for exchanging ballast water is the one which has the greatest total dispersive volume (m3) after some time (which we take as 15 days). This guarantees that the average concentration of tracer is the lowest, but does not, for example, guarantee that the maximum value is the lowest, nor does this take into account the spatial distribution of tracer which may be unfavourable (e.g. predominantly inshore). Therefore we will use a combination of surface concentration fields and dispersive volumes to formulate our advice. The model provides 360 realizations of the circulation but clearly it is not practical to do this many simulations of dispersion. Therefore we averaged the model output to produce monthly mean fields with which to investigate dispersal. Because the typical exchange time is about 24h, we take the flow as stationary during the exchange process. Noting that the principal vessel corridors are of finite width, we model releases to have a footprint of 45x45 km, i.e. we release tracer in 9x9 model cell “boxes”, and define the standard segment to be a sequence of 8 consecutive boxes equaling (nominally) 360 km in length. (This length, arguably a bit short, is roughly consistent with proposed alternate BW exchange zones (ABWEZ). We note that longer segment choices do not significantly affect our findings.) An example of the rendering of vessel corridors into model tracks made up of discrete boxes and segments is shown in Figure 16. To compute the dispersion (and dispersive volume) along a segment we make use of the linearity of the advection–diffusion (tracer) equation, which allows us to create a total concentration field by adding the contributions from the various boxes. Therefore, for a given month and track, we integrate the release of tracer from the set of boxes constituting the track and store the results. A postprocessing program assembles the boxes into segments and outputs the resultant concentration fields and dispersive volumes.

7
General results Figure 17 shows the complete set of tracks modelled and the subset for which dispersive results will be reported in this document. As indicated above, the latter were chosen based on consideration of the endpoint exchange analysis and vessel track density. To get a feel for the dispersive characteristics on the SS/GoM, Figure 18 shows surface concentration fields (at 15d) for various track segments. From these it can be seen:
• Segments spanning from (roughly) the NE peak of Georges Bank (GB) to the central SS are characterized by drift and diffusion along the shelf break and into the GoM (panel a). These releases have the highest dispersive volumes. We call this region the mixmaster.
• Nonhomogeneous drift and diffusion leads to areas of higher concentration and some dispersion into coastal zones and/or protected areas (e.g. Gully) (panels b-f).
• There is drift from the shelfbreak (>1000m) toward the offshore. This is due to offshore eddies caused by the interaction of internal pressure gradients and the model’s southern boundary, and in precise detail is unlikely to correctly represent the slope water eddy field. However, some on-offshelf exchange certainly does occur, so we consider this to be the model’s version of a real effect for releases that straddle the shelfbreak.
The histogram of possible segment dispersive volumes (Figure 19) is bimodal, due to a combination of generally higher dispersion from the mixmaster region plus a seasonal cycle characterized by lower dispersion in summer. Significantly, the range of volumes is small, about a factor of 2, showing that differences in dispersion in the SS/GoM region are not particularly large.
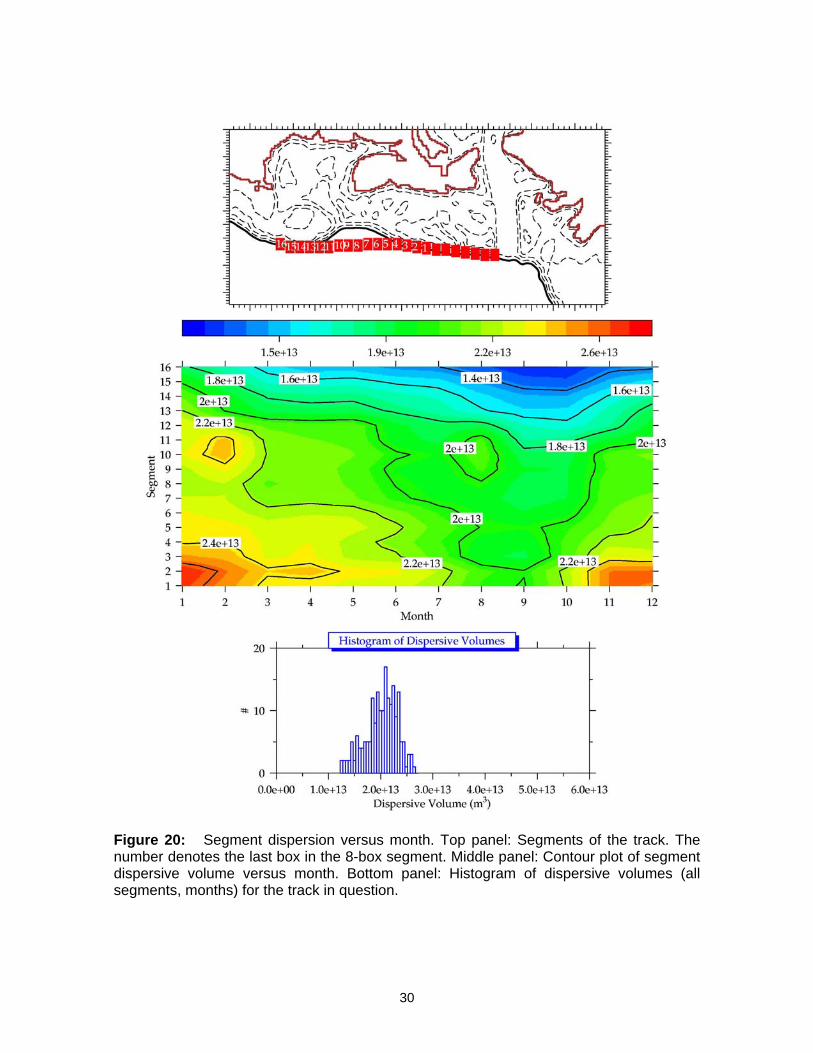
ADVICE: SPECIFIC RECOMMENDATIONS We start this section by going through an example of how we develop advice for a specific vessel corridor. Then we go through the remaining corridors, grouped by region of origin. Shelfbreak Corridor The typical type of output used to develop advice is the 3 panel plot shown in Figure 20, plus the surface concentration field (e.g. Figure 18). In Figure 20 the top panel shows the track under consideration with the segments numbered. Recall that the segment number is shown on the last box of the 8-box segment. The middle panel is a contour plot of the segment dispersive volume versus month. The bottom panel is a histogram of all the dispersive volumes for the particular track. Following lines of constant segment number the contour plot shows the seasonal cycle of dispersion with a minimum in late summer. Following lines of constant month we see that the lower segment numbers (representing more easterly exchange) are more dispersive. The histogram highlights the small spread in dispersive volumes for this track, indicating that it makes little difference where exchange takes place. However, the Gully MPA is located along this track and the surface concentration field (Figure 18(c-h)) shows that segments 6 and higher are safer from the point of view of this MPA.

8
• Advice: For shelfbreak transits, all ballast water exchange should take place west (i.e. downstream) of the Gully, in waters >1000m depth if possible.
U.S. Points of Origin
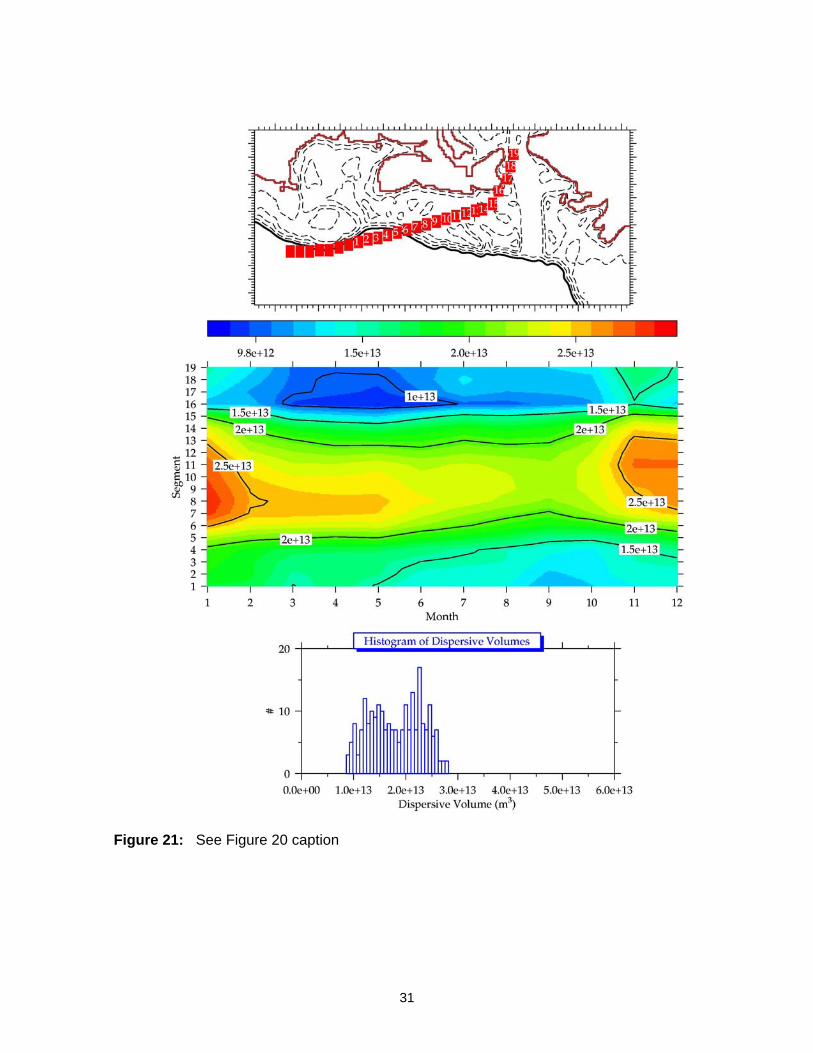
Offshelf Georges Bank to Cabot Strait This corridor has 19 segments (Figure 21) with segments 7–11 (in the mixmaster) being the most dispersive. The histogram is bimodal, showing the difference between segments in the mixmaster versus those more offshore or inshore. The concentration plots (Figure 22) show that later segments (11–18) disperse more toward the Gully and coastal areas, and thus should be avoided. • Advice: If possible complete exchange in waters deeper than 500m (i.e. shelfbreak to
offshelf). Otherwise, exchange in region between central SS and NE Georges Bank.
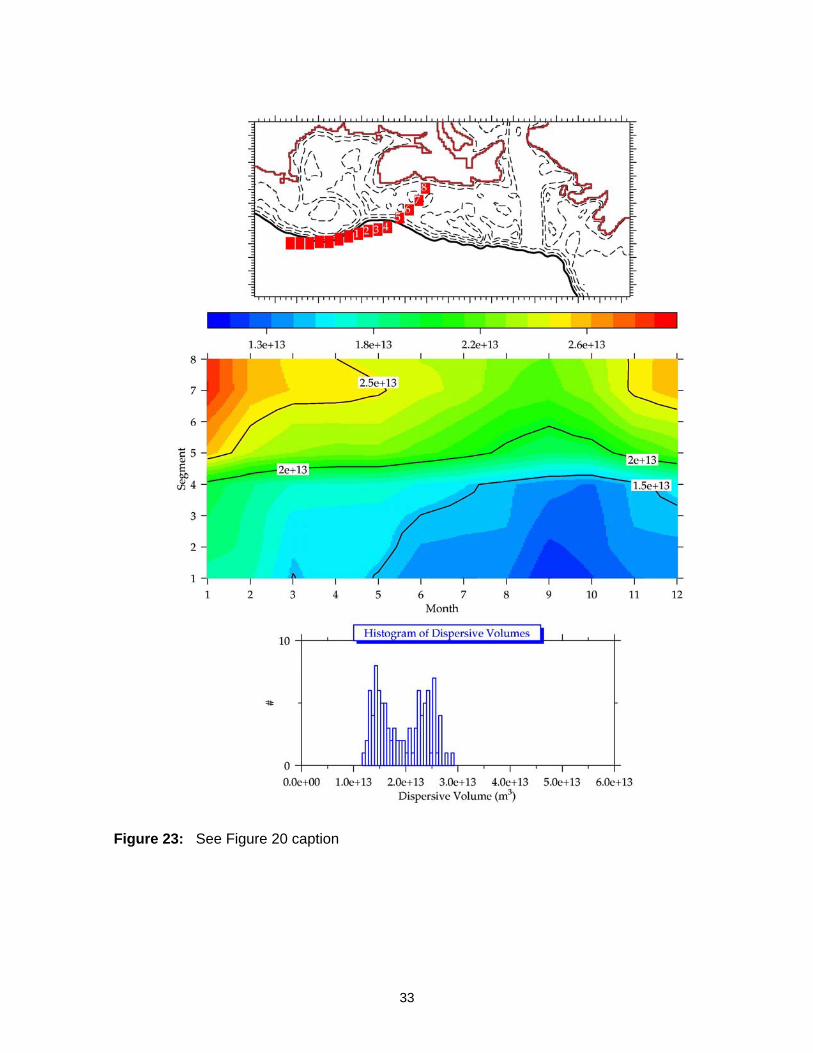
Offshelf Georges Bank to Halifax This corridor has 8 segments (Figure 23) with segments 6–8 being the most dispersive. However, the concentration plots (Figure 24) show that these segments disperse more in coastal areas. • Advice: If possible complete exchange in waters deeper than 500m (i.e. shelfbreak to
offshelf). Otherwise, exchange in region between central SS and SE Georges Bank. Complete exchange in waters deeper than 100m (outside of NS current).
Nantucket Shoals to Halifax This corridor has 7 segments with segment 7 as the most dispersive, followed by 6 and 5. The histogram shows little difference within the corridor (Figure 25). Later segments disperse more in the coastal zone (Figure 26). • Advice: Exchange between the peak of GB and Halifax, as far away from Halifax as
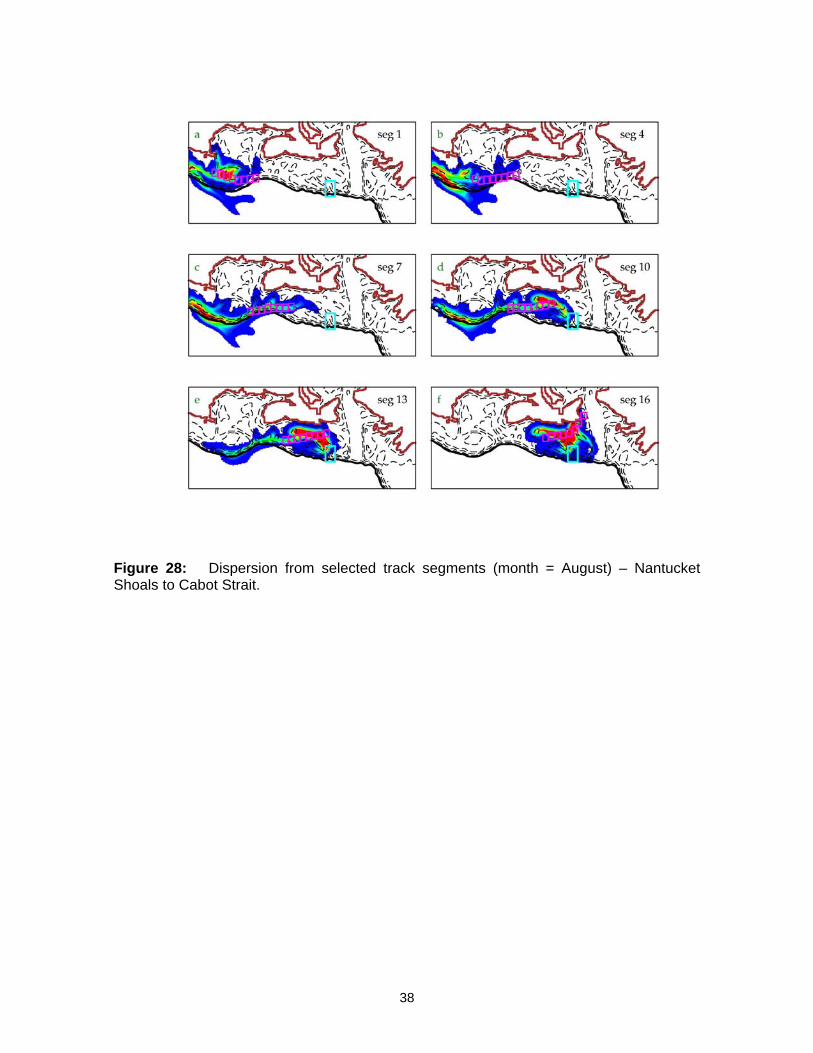
possible. Exchange should occur outside of 100m isobath on SS. Nantucket Shoals to Cabot Strait This corridor has 18 segments, with maximum dispersion on SS (Figure 27, segments 7-11). Later segments disperse more toward the Gully and coastal areas (Figure 28). • Advice: Exchange should occur between GB and western-to-central SS. Exchange
should occur outside of 100m isobath on SS. Nantucket Shoals to St. John This corridor has 3 segments. Segment 1 is most dispersive but the histogram shows very little difference (Figures 29, 30).
• Advice: Exchange should occur between Nantucket shoals and head of bay of Fundy.

9
Boston to Cabot Strait This corridor is meant to provide guidance for the suite of three common routes emanating from GoM origins: Boston, Portsmouth N.H., and Portland Me. This route has 18 segments (Figure 31). Early segments (2-4) tend to show higher dispersion, especially in months 3-10. Histogram shows very little difference along corridor. Concentration plots (Figure 32) show that exchanges occurring within the GoM are least likely to invade coastal regions. • Advice: Exchange in GoM. Releases should be in >100m depth to avoid coastal
current. Along Laurentian Channel to Cabot Strait This corridor is meant to provide guidance for evaluating the risk associated with overseas traffic exchanging on the way into the Gulf of St. Lawrence, as opposed to in the GSL. Recall that the exchange endpoint analysis did not identify this region as one where exchange typically takes place. This route has 6 segments (Figure 33) with the offshelf ones the most highly dispersive, by a factor of about 2. However, the concentration plots (Figure 34) show that exchanges crossing the shelfbreak into Laurentian Channel and/or taking place fully in the Channel disperse toward the Gully MPA and coastal regions of N.S. and Nfld. • Advice: Exchange fully offshelf if possible. Otherwise this could be considered to be a
corridor to avoid.
SUMMARY We have provided an overview of the circulation in the Scotian Shelf and Gulf of Maine region of Eastern Canada, and used a numerical model to evaluate dispersion along the principal vessel corridors in the area. The majority of exchange segments has a significant onshelf component and result in dispersion into coastal zones and/or other sensitive areas like the Gully MPA or bank fisheries. This emphasizes that any exchange on the shelf is undesirable. The circulation is characterized by a shelfbreak current that separates the shelf from the offshelf. The preferred option for alternative ballast water exchange would occur off the shelf (beyond the 1000 m isobath). Simulations by the circulation model showed that the suite of dispersion volumes on the shelf, for all months and all exchange segments, varies by a small amount – a factor of 2 or less. From this point of view there is little difference where ballast water is exchanged. Nevertheless, taking this into account as well as other factors such as the spatial pattern of dispersion with respect to sensitive areas (e.g. Gully, coastal zones), recommendations have been formulated. The numerous vessel corridors in the SS/GoM region make it difficult to recommend one simple alternate ballast water exchange zone. The following picture (next page) provides a condensation of the findings in this document.

10
Preferred Ballast Water Exchange Zones on the SS and GoM
The magenta zone indicates that traffic transiting to/from the Bay of Fundy should exchange in the GoM, in waters deeper than 100m. The yellow zone indicates that traffic crossing the GoM and using a coastal route on the SS should similarly exchange in the GoM, in waters deeper than 100m. The green zone is the preferred exchange zone for on-shelf traffic heading to/from N.S., plus vessels following a shelfbreak path. Exchange should occur in waters deeper than 1000m, west of Sable Island and the Gully, and away from the entrance to N.E. Channel.

11
REFERENCES
Anderson, C. and P.C. Smith. 1989. Oceanographic observations on the Scotian Shelf during CASP. Atmosphere-Ocean, V29(1),130-156.
Carver, C.E. and A.L. Mallet, Mallet Reseasrch Services Ltd. 2004. Investigating potential
ballast water management strategies for ships travelling from Chesapeake Bay to ports in Nova Scotia. Report to: Transport Canada (Atlantic ballast water sub-committee).
Drinkwater, K., B. Petrie and W.H. Sutcliffe, Jr. 1979. Seasonal geostrophic volume
transports along the Scotian Shelf. Estuarine and Coastal Marine Science, V>9, 17-27.
Fratantoni, D. 2001. North Atlantic surface circulation during the 1990’s observed with
satellite-tracked drifters. J. Geophys. Res., 106(C10), 22,067-22,093. Hannah, C.G., J.A. Shore, J.W. Loder and C.E. Naimie. 2001. Seasonal circulation on the
western and central Scotian Shelf. J. Phys. Ocean. V.31, 591-615. Kelly, B. 2002. Marine commercial vessel traffic activity in Canada’s Atlantic region. Report
to: Fisheries and Oceans Canada and Environment Canada. Kelly, B. 2003. GIS mapping of marine vessel ballast water exchange endpoint data in
Atlantic Canada, for the 2002 shipping season. Report to: Marine Safety, Transport Canada, Dartmouth, N.S.
Langevin, Anjuna. 2003. Ballast Water Management: A Marine Industry Perspective
Presentation at 2003.11.18 Transport Canada Workshop, Dartmouth, N.S. Locke, A., D.M. Reid, H.C. van Leeuwen, W.G. Sprules, and J.T. Carlton. 1993. Ballast
water exchange as a means of controlling dispersal of freshwater organisms by ships. Can. J. Fish. Aquat. Sci., V50, 2086-2093.
Loder, J.W., C.G. Hannah, B.D. Petrie, and E.A. Gonzalez. 2003. Hydrographic and
transport variability on the Halifax section. J. Geophys. Res., V108(C11). Lu, Y., D.G. Wright and D. Brickman. 2001. Internal tide generation over topography:
experiments with a free-surface z-level ocean model. J. Atmos. Oceanic Technol., V.18, 1076-1091.
Röske, F. 2001. An atlas of surface fluxes based on the ECMWF re-analysis – a
climatological dataset to force global ocean general circulation models. 31pp. See – http://www.mpimet.mpg.de/Depts/Klima/natcli/omip.html
Saucier, F. J., F. Roy, D. Gilbert, P. Pellerin and H. Ritchie. 2003. Modeling the formation
and circulation processes of water masses and sea ice in the Gulf of St. Lawrence, Canada. J. Geophys. Res. V.108 (C8), pp.
12
Sheng, J, D.G. Wright, R.J. Greatbatch, and D.E. Dietrich. 1998. CANDIE: A new version of the DieCast ocean circulation model. J. Atmos. Oceanic Technol., V15, 1414-1432.
Smith, P.C. 1983. The mean and seasonal circulation off southwest Nova Scotia. J. Phys.
Oceanog. V13(6), 1034-1054. Wonham, M.J., W.C. Walton, G.M. Ruiz, A.M. Frese. B.S. Galil. 2001. Going to the
source: role of the invasion pathway in determining potential invaders. Mar. Ecol. Prog. Ser., V215, 1-12.

13
Figure 1: Top: Geography of the SS/GoM region. Bottom: Schematic diagram of near-surface circulation in the Northwest Atlantic showing two major and opposing current systems: the north-to-south flow along the continental margin and the south-to-north flow in the Gulf Stream and North Atlantic Current.
14
Figure 2: (a) Commercial landings - 4VW, (b) Commercial landings - 4X, (c) Landed value, excluding aquaculture, (d) Aquaculture production.

15
Figure 3: Drifter release on the central SS. Top panel: Distance from centre of mass versus time. Bottom panel: Drifter tracks.

16
Figure 4: Subzones on the Scotian Shelf (SS) – delimited by isobaths, latitude, and the shelf-slope front (SSF): 40N>A>SSF, SSF>B>2500m, 2500>C>1000m, 1000>D>200m, E<200m.
Figure 5: Transition statistics for surface drifters originating in each sub-zone of the Scotian Shelf region, expressed as a percentage of tracks the intercepted that sub-zone. For example, in sub-zone A 100% (blue bar) of those tracks that started in A intercepted A, but only 4% (red bar) intercepted sub-zone E.

17
Figure 6: Vessel transect density. Top: 1990. Bottom: 1995. From Kelly (2002).
18
Figure 7: Example of vessel exchange movement tracks derived from ballast water exchange endpoints. From Kelly (2003). The colour scale progresses from green (high exchange volumes) to red (low exchange volumes). No significant seasonality was found in these data.
19
Figure 8: Great circle routes to Atlantic Canada.

20
Figure 9: Principal vessel corridors on the Scotian Shelf, as derived from vessel transect density maps.

21
Figure 10: The domain for the circulation model (dashed magenta box). The brown arrows denote time independent boundary velocity forcing. The red arrow is where an analytic seasonal cycle is applied. Cabot Strait (CS), the Western Bank complex (WB) and Georges Bank (GB) are marked. The green, pink and yellow lines mark the CS, Halifax and Cape Sable Island sections referred to in the text.

22
Figure 11: Example of the passage of a storm from the OMIP dataset. The domain averaged windstress magnitude at yd19 (yearday 19) was ~0.7Pa.

23
Figure 12: The domain averaged windstress magnitude versus yearday, from the OMIP dataset.

24
Figure 13: The depth-averaged velocity field averaged over the 90 days of spring.

25
Figure 14: The seasonal cycle of transport through Cabot Strait, and the Halifax and Cape Sable Island sections. The blue boxes on the Halifax section correspond to the data (mean plus error bars) of Anderson and Smith (1989). Negative values imply transports (roughly) toward the south, southwest, and west for the 3 sections respectively.

26
Figure 15: The depth-averaged response to the passage of the storm shown in Figure 11. Note the reversal of the coastal currents in the GoM and central SS and the destruction of the gyre on Western Bank, leading to a reversal of transport on the Halifax section. By yd23 the gyre had re-established itself.

27
Figure 16: Example of conversion of vessel corridors to discretized model tracks. Segment numbers on boxes refer to the last box in the 8-box segment.
Figure 17: Vessel tracks investigated for dispersion, grouped based on port of origin. The dashed lines denote tracks simulated but not reported in this document. The 1000m isobath is highlighted.

28
Figure 18: Dispersion on the SS/GoM – model surface layer. The top 2 panels come from the offshelf GB to CS corridor. The bottom 6 come from the shelfbreak corridor. Segment boxes are shown in magenta, the cyan square is the Gully MPA. The concentration scale is in arbitrary units.

29
Figure 19: Histogram of dispersive volumes, for all segments over all months.
30
Figure 20: Segment dispersion versus month. Top panel: Segments of the track. The number denotes the last box in the 8-box segment. Middle panel: Contour plot of segment dispersive volume versus month. Bottom panel: Histogram of dispersive volumes (all segments, months) for the track in question.
31
Figure 21: See Figure 20 caption

32
Figure 22: Dispersion from selected track segments (month = August) – Offshelf Georges Bank to Cabot Strait.
33
Figure 23: See Figure 20 caption

34
Figure 24: Dispersion from selected track segments (month = August) – Offshelf Georges Bank to Halifax.

35
Figure 25: See Figure 20 caption

36
Figure 26: Dispersion from selected track segments (month = August) – Nantucket Shoals to Halifax.

37
Figure 27: See Figure 20 caption
38
Figure 28: Dispersion from selected track segments (month = August) – Nantucket Shoals to Cabot Strait.

39
Figure 29: See Figure 20 caption

40
Figure 30: Dispersion from selected track segments (month = August) – Nantucket Shoals to St. John.

41
Figure 31: See Figure 20 caption

42
Figure 32: Dispersion from selected track segments (month = August) – Boston to Cabot Strait.

43
Figure 33: See Figure 20 caption

44
Figure 34: Dispersion from selected track segments (month = August) – Along Laurentian Channel to Cabot Strait.