republic of the philippines · republic of the philippines ex-post evaluation of japanese oda loan...
TRANSCRIPT

1
Republic of the Philippines
Ex-Post Evaluation of Japanese ODA Loan Project
“Subic Bay Port Development Project”
External Evaluator: Yasuhiro Kawabata,
Sanshu Engineering Consultant
0. Summary
The objective of the project was to increase cargo handling capacity for the Subic Port,
and facilitate and promote distribution in the Central Luzon including the Subic area by
constructing a new container terminal and rehabilitating existing port facilities in the Subic
Bay Freeport Zone, which is located at about 80 km north-west of Metro Manila, thereby
contributing to promotion of regional economic development and to alleviation of
congestion at Manila Port. The project has been highly relevant to the development plans
and needs of the Philippines, as well as Japan’s ODA policies. However, projection of
handling cargo volume at the planning stage was overestimated, and preparation of a
comprehensive plan and review for organic and effective use and operation of container
terminals after the project completion was not thorough. Thus, it is considered that there
were some problems in planning a project and the approach to address issues. Its relevance
is therefore considered fair. The project cost was lower than planned, but the project period
was significantly longer than planned. Therefore, efficiency of the project is considered fair.
Regarding the effectiveness, it was verified that the volume of non-container cargos handled
was higher than the projected volume and thus rehabilitation of the existing port has to some
extent achieved its effect. However, the actual cargo handling volume at Subic Port including
that at the new container terminal in 2014 is about 77,177 TEU, which is only 10% of the
projected volume. As for qualitative effects by the project, promotion of smooth and efficient
logistic systems and contribution to development of regional economy were anticipated.
However, the executing agency considers that appearance of expected qualitative effects by
the project is limited at the ex-post evaluation stage, since the actual handling volume of
container cargo is much lower than projected. With respect to impact of the project, since
the number of container ships which call at Subic Port is much lower, resulting in much
fewer cargo handling volume at the container terminals, increase of employment
opportunities has not taken place. Thus, contribution to the development of regional
economies is limited. The project has achieved its objectives at a limited level. Therefore,
effectiveness and impact of the project are low. No major problems have been observed in
the institutional and technical aspects of the operation and maintenance of facilities and
equipment constructed/installed/procured under the project. Currently, there are also no
problems in the operation and maintenance system. However, some minor problems have

2
been observed in terms of financial status. Therefore, sustainability of the project effects is
fair.
In light of the above, this project is evaluated to be unsatisfactory.
1. Project Description
Project Location Subic Bay Port Container Terminal
1.1 Background
With its distinctive geographical character of an archipelago consisting of more than 7,000
islands, the Philippines relied heavily on maritime transportation in its economy and society
so that improvement of port facilities was essential to expedite smooth maritime distribution
at the appraisal stage. Development and improvement of port facilities had not been
appropriately undertaken even though the cargo volume handled at ports had been increased
due to economic development and internationalization of the Philippines. Thus, congestion
was common at all the main ports. Increase in handling load at Manila Port was especially
pronounced due to economic activities concentrating in the Metro Manila area. Decongestion
at major ports including Manila Port and expansion of container cargo handling facilities
were considered urgently addressed issues in order to maintain sustainable economic growth
in the Philippines. Thus, the Philippine government had promoted port development projects.
However, investment had concentrated in Manila Port, which is a core port for cargo
handling. Under the circumstances, it was considered essential to develop local main ports
in order to promote dispersing handling cargo to each regional center and develop ports ,
which can serve as a supplemental and alternative port for Manila Port such as Batangas
Port, located in the south of Manila Capital Region and Subic Port in the north.
1.2 Project Outline
The objective of the project was to increase cargo handling capacity for the Subic Port,
and facilitate and promote distribution in the Central Luzon including the Subic area by
constructing a new container terminal and rehabilitating existing port facilities in the Subic

3
Bay Freeport Zone, which is located at about 80 km north-west of Metro Manila, thereby
contributing to promotion of regional economic development and to alleviation of
congestion at Manila Port. The location of the project site is shown in Figure 1.
Source: JICA document
Figure 1 Location of Project Site
Loan Approved Amount/
Disbursed Amount 16,450 million yen/15,683 million yen
Exchange of Notes Date/ Loan
Agreement Signing Date August 2000/August 2000
Terms and Conditions For civil work: Interest Rate: 0.95%,
Repayment Period: 40 years (Grace Period: 10 years)
Conditions for Procurement: Tied (Special ODA
Loan)
For consulting services: Interest Rate: 0.75%
Repayment Period: 40 years (Grace Period: 10 years)
Conditions for Procurement: Bilateral tied
Borrower / Executing
Agency(ies)
Subic Bay Metropolitan Authority (SBMA)
Final Disbursement Date December 2010 (originally December 2009)
4
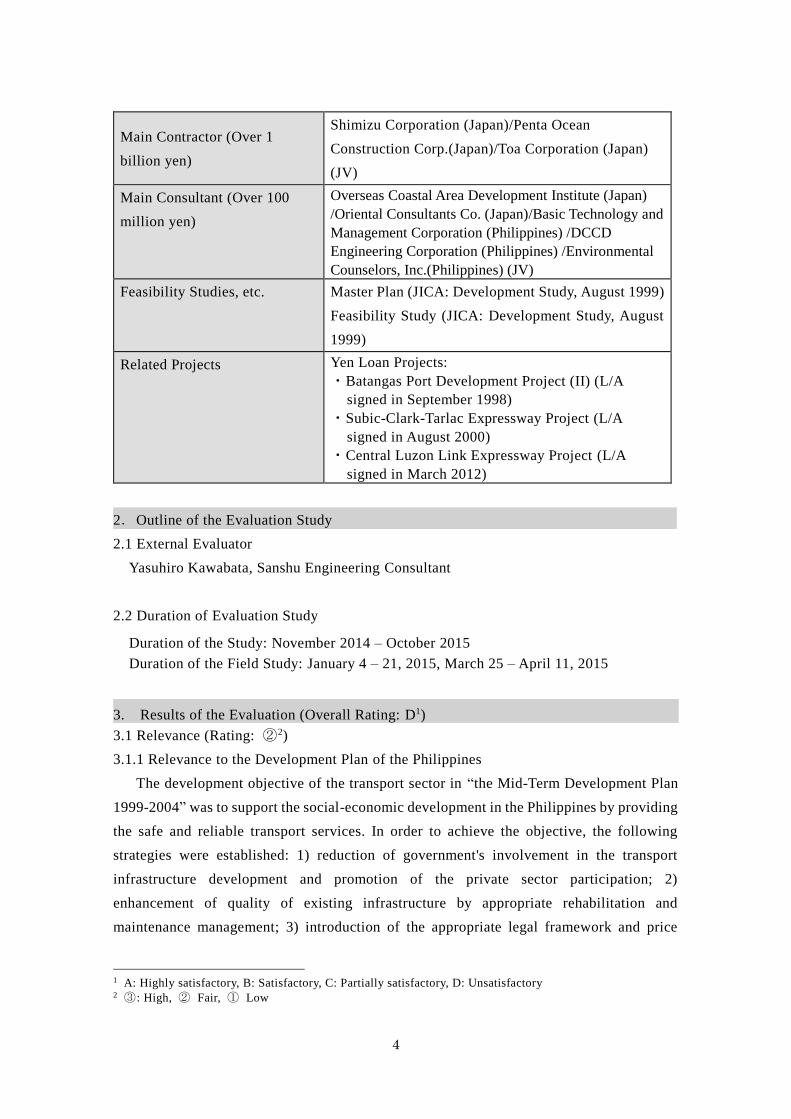
Main Contractor (Over 1
billion yen)
Shimizu Corporation (Japan)/Penta Ocean
Construction Corp.(Japan)/Toa Corporation (Japan)
(JV)
Main Consultant (Over 100
million yen)
Overseas Coastal Area Development Institute (Japan)
/Oriental Consultants Co. (Japan)/Basic Technology and
Management Corporation (Philippines) /DCCD
Engineering Corporation (Philippines) /Environmental
Counselors, Inc.(Philippines) (JV)
Feasibility Studies, etc. Master Plan (JICA: Development Study, August 1999)
Feasibility Study (JICA: Development Study, August
1999)
Related Projects Yen Loan Projects:
・Batangas Port Development Project (II) (L/A
signed in September 1998)
・Subic-Clark-Tarlac Expressway Project (L/A
signed in August 2000)
・Central Luzon Link Expressway Project (L/A
signed in March 2012)
2.Outline of the Evaluation Study
2.1 External Evaluator
Yasuhiro Kawabata, Sanshu Engineering Consultant
2.2 Duration of Evaluation Study
Duration of the Study: November 2014 – October 2015
Duration of the Field Study: January 4 – 21, 2015, March 25 – April 11, 2015
3. Results of the Evaluation (Overall Rating: D1)
3.1 Relevance (Rating: ②2)
3.1.1 Relevance to the Development Plan of the Philippines
The development objective of the transport sector in “the Mid-Term Development Plan
1999-2004” was to support the social-economic development in the Philippines by providing
the safe and reliable transport services. In order to achieve the objective, the following
strategies were established: 1) reduction of government's involvement in the transport
infrastructure development and promotion of the private sector participation; 2)
enhancement of quality of existing infrastructure by appropriate rehabilitation and
maintenance management; 3) introduction of the appropriate legal framework and price
1 A: Highly satisfactory, B: Satisfactory, C: Partially satisfactory, D: Unsatisfactory 2 ③: High, ② Fair, ① Low

5
policy to foster the competitive market, and others. Regarding the subject project, the
government identified it as the transport network development project in the bases
conversion and development program, which aimed at the socio-economic development in
the central Luzon region3.
Under the current “Mid-Term Development Plan 2011-2016”, the following agendas are
to be addressed in order to achieve the inclusive growth: good governance, promotion of
investment, infrastructure development by the PPP scheme, social security reforms,
enhancement of tax collection capacity, peace building/national security and others. In
“Chapter 5: Accelerating Infrastructure Development” of the Development Plan, it is stated
that seamless multimodal transport networks and logistics systems are needed in order to
promote productivity and trade competitiveness. Particularly, the Subic-Clark-Manila-
Batangas (SCMB) Corridor, where the project is located, accounts for two-third of the
country’s GDP, and is considered an important region. The Clark-Subic Region has also been
envisioned as the best international service and logistics hub in the Southeastern Asia.
As mentioned above, at appraisal and at ex-post evaluation, the implementation of the
project conforms to the development policies of the Philippine Government.
3.1.2 Relevance to the Development Needs of the Philippines
The project site, Subic Port was designated as “Subic Bay Freeport Zone” in 1992 after
the US Navy withdrew the Subic Base. Since then, the handling volume of cargo and
container cargo at Subic Port has rapidly increased. However, since operation of Subic Port
had been undertaken by only the facilities which US Navy left, the handling volume of cargo
already exceeded the handling capacity as of 2000. Thus, Subic Port could not handle non-
container/container cargoes originated at Subic Port and surrounded areas including Bataan
Industrial Park, Clark Industrial Park and Luisita Industrial Park. In order to respond to the
situation, construction of a container terminal and rehabilitation/expansion of existing
facilities were considered essential in order to make increasing logistics smooth and promote
trade. At the appraisal stage, the burden of Manila Port was notable (handled 76.4% of trade
cargo, 39.2% of total cargo and 68.8% of container cargo as of 1998), thus implementation
of the project was needed in order to prepare an alternative port for Manila Port as well. At
the appraisal stage, it was considered that Manila Port was already heavily congested and
that further expansion of Manila Port was not feasible.
Around the Subic area, the Central Luzon Regional Growth Hub including above
mentioned three industrial parks is located. It is more convenient to transport and ship the
3 Source: JICA documents

6
cargo originated at the growth hub from Subic Port, which has more advantage in terms of
travel distance compared with that to/from Manila Port. Thus, even at the post evaluation
stage, the development need of the Subic Port is high. However, the type and volume of
cargo (products and commercial goods) originated at the growth hub have not necessarily
reached the level to which the container terminal of Subic Port is effectively utilized. In
addition, no regular navigational routes connecting with major foreign cities including those
in Japan had not been established yet and this was considered disadvantage. (In Autumn
2014, the regular service connecting with Shanghai, Hakata, Pusan and Xiamen was open.)
However, Subic Port has recently functioned as an alternative and supplemental port for
Manila port. In order to alleviate congestion at Manila Port, where congestion is particularly
heavier (the average demurrage time was 5 to 7 days as of 2014), the Philippine Government
issued an Executive Order (EO) in September, cognizant of the fact that congestion around
Manila Port and the vicinity impedes economic activities not only in Manila Capital Region,
but also the other regions in the country, and exerts adverse impact to Philippine economy.
According to the EO, when Manila Port is congested and/or in an emergency situation, Subic
Port together with Batangas Port are to function as an alternative port for Manila Port. In
fact, since congestion at Manila Port has been worsened, the number of ships which make a
call at Subic Port increased in 2014.
The handling volume of container cargo at Manila Port is shown in Table 1.
Table 1 Handling Volume of Container Cargo at Manila Port
Unit: 1000 TEUs
Port 2000 2010 2011 2012 2013 2014
North Harbor Port - 554 772 866 895 1,032
South Harbor Port 577 988 977 1,014 983 762
Manila International
Container Terminal (MICT)
951 1,613 1,713 1,827 1,901 1,877
Total 1,528 3,155 3,462 3,707 3,779 3,671
Source: Philippine Ports Authority:Annual Reports 2010-2013, Ports Statistics, Port
Expert Report
Note 1: TEU (twenty-foot equivalent unit)

7
Seaport Department Management Office Access Road
As stated in 3.1.2, at the appraisal time, the handling volume of cargo at Subic Port had
already exceeded the handling capacity. At the Ex-post evaluation stage, Subic Port handles
non-container cargo and container cargo which are originated at the port surrounding areas,
and serve as an extension port for Manila Port. The project conforms to the development
needs.
3.1.3 Relevance to Japan’s ODA Policy
Under “the Medium-Term Strategy for Overseas Economic Cooperation Operations”
(issued in December 1999), which was effective at the appraisal stage, the assistance to the
following agendas was listed as the priority agenda for the Philippines: strengthening of
economic structure for the sustainable growth and overcoming factors, which constrain
growth, poverty alleviation and correction of disparity among regions, assistance to
environmental protection measures including disaster prevention, and development of
human resources and institutional reforms. As the JICA’s policy at the appraisal stage, it
planned to assist the development of the economic infrastructure including the transport
sector in order to ensure the sustainable economic growth, and to resolve the bottleneck for
economic development4.
3.1.4 Appropriateness of Project Planning and Approach
As discussed later, the number of container ships which call at Subic Port is much less
than expected (2,591 ships in 2014) after the project was completed. The actual handling
volume of container cargo as of 2014 is only about 10% of the projected volume. According
to JICA documents, it was noted: i) at the appraisal stage, Manila Port had been congested.
Thus, development of ports, which could be an alternative and supplemental port for Manila
4 Source: JICA documents

8
Port was essential since further expansion of Manila Port was considered difficult.; and ii)
the project objective was also to contribute to alleviation of congestion at Manila Port.
However, expansion of Manila Port was actually possible, and at Manila International
Container Terminal, Berth No. 6 was constructed during the project implementation and
moreover construction of additional Berth No. 7 was planned (both Berth 6 and 7 have been
constructed as of reporting date). Even at Manila South Port, reconstruction/conversion of
the existing No. 9 Pier to a container terminal was planned (reconstruction/conversion has
been done as of reporting date). These facts reveal that definite plans and strategies which
address and aim at alleviation of traffic congestion around Manila Port area by organically
and effectively operating three ports around Manila Capital Region including Manila Port,
Batangas Port and Subic Port had not been established.
Critical issues at the project planning stage are: 1) Preparation of a comprehensive plan
for organically and effectively operating three ports including Manila Port, Batangas Port
and Subic Port, which are located in the Manila Capital Region was lacking. A
comprehensive plan should have been prepared together with the physical development of
port infrastructure (hardware) and 2) Even though the potential demand was anticipated
around the Subic Port, not only development of port facilities but also attraction and
promotion activities to the brokers/custom agents, shipping lines, container transporters,
warehouse/storage operators and other relevant business sectors are essential. Moreover,
various incentives/preferential treatment including reduction/exemption of taxes, lowering
charges and tolls, simplification of examination documents, reduction of process time were
to be introduced. However, efforts to address and monitor these agendas were considered
insufficient.
Accordingly, the project has been highly relevant with the Philippine development plan
and needs, as well as Japan’s ODA policies. However, projection of handling cargo volume
at the planning stage was overestimated, and preparation of a comprehensive plan and
review for organic and effective use and operation of container terminals after the project
completion was not thorough. Thus, it is considered that there were some problems in
planning of a project and the approach to address issues. Its relevance is therefore
considered fair.
3.2 Efficiency (Rating: ②)
3.2.1 Project Outputs
The original and actual output of the project is shown in Table 2.
9
Table 2 Output (Planned and Actual)
Project Scope at Appraisal Stage Project Scope at Project Completion
Civil Work i) Construction of a new container terminal
・construction of container berths (2
berths) length 560m
・construction of container yard (about 30
ha)
・construction of an access road (a 3.6km
4-lane road)
・construction of buildings (a
management office, 2 gates, 2
substations)
・construction of navigation aid facilities
(27 buoys, a lighting beacon, a radar
system)
・construction of ancillary facilities (fire
extinguishing, water supply, power
supply)
ii) Rehabilitation of existing port facilities
・Improvement of piers (expansion of
piers), and dredging
i) Construction of a new container terminal
・construction of container berths (2 berths) as
planned
・construction of container yard (about 30 ha) as
planned
・construction of an access road (a 3.1km 4-lane road)
almost as planned
・construction of buildings (a management office, 2
gates, substations (a main and 2 substations), a
warehouse) almost as planned
・construction of navigation aid facilities (21 buoys, 2
lighting beacons, a radar system, a range light)
almost as planned
・construction of ancillary facilities (fire
extinguishing, water supply, power supply, a closed
circuit TV) almost as planned
ii) Rehabilitation of existing port facilities
・Improvement of piers (rehabilitation of Marine
Terminal, Boton Wharf and Nabasan Wharf and
repair/replacement of existing pier fixtures) almost
as planned
Procurement
of major
equipment
and goods
・gantry cranes (41ton class x 4 units) for a
new container terminal
・a tugboat
・an environmental monitoring boat
・speed boats (5 units)
・gantry cranes (41ton class x 4 units) as planned
・a marine garbage collector
・an oil skimmer
・a search and rescue boat
・3 multi-purpose patrol boat
・a line handling boat
Consulting
services
i) Basic surveys (topographic survey, soil
investigation)
ii) Detail designs
iii) Preparation of bidding documents and
assistance in bidding process (for
procurement of civil works and a port
operator)
iv) Construction supervision
v) Implementation of an additional
environmental study, and
vi) Monitoring of compliance of
conditions stipulated in the Environment
Compliance Certificate and
environmental management
Foreign expert: 283 M/M
Local experts: 286 M/M
Local assistants: - M/M
as planned
Foreign expert: 353 M/M
Local experts: 631 M/M
Local assistants: 988 M/M
Source: JICA documents, Interview with the executing agency
Note 1: Originally, civil work and equipment were to be procured in one package under the International
Competitive Bidding procedure. Because of application of the Special ODA Loan, bidders were tied to
Japanese firms.
Civil work was completed almost as planned. Although there are some changes in bill of
quantities and work items, these changes were made based on the results found during detail
designs, and thus, they are considered appropriate.
10
Regarding procurement of equipment and goods, review on needs (type and quantities)
was made during the project implementation, and some changes were made on the type and
quantities. These changes were made based on the results (on needs and priority) of
inventory and demand surveys during the detail designs, and they are considered appropriate.
Consulting services were undertaken as planned. However, the length of assignment was
extended more than planned since the implementation period was lengthened.
Results of Responses to the Questionnaire on Application of Special ODA Loan from the
Executing Agency: Regarding the terms and conditions applied to the procurement
procedure and process under the Special ODA Loan, there was no particular problem. The
technical level of contractors was extremely high, and the project management was
satisfactory. Thus, the project was completed as planned. The technical transfer to
subcontractors was also properly done.
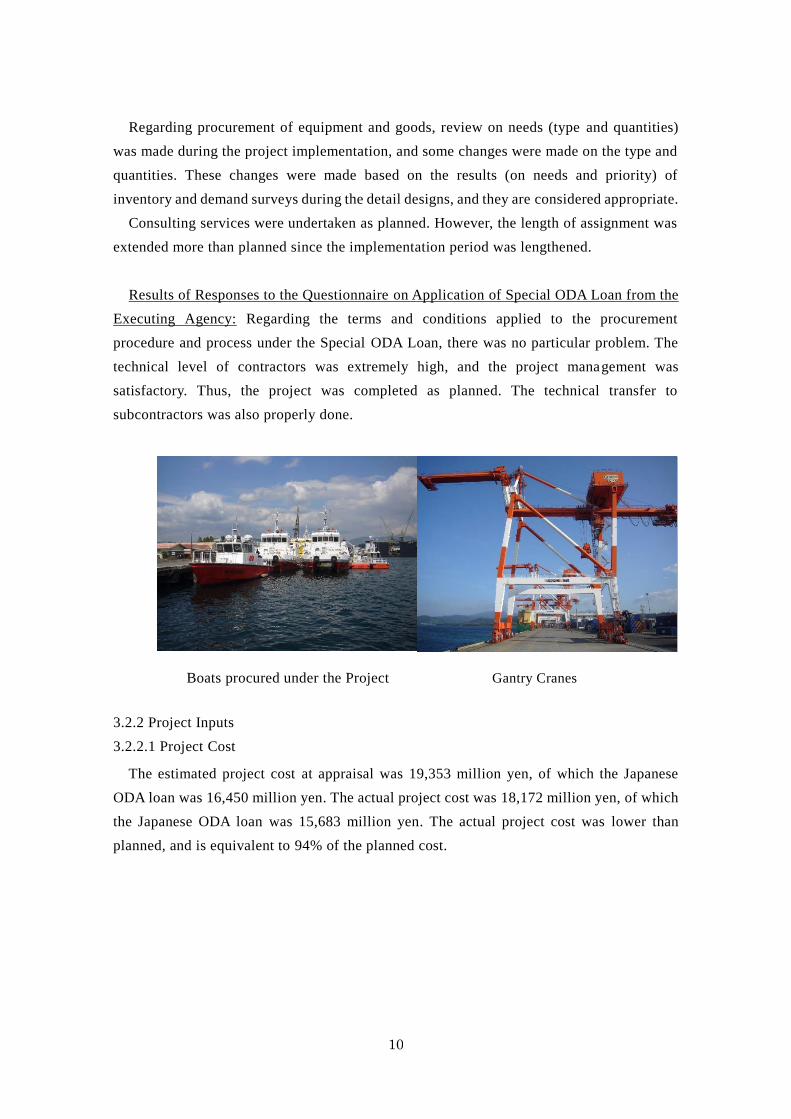
Boats procured under the Project Gantry Cranes
3.2.2 Project Inputs
3.2.2.1 Project Cost
The estimated project cost at appraisal was 19,353 million yen, of which the Japanese
ODA loan was 16,450 million yen. The actual project cost was 18,172 million yen, of which
the Japanese ODA loan was 15,683 million yen. The actual project cost was lower than
planned, and is equivalent to 94% of the planned cost.

11
Table 3 Comparison of Project Cost (Planned and Actual)
(Unit: million yen)
Category
Planned Actual
ODA
loan
(foreign)
Local currency Total ODA
loan
(foreign)
Local currency Total
Own
fund
ODA
loan
Total ODA
loan
Own
fund
ODA
loan
Total ODA
loan
・Civil Work/Procurement
of equipment and goods 9,510 2,117 4,017 15,644 13,527 12,200 2,243 2,019 16,462 14,219
Container Terminal 4,831 - - - - -
Rehabilitation of existing
facilities 718 - - - - -
Procurement of equipment 3,458 - - - - -
Price escalation 503 - - - - -
・Physical contingency 951 0 613 1,564 1,564 16 0 0 16 16
・Consulting services 911 0 448 1,359 1,359 1,268 0 180 1,448 1,448
・Administration cost 0 786 0 786 0 0 246 0 246 0
Total 11,372 2,903 5,078 19,353 16,450 13,484 2,489 2,199 18,172 15,683
Source: JICA documents, Interview with the executing agency, Project Completion Report
Exchange rates: at appraisal 1 US$ =110 yen, 1peso =2.8 yen
average during implementation (2001 - 2010): 1 peso = 2.12 yen
Price escalation: foreign currency1.2%/year, local currency 1.2%/year
Physical contingency: civil work 10%
Cost estimation made: January 2000
Note 1: VAT and taxes are not included since the project was implemented within the properties of SBMA,
where taxes are exempted.
The reason why the actual project cost was lower than planned is due to appreciation of
yen during the project implementation. (1 peso = 2.8 yen ⇒ 1 peso = 2.12 yen) The actual
project cost is equivalent to about 102% of the planned cost in local currency.
Marine Terminal Boton Wharf
3.2.2.2 Project Period
The originally planned project period was from August 2000 (signing of the Loan
Agreement) to August 2007 (civil work completion) with a total period of 85 months.
12
Originally, it was anticipated that a completed terminal would be sequentially open to traffic5
without waiting for completion of all the civil work. However, the actual completion date of
civil work was December 2009 with a total period of 113 months, or equivalent to 133% of
the plan. Operation of a terminal, which was planned to be sequentially open to traffic
without waiting for completion of all the civil work did not commence even after completion
of all the civil work. The date when operation of New Container Terminal 1 (NCT1)
commenced was April 2008 and that of New Container Terminal 2 (NCT2) was October
2012, and the operational dates were substantially delayed. In case the operational date for
New Container Terminal 2 (October 2012) is considered to be project completion taking into
consideration the time when the impact appears, the actual project period is 173% of the
plan, which is significantly longer than planned.
Table 4 Comparison of Project Period (Planned and Actual)
Planned
(at L/A signing) Actual
Selection of a consultant April 2000 – March 2001 July 2000 – November 2000
Consulting services
Detail design
April 2001 – March 2002 February 2001 – June 2002
Assistance in tendering
(P/Q, bidding )
April 2002 – June 2003 December 2001– May 2003
Supervision, technical
assistance
July 2003 – August 2007 February 2001 – December 2009
Civil work/procurement of
equipment and goods
July 2003 – August 2007 May 2004 – December 2009
Source : JICA documents, Responses to the Questionnaire
Main reasons for extension of the project period are as follows:
1) There is an absence of about one year after the bidding was completed. After opening
of bids in March 2003, it took a long time to negotiate with the lowest bidder and
conduct the awarding process on the result of selection within the executing agency.
Signing the contract was done in March 2004.
2) The period required for civil work and procurement of equipment and goods was
originally planned to be 50 months. However, the actual period spent was 68 months.
Reasons for delay are variation orders made and civil work and equipment
procurement as stated below, which were added/implemented due to anticipated
saving in the loan amount toward the end of project completion. Main additional work
and equipment procured are building a warehouse (about 10,000 m2), installation of a
5 Originally planned operation-commencing dates were May 2005 for Container Terminal 1 and August 2006
for Container Terminal 2, respectively. The actual operation-commencing dates were April 2008 for Container
Terminal 1 and October 2012 for Container Terminal 2, respectively.

13
closed circuit television (CCTV) system, installation of a range light, and procurement
of oil spill fences. These additionally procured work and equipment have supported
the smooth port operation and strengthened the capacity/function for increasing
handling volume of cargo. Thus, these additional work and procured equipment are
considered appropriate.
The project cost was lower than planned, but the project period was significantly longer
than planned. Therefore, efficiency of the project is considered fair.
3.2.3 Results of Calculations of Internal Rates of Return (Reference only)
Economic Internal Rate of Return (EIRR) and Financial Internal Rate of Return (FIRR)
of the Project calculated at the appraisal stage were 25.7% and 4.5%, respectively. Regarding
the EIRR and FIRR at the ex-post evaluation stage, since relevant data on costs and benefits
needed to calculate the EIRR and FIRR was not provided by the executing agency, EIRR
and FIRR are not recalculated.
3.3 Effectiveness6 (Rating: ①)
3.3.1 Quantitative Effects (Operation and Effect Indicators)
In the appraisal documents, only numbers of EIRR and FIRR are shown as quantitative
operational indicators. Thus, effectiveness of the project will be assessed in terms of the
cargo handling volume, which is the representative indicator for port projects.
(1)Cargo Volume Handled (yearly)
Table 5 Cargo Volume Handled (yearly)
Name of port
Actual Planned
2009 2010 2011 2012 2013 2014 2014
Subic Port:
・Container cargo: TEU
29,252
34,318
33,573
36,304
37,460
77,177
738,000
・Non-container cargo:
ton
2,214,666 2,244,899 2,593,117 2,214,704 2,404,649 6,083,000 4,730,000
Manila Port:
・Container cargo: TEU
2,874,807
3,154,702
3,461,734
3,706,851
3,778,861
3,490,187
3,671,984
Source: Philippine Ports Authority:Annual Reports 2010-2013 and Ports Statistics
Responses to the questionnaire, JICA documents
Note 1: TEU (twenty-foot equivalent unit): an inexact unit of cargo capacity often used to describe the
capacity of container ships and container terminals.
Note 2: Planned figures were taken from the JICA documents.
Note 3: Container Terminal 1 at Subic Port was open to traffic in April 2008 and Terminal 2 in October
2012. Actual volume is the total of two terminals.
Note 4: The total container cargo handling volume at both NCT1 and NCT2 in 2014 was about 74,000TEU.
Note 5: Volume at Manila Port is a total of those at North Harbor Port, South Harbor Port and International
Container Terminal.
6 Sub-rating for Effectiveness is to be put with consideration of Impact.

14
According to JICA documents, projection of the handling volume of container cargo at
Subic Port was made by estimating the demand in the Subic Port and the surrounding
industrial parks (Clark, Luisita, and Bataan) by applying the unit volume (estimated based
on the actual figure in past) to the planned area, and by adding the transshipment cargo
volume, which was estimated by applying correlation with GDP. According to the projection
made, the projected volume for 2007 and 2015 is 436,000 TEU and 781,000 TEU,
respectively. The projected volume for 2014 estimated by prorating the projected volume for
2007 and 2015, is 738,000 TEU. Actual volume in 2014 was 77,177 TEU, which is only
about 10% of the projected volume.
The reason for extremely lower actual volume compared with the projected volume is
simply that the number of ships which make a call is much less. Until 2013, only two
shipping lines including American President Line and Wanhai Lines operated the route
connecting between Subic and Kaohsiung, Taiwan once a week each. However, carrying in
and out of container cargoes at Manila Port was delayed due to enforcement of truck ban
during the day time by Manila City, which enacted on February 24, 2014. (However, the
truck ban was lifted on September 13, 2014.) Thus, since the operational delay (expansion
of demurrage time)7 of ship which calls Manila Port has constantly occurred, the number of
ships which divert to Batangas Port and Subic Port has been increasing.
Another factor that contributes to increase of cargo handling volume can be the
implementation of actions and activities for attraction and promotion, which are
recommended in the Action Plan, which was prepared for aiming at promotion of utilization
of Subic Port container terminals. Actions and activities recommended in the Action Plan
were originally planned to be addressed and completed by 2014, and actions and activities
are divided into 7 major items with further sub-items (Details are discussed in 4.2.1).
With respect to the recent situation of Subic Port, two lines including SITC Container
Lines and Nippon Yusen Kaisha newly commenced a ship call once a week starting in fall
2014. Maersk Line also started a ship call (between Subic and Singapore) in January 2015.
After that, Wanhai Lines and Nippon Yusen Kaisha increased the number of ship call by one
each, resulting in 2 ship calls a week.
In addition, since a number of ships which make a call was much less, permanent offices
of brokers/custom agents dealing with cargoes, shipping lines, container truckers, and
warehouse/storage operators were not properly established in Subic. Then, it results in less
number of ship calls, and this was one of the reasons for causing a vicious circle. Ultimately,
increase of container ship calls at Subic Port depends on how many ships which currently
loads or unloads at Manila Port divert to Subic. As the number of ships which calls at Subic
7 Average demurrage time as of 2014 was 5 to 7 days (Source: Report of Philippines Chamber of Commerce)

15
Port increases, these relevant enterprises/entities would establish an permanent office, and
loading/unloading of cargoes, custom clearance process, and transport by trucks will be done
more smoothly which will lead to more ship calls at Subic.
Regarding projection of non-container cargos to be handled, the volume was estimated
by category of cargo by applying correlation with GDP. According to the projection results,
the projected volume for 2007 and 2015 is 2,912,000 tons and 4,990,000 tons, respectively.
The projected volume for 2014 estimated by prorating the projected volume for 2007 and
2015, is 4,730,000 tons. Actual volume in 2014 is about 6,083,000 ton, which is 129% of
the projected volume. The reason for substantial increase in 2014 is considered that the ship
waiting for unloading/loading at Manila Port diverted to Subic Port. Non-container cargos
handled at Subic Port are mainly fertilizer, grains, and used construction machines. The
transporting vessels are smaller compared with the container ship and unloaded cargos can
be transported by normal large trucks so that diverting call to Subic Port from Manila Port
is easier.
3.3.2 Qualitative Effects
At the appraisal stage, the following two items were considered as qualitative effects by
the project: i) promotion of smooth and efficient logistics systems and ii) contribution to
development of regional economy. However, the executing agency considers that appearance
of expected qualitative effects by the project is limited at the ex-post evaluation stage, since
the actual handling volume of container cargoes is much lower than projected (10% of the
planned volume).
In order to verify the qualitative effects by the project (promotion of smooth and efficient
logistics systems, development of regional economy), the beneficiary survey 8 was
undertaken as shown below.
Results of Beneficiary Survey:
(1) Making Logistics Systems Smooth/Promotion of Efficiency
1) Increase of Ships which call at Subic Port
8 Number of samples: total 100 (the project target site: Subic Bay Freeport Zone); drivers (28%), government
employees (26%), private company employees (12%), college students (9%), housewives (8%), employees
of transporting firms (7%), self-employed (5%), others (5%); male (74%), female (26%); method: interview
with a Questionnaire

16
Table 6 Increase of Ships which call at Subic Port
Level of Increase Rate cognized (%)
Substantially 17
Fairly 64
A little bit 16
No change 3
Total 100
About 97% of respondents of the beneficiary surveys in the project target areas
cognize that the number of ship call to Subic Port has increased compared with that
before the project, even though the degree of cognition varies within the group.
2)Increase of Traffic Volume (Large Cargo Trucks) Table 7 Increase of Traffic Volume (Large Cargo Trucks)
Level of Increase Rate cognized (%)
Substantially 26
Fairly 56
A little bit 15
No change 3
Total 100
About 97% of respondents of the beneficiary surveys cognize that the number of traffic
volume (large cargo trucks) has increased compared with that before the project, among
which 26% consider that the increase is “substantial” .
(2) Development of Regional Economy
1) Activation of Regional Economic Activities
Table 8 Activation of Regional Economic Activities
Level of Activation Rate cognized (%)
More than 51% 14
41 - 50% 14
31 - 40% 17
21 - 30% 24
11 - 20% 26
1 - 10% 1
No change 4
Total 100
About 96% of respondents of the beneficiary surveys cognize that the regional
economic activities have been activated compared with those before the project. It may
be due to the fact that the number of ship calls and traffic volume (large cargo trucks)

17
fairly increased particularly in 2014. Fourteen percent of respondents cognize that the
level of activation generated is more than 50%.
2) Increase of Business Chances
Table 9 Increase of Business Chances
Level of Increase Rate cognized (%)
More than 51% 11
41 - 50% 14
31 - 40% 14
21 - 30% 10
11 - 20% 16
1 - 10% 29
No change 8
Total 100
Note: Business chances mean particularly those of
local shops and restaurants
Regarding increase of business chances, about 37% of respondents of the beneficiary
surveys cognize that the level of increase is less than 10% or no change. Persons who
recognize that the level of increase is lower compared with recognition on activation of
regional economic activities are mostly those running local shops and restaurants, and it
seems that they cannot yet cognize the benefits to the local economy.
3.4 Impact
3.4.1 Intended Impacts
The anticipated impact by implementation of the project was contribution to the
development to the regional economy. However, as mentioned above, since the number of
container ships which call at Subic Port is much lower than expected resulting in much fewer
cargo handling volume at the container terminals, increase of employment opportunities has
not occurred. Thus, contribution to the development of regional economies is limited.
Transition of number of employees for the past 5 years in Subic Bay Freeport Zone is shown
in Table 10.
Table 10 Number of Workers
in Subic Bay Freeport Zone for the past 5 years
(Unit: persons)
2009 2010 2011 2012 2013
Number of
workers
87,200 88,500 89,000 89,100 89,600
Source: Responses to the Questionnaire
The number of workers in Subic Bay Freeport Zone has slightly increased (3%) for the

18
past 5 years. Examining the increase by type of job, no major difference is observed in the
transition of increase. Thus, contribution of the project to increase of the number of workers
is considered to be limited.
Transition in the number of new employees in Subic Bay Freeport Zone for the past 5
years is shown in Table 11.
Table 11 Transition in the number of new employees
in Subic Bay Freeport Zone for the past 5 years
(Unit: persons)
2009 2010 2011 2012 2013
Number of new employees 35,700 36,800 36,000 43,700 36,400
Source: Responses to the Questionnaire
The number of new employment (jobs) in Subic Bay Freeport Zone was constantly about
36,000 persons per year for the past five years except 2012. Since the number of employees
in the Zone has been almost constant for the past five years, the new employees are likely to
fill of retirees. At this moment, contribution of the project to increase of employment
includes employment of about 60 regular staffs at container terminal operating firms and
about 30 part-time staffs who work when container ship calls at Subic Port. As the number
of regular ship calls at Subic Port increases in the future, the number of employees of the
terminal operating firms and those of port business relevant firms and entities (trucking
companies, brokers9, forwarders10) which would newly move in will also increase.
The project secondly aimed at functioning as an alternative/supplemental port for Manila
Port. Since the traffic congestion around Manila Port area has been worsened, the
Government has been implementing/reviewing countermeasures for improvement (including
installation of truck lanes).
Regarding contribution to development of the regional economy, the beneficiary surveys
reveal the following results.
1) Increase of Employment Opportunities
9 Broker: takes care of custom documentation for export/import of trade cargoes on behalf of cargo owners. 10 Forwarder: a cargo transport operator, who is responsible for transporting cargoes entrusted by a cargo
owner by using other transport modes (ship, air, railway, trucks)

19
Table 12 Increase of Employment Opportunities
in Subic Bay Freeport Zone
Level of Increase Rate cognized (%) Substantially 23
Fairly 56
A little bit 12
No change 9
Total 100
About 91% of respondents of the beneficiary surveys in the project target areas
cognize that employment opportunities in Subic Bay Freeport Zone have increased even
though the degree of cognition varies within the group.
2) Increase of Investment by Domestic and Foreign Enterprises
Table 13 Increase of Investment to Subic Bay Freeport Zone
Level of Increase Rate cognized (%) Substantially 18
Fairly 58
A little bit 17
No change 7
Total 100
About 93% of respondents of the beneficiary surveys cognize that the investment to
Subic Bay Freeport Zone has increased compared with that before the project even
though the degree of cognition varies within the group.
3) Impact on Increase of Household Income
Table 14 Impact to Increase of Household Income
Level of Increase Rate cognized (%) More than 51% 6
41 - 50% 20
31 - 40% 7
21 - 30% 18
11 - 20% 26
1 - 10% 6
No change 17
Total 100
About 83% of respondents of the beneficiary surveys in the project target areas
cognize that the household income has increased compared with that before the project
even though the degree of cognition varies within the group. However, 17% of
respondents answered that there has been “no change”.
20
3.4.2 Other Impacts
(1) Impacts on the Natural Environment
According to the “JICA Environmental Guidelines for Consideration of Safeguard
Aspects under the ODA Loan Project”, the project was classified as Category A11, taking
into account the project scale, and geographical features. Thus, during the feasibility
study, the Environmental Impact Assessment (EIA) was conducted and an Environmental
Compliance Certificate was issued by Environment Department of SBMA.
Since it was foreseen that the toxic substance would be most likely included in the
dredged soils and sand, additional environmental surveys were to be implemented by a
consultant during the project implementation including the following: 1) undertaking of
dissolution tests on the dredged soils and sand; 2) preparation of treatment plans based
on the results of dissolution tests; and preparation of an environmental monitoring
program. Moreover, an independent monitoring team which included NGOs was
established in order to monitor the environmental impacts by the project, and a
monitoring was to be regularly undertaken.
Although the dredging work was originally included in the rehabilitation of the
existing port facilities, only repair of existing piers/wharves, repair/replacement of pier
ancillary fixtures and widening of piers were undertaken. However, since dredging work
(about 250,000 m2) was required around the construction job site for a container terminal,
an additional environmental survey was conducted. The survey results revealed no
hazardous materials. The site for a container terminal was constructed by reclaiming
(about 2 million m3) by using borrow materials taken from Maritan Hills close to the
project site. During the project implementation, an independent monitoring team which
consists of Department of Environment and Natural Resources (DENR), SBMA and
NGOs was established in order to monitor the environmental impacts, and a monitoring
on soils and air/water quality was regularly undertaken. No major problem has been
reported. During the operational stage after the project was completed, private port
operation firms have examined and inspected changes of air/water quality and status of
treatment of solid wastes, and they summarize the results of examination and inspection
for a report to be quarterly submitted to SBMA. Currently, SBMA continues an
environmental monitoring, and it reports that there is no major problem in the
environmental issues.
11 Category A is applied to the project which can cause seriously unfavorable impacts on the environment
and community).
21
(2) Land Acquisition and Resettlement
The project scope included rehabilitation of existing port facilities and construction
of a new container terminal. Since all the new construction work was implemented within
the properties owned by SBMA, land acquisition and resettlement have not occurred.
(3) Other Positive and Negative Impacts
None.
Regarding the effectiveness, although it was verified that the volume of non-
container cargos handled was higher than the projected volume and thus rehabilitation of
the existing port facilities has to some extent achieved its effect, the actual cargo handling
volume at Subic Port including that at the new container terminal in 2014 is about 77,177
TEU, which is only 10% of the projected volume. As qualitative effects by the project,
promotion of smooth and efficient logistic systems and contribution to development of
regional economy were anticipated. However, the executing agency considers that
appearance of expected qualitative effects by the project is limited at the ex-post
evaluation stage since the actual handling volume of container cargoes is much lower
than projected. With respect to “Impact”, since the number of container ships which call
at Subic Port is much lower than expected, resulting in much fewer cargo handling
volume at the container terminals, increase of employment opportunities has not been
generated. Thus, contribution to the development of regional economies is limited.
The project has achieved its objectives at a limited level. Therefore, effectiveness
and impact of the project are low.
3.5 Sustainability (Rating: ②)
3.5.1 Institutional Aspects of Operation and Maintenance
The supervisory agency of the Subic Port is Subic Bay Metropolitan Authority (SBMA),
and the total number of staffs is about 3,000. The Authority consists of 26 departments and
other 20 offices, and Seaport Department among them is responsible for overall operation
and maintenance of Subic Port. Seaport Department consists of 4 divisions with a total staff
number of about 190, and is responsible for maintenance of piers and wharves rehabilitated
under the project and other piers/wharves/facilities except the new Container Terminal 1
(NCT1) and Terminal 2 (NCT2). About 5 staffs in the Seaport Department are responsible
for supervision of the operating firm entrusted by SBMA.
Operation of NCT1 and NCT2, which were constructed under the project, is entrusted to
the following two firms under the concession agreement. The contract period for concession
is 25 years, and the operating firms pay the contract amount, which includes fixed fees, rental

22
costs and the variable fees corresponding to the total sales to SBMA every year.
・NCT1: Subic Bay International Terminal Corp (SBITC) (A major shareholder of
SBITC is International Container Terminal Services, Inc. (ICTSI) and part of
shares are owned by SBMA and private enterprises)
・NCT2:International Container Terminal Services, Inc. Subic (ICTSI, Subic)
ICTSI, which is a parent company of SBITC and ICTSI, Subic is a terminal operator
ranked within the top 5 in the World, and is entrusted to operate Manila International
Container Terminal, Okinawa Naha International Container Terminal and others.
Since NCT2 has not been operational due to less cargo handling volume at Subic Port
after opening in October 2012, SBITC (management level staffs belong to ICTSI) operates
both terminals. SBITC consists of 62 regular staffs and about 30 part-timers who work only
when container ship calls at the port under General Manager. Eleven staffs out of 62 regular
staffs of SBITC are administration staffs and the remaining 51 staffs are technical staffs,
who are actually in charge of operation and management of terminals. Staffs are categorized
into two sectors. Thirty-eight staffs are in charge of port operations and 13 are in charge of
maintenance. The current organization for operation and maintenance is appropriately
established and the number of staffs assigned is likely appropriate.
3.5.2 Technical Aspects of Operation and Maintenance
Management level staffs such as a General Manager and four Division Chiefs of Seaport
Department have college degrees and qualification required to respective positions.
Among 51 technical staffs of SBITC in charge of terminal operation and maintenance of
NCT1 and NCT2, 3 manager level staffs possess college degrees and qualification as a
licensed engineer. Three second level staffs (Supervisors) have not necessarily a licensed
engineer qualification, but have college degrees. Thus, there is no technical issues.
Terminal operation and maintenance of NCT1 and NCT2 have been undertaken
according to the operational manuals such as “Rules of Terminal” and “Maintenance
Manuals for each Equipment”. Main maintenance work for civil work infrastructure and
gantry cranes are implemented in the following manner.
・Civil work infrastructure: Bollards and fenders are inspected every 6 months and
necessary preventive work (repainting, rust removal, and replacement) is implemented.
・Gantry cranes: Lubricated weekly. Main structures are visually inspected every month.
Gear box oil is changed every six months. A structured integrated test on main
structure is undertaken every five years.
Inspection results of these maintenance work are also included in a quarterly financial
report, which is submitted to the company headquarters quarterly. Since the cargo handling
23
volume is still less and thus operating hours of cranes are extremely short . No major obstacle
has been reported on operation and maintenance of equipment.
Regarding the capacity building and training for SBITC management staffs, several
training programs including external (e.g. “how to manage the company”) and internal on -
the job training (e.g. “maintenance of cranes”) programs are regularly undertaken. To
technicians such as drivers/operators of cranes, stackers and lubber-tire gantry cranes,
operational training is implemented at entry to the company, and only the operators who
passed the examination are provided a license.
Since engineers and technicians with qualified technical skills are assigned to SBITC,
and undertakings of training and development of manuals are properly done, no particular
problem is noted. Thus, there is no technical issues to sustain the effectiveness of the project.
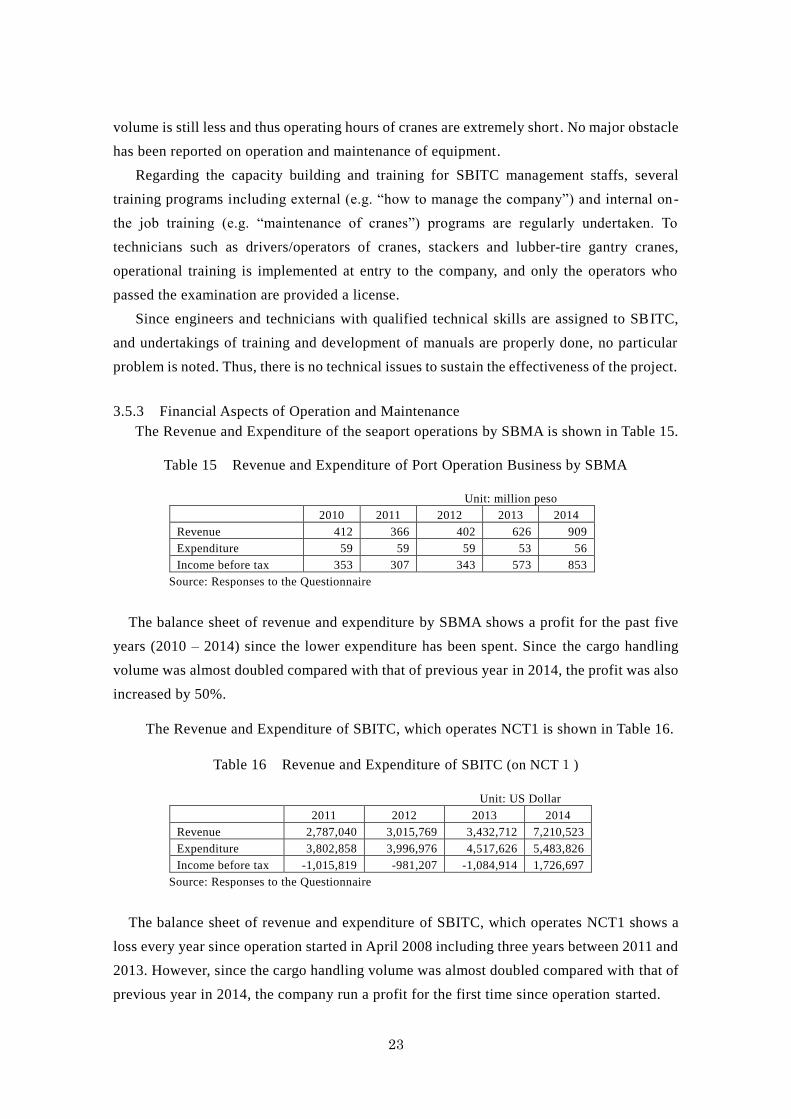
3.5.3 Financial Aspects of Operation and Maintenance
The Revenue and Expenditure of the seaport operations by SBMA is shown in Table 15.
Table 15 Revenue and Expenditure of Port Operation Business by SBMA
Unit: million peso
2010 2011 2012 2013 2014
Revenue 412 366 402 626 909
Expenditure 59 59 59 53 56
Income before tax 353 307 343 573 853
Source: Responses to the Questionnaire
The balance sheet of revenue and expenditure by SBMA shows a profit for the past five
years (2010 – 2014) since the lower expenditure has been spent. Since the cargo handling
volume was almost doubled compared with that of previous year in 2014, the profit was also
increased by 50%.
The Revenue and Expenditure of SBITC, which operates NCT1 is shown in Table 16.
Table 16 Revenue and Expenditure of SBITC (on NCT1)
Unit: US Dollar
2011 2012 2013 2014
Revenue 2,787,040 3,015,769 3,432,712 7,210,523
Expenditure 3,802,858 3,996,976 4,517,626 5,483,826
Income before tax -1,015,819 -981,207 -1,084,914 1,726,697
Source: Responses to the Questionnaire
The balance sheet of revenue and expenditure of SBITC, which operates NCT1 shows a
loss every year since operation started in April 2008 including three years between 2011 and
2013. However, since the cargo handling volume was almost doubled compared with that of
previous year in 2014, the company run a profit for the first time since operation started.

24
The Revenue and Expenditure of ICTSI, Subic, which operates NCT2 is shown in Table
17.
Table 17 Revenue and Expenditure of ICTSI, Subic (on NCT2)
Unit: US Dollar
Source: Responses to the Questionnaire
As shown in Table 17, the balance sheet of revenue and expenditure of ICTSI, Subic,
which operates NCT2 shows a loss for the past 3 years (2012 – 2014) since operation started
in October 2012. The container cargo volume handled at NCT1 and NCT2 is about 74,000
TEU. Considering the handling capacity of NCT1 (300,000 TEU), NCT1 is sufficient to
handle the cargo. Thus, the financial status of port operation by ICTSI, Subic will continue
to be negative for a while. As mentioned above, ICTSI, which is a major shareholder of
SBITC and a shareholder of ICTSI, Subic is a container terminal operator ranked within the
top 5 in the world delivered profits of US$172.5 million in the 2013 balance sheet.
According to the Seaport Department of SBMA, SBITC, and ICTSI, Subic, since the
facilities of piers and container terminals rehabilitated/constructed under the project are still
generally new, and require less maintenance expenditures. Thus, the operation/maintenance
budget is likely well secured by each entity.
As discussed above, since the container cargo handling volume at NCT1 and NCT2 is
substantially lower than projected (about only 10% of the projected volume as of 2014), the
container operation, which is the major project component, has run a loss. (However, NCT1
runs a profit in 2014.)
SBMA, together with terminal operators, has actively undertaken attraction/promotion
activities after terminals were open to operation. SBMA projected the cargo handling volume
for the next six years in March 2015. The projected volume for the year of 2015 based on
the past trends is 77,755 TEU. If the on-going attraction/promotion activities were successful,
the newly generated/induced volume (cargos created by newly moved in enterprises, increase
of number of regular ship calls, ship calls by new shipping lines) is estimated at 42,430 TEU,
and the total projected volume will be 120,095 TEU (about 15% of projected volume at the
planning stage). As the waiting time for loading/unloading at Manila Port becomes longer,
it is expected that the number of ships which shift from Manila Port to Subic Port would
increase. However, the financial status of container terminal operation at Subic Port will still
remain difficult since the future cargo handling volume projected at this moment is
substantially low compared with the volume projected at the planning stage.
2012 2013 2014
Revenue 197,871 420,696 1,197,548
Expenditure 1,218,568 3,834,264 4,044,529
Income before tax -1,020,697 -3,413,568 -2,846,981
25
3.5.4 Current Status of Operation and Maintenance
No defects/problems have been observed on infrastructure (terminals) and gantry cranes,
which were constructed or installed under the project, and these have been functioning well.
Seven vessels including a marine garbage collector, which were procured for operation and
maintenance of Subic Port have been well utilized.
No major problems have been observed in the institutional and technical aspects of the
operation and maintenance of facilities and equipment constructed/installed/procured under
the project. Currently, there are also no problems in the operation and maintenance system.
However, regarding the financial aspects, the financial status of container terminal operation
at Subic Port will still remain difficult for a while considering the following: 1) The balance
sheet of revenue and expenditure of seaport operations on NCT1 continuously shows a loss
including the period of three years (2011 - 2013) since operation started in April 2008.
However, the operating company runs a profit in 2014 for the first time since operation
started; and 2) the balance sheet of revenue and expenditure on NCT2 shows a loss for the
past 3 years (2012 – 2014) since operation started in October 2012. As the waiting time for
loading/unloading at Manila Port becomes longer, it is expected that the number of ships
which shift from Manila Port to Subic Port would increase. However, the financial status of
container terminal operation at Subic Port will still remain difficult since the future cargo
handling volume projected at this moment is substantially low compared with the volume
projected at the planning stage.
Some minor problems have been observed in terms of financial status on operation and
maintenance. Therefore, sustainability of the project effects is fair.
4. Conclusion, Lessons Learned and Recommendations
4.1 Conclusion
The objective of the project was to increase cargo handling capacity for the Subic Port,
and facilitate and promote distribution in the Central Luzon including the Subic area by
constructing a new container terminal and rehabilitating existing port facilities in the Subic
Bay Freeport Zone, which is located at about 80 km north-west of Metro Manila, thereby
contributing to promotion of regional economic development and to alleviation of
congestion at Manila Port. The project has been highly relevant to the development plans
and needs of the Philippines, as well as Japan’s ODA policies. However, projection of
handling cargo volume at the planning stage was overestimated, and preparation of a
comprehensive plan and review for organic and effective use and operation of container
terminals after the project completion was not thorough. Thus, it is considered that there

26
were some problems in planning a project and the approach to address issues. Its relevance
is therefore considered fair. The project cost was lower than planned, but the project period
was significantly longer than planned. Therefore, efficiency of the project is considered fair.
Regarding the effectiveness, it was verified that the volume of non-container cargos handled
was higher than the projected volume and thus rehabilitation of the existing port has to some
extent achieved its effect. However, the actual cargo handling volume at Subic Port including
that at the new container terminal in 2014 is about 77,177 TEU, which is only 10% of the
projected volume. As qualitative effects by the project, promotion of smooth and efficient
logistic systems and contribution to development of regional economy were anticipated.
However, the executing agency considers that appearance of expected qualitative effects by
the project is limited at the ex-post evaluation stage, since the actual handling volume of
container cargoes is much lower than projected. With respect to “impact”, since the number
of container ship which calls at Subic Port is much lower, resulting in much fewer cargo
handling volume at the container terminals, increase of employment opportunities has not
taken place. Thus, contribution to the development of regional economies is limited. The
project has achieved its objectives at a limited level. Therefore, effectiveness and impact of
the project are low. No major problems have been observed in the institutional and technical
aspects of the operation and maintenance of facilities and equipment
constructed/installed/procured under the project. Currently, there are also no problems in the
operation and maintenance system. However, some minor problems have been observed in
terms of financial status. Therefore, sustainability of the project effects is fair.
In light of the above, this project is evaluated to be unsatisfactory.
4.2 Recommendations
4.2.1 Recommendations to the Executing Agency
Since the operational status has been unsuccessful after the container terminals were
completed, JICA Philippine Office conducted several technical assistance and studies 12
including studies shown in the footnote in order to promote more effective utilization, and
reviewed/studied countermeasures for improvement. In these studies, discussions with a
number of relevant agencies and experts including SBMA, Philippine Port Authority,
container terminal operators, shipping lines and truck transporters were made and analysis
of data/information was undertaken. These studies also address the current status of
container terminals at Subic Port, analyze the current major problems, and derive
countermeasures and improvement to be made. Particularly, the recent report involves the
12 1) Study on Marketing for Optimizing the Utilization of Subic Port, 2012; 2) Study to Decongest Manila
and Divert Container Traffic to Subic and Batangas Ports, January 2013; and 3) Expert for SBMA in
Optimizing the Use of New Container Terminal (NCT1) and NCT2 in Subic Port, September 2013.

27
action plan to promote more utilization of Subic Container Terminal and recommends its
implementation. The Action Plan includes actions to be done by 2014, and divided into 7
major items with further sub-items:
1) improvement of proposed incentive scheme for maritime stakeholders;
2) market analysis of Northern and Central Luzon cargo flow;
3) developments on the exploration of establishing Singapore and Japan links as well as
China and Hong Kong links to Subic Port;
4) review of the current import procedures in Subic Port vis-à-vis Manila and also tariff
rates;
5) discussions with stakeholders on having an inland container depot that is strategically
located in Pampanga13;
6) establishment of an association among maritime logistics stakeholders in Subic;
7) facilitate the agreement between SBMA and private operators on the marketing
activities.
All the items recommended in the Action Plan are in the status under either “implemented”
or “on-going” or “have been implemented, but to be continued”, and SBMA has been
proactively engaged in the promotion and attraction activities. However, in order to achieve
the targeted generated/induced volume for the next 6 years (2020 is the target year),
particularly, items under the “have been implemented, but to be continued” category stated
in the Action Plan need to be continuously tackled. According to the projection of cargo
handling volume for the next 6 years, made by SBMA in March 2015, if the on-going
attraction/promotion activities were successful, the newly generated/induced volume (cargos
created by newly moved in enterprises, increase of number of regular ship calls, ship calls
by new shipping lines) is estimated at 42,430 TEU.
4.2.2 Recommendations to JICA
As a JICA technical assistance, an “Expert for SBMA in Optimizing the Use of New
Container Terminal (NCT1) and NCT2 in Subic Port,” was undertaken, and a SBMA Action
Plan was recommended as a part of the output. The progress status of recommended actions
is under either “implemented” or “on-going” or “have been implemented but to be continued.
Since the current utilization of container terminals at Subic Port is low, i t is suggested that
JICA regularly monitors the utilization of container terminals and the implementation status
of measures to improve and attract/promote ship calls of container cargo vessels , including
items included in the Action Plan.
13 Since numerous container depots are currently located in Manila, this is considered one of factors for
traffic congestion in Manila. In order to help the Subic-Clark-Manila-Batangas corridor function as an
integrated one, installation of depots in the inland is considered effective.

28
4.3 Lessons Learned
(1) Necessity of analysis and studies on policies and plans on projects relevant to the subject
project, which would be a basis of projection of effectiveness appearance of the project
(demand forecast and others)
Under the above mentioned “Recommendations to the Executing Agency”, the Action
Plan for optimizing the use of Subic Port, which could be addressed particularly by SBMA
is discussed and its follow up is recommended. However, the fundamental issue was that
strategies/plans for integrating and optimizing the use of three ports (Manila, Batangas, and
Subic) in the Manila Capital Region in order to alleviate congestion at Manila Port under
serious congestion for a long time were not formulated at the appropriate timing. However,
reality is that Manila Port and Batangas Port are under the control of Philippine Port
Authority under Ministry of Transport and Communications, while SBMA is directly under
the President Office, and thus the two ports were under the environment where it was
difficult for two authorities to have a dialogue on check/confirmation of the division of roles
between ports and collaboration on future plans for improvement/rehabilitation of port
facilities.
In view of the above, in the future similar port projects, at the planning/appraisal stage,
policies and plans on relevant projects (including urban development project around the
project site, development projects such as industrial parks, expressway/highway projects,
and port development projects) aiming at optimizing the use of the subject project after the
project is completed need to be analyzed and studied in detail.
(2) Necessity of establishment of plans and strategies for demand promotion by the executing
agency.
At the same time, it is recommended that establishment and undertaking of plans and
strategies for demand promotion (including formulation of an action plan) to be addressed
by the executing agency is included as a legal covenant in the loan agreement or other official
documents. In this project, in order to attract container cargo vessels to Subic Port , the
following items should have been included: a) preferential /incentive schemes for maritime
stakeholders; b) a market analysis of cargo flow in the project surrounding areas; c)
developments of new routes linking with major foreign cities; and d) a review of import
procedures, and review of tariff rates and revision.

29
Comparison of the Original and Actual Scope of the Project
Item Original Actual
1. Output 1) Civil Work 2) Procurement of major
equipment and goods
3) Consulting Services
i) Construction of a new container terminal
・construction of container berths (2
berths) length 560m
・construction of container yard (about 30
ha)
・construction of an access road (a 3.6km 4-
lane road)
・construction of buildings (a management
office, 2 gates, 2 substations)
・construction of navigation aid facilities
(27 buoys, a lighting beacon, a radar
system)
・construction of ancillary facilities (fire
extinguishing, water supply, power
supply)
ii) Rehabilitation of existing port facilities
・Improvement of piers (expansion of piers,
and dredging)
・gantry cranes (41ton class x 4 units) for a
new container terminal
・a tugboat
・an environmental monitoring boat
・speed boats (5 units) i) Basic surveys (topographic survey, soil
investigation)
ii) Detail designs
iii) Preparation of bidding documents and
assistance in bidding process (for
procurement of civil works and a port
operator)
iv) Construction supervision
v) Implementation of an additional
environmental study, and
vi) Monitoring of compliance of conditions
stipulated in the Environment
Compliance Certificate and
environmental management
Foreign expert: 283 M/M
Local experts: 286 M/M
Local assistants: - M/M
i) Construction of a new container terminal
・construction of container berths (2 berths) as
planned
・construction of container yard (about 30 ha)
as planned
・construction of an access road (a 3.1km 4-lane
road) almost as planned
・construction of buildings (a management
office, 2 gates, substations (a main and 2
substations), a warehouse) almost as
planned
・construction of navigation aid facilities (21
buoys, 2 lighting beacons, a radar system) almost as planned
・construction of ancillary facilities (fire
extinguishing, water supply, power supply)
as planned
ii) Rehabilitation of existing port facilities
・Improvement of piers (rehabilitation of Marine
Terminal, Boton Wharf and Nabasan Wharf
and repair/replacement of existing pier
fixtures) almost as planned ・gantry cranes (41ton class x 4 units)
as planned
・a marine garbage collector
・an oil skimmer
・a search and rescue boat
・3 multi-purpose patrol boat
・a line handling boat
as planned
Foreign expert: 353 M/M
Local experts: 631 M/M Local assistants: 988 M/M
2. Project Period August 2000 – August 2007
(86 months)
August 2000 – December 2009
(113 months)

30
3.Project Cost Amount paid in Foreign currency
Amount paid in Local currency Total Japanese ODA loan portion Exchange rate
11,372 million yen
7,981 million yen
19,353 million yen
16,450 million yen
1 Peso = 2.8 yen (as of January
2000)
13,484 million yen
4,608 million yen
18,172 million yen
15,683 million yen
1 Peso = 2.12 yen (average between 2001 and
2010)