republic of poland - unfcccunfccc.int/resource/docs/dpr/pol1.pdf · poland as a party to the kyoto...
TRANSCRIPT

REPUBLIC OF POLAND
Poland’s Report on Demonstrable Progress under the Kyoto Protocol
Ministry of the Environment
Warsaw 2006

2
Financed by the National Fund for Environmental Protection and Water Management

3
Contents Introduction.............................................................................................................................................................4 1. Description of domestic policies, strategies, programmes and instruments......................................…..5
1.1. Instruments.................................................................................................................................................5 1.2. Major legal acts and strategic documents.........…......................................................................................6 1.3. Domestic policies and measures.…............................................................................................................8 1.4. Energy sector...........................................................................................................................................10
1.4.1. Policy.............................................................................................................................................11 1.4.2. Measures.......................................................................................................................................11
1.5. Industry.....................................................................................................................................................13 1.5.1. Policy.............................................................................................................................................14 1.5.2. Measures.......................................................................................................................................14
1.6. Transport...................................................................................................................................................15 1.6.1. Policy.............................................................................................................................................16 1.6.2. Measures.......................................................................................................................................16
1.7. Construction and housing.........................................................................................................................17 1.7.1. Policy.............................................................................................................................................17 1.7.2. Measures.......................................................................................................................................18
1.8. Agriculture.................................................................................................................................................18 1.8.1. Policy.............................................................................................................................................18 1.8.2. Measures.......................................................................................................................................18
1.9. Forestry.....................................................................................................................................................19 1.9.1. Policy.............................................................................................................................................19 1.9.2. Measures.......................................................................................................................................20
1.10. Waste........................................................................................................................................................20 1.10.1. Policy.............................................................................................................................................20 1.10.2. Measures.......................................................................................................................................20
2. Greenhouse gas emission trends and projections ….......……………………..............................................23 2.1. Emission trends by gases ...........………..................................................................................................23 2.2. Projections of greenhouse gas emissions and removals....………...........................................................26
3. Assessment of the impact of applied measures upon fulfilment of commitments included in Art. 3 of the Kyoto Protocol....................................…................................................................................34 3.1. Assessment of emission reductions under current policies and measures....………................................34 3.2. Participation in emission trading, JI and CDM....………....…….……........................................................36 3.3. Main obstacles in the implementation of domestic policies and measures....………................................38
4. Measures taken to fulfil the commitments under Art. 10 and 11 of the Kyoto Protocol……...................39 4.1. Programmes for improving emission factors, activity data and information
on socio-economic models used for preparing greenhouse gas emission projections……............…......39 4.2. Emission reduction programmes (energy sector, transport, industry, agriculture, forestry, waste) ……..39 4.3. Climate change adaptation programmes ....……………....…….……........................................................41
4.3.1. Agriculture ...………....…….……...................…….......…….……...................................................41 4.3.2. Coastal zone...…….....…….……...................…….......…….……...................................................42 4.3.3. Water resources...………..…..…...................…….......…….……...................................................43 4.3.4. Forestry...………....…….………….................…….......…….……...................................................43
4.4. International development assistance...…….......…….……………….…...................................................44 4.5. Transfer of technology...………..…..…...................…….......…….……...............…..................................44 4.6. Cooperation in scientific research, measurements and observations ....………......................……..........44
4.6.1. Polish contribution to the research activity of the International Geosphere-Biosphere Programme (IGBP) and its subprogrammes ………………………………………………………….44
4.6.2. Cooperation under the World Climate Programme (WCP) ……………………….…............…......46 4.6.3. Global Climate Observing System (GCOS) ……………………………………..….…............…......46 4.6.4. Participation in the work of the Intergovernmental Panel on Climate Change (IPCC) …………...47 4.6.5. Participation in the European Programme for the Global Ocean
Observing System (EuroGOOS) ……………………………………………………….……………….47 4.7. Educational activity ...………..…..…...................…….......…….……...............….............................…......47
Abbreviations……………………………………………………………………………………….………………………50

4
INTRODUCTION The decision on the ratification by Poland of the United Nations Framework Convention on Climate Change1), and later of the Kyoto Protocol2) has been driven by its political will to join the international efforts in activities agreed upon jointly under the Convention to slow down climate change and to take both the individual and international responsibility for the processes leading to that change. Poland has signed the Protocol on 15 July 1998 and ratified it on 13 December 2002 (the Kyoto Protocol entered into force on 16 February 2005). Since 1 May 2004 Poland has become a member of the European Union (EU-25) creating favourable conditions for further opening of the Polish market (including the labour market) and for developing foreign trade supporting the inflow of capital and modern technology as well as for providing access of public institutions and economic entities (including farmers) to the European Union funds supporting the implementation of EU policies that are important for the economy. Poland is a moderately developed country, but among the poorest countries within the enlarged European Union: with its gross domestic product per capita, in terms of purchasing power parity, around 50% of the EU-25 average, and at the same time with the lowest in the Community level of employment for working age people (53.7%) and the highest unemployment rate (17.6%). Poland as a Party to the Kyoto Protocol has made a commitment to reduce its greenhouse gas emissions by 6% selecting 1988 as the base year for commitments under the UNFCCC and the Kyoto Protocol regarding emissions of the three main gases: carbon dioxide, methane and nitrous oxide, and 1995 as the base year for industrial fluorinated gases: HFCs, PFCs and sulphur hexafluoride. The results of the inventory of greenhouse gas (GHG) emissions and removals for the period of 1988–2004 presented in this report may change following the emissions recalculations carried out during 2006 in accordance with the methodology given in the Revised 1996 IPCC3) Guidelines, and in Good Practice Guidance and Uncertainty Management. Political and economic transformation that has taken place since 1990 caused the national GHG emissions to drop much below Poland’s target under the Kyoto Protocol. Over the years 1988–2004, greenhouse gas emissions (without sector 5. Land-use change and forestry) decreased by as much as 31.7% below the base year. This target has been achieved by implementing a package of policies and measures primarily leading to the improvement of energy efficiency and restructuring of fuel consumption. Poland as a country undergoing economic modernisation is likely to face an increase of greenhouse gas emissions. The reason for this is mainly the use-structure of fuels (hard coal and lignite), which makes further emission reduction difficult, by switching to gas or to nuclear energy, which does not yet exist in Poland. Modernisation and restructuring processes taking place in enterprises will always be targeted at energy-saving and environmentally friendly measures. Poland wishes to discount the CO2 emission reductions obtained so far within the framework of the emission trading scheme. On 4 November 2003 the Council of Ministers has approved Poland’s Climate Policy – the strategies for greenhouse gas emission reductions in Poland until 2020, whose strategic goal is “for Poland to join the efforts of the international community for the protection of the global climate through the implementation of the principles of sustainable development, particularly within the scope of the improvement of energy consumption, expansion of the national forest and soil resources, rationalisation of the use of raw materials and industrial products as well as rationalisation of waste disposal in a manner ensuring the achievement of maximum long-term economic, social and political benefits”. This goal is consistent with the objectives of the European Union climate policy in which effective climate protection has been given the highest priority in the strategy for sustainable development. This report has been prepared pursuant to Decisions 22/CP.7 and 25/CP.8 of the United Nations Framework Convention on Climate Change – UNFCCC and Decision No. 280/2004/EC of the European Parliament and of the Council of 11 February 20044) concerning a mechanism for monitoring Community greenhouse gas emissions and for implementing the Kyoto Protocol. 1)United Nations Framework Convention on Climate Change (Dz. U. of 1996 No. 53, item 238). 2) Kyoto Protocol to the United Nations Framework Convention on Climate Change (Dz. U. of 2005 No. 203, item 1684). 3) Intergovernmental Panel on Climate Change (IPCC). 4) OJ L 49 of 19.2.2004, pp. 1–8.

5
1. DESCRIPTION OF DOMESTIC POLICIES, STRATEGIES, PROGRAMMES AND INSTRUMENTS Poland’s Climate Policy. Strategies for greenhouse gas emission reductions in Poland until 20205) is the key governmental document formulating the national climate policy, which contains the basic objectives, priorities and tasks for economic sectors responsible for the major part of the national greenhouse gas emissions. Reduction of greenhouse gas emissions depends on the energy, industrial and forest policies as well as preferences used for the development of renewable energy sources. Work is underway to incorporate the Climate Convention and the Kyoto Protocol into the State Environmental Policy for 2007–2010, considering perspectives for 2011–2014. This document is to be approved by the Parliament (Sejm) of the Republic of Poland by the end of 2006. 1.1. Instruments Since the beginning of the1990s the Polish economy has been functioning and developing in line with the principles of a free market economy and now it is becoming more and more affected by globalisation processes. Poland is successfully making use of certain instruments to stimulate the desired behaviour of the users of the environment assuming that “environmental goods” have a certain value, which should be taken into account in the economic cost- -benefit evaluation. The concept based on the fundamental “polluter pays” principle is implemented by using a number of new instruments of a fiscal nature or by enforcing certain requirements or technical standards, which stimulate the desired behaviour of environmental end-users. They include: - promotion of production and services less-burdening to the environment and therefore aiming at more
sustainable consumption, - stimulation of multiple-use of goods, recycling and recovery of secondary resources, - development of equipment and facilities that serve environmental protection, - use of the principle of preventing pollution “at source” and promotion of implementing best available
techniques/best available practices (BAT/BEP), - securing and developing work places that are less burdening to the environment and serving the environment,
the so-called “green work places”, - strengthening and enlarging the export offer of Polish economic entities involved in environmental protection,
especially the export to the markets of Central and Eastern Europe and of the developing countries, - capacity-building in advisory services serving sustainable development, - involvement of financial institutions to support market-based undertakings in environmental protection and
sustainable development. Among those instruments are also the following ones: - emission standards for installations – permissible emission levels, - an obligation to measure emissions of pollutants, - environmental quality standards (qualitative requirements that have to be met in a specified period of time by
the environment as a whole or by its natural components), - air protection programmes prepared by the voivodship head (voivode), with the aim to meet the permissible
levels of substances in the atmosphere, - a system for air quality assessment (the assessment of the quality of air is performed under the State
Environmental Monitoring system, by using specified measurement or modelling methods), - an obligation to measure the levels of substances in the air (air monitoring within the State Environmental
Monitoring system (PMŚ) includes measurement and assessment of air pollution with a view to the observation of continental-nature phenomena and research in global-nature phenomena observation),
- permits for utilising the environment (environmental permits), - environmental management systems – voluntary commitments of organisations (manufacturing enterprises and
service companies, financial, educational, health protection institutions, public administration bodies, etc.) to take measures aimed at systematic reduction of environmental impacts connected with the type of activity involved,
- fees for releasing gases or dusts (particulates) – income from those fees forms the funds for environmental protection and water management,
- administrative fines (imposed for those exceeding the amounts or types of substances specified in permits as permitted to be released into the air),
- “green certificates” (certificates of origin for electric power produced from renewable energy sources).
5) Document approved by the Council of Ministers in November 2003.

6
1.2. Major legislative acts and strategic documents Legal acts that comply with the European Union legislation as well as other strategic documents that are approved by the Council of Ministers and the Parliament (Sejm) of the Republic of Poland are of great significance to climate protection. Table 1 presents selected legislative acts and strategic documents that are most relevant to climate change. Table 1. Selected legal acts and strategic documents Item no. Title of document Information
I. MULTI-SECTORAL ISSUES 1 Poland’s Climate Policy. Strategies for
greenhouse gas emission reductions in Poland until 2020 (adopted by the Council of Ministers on 4 November 2003)
The strategic goal of the climate policy is “for Poland to join the efforts of the international community for the protection of the global climate through the implementation of the principles of sustainable development, particularly in the scope of the improvement of energy consumption, the expansion of the national forest and soil resources, the rationalisation of the use of raw materials and industrial products as well as the rationalisation of waste disposal in a manner ensuring the achievement of the maximum long-term economic, social and political benefits”. This goal is consistent with the objectives of the European Union climate policy.
2 The Second State Environmental Policy (adopted by the Council of Ministers on 13 June 2000 and by the Parliament on 23 August 2001)
This document as one of its major goals sets out directions of actions to reduce the energy intensity of the economy and lays down priorities in using renewable energy sources.
3 Resolution of the Parliament (Sejm) of the Republic of Poland of 8 May 2003 on the adoption of the ”State Environmental Policy for 2003–2006, considering perspectives for 2007–2010” (M.P. No. 33, item 433)
The state environmental policy is implemented through changes in production and consumption patterns, the reduction of material intensity, water intensity and energy intensity of the economy, and by the use of best available techniques and good management practices.
4 Poland 2025: Long-term Strategy for Sustainable Development (adopted by the Council of Ministers on 26 July 2000)
The Strategy assigns high priority to environmental problems and considers international co-responsibility of Poland for environmental threats, including risks connected with climate change. This document indicates, inter alia, the need to reduce the energy consumption in the economy in connection with the activity leading to the fulfilment of commitments of the Kyoto Protocol.
5 The National Reform Programme for 2005––2008 for the Implementation of the Lisbon Strategy (adopted by the Council of Ministers on 27 December 2005)
The Programme points out a number of essential activities, such as: to facilitate the use of eco-technologies, to support energy efficiency and co-generation, to promote the development and modernisation of energy infrastructure, to provide assistance in developing renewable energy sources.
6 Act of 27 April 2001 – Environmental Protection Law (Dz.U. of 2006 No. 129, item 902)
The Act contains regulations concerning air protection so as to ensure possibly the best air quality.
7 Act of 20 April 2004 on substances that deplete the ozone layer (Dz.U. No. 121, item 1263, as amended)
The Act sets out mainly the provisions for using and marketing ozone depleting substances and products, equipment and installations containing these substances.
8 Act of 20 July 1991 on the Inspection for Environmental Protection (Dz.U. of 2002 No. 112, item 982, as amended)
This Act establishes the State Environmental Monitoring system and lays down the rights and duties of the State in the field of environmental control and execution of environmental legislation in all its elements (e.g., air, forests, waste control).
9 Act of 27 March 2003 on spatial planning and management (Dz.U. No. 80, item 717, as amended)
Spatial management plans constitute an instrument for sustainable development and spatial order. The Act lays down the principles of sustainable development.
10 Act of 20 March 2002 on financial support for investments (Dz.U. No. 41, item 363, as amended)
The Act lays down the principles and forms of providing financial support for businessmen undertaking new investments or for those creating new work places associated with these investments.
11 Act of 22 December 2004 on emission allowance trading of greenhouse gases and other substances (Dz.U. No. 281, item 2784)
A flexible mechanism in the form of an emission allowance trading scheme, pursuant to Directive 2003/87/EC establishing a scheme for greenhouse gas emission allowance trading within the Community and amending Council Directive 96/61/EC, has been transposed into the Polish law by the Act of 22 December 2004 on emission allowance trading of greenhouse gases and other substances.
12 Regulation of the Council of Ministers of 22 June 2004 on the adoption of the National Development Plan 2004–2006 (Dz.U. No. 149, item 1567, as amended)
The National Development Plan sets out a short-term national socio-economic strategy; it is an overriding national socio-economic plan, which takes account of the regional development strategies – major sectoral strategies (for agriculture, energy, housing, communication/transport) and horizontal strategies (education, innovation). Work on a document entitled the National Development Strategy for 2007–2013 is currently underway.
13 Water Management Strategy, elaborated by the Minister of the Environment in 2005
Measures laid down in the Water Management Strategy favour the adaptation of water management to changed climatic conditions. They mainly include measures to enhance the efficiency of protection against floods and effects of droughts, inter alia, by improving retention in river valleys, stimulating activities that capture water in soils by modernising irrigation or building and modernising flood control facilities (reservoirs, falls, flood control embankment, polders).
14 Strategy for changing the production and consumption patterns to those favouring implementation of the principles of sustainable development (adopted by the Council of Ministers on 14 October 2003)
One of the Strategy’s goal is to “eliminate, successively, economic activities that harmful to the environment and human health, to promote environment-friendly management systems, to change production and consumption models, and to revitalise the natural environmental status in all those places where the natural equilibrium has been disturbed”.

7
15 National Strategy for biodiversity preservation and reasonable use with an action programme6)
The ultimate goal of the Strategy is to preserve all natural environmental values and ensure sustainability in the development at all organizational levels. Biodiversity preservation must apply to the entire nature of Poland, irrespective of the form of its use or the degree of its transformation or damage. The National Strategy for biodiversity preservation and reasonable use with an action programme is taken account of in undertaking all activities connected with the protection and management of natural resources in Poland.
II. ENERGY SECTOR 16 Act of 10 April 1997 – Energy Law (Dz.U.
of 2006 No. 89, item 625, as amended) The Act lays down the principles for energy management and for saving energy resources, as well as supports the use of renewable energy sources. Of great significance is the requirement to develop consistent development plans for enterprises and communes (gminas), which, inter alia, need to include undertakings related to the use of renewable energy sources.
17 Energy Policy of Poland until 2025 (adopted by the Council of Ministers on 4 January 2005)
The document defines measures that need to be taken to ensure national energy security, competitiveness of the economy and its energy efficiency as well as environment protection.
18 Strategy for renewable energy development (adopted by the Council of Ministers on 5 September 2000 and by the Parliament (Sejm) on 23 August 2001)
The Strategy assumes an increase of the share of renewable sources in the national fuel and energy balance by 7.5% in 2010 and by 14% in 2020 in the structure of primary energy carrier consumption. An increase in the use of renewable energy sources (RES) will, above all, facilitate reaching the targets set in environmental policy related to emission reduction of pollutants that are responsible for climate change, and acidifying substances.
19 Act of 18 December 1998 on supporting thermo-modernisation projects (Dz.U. No. 162, item 1121, as amended)
The Act is targeted at the reduction of energy used for heating buildings and for supplying hot water; at the reduction of energy losses in local heating networks and local heating sources, as well as at shifting from conventional to renewable energy sources.
III. INDUSTRY 20
See item no. 12. Sectoral strategies for different industrial branches are incorporated into the National Development Plan. At present the preparation of a document entitled the State development strategy for the years 2007–2015 is underway.
IV. TRANSPORT 21 State Transport Policy for the years 2006–
2025 (adopted by the Council of Ministers on 29 June 2005)
The Policy’s aim is to achieve a transportation system that would be technically, spatially, economically, socially and environmentally sustainable under the country’s developing market economy taking account of international cooperation, mainly at the European scale.
V. AGRICULTURE 22 Act of 28 November 2003 on supporting
the development of rural areas with financial resources originating from the Guarantee Section of the European Agriculture Guidance and Guarantee Fund (Dz.U. No. 229, item 2273, as amended)
The Act lays down the tasks and properties of organisational units and bodies in supporting the development of rural areas from resources originating from the Guarantee Section of the European Agriculture Guidance and Guarantee Fund, related to the support provided, inter alia, for: agricultural activity on less-favoured areas, for agri-environmental and animal welfare improvement measures, for agricultural land afforestation and adaptation of farms to European Union standards.
23 Rural Development Plan for the years 2004–2006 (M.P. No. 56, item 958)
The Plan sets out objectives, priorities and principles for supporting sustainable development in the rural areas.
VI. FORESTRY 24 Act of 28 September 1991 on forests
(Dz.U. of 2005 No. 45, item 435, as amended)
The Act lays down the principles for preserving, protecting and increasing forest resources, as well as the principles of forest management in conjunction with other elements of the environment and of the national economy.
25 National Programme for the Augmentation of Forest Cover (KPZL), adopted by the Council of Ministers in 1995 and updated in 2003
This Programme sets out measures targeted at increasing the national forest cover from 28% to 30% by 2020. It determines the quantitative transfer of land from agriculture to forestry, and presents a complex action plan towards rationalization of the natural land-use structure of the country’s natural habitat area. New afforestations are elements of the implementation of the multifunctional and sustainable development of the country.
VII. WASTE 26 Act of 27 April 2001 on waste (Dz.U. No.
62, item 628, as amended) The Act sets out the rules for handling waste in a way that ensures the protection of human life and health as well as environmental protection pursuant to the principle of sustainable development, and in particular lays down the rules for waste generation or waste reduction and for the limitation of their adverse effects on the environment, and the rules for waste recovery and treatment.
27 Resolution no. 219 of the Council of Ministers of 29 October 2002 concerning the national waste management plan (M.P. No. 11, item 159)
The Plan includes measures for preventing and minimising waste, for providing recovery, mainly recycling of waste, waste treatment and landfill that would be safe for human health and the environment.
28 Act of 11 May 2001 on packaging and packaging waste (Dz.U. No. 63, item 638, as amended)
The Act lays down the requirements with which packaging must comply with regard to environmental protection, as well as rules for handling packaging and packaging waste that ensure human life and health protection and environmental protection pursuant to the principle of sustainable development.
29 Act of 11 May 2001 on the duties of businessmen in managing certain wastes, and on product fees and deposit charges (Dz.U. No. 63, item 639, as amended)
The Act introduces a new economic instrument targeted at rationalising the management of packaging waste and end-of-use product waste.
6 ) Document approved by the Council of Ministers on 25 February 2003.
8
1.3. Domestic policies and measures Progress in the implementation of different measures for reducing greenhouse gas emissions is differentiated and it depends to a significant extent on the compliance of a given measure with the economic priorities of a specific sector. Domestic emission reduction targets The national greenhouse gas emission reduction target included in Annex B to the Kyoto Protocol (-6% in relation to the 1988 base year level) remains unchanged and will be achieved by Poland. Complex measures for reducing emissions of greenhouse gases: - the scheme for greenhouse gas emission allowance trading, - the use of the Joint Implementation Mechanism (JI), - monitoring of emissions and of the implementation of the Kyoto Protocol – monitoring of greenhouse gas
emissions is carried out on a current basis and its results are presented in the national inventory reports. Implementation of the provisions of the Kyoto Protocol is subject to periodical evaluations, which are submitted through National Communications to the Conference of the Parties to the Convention,
- financial mechanisms supporting measures for reducing emissions of greenhouse gases – financial mechanisms stimulating emission reduction of these gases are introduced by the National Fund for Environmental Protection and Water Management (NFOŚiGW), EcoFund and GEF in order to support activities related to, inter alia, the improvement of energy efficiency. For example, support provided by the NFOŚiGW has led in 2001–2003 to the achievement of CO2 emission reduction by 1,135.382 Gg/year in the course of the following undertakings: modernisation of heating systems (403.856 Gg/year), fuel conversion (353.751 Gg/year), renewable energy sources (212.344 Gg/year) and enhancement of energy efficiency (165.431 Gg/year). The co-financing of projects by the EcoFund has in 2000–2004 led to a reduction of emissions of carbon dioxide and methane in the municipal-household sector in the following fields:
CO2 CH4
[Gg/year] [Gg/year]
Modernisation of heating systems 235.110 - Fuel conversion 1 690.276 - Utilisation of heat from waste 274.298 3.133 Renewable energy sources 379.695 - Total 2 579.379 3.133
In general, support provided by these institutions has led to an annual CO2 emission reduction amounting to 3,714.761 Gg and CH4 emission reduction reaching 3.313 Gg. The Global Environment Facility (GEF) has provided financial resources for the following projects: 1. In 1995–2004 – a project on the conversion of coal to gas (Coal-to-Gas Project). The project has led to the
reduction of CO2 emissions by almost 65% in the course of conversion of small coal-fired boilers to gas boilers, and to the reduction of CO2 emissions by 28% as a result of energy efficiency growth in the new residential buildings.
2. In 2000–2004 – the Zakopane/Podhale Geothermal District Heating and Environment Project. The project was
co-financed by: the NFOŚiGW, EcoFund, USAID, EU, Denmark, local sources and commercial banks. In 1995––2004 a CO2 emission reduction by 2,700 Gg was obtained in the course of project implementation. Also emissions of other air pollutants declined and an improvement of air quality was achieved by replacing local coal- and coke-fired boilers in seven towns: Zakopane, Nowy Targ, Kościelisko, Szaflary, Bańska Niżna, Biały Dunajec and Poronin. The new heating system embraced the following elements: 5 geothermal wells, installation of a new geothermal district heating plant with a capacity of 60–70 MW, installation of two new gas- -fired peaking heating plants (42 MW in Zakopane and 12 MW in Nowy Targ) and developing almost 100 km of district heating network, including transmission and distribution heating network and end-user connections.
3. A project named Rural Environmental Project realized in 2000–2004 has been co-financed by the World Bank,
the Nordic Environmental Finance Corporation, Phare, NFOŚiGW and contributions of the beneficiaries and of the self-governments. The project’s objective was to build facilities for storing animal manure in almost 1,000 private farms. The project covered app. 24 thousand animals and app. 29 thousand ha of agricultural land. Its implementation resulted in a reduction of emissions of nitrogen compounds by 17 kg N/ha. It is expected that as

9
time goes on this effect will improve to 28 kg N/ha, which would make an annual reduction of nitrogen emissions into the environment of almost 800 Mg per year.
4. The Kraków Energy Efficiency Project has been implemented since 2004 and its accomplishment is expected in
2007. The project is co-financed by the International Bank for Reconstruction and Development (IBRD). The project’s aim is to improve the energy efficiency of the heating systems of Małopolskie Voivodship within the region of Cracow and to remove barriers in transactions in the market economy, as well as to raise awareness regarding energy efficiency in buildings. Replacement of coal-fired boilers with boilers fired by low-sulphur heating oil or low NOx emission oil/gas-fired burners will reduce CO2 emissions, and Polish emission standards for SO2 and NOx will be met.
5. Integrated Approach to Wood Waste Combustion for Heat Production. This project has been launched in 2001
and should be finalised by September 2006. The project’s objective is to strengthen the development of the energy market based on wood-like waste (biomass) as a substitute for fossil fuels by establishing an inter- -communal partnership public and private company on the territories of the Jordanów and Bystra-Sidzina communes. The specific project’s goals include: - increased use of wood waste as fuel for heating homes in Poland, - the development of local wood waste purchasing (trade) and management markets for heat production
on commercial terms, - integration of investments related to boiler replacement with activities of energy consumers targeted at
reducing heat consumption, - an increase of public approval for utilising wood waste as a modern, economically feasible and widely
accessible type of fuel, - an increase of economic competitiveness of converting coal to biomass in relation to coal-to-gas, to -oil
or to -electricity conversion. 6. Gdańsk Cycling Infrastructure Project – its duration has been planned for 2001–2005. The project’s objectives
were: - to reduce CO2 emissions from road traffic in total by 250 Gg within 10 years starting from the fifth year
after accomplishing the investment, - proportionate reduction of toxic emissions from the traffic, - to increase the share of bicycle trips to the level of 5–10% of all trips in Gdańsk, - to improve road traffic safety, - to increase the mobility of all groups of inhabitants; to create a pattern for a model infrastructure
investment linked with an information campaign to be utilized in other towns and countries. 7. The Polish Energy Efficiency Motors Programme (PEMP) will be realised in 2004–2009. The project is co-
financed by several domestic institutions. The aim of the project is to achieve an increase in the sales of power efficient motors to the level of 30% of the total motors’ market by 2010 and to obtain energy savings of 55.7 GWh in 2006, and 231.6 GWh in 2010 by optimising electric motors and drives; as well as a reduction of the national greenhouse gas emissions by 885 Gg CO2 by 2006 (accumulating during the project life-time) and by 3,700 Gg CO2 by 2010, including the medium-term impact (accumulating during the investment life-time). According to the estimates, the countrywide use of energy efficient drives would decrease the expenditures of enterprises for electricity by as much as 240 million USD annually.
8. Small (GEF) projects:
- 3 projects in the scope of biofuel production at a total of 27,742 USD including two installations for producing rape oil with a capacity of 400 litres of oil and an agri-refinery,
- 15 projects related to the conversion of fuels from coal to biomass in 63 boiler plants amounting to a cost of 43,601 USD with a total capacity of almost 2,800 kW,
- growing a pilot plantation of 20 ha of basket willow (Salix viminalis), - 5 projects related to the conversion of coal heating to solar collectors amounting to a sum of 135,653
USD with app. 150 m2 of collectors installed as an out-come, - 1 project on the promotion of renewable energy sources among school children amounting to a sum of
11,370 USD (two boilers with a total capacity of 800 kW, and - 7 projects related to the development of almost 700 km of bicycle routes and trails at a total cost of
232,251 USD.

10
1.4. Energy sector The energy sector secures all manufacturing activities and is the major indicator of the country’s economic development. The following mineral resources create the basis for the Polish energy sector: - hard coal – its extraction has been declining over the last years due to the liquidation of the old and
economically unprofitable mines, and the use of energy saving technologies and machinery at energy users. Hard coal is found in the Górnośląskie (Upper Silesian), Dolnośląskie (Lower Silesian) and Lubelskie Coal Districts,
- brown coal (lignite) – extracted in open pits (the Konińskie, Turoszowskie and Bełchatowskie Coal Districts), - crude oil – its extraction in Poland is scarce, Poland imports oil from the Russian Federation, the Arab countries
and from the North Sea countries, - natural gas – the domestic extraction satisfies 40% of Poland’s gas demand, the remaining quantity is imported
from the Russian Federation and Ukraine, - other energy sources, clean hydropower, geothermal energy, wind power – increasing share from year to year. Renewable energy Biomass (especially wood and wood waste) and hydro energy, and to a much smaller extent also wind energy and geothermal and solar energy are among the most commonly currently used sources of renewable energy in Poland, which provide around 5% of the primary energy total. A decrease in the extraction of coal and an increase of its prices, beside promotion connected with the implementation of innovation technology, environmental protection and sustainable development significantly contribute to the increase of the primary energy use. Solid biomass, mainly fuel wood and wood waste is used mainly in low and medium capacity boilers in app. 110 thousand households, especially in rural areas (the total capacity of these boilers is app. 5,500 MWth), as well as in app. 150 installations in local municipal heating plants (a total of app. 600 MWth), and in several co-incineration installations for biomass and fine coal in autoproducing CHP plants (a total of app. 330 MWth)7). Straw is used for energy purposes in app. 30 local heating installations (with a total capacity of app. 50 MWth). It is also estimated that app. 150 straw-fired boilers (with a total capacity of app. 45 MWth) are installed in small and medium agricultural farms. The use of biogas is developing in Poland, mainly landfill gas and gas from wastewater treatment plants for the production of electric power or combined heat and power production. The total capacity of the 28 existing installations using landfill gas is 9 MWe of electric power and 5 MWth of thermal power, whilst app. 30 installations using gas from wastewater treatment plants amount to a total of 14.5 MWe and 24.5 MWth, respectively. However, 20 agricultural biogas plants that were built in the 1980s are currently out of operation. The biogas production level in Poland is estimated at app. 62 ktoe8) (in 2002) and is similar to the production level in Denmark. However, the biogas production scale in Poland per 1000 inhabitants is much smaller than in Denmark, and also smaller than the average of the old European Union Member States (EU-15) and reaches 1.6 toe (13 toe in Denmark, 7.4 toe on average in the EU-15). Bioethanol and fatty acid methyl esters are the main biocomponents that are produced and used in fuels in Poland. According to data for 2004 the production capacity of the Polish biorefineries for these biocomponents was around 80 million litres of bioethanol and 120 thousand tonnes of esters annually. The share of petrol with 5% of bioethanol added, in the total amount of petrol produced by the largest Polish refineries in 2005 ranged from 35% to 60%. This kind of petrol is to be one of the major types of petrol produced by these refineries in future. The second half of 2006 should see an introduction into the common use of the diesel oil with up to 5% of additive of the methyl esters, and of a biofuel – diesel oil with 20% of ester additives. Wind energy is used in Poland by public wind plants connected to the power grid network, and various small power plants operating for their own purposes of individual farms and households. In 2004 the total installed capacity of wind plants amounted to 65 MW, and electricity production totalled 142 GWh. The largest existing wind farms are situated at the Baltic Sea coast – in Zagórze near Wolin (30 MWe) and in Cisowo near Darłowo (18 MWe). The interest in wind power is increasing. Construction of further wind farms is planned at the coast of the Baltic Sea, at sea (near Słupsk), as well as in other regions of Poland, particularly in the north and north-east and south-east. It has been estimated that investments under construction will potentially account for a total capacity exceeding 1,000 MWe.
7) Installations for biomass and fine coal co-incineration in autoproducing CHP plants (330 MW in total) include 3 installations in pulp and paper
industry and in furniture manufacturing – data from a report of the Energy Market Agency entitled Long-term prognosis for the development of fuel and energy management until 2025.
8) 1 ktoe = 1 kilotonne of oil equivalent.

11
Hydro energy is used in Poland for electricity generation. The total capacity of operating hydropower plants is almost 870 MWe. The majority of this capacity originates from around a dozen of large power plants. The installed capacity of over 600 small power plants of below 5 MWe, amounts to around 178 MWe. It has been estimated that app. 650 existing dams (after their appropriate modernisation,) and app. 400 that are planned could be potentially used for putting into operation small hydro plants. The total capacity of these power plants could be close to 200 MWe. Geothermal energy, whose share in the structure of primary energy use has been estimated at 0.06%, is mainly used in central heating systems and for water heating in the housing sector and in public buildings, and also in balneology, fish breeding and in greenhouse and drying room heating systems. The existing geothermal plants with the total capacity of app. 34 MWth generate heat mainly for housing purposes. The level of geothermal energy used in balneology, fish breeding and in greenhouse and drying room-heating systems is estimated at 20 MWth. An increase in the utilization of heat pumps has also been observed in Poland since several years. Instead of using heat from water with elevated temperatures, the energy is used from the ground and shallow groundwaters. There are almost 1,000 installations of this kind with the total capacity of app. 12 MWth. Geothermal plants are located in Bańska Niżna (Podhale), Pyrzyce, Mszczonów, Uniejów, Słomniki and Stargard Szczeciński. The level of solar energy use in Poland is insignificant. It is assumed that app. 60 solar air energy-collecting systems with the surface of almost 6,000 m2 are used for drying agricultural crops. There are also a few thousand water heating solar systems for heating in-door air and providing hot water, mainly for the housing sector (in single and multi-dwelling buildings), summer houses and for sport, leisure and tourist facilities (their total surface is estimated at app. 33,000 m2). The overall surface of solar energy collectors that are installed in Poland amounts to app. 39,000 m2, which gives around 1 m2 per 1,000 inhabitants (the EU average is 34 m2). 1.4.1. Policy The Energy Policy of Poland until 20259), which was adopted by the Council of Ministers on 4 January 2005, is a principle document formulating the basis for energy management in Poland. It lays down measures to ensure energy security, competitiveness of the economy and its energy efficiency as well as environment protection. The Polish energy policy is based on the following principles: - harmonious energy management under social market economy, - full integration of the Polish energy sector with the European and global energy sectors, - market competitiveness and support for renewable energy sources. This Policy creates priorities and lays down measures, such as: monitoring of the level of energy security, reduction of energy costs and improvement of energy efficiency, as well as strengthening the role of self-governmental level administration towards energy enterprises. 1.4.2. Measures Legislative, financial and organizational measures: - Promotion of renewable energy sources. Introduction of financial mechanisms supporting energy
production from renewable sources – the share of energy produced from renewable sources in the total energy production is systematically rising and in 2004 it accounted for 5.49%. Promotion of renewable energy sources includes: - introduction of financial mechanisms in 2002 supporting energy production from renewable sources in
the form of exemptions from excise tax on the sales of electricity from RES, - introduction of a supporting mechanism, under the Energy Law, in the form of an obligation, imposed on
energy enterprises involved in energy selling to the end-users, to obtain a specified number of certificates of origin for electricity produced from RES and to submit them to the President of the Energy Regulatory Office for cancellation or to pay a substitute fee, as well as to enable the marketing of property rights from these certificates. This mechanism is supplemented by an obligation for energy enterprises, acting as officially authorised sellers, to purchase all electricity generated from renewable sources within the territorial activity of the authorized seller, as well as by a system of fines imposed on energy enterprises for incompliance with the aforementioned duty. Financial resources obtained from
9) M.P. of 2005 No. 42, item 562.

12
the substitute fees and from fines feed the budget of the National Fund for Environmental Protection and Water Management and are exclusively intended for providing financial support for investments connected with renewable energy sources. An additional support is an exemption from excise tax on the sales of electricity from renewable energy sources (RES). In 2004 the level of CO2 emissions that was avoided due to the substitution of conventional power plants with renewable energy sources totalled 2,893 Gg,
- issuance of certificates of origin for electricity produced from renewable energy sources, An increase in the production and use of renewable energy in 2002–2004 results from the following measures that have been taken: - introduction of an obligation to purchase energy from renewable sources, which caused an increase of
energy purchased from these sources by 318,622 MWh in 2004 in relation to the level of 2001. The duty to purchase such energy allows for avoiding 288.353 Gg of CO2 emissions per year,
- introduction of financial mechanisms in 2002 supporting energy production from renewable sources in the form of exemptions from excise tax on the sales of electricity from RES,
- granting certificates of origin for electricity produced from these energy sources. This mechanism is strengthened by a system of fines imposed on energy enterprises for incompliance with the duty to obtain a specified number of certificates. Moreover, it is possible to decrease by 50% the costs related to the connection to the network of renewable electric power sources and to take advantage of other discounts for producing this type of energy.
- Promotion of combined heat and power production – as shown in Table 2, the level of combined heat and
power production and process efficiency are systematically increasing. As a result, the average CO2 emission in 2000–2004 has decreased by 33,534.158 Gg per year. At the same time the process of fuel conversion to more environmentally sound fuels, including those reducing greenhouse gas emissions, is underway in power plants and in combined heat and power plants,
Table 2. Combined heat and power production, and transformation efficiency in 2000–2004
Specification 2000 2001 2002 2003 2004 Fuel energy input [TJ] 1528042 1527571 1514717 1605269 1600696 Electricity production [GWh] 141032 141340 140159 148214 150326 Combined heat production [TJ] 196780 209276 205570 225409 219274 Efficiency [%] 46.10 47.01 46.88 47.28 47.51 Source: IEA STATISTICS – Electricity Information 2005 & 2006. - Introduction of “green certificates”, certificates of origin for electric power produced from renewable
energy sources – these certificates have been introduced under the Act on Energy Law, - Introduction of a system of incentives for enterprises to undertake investments leading to energy
saving – the system of incentives includes: - preferential credits granted by a system of Funds for Environmental Protection and Water Management
for modernising energy production sources and for thermo-modernisation activities, - donations provided by the EcoFund foundation for modernising energy production and for renewable
energy sources, - donations from the European funds within the framework of the Integrated Operational Programme for
Regional Development, launched in 2004. - Introduction of a system of incentives for the public sector to undertake investments leading to rational
energy consumption – the system of incentives includes the aforementioned credits and donations, as well as donations of the Global Environment Facility and mechanisms of the Act on supporting thermo-modernisation activities in public buildings (see Table 1),
- Modernisation of existing energy production technologies and enhancement of energy transformation efficiency – modernisation of technology has been carried out in more than a dozen public energy plants and CHP plants, by, inter alia, putting into operation of fluidised boilers, by introducing biomass co-incineration and adjusting technology to combined energy production. Changes of the average transformation efficiency in the public energy sector in 2001–2004 (Table 3) caused a reduction of CO2 emissions by almost 2,536.968 Gg/year.
Table 3. Transformation efficiency in the public energy sector in 2001–2004
Year
Efficiency [%] 2000 2001 2002 2003 2004
45.29 45.90 45.97 45.96 46.64
Source: Central Statistical Office (GUS).

13
- Introduction of the requirements concerning energy efficiency of new water heating boilers fired with liquid and gaseous fuels10),
- Introduction of key requirements regarding energy efficiency for cooling equipment (appliances)11), - Energy efficiency labels – since 2001 an obligation has been introduced of the labelling of household
appliances, however no market survey has been carried out to enable a quantitative assessment of the effects of this activity. Fragmentary studies prove that e.g. in the case of use of energy-saving refrigerators CO2 emission may decline by almost 77 Gg/year, and in the case of fluorescent lamps by nearly 1.6 Gg/year,
- Improvement of the efficiency of electrical household appliances – measures leading to the improvement of efficiency of such equipment are subject to the GEF project on Polish Energy Efficiency Motors Programme (described in Chapter 1.3),
- The use of methane from mines for heat generation – measures connected with de-methanising are taken in hard coal mines and their aim is to utilise this gas for industrial purposes. The level of methane in-take from mines in the given period of time is shown in Table 4. This measure enabled to obtain a total reduction of CO2 emissions by almost 367.366 Gg,
Table 4. Recovery of high-methane natural gas from hard coal mines Amount of methane captured Year
[million m3] [TJ] 2000 226 7431 2001 330 10890 2002 297 9902 2003 344 11287 2004 368 12092
Source: GUS.
- Exemption from an excise tax on electricity production based on methane from hard coal mines – an exemption from an excise tax on electricity production from methane released and captured during in-depth mining works is used.
1.5. Industry Hard coal mining A reduction of the production capacity as well as a declining impact of mines on the environment is observed in the mining sector. Employment reduction in the mining industry was compensated by special funds of the so-called Mining Social Package. Chemical industry This industry sector demonstrates constant and slow increase of production and sales. In effect of restructuring measures the property structure of the chemical industry has changed, especially in large enterprises – small and medium-size plants almost entirely belong to the private sector. Production technologies have undergone intensive modernisation. Direct foreign investments play a significant role in modernizing and restructuring the chemical industry. Chemical industry is highly capital consuming and strongly dependent on the sources of the resources. Its typical feature is also a very high production of semi-products, which are later processes by other industry sectors. The chemical industry is composed of the following branches: 1. Great chemical synthesis (WSCH), which includes:
- petroleum industry – based on crude oil processing, - production of mineral fertilisers, - soda industry – based on rock salt and limestone,
2. Low-tonnage chemistry – production of pharmaceuticals, cosmetics and auxiliary products, 3. Chemical processing – manufacturing of end-products based on high-tonnage products, which includes:
- rubber industry, - plastics industry, - paint and vanish industry, - distribution and trade of chemical agents.
10) Act of 30 August 2002 on compliance assessment (Dz.U. of 2004 No. 204, item 2087, as amended) implementing Council Directive 92/42/EEC
of 21 May 1992 on efficiency requirements for new hot-water boilers fired with liquid or gaseous fuels (OJ L 167 of 22.06.1992, p. 17). 11) Act of 30 August 2002 on compliance assessment (Dz.U. of 2004 No. 204, item 2087, as amended) implementing Directive 96/57/EC of the
European Parliament and of the Council of 3 September 1996 on energy efficiency requirements for household electric refrigerators, freezers and combinations thereof (OJ L 236, 18.09.1996, p. 36; Polish special edition Chapter 12, vol. 1, p. 305).

14
Cement industry The cement industry in Poland encompasses around a dozen of plants producing cement. High season-dependence is a characteristic feature of the domestic cement market, which derives from the climatic conditions in Poland. In the course of privatization the unit heat consumption for burning clinker has decreased by 22% compared with the level achieved in the early 1990s. Thus, the amount of off-gases emitted to the atmosphere per unit product also declined. Introduction of modern management methods and process control, production concentration and assigning high priority to economic effectiveness and environmental protection currently allows to classify the cement industry as the leading industries in Europe - technically and organizationally. All these measures have led to the minimisation of cement industry’s impact on the environment in our country. As compared with the late 1980s carbon dioxide emissions dropped by over 25%. The cement industry in its activity uses large amounts of waste as secondary resources for the production of clinker and cement additives (substitution of non-renewable fuels by waste). Alternative fuels are also used in this industry, saving natural fuel resources. Iron and steel industry Iron and steel metallurgy is a basis for supplying materials for the general construction, road, water, energy and municipal industries – it provides basic materials for the electro-machinery, ship-building, machinery, transport, metal and extraction industries. Refrigeration sector Measures taken in the refrigeration industry are targeted at replacing gases used in cooling equipment that are subject to commitments of the Montreal Protocol as well as at reducing energy consumption in production processes. The refrigeration sector is preparing to introduce Regulation of the European Parliament and of the Council on certain fluorinated greenhouse gases, whose aim is to reduce the emission of certain greenhouse gases containing fluorine12) by introducing monitoring of leakage from equipment and restrictions of use for products and equipment containing these gases (regulation also includes placing on the market prohibitions of the products and equipment containing F- -gases listed in Annex II). In Poland HFCs are used in the cooling sector and in air conditioning, both as single substances (mainly HFC-134a) and also as mixture components (HFC-134a, HFC-143a and HFC-125). Currently, PFCs are not used in Poland in the refrigeration sector. 1.5.1. Policy In industry priority has been given to restructuring of the following sectors: hard coal, zinc and lead mining, iron and steel metallurgy, sulphur mining and processing as well as cement and chemical industry. Furthermore, among other priorities addressed to the entire industry there are: privatization and restructuring of economic entities and overall industrial sectors, as well as consolidation of entities to strengthen their economic force, research and development activity, innovation growth and implementation of provisions pursuant to the updated Lisbon Strategy, inflow of direct foreign investments, public assistance and its proper assignment and elimination of barriers in business sector development. 1.5.2. Measures Legislative and organisational measures: - Improvement of technical standards for equipment and facilities – such measures result in an
improvement of the energy effectiveness of industrial production13) (in the iron and steel industry it results from the modernisation of natural gas-fired tunnel furnaces),
12) Fluorinated greenhouse gases (the so-called F-gases) means hydrofluorocarbons (HFCs), perfluorocarbons (PFCs) and sulphur
hexafluoride (SF6). In the majority of cases they are applied as substitutes for the commonly used so far substances that deplete the ozone layer (ODS), chlorofluorocarbons (CFCs) and hydrochlorofluorocarbons (HCFCs), which apart from having adverse effect on the ozone layer, also belong to greenhouse gases. Regulation (EC) No. 842/2006 of the European Parliament and of the Council of 17 May 2006 on certain fluorinated greenhouse gases (OJ L 161 of 14.6.2006, pp. 1–11).
13) Implemented Council Directive 92/42/EEC of 21 May 1992 on efficiency requirements for new hot-water boilers fired with liquid or gaseous fuels (OJ L 167 of 22.06.1992, p. 17) and Directive 96/57/EC of the European Parliament and of the Council of 3 September 1996 on energy efficiency requirements for household electric refrigerators, freezers and combinations thereof (OJ L 236, 18.09.1996, p. 36).

15
- Implementation of best available techniques – integrated permits are granted to installations and plants implementing BAT/BEP14). The use of best available techniques in the iron and steel industry was based on replacing open-hearth furnaces with electric converters, optimisation of the heating capacity of heaters, conversion from blast-furnace gas and coke-oven gas to natural gas, and modernisation of the process of steel smelting. In effect CO2 emissions decreased by about 240 Gg,
- Reduction of methane emissions from production processes and fuel distribution – for this purpose certain regulations on hermetic air-tight sealing of fuel distribution have been enacted15),
- Development of a set of measures supporting the activity of small and medium enterprises, mainly in the field of introducing innovation and capacity improvement – mechanisms supporting the activity used, inter alia, with regard to small and medium enterprises. In 2001–2003 the programme for the development of innovation covered 18.3% of small and 37.1% of medium enterprises. In the majority of cases it applied to manufacturing enterprises in the field of technical equipment and devices, as well as construction,
- Promotion of environmentally sound and effective practices and technologies in industrial activity. Supporting the development of environmentally friendly and technically profitable (feasible) methods for reducing greenhouse gas emissions – to promote environmentally friendly technologies a series of folders, which disseminate information on best available techniques for different production areas (for instance, guidebooks for brickyards and titanium white and soda production plants) have been published,
- Setting of priorities for research and development targeted at sophisticated ecological and material- and energy-saving production technologies and provision of their financing – many research and development (R&D) projects have been carried out, including a project entitled Approximation of the working conditions in Poland to the standards of the European Union. Furthermore, the following R&D projects have been prepared or undertaken: - Improvement of innovation development systems in production and maintenance processes
in 2004–2008, - Safety of exploitation of the technical infrastructure threatened by corrosion effects, - The state energy policy and energy security, and the management of natural and energy resources
taking account of the European Union standards and of environmental requirements. - Technological modernisation in industrial plants, reduction of CO2 emissions in iron and steel industry
– technological modernisation in the mineral industry has led to a decrease in CO2 emissions from 10,573 Gg in 2001 to 7,588 Gg in 2004 as a result of energy efficiency improvement in the production of clinker from 3,732 kJ/kg to 3,692 kJ/kg for the dry method and from 5,795 kJ/kg to 5,432 kJ/kg for the wet method, while maintaining the same production level. In metallurgy measures aimed at energy recovery from waste have led to a reduction of CO2 emissions by almost 450 Mg/year. These measures were based on fuel conversion from coal to gas in boilers; the reduction of electricity unit consumption in the production of ferrosilicon; modernisation of heating furnaces and furnaces for thermal processing; construction of installations using waste heat from rotary sinter coolers on sinter belt, purchasing and building of energy-saving ignition furnaces in sinter plants and building of installations for converter gas recovery.
1.6. Transport The following are the most significant features of transport: - increased general mobility of the inhabitants of Poland, fast development of individual transportation means and
a dropping share of public passenger transport as well as rapid increase of passenger air transport, - insufficient development and quality of transport infrastructure, which does not allow the infrastructure to keep
up with the trends in place regarding the scale and ways of transportation (especially in road and air transport). It also does not keep up with the needs connected with the necessity to influence such trends, which are regarded as negative in order to limit their range and dynamics (overloaded road transport, especially on major national roads and in urban areas; lack of adaptation to the traffic loads and bad condition of road surface; bad technical quality of a significant part of the collective transportation fleet and of railway and tramway tracks; lack of sufficient fitting with sophisticated systems of traffic control).
14) The need to obtain such permits results from the Act on Environmental Protection Law, which implements Council Directive 96/61/EC of 24
September 1996 concerning integrated pollution prevention and control (OJ L 257 of 10.10.1996, p. 26, as amended; OJ EU Polish special edition, Chapter 15, vol. 3, p. 80).
15) Regulation of the Minister of Economy of 21 November 2005 on technical conditions that have to be met by liquid fuel bases and stations, long-range transmission pipelines used for transporting crude oil and petroleum products, and their location (Dz.U. No. 243, item 2063).

16
1.6.1. Policy The State Transport Policy for 2006–2025 (alike the previous policy) sets out its major goal to fulfil the rational expectations of the public to modernise the basic transportation system and ensure high quality transport services, taking due account of, inter alia, the need to reduce the negative impact of transport on the environment and the living conditions. This requires parallel action in three directions: - to optimize traffic and transportation growth rate, - to have influence on the way passengers or goods are transported to use to a maximum extent those means of
transport that are least harmful to the environment, - to use technical and organisational solutions that reduce unfavourable environmental impacts. The policy directions that are followed include, in particular, the improvement of the state of all category public roads and development of a network of motorways and express roads, modernisation of railways and improvement of the state of the railway infrastructure; safety improvement in transport; improvement of the quality of public transport in towns, the development of aviation service market and improvement in the operation of the inland water transport. The greenhouse gas reduction reserves in the transportation sector are to be found in the improvement of the organisation of passenger and freight shipment, and with associated infrastructure undertakings, as well as in the use of biofuels. Preparations are underway to implement the Directive of the Council and of the European Parliament on emissions from air-conditioning systems in motor vehicles, whose aim is to reduce emissions of fluorinated gases (F-gases)16). 1.6.2. Measures Legislative and financial measures: - Promotion and use of biofuels – on 2 October 2003 the Parliament adopted an Act on biocomponents used
in liquid fuels and liquid biofuels17). Currently, work on the amendment of the act on biofuels is under-way; a system of taxes for fuels has been introduced, which promotes alternative fuels, an additional instrument has been used in the form of fees for making use of the environment, which are generally imposed for utilising motor fuels produced from non-renewable resources; excise duty levels for LPG18) that have been introduced are much lower than the ones for petrol or diesel oil, which makes this type of fuel privileged. This has also caused greater interest of users in fitting their cars with LPG installations, which led to the development of service facilities and a distribution network for this fuel,
- Introduction of a road tax – work is underway to introduce charges for using road infrastructure, dependant on the distance driven and the ecological category of a vehicle,
- Energy efficiency changes in road transport – differentiated fee rates for driving on domestic roads have been introduced depending on the level of exhaust gas emissions from vehicles,
- Promotion of “environmentally clean” motor vehicles – a system of fees for making use of the environment has been established, which distinguishes vehicles with lower emissions of pollutants or with lower fuel consumption. Moreover, an information system on fuel consumption and CO2 emissions in the marketing of new passenger cars has been introduced. Additionally, control of exhaust gas emissions as an obligatory element of the vehicle technical control plays an important role in this area.
Technical measures: - Construction of motorways, by-pass roads and express roads – in 2000–2004 the implementation of the
programme for building motorways and modernising the road network has been intensified and this resulted in the building of almost: 297 km of motorways, 38 km of express roads, and 38 by-pass roads, which improved road traffic flowability and reduced energy losses resulting from congestion,
- Improvement of vehicle energy effectiveness, including measures connected with vehicle construction – as a result of technological progress declared by the producers of passenger cars and decisions of car buyers the consumption of fuels dropped markedly and thus CO2 emissions decreased. For instance, a unit emission of CO2 from passenger cars decreased from the level of 165 g/km in 2001 to 154 g/km in 2004. Introduction of
16) Directive 2006/40/EC of the European Parliament and of the Council of 17 May 2006 relating to emissions from air-conditioning systems
in motor vehicles and amending Council Directive 70/156/EEC (OJ L 161 of 14.6.2006, pp. 12–18). 17) Dz.U. of 2003 No. 199, item 1934, as amended. 18) Liquid Petroleum Gas.
17
noise limitations at airports in air transport is connected with the use of aircrafts with engines with technologically lowest possible fuel consumption,
- Technical measures connected with vehicle construction – there is an on-going progress in the improvement of fuel consumption efficiency in new passenger cars, trucks, buses, rail vehicles and aircrafts put into service in Poland,
- Introduction of restrictions in speed rates in towns – a legislative obligation has been introduced on speed limits in urban built-up areas during daytime up to 50 km/h (and up to 60 km/h during the hours between 23.00 and 5.00)19).
Legislative and administrative measures: - Improvement of the infrastructure for cyclists and pedestrians – activities that were undertaken focused on
promoting bicycles as a means of transport and on building bicycle routes. Promotion of bicycle transport is favoured by the setting or building of bicycle paths and pedestrian pathways for the every-day local and tourist transport, both in the urbanised areas and beyond them. In 2003 the total area of pavements and bicycle routes in Poland for roads within the administrative limits of towns amounted to 79,910 thousand m², and for roads outside the administrative limits of towns 16,399 thousand m². Actions of non-governmental organisations promoting bicycle use as a means of transport, as well as attractive bicycle prices, which encourage their purchasing and use play a significant role in the popularisation of bicycles. Furthermore, the idea of multimodal transport (bicycle and collective means of transport) is being implemented by creating bicycle parking places close to places where modes of transport are changed and by providing possibilities for transporting bicycles by collective transportation means,
- Promotion of public transport – the structural changes that have been introduced in the Polish State Railways Joint Stock Company (PKP S.A.) should facilitate involvement of railway operators in providing services for collective transport at local and regional levels. Support is also provided for investment undertakings for the development of collective transportation services in towns, such as the co-financing with the state budget resources the building of an underground train in Warsaw,
- Programme for the development of combined transport – in 2001–2004 there has been an increase in the share of intermodal railway transportations in the total transportation from 1.2% in 2001 to 1.6% in 2004,
- Improvement of the quality of water transport – inland navigation ship-owners may apply for financial resources for undertakings to promote inland water transport as the most ecological branch of transport, and in particular for activities aimed at environmental protection (repairs, replacement of old engines with new ones that meet environmental requirements),
- Measures to reduce greenhouse gas emissions from air transport – the aviation space has been divided into two types: A and G, which will enable flights from point to point following the shortest route. The expected fuel-saving effect has been estimated at 6–8%. Implementation of the newest air navigation devices allows to reduce the waiting time of planes to land, and thus to reduce energy consumption.
Educational measure: - Information and educational activity related to the need for behavioural changes – this activity resolved
itself into information and educational activities related to economic driving, which is in favour of a significant reduction in fuel consumption and exhaust gas emissions (the so called “eco-driving”) – many projects have been accomplished and standards and requirements of the European Aviation Safety Agency (EASA) have been incorporated into the operational procedures at airports and by aviation transporters (carriers) which contributed to more environmentally sound behaviour.
1.7. Construction and housing 1.7.1. Policy The housing policy is decentralised and subordinated to the decisions of the local self-governments20). The development of the housing sector for the poorest social groups is financially supported by self-governments (gminas), which also provide financial aid for the poor. Also the housing co-operatives take advantage of the country’s assistance in paying back housing credits.
19) Act of 20 June 1997 – Road Traffic Law (Dz. U. of 2005 No. 108, item 908, as amended). 20) In over 90% of cases it is individual or commercial housing. Building investments are subject to Building Law and are subject to control from
building supervision.

18
1.7.2. Measures Legislative and organisational measures: - Energy standards in the construction sector – the technical and construction requirements on effective and
rational energy use in buildings have been extended by: thermal protection and heating, ventilation and air-conditioning installations, and hot water supply systems. Work on the energy performance of buildings is underway,
- The process of thermo-modernisation of buildings – more stringent requirements were put into effect regarding buildings intended for thermo-modernisation with the use of budgetary sources in the form of heating efficiency improvement bonuses. A new energy standard has been elaborated for buildings by introducing a new regulation21). In the case of existing buildings the energy demand drops by 50% on average after thermo-modernisation. For example, modernisation of public buildings caused a CO2 emission reduction by 70.772 Gg in 2004 in relation to the level in 2001,
- Raising awareness of the users and owners of buildings in energy saving – an educational and information programme has been implemented, which is addressed to investors of new buildings, as well as managers and owners of the existing buildings. Its role is to motivate to improve the technical standard of construction resources (building stock), including the energy standard. Furthermore, a number of publications have been prepared and disseminated to promote energy-saving activities, such as: Energy-saving house, Thermo-modernisation of buildings.
1.8. Agriculture 1.8.1. Policy The basis for agricultural management is provided in the Strategy for the development of rural areas and agriculture for 2007–2013 (with elements of prognosis until 2020). The Strategy’s aim is to improve the living and working conditions of inhabitants of rural areas through economic growth taking account of environmental requirements. This goal is to be achieved by implementing the following priorities, such as: improvement of the competitiveness in agriculture and forestry, rationalisation of land management and improvement of the quality of living in rural areas. Priorities of the agricultural policy for the nearest years include, inter alia: influence on the development of multifunctional agriculture through financial and legal instruments and maintenance of competitiveness of farms and of the entire European agriculture on the world market and maintenance of spatial agricultural management, including the problem areas. In the development of rural areas the most important targets are: sustainable development of agriculture and rural areas (the key issue is to engage resources and sources of wealth), economic stability of rural areas developed on the basis of work in agriculture and beyond, as well as social approval for transformation and environmental integration. 1.8.2. Measures Legislative and organizational measures: - Rational use of fertilisers, including nitrogenous fertilisers – for example, in 2000 in the course of
measures taken by the Minister of Agriculture and Rural Development the doses of natural fertilisers have been limited to 170 kg N/ha per year in terms of pure ingredient. Also the use of fertilisers in flooded soils, in soils covered with snow and in frozen soils, as well as soils on mountain slopes has been forbidden. Moreover, a requirement for large commercial farms to have a fertilisation plan has been introduced. To facilitate rational fertilisation a consultancy system has been introduced to provide assistance in determining the exact required doses of fertilisers, and farmers are obliged to use the Common Good Agricultural Practice. In order to determine the contents of mineral nitrogen in agricultural soils monitoring of soils in Poland is carried out in early spring and in autumn. The use of mineral fertilisers in 2001–2004 is presented in Table 5,
21) Regulation of the Minister of Infrastructure of 15 January 2002 on detailed scope and format of the energy audit (Dz.U. of 2002 No. 12, item
114).

19
Table 5. Consumption of mineral fertilisers in 2001–2004 Consumption
[in thousand tonnes] 2001/2002 2002/2003 2003/2004
NPK fertilisers total, incl.:
1574.2 1511.7 1622.1
nitrogenous fertilisers 861.8 831.7 895.0 Organic fertilisers 56800.0 48800.0 56000.0
Source: GUS. - Rational energy management in agriculture, including energy production from biomass waste, and from
solid and liquid manure – new boiler houses using biomass waste, timber and straw were built in the rural areas with financial support. It is estimated that around 200 straw-fired boilers and 250 wood-fired boilers were built in 2001–2004. They are low- and medium-capacity boilers (<500 kW). Apart from these measures taken in agriculture other activities focused on: supporting the purchase of seeding material for energy plants, supporting the purchase of individual installations for energy supply from renewable sources, and introducing preferential credits for the production of raw agricultural spirit or rape oil used as bio-components in liquid fuels. These activities reduced CO2 emissions in 2001–2004 by app. 2.843 Gg and CH4 emissions by 5.7 Mg,
- Support for using other renewable energy sources in agricultural production – thanks to various forms of support app. 1,000 m2 of solar water collectors and app. 300 m2 of air collectors were created in agriculture, which corresponds to app. 2,046 GJ of energy obtained. This caused CO2 emission to fall by app. 0.185 Gg/year,
- Reduction of solid fuel coal and coke demand – a decrease in the consumption of traditional fuels is observed in agriculture in 2001–2004. This resulted in a reduction of CO2 emissions, which declined in 2004 in relation to the year 2001 by 883.450 Gg,
- A change in the structure of fuels used in favour of hydrocarbon fuels and reduction of diesel oil consumption – in 2004 app. 48.5 million litres of bioethanol have been put into the fuel market, which caused a decrease in petrol consumption in agriculture by almost 50% compared to the period of 1996–1998. The share of biofuels (bioethanol and esters) in fuels used in transport (petrol and diesel oil) accounted for app. 0.3% in 2004. It is expected that this share will rise in 2006 to the level of 1.5%. However, the rapid growth of transport development in the rural areas, despite these measures, caused an increase in the total CO2 emissions,
- Technical modernisation of farms – modernisation measures focused mainly on adapting farms to the EU standards. As regards environmental protection they concerned water and soil protection aspects. The problem of reducing greenhouse gas emissions had a lower priority in these activities. The only activity affecting reduction of methane emissions was the building of manure plates (gutters) for animal excrements and containers for liquid fermented and unfermented manure,
- Improvement of farm animal raising systems, reduction of methane from animal excrements, application of methane removal methods in litter-free raising of ruminants – methane emissions from these sources declined by almost 51.000 Gg, while nitrous oxide emissions increased by 750 Mg. These changes resulted mainly from changes in the population of animals, and to a lesser extent from measures taken in this field,
- Preference to crops with a high CO2 removal factor – subventions to energy willow (Salix sp.) and Japanese rose (Rosa multiflora var.) plantations have been introduced (55.46 EUR/ha). The cultivated area of these plants covers app. 6,000 ha,
- Development of new technologies for growing and harvesting plant biomass intended for use as a renewable energy source and raw material for the industry – new technologies for growing and harvesting willow, miscanthus (Miscantus sinensis), Pensylvanian mollow (Sida hermoaphrodita) and hemp (Cannabis sativa) have been developed. The total area grown with these crops has been estimated at 6–7 thousand ha and shows an upward trend. Apart from the aforementioned support provided by the GEF for such measures taken, other preferential credits for investments on new production technologies have been put into operation, including those connected with manufacturing of raw material for the production of bioethanol and bio-components, as well as animal production.
1.9. Forestry 1.9.1. Policy The ultimate goal of the forest policy, which has been formulated in a document the National Forest Policy, adopted by the Council of Ministers in April 1997, is to lay down measures targeted at sustainable multifunctionality of forests, their usefulness and protection, as well as their role in the shaping of the environment. This goal will be achieved through an

20
increase in the national forest cover to 30% in 2020 and to 33% in the mid 21st century, reinstatement and rehabilitation of forest ecosystems and regeneration of the devastated and neglected treestands in private forests. Implementation of these measures should lead to increased removal and capture of carbon dioxide. 1.9.2. Measures Legislative and organisational measures: - Combating changes in land-use – transformations of forest land into non-forest purposes are of marginal
significance in relation to the constantly growing total forest land area, - Rational forest management, incentives and measures supporting afforestation, preservation of
environmental stability of forests – forest management is conducted pursuant to Act of 28 September 1991 on Forests (Dz.U. of 2005 No. 45, item 435, as amended) and it includes both afforestation of non-forest land, reforestation, and enlargement of standing stocks with timber removal limitation to the level of 50–60% of the annual biomass growth. In 2004 in total 12.7 thousand ha of agricultural land used for agricultural purposes including 9.7 thousand ha owned by the State Treasury has been afforested,
- A plan for the utilisation of wood for energy purposes – in 2004 an installation for co-incineration of biomass has been put into operation in the “Połaniec” Power Plant. The annual use of timber amounts to about 400 thousand m3,
- Research on the level of carbon removal – a research project has been launched, named The role of forests and forest management in designing CO2 balance in Poland.
1.10. Waste 1.10.1. Policy The major goals of waste management in Poland have been laid down in the Second State Environmental Policy. Issues concerning the actual waste management status, by individual sectors, are presented in the National Waste Management Plan22) (KPGO) covering the period of 2003–2014. The ultimate objective is to prevent the generation of waste “at source”, to recover the resources and to re-use waste, as well as to finally dispose of unused waste in an environmentally safe manner. This can only be achieved by reducing the material and energy-consuming production, by using alternative renewable energy sources and by applying full product “life-cycle” analysis. 1.10.2. Measures Utilisation of waste by plants that are their generators is slowly improving. In 2001 out of the total number of 1,369 plants producing waste that are covered by public statistics, 1,281 plants utilised their own waste, of which 676 plants used over 95% of waste. Whereas in 2004 the relevant figures were as follows: 1,482, 1,321 and 823, respectively. A particularly positive effect is an increase in the number of plants with a high percentage of waste that is recovered. Legislative and organisational measures: - Recovery and recycling of waste – as shown in Tables 6 and 7, in 2000–2004 the amount of waste
recovered from the economy sector remained at a similar level (app. 79%), the amount of waste that were disposed of rose insignificantly (from 17.6% in 2002 to 18.2% in 2004), the amount of waste deposited in landfills declined systematically (from 17.8% in 2000 to 13.8% in 2004), and the amount of waste that was stored remained at the same level; changes in waste recovery and recycling are shown in Table 8,
22) Resolution no. 219 of the Council of Ministers of 29 October 2002 on the national waste management plan (M.P. of 2003 No. 11, item 159).
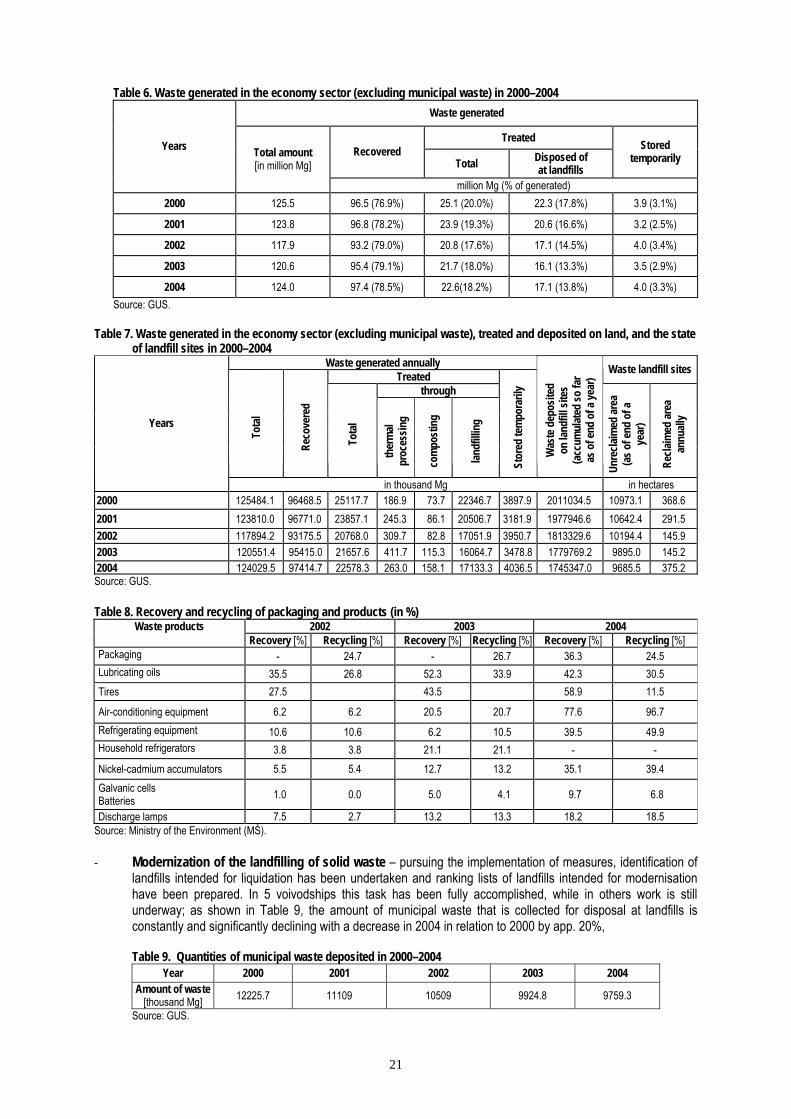
21
Table 6. Waste generated in the economy sector (excluding municipal waste) in 2000–2004
Waste generated
Treated Recovered
Total Disposed of at landfills
Stored temporarily
Years Total amount [in million Mg]
million Mg (% of generated) 2000 125.5 96.5 (76.9%) 25.1 (20.0%) 22.3 (17.8%) 3.9 (3.1%)
2001 123.8 96.8 (78.2%) 23.9 (19.3%) 20.6 (16.6%) 3.2 (2.5%)
2002 117.9 93.2 (79.0%) 20.8 (17.6%) 17.1 (14.5%) 4.0 (3.4%)
2003 120.6 95.4 (79.1%) 21.7 (18.0%) 16.1 (13.3%) 3.5 (2.9%)
2004 124.0 97.4 (78.5%) 22.6(18.2%) 17.1 (13.8%) 4.0 (3.3%) Source: GUS.
Table 7. Waste generated in the economy sector (excluding municipal waste), treated and deposited on land, and the state
of landfill sites in 2000–2004 Waste generated annually
Treated Waste landfill sites
through
Tota
l
Reco
vere
d
Tota
l
ther
mal
proc
essin
g
com
post
ing
landf
illing
Stor
ed te
mpo
raril
y
Was
te d
epos
ited
on
land
fill s
ites
(acc
umul
ated
so fa
r as
of e
nd o
f a ye
ar)
Unre
claim
ed ar
ea
(as o
f end
of a
ye
ar)
Recla
imed
area
an
nuall
y Years
in thousand Mg in hectares 2000 125484.1 96468.5 25117.7 186.9 73.7 22346.7 3897.9 2011034.5 10973.1 368.6 2001 123810.0 96771.0 23857.1 245.3 86.1 20506.7 3181.9 1977946.6 10642.4 291.5 2002 117894.2 93175.5 20768.0 309.7 82.8 17051.9 3950.7 1813329.6 10194.4 145.9 2003 120551.4 95415.0 21657.6 411.7 115.3 16064.7 3478.8 1779769.2 9895.0 145.2 2004 124029.5 97414.7 22578.3 263.0 158.1 17133.3 4036.5 1745347.0 9685.5 375.2 Source: GUS. Table 8. Recovery and recycling of packaging and products (in %)
2002 2003 2004 Waste products Recovery [%] Recycling [%] Recovery [%] Recycling [%] Recovery [%] Recycling [%]
Packaging - 24.7 - 26.7 36.3 24.5 Lubricating oils 35.5 26.8 52.3 33.9 42.3 30.5 Tires 27.5 43.5 58.9 11.5
Air-conditioning equipment 6.2 6.2 20.5 20.7 77.6 96.7 Refrigerating equipment 10.6 10.6 6.2 10.5 39.5 49.9 Household refrigerators 3.8 3.8 21.1 21.1 - - Nickel-cadmium accumulators 5.5 5.4 12.7 13.2 35.1 39.4 Galvanic cells Batteries 1.0 0.0 5.0 4.1 9.7 6.8
Discharge lamps 7.5 2.7 13.2 13.3 18.2 18.5 Source: Ministry of the Environment (MŚ). - Modernization of the landfilling of solid waste – pursuing the implementation of measures, identification of
landfills intended for liquidation has been undertaken and ranking lists of landfills intended for modernisation have been prepared. In 5 voivodships this task has been fully accomplished, while in others work is still underway; as shown in Table 9, the amount of municipal waste that is collected for disposal at landfills is constantly and significantly declining with a decrease in 2004 in relation to 2000 by app. 20%,
Table 9. Quantities of municipal waste deposited in 2000–2004
Year 2000 2001 2002 2003 2004 Amount of waste
[thousand Mg] 12225.7 11109 10509 9924.8 9759.3
Source: GUS.

22
At the same time the monitoring of municipal waste, conducted in 2000–2004, especially related to the waste accumulation indicator (kg/Mg per year) shows a stagnation of this indicator. Taking account of the demographic changes, the amount of municipal waste collected for disposal should remain at a similar level (with a tendency towards a slight increase). A decline observed in the amount of municipal waste collected for disposal is unlikely to be connected with a reduction in waste generation. This drop may be affected by: increasing poverty of the public, limited waste collection services, and in particular “incomplete” reporting on collected municipal waste by economic entities,
- Utilisation of landfill gas and biogas for energy production – in 2001 out of a total number of 1,036 municipal waste landfills in Poland 112 were fitted with de-gassing installations (for landfill gas recovery); out of this number 7 disposed of the landfill gas without recovering the energy, and 21 with energy recovery (4 for heat production and 17 for electricity production). In 2004 the number of landfills declined to 1049, out of which 207 applied de-gassing: 9 without energy recovery, and 32 with energy recovery (5 for heat production and 27 for electricity production).
Wastewater - Implementation of biological wastewater treatment processes based on BAT – data of the years 2000–
–2004 (Tables 10 and 11) indicate a significant progress in the biological treatment of wastewater, especially in an increased share of high-performance treatment processes, which are to a great extent based on BAT. This relates to ENR treatment plants with an elevated removal of nutrients (nitrogen and phosphorous). Building of new treatment plants and modernization and reconstruction of the old ones allowed to increase the high- -efficiency treatment in biological treatment plants from 36.2% to 56.4% in 2004.
Table 10. Treated and untreated municipal wastewaters
2000 2001 2002 2003 2004 Wastewater [million
m3/year] [%] [million m3/year] [%] [million
m3/year] [%] [million m3/year] [%] [million
m3/year] [%]
Total 1494.0 100.0 1425.3 100.0 1190.9 100.0 1323.7 100.0 1293.6 100 Treated 1243.4 83.2 1227.4 86.1 1353.1 88.0 1159.1 87.6 1152.3 89.1
Mechanically 84.8 5.6 74.0 5.1 61.1 4.5 59.5 4.5 54.2 4.2 Biologically 1158.6 77.6 1153.4 81.0 1129.9 83.5 1099.6 83.1 1098.0 84.9 including ENR1 450.5 30.2 501.4 35.2 546.3 40.4 608.7 46.0 650.8 50.3
Untreated 250.6 16.8 197.9 13.9 162.2 12.0 164.8 12.4 141.3 10.9 1ENR – treatment plants with Enhanced Nutrient Removal, largely based on BAT. Source: GUS. Table 11. Percentage of different methods of municipal wastewater treatment Wastewater treatment method 2000 2001 2002 2003 2004 Total 100.0 100.0 100.0 100.0 100.0
Mechanical treatment 6.8 6.0 5.1 5.1 4.7 Biological treatment 93.2 94.0 94.9 94.9 95.3 including ENR 36.2 40.9 45.9 52.5 56.4
Source: MŚ. - Reduction of energy intensity in wastewater treatment processes – over the last decade the energy
consumption of wastewater treatment plants has decreased, as a result of: - changes in wastewater treatment technologies and introduction of BAT, - the use of energy-saving equipment and introducing systems for their operation adjusted to the actual
pollution loads in treated wastewaters, - utilisation of biogas from sludge fermentation for the production of heat and electricity for the purposes
of treatment plants.
The percentage of treatment plants equipped with closed fermentation chambers has increased from app. 46% to app. 54%, and also the level of biogas use has increased from app. 80% to 98%. The methane emission level has significantly decreased. The estimated CH4 emissions from wastewater treatment plants and from sludge processing amounted to app. 30 Gg CH4 in 2000, whereas in 2003 to around 8 Gg CH4.

23
2. GREENHOUSE GAS EMISSION TRENDS AND PROJECTIONS 2.1. Emission trends by gases Each year, Poland submits detailed inventories of GHG emissions and removals to the UNFCCC Secretariat in Bonn. Since 2002, GHG inventory results have been submitted in the form of CRFs (Common Reporting Format) – spreadsheet files that cover the period 2000–2004 period. National GHG inventories are subject to periodic reviews carried out by expert review teams (ERT) designated by the UNFCCC Secretariat. For the needs of the UNFCCC Convention and the Kyoto Protocol, Poland selected the year 1988 as the base year for the main greenhouse gases: carbon dioxide, methane, nitrous oxide, and the year 1995 for industrial fluorinated gases (F-gases): HFCs, PFCs and sulphur hexafluoride. The results of GHG emissions and removals inventory for the 1988–2004 period, presented in this report may be subject of change following the emissions recalculations carried out during 2006 in accordance with methodologies given in the Revised 1996 IPCC23) Guidelines and in Good Practice Guidance and Uncertainty Management. The results presented in this report for the base year (1988/1995) are based on previous estimates made in the mid 1990s that were corrected to follow the current IPCC inventory methodologies and to apply recommendations of ERT that reviewed the Polish GHG emission inventory in 2005. Also for the first time, the 1989 GHG emission inventory results are presented here. The 1989 GHG inventory is consistent – from the methodological point of view – with the updated 1988 inventory. Under the Kyoto Protocol, Poland committed itself to 6% GHG emission reduction in the 2008–2012 period compared to the base year 198824). GHG inventory results show that over the period 1988–2004 GHG emission decreased significantly (excluding sector 5. Land use, land-use change and forestry) being as much lower as 31.7% below the base year. The GHG emissions decrease has been caused primarily by decreases of emissions of: carbon dioxide, methane and nitrous oxide that dropped by 33.6%, 23.7% and 25.7%, respectively. The decreasing trend had continued until the year 2002, after which GHG emissions began to grow by 3.3% in 2003 and further by 1.5% in 2004 (Table 12). Table 12. Emission changes of carbon dioxide, methane, nitrous oxide, hydrofluorocarbons, perfluorocarbons and
sulphur hexafluoride in 1988–2004 expressed as carbon dioxide equivalent [Gg CO2 eq.] Years
GHG Base year 1989 1990 1991 1992 1993 1994 1995 1996 1997 1998 1999 2000 2001 2002 2003 2004
CO2 with sector 5 440973 422698 340737 324003 334738 323209 331430 307935 331514 320725 298107 291011 278212 277990 275359 290871 290541
CO2 without sector 5 477004 459734 380697 366959 371591 363133 371588 348172 372530 361626 337448 329697 314812 317844 308277 319082 316700
CH4 51151 50676 58819 54362 51952 51061 51805 51598 47296 47845 49041 47252 45848 38816 37787 37684 39025
N2O 40384 41877 19428 16126 15562 15426 15574 16734 16715 16743 15984 23284 23895 23946 22633 23936 30004
HFCs* 26 0 0 0 0 0 0 26 97 154 167 206 595 1073 1523 1825 2436
PFCs* 250 0 0 0 0 0 0 250 236 249 251 240 224 270 287 278 285
SF6* 13 0 0 0 0 0 0 13 8 9 12 14 16 18 21 20 23
Total emission ** 568829 552287 458944 437447 439105 429619 438968 416794 436881 426626 402903 400694 385390 381968 370529 382825 388473
* 1995 is the base year for: HFCs, PFCs and SF6. ** CH4, N2O and total GHG emissions excluding sector 5. Land use, land-use change and forestry. Source: Ministry of the Environment (MŚ). Total GHG emissions in 2004 are dominated by carbon dioxide emissions that contribute 81.52% to the total. Methane emissions contribute 10.05% to the total, while the share of nitrous oxide is 7.72%. The shares of individual greenhouse gases in 2004 changed slightly compared to those in 1988. Carbon dioxide share decreased by 2.3% and was compensated by increases of methane (by 1.6%) and nitrous oxide (increase by 0.6%). F-gases made up 0.71% of the aggregated 2004 GHG emission total. 23) Intergovernmental Panel on Climate Change (IPCC). 24) Base year emissions include: emissions of carbon dioxide, methane and nitrous oxide in 1988, and emissions of HFCs, PFCs
and sulphur hexafluoride in 1995.

24
Carbon dioxide The basic source of carbon dioxide emissions in 2004 was combustion of fuels in sector 1. Energy, that makes up almost 96% of CO2 emissions, including: Energy Industries – 57.1%, Manufacturing Industries and Construction – 12.7%, Transport – 10.6%, Other sectors – 14.4% (Figure 1). Since 1988 the shares of individual emission sources have changed insignificantly.
Figure 1. Carbon dioxide emission share in 2004* Poland national CO2 emission in 2004 with IPCC sectors share
(without emissions and removals from IPCC sector 5. LUCF)
1.A.1. Energy Industries
57.1%
6. Waste0.1%
2. Industrial Processes
4.2% 1.B. Fugitive Emissions from
Fuels0.1%
4. Agriculture0.0%
3. Solvent and Other Product Use
0.2%
1.A.2. Manufacturing Industries and Construction
12.7%
1.A.5. Other0.6%
1.A.3. Transport10.6%
1.A.4. Other Sectors14.4%
1. Energy95.5%
* Sectors’ names and numbering according to IPCC classification used in national inventories of sources and removals of greenhouse gases; in sector 4. Agriculture CO2 emissions do not occur. Source: MŚ.
Over the period: 1988–2004 carbon dioxide emissions decreased by as much as 33.6% (with 34.1% accounting for CO2 removals). The largest decrease app. by 20% occurred during 1988–1990 period. At the same time, the fuel structure had changed so that the share of liquid fuels increased from 12.5% in 1988 to 20.4% in 2004, the share of gaseous fuels dropped from 7.5% in 1988 to 6.4% in 2004 and the share of hydrocarbon fuels increased from 20.0% to 26.8%, respectively. In 2003 emissions were higher than in 2002 by 3.5% following increasing economic growth, which resulted in increasing energy demand. However, 2004 emissions were lower than in the previous year by 0.7%. Removal of carbon dioxide by the forestry sector in 2004 was estimated at 26,159 Gg, i.e. 8.3% of total emissions of that gas and was by 27.4% lower than in 1988. Until 2001, CO2 removal had been higher than in the base year and in 1991 it was higher by as much as 19.2%. Since 2002 the amount of removals has dropped below the 1988 level and has continued to fall in the following years. The drop of removal is caused by increasing commercial harvesting accompanied by fairly constant biomass growth in forests and decreasing trend in afforestation. The latter is caused by increasing trend of using land for other than afforestation purposes related to socio-economic development of Poland. Methane The largest source of methane is sector 1. Energy, whose share in total CH4 emissions in 2004 was 45.6%. Here, the largest contribution came from fugitive emissions resulting mainly in extraction of hard coal (app. 30% of the national total). Another important source of methane is the Waste sector 24.8% of the total. Within the Waste sector, the largest contribution came from solid waste disposal on sites (20.9% of the total). Sector 4. Agriculture contributed 28.8% of the total. The dominating sub-sector here was the enteric fermentation, 20.7% of emission total (Figure 2).
Figure 2. Methane emission share in 2004* Poland national CH4 emission in 2004 w ith IPCC sectors share
6. Waste24.8%
1. Energy 45.6%
2. Industrial Processes
0.8%
3. Solvent and Other Product Use
0.0%
5. Land-Use Change and
Forestry0.01%
6.A. Solid Waste Disposal on Land
20.9%
6.B. Waste-water Handling
3.9%
4. Agriculture
28.8%
* Sectors’ names and numbering according to IPCC classification used in national inventories of sources and removals of greenhouse gases; In sector 3. Solvent and Other Product Use CH4 emissions do not occur. Source: MŚ.
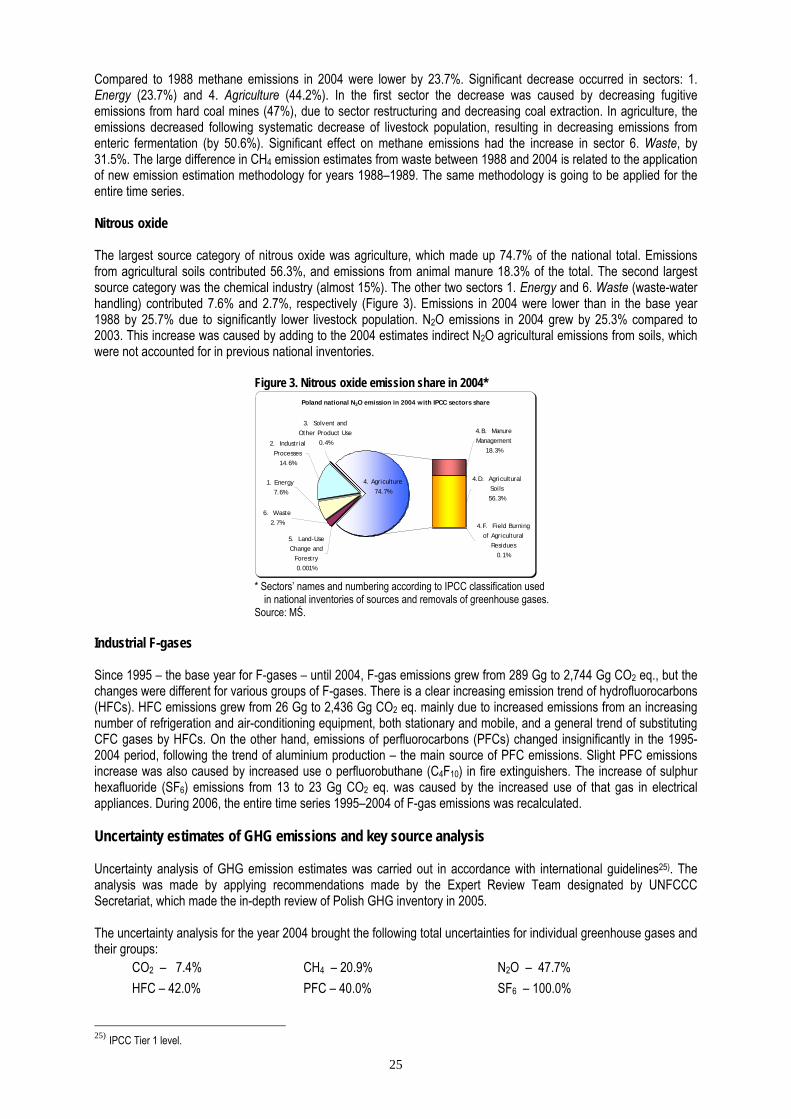
25
Compared to 1988 methane emissions in 2004 were lower by 23.7%. Significant decrease occurred in sectors: 1. Energy (23.7%) and 4. Agriculture (44.2%). In the first sector the decrease was caused by decreasing fugitive emissions from hard coal mines (47%), due to sector restructuring and decreasing coal extraction. In agriculture, the emissions decreased following systematic decrease of livestock population, resulting in decreasing emissions from enteric fermentation (by 50.6%). Significant effect on methane emissions had the increase in sector 6. Waste, by 31.5%. The large difference in CH4 emission estimates from waste between 1988 and 2004 is related to the application of new emission estimation methodology for years 1988–1989. The same methodology is going to be applied for the entire time series. Nitrous oxide The largest source category of nitrous oxide was agriculture, which made up 74.7% of the national total. Emissions from agricultural soils contributed 56.3%, and emissions from animal manure 18.3% of the total. The second largest source category was the chemical industry (almost 15%). The other two sectors 1. Energy and 6. Waste (waste-water handling) contributed 7.6% and 2.7%, respectively (Figure 3). Emissions in 2004 were lower than in the base year 1988 by 25.7% due to significantly lower livestock population. N2O emissions in 2004 grew by 25.3% compared to 2003. This increase was caused by adding to the 2004 estimates indirect N2O agricultural emissions from soils, which were not accounted for in previous national inventories.
Figure 3. Nitrous oxide emission share in 2004* Poland national N2O emission in 2004 with IPCC sectors share
2. Industrial
Processes 14.6%
1. Energy 7.6%
6. Waste2.7%
4.B. Manure Management
18.3%
4.D. Agricultural Soils56.3%
4.F. Field Burning of Agricultural
Residues0.1%
3. Solvent and Other Product Use
0.4%
5. Land-Use Change and
Forestry0.001%
4. Agriculture
74.7%
* Sectors’ names and numbering according to IPCC classification used
in national inventories of sources and removals of greenhouse gases. Source: MŚ.
Industrial F-gases Since 1995 – the base year for F-gases – until 2004, F-gas emissions grew from 289 Gg to 2,744 Gg CO2 eq., but the changes were different for various groups of F-gases. There is a clear increasing emission trend of hydrofluorocarbons (HFCs). HFC emissions grew from 26 Gg to 2,436 Gg CO2 eq. mainly due to increased emissions from an increasing number of refrigeration and air-conditioning equipment, both stationary and mobile, and a general trend of substituting CFC gases by HFCs. On the other hand, emissions of perfluorocarbons (PFCs) changed insignificantly in the 1995-2004 period, following the trend of aluminium production – the main source of PFC emissions. Slight PFC emissions increase was also caused by increased use o perfluorobuthane (C4F10) in fire extinguishers. The increase of sulphur hexafluoride (SF6) emissions from 13 to 23 Gg CO2 eq. was caused by the increased use of that gas in electrical appliances. During 2006, the entire time series 1995–2004 of F-gas emissions was recalculated. Uncertainty estimates of GHG emissions and key source analysis Uncertainty analysis of GHG emission estimates was carried out in accordance with international guidelines25). The analysis was made by applying recommendations made by the Expert Review Team designated by UNFCCC Secretariat, which made the in-depth review of Polish GHG inventory in 2005. The uncertainty analysis for the year 2004 brought the following total uncertainties for individual greenhouse gases and their groups:
CO2 – 7.4% CH4 – 20.9% N2O – 47.7% HFC – 42.0% PFC – 40.0% SF6 – 100.0%
25) IPCC Tier 1 level.

26
These results are in line with the corresponding values obtained in GHG national inventories in other countries. The ranges of uncertainty estimates in other countries vary within the following intervals: for CO2 0.2–10%, CH4 5–50% and N2O between 5 and 300%. Relatively low uncertainty values for total CO2 emissions (7.4%) are caused by the fact that most of CO2 emissions are generated in sector 1.A in which activity data are relatively precise (2–5%) as well as CO2 emission factors (0.2–2%). Higher uncertainty estimate for methane (20.9%) is due to the fact that significant parts of CH4 emissions come from agriculture (from enteric fermentation of livestock and animal manure) where emission factors are quite uncertain (app. 50%). Like in other countries, large uncertainty of total emissions was estimated in case of N2O (47.7%). The main cause is large uncertainty of the respective emission factors in dominating source categories including animal manure management (150%). Large uncertainties of emission factors are caused by inter alia uncertainties of measurement and chemical analyses based on which emission factors were determined. Also insufficient knowledge of processes leading to emissions is another reason for large uncertainties. Uncertainties of activity data are often caused by the lack of suitable analyses and due to inherent uncertainty of selected statistical analysis used in public statistics and energy balances. Uncertainty levels in GHG inventories can be lowered by studying the uncertainties of the key sources especially those where uncertainty ranges are highest. In 2004, 14 key emission sources were identified in Poland’s GHG emission inventory. The most important ones are: stationary combustion of fuels (solid, liquid and gaseous) and road transport. CO2 emissions from those sources made up over 77% of the national GHG emission total expressed in CO2 equivalents. Emissions from solid fuel combustion in stationary sources contributed app. 56% to total GHG emissions in Poland. Detailed results of uncertainty analysis and key source analysis are given in the National Inventory Reports (NIR) on sources and removals of GHG that are submitted annually to the UNFCCC Secretariat. 2.2. Projections of greenhouse gas emissions and removals
Following the guidelines of the UNFCCC, two projection scenarios were developed for GHG emissions: “with measures” and “without measures” for the years: 2005, 2010, 2015 and 2020. The key scenario is the “with measures” scenario, in which currently implemented policies and measures were accounted for. Both scenarios were elaborated in accordance with the requirements for national GHG inventories following methodologies presented in the Revised 1996 IPCC Guidelines for National Greenhouse Gas Inventories and in Good Practice Guidance and Uncertainty Management. Macroeconomic assumptions used in the “with measures” scenario are presented in Table 13. Annual averaged GDP growth is expected to be 5.1% during 2005–2010, 5.2% in 2011–2015 and 4.8% during 2016–2020. According to demographic projections, Poland’s population will continue to decrease from 38,123 thousand in 2005 to 37,626 thousand in 2020. According to energy forecasts, during 2005–2020 we may expect steady improvement of effectiveness of energy use in all sectors of economy (Table 14), and also significant increased use of natural gas and the renewables for electric energy production. The demand for electric energy is expected to grow steadily. Table 13. Projected changes of main macroeconomic indexes in 2005–2020 according to scenario “with measures”
Specification Changes 2005–2010 2011–2015 2016–2020 GDP Mean annual increase [%] 5.1 5.2 4.8 Population Change over a period [%] -0.6 -0.7 -1.1 Change of gross electric energy demand Per cent increase over the period 20.5 16.5 15.3
Increase of electric energy production based on natural gas Per cent increase over the period 26.7 35.1 64.9
Increase of electric energy production based on renewable sources Per cent increase over the period 197.6 20.8 21.9
Increase of share of electric energy produced based on natural gas Per cent increase over the period 0.21 0.56 1.69
Increase of share of electric energy produced based on renewable sources Per cent increase over the period 4.5 0.3 0.5
Source: Energy Market Agency (ARE).

27
In forecasting the development of energy sector, the methodology introduced by the International Atomic Energy Agency (IAEA) was applied. The methodology is used worldwide in energy related studies. In this methodology, the driving force behind the growing energy demand is the economic growth described by macroeconomic variables. To elaborate the energy demand forecast, the end-use model MAED was applied, i.e. bottom-up approach. Model of this type is the only recommended by IAEA approach for projections of energy demand in long-term forecasts (10 or more years). Projections of useful energy use were made based on assumed scenario of macroeconomic development, energy policy, progress and innovative measures adopted in energy use. These projections were made for each direction of energy use within each sector of economy. Coefficients of energy efficiency improvement were determined based on 1994–2004 statistical data. Results of the MAED model provide input to energy-ecological simulation model BALANCE, which determines demand for final energy disaggregated into energy carriers and determines national energy balances and provides estimates for the amounts of emitted air pollutants. The basic idea behind the model is the market approach: each producer and each energy user operate on a simulated energy market, which results in optimal costs for energy supply. Hence, the BALANCE model brings the most probable projection of future state of energy economy – under given assumptions and boundary conditions with respect to primary fuel prices, national energy policy, technological progress, limited access to energy carriers, and also time limitations for investment processes. The optimal pathways for sources of electrical energy in the national grid were determined using WASP-IV model. For tasks “what happens, if?” optimization model MESSAGE was applied – which communicates with the BALANCE model. Table 14. Projected improvements of effectiveness of energy use in relation to 2003 (expressed in %)
Specification 2005 2010 2015 2020 Heavy industry Electric energy users 1.78 8.79 13.87 17.87 Hot water and steam 2.35 11.60 18.32 23.59 Process heat 2.77 13.67 21.58 27.79 Non-energy use 0.00 0.00 0.00 0.00 Other industry Electric energy users 1.77 8.75 13.81 17.79 Hot water and steam 4.52 22.27 35.15 45.27 Process heat 1.06 5.21 8.22 10.59 Agriculture Electric energy users 1.26 6.19 9.77 12.58 Motor fuels 0.06 0.34 0.57 0.77 Other fuels 2.01 9.93 15.67 23.90 Services Space heating 3.01 9.50 15.03 19.94 Water heating 2.53 8.00 12.66 16.79 Cooking 1.90 6.00 9.50 12.59 Lighting 2.85 9.00 14.24 9.00 Electric appliances -1.27 -4.00 -6.33 -8.40 Households Space heating 1.06 3.67 5.56 7.05 Water heating -0.14 2.47 4.36 5.85 Cooking 0.46 3.07 4.96 6.45 Lighting 9.65 12.20 14.05 15.51 Electric appliances -0.35 2.20 4.05 5.51
Source: ARE. In the case of the “without measures” scenario, the forecast of GDP growth was made upon a multi-year 1995–2004 trend based on data of the Central Statistical Office (GUS), which was then extrapolated for the 2005–2020 period, by applying the growth rates used in the Energy Policy, i.e. 5.8% growth during 2005–2010 and 5.1% growth in 2011– –2020. Moreover, a modified trend of primary energy use to GDP ratio for the period 1995-2020 was assumed, which assumes slower but continuous decrease of that ratio. A linear, decreasing trend of the ratio was assumed with annual decrease by 0.35%. The starting year for the assumed trend was 1997. Based on the modified trend of primary energy use to GDP ratio, a new projection was made for the primary energy use: “without measures” scenario. According to the projection for the year 2020, the total use of primary energy is higher by 976 PJ (19.6%) than the respective figure in the “with measures” scenario. Figures 4 to 9 presented below, show the comparison of projected emissions “with measures” and “without measures” scenarios in the base year, 2000, 2003 and 2005, 2010, 2015 and 2020 in the main IPCC source categories. In the case of the following source categories: 3. Solvents and other product use, 4. Agriculture and 5. Land use, land-use change and forestry, both scenarios “with measures” and “without measures” yield very similar results, so no differences can be seen in the respective figures. It should be noted that GHG emission estimates for the base year and the following years may change due to recalculation of the entire time series scheduled for 2006. The need for the recalculation of the national GHG emission inventory comes from the necessity to standardize the inventory

28
methodology and in order to follow the recommendations made by the Expert Review Team of the UNFCCC Secretariat that reviewed the Polish GHG inventory in 2005. In sector 1. Energy (Figure 4) GHG emissions in 2000–2003 were much lower than in the base year. While during 2005–2020, emissions are expected to grow in both scenarios (in scenario “without measures” the growth is higher), but still the level of emissions remains well below that of 1988. Figure 4. Greenhouse gas emissions from sector Figure 5. Greenhouse gas emissions from sector
1. Energy in 1988–2020 (Tg CO2 eq.) 2. Industrial Processes in 1988–2020 (Tg CO2 eq.)
300
320
340
360
380
400
420
440
460
480
500
1988 1992 1996 2000 2004 2008 2012 2016 2020
Tg C
O2 e
q.
scenario "with measures" scenario "without measures"
16
19
23
26
29
1988 1992 1996 2000 2004 2008 2012 2016 2020Tg
CO
2 eq.
Source: MŚ. The base year for HFCs, PFCs and SF6 is 1995 for Poland.
Source: MŚ.
The projected emissions in sector 2. Industrial Processes (Figure 5) in both scenarios: “with measures” and “without measures” differ only in the case of sulphur hexafluoride – SF6 emissions – from production, assembly and use of electric appliances that contain that gas. Therefore, the differences in sector emissions expressed in CO2 equivalent are insignificant and cannot be seen in Figure 5. The projections show that GHG emissions in that sector will continue to grow in the period 2005–2015 and then they will stabilize until 2020. In sector 3. Solvents and other product use (Figure 6), GHG emissions are expected to fall during the time period covered by the projections. Projections for that sector cover only the period until 2010 due to the lack of 2010–2020 projections for the non-methane volatile organic compounds based on which carbon dioxide emissions are estimated in this source category. Figure 6. Greenhouse gas emissions from sector 3. Solvent Figure 7. Greenhouse gas emissions from sector
and Other Product Use in 1988–2020 (Tg CO2 eq.) 4. Agriculture in 1988–2020 (Tg CO2 eq.)
0.0
0.1
0.2
0.3
0.4
0.5
1988 1992 1996 2000 2004 2008 2012 2016 2020
Tg C
O2 e
q.
10
15
20
25
30
35
40
45
50
55
1988 1992 1996 2000 2004 2008 2012 2016 2020
Tg C
O2 e
q.
Source: MŚ. Source: MŚ. In sector 4. Agriculture (Figure 7) 2005–2020 GHG emissions are generally expected to stabilize after 2005 except for enteric fermentation, which is expected to decrease due to the projected decrease of livestock population of cattle. Emission data for the years covered by the projections cannot be directly compared with the respective data for the period 2000–2003 because of the ongoing in 2006 recalculation of greenhouse gas emissions in that sector.

29
Emission projections made for sector 5. Land use, land-use change and forestry (Figure 8) showed a decreasing trend for net removal of greenhouse gases, from app. 28 Tg CO2 eq. in 2005 to slightly above 20 Tg CO2 eq. in 2020. These changes are mainly caused by the projected increase of biomass removed in commercial harvest until 2020. This will bring net decrease of removal despite projected growth of forest area (due to afforestation) and projected growth of biomass stocks. Figure 8. Greenhouse gas net removals from sector 5. Land Figure 9. Greenhouse gas emissions from sector
Use, Land-Use Change and Forestry in 1988–2020 6. Waste in 1988–2020 (Tg CO2 eq.) (Tg CO2 eq.)
0
5
10
15
20
25
30
35
40
1988 1992 1996 2000 2004 2008 2012 2016 2020
Tg C
O2 e
q.
0
5
10
15
20
25
1988 1992 1996 2000 2004 2008 2012 2016 2020Tg
CO
2 eq.
scenario "with measures" scenario "without measures"
Source: MŚ. Source: MŚ. In sector 6. Waste (Figure 9) GHG emissions are expected to grow in 2005–2020, especially after 2010 due to projected completion of new municipal waste incineration plants and growing amounts of sewage sludge. Emission data for years covered by the projections cannot be directly compared with those for 2000–2003 due to ongoing recalculation of greenhouse gas emission estimates in that sector. Detailed data on greenhouse gas emissions in the base year and years covered by the projections are shown in Table 15 (“with measures” scenario) and in Table 16 (“without measures” scenario). In both scenarios, GHG emissions are expected to grow but without exceeding the level of the base year emissions. The emissions increase in the period 2005–2020 would mainly be caused by an increasing demand for energy resulting in emissions growth in sector 1. Energy.

30
Table 15. GHG emission projections for the “with measures” scenario; comparison with the base year 1988/1995 2005 2010 2015 2020 2005 2010 2015 2020
GHG in CO2 equivalent [Gg] [Gg] [Gg] [Gg] [Gg] % of base year
1 Energy 482817.0 314564.67 349991.6 381014.2 405993.1 65.2 72.5 78.9 84.1
2 Industrial processes 24170.2 21377.80 24503.5 25741.0 25755.8 88.4 101.4 106.5 106.6
3 Solvents and other product use 1006.5 357.33 292.5 0.0 0.0 35.5 29.1 0.0 0,0
4 Agriculture 51741.6 36068.33 35001.1 34856.6 35045.1 69.7 67.6 67.4 67.7
5 Land use, land-use change and forestry -36022.4 -28461.29 -25442.3 -22763.4 -20637.6 79.0 70.6 63.2 57.3
6 Waste 9093.6 9484.42 10204.5 11148.3 12232.9 104.3 112.2 122.6 134.5 Sum of projections in sectors (without sector 5)
568828.9 381852.55 419993.2 452760.2 479026.9 67.1 73.8 79.6 84.2
Source: MŚ. Table 16. GHG emission projections for the „without measures” scenario; comparison with base year 1988/1995 2005 2010 2015 2020 2005 2010 2015 2020 GHG in CO2 equivalent
[Gg] [Gg] [Gg] [Gg] [Gg] % of base year 1 Energy 482817.0 377896.4 402315.1 420898.9 444448.3 63.5 67.6 70.1 75,5
2 Industrial processes 24170.2 21385.4 24515.9 25758.2 25777.8 88.5 101.4 106.6 106,7
3 Solvents and other product use 1006.5 357.3 292.5 0.0 0.0 35.5 29.1 0.0 0,0
4 Agriculture 51741.6 36068.3 35001.1 34856.6 35045.1 69.7 67.6 67.4 67,7
5 Land use, land-use change and forestry -36022.4 -28461.3 -25442.3 -22763.4 -20637.6 79.0 70.6 63.2 57,3
6 Waste 9093.6 9484.4 10194.6 11148.3 11881.6 104.3 112.1 122.6 130,7 Sum of projections in sectors (without sector 5)
568828.9 445191.9 472319.1 492662.0 517152.8 78.3 83.0 86.6 90.9
Source: MŚ. Tables 17 and 18 present GHG emissions expressed in CO2 equivalents disaggregated into individual gases for the base year (1988 for the main GHG, and 1995 for F-gases), 2000, 2003 and for the years covered by projections: 2005, 2010, 2015 and 2020 for the “with measures” (Table 17) and “without measures” (Table 18) scenarios and broken down into the main IPCC source categories.

31
Table 17. GHG emissions in main IPCC source categories for the “with measures” scenario 1 2 3 4 5 6 Sum
GHG in CO2 eq. [Gg]
Ener
gy
Indu
stria
l pro
cess
es
Solve
nts a
nd o
ther
pr
oduc
t use
Agric
ultu
re
Land
use
, land
-use
ch
ange
and
fore
stry
Was
te
Sum
of p
rojec
tions
in
sect
ors
(with
out s
ecto
r 5)
CO2 457005.1 18550.38 882.5 -36030.7 566.2 477004.14 CH4 23337.9 336.62 0.0 20112.0 7.5 7364.0 51150.55 N2O 2474.1 4993.43 124.0 31629.6 0.8 1163.4 40384.46 HFC 26.44 26.44 PFC 250.18 250.18 SF6 13.15 13.15
1988/1995
Sum 482817.03 24170.20 1006.46 51741.63 -36022.44 9093.60 568828.93 CO2 302465.4 12346.7 0.0 -36600.1 0.0 314812.1 CH4 17212.9 174.9 9857.9 4.1 18602.0 45847.7 N2O 2228.9 4349.3 16510.6 0.4 806.0 23894.8 HFC 594.7 594.7 PFC 224.4 224.4 SF6 16.3 16.3
2000
Sum 321907.2 17706.3 0.0 26368.5 -36595.6 19408.0 385390.0 CO2 307099.8 11479.8 473.8 0.0 -28211.2 29.1 319082.4 CH4 17746.6 294.9 9281.4 3.9 10361.0 37683.8 N2O 2322.9 4401.4 16418.4 0.4 793.3 23936.0 HFC 1824.8 1824.8 PFC 278.3 278.3 SF6 19.7 19.7
2003
Sum 327169.3 18298.8 473.8 25699.8 -28206.89 11183.4 382825.0 CO2 300275.2 13895.3 357.3 -28463.8 293.1 314820.9 CH4 12152.9 312.6 12996.3 2.3 8367.2 33829.0 N2O 2136.5 4686.1 23072.0 0.2 824.2 30718.8 HFC 2178.66 2178.7 PFC 285.08 285.1 SF6 20.08 20.1
2005
Sum 314564.7 21377.8 357.3 36068.3 -28461.3 9484.4 381852.5 CO2 333920.6 16994.3 292.5 -25444.8 293.8 351501.2 CH4 13624.6 326.4 12139.6 2.3 9081.8 35172.5 N2O 2446.4 4686.1 22861.4 0.2 828.9 30822.9 HFC 2188.96 2189.0 PFC 282.83 282.8 SF6 24.86 24.9
2010
Sum 349991.6 24503.5 292.5 35001.1 -25442.3 10204.5 419993.2 CO2 363714.8 18222.8 -22765.9 1102.3 383039.8 CH4 14626.9 326.0 11775.4 2.3 9215.0 35943.3 N2O 2672.6 4686.1 23081.2 0.2 831.1 31271.0 HFC 2204.78 2204.8 PFC 271.63 271.6 SF6 29.64 29.6
2015
Sum 381014.2 25741.0 0.0 34856.6 -22763.4 11148.3 452760.2 CO2 387623.5 18222.8 -20640.1 2012.3 407858.5 CH4 15520.8 328.0 11643.1 2.3 9382.1 36874.1 N2O 2848.8 4686.1 23402.1 0.2 838.5 31775.4 HFC 2217.69 2217.7 PFC 266.73 266.7 SF6 34.42 34.4
2020
Sum 405993.1 25755.8 0.0 35045.1 -20637.6 12232.9 479026.9 Source: MŚ.

32
Table 18. GHG emissions in main IPCC source categories for the “without measures” scenario
1 2 3 4 5 6 Sum
GHG in CO2 eq. [Gg]
Ener
gy
Indu
stria
l pro
cess
es
Solve
nts a
nd o
ther
pr
oduc
t use
Agric
ultu
re
Land
use
, land
-use
ch
ange
and
fore
stry
Was
te
Sum
of p
rojec
tions
in
sect
ors
(with
out s
ecto
r 5)
CO2 457005.1 18550.4 882.5 -36030.7 566.2 477004.1 CH4 23337.9 336.6 20112.0 7.5 7364.0 51150.6 N2O 2474.1 4993.4 124.0 31629.6 0.8 1163.4 40384.5 HFC 26.4 26.4 PFC 250.2 250.2 SF6 13.1 13.1
1988/1995
Sum 482817.03 24170.20 1006.5 51741.6 -36022.4 9 093.6 568828.93 CO2 302465.4 12346.7 0.0 -36600.1 0.0 314812.1 CH4 17212.9 174.9 9857.9 4.1 18602.0 45847.7 N2O 2228.9 4349.3 16510.6 0.4 806.0 23894.8 HFC 594.7 594.7 PFC 224.4 224.4 SF6 16.3 16.3
2000
Sum 321907.2 17706.3 26368.5 -36595.6 19408.0 385390.0 CO2 307099.8 11479.8 473.8 0.0 -28211.2 29.1 319082.4 CH4 17746.6 294.9 9281.4 3.9 10361.0 37683.8 N2O 2322.9 4401.4 16418.4 0.4 793.3 23936.0 HFC 1824.8 1824.8 PFC 278.3 278.3 SF6 19.7 19.7
2003
Sum 327169.3 18298.8 473.8 25699.8 -28206.89 11 183.4 382825.0 CO2 362895.1 13895.3 357.3 -28 463.8 293.1 377440.7 CH4 12485.9 312.6 12996.3 2.3 8367.2 34162.0 N2O 2515.4 4686.1 23072.0 0.2 824.2 31097.7 HFC 2178.66 2178.7 PFC 285.08 285.1 SF6 27.72 27.7
2005
Sum 377896.4 21385.4 357.3 36068.3 -28461.3 9484.4 445191.9 CO2 384975.8 16994.3 292.5 -25444.8 293.8 402556.4 CH4 14369.0 326.4 12139.6 2.3 9081.8 35916.9 N2O 2970.2 4 686.1 22861.4 0.2 819.0 31336.7 HFC 2188.96 2189.0 PFC 282.83 282.8 SF6 37.28 37.3
2010
Sum 402315.1 24515.9 292.5 35001.1 -25442.3 10194.6 472319.1 CO2 401647.3 18222.8 -22765.9 1102.3 420972.3 CH4 16085.2 326.0 11775.4 2.3 9215.0 37401.7 N2O 3166.3 4 686.1 23081.2 0.2 831.1 31764.7 HFC 2204.78 2204.8 PFC 271.63 271.6 SF6 46.84 46.8
2015
Sum 420898.9 25758.2 0.0 34856.6 -22763.4 11 148.3 492662.0 CO2 423185.5 18222.8 -20640.1 1662.3 443070.5 CH4 17878.7 328.0 11643.1 2.3 9382.1 39231.9 N2O 3384.1 4686.1 23402.1 0.2 837.2 32309.5 HFC 2217.69 2217.7 PFC 266.73 266.7 SF6 56.40 56.4
2020
Sum 444448.3 25777.8 0.0 35045.1 -20637.6 11881.6 517152.8 Source: MŚ.

33
Emission trends in both scenarios considered are close to each other. Until 2005, GHG emissions continue to decrease. After 2005, the emissions are expected to grow steadily, following the changes in sector 1. Energy, in which steady growth of emissions is projected over the entire 2005–2020 period. Steady emissions growth 2005–2020 is projected also in sector 2. Industrial processes. In sector 4. Agriculture, GHG emissions will grow significantly compared to 2003 emissions estimates, with slight downward trend in the 2005–2015 period followed by a slight increase towards 2020. GHG emissions in sector 6. Waste are also projected to grow during 2005–2020, mainly because of putting into operation new waste incineration plants. In both scenarios: “with measures” and “without measures”, and for all years beginning with the base year, carbon dioxide emissions have the largest contribution to GHG emissions with sector 1. Energy as the dominating source category. In the case of methane, the two dominant source categories are: 1.B. Fugitive emissions from fuels and 6. Waste. Methane emissions are expected to grow over the 2005–2015 period following the growth in sector 6. Waste, in which methane emission are supposed to increase over the entire period 2005–2020. Trend and level of emissions of nitrous oxide depend mainly on developments in sector 4. Agriculture. Projections for 2005–2020 indicate slight increase of N2O emissions.

34
3. ASSESSMENT OF THE IMPACT OF APPLIED MEASURES UPON FULFILMENT OF
COMMITMENTS INCLUDED IN ART. 3 OF THE KYOTO PROTOCOL 3.1. Assessment of emission reductions under current policies and measures Poland being a Party to the Kyoto Protocol has made a commitment to reduce its GHG emissions by 6% and selected year 1988 as the base year for the three main GHG gases: carbon dioxide, methane and nitrous oxide, and year 1995 for industrial F-gases (HFCs, PFCs and SF6), for its commitments under the UNFCCC and its Kyoto Protocol. Political and economic transformation that has been taking place since 1990, caused a reduction of the national GHG emissions much below Poland’s target under the Kyoto Protocol. Over the years 1988–2004, GHG emissions (without sector 5. Land-use change and forestry) decreased by as much as 31.7% below the base year. This target had been achieved by implementing a wide variety of policies and measures primarily aimed at the improvement of energy efficiency and restructuring of fuel use. Poland as a country undergoing economic modernisation, expects that its GHG emissions will grow. The main reason for the growth is the use structure of combusted fuels (hard coal and lignite), which makes further emission reduction difficult by switching to natural gas or to nuclear energy which does not yet exist in Poland. Modernization and restructuring processes in enterprises will always be targeted at energy-saving and environmentally friendly measures. Poland wishes to make use of CO2 emission reductions obtained so far within the framework of the emissions trading scheme. The national GHG emission reduction target covered by Annex B to the Kyoto Protocol is going to be met by Poland without applying additional measures. Therefore, it is not justified to adopt and implement additional measures both from the economic point of view and from the point of view of realization of the Kyoto Protocol targets. Some of the reduction commitments with respect to CO2 are allocated – within the emission trading mechanism – among installations in main sectors of the economy included in the National Allocation Plan (NAP). The comprehensive GHG emission reduction measures include: - a system of emission allowance trading, - the use of the Joint Implementation mechanism, - emission monitoring and implementation of the Kyoto Protocol (GHG emission monitoring is in place and the
results of the national emission inventories are reported in National Inventory Reports, while implementation of the Kyoto Protocol is presented in National Communications to the Conference of the Parties),
- financial mechanisms that support measures related to GHG emission reductions (financial mechanisms that stimulate emission reductions are implemented by the National Fund for Environmental Protection and Water Management (NFOŚiGW), EcoFund and the Global Environment Facility (GEF), to support measures related, inter alia, to the improvement of the effectiveness of energy use).
Poland’s energy policy is based upon the following principles: harmonized energy management under social market economy, full integration of Polish power sector with the European and world energy market, market competitiveness and support for renewable energy sources. This policy formulates priorities and directions of measures such as: monitoring of the level of energy security, cost reductions in power sector and improvement of energy efficiency; strengthening the position of self-governing administration towards enterprises in the power sector. The reserves of GHG emission reductions in the transport sector lie within broadly understood improvement of organisation of passenger and freight transport and related infrastructural measures, and also in increased use of biofuels. The principle goal of the forest policy formulated in the document entitled the National Forest Policy, adopted by the Council of Ministers in April 1997, is to specify measures aimed at maintaining lasting multi-functional role of forests, their usefulness and protection and their role in shaping the environment. This goal is going to be achieved by increasing the forest cover nationally to 30% in 2020 and 33% in the mid 21st century, reinstatement and rehabilitation of forest ecosystems and regeneration of devastated forest stands in private forests. Implementation of these measures should result in increased removal and capture of carbon dioxide. The aim of waste management is to prevent waste generation “at source”, to recover raw materials, to recycle waste and ensure environmentally safe final disposal of unused waste. The necessary condition to fulfill the aim is to reduce

35
material and energy intensity of production, and to increase the use of alternative renewable energy sources, and to trace the full “life cycle” of a product. The main measures in individual sectors include: 1. In the energy sector:
- promotion of renewable energy sources, - introduction of financial mechanisms that support energy production from renewable sources, - promotion of combined heat and power generation, - modernization of existing technologies in energy production and improvement of the efficiency of energy
transformation. 2. In industry:
- improvement of technical standards for appliances and equipment, - implementation of best available techniques – integrated permits are granted to installations that
implement BAT/BEP26), - reduction of methane emissions from production and distribution of fuels, - development of means to support small and medium-sized enterprises, mainly in implementing
innovations and for the improvement of effectiveness, - promotion of environment-friendly and effective practices and technologies in industrial activity, - support for the development of environment-friendly, technically feasible and cost-effective methods of
GHG emission reductions. 3. In transport:
- promotion and use of biofuels, - promotion of “ecologically clean” vehicles, - construction of motorways, ring-roads and express roads, - introduction of more stringent emission standards for motor vehicles, - promotion of public transport, - improvement of the quality of water transport, - measures for reducing GHG emissions from air transport.
4. In construction and housing: - implementation of energy standards in the construction sector, - thermo-modernisation of buildings, - raising awareness of building owners and users with respect to energy savings.
5. In agriculture: - rational use of fertilizers, including nitrogenous fertilisers, - efficient use of energy in agriculture, including energy production from biomass waste, slurry and
manure, - support for the use of other renewable energy sources in production processes, - reduction of the demand for solid fuels, coal, coke, - technical modernisation of households in rural areas, - improvement of animal breeding systems, methane reduction from animal manure, the use of
techniques to capture methane from litter-free rearing of cattle and other ruminants, - preferences to plant production with a high CO2 removal factor, - development of new cultivation and harvesting techniques for plant biomass intended for use as
renewable energy source and input material for the industry. 6. In forestry:
- counteracting land use change, - improvement of forest management, - incentives for and measures supporting afforestation, - protection of environmental stability of forests, - the use of wood for energy purposes.
7. In waste management: - recovery and recycling of waste, waste segregation prior disposal at landfills, - modernisation of solid waste disposal at landfills, - minimization of waste generation, - waste reduction at source,
26) The requirement to obtain such permits derives from the Polish law and Council Directive 96/61/EC of 24 September 1996 on integrated
pollution prevention and control (OJ L 257 of 10.10.1996, p. 26, as amended; OJ Polish special edition, Chapter 15, vol. 3, p. 80).

36
- use of landfill gas and biogas for energy generation, - implementation of biological processes for wastewater treatment based on BAT.
The most effective policies and measures include: increased use of biomass in fuel balances, fuel conversion, increased share of combined heat and power production (cogeneration), the use of biogas from landfills and processing of sewage sludge, and implementation of best available techniques as well as energy saving and material efficient technologies. Increased share of biomass in fuel balance When assessing emission reduction resulting from the increase of biomass share in fuel structure, it was assumed that, if there were no increase of biomass combustion compared to 2003 level, the additional amount of energy from biomass combustion would have to be compensated by additional use of fossil fuels. Projected CO2 emissions from biomass combustion amounted to: 21,455 Gg in 2005, 29,587 Gg in 2010, 32,732 Gg in 2015 and 34,829 Gg in 2020. CO2 emission reduction resulting from projected increased use of biomass was estimated at more than 2,100 Gg in 2005, and 1,600 Gg in 2020 (the rate of biomass share increase will drop over 2005–2020). Biomass combustion is the dominating source among all renewable energy sources (RES). In 2003, app. 85% of energy (electric power and heat) generated by RES came from biomass combustion. Fuel conversion The amount of emission reduction related to the change in fuel structure, was estimated as a difference between emission calculated according to projected fuel use for years 2005, 2010, 2015 and 2020, and emission calculated under the assumption of the same total fuel use but with the fuel structure frozen at the 2003 level. Emission reduction resulting from the projected fuel conversion (mainly coal to natural gas) excluding biomass, was estimated at over 5,300 Gg in 2005, and app. 24,000 Gg in 2020. Increased share of cogeneration CO2 emission reduction effect resulting from cogeneration (simultaneous production of electric power and heat) was estimated compared to the 2003 level. It was assumed that the emission change can be estimated based on the percentage changes of respective shares of cogeneration during 2005–2020 period, compared to cogeneration share in 2003. CO2 emission was calculated based on the estimated fuel amount that would have to be combusted if there were no increase of cogeneration share. CO2 emission reduction resulting from projected increase of cogeneration, was estimated as 2,400 Gg in 2005 up to app. 31,700 Gg in 2020. Summary effect The total CO2 emission reduction resulting from the projected increase of biomass use, fuel conversion (excluding biomass) and increased cogeneration was estimated as over 9,900 Gg in 2005 and over 67,000 Gg in 2020. These estimates were made on the basis of “effective option” included in Poland’s Energy Policy until 202527), adopted by the Council of Ministers on 4 January 2005. 3.2. Participation in emission trading, JI and CDM Emission allowance trading – a flexible mechanism, pursuant to Directive 2003/87/EC establishing a scheme for greenhouse gas emission allowance trading within the Community and amending Directive 96/61/EC28), was transposed into Polish law in Act of 22 December 2004 on emission allowance trading of greenhouse gases and other substances29). Work on the National Allocation Plan for the years 2005–2007 began in 2003, and in September 2004 the NAP was submitted to the European Commission. The European Commission in its decision of 8 March 2005 accepted the NAP under the condition that the Polish Government reduces the total amount of allowances by 16.5%. As a result the total limit of allowances in the 2005–2007 period was set at 717.3 million allowances (i.e. 239.1 million annually), which led to the verification of allocated amounts of allowances for individual installations covered by the scheme. After analysis, corrections were made to allocation methodology which resulted in updated allocations to sectors and individual installations set in the Regulation of the Council of Ministers of 27 December 2005 on the adoption of the National Allocation Plan for carbon dioxide emissions for the years 2005–2007 and the list of installations temporarily excluded from the Community emission trading scheme for the period between 1 January 2005 until 31 December 2007 (Dz.U. No. 264, item 2206). On 30 June 2006, the European Commission confirmed that the Polish National Allocation Plan for 2005–2007 CO2 emissions is consistent with the Commission Decision of 8 March 2005 on the Polish NAP, and hence Poland was included into the Community emission trading scheme. 27) M.P. of 2005 No. 42, item 562. 28) OJ L 275 of 25.10. 2003, p. 32; OJ EU Polish special edition, Chapter 15, vol. 7, p. 631. 29) Dz.U. of 2004 No. 281, item 2784.

37
By virtue of the Act of 22 December 2004 on emission allowance trading of greenhouse gases and other substances, the following regulations were adopted: - Regulation of the Minister of the Environment of 10 April 2006 on the conditions and ways to set costs of
verifications of annual reports (Dz.U. No. 71, item 496), - Regulation of the Minister of the Environment of 31 March 2006 on types of installations covered by Community
emission allowance trading scheme (Dz.U. No. 60, item 429), - Regulation of the Minister of the Environment of 7 March 2006 on information required for the development of
the National Allocation Plan (Dz.U. No. 43, item 308), - Regulation of the Minister of the Environment of 12 January 2006 on the way to monitor emission levels of
substances covered by the Community emission allowance trading scheme (Dz.U. No. 16, item 124), - Regulation of the Minister of the Environment of 13 September 2005 on the designation of the National
Administrator of emission trading scheme (Dz.U. No. 186, item 1562). The function of the Administrator is played by the Institute of Environmental Protection in Warsaw. The Administrator coordinates the functioning of the emission allowance trading scheme,
- Regulation of the Council of Ministers of 27 December 2005 on the adoption of the National Allocation Plan for carbon dioxide emissions for the years 2005–2007 and on the list of installations temporarily excluded from the Community emission allowance trading scheme between 1 January 2005 and 31 December 2007 (Dz.U. No. 264, item 2206).
The National Administrator of Emission Trading Scheme (KASHUE) was established at the Institute of Environmental Protection in Warsaw. A necessary condition for the functioning of the Community system was the establishment of the national registry. Poland selected the SERINGAS system developed by Caisse des Depots et Consignations from France. On 16 May 2006, Poland submitted to the European Commission additional information confirming that Poland fulfiled all the conditions included in the Commission Decision of 8 March 2005 and provided a description of measures that were taken by the Polish Government for that purpose. Pursuant to the requirements of Directive 2003/87/EC30), by 30 June 2006 each Member State should have submitted to the Commission for acceptance its National Allocation Plan for CO2 emission allowances for 2008–2012. To fulfil the requirement, work on the development of the National Allocation Plan was initiated. The National Administrator of Emission Trading Scheme developed the NAP for the years 2008–2012 (NAP – KPRU II), which was then submitted to the European Commission on 30 June 2006. The basis for the NAP elaboration were the sectoral development strategies worked out by industry associations that represent plants covered by the system. Clean Development Mechanism (CDM) – Poland does not take part in the implementation of that mechanism. Joint Implementation (JI) – Poland has large potential for greenhouse gas reduction from agriculture, waste and some industry branches. Our country has also significant potential for the implementation of projects on renewable energy sources. These areas provide the field for projects to be implemented within the framework of Joint Implementation. Poland implements actively the mechanism of Joint Implementation through undertaking – on Polish territory – jointly with other countries from Annex I to the UN Framework Convention on Climate Change, measures resulting in emission reduction of greenhouse gases. The will for common realization of the Convention goal, through the mechanism of Joint Implementation was expressed in signed agreements and MoU (Memorandum of Understanding) by the Governments of Finland, Canada, Denmark, the Baltic States and the International Bank for Reconstruction and Development (Prototype Carbon Fund). Poland also participates actively in international programmes and funds dealing with realization of Joint Implementation projects, like e.g. Dutch ERUPT programme. During the pilot phase of Art. 6 mechanism of the Kyoto Protocol – Activities Implemented Jointly (AIJ) the following projects were implemented: - Polish-Dutch project of using cogenerated electrical energy and heat in Szamotuły – completed in December
2000, - Polish-Norwegian project of fuel switch from coal to natural gas in app. 30 non-industrial boiler houses all over
Poland – completed in 2002. The cooperation concerning the proper mechanism of Joint Implementation has led to the acceptance of the following projects: - Polish-Dutch project on the use of biomass from municipal greens for heating purposes in Jelenia Góra –
project completed in October 2001, - Polish-Canadian project on hydro power plant on the Bóbr River at Leszno Górne – completed in 2001, - Polish-Danish project on 30 MW wind farm Zagórze – completed in 2002, 30) OJ L 275 of 25.10.2003 p. 32; OJ EU Polish special edition, Chapter 15, vol. 7, p. 631.

38
- Polish-Dutch project on landfill gas recovery in Konin, - Polish-Danish project on the use of landfill gas and sewage sludge in Zakopane, - Prototype Carbon Fund – project on geothermal heating plant in Stargard Szczeciński – project completed in
March 2005, - Polish-Dutch project on the use of landfill gas in the Warmińsko-Mazurskie Voivodship – project currently under
implementation. There are a number of potential Joint Implementation projects at various stages of preparation, beginning with those in initial phase, and ending with those in advanced phase, which are awaiting final approval. As regards the initial phase of project preparation, the Ministry of the Environment has already issued approximately 30 Letters of Endorsement. Their number is constantly increasing along with the increasing number of submitted JI project proposals. The Polish procedure of analyzing and approval of Joint Implementation projects is consistent with the relevant international guidelines, however it has not yet been officially adopted by the Polish Government. A new act is being prepared which will regulate matters concerning Joint Implementation projects in Poland, providing legal basis for approvals of project, and for project implementation. The new act will also transpose into the national law the provisions of the so-called “Linking Directive” (2004/101/EC)31). The drafted act is expected to enter into force on 1 January 2007. The provisions of the new act will introduce into the Polish law procedures and principles concerning joint implementation projects, thus providing transparent framework that should facilitate their realisation. 3.3. Main obstacles in the implementation of domestic policies and measures Most obstacles have their origin in problems common to most countries that undergo political and economic transition. These problems include: - coal based structure of primary fuels, conditioned historically through availability of own resources and
accompanying social circumstances, - still relatively low energy efficiency of the economy, - dynamic development of road transport.
31) Directive 2004/101/EC of the European Parliament and of the Council of 27 October 2004 amending Directive 2003/87/EC establishing a
scheme for greenhouse gas emission allowance trading within the Community, in respect of the Kyoto Protocol’s project mechanism (OJ L 338 of 13.11. 2004, p. 18).

39
4. MEASURES TAKEN TO FULFIL THE COMMITMENTS UNDER ART. 10 AND 11 OF THE KYOTO PROTOCOL
4.1. Programmes for improving emission factors, activity data and information on socio-economic
models used for preparing greenhouse gas emission projections In making the national greenhouse gas inventory, emission factors are used that come from various sources: - energy – CO2 emission factors for fuel combustion are national factors (for the main fuels they are updated
annually based on empirical functions derived from domestic studies). National emission factors are also used for the assessment of fugitive emissions,
- industrial processes – in some processes default factors are used32) from IPCC methodology or international publications, and in other processes domestic emission factors are used (e.g. for iron and steel production, ammonia, nitric acid),
- agriculture – in enteric fermentation sub-sector for horses and pigs default factors are assumed, while for the other animals (cattle and sheep) domestic factors are used. In manure management sub-sector, default emission factors are used taking into consideration domestic data on shares of different waste management systems. Emission estimates from soils are based on default or literature emission factors,
- land-use change and forestry – for emission assessments from forest areas domestic factors exist, while for the other activities default emission factors are used. The biggest problem remains in removal factors in forests and especially forest soils,
- waste – for this sector default emission factors are used at various stages of calculations, in combination with detailed domestic data.
Domestic emission factors are derived when there are reasons to assume that default emission factors do not reflect national conditions. The necessity of deriving domestic factors results from fragmentary results of various research projects and experts’ assessments. A separate problem is the periodic updating of existing emission factors that undergo changes following technological changes. However, due to financial reasons such updates are made to a limited extent. No socio-economic models are used when compiling the national emission inventories. The source for activity data is the official public statistics and all the changes in assessment of activities result from national and Community law. Projections of the demand for useful energy are made based upon the economic development scenario, energy policy and upon the progress and innovation in energy use. Projections are made for each direction of energy use and for each sector of economy. Models applied for projections of greenhouse gases emissions are described in detail in Chapter 2. Models: BALANCE, MAED and WASP were developed in Argonne National Laboratory, Argonne, Illinois, USA: WASP in the 1970s, while MAED and BALANCE in the 1980s. These models – as a package of analyses of the energy system ENPEP (Energy and Power Evaluation Program) – were distributed freely by IAEA among IAEA member states within the framework of Technical Cooperation Projects. Model MESSAGE was developed in 2000 at IIASA in Vienna and is distributed by IAEA. 4.2. Emission reduction programmes (energy sector, transport, industry, agriculture, forestry, waste)
Energy sector – in order to implement the energy policy the following measures are planned for implementation until 2008: - elaboration of a system of incentives for improving the effectiveness of energy generation, - change of the use structure of energy carriers, inter alia, an increased share of renewable energy sources and
hydrocarbon fuels in the primary energy balance. The impact on the environment will decrease with the application of compressed natural gas and liquid petroleum gas (LPG) in transport, especially in public transport, as well as by adding bio-components to liquid fuels and by using natural gas for electric energy generation,
- development of industry for the benefit of renewable based power sector, - application of clean technologies that enable adherence to environmental standards, inter alia, the development
of technologies that enable utilization of carbon dioxide from flue gases. Transport – to realize in practice the integration of transport policy with environmental policy, from the point of view of reduction of the negative effects of the transport system, the following issues are regarded as particularly important:
32) Emission factors in IPCC Guidelines.

40
- compliance with the principle of improvement and development of the transport system and its branches by implementing long-term plans and strategies;
- raising the competitiveness of other than road transport branches of transport, including: - rail transport, - support for the development of operators of intermodal transport and logistics operators, - promotion of development of short distance maritime transport and ferry shipping, - promotion and support for local initiatives aimed at stimulation of inland shipping, - taking into consideration to an extent possible, aspects of environmental protection, especially nature
protection in designing and construction of transport infrastructure. - development of effective collective transport. Industry – restructuring directions in individual sectors will cover: Hard coal mining – in 2003, the Council of Ministers adopted the Programme of hard coal restructuring in Poland in 2003–2006 with the use of anti-crisis acts and initialization of privatization of some coal mines. The main tasks in the programme include: implementation of structural and organizational changes, adjustment of production capacities to market needs and matching the capacities with employment rates. Iron and steel metallurgy – programme on the restructuring of iron and steel metallurgy until 2006 that was adopted by the Council of Ministers in January 2003, aims at modernization of the sector. The programme includes, among others: - radical cost cuts in all activity areas, - raising competitiveness, especially in domestic market supply, - elimination of ineffective and unprofitable production capacities including closing down and taking over of power
plants as a result of financial and property restructuring and fulfilment of the requirements of the European environmental standards.
Sulphur mining and processing – an attempt to solve the problems in the sulphur mining sector was the elaboration and adoption in 2001 of the governmental Programme of restructuring of sulphur mining and processing in Poland, in which the following goals were formulated: - to bring about economic rationality in as large as possible part of the sector, - liquidation of permanently unprofitable activity areas, and elimination of environmental hazards, which
originated as a result of opencast and drill-hole sulphur exploitation and assuring the remediation (reclamation) of degraded areas.
Zinc and lead mining – the Council of Ministers has set out two basic directions of transformation covering capital consolidation and privatization of companies, which will remain outside capital groups, proceeded by restructuring processes with respect to some plants. Cement industry – apart from modernization measures, cement industry, worked out an adaptation programme to the EU requirements concerning environmental protection. This programme includes an analysis of the EU legislation, analysis of the current environmental impact assessment and sets criteria that must be met by plants that operate in Poland. The program covers practically all cement plants that apply the entire technological cycle, i.e. those that kiln clinker and grind cement. Further actions within the cement industry aiming at reduction of energy intensity, thereby reduction of environmental impact, have to take into account technical conditions. Cement production is an energy intensive process, so the key positions will be related to energy use and will concern – among others – decarbonisation of limestone, fuel combustion in a kiln, and reduction of electrical energy use (mainly for cement grinding). Chemical industry – the policy for the chemical industry is specified in a document: the Strategy for the chemical industry in Poland until 2010, adopted by the Council of Ministers in June 2002. This document anticipates air emission reduction of gases and particulates, reduction of the amount of harmful wastes, reduction of wastewater discharges, implementation of environmental management systems, as well as identification and monitoring of environmental impacts. Agriculture – agricultural programmes cover, inter alia: the use of environmentally friendly methods, preservation of low-productive grasslands and pastures that have high natural values, preservation of habitats that provide refuge for wild nature, changes to agricultural land use for less intensive and profitable, management of uncultivated and waste land, and preservation of domestic animal species and domestic varieties of cultivated plants. Forestry – during 2006–2010, the forest cover is expected to grow, especially following afforestation of privately owned land, with a simultaneous slight decrease of afforested areas in the public sector because of a decreasing
41
supply of land assigned for afforestation in this sector. Afforestation should cover arable land of total area 160 thousand hectares, including 40 thousand hectares in the public sector, and 120 thousand hectares in the private sector. The ten year period of 2011–2020 should see full implementation of the National Programme for the Augmentation of Forest Cover. With the decreasing level of afforestation in the public sector (from 8 thousand hectares in 2006–2010 to 4 thousand hectares in 2011–2020), the non-public land will experience a very significant increase of afforestation up to 36 thousand hectares annually. That means that the total afforested area in the private sector should cover 360 thousand hectares, over the entire period of 2011–2020. Waste – the priority in municipal waste is the prevention and minimization of waste generation. In Poland, the strategy aimed at stepwise reduction of municipal waste includes, among others: - application of financial instruments to encourage manufacturers to limit the amount of waste, - elimination of uncontrolled discharge of municipal waste into the environment, - raising public awareness, - recycling and safe treatment of biodegradable municipal waste, and - construction, reclamation and/or modernisation of local municipal waste disposal sites. The priority in the packaging waste management is prevention of packaging waste generation and limitation of disposal of these wastes at landfills – inter alia – through: organization of collection systems of packaging waste suitable for recycling, promotion of multiple-use packaging in cases that are ecologically and economically justified, and maintaining safety and hygiene requirements, production and application of packaging that are consistent with the requirements of environmental protection and recovering of energy and raw materials from packaging waste. The system of packaging waste management should ensure minimum rates of 50% for waste recovery, and 25% for recycling by the end of 2007. Priorities in hazardous waste management systems cover – inter alia – complete destruction and elimination of PCBs from the environment until 2010, safe for human health elimination of articles containing asbestos, elimination by 2010 of dump sites containing obsolete plant protection chemicals, recover and recycling of lubricants, lead batteries, used equipment containing ozone depleting substances (CFCs and HCFCs) and minimization of hazardous medical waste generation. 4.3. Climate change adaptation programmes
Articles 2 and 4.1(b) of the Climate Convention and Decision 1/CP10 “Buenos Aires programme of work on adaptation and response measures” create the basis to intensify activities to assess and reduce the impact of climate change on the economy also at the level of Parties listed in Annex I of the Convention, including Poland. The need for adaptation is not only the problem of the developing countries. It equally concerns the developed countries, especially those under economic transformation, including the new members of the European Union. 4.3.1. Agriculture The analysis of vulnerability of the agricultural sector to climate change that was carried out in Poland in the late 1990s proves that the following, in particular, are to be expected: - an extended agricultural economic and vegetation period, - widened possibilities to cultivate and obtain increased yields of thermophilous crops, - shorter crop ripening periods, - increased photosynthesis intensity, - reduced yields due to increased pests’ population and plant diseases, - interference of germinating processes resulting from temperature rise, - reduced soil humidity, - increased costs of animal production. Assessment of adaptation costs is complex and difficult. The adaptation of agriculture will be a long-lasting process, considering an additional need for the adaptation of this sector to the requirements of the European Union Common Agricultural Policy. The adaptation processes will mainly include: changes in plant cultivation, agritechnology modifications, changes in the selection of plant species grown and places of cultivation. Costs will depend on the adaptation period. If the adaptation is to be extended over time the annual costs will be smaller. At present, a research project is underway, whose aim is to prepare a regional programme for the adaptation of agriculture in north-eastern Poland with guidelines on good agricultural practice under climate changing conditions.

42
Some of the projected effects of climate change in agriculture are already observed in Poland. A good example is the reduction of thermal barriers for growing corn for seeds, which contributed to increased growing area of this crop. At the same time in the south-eastern part of Poland an increasing harmfulness of the European corn borer (Ostrinia nubilalis Hb) is noted in corn growing, which should be associated with improved thermal conditions favouring the development of this pest. In the course of temperature rise over the last decade the limitations in the production of other thermophilous plants such as soya bean, millet or sunflower, have also declined. Whereas, under the observed increasing trend of the average annual air temperature (by 0.9oC in the 20th century), maintained also in the period of 2001–2010, the vegetation period is likely to become longer, by even as much as 10 days (taverage>5oC). Longer vegetation period will affect changes in the dates of crop sowing and other agritechnical activities. It will also create possibilities for intercrops and stubble after-crops. Increased development rate is of special importance to thermophilous plants such as corn, soya bean, millet and sunflower, whose thermal requirements have limited their growth in Poland in the past. So far, only over small areas of Dolny Śląsk (Lower Silesian Region) and the Sandomierska Basin the probability of corn ripening exceeded 80%. While, the probability north of the Szczecin-Białystok line was below 20%. A simulation that was performed shows that in 2001–2010, further temperature rise will create favourable conditions for growing corn (apart from small areas in the northern Poland and in the mountains), and the probability of corn ripening throughout the country will significantly exceed 80%. Simulation of climate changes in Poland carried out on the basis of GFDL and GISS general models of atmospheric circulation and on statistical and empirical models elaborated for country-specific crop production circumstances correspond, in general, with other yield projections in Europe. Thus, the simulations according to the GFDL scenario showed app. 10% reduction in wheat and rye yields, while according to the GISS scenario the average yields of wheat and rye will only undergo slight changes compared to the present levels. Sugar beet yields will rise by a few per cent, and those of corn, soya bean and sunflower by several dozen per cent. Both scenarios predict very serious decreases in potato yields, and in the case of the GFDL model even to the level of app. 30% of the present yields. The regional variability inside Poland may be, in the case of certain crops (e.g. potatoes), greater than at present, while for other crops – smaller (e.g. corn). It is worth noticing that the prognoses presented above did not take into account other elements of non-climate-related plant cultivation background, such as e.g. the nutritional effect of carbon dioxide, possible changes in the spreading and intensity of agrophages, as well as soil transformation. It also should be added that in higher temperatures the frequency of extreme weather events would possibly be higher, which will specifically affect agriculture. Adaptation of agriculture to the climatic conditions already observed and predicted requires alterations in the organisation of production. Certain measures should be taken now, and others in the long-term. Special attention should be given to appropriate crop rotation. It is extremely important in the production process to adjust the timelines of agritechnical treatment activity to the vegetation conditions of plants (dates of sowing, application of fertilisers and plant protection agents), taking account of regionally-specific production to minimise climate-driven risk of yield losses. 4.3.2. Coastal zone The major measures aimed at the protection of the Baltic Sea coastal zone and adaptation to potential sea level changes have been laid down in the Act of 28 March 2003 on the establishment of a long-term “Programme on the protection of the coastline” (Dz.U. No. 67, item 621). The main tasks of the Programme are to: build, reconstruct and maintain a protection system against flooding of the coastal areas, including removal of damages in the coastal flood control system, to ensure stabilisation of the coastline and to prevent beach declining, as well as to monitor the sea coast. As an example of the activities that have been undertaken may be the sand-feeding of the foreland of the front bank at Krynica Morska on the Vistula Sand-Bar or feeding with sand of the three parts on the Helski Peninsula. Similar work has been carried out at open sea, inter alia, the modernisation of coast strengthening in many places, including Ustka and Ustronie Morskie, the construction of flood embankments on Kopań Lake Sand-Bar, the conservation of the cliff at Trzęsacz, modernisation of the silting pipelines in Kołobrzeg. Artificial feeding, modernisation of bank strengthening or conservation of the flood embankment were also carried out around the Szczeciński Bay. As a result in 2004 actions aimed at protection of the coast from sea erosion were undertaken over a total distance of over 120 km of the Polish coastline. In 2004 the PAN Institute of Hydro-Engineering has finalised updating the assessment of the impacts of Baltic Sea level changes on the Polish coast. The analysis shows that sea water level changes affect app. 2,400 km2 and over 244,000 people. The adaptation costs have been estimated at app. 30 billion USD and 18 billion USD is areas highly endangered by flooding due to Baltic Sea water level rise.

43
4.3.3. Water resources It is expected that climate impact on water management in Poland may be revealed mainly through changes in water balance (outflow and evaporation), inland water quality changes and increased frequency of extreme hydrological events (droughts and floods). Adaptation measures of water management to climate change should be taken in the above-mentioned areas in cases of possible or existing threats to the public and the economy in fulfilling their water demand requirements, or to the safety of the country. Therefore, the problem of preparing water management in Poland for climate change currently resolves itself into monitoring of water balance changes and scientific research aimed at predicting potential changes in this balance in the future and changes of biological, chemical and physical features of the aquatic ecosystems. Research work on climate change impact and water management adaptation to these changes is carried out by different institutes and universities within the framework of their statutory financial resources and individual research grants. It should be mentioned that in 2004 work has been undertaken under a research project entitled Extreme meteorological and hydrological events in Poland. A task entitled Elaboration of a projection model for predicted effects of extreme events and practical measures for reducing risks of threats will be accomplished under this project. An important role in the development of international cooperation in climate research studies and their application in water management is played by Centres of Excellence, established in 2003 and co-financed by the European Commission, inter alia, the Centre of Excellence on Geophysical Methods and Observations for Sustainable Development, established at the Institute of Geophysics of the Polish Academy of Sciences, and the Centre of Excellence in Wetland Hydrology at the Agricultural University in Warsaw. Measures laid down in the Water Management Strategy, prepared by the Ministry of the Environment in 2005 favour the adaptation of water management to changed climate conditions. They include, primarily, enhancement of the effectiveness of protection against floods and drought effects, inter alia, by increasing river valley retention, stimulating actions to retain water in the soil through modernisation of irrigation systems or by building and modernising flood control facilities (reservoirs, water falls, flood embankments, polders). The Strategy also underlines the need for fulfilling future water demands of the public and of the economy in compliance with the principles of sustainable water consumption, by, inter alia, completing multi-functional retention reservoirs and developing the so-called small water retention, as well as by building new retention reservoirs of beyond-regional-level importance. Caring for the quality of water and its availability also lies under the scope of these measures. 4.3.4. Forestry The forecasted climate change may cause a variety of effects to forests in Poland, including, inter alia: - changes of the biotic environment, - limiting capabilities for retaining groundwaters and mitigating extreme surface water flows, - soil degradation and erosion, and landscape steppification, - reduction of fauna and flora genetic resources, - losses of biodiversity and natural landscape. Climate change may also affect the frequency and spatial range of fires, pests and pathogens. Certain social and recreational functions of forests may also undergo limitation. Changes in vegetation caused by climate change and economic use of land will most likely lead to fragmentation of plant species and a decline in the diversity of landscape and biodiversity. The species creating natural vegetation in certain areas now-a-days, may have problems in adapting to new, unfavourable environmental conditions, resulting from climate change in these areas. These species may also be found too far from new places with favourable conditions for their growth, created in the course of climate change, so the colonisation of these places may become impossible. The newly-created plant populations will likely be composed of a small number of species and it is possible to assume that they will be vulnerable to invasions of the more adjusted species of phytophages and pathogens, which in the ecological meaning, will partly restore the species population and biodiversity. The use of non-local species and ecotypes may be justified if the predicted climate change goes beyond the tolerance limits for the local species. It is also essential to establish a system of corridors of nature to allow natural migration of fauna and flora species, along with the changing climatic conditions. Efforts made by Polish foresters to enrich the composition of forest species and to adjust it to the quality of forest habitats have already led over the past 55 years to an increase in the share of broadleaved trees from 13% to 22%,

44
which was also affected by climate warming in this period. It is planned to further increase the share of broadleaved species up to 33% of the total treestand, and the spatial share of multi-species treestands up to 48%, by reducing at the same time the area of pine-tree monocultures. Monitoring of forests shows that the worsening of treestand condition contributes to climate change, including the observed warming and deepening water shortage in many regions of the country. Increased deposition of nitrous compounds and increased atmospheric concentration of CO2 contributing to the eutrophication of forest habitats and enhancement of an increase in the treestand growth are also important factors affecting the treestand condition. This phenomenon makes treestands less resistant to adverse environmental impacts. 4.4. International development assistance The Polish development assistance for countries undergoes constant and significant increase. For instance, in 2004 Poland provided 137.3 million USD for supporting the development of the developing countries and those in transition (mainly the developing countries). This assistance accounts for almost 0.05% of the Polish GDP in 2004. Irrespective of the aforementioned development assistance in 2004 Poland contributed to the development assistance budget of the European Union. Additionally, over 20 million USD was submitted mainly to countries in transition. Activities related to bi- and multi-lateral humanitarian assistance were also undertaken amounting to app. 1 million USD, which was divided among Iran, North Korea, Sudan (Darfur) and the region of South and East Asia. 4.5. Transfer of technology Poland provides support for the promotion of technological development. For instance, the following financial resources were provided in 2004 within the development assistance by: - granting a preferential credit under a combined assistance scheme for Serbia and Montenegro (projects for the
energy and mining sectors), - granting a preferential credit under a combined assistance scheme for China for projects on environmental
protection, as well as on health protection, education, infrastructure, communication and mining. 4.6. Cooperation in scientific research, measurements and observations 4.6.1. Polish contribution to the research activity of the International Geosphere-Biosphere Programme
(IGBP) and its subprogrammes The activity of the Polish National Committee (PKN) of the IGBP covers a broad research and organisational area: - research on the impacts of global changes of the geosphere, biosphere and anthroposphere on the entire natural
environment of the country, - projections and examination of these impacts on domestic economic and social development, - research on increasing extreme events (floods, droughts, hurricanes, landslides, hailstorms, storms, fires, etc.)
and on projections and prevention of their environmental, economic and social effects. PKN IGBP of the Polish Academy of Sciences (PAN) provides information to the national community on the results of research studies, as well as on the development of the IGBP and other international programmes that cooperate with it. Furthermore, the Committee provides inspiration and coordination of priority research studies related to global climatic and environmental changes. The results of Polish research studies are presented at national and international conferences. The Committee constitutes a forum for presenting domestic research studies as well as research projects on global and environmental changes, and on their consequences. A special publication of the Polish National Committee, Papers on Global Change IGBP, presents the results of Polish scientists in global change, and heads for the papers of foreign authors. The Advisory Board of this publication comprises scientists of various research fields representing the world’s science (Japan, Germany, Russian Federation, Switzerland, USA and Hungary). The Committee annually publishes the IGBP Polish Newsletter within its informative and reporting activity.
45
Biospheric Aspects of the Hydrological Cycle (BAHC) Studies on the impact of the unstableness of geophysical processes on domestic water resources with particular consideration of extreme hydrological events, such as floods and droughts, were subject to detailed analysis. The studies undertaken identify hazards of water resources and extreme hydrological events resulting from temperature changes. The problem of droughts was also investigated, inter alia, on the territory of the Wielkopolska region with regard to the requirements of different plant habitats, and the rate of global climate change impact on the river regime was also analysed in selected river basins with different physico-geographical features. The work of Polish scientists has gained international recognition and is used, inter alia, in the reports of the Intergovernmental Panel on Climate Change. In the recent period a team of scientists from ZBŚRiL PAN got involved in research studies under the MICE programme (Modelling the Impact of Climate Extremes, MICE), followed by its continuity – the ENSEMBLES project. Other teams of Polish scientists were also involved in the work on the impact of land-use on water and heat balances, and others in the aspects of the protection of the coast against predicted rise of the ocean level by analysing possible losses connected with those changes and by identifying measures essential for ensuring economic security in this area. Global Change and Terrestrial Ecosystems (GCTE) Stationary research studies on pollution balance in forest ecosystems were carried out in the Carpathians and Sub-Carpathian Basins. Studies on the impacts of global change on the carbon cycle in forest ecosystems and on the effects of forest reclamation in industrial areas were carried out in parallel. Also, monitoring of ion exchange was carried out in the lowland and post-lake ecosystems. By analysing changes taking place in the population of pine forests in the southern cross-section of Europe (from Lapland to the Carpathians) a clear trend was noticed for forest range to move towards the north as climate warming proceeds. Changes in the vertical structure of plant species under global atmospheric temperature rise were subject to analyses carried out in the Carpathians. Research in agriculture focussed on the assessment of climate change impact on plant production and it was carried out mainly in Puławy. These studies proved that the expected temperature changes will have a significant influence on plant production and to ensure production efficiency it would be necessary to introduce changes in crop production structure. Studies on energy and material flows in agricultural landscape form a separate group of issues. Analyses of the consequences of climate change in forestry and estimates concerning adaptation capacities of Polish forests to changed climate conditions were also undertaken that ended up with certain recommendations concerning changes in forest management. The range of avifauna in Poland in the context of observed climate warming was also examined. International Global Atmospheric Chemistry (IGAC) Monitoring of stable and radioactive isotopes in the atmosphere was targeted at discovering the isotopic composition of CO2 and CH4, and the proceeding changes connected with human interference. Research studies on the location of the boundary layer in the vertical profile of the atmosphere in urban areas by using sodar and teledetection methods were also carried out. These studies correspond to research on atmospheric ozone changes, as well as on changes in UV-B radiation and tropospheric ozone. These studies partly include methods for impact assessment of different types of activities on climate and their aim is to establish relevant indicators and greenhouse gas emission standards, as well as to develop methods to reduce adverse effects. A number of studies in this field are of innovatory nature and represent a very high level. Past Global Changes (PAGES)
Research on past environmental changes focussed on the investigation of mechanisms of changes in the last glacial and Holocene periods. Special attention in the glacial period has been given to climate changes registered in loess sediments and to the deglaciation process and permafrost recession. Particularly important was the discovery of one-year old laminas in Lake Gościąż, representing the last 12.5 thousand years. They provided the basis not only for a detailed reconstruction of environmental changes, but also for the calibration of radiocarbon curve and the determination of the duration of the cooling period of the early dryas. Reconstructions of hydrological changes mainly based on analyses of sediments and river forms, as well as landslides, lakes and marshlands were also carried out under international programmes. It was, inter alia, proved that Holocene

46
consisted of more humid phases with a high frequency of extreme events. Vegetation changes were reconstructed using an isotopic method. Polish scientists participate also in interdisciplinary research programmes on the history of Lake Baikal and of Scandinavian lakes, and are involved in the European palinology database. Joint Global Ocean Flux Study (JGOFS) Studies on the integration of solar radiation with the maritime environmental biosphere, on the modelling of hydrophysical field structure, and on energy supply for the seas through photosynthesis were carried out in this area of interest. Several new methods, inter alia, using satellite technology, were developed that are useful for Baltic Sea monitoring. Implementation of the elements of satellite technology in environmental monitoring is currently carried out by IMGW and independently by the PAN Institute of Oceanology and the University of Gdańsk. Polish research studies in polar zones significantly contribute to the knowledge on the impacts of global warming on ocean ecosystems. Land Ocean Interactions in the Coastal Zone (LOICZ) Special attention has been given to the coastal zone in terms of expected global warming leading to sea level rise and possible increase of the frequency of storms and of their strength. Studies on the dynamics of the coastal zones and sea sediments and on the evolution of the Baltic coastline over a longer period of time were also carried out, similar to the modelling of physical processes at river mouths, salt and CO2 exchange in the sea contact zones, as well as the chemistry and pollution of coastal waters. Extended studies on long-term temperature variability of sea water, its salinity, and on the inflow of nutrient substances into the Baltic Sea are carried out in IMGW. International Human Dimensions Programme on Global Environmental Change (IHDP) The IHDP programme gives priority to the "Social attitude as a driving force in the understanding of the causes and effects of changes in the environment and of the use of Earth’s natural resources”. Research has been undertaken to integrate activities of physical, economic and social sciences to improve the understanding of human behaviour in the environment, which leads to its degradation, both at local and global levels. The Polish National Committee of the International Geosphere-Biosphere Programme (PKN IGBP) has taken the role of an initiator to establish the IHDP National Committee. The problem of human activity impacts on global climate change has been a subject of interest of several seminars and conferences, organised by PKN IGBP, as well as of numerous publications. 4.6.2. Cooperation under the World Climate Programme (WCP) Polish scientists and experts actively participate in the work of the WMO and its commissions and individual programmes. For example, the scientists from the Institute for Research on Agricultural and Forest Environment (ZBŚRiL PAN) were involved in research activities under the World Climate Programme – Water aimed at seeking changes, both gentle trends, as well as sudden jumps in the extreme values of the long time series of river flows (for around 200 stations all over the world). Three reports have been published as a result of those studies under the WCASP series (2004), i.e. the World Climate Applications and Services Programme. In 2005 a Climate Atlas of Poland was published. It was prepared by IMGW and it contains a broad spectrum of climate elements observed in 1871–2000 in Poland. Furthermore, a programme for saving historical data, including their scanning and digitization from archive materials, inter alia, from the period of 1930–1950, is implemented in the IMGW. Studies on the variability of climate conditions in Poland based on long-term series of climate data are constantly continued. 4.6.3. Global Climate Observing System (GCOS) Poland has designated the national focal point for cooperation within the GCOS, which is located at the Institute of Meteorology and Water Management (IMGW). Two stations from the territory of Poland were submitted for incorporation into the observation network of the GCOS. Poland was also represented in a regional GCOS seminar organized for Central and Eastern Europe, and thus showed its engagement in this field. This engagement has also been proved, inter alia, by preparing by IMGW at the request of the GCOS Secretariat the regional strategy for the safeguarding of historical materials.

47
4.6.4. Participation in the work of the Intergovernmental Panel on Climate Change (IPCC) The Polish focal point for the IPCC has been designated in 1990 by the Minister of the Environment and it is currently located at the Institute of Meteorology and Water Management in Warsaw. It coordinates work for the IPCC in Poland, provides opinions to IPCC documents and nominates experts to participate in working group sessions and expert meetings. Polish scientists are involved in the preparation and review of IPCC documents and reports. Polish scientists took part in a series of preparatory meetings (the so-called scoping meetings) for the IPCC Fourth Assessment Report (AR4) on climate change. In the work related to the AR4 Poland is represented by Polish scientists preparing chapters on fresh water resources and their management and on the assessment of observed changes and natural impacts of managed ecosystems on climate change. A small group of Polish scientists has been invited by the IPCC to participate in the so-called expert review phase of the report. Polish scientists also participated in the preparation of two special IPCC reports on the protection of the ozone layer and the global climate system, and on carbon dioxide capture and storing, as well as in the preparation of a technical document – Climate change and biodiversity. Polish contribution is also visible in the preparation of two documents supporting national estimates on greenhouse gas emission and removal inventories connected with deforestation and other changes in land use. Polish experts took part, both in the preparation of Definitions and methodology options for emission inventories connected directly with degradation of forests and other plant habitats resulting from human activity, as well as of the Guidebook on good practices in estimation, measurement, monitoring methods and on methods for reporting changes in carbon stocks and carbon dioxide emissions connected with land use, land-use change and forestry. 4.6.5. Participation in the European Programme for the Global Ocean Observing System (EuroGOOS) Polish institutions (IMGW, IO PAN, IM) being members of the EuroGOOS carry out important activities for the development of the European operational oceanography, which will significantly contribute to the Global Ocean Observing System – GOOS. The key element of work carried out under the EuroGOOS is to create and develop a stable system for oceanographic observations and measurements within the Baltic Sea area. 4.7. Educational activity Educational policy in the field of environmental protection currently lies within the competences of two ministers: the minister responsible for education and the minister responsible for environmental issues. Raising public awareness and developing public concern in environment-related matters begins as early as at nursery school, through a six-year primary school, then a three-year gymnasium and post-gymnasium schools. Mandatory programme contents in this matter is included in a document issued by the Minister of National Education – Programme basis for nursery school level and for all school-type education. This document serves as a basis for educational programmes and manuals that are prepared. The Ministry of the Environment is responsible for supporting informal education, and thus the activities aiming at raising awareness in environmental matters that go beyond the official school programme. These activities are of countrywide nature and are addressed to the entire public, with particular consideration of children and youth. Environmental awareness of the public is developed in schools and through different types of actions conducted by public and social organisations and the media. Training of specific profession and social groups also plays a special role. Environmental education in Poland is carried out by a number of institutions. The Ministry of the Environment is involved in developing environmental awareness of the Poles by organising various competitions, exhibitions, conferences, as well as other information and educational events. A significant role in the process of developing environmental approach is played by mass media. The Minister of the Environment is cooperating with a variety of them, especially those that are branch-related, to disseminate updated and reliable information on environmental protection and water management. The Minister organises press conferences on climate change as well as seminars for journalists dedicated to this issue (Climate Convention, the Kyoto Protocol, emissions trading). This theme is also present in radio broadcasts. The Ministry of the Environment publishes an information bulletin on Climate change, which contains a broad package of information, inter alia, on greenhouse gas emission trends, research projects, undertakings for preventing and

48
adopting to future climate change, and on domestic and international measures that are taken. In 2005 the Ministry of the Environment has launched a special environmental website (Ekoportal – ekoportal.com.pl) where information on the environment and its protection is provided. By providing broad communication capacities, the Ekoportal will also develop other forms of communication such as chats, discussion forums, news of the day. The pan-European information and promotional campaign on climate change, prepared by the European Commission and running in 2006, is one of the examples of information and educational activities in which the Minister of the Environment is involved as an organiser or co-organiser. The campaign’s objective is to raise awareness of the Europeans of climate change impacts on the environment they live in and to convince them that each of us can contribute to reducing greenhouse gas emissions into the atmosphere through our every-day activity. Two large promotional and information events planned for 2006 by the Ministry of the Environment will also take place under the key theme of climate change. The first one is a campaign on the European Mobility Week and a Car-free Day. The campaign is targeted at direct engagement in activities related to environmental protection by promoting public means of transport as an alternative to private car transport. In 2005, 87 towns participated in this action, which allowed Poland to rank fourth in Europe (following Spain, Austria and the Netherlands). The second event is the POLEKO International Ecological Fair, which is to take place in November 2006. Climate change will be its theme for this year. It is the largest environmental trade fair in Central and Eastern Europe that creates a platform for information exchange and promotion of the most sophisticated environmental technologies, and gives an opportunity to meet with environmental experts from Poland and from abroad. Many activities related to environmental education are financed by the National Fund for Environmental Protection and Water Management. One of the elements of educational activities of the Minister of the Environment is the cooperation that has been maintained since many years with non-governmental environmental organisations and environmental education centres, whose major task is to develop public responsibility for the state of the natural environment and to encourage to undertake activities for air protection, including climate protection. Educational activities targeted at raising environmental awareness among wider social groups are carried out, inter alia, by environmental education centres, non-governmental organisations, national and landscape parks, Regional Directorates of the State Forests, educational centres of the Promotional Forest Complexes, gmina-owned centres of culture, botanic gardens and zoos. A campaign TIRs on railway tracks serves as an example of such activity and is a part of a campaign for environmentally sound spatial and transport policy conducted jointly by the Citizens’ Environmental Movement and the Greens’ Federation – the Cracow Group. An exhibition has been organised and a folder published under this campaign to promote among the citizens the idea of transporting transit trucks crossing Poland on railway platforms. This exhibition was presented in major Polish cities. The most active non-governmental organisations are involved not only in seeking solutions to local problems but they also participate in providing opinions to drafted legislation, and organise their own, often countrywide, educational actions (e.g. training, conferences, seminars). Their aim is to raise awareness of the Poles on the benefits likely to be achieved thanks to measures taken to reduce greenhouse gas emissions (undertakings combating emissions of greenhouse gases causing climate change – promotion of energy-saving and renewable energy sources, elimination of methane from coal mines and municipal waste landfills, and of freons from production processes), on threats connected with lack of such activity and on the potential consequences of climate change. Activity related to transport, i.e. the economical driving (the so-called “eco-driving”), which is in favour of a significant reduction of fuel consumption and exhaust gas emissions, can serve as an example of information and educational activities targeted towards the need for behavioural change. Many projects have been accomplished in this field, and standards and requirements of the European Aviation Safety Agency (EASA) incorporated into the operational procedures at airports and air carriers, which caused more environmentally sound behaviour. A Climate Coalition has been established in 2003 to disseminate knowledge on threats connected with climate change and to better coordinate the undertakings of the environmental movement in climate protection matters. Nine non-governmental organisations (NGOs) acceded to this open agreement. The Coalition is involved in organising conferences, workshops and thematic training connected with climate change and in publishing guidebooks for different addressees, as well as in an information action through websites and mass media. The following examples are among the educational and information measures that have been taken:

49
- the programme My school protects the Earth’s climate, whose mission was to promote in schools the knowledge on climate change risks and on possibilities of self-reducing our own impacts on the environment through rational use of energy, fuel and water,
- the project Stop to global warming, which contributed to the strengthening of cooperation between environmental non-governmental organisations dealing with global warming, and to the development of a stable form of cooperation in this field,
- the project Institutions friendly to renewable energy sources (RES) – regional and local support for RES in Poland,
- the Polish Energy Efficiency Motors Programme (PEMP), whose aim is to reduce the national CO2 emissions connected with electric power production through effective power use in electric motors. PEMP is an executive programme co-financed by the Global Environment Facility (GEF) under the global climate protection.
In 2006, under the patronage of the Minister of the Environment and the Minister of Economy, the World Wildlife Fund (WWF Poland) has started a countrywide educational campaign on climate change limitation and better use of the energy efficiency potential. Its goal is to disseminate knowledge on climate change, its effects and co-relations between CO2 emissions and Earth’s temperature rise, to become aware of the relationship between the way of energy-use and surplus CO2 emissions, as well as to promote the energy saving and responsible attitudes towards energy use. An electronic quarterly bulletin entitled Climate Bulletin, which has been issued by the Institute for Sustainable Development since 2002 serves as a tool for presenting public opinion with climate change issues and, in particular, climate policy.

50
Abbreviations AIJ Activities Implemented Jointly ARE Energy Market Agency (Agencja Rynku Energii) AR4 Fourth Assessment Report BAHC Biospheric Aspects of the Hydrological Cycle BAT/BEP Best Available Techniques/Best Environmental Practices CDM Clean Development Mechanism CHP Combined Heat and Power CRF Common Reporting Format Dz.U. Polish Journal of Laws (Dziennik Ustaw) EASA European Aviation Safety Agency EBRD European Bank for Reconstruction and Development EC European Commission ENPEP Energy and Power Evaluation Program ENR Enhanced Nutrient Removal ENSEMBLES ENSEMBLES-based Predictions of Climate Changes and their Impacts ERT Expert Review Teams EU European Union EU-15 old EU Member States, before enlargement EU-25 current EU Member States, after enlargement EuroGOOS European component of the Global Ocean Observing System (GOOS) F-gases fluorinated gases GCOS Global Climate Observing System GCTE Global Change and Terrestrial Ecosystems GDP Gross Domestic Product GEF Global Environment Facility GFDL Geophysical Fluid Dynamic Laboratory GHG Greenhouse gases GISS Goddard Institute for Space Studies GOOS Global Ocean Observing System GUS Central Statistical Office (Główny Urząd Statystyczny) IBRD International Bank for Reconstruction and Development IGAC International Global Atmospheric Chemistry Project IGBP International Geosphere-Biosphere Programme IHDP International Human Dimensions Programme IIASA International Institute for Applied Systems IM Maritime Institute (Instytut Morski) IMGW Institute of Meteorology and Water Management (Instytut Meteorologii i Gospodarki Wodnej) IO Institute of Oceanology (Instytut Oceanologii) IPCC Intergovernmental Panel on Climate Change JGOFS Joint Global Ocean Flux Study JI Joint Implementation KASHUE National Administrator of Emission Trading Scheme (Krajowy Administrator Systemu Handlu
Uprawnieniami do Emisji) KPGO National Waste Management Plan (Krajowy plan gospodarki odpadami) KPZL National Programme for the Augmentation of Forest Cover (Krajowy Program Zwiększania
Lesistości) LOICZ Land Ocean Interactions in the Coastal Zone LPG Liquified Petroleum Gas LUCF Land-Use Change and Forestry MICE Modelling the Impact of Climate Extremes MoU Memorandum of Understanding M.P. Polish Monitor (Monitor Polski) - Polish journal of official strategic documents MŚ Ministry of the Environment (Ministerstwo Środowiska) NAP National Allocation Plan (Krajowy plan rozdziału uprawnień do emisji - KPRU) NFOŚiGW National Fund for Environmental Protection and Water Management (Narodowy Fundusz Ochrony
Środowiska i Gospodarki Wodnej) NGOs Non-governmental organisations NIR National Inventory Report

51
ODS ozone depleting substances OJ Official Journal of the European Union PAGES Past Global Changes PAN Polish Academy of Sciences (Polska Akademia Nauk) PEMP Polish Energy Efficiency Motors Programme PHARE Poland and Hungary Assistance for Restructuring of the Economy PKN Polish National Committee (Polski Komitet Narodowy ) RES renewable energy sources R&D Research and Development UNFCCC United Nations Framework Convention on Climate Change USAID US Agency for International Development UV–B ultraviolet radiation type B WCASP World Climate Applications and Services Programme WCP World Climate Programme WMO World Meteorological Organisation WSCH Great Chemical Synthesis (Wielka Synteza Chemiczna) WWF World Wildlife Fund ZBŚRiL Institute for Research on Agricultural and Forest Environment (Zakład Badań Środowiska
Rolniczego i Leśnego) Chemicals: CO2 carbon dioxide CH4 methane N2O nitrous oxide HFCs hydrofluorocarbons PFCs perfluorocarbons SF6 sulphur hexafluoride CFCs chlorofluorocarbons HCFCs hydrochlorofluorocarbons C4F10 perfluorobutane NOx nitrogen oxides SO2 sulphur dioxide Currency: EUR euro USD American dollar Units: Mg megagramme, 1 Mg = 106 g (1 tonne) Gg gigagramme, 1 Gg = 109 g (thousand tonnes) Tg teragramme, 1 Tg = 1012 g (million tonnes) km kilometre m2 square metre ha hectare m3 cubic metre toe tonne of oil equivalent ktoe kilotonne of oil equivalent (thousand tonnes) kJ kilojoule, 1 kJ = 103 J TJ terajoule, 1 TJ = 1012 J PJ petajoule, 1 PT = 1015 J MW megawatt MWth thermal megawatt MWe electric megawatt GWh gigawatt-hour, 1 GWh = 109 Wh