reproductions supplied by edrs are the best that can be ... manpower demonstration research corp.,...
TRANSCRIPT

DOCUMENT RESUME
ED 441 075 CE 079 943
AUTHOR Kemple, James J.; Snipes, Jason C.TITLE Career Academies: Impacts on Students' Engagement and
Performance in High School.INSTITUTION Manpower Demonstration Research Corp., New York, NY.SPONS AGENCY DeWitt Wallace/Reader's Digest Fund, Pleasantville, NY.;
Ford Foundation, New York, NY. International UrbanizationSurvey.; Department of Education, Washington, DC.;Department of Labor, Washington, DC.; Commonwealth Fund, NewYork, NY.; Pew Charitable Trusts, Philadelphia, PA.;Rockefeller Foundation, New York, NY.; George GundFoundation, Cleveland, OH.; Richard King Mellon Foundation,Pittsburgh, PA.; American Express Foundation, New York, NY.;Alcoa Foundation, Pittsburgh, PA.; Russell Sage Foundation,New York, NY.; Center for Research on the Education ofStudents Placed At Risk, Baltimore, MD.; WestinghouseFoundation, Pittsburgh, PA.; Citigroup Foundation, New York,NY.; Bristol-Myers Squibb Foundation, Inc., New York, NY.;Mott (C.S.) Foundation, Flint, MI.; William T. GrantFoundation, Washington, DC. Commission on Youth andAmerica's Future.
PUB DATE 2000-03-00NOTE 200p.; Also sponsored by The Grable Foundation.AVAILABLE FROM Manpower Demonstration Research Corporation, 16 East 34
Street, New York, NY 10016. Tel: 212-532-3200. For fulltext: http://www.mdrc.org.
PUB TYPE Numerical/Quantitative Data (110) Reports Research(143)
EDRS PRICE MF01/PC08 Plus Postage.DESCRIPTORS *Career Academies; Career Education; Dropout Prevention;
*Education Work Relationship; High Schools; *Outcomes ofEducation; *Program Effectiveness; Pupil Personnel Services;School Holding Power; *Vocational Education; *WorkExperience Programs
ABSTRACTThe career academy approach is one of the oldest and most
widely established high school reforms in the U.S., stretching back for morethan 30 years. A large-scale, multi-site, random assignment research designwas conducted to determine the impact of career academies on studentoutcomes. Some of the findings of the study include the following: (1) the
career academies in the study increased both the level of interpersonalsupport students experienced and their participation in career awareness andwork-based learning activities; (2) the career academies substantiallyimproved high school outcomes among students at high risk of dropping out;(3) among students least likely to drop out, the career academies increasedthe likelihood of graduating on time; (4) in academies that greatly enhancedinterpersOnal support from teachers and peers, the dropout rates droppeddramatically; (5) the academies did not improve standardized mathematics andreading test scores; and (6) the impact of the academies and the types ofstudents who participated in them varied greatly from site to site. The studyconcluded that career academies can be an effective means of reducing thehigh school dropout rate and enhancing students' engagement with school,
Reproductions supplied by EDRS are the best that can be madefrom the original document.

especially if they increase personal support of students through involvementwith teachers and peers. (Contains 33 references and two appendixes thatprovide supplementary information about the career academies research studyand strategies for creating subgroups of students defined by at-riskcharacteristics.) (KC)
Reproductions supplied by EDRS are the best that can be madefrom the original document.

reer demnesImpacts on Students' James J. KempleEngagement and Jason C. Snipes
Performance inHigh School
MDRC
March 2000U.S. DEPARTMENT OF EDUCATION
Office of Educational Research and ImprovementEDUCATIONAL RESOURCES INFORMATION/ CENTER (ERIC)
This document has been reproduced asreceived from the person or organizationoriginating it.Minor changes have been made toimprove reproduction quality.
Points of view or opinions stated in thisdocument do not necessarily representofficial OERI position or policy. BEST COPY AVAILABLE

OARD 0 DI
PAUL H. O'NEILL, ChairmanChairmanAlcoa
CTORS
ROBERT SOLOW, Vice ChairmanInstitute ProfessorMassachusetts Institute of Technology
RUDOLPH G. PENNER, TreasurerSenior FellowUrban Institute
MARY JO BANEProfessor of Public PolicyJohn F. Kennedy School of GovernmentHarvard University
JAMES H. JOHNSON, JR.E. Maynard Adams Professor of Business,
Geography, and SociologyDirector, Urban Investment Strategies CenterUniversity of North Carolina
ANNA KONDRATASSenior AssociateUrban Institute
RICHARD J. MURNANEProfessor of EducationGraduate School of EducationHarvard University
MARION 0. SANDLERChairman and CEOGolden West Financial Corporation and
World Savings and Loan Association
ISABEL V. SAWHILLSenior FellowBrookings Institution
LAWRENCE J. STUPSKIChairmanStupski Family Foundation
WILLIAM JULIUS WILSONMalcolm Wiener Professor of Social PolicyJohn F. Kennedy School of GovernmentHarvard University
JUDITH M. GUERONPresidentManpower Demonstration Research Corporation
MDXC

reer Ac demnespact on Students'
Engagement al-RdPerformance inHigh Schoo'
James J. KempleJason C. Snipes
MDXC
March 2000
Manpower DemonstrationResearch Corporation

Fu o dens of the Career Academies Evaluation
DeWitt WallaceReader's Digest FundFord FoundationU.S. Department of EducationU.S. Department of LaborThe Commonwealth FundCharles Stewart Mott FoundationWilliam T. Grant FoundationThe Pew Charitable TrustsThe Rockefeller FoundationThe George Gund Foundation
The Grab le FoundationRichard King Mellon FoundationAmerican Express FoundationAlcoa FoundationRussell Sage FoundationCenter for Research on the Education
of Students Placed At Risk (CRESPAR)Westinghouse FoundationThe Citigroup FoundationBristol-Myers Squibb Foundation, Inc.
Dissemination of MDRC publications is also supported by MDRC's Public Policy Outreach funders: theFord Foundation, Ambrose Monell Foundation, Alcoa Foundation, and James Irvine Foundation.
The findings and conclusions in this report do not necessarily represent the official positions or policiesof the funders.
For information about MDRC and copies of our publications, see our Web site: www.mdrc.org.MDRC® is a registered trademark of the Manpower Demonstration Research Corporation.
Copyright 2000 by the Manpower Demonstration Research Corporation

Contents
Tables and Figures ivPreface viiAcknowledgments ixExecutive Summary ES-I
1 Introduction 1
I. The Origins of the Career Academy Approach and the Policy Contextfor This Report 2
II. Previous Research on Career Academies 6III. A Conceptual Framework of the Career Academy Approach and
Its Potential Impact on Student Outcomes 8
IV. Key Features of the Career Academies Evaluation 13
V. Overview of This Report 18
2 Career Academy Students and Their Patterns of Enrollment in theAcademy Programs 20
I. Students in the Study Sample for This Report 20II. Subgroups of Students Defined by Characteristics Associated with
Dropping Out of High School 26III. Career Academy Enrollment and Attrition Patterns 32
3 Career Academy Impacts on Student Engagement, Performance,and Achievement 43
I. Analysis Issues 44II. Career Academy Impacts for Students in the High-Risk Subgroup 46III. Career Academy Impacts for Students in the Low-Risk Subgroup 56IV. Career Academy Impacts for Students in the Medium-Risk Subgroup 65V. Career Academy Impacts Averaged Across the Student Subgroups 71VI. Conclusions 72
4 Factors Associated with Student Outcomes and the Pattern ofCareer Academy Impacts 74
I. Potential Pathways to Positive Student Outcomes 74II. Sources of Variation Among the Sites That May Be AssOciated
with Differences in Impacts 76
5 The Relationship Between Career Academy Implementationand Impacts 82
I. Contrasting Impacts for Students in the Medium-Risk Subgroup 83II. Contrasting Impacts for Students in the High-Risk Subgroup 89III. Contrasting Impacts for Students in the Low-Risk Subgroup 92IV. Summary 94
Appendix A Supplementary Information About the Career AcademiesEvaluation Research Sample and Data Sources 97
Appendix B Strategies for Creating Subgroups of Students Defined byCharacteristics Associated with Risk of Dropping Out 115
References 134Recent Publications on MDRC Projects 136

Table
ES-1
Tables and Figures
Background Characteristics of Students, by Subgroups Defined by Risk of DroppingOut of School ES-10
2.1 Background Characteristics of Study Sample, by Research Status 21
2.2 Background Characteristics of Study Sample, by Subgroups Defined by Risk ofDropping Out of School 29
2.3 Career Academy Enrollment and Attrition Rates for Selected Subgroups of theAcademy Group 38
3.1 Impacts on Sbhool Enrollment and Attendance for Students in the High-Risk Subgroup 48
3.2 Impacts on Credits Earned and Course-Taking for Students in the High-Risk Subgroup 49
3.3 Impacts on Achievement Test Scores for Students in the High-Risk Subgroup 52
3.4 Impacts on Experiences During the 12th Grade Year for Students in the High-RiskSubgroup 54
3.5 Impacts on Planning and Preparation for College and Work for Students in the High-Risk Subgroup 57
3.6 Impacts on School Enrollment and Attendance for Students in the Low-Risk Subgroup 59
3.7 Impacts on Credits Earned and Course-Taking for Students in the Low-Risk Subgroup 61
3.8 Impacts on Achievement Test Scores for Students in the Low-Risk Subgroup 62
3.9 Impacts on Experiences During the 12th Grade Year for Students in the Low-RiskSubgroup 63
3.10 Impacts on Planning and Preparation for College and Work for Students in the Low-,.
Risk Subgroup 64
3.11 Impacts on School Enrollment and Attendance for Students in the Medium-RiskSubgroup 66
3.12 Impacts on Credits Earned and Course-Taking for Students in the Medium-RiskSubgroup 67
3.13 Impacts on Achievement Test. Scores for Students in the Medium-Risk Subgroup 68
3.14 Impacts on Experiences During the 12th Grade Year for Students in the Medium-RiskSubgroup 69
3.15 Impacts on Planning and Preparation for College and Work for Students in theMedium-Risk Subgroup 70
3.16 Impacts on Selected High School Outcomes for Students in the Study Sample 71
4.1 Students' Perceptions of Interpersonal and Instructional Supports and Participation inWork-Related Activities, by High-Contrast and Low-Contrast Academies 78
5.1 Impacts on Enrollment, Attendance, and Course-Taking for Students in the Medium-Risk Subgroup, by High-Contrast and Low-Contrast Academies 84
5.2 Impacts on Youth Development Experiences and Preparation for the Future for Studentsin the Medium-Risk Subgroup, by High-Contrast and Low-Contrast Academies 87
-iv-

5.3 Impacts on Enrollment, Attendance, and Course-Taking for Students in the High-RiskSubgroup, by High-Contrast and Low-Contrast Academies 90
5.4 Impacts on Youth Development Experiences and Preparation for the Future for Studentsin the High-Risk Subgroup, by High-Contrast and Low-Contrast Academies 91
5.5 Impacts on Enrollment, Attendance, and Course-Taking for Students in the Low-RiskSubgroup, by High-Contrast and Low-Contrast Academies 93
5.6 Impacts on Youth Development Experiences and Preparation for the Future for Studentsin the Low-Risk Subgroup, by High-Contrast and Low-Contrast Academies 95
A.1 Data Availability for the Full Study Sample and the Risk Subgroups 99
A.2 Regression Coefficients for Probability of Being Assigned to the Academy Group forFull Study Sample and by Risk Subgroups 103
A.3 Regression Coefficients for Probability of Being Assigned to the Academy Group,Student School Records Database, for Full Study Sample and by Risk Subgroups 106
A.4 Regression Coefficients for Probability of Being Assigned to the Academy Group, 12thGrade Survey Database, for Full Study Sample and by Risk Subgroups 109
A.5 Regression Coefficients for Probability of Being Assigned to the Academy Group, 12thGrade Achievement Test Sample, for Full Sample and by Risk Subgroups 112
B.1 Relationship Between Baseline Characteristics and the Prnbability of Dropping Out ofHigh School Among Non-Academy Students 119
B.2 Selected Outcomes Among Non-Academy Students, by Risk Subgroups Defined UsingRisk-Factor Accumulation and Regression-Based Index 124
B.3 Outcome Levels for Bootstrap Control Samples and Program Group, by RiskSubgroups 130
Figure
ES-1 Career Academy Impacts on High School Outcomes in the High -Risk Subgroup ES-12
ES-2 Career Academy Impacts on High School Outcomes in the Low-Risk Subgroup ES-13
ES-3 Career Academy Impacts on High School Outcomes in the Medium-Risk Subgroup ES-15
ES-4 Career Academy Impacts on High School Outcomes for the Full Study Sample ES-16
ES-5 Simplified Conceptual Model of the Career Academy Approach ES-18
ES-6 Career Academy Impacts on High School Outcomes for Students in the Medium-RiskSubgroup, by High-Contrast and Low-Contrast Academies ES-20
1.1 Simplified Conceptual Model of the Career Academy Approach 9
1.2 Random Assignment Design 14
2.1 12th Grade Outcomes Among Non-Academy Students, by Risk Subgroup 33
2.2 Career Academy Enrollment and Attrition Patterns Among Students Selected to Enroll 35
B.1 Impact of Career Academies onDropout Rate, by Deciles of the Regression-Based RiskIndex 122
-v-

Preface
Career Academies have existed for more than 30 years, and they can now be found in anestimated 1,500 high schools nationwide. The durability and broad appeal of the Career Acad-emy approach can be attributed, in part, to the fact that its core features offer direct responses to anumber of problems that have been identified in large comprehensive high schools. CareerAcademies consist of small learning communities that aim to create a more personalized andsupportive learning environment for students and teachers. They combine academic and career-related courses in an effort to enhance both the rigor and the relevance of the high school curricu-lum. Career Academies form partnerships with local employers to expand students' exposure tocareer options and skills requirements and to provide them with work-based learning experiences.The primary goals of the Career Academy approach are to enhance students' engagement andperformance in high school and provide them with the credentials and skills needed to make suc-cessful transitions to post-secondary education and, eventually, a career.
This report from MDRC's ongoing Career Academies Evaluation is being released at atime when education policymakers and practitioners are pursuing a number of far-reachingstrategies for improving American high schools. Many of these strategies include principles em-bedded in the Career Academy approach, while others include the Career Academy model as anexplicit component. In short, Career Academies stand at the intersection of several major educa-tion reforms aimed at transforming high schools into nurturing, productive places where studentslearn and grow and are prepared for careers in an economy that demands high skills and adapt-ability.
In partnership with the funding organizations listed at the front of this report and withstaff from the participating sites, MDRC began an in-depth evaluation of the Career Academyapproach in 1993. The primary purpose is to provide policymakers and educators with reliableevidence about the extent to which the Academies deliver on their ambitious goals, outlinedabove. In particular, the evaluation provides a rigorous assessment of Career Academies' effectson a range of education, developmental, and work-related outcomes for high school students. Thestudy also offers lessons about how Career Academies operate and are sustained and about thepathways through which they affect students' engagement and performance during high schooland beyond.
This report marks an important milestone in the Career Academies Evaluation. Previousreports and papers from the study described some distinctive features of the Career Academies,relative to their regular school environments, and examined some differences in the school- andwork-based experiences of Academy and non-Academy students in the study sample. These re-ports concluded that the distinctive features of the participating Career Academies had indeedenhanced students' experiences in school and the workplace. The current report provides evi-dence about the extent to which these enhancements translated into higher levels of school en-gagement and performance and whether Academy students are better prepared than their non-Academy peers to make the transition from high school to further education and the labor mar-ket.
The findings suggest that a growing number of high schools may be on the right path to-ward keeping students engaged in school and preparing them for further education and a career.
-vii-
9

Career Academies reduced dropout rates and improved school engagement among students leastlikely to do well in a regular school environment. While the Academies produced more modesteffects for other students, they created a more supportive school environment for all students andprovided them with more opportunities to explore careers and engage in work-based learning op-portunities. It is not yet clear how the Academies affect students as they navigate the transitionbetween high school and college and the labor market. The evaluation will continue to followstudents in the study sample to assess the Academies' longer-term post-high school effects.
The report draws on a particularly rigorous research design and an unusually rich database.This evaluation has demonstrated the feasibility and benefits of using a random assignment re-search design to determine the impact of Career Academies on student outcomes. A rarity ineducation research, this design provides an especially reliable way of comparing the performanceof students who had access to an Academy with that of a truly comparable group of students whodid not have access to the programs. The database consists of survey information provided byAcademy and non-Academy students in the study sample, performance indicators obtained fromschool records and transcripts, and standardized test scores from a test MDRC administered to asample of the students. The report also draws on qualitative information collected during the manyfield visits to each of the participating sites over the past seven years and through ongoing commu-nication with the staff in the sites. Students in the study sample were identified in the 8th or 9thgrade, and this report follows them through the end of their scheduled 12th-grade year until justbefore they would have graduated from high school.
It is our hope that the Career Academies Evaluation will continue to offer policymakersand educators useful lessons about what works for high school students and about the value ofsubjecting promising school reform approaches to rigorous tests of their effectiveness.
1 0-viii-
Judith M. GueronPresident

Acknowlledgments
This report marks the end of the first phase of the Career Academies Evaluation. Over thelast seven years, the staff at MDRC have had the opportunity to work with and learn from anextraordinary group of sites, funders, and advisers. The products of this collaboration include theimplementation of an exceptionally strong research design and the compilation of a deep and richdatabase. Previous reports from the study have acknowledged the contributions of the manyindividuals and organizations who helped lay the foundation for the evaluation and who playedkey roles in the preparation of those documents. This report is built upon that foundation andowes a special debt to these individuals and organizations.
First, the authors are indebted to the teachers, administrators, students, and employerpartners at all of the Career Academy programs. Their experiences and insights taught us a greatdeal about life in Career Academies and in high schools. We also greatly appreciate the help ofstaff from each of the participating school districts who assisted MDRC in collecting the data forthis report. Second, several key advisers to the evaluation offered useful feedback. In particular,David Stern of the University of California at Berkeley has been invaluable in providingguidance for further analyses and helping us gain better insights into the results. The theoreticalframework for describing the likely effects of the Career Academy approach benefited fromperspectives and analyses provided by James P. Connell and Lisa Bridges of the Institute forResearch and Reform for Education, and from analyses conducted by Lauren Brown, aconsultant to the project.
The following people provided thoughtful feedback on earlier drafts of the report oroffered suggestions at briefings we held to discuss the findings: Kent McGuire and NevzerStacey of the U.S. Department of Education's Office of Educational Research and Improvement;David Goodwin and Marcia Silverberg of the U.S. Department of Education's Planning andEvaluation Service; Patricia McNeil of the U.S. Department of Education's Office of Vocationaland Adult Education; Stephanie Powers, Sharon Belli, and Chris Kulick of the National School-to-Work Office; Lorenzo Harrison, Gerri Fiala, Irene Lynn, Gerald Gunderson, Harry Holzer,David Lah, Eileen Pederson, Daniel Ryan, and Marlin Ferral of the U.S. Department of Labor.
The following individuals from the study's funding organizations provided usefulsuggestions and advice during briefings we held to discuss the early findings: Kathy Beuchel ofthe Alcoa Foundation; Cyrus Driver of the Ford Foundation; Jeffery Glebocki of the GeorgeGund Foundation; Peter Kleinbard and Edward Pauly of the Wallace Funds; Lonnie Sherrod ofthe William T. Grant Foundation; Terry Savage of the American Express Foundation; ChristineSturgis of the Charles Stewart Mott Foundation; and Michelle Yellowitz of the CommonwealthFund.
Leaders from several of the Career Academy network organizations provided usefulfeedback on the findings: Charles Dayton of the Career Academy Support Network; SusanTidyman of the California Department of Education; John Ferrandino and Bonnie Silvers of theNational Academy Foundation; and Natalie Allen of Philadelphia Academies, Inc., and theNational Career Academy Coalition.
Finally, members of MDRC's Education Studies committee also provided valuable

feedback on the findings: Richard Murnane, Anthony Alvarado, Thomas Bailey, Mary Jo Bane,A. Wayne Boykin, Michael Casserly, Jacquelyne Eccles, Richard Elmore, Charles M. Payne, andIsabel Sawhill.
From the beginning of the Career Academies Evaluation, Robert Ivry, MDRC's SeniorVice President for Development and External Affairs, has played a pivotal role in building thepartnerships with sites, funders, and advisers that form the foundation for the study. This reportbenefited greatly from his insights and guidance on sharpening the presentation of the findingsand policy implications. Several MDRC staff members played key roles in acquiring andanalyzing data for the evaluation. Anita Kraus, with help from Joel Gordon, prepared the finalschool records data files for analysis. Special thanks to Richard Hendra for processing thethousands of school transcript records and creating a rich set of outcome measures from them.Susan Poglinco conducted field research activities in several of the sites and provided usefulinformation about the context within which the programs operated.
Katherine Jamieson provided research assistance, prepared the tables and figures, andcoordinated the production of this report. Howard Bloom, Hans Bos, Charles Michalopoulos, andWinston Lin provided valuable perspectives and guidance on the strategy used to identify thesubgroups discussed in the report. Fred Doolittle, Robert Granger, Robert Ivry, Susan Kagehiro,Marilyn Price, and JoAnn Rock reviewed drafts of the report. Robert Weber edited the report,and Stephanie Cowell prepared the manuscript for publication.
The Authors
x_ D.2

Executive Summary
The Career Academy approach is one of the oldest and most widely established highschool reforms in the United States. Career Academies have existed for more than 30 years andhave been implemented in more than 1,500 high schools across the country. The durability andbroad appeal of the Academy approach can be attributed, in part, to the fact that its core featuresoffer direct responses to a number of problems that have been identified in large comprehensivehigh schools. Career Academies attempt to create more supportive and personalized learning en-vironments through a school-within-a-school structure. Their curricula combine academic andoccupation-related course requirements that aim both to promote applied learning and to satisfycollege entrance requirements. Academies establish partnerships with local employers to buildsequences of career awareness and work-based learning opportunities for their students.
While the basic organizational features of the approach have remained the same since Ca-reer Academies' inception, the goals and target population have changed. The original Acade-mies were designed primarily to prevent dropping out of high school and to increase preparationfor work among students who began high school at high risk of school failure. There is nowwidespread agreement that Career Academies should seek to prepare students for both work andcollege, and that they should include a broad cross-section of students, including those who arehighly engaged in school.
There has been a great deal of research on the Academy approach. Nevertheless, previousstudies have been unable to determine reliably whether differences between Academy students'high school experiences and outcomes and those of other students result from the Academy itselfor from the program's student targeting or its selection practices. Further, little is known aboutthe relative effectiveness of Academies for different groups within the broad cross-section of stu-dents they now serve. There have also been few opportunities to explore the extent to which dif-ferent contexts and implementation strategies may influence the effectiveness of the Academyapproach.
This evaluation has demonstrated the feasibility and benefits of using a large-scale, multi-site random assignment research design to determine the impact of Career Academies on studentoutcomes. A rarity in education research, this design provides a uniquely rigorous way of com-paring the performance of students who had access to an Academy with the performance of atruly comparable group of students who did not have access to the programs. In order to addressa number of key policy issues for Academies and related high school reforms, this report focuseson three questions:
To what extent does the Career Academy approach alter the high school envi-ronment in ways that better support students academically and developmen-tally?
To what extent does the Career Academy approach change educational, em-ployment, and youth development outcomes for students at greater or lesserrisk of school failure?
ES - 1 r3

How do the manner and context in which Career Academy programs are im-plemented influence their effects on student outcomes?
This report marks a milestone in the Manpower Demonstration' Research Corporation's(MDRC) 10-year Career Academies Evaluation, which is being, supported by the U.S./Depart-ments of Education and Labor and by 17 private foundations and organizations. The report fo-cuses on over 1,700 students who had applied for one of nine Career Academies participating inthe evaluation.' The participating Academies were able to, implement and sustain the basic fea-tures of the approach and have adapted to a wide range of local needs and circumstances. Theyinclude a range of technical, service-oriented, and business-related career themes and are locatedin small cities and large urban school districts. Students in the study sample were identified whenthey were in 8th or 9th grade, and this report follows them through the end of their scheduled 12th-grade year.
Findings in Brief and Policy Implications
Throughout this report, the term impact refers to differences between outcomes for stu-dents who were randomly selected to enroll in an Academy and those of students who also ap-plied but were not selected to enroll. Academy applicants were assigned to these groups at ran-dom, so there were no systematic differences in the characteristics or school experiences of theapplicants initially. Thus, subsequent differences in outcomes for the two groups reflect increasesor decreases caused by the Career Academies. Following is a summary of the key findings fromthe report.
The Career Academies in this study increased both the level of interpersonalsupport students experienced during high school and their participation in ca-reer awareness and work-based learning activities.
The Career Academies substantially improved high school outcomes amongstudents at high risk of dropping out. For this group, the Academies reduceddropout rates, improved attendance, increased academic course-taking, and in-creased the 'likelihood of earning enough credits to graduate on time.
Among students least likely to drop out of high school, the Career Academiesincreased the likelihood of graduating on time. The Academies also increasedvocational course-taking for these students without reducing their likelihoodof completing a basic core academic curriculum.
In sites where the Academies produced particularly dramatic enhancements inthe interpersonal support that students received from teachers and peers, theCareer Academies reduced dropout rates and improved school engagement forboth high-risk and medium-risk subgroups (about 75 percent of the students
'Ten sites were initially selected for-the evaluation. One of the initial Career Academies was disbanded aftertwo years in the study and was unable to provide sufficient follow-up data to be included in the impact analysis forthis report.
ES - 2
1.4

served). Academies that- did not enhance these supports actually increaseddropout rates and reduced school engagement for some students.
The Career Academies did not improve standardized math and readingachievement test scores.
When the findings are averaged across the diverse groups of students in thefull study sample, it appears that the Career Academies produced only slightreductions in dropout rates and modest increases in other measures of schoolengagement. These aggregated findings, however, mask the high degree ofvariation in effectiveness among different groups of students and across thedifferent program contexts.
The findings that have emerged from the Career Academies Evaluation to date suggestthe following implications for policies aimed at improving high schools and helping studentsprepare for the transition from high school to further education and work.
Career Academies provide a well-defined approach to creating more suppor-tive high school environments and increasing students' exposure to careerawareness and work-based learning activities.
Among students who are most at risk of dropping out of high, school, -CareerAcademies are an effective means of preventing dropout, increasing schoolengagement, and helping students acquire the credentials they need to gradu-ate and prepare for post-secondary education.
Career Academies should continue to serve a heterogenemis population ofstudents. The pervasive positive impacts for students at high risk of droppingout may derive, in part, from exposure to a highly engaged peer group who, onbalance, also benefit from exposure to several key dimensions of the Academyexperience.
If Career Academies do not complement their career-related curriculum andwork-based learning activities with strong interpersonal and academic sup-ports, they risk reducing school engagement for some students. A highlystructured school-within-a-school organization can create a necessary set ofconditions for providing these supports.
Career Academies should build on the effective organizational- enhancementsthey bring to high school reform efforts if they are to improve academicachievement as measured by most standardized tests currently in use. Prom-ising approaches may involve aligning Career Academy curricula with highstandards and providing teachers with the incentives and capacity to deliver onsuch standards.
The above results capture the effects that the Career Academies have had on studentsthrough the end of their scheduled 12th-grade year. The evaluation does not yet include informa-tion about the rates at which these students actually graduated from high school and whether thedropouts eventually returned to high school or pursued an alternative credential. The next phase
ES - 3 15

of this evaluation will include this information and will follow the students in the study samplefor four additional years as they make the transition from high school to post-secondary educa-tion and employment opportunities.
The remainder of this Executive Summary describes the Career Academy approach ingreater detail, including its history, and discusses the current policy context and previous re-search in the Career Academies Evaluation. It then describes the results of the evaluation andtheir implications for policy and practice.
The Career Academy Approach
The Career Academy approach is distinguished by three core features that offer direct re-sponses to several problems that have been identified in high schools, particularly those servinglow-income communities and students at risk of school failure. First, a Career Academy is or-ganized as a school-within-a-school in which students stay with a group of teachers over three orfour years in high school. Such arrangements are often referred to as "small learning communi-ties." The aim is to create a more personalized and supportive learning environment for studentsand teachers. Second, a Career Academy offers students a combination of academic and voca-tional curricula and uses a career theme to integrate the two. Third, a Career Academy estab-lishes partnerships with local employers in an effort to build connections between school andwork and to provide students with a range of career development and work-based learning op-portunities. This definition of an Academy is now commonly accepted and was reviewed by abroad range of researchers, policymakers, and practitioners who have worked closely with CareerAcademies.
The initial Career Academies of the 1970s and 1980s were primarily vocational educationprograms targeted at students who appeared to be at high risk of dropping out of high school. Thecentral goals of these early programs were to keep students engaged in school, provide them withwork-related learning experiences both in the classroom and on the job, and establish clearerpathways between high school and post-secondary employment.
Since the late 1980s, there has been a shift in the primary goals and target population ofmost Career Academies. In particular, there is now wide agreement that the Career Academy ap-proach should be explicitly distinct from traditional vocational education by seeking to preparestudents for both work and college. Vocational education, as defined in federal law and throughits historical legacy, has been directed at preparing young people for occupations that do not tra-ditionally require advanced degrees. In line with what has been called "the new vocational edu-cation," Career Academies now seek to include a broad range of students and to combine a rigor-ous academic curriculum with exposure to extensive information about an industry both in theworkplace and in the classroom. The career theme is used to integrate curricula and provide ex-posure to a broad array of careers in a given field and does not typically focus on preparing stu-dents for jobs in those areas.
The 1990s have seen extraordinary growth in the number of Career Academies around thecountry. There are estimated to be more than 1,500 Career Academies nationwide, representingnearly a 15-fold increase in approximately 10 years; many more Academies are in the planningstages. Much of this growth can be traced to the increasing number of national, state, and district
ES - 4
6

Academy support networks. Although most Career Academies share the approach's basic ele-ments, the Academy model has been adapted to a wide range of local needs and circumstances,resulting in a variety of versions that emphasize different features over others.
The expansion of Career Academy target populations and goals and the rapid growth in thenumber of Academies have raised several questions about how the Academy approach may be af-fecting students' performance in high school. How well does it meet the needs of a much broaderrange of students than it was initially designed to serve? Is the Academy approach more effectiveunder some conditions than under others? Which features of the Academy model make the mostdifference for students? MDRC's Career Academies Evaluation is intended to shed light on theseand other questions.
The Current Policy Context
This report is being released at a time when education policymakers and practitioners arepursuing a number of far-reaching strategies for improving American high schools. Many ofthese strategies include principles embedded in the Career Academy approach, while others in-clude the Career Academy model as an explicit component. Two key policy initiatives are par-ticularly relevant.
First, states, school districts, and employers are now looking for strategies and ap-proaches that can build on the foundation established by the School-to-Work Opportunities Act(STWOA) of 1994. STWOA was aimed at enhancing the relevance and rigor of school- andwork-based learning and at creating clearer pathways between high school and post-secondaryeducation and careers. This was to be done primarily through partnerships between schools andlocal employers. STWOA specifically identifies Career Academies as a "preferred approach" tocreating such partnerships and implementing the principles embedded in the legislation. STWOAis scheduled to sunset in 2001 adding urgency to these efforts and heightening interest in con-crete evidence of the potential payoff of Career Academies.
Second, the U.S. Department of Education has committed itself to several initiativesaimed specifically at addressing problems that are unique to high schools. Many of these initia-tives are being supported under the Comprehensive School Reform Demonstration developedwithin the Office of Educational Research and Improvement (OERI) and the New AmericanHigh Schools established by the Office of Vocational and Adult Education (OVAE). Althoughmost of the strategies that are being developed involve comprehensive reforms of entire highschools, many include key elements of the Academy approach, including the creation of a smallschool-within-a-school, integration of academic and vocational curricula, and the establishmentof partnerships with employers and other organizations in the community.
The findings presented in this report will shed light on the extent to which the CareerAcademy model, and some of the high school reform approaches embedded in the model, canachieve the goals sought by their proponents.
ES - 5 17

The Career Academies Evaluation
In 1993, MDRC began an evaluation of the Career Academy approach as it had been de-fined in previous research and implemented in a broad range of settings across the country. Theevaluation's primary goal is to provide policymakers and educators with reliable evidence aboutthe impact that Career Academies have on students' success in high school and their transition tofurther education and the labor market. The evaluation will also offer lessons about how CareerAcademies operate and are sustained and about the pathways through which Academies affectstudent engagement and performance in school.
The current report is based on information collected over a six-year period and focuses onnine high schools and their Career Academies.' Each of the Academies had established the basicCareer Academy components described earlier: a school-within-a-school organization, anintegrated academic/vocational curriculum, and employer partnerships. Moreover, this combinationof features was not available elsewhere in the participating high schools.' These Academies wereselected to include school districts and high schools reflecting the typical conditions (large urbancenters and small cities) under which Career Academies have been implemented across the country.MDRC was specifically interested in Academies serving a broad range of students, including thosewho were perceived to be at risk of not succeeding in the regular high school environment. Most ofthe school districts in the evaluation are large and enroll substantially higher percentages ofAfrican-American and Hispanic students than school districts nationally. On average, these schooldistricts have higher dropout rates, higher unemployment rates, and higher percentages of low-income families.
The Career Academies Evaluation is a rarity in the field of education research in that ithas demonstrated the feasibility and benefits of implementing a large-scale, multi-site randomassignment research design within an ongoing high school program. This was made possible be-cause each of the Career Academies in the study received applications from approximately twiceas many students as it was able to serve. This reports focuses on a sample of 1,764 students (re-ferred to in this report as the study sample) who applied for one of the Career Academies selectedfor the study. Of these, 959 students were randomly assigned to the program group (referred to inthis report as the Academy group) and were accepted for admission to the Academies. The re-maining 805 students were randomly assigned to a control group (referred to in this report as thenon-Academy group) and were not invited to participate in the Academies, although they couldchoose other options in the high school or school district.
The random assignment process ensured that there were no systematic differences betweenthe two groups of students in terms of their observable and unobservable background characteris-tics, prior school experiences, and initial motivation and attitudes toward school. Any systematic
'For a more detailed description of the criteria and process used to select sites for this study, see James J. Kem-ple and JoAnn Leah Rock, Career Academies: Early Implementation Lessons from a 10-Site Evaluation (NewYork: MDRC, 1996).
'Although some participating high schools do operate other programs that they classify as Career Academies,information collected for this study indicated that most such programs do not include all the basic components ofthe Academy approach described earlier. As a result, the participating Career Academy programs represent a clearcontrast with the other programs in the high schools.
ES - 6
18

differences that subsequently emerged between the groups can be attributed with confidence to dif-ferences in their access and exposure to the Career Academies.
MDRC obtained data for this report from four sources:
o school transcript records, including information about students' daily atten-dance rates, credits earned toward graduation, and course-taking patterns;
o student surveys that asked a wide range of questions about school experi-ences, employment and work-related experiences, extracurricular activities,preparation for college and post-secondary jobs, and plans for the future;
o standardized math computation aid readi i g comprehension tests admin-istered to 490 students from the study's sample (from both the Academy andthe non-Academy groups) at the end of their 12th-grade year;4 and
o qualitative field research conducted throughout the evaluation to documentAcademies' characteristics, local contexts, staff, students, and employer part-ners.
Students in the study sample were identified at the end of 8th or 9th grade. This report fol-lows them for three or four years through the end of their scheduled 12`h-grade year, until justbefore they would have graduated from high school. The primary focus of the report is on out-comes measured at the end of students' scheduled 12th grade year. Unless otherwise noted, theimpact findings discussed in the report are statistically significant, indicating that one may have ahigh degree of confidence that measured differences in outcomes between the Academy and thenon-Academy groups were not a result of chance.
Previously Reported Findings on How Career Academies Changed Students'High School Experiences
The previous reports from this evaluation examined the extent to which Career Acade-mies changed the high school environment as indicated by differences between Academy andnon-Academy students' experiences during high school.' Following is a brief overview of keyfindings from these reports.
o The Career Academies enhanced the degree of interpersonal support stu-dents received from teachers a i. d peers.
'The test instrument comprised the reading comprehension and math test batteries from the National Educa-tional Longitudinal Survey of 1988 (NELS: 88) Follow-up Study. A total of 490 students from the study samplecompleted the test, including both high school dropouts and students who remained enrolled in school.
'For a more detailed discussion of these findings, see James J. Kemple, Career Academies: Communities ofSupport for Students and Teachers: Emerging Findings from a 10-Site Evaluation (New York: MDRC, 1997);James J. Kemple, "Selected Dimensions of Applied Learning in Career Academy Classrooms," unpublished MDRCpaper, 1997; and James J. Kemple, Susan M. Poglinco, and Jason C. Snipes, Career Academies: Building CareerAwareness and Work-Based Learning Activities Through Employer Partnerships (New York: MDRC, 1999).
ES -

During their early years in high school, Academy students received more support fromtheir teachers and peers than did their counterparts in non-Academy high school environments.For example, compared with their non-Academy peers, Academy students reported that theirteachers had higher expectations of them and that teachers provided them with more individual-ized attention. Moreover, compared with their non-Academy counterparts, Academy studentswere more likely to report that their classmates were highly engaged in school and that they hadmany opportunities to collaborate with their peers on school and work-related projects.
Career Academies increased students' participation in career awarenessand work-based learning experiences during high school.
Academies also increased students' exposure to work-related learning experiences inschool and in the workplace. Academy students were more likely than their non-Academy peersto be exposed to career-related themes or activities in the classroom. They were also more likelyto participate in career-related activities such as job-shadowing or field trips. Finally, Academystudents were more likely than non-Academy students to participate in a planned program ofwork experience and to have high-quality work-based learning experiences during high school.
® The Career Academies in this evaluation demonstrated their capacity toattract large numbers of applicants and to include students with a widerange of demographic and education characteristics.
The growth of the Career Academy movement has been accompanied by questions aboutwhether the programs can and should serve a broad range of students and about which studentsbenefit most from them. Reflecting the shift in goals and target populations of Career Academiesnationwide, the programs in this evaluation attracted a mix of students including those at risk ofdropping out of high school or failing academically as well as students who had done well inschool. Most of the students in the study sample are from minority backgrounds 56 percentare Hispanic, and 30 percent are African-American reflecting the racial and ethnic make-up oftheir communities. Also, more than one-third of the students came from single-parent house-holds, and about one-quarter indicated that their families received public assistance. At the sametime, just under half the students reported that both their parents were employed, and about one-third reported that at least one parent had attended college.
Approximately 88 percent of the students selected for admission to a Ca-reer Academy actually enrolled in the programs, and 58 percent of thoseselected remained in an Academy throughout high school.
Of the students who were initially selected for admission, about 12 percent chose not toenroll, and another 30 percent enrolled in the programs and then left before the end of their 12th-grade year. It is unclear how much of this attrition could possibly be controlled or avoided by theCareer Academies. Student mobility and early dropout are common in most urban school dis-tricts, and they were reasons for attrition from the Academies in this evaluation. Just under one-quarter of the students who never enrolled in an Academy or who enrolled and then left reportedthat they did so because their families moved and they had to transfer to other schools. Another20 percent reported that they were asked to leave the programs or dropped out of high school al-together. The remaining students (approximately 55 percent of those who were not enrolled in anAcademy in the 12th grade) chose not to enroll or chose to leave the programs. The most common
ES - 8
20

reasons students gave for not enrolling or for not remaining enrolled in an Academy were thatthey wanted to enroll in another program, they lost interest in the occupational area, or they didnot think the Academy would help them get into a good college.
The Impact of Career Academies on Student Outcomes
The central theme that has emerged from the Career Academies Evaluation thus far is thatthe Academies affected the outcomes for students who were likely to drop out of high schoolmuch more than they affected the outcomes for other students. When the results are averagedacross the diverse groups of students they serve, it appears that the Academies produced onlyslight reductions in dropout rates, modest improvements in students' progress toward high schoolgraduation, and increases in career-related course-taking and involvement in positive youth de-velopment activities. These aggregate results mask a high degree of variation in the CareerAcademies' potential to make a difference and in the actual differences they made for some stu-dents.
To assess this variation in impacts, the study sample was divided into three subgroupsbased on selected background characteristics and prior school experiences. These characteristicswere chosen as indicators of students' engagement in school at the time they applied for anAcademy and as factors associated with the likelihood of their eventually dropping out of school.(See Table ES-1 for a list of the background characteristics used to define these subgroups.) Justover one-quarter of the students were classified as being in the high-risk subgroup and reflectedthe combination of characteristics associated with the highest probability of dropping out amongthose in the non-Academy group. Approximately one-quarter of the students in the sample wereclassified as being in the low-risk subgroup and reflected the combination of characteristics asso-ciated with the lowest probability of dropping out among those in the non-Academy group. Theremaining students (approximately half the sample) were defined as being in the medium-risksubgroup.
Because each of the characteristics used to define the subgroups was measured beforestudents were randomly assigned to the two main study groups, there are no systematic differ-ences in observed background characteristics between Academy and non-Academy groupswithin each of the three risk subgroups.' The following sections summarize the impact findingsfor these subgroups.
'The definition of these subgroups involved analyses using background characteristics to predict dropping outamong students in the non-Academy group. This generated an index of average characteristics of likely dropoutswho did not have access to an Academy. The index was then calculated for the Academy group using the samecharacteristics. Because the predicted relationship between background characteristics and dropout rates was basedon the non-Academy group, however, it is likely to yield somewhat more accurate predictions of likely dropouts forthat group than for the Academy group. This means that the dropout rate for the students in the high-risk non-Academy group may be artificially high. Extensive analyses were conducted to identify the potential magnitude ofthis distortion. These analyses indicate that whatever distortion exists is minimal and could not have changed thepattern of impacts. This issue is discussed in greater detail in Appendix B of the report.
ES - 9
2i!

Table ES-1
Career Academies Evaluation
Background Characteristics of Students,by Subgroups Defined by Risk of Dropping Out of School
High-RiskSubgroup
Medium-RiskSubgroup
Low-RiskSubgroup
Characteristic (%) (%) (%)
Characteristics associated with dropping out of school
Attendance rate, year prior to random assignment96-100% 24.4 52.5 91.091-95% 23.6 32.3 7.986-90% 18.7 11.7 1.085% or lower 33.3 3.6 0.2
Credits earned in 9`h grades5 or more credits. 47.2 93.8 100.03-4 credits 35.1 6.3 0.02 or fewer credits 17.7 0.0 0.0
Grade point average in year of random assignment°3.1 or higher 12.5 37.2 58.62.1-3.0 25.5 44.0 39.32.0 or foWer 62.0 18.7 2.1
Student is overage for grade level` 43.0 18.2 2.4
School mobility°0 or 1 different school2 or more different schools
50.050.0
71.928.1
99.01.0
Student has sibling who dropped out of high school 42.7 17.5 0.5
Sample size (N=1,764) 474 869 421
SOURCES: MDRC calculations from the Career Academies Evaluation Student Baseline Questionnaire and StudentSchool Records Databases.
NOTES: All characteristics were measured at the time students applied to the Career Academy program and prior tobeing randomly selected to the Academy and non-Academy groups.
Invalid or missing,values are not included in individual variable distribution. Rounding may cause slightdiscrepancies in calculating of sums and differences.
Statistical significance tests are not included.
aThis was applicable only to students who applied to the Career Academy at the end of their 9th-grade year.bGrade point averages were converted to a standard 4.0 scale from 100-point or 5-point scales forsome sites.
CA student is defined as overage for grade at the time of random assignment if she or he turned 15 before thestart of the 9t° grade, or 16 before the start of the 10th grade. This indicates that the student was likely to have beenheld back in a previous grade.
dSchool mobility is defined as the number of schools attended since the 151 grade beyond the number expected to
result from piomotions in grade level or graduations.
ES - 10 22

Career Academy Impacts for Students in the High-Risk Subgroup
As shown in Table ES-1, students in the high-risk subgroup entered the study with back-ground characteristics and prior school experiences indicating that they were disengaged fromschool. More than half had failed courses during the 9th grade, and about one-third could be clas-sified as chronic absentees (having attendance rates lower than 85 percent). Most of these stu-dents had low grade point averages (2.0 or lower), and over 40 percent had been held back in aprevious grade (as indicated by being overage for their current grade).
Figure ES-1 provides a summary of the impact findings for students in the high-risk sub-group. It shows first that, without access to an Academy, a high percentage of non-Academy stu-dents in the high-risk subgroup had become even more disengaged from school. In all, 32 percentof these students dropped out of high school, and only 26 percent had earned sufficient credits tomeet the district's graduation requirements by the end of their scheduled 12°1-grade year.
0 Among students at high risk of school failure, Career Academies signifi-cantly cut dropout rates and increased attendance rates, credits earnedtoward graduation, and preparation for post-secondary education.
Figure ES-1 shows that the Career Academies produced substantial improvements inmany educational outcomes for students in the high-risk subgroup. In particular, while 32 percentof the non-Academy students in the high-risk subgroup dropped out of high school, 21 percent ofthe Academy students did so. This 11 percentage point difference represents a one-third reduc-tion in the dropout rate for the non-Academy group. This can be classified as a particularly largereduction in dropout rates. Reductions of this magnitude are rare for school-based interventions.
The Academies also significantly increased average attendance throughout high schoolfor students in the high-risk subgroup (not shown in Figure ES-1). Average attendance ratesthroughout high school were approximately 76 percent for students in the non-Academy group,compared with 82 percent for students in the Academy group. This amounts to an additional 11days of school per year over four years.
Moreover, while 26 percent of the high-risk non-Academy group had earned enoughcredits to meet district graduation requirements, 40 percent of the students in the Academy groupdid so (an increase of over 50 percent beyond the non-Academy group average). This suggeststhat, besides improving attendance and preventing students from dropping out, the Academieshelped a significant portion of the high-risk subgroup to make up enough of the initial gap incredits earned to meet the district's graduation requirements three year later.
Also, as indicated by the third set of bars in Figure ES-1, the Academies doubled the per-centage of students in the high-risk subgroup who completed a basic core academic curriculum(four English courses, three social studies courses, two math courses, and two science courses).At the same time, students in the Academy group were significantly more likely than their non-Academy counterparts to complete three or more career-related or vocational courses.
The fifth set of bars in Figure ES-1 indicates that the Academies increased the percentageof students in the high-risk subgroup who reported that they had submitted an application to atwo-year or four-year college by the end of their 121h-grade year. In particular, 35 percent of stu-dents in the high-risk non-Academy group reported submitting a college application, compared
ES-11 23

Figure ES-1
Career Academy Impacts on High School Outcomesin the High-Risk Subgroup
100% -
90% -
80% -
.B7 0% -e
32%
20% -
10% -
0%
40%
32%
58%
51%
61% 63%
Academy
O Non-Academy
3%39%
1 1 1 1 1 1 1 I
Dropped Out Completed Completed 3+ Career or Applied to Applied for Youth Risk-Takingof School Credits to Academic Vocational College Employment Development Behavior
Graduate Core Courses Courses ActivitiesHigh School Outcomes
SOURCES: MDRC calculations from the Career Academies Evaluation Student School Records and 12th GradeSurvey Databases.
NOTE: A two-tailed t-test was applied to differences between Academy and non-Academy groups. Statisticalsignificance levels are indicated as: *** = 1 percent; ** = 5 percent; * = 10 percent.
with 51 percent in the Academy group. Academy students in the high-risk subgroup were alsomore likely to report taking the SATs or ACTs (not shown in the figure).
Finally, the last two sets of bars in Figure ES-1 indicate that Academies did not produce asystematic change in involvement in positive youth development activities or in negative risk-taking behaviors. Positive youth development activities included participation in communityvolunteer work, receiving recognition for participation in academic or extracurricular activities,and receiving an academic award. Negative risk-taking behaviors included coming to school ondrugs, becoming a parent, being expelled from school, and being arrested. Although the differ-ences between the groups shown in Figure ES-1 were not statistically significant, they indicatetrends in a positive direction.
Career Academy Impacts for Students in the Low-Risk Subgroup
Figure ES-2 presents a summary of the impact findings for students in the low-risk sub-group. The results for the non-Academy group indicate that, even without access to the Academyintervention, these students appear to be unlikely to disengage from school. For example, as thefirst set of bars in Figure ES-2 illustrates, only 3 percent of the non-Academy students in thelow-risk subgroup dropped out of high school before the end of 12th grade. Almost the same per-centage of Academy students (2 percent) dropped out.
ES-12 24BEST COPY AVAILABLE

Figure ES-2
Career Academy Impacts on High School Outcomesin the Low-Risk Subgroup
100%
90% -
80% -
. 70%0
;4 60% -tn
50% -ee
la: 40% -
4 30% -
20%
10% -
0%
2% 3%
Dropped Outof School
86%
59%61%J--
77% 00 79%
71%
56%57%
80%
Completed Completed 3+ Career or Applied to Applied for YouthCredits to Academic Vocational Col ege Employment Development
Graduate Core Courses Courses Activities
High School Outcomes
Academy
Non-Academy
16% 16%
Risk-TakingBehavior
SOURCES: MDRC calculations from the Career Academies Evaluation Student School Records and 12thGrade Survey Databases.
NOTE: A two-tailed t-test was applied to differences between Academy and non-Academy groups. Statisticalsignificance levels are indicated as: *** = 1 percent; ** = 5 percent; * = 10 percent.
o Career Academies increased the likelihood that students in the low-risksubgroup were prepared to graduate on time. For these students, theAcademies also increased career-related and vocational course-takingwithout reducing the likelihood of completing a basic academic core cur-riculum.
The second set of bars in Figure ES-2 indicates that the Academies increased the percent-age of students in the low-risk subgroup who earned sufficient credits to meet their district'sgraduation requirement. The figure shows that 86 percent of the Academy students met their dis-tricts' graduation requirement, compared with 75 percent of the students in the non-Academygroup.
Also, while approximately equal percentages of Academy and non-Academy students inthe low-risk subgroup completed a basic core academic curriculum, the Academies significantlyincreased the percentage who completed at least three career-related or vocational courses. Itshould be noted than many students in the low-risk non-Academy group were likely to be en-rolled in their high school's college preparatory programs and courses. Thus, the Academies in-creased vocational course-taking for the low-risk subgroup while enabling students to completeas many core academic courses as their non-Academy peers.
The fifth set of bars in Figure ES-2 indicates that the Academies reduced the percentageof the low-risk subgroup who reported that they had submitted an application to a two-year orfour-year college by the end of their 12th-grade year. Among these students, 79 percent of the
ES 13 25 BEST COPY AVAILABLE

non-Academy group reported submitting a college application, compared with 71 percent of theAcademy group. Although not shown in the figure, this occurred despite the fact that Academyand non-Academy students were equally likely to have taken the SATs and ACTs. In addition,over 85 percent of students in both low-risk groups reported that they had conducted at least amodest amount of research on college options during their 12th-grade year.
Figure ES-2 also shows that Academy and non-Academy students in the low-risk sub-group were equally likely to pursue post-secondary employment opportunities. Further analysesindicated that the Academies do not appear to have induced students to pursue post-secondaryemployment opportunities instead of either a two-year or four-year college. Further follow-up isneeded to determine the effects that the Career Academies may have had on actual college en-rollment and employment during the years following high school graduation. This will be ex-plored further in subsequent reports from the Career Academies Evaluation.
Finally, the last two sets of bars in Figure ES-2 show that the Academies did not producestatistically significant changes in the low-risk subgroup's involvement in positive youth devel-opment activities or risk-taking behavior.
Career Academy Impacts for Students in the Medium-Risk Subgroup
On average, the Career Academies produced little or no change in out-comes for students in the medium-risk subgroup. Results for medium-risk students differed considerably across the participating sites.
The medium-risk subgroup represents approximately 50 percent of the students in thestudy sample. As shown in Table ES-1, the characteristics of this subgroup do not provide a clearindication of likely school success or disengagement. Figure ES-3 presents a summary of impactfindings for students in the medium-risk subgroup. The figure indicates that, on average, theAcademies had little or no impact on most outcomes for these students. As discussed below,however, the results for the medium-risk subgroup differed dramatically across the participatingsites.
Impact Findings for the Full Sample
When averaged across the diverse groups of students and sites partici-pating in the evaluation, it appears that the Career Academies producedonly modest improvements in students' engagement and performanceduring high school.
Figure ES-4 provides a summary of impact findings that are averaged across the fullsample of students in the study. It suggests that the Academies produced only slight (and not sta-tistically significant) reductions in dropout rates and in student involvement in negative risk-taking behaviors. On average, the Academies produced modest increases in the percentage ofstudents who earned sufficient credits to meet district graduation requirements and in student in-volvement in youth development activities. In keeping with one of the central features of theAcademy approach, Figure ES-4 indicates a more substantial increase in vocational course-taking. This increase did not come at the expense of students' being less likely to complete at
ES - 14 26

Figure ES-3
Career Academy Impacts on High School Outcomesin the Medium-Risk Subgroup
100%
90%
80%
a 70%
60%
50%
40%
30%
20%
10%
0%
OlAcademy
1:1Non-Academy
71%69%
CompletedCredits toGraduate
CompletedAcademic
Core Courses
3+ Career orVocational
Courses
Applied toCollege
High School Outcomes
Applied forEmployment
Youth Risk-TakingDevelopment Behavior
Activities
SOURCES: MDRC calculations from the Career Academies Evaluation Student School Records and 12th GradeSurvey Databases.
NOTE: A two-tailed t-test was applied to differences between Academy and non-Academy groups. Statisticalsignificance levels are indicated as: *** = 1 percent; ** = 5 percent; * = 10 percent.
least a basic core academic curriculum. In general, however, according to the full sample find-ings, the Career Academies tended to produce small, positive (but not statistically significant)impacts on many student outcomes. As discussed earlier, these aggregate findings mask a greatdeal of underlying variation that sheds light on the potential strengths and limitations of theAcademy approach.
The Career Academies did not improve standardized measures of readingand math achievement either on average or for any subgroup of students.
According to standardized achievement tests completed by 490 students in the studysample, the Career Academies did not produce any systematic improvement in students' mathand reading test scores. Although impacts on test scores followed trends found for other out-comes, such as academic course-taking, there was no clear pattern of increases or decreases ei-ther on average or among the risk subgroups.
Among students in the high-risk subgroup, average math and reading test scores for theAcademy group were somewhat higher than scores for the non-Academy group. While none ofthe differences was statistically significant, test scores followed this subgroup's trend of in-creases in academic course-taking and total credits earned toward graduation. Academy studentsin the low- and medium-risk subgroups had slightly lower reading test scores than their non-Academy counterparts. This is consistent with the slight (but not statistically significant) reduc-tion in academic course-taking, which was found to be more highly correlated with reading test
a ES - 15
27

Figure ES-4
Career Academy Impacts on High School Outcomesfor the Full Study Sample
100%
90%
80%
70%
0
i60%
°50%ou
2T40%
11'30%
20%
10%
0/
65%
594
72%67% 7%
62% 60% 59%6%
0 Academy
El Non-Academy
48% 46%
24%27%
10%12%
Dropped Out Completed Completedof School Credits to Academic
Graduate Core Courses
3+ Career or Applied to Applied forVocational Col ege Employment
Courses
High School Outcomes
YouthDevelopment
Activities
Risk-TakingBehavior
SOURCES: MDRC calculations from the Career Academies Evaluation Student School Records and 12thGrade Survey Databases.
NOTE: A two-tailed t-test was applied to differences between Academy and non-Academy groups.Statistical significance levels are indicated as: *** = 1 percent; ** = 5 percent; * = 10 percent.
scores than was non-academic course-taking. There was almost no difference in math test scoresbetween Academy and non-Academy students in the low- and medium-risk subgroups.
Several factors may account for these test score findings. First, qualitative field researchinformation collected for this evaluation indicated that academic curricula and instruction in mostof the Career Academies did not differ substantially from those of typical high schools; Academyteachers were required to cover the same basic material as teachers of the same subjects in therest of the high school. Nor were Academy teachers typically provided with professional devel-opment opportunities beyond those offered to their non-Academy counterparts, which focused onstandard-setting and instructional strategies in the academic subjects.
Second, there were some important differences between the sample of students who com-pleted the math and reading achievement tests and those who did not. In particular, the magni-tude of impacts for the achievement test sample was somewhat smaller and more mixed than themagnitude of impacts described above. For example, among students in the high-risk subgroupwho completed the math and reading tests, the Academies produced a somewhat smaller reduc-tion in dropout rates and a somewhat smaller increase in academic course-taking compared withthe impacts displayed in Figure ES-1. Among students in the medium-risk subgroup who com-pleted the test, it appears that the Academies actually reduced academic course-taking. In short,the test score sample does not appear to be representative of the full study sample. Nonetheless,
ES - 16
28BEST COPY AVAILABLE

there was not a systematic difference in background characteristics between the Academy andnon-Academy students in the achievement test sample. Thus, test score impact estimates providea reliable indication of the Academies' impact (or lack of impact) on test scores.
Finally, the types of standardized measures of achievement used in this evaluation, and inmany school districts, may not adequately capture learning gains that Academy students achieverelative to their non-Academy counterparts. As discussed in an earlier report from this evalua-tion, Academy teachers were more likely than their non-Academy colleagues to state that theymade explicit efforts to plan lessons and activities that cut across academic and non-academicsubject areas.' They were also more likely to have students focus on problem-solving activitiesand to integrate problems and examples from the world of work into their lessons. Academy stu-dents were more likely than their non-Academy peers to indicate that they received instructionthat included cross-discipline integration and connections between school-based and work-basedlearning. If the potential benefits of such activities and experiences are of value to schools, theywill likely need to be measured through some alternative forms of assessment.
What Factors Help Explain the Pattern of Career Academy Effects?
Figure ES-5 illustrates a conceptual model of the pathways through which the core or-ganizational features of the Career Academy approach are hypothesized to affect student out-comes during high school and beyond. The first column of the figure lists the three core organiza-tional elements of the Career Academy approach: (1) the school-within-a-school, (2) the integratedacademic and vocational curricula based on the Academy's career theme, and (3) the employerpartnerships. Three types of supports and learning opportunities (the second column in Figure ES-5) are hypothesized to evolve from the core organizational elements and their interaction: (1) en-hanced interpersonal support through the intensive collaboration offered by the school-within-a-school, (2) focused curricula and enriched teaching and learning through the combination of aca-demic and vocational courses, and (3) exposure to career awareness and work-based learning op-portunities through the employer partnerships. Together, these supports are intended to increasestudents' school engagement and prevent them from dropping out, enhance their performance andhelp them meet graduation requirements and prepare for post-secondary education and employ-ment, and promote constructive use of non-school hours by increasing developmentally appropriateactivities and reducing risk-taking behaviors.
For this report, a variety of analyses were aimed at assessing the relationships between stu-dent outcomes and measures of supports and learning opportunities that are likely to arise from theCareer Academy's organizational elements. The findings from these analyses suggest that thestrongest associations appear to exist between the interpersonal supports students received early inhigh school and various measures of their subsequent engagement and performance. The interper-sonal supports include students' perceptions of their teachers' expectations for them, personalizedattention they .receive from teachers, the degree to which they see their peers as being engaged inschool, and the degree to which they have opportunities to work collaboratively with peers.
'James J. Kemple, "Selected Dimensions," cited above.
ES - 17
2'9

Both Academy and non-Academy students who reported that they received particularlyhigh levels of support from their teachers and peers in 9th or 106 grade were less likely to drop outof high school, exhibit chronic absenteeism, or engage in risk-taking behaviors than were studentswho reported lower levels of interpersonal support. They were also more likely to make steady pro-gress toward graduation and to engage in positive youth development activities. One should becautious about making inferences about causal relationships in this regard. For example, studentswho achieve positive outcomes may attract strong support from teachers and peers, rather than theother way around. Nevertheless, the patterns of cross-site impacts described below provide furtherevidence that interpersonal supports are likely to be important antecedents to positive outcomes forstudents.
Figure ES-5
Career Academies Evaluation
Simplified Conceptual Modelof the Career Academy Approach
Career Academy Supports andOrganizational Learning
Elements Opportunities
School-within-a-school organization
Academic andvocationalcurricula based oncareer theme
Interpersonalsupports
High SchoolOutcomes
Employerpartnerships
Focused curriculaand enrichedlearningopportunities
Career awarenessand work-basedlearningopportunities
School engagement
School performance
Youth developmentand risk-takingexperiences
College andemploymentprepa ration
Post-SecondaryOutcomes
College degreesand other educationalattainment
Integration of schooland work
High-wage andcareer- orientedemployment
o In several participating sites, the Career Academies represented a par-ticularly dramatic contrast with their non-Academy school environments.Specifically, these Academies produced particularly large increases in thelevel of interpersonal support students received early in high school, rela-tive to the level experienced by students in the non-Academy environ-ments.
To explore the relationship between changes in the school environment that the Acade-mies represent and the impact that Academies have on student outcomes, the evaluation at-tempted to identify sites in which Academies produced the largest differences in the level of in-terpersonal support students experienced. Specifically, the individual sites in the evaluation were
ES-18
BEST COPY AVAILABLE

ranked according to the difference between the percentages of Academy and non-Academy stu-dents who reported receiving a high level of support from teachers and peers during 9th or 10thgrade. For the purposes of this report, the sites with the largest differences are referred to as high-contrast Academies. In the remaining sites, there was little difference in the level of support re-ported by Academy and non-Academy students; these sites are referred to as low-contrastAcademies.
Finally, there are several important similarities between the two groups of sites. Bothhigh-contrast and low-contrast Academies produced substantial increases in students' exposureto career awareness and development opportunities and their participation in work-based learningactivities. It should be noted, however, that within the two groups of sites, some Academies pro-duced much larger increases in students' exposure to these activities and experiences than others.
The high-contrast Academies produced a consistent pattern of positiveimpacts for students in the medium-risk subgroup. On average, the low-contrast Academies increased dropout rates and reduced academiccourse-taking among these students.
The patterns of impacts fdr students in the medium-risk subgroup differed dramaticallybetween the high-contrast Academies and the low-contrast Academies. As shown in Figure ES-6,in general the high-contrast Academies produced impacts that were similar but smaller in mag-nitude to impacts for students in the high-risk subgroup (Figure ES-1): they reduced dropoutrates, increased credits earned toward graduation, and increased the percentage of students com-pleting a basic core academic curriculum. Figure ES-6 also indicates that the low-contrastAcademies actually increased dropout rates and reduced the percentage of students who com-pleted a basic core curriculum.
While it is not possible to pinpoint the source of differences in impact findings for high- andlow-contrast Academies, differences in program implementation may suggest some explanations.For example, qualitative field research information collected for the evaluation indicated that thehigh-contrast Academies tended to have implemented a tighter school-within-a-school organizationcompared with the low-contrast sites. The high-contrast Academies typically included a core groupof four or five teachers whose responsibilities fell almost exclusively within the Academy. The vastmajority of students in high-contrast sites were scheduled together in at least two or three corecourses, and very few non-Academy students had to be included in the Academy classes (for ex-ample, to ensure adequate enrollments). The high-contrast Academies also tended to be located in adistinct area of the school building or campus. These features of the high-contrast Academies mayhave nurtured a more personalized learning environment and helped students and teachers feel thatthey were part of something unique within the school. The tightly organized school-within-a-schoolmay also have served as a foundation for enhancing instructional supports, curriculum integration,and connections between school and work.
The school-within-a-school organization of the low-contrast Academies tended to be moreloosely structured and typically included several teachers who had responsibilities both in and out-side the Academy. A number of Academy students in low-contrast sites were scheduled in non-Academy sections of core courses, and several of the Academy classes included non-Academy stu-dents in order to ensure adequate enrollments. These aspects of program implementation tended tominimize the contrast between the Academy and non-Academy environments. It is difficult to de-
ES - 19 31

termine how this might account for the apparent reduction in school engagement among the me-dium-risk subgroup in these sites. It may be that without a tightly organized, highly supportiveschool-within-a-school environment, the other aspects of the Academy experience (additional vo-cational courses, career awareness activities, and work-based learning) may have become somewhatof a distraction or burden.
Figure ES-6
Career Academy Impacts on High School Outcomesfor Students in the Medium-Risk Subgroup,
by High-Contrast and Low-Contrast AcademiesFigure 1: Dropped Out of High Schoo
100%
80%
60%
40%
20%
0%
5% 11% ** 13%
IllAcademy
Non-Academy
HighContrail
LowContrast
Figure 3: Completed Academic Core Courses
100%
80%
60%
40%
20%
0%
58%
III Academy
ON on-Academy
54% *0*
HighContrast
LowContrast
Figure 2: Completed Credits to Gradu
100%68% 69%
80% 62% 62%
60%
40%
20%
0%High
ContrastLow
Contrast
toAcademy
ON on-Academy
Figure 4: Earned 3+ Career/Vocational Credits
100%
80%-
60%-
40 %-
20%-
0%
62% **50%
72%
Academy
ON on-Academy
*0*46%
HighContrast
LowContrast
SOURCE: MDRC calculations from the Career Academies Evaluation Student School RecordsDatabase.
NOTE: A two-tailed t-test was applied to differences between Academy and non-Academy groups.Statistical significance levels are indicated as: *** = 1 percent; ** = 5 percent; * = 10 percent.
In general, the patterns of impacts for the high-risk and low-risk subgroups were consis-tent across both groups of sites, with two notable exceptions. First, the low-contrast Academiesproduced a somewhat larger reduction in dropout rates among the high-risk subgroup. Althoughthe difference in impacts on dropout rates was not statistically significant, this pattern is not con-sistent with the hypothesis that greater enhancement of interpersonal supports should lead tolarger reductions in dropout rates. It is not clear what accounts for the pattern. Second, the low-contrast Academies produced somewhat larger increases in vocational course-taking for both thehigh-risk and the low-risk subgroups. This may reflect a greater emphasis on vocational course-taking in low-contrast sites and the fact that, on average, relatively few non-Academy students inthese sites completed three or more career-related or vocational courses during high school.
ST COPY AVABLABLE ES -3()

Po Hey ffmpllications and Lessons for Practice
Although the story of the Career Academies' longer-term effectiveness is not yet com-plete, the findings to date suggest the following implications and lessons.
o The Career Academies in this study demonstrate the feasibility of imple-menting a well-defined and effective approach to creating a more suppor-tive high school environment and increasing students' exposure to careerawareness and work-based learning activities.
Large comprehensive high schools (including those participating in this study) have beencriticized for being impersonal and for preventing students and teachers from working as teamsto create a sense of community and common values. Students in such schools do not have a con-sistent group of teachers who are accountable for their success, and they see few of the sameclassmates from course to course. Teachers rarely share the same group of students with a smallnumber of colleagues, and they have few opportunities to coordinate their coursework withteachers in other disciplines. The findings from this evaluation provide evidence that the CareerAcademies can provide well-defined and effective approaches to addressing such problems.
Another common problem identified in high schools is that students and teachers are iso-lated from other institutions in the community, particularly employers. Such isolation insulatesstudents from the world of work and misses an opportunity to provide them with learning-oriented exposure to it at a particularly formative point in their development. With few connec-tions among classes or between school and work, many students are inadequately informed aboutor are unprepared for post-secondary education and employment opportunities. Even with therise of the school-to-work movement and with the federal School-to-Work Opportunities Act of1994, there has been a struggle to identify widely implemented strategies that address these con-cerns. The findings from this evaluation indicate that Career Academies can provide concreteexamples of partnerships between schools and employers and can substantially enhance students'exposure to career development and work-based learning opportunities.
® Career Academies are an effective means of enhancing the school en-gagement of students who are at high risk of dropping out of high school.
Many of the students served by Career Academies enter high school at a substantial riskof dropping out; many others are likely to become psychologically disengaged from school andto make only limited progress toward graduation. Some of these students have already fallen be-hind or are disengaged when they enter high school, while others come from home environmentsthat lack the support or resources to facilitate academic persistence and success. Without the in-tervention of the Academies, about 1 in 3 of these young people will drop out of high school.Previous research has shown that the economic and social costs of not securing a high school di-ploma are extremely high.
The findings from this evaluation show that the Career Academies substantially reduceddropout rates and substantially improved a variety of measures of school engagement among stu-dents in the high-risk subgroup. Not only are effects of this magnitude and pervasiveness rare inthe world of education policy interventions, but the long-term payoff, if the effects persist, islikely to be large.
-ES - 21 33

o Career Academies should continue to serve a heterogeneous studentpopulation.
Because the largest and most pervasive positive effects in this evaluation were foundamong students in the high-risk subgroup, it might be argued that the Career Academies shouldserve only such students. This approach is likely to create a number of problems, however. First,Career Academies have explicitly attempted to move away from targeting students on the basisof their estimated trajectories for school success in order to avoid the tracking and stigma thathave been associated with vocational and career-related programs. Second, and perhaps moreimportant, it is likely that exposure to a broad cross-section of students particularly those whoenter the programs highly engaged in school is an important factor driving the positive effectsof Career Academies on the high-risk subgroup. Perhaps the presence of other, highly engagedstudents in their classrooms helps increase teachers' attention to and expectations for all students.Excluding engaged students, therefore, would dramatically change the nature of the Academyexperience for students at high risk of dropping out.
o llnterpersonall supports appear to be necessary conditions for maximizingthe positive effects Career Academies have on student engagement. Theschool-within-a-school organization can provide an effective strategy forenhancing these supports.
The findings indicate that enhancing interpersonal supports may be a key element ofschool reform initiatives aimed at increasing retention and engagement in school. A highlystructured school-within-a-school organization can provide some of the necessary conditions forpromoting such supports as personalized attention and high expectations from teachers, high lev-els of peer engagement, and opportunities for teachers and students to work collaboratively. Ca-reer Academies that did not complement their career awareness and work-based learning activi-ties with increased supports (relative to what was already available in the regular school envi-ronment) risked having some of their students become disengaged from school.
o Although Career Academies provide a number of supports necessary tokeep students engaged in school, these have not been sufficient to enhanceachievement, at least as measured by commonly used standardized tests.
The primary added value of Career Academies appears to rest on their enhanced interper-sonal supports and increased access to career awareness and work-based learning opportunities.Although these factors may be necessary to keep many students engaged in school, they were notsufficient to improve student achievement. The findings from this evaluation indicate that theCareer Academies were quite similar to regular school environments in terms of their academiccurricula and typical instructional strategies. From this standpoint, it should not be too surprisingthat the Academies did not I mprove student achievement as measured by the standardized mathand reading tests used in the evaluation. Academies face many of the same challenges that mosthigh schools do in providing teachers and students with appropriate incentives and supports toensure that they focus on clearly specified learning objectives and that they have the capacity tomeet those objectives. The personalized and collaborative nature of the Career Academy'sschool-within-a-school organization can serve as a solid foundation on which to build these en-hancements.
34ES - 22

There is also a question about whether current assessment instruments (including theachievement tests used in this evaluation) adequately capture the distinctive learning gains thatAcademy students may attain. Such skills may include, for example, the type of work-relatedcompetencies outlined in the Secretary's Commission on Achieving Necessary Skills (SCANS)or the presentation and organizational skills often exhibited in student portfolio assessments. Inorder to measure such potential benefits of a Career Academy, school officials may want to con-sider incorporating alternative forms of student and teacher assessment. They may also want todevelop forums that recognize efforts by teachers to integrate academic course content with theapplied learning and problem-solving approaches of high-quality vocational curricula. Few ex-amples of such assessments and incentives currently exist.
Longer-term follow-up is needed to ascertain the effects of CareerAcademies on post-secondary labor market and educational outcomes.
The results in the report summarize the effects that the Career Academies have had onstudents through the end of the year they were scheduled to be in 12th grade. The data do not in-clude complete information about actual high school graduation rates or about the critical transi-tion between high school and post-secondary education and work. Further follow-up is needed inorder to get a more complete picture of the Academies' effectiveness and limitations. For exam-ple, it will be important to determine whether the reduction in dropout rates among students inthe high-risk subgroup translates into higher levels of educational attainment or whether thesestudents simply remain in school longer without earning a diploma or do not go beyond highschool. It will also be important to determine whether the Career Academy experience helped orhindered students in the low-risk subgroup, particularly regarding their actual rates of collegeenrollment and completion. Ultimately, measures of success for Career Academies are likely todepend, in part, on whether the students they attempted to serve are better attached and moresuccessful in the labor market than their non-Academy counterparts.
In order to examine these issues, MDRC's Career Academies Evaluation will continuethrough 2003, following the students in the study sample for up to four years after their sched-uled graduation from high school. As part of this second phase of the evaluation, MDRC will beadministering follow-up surveys to students in the study sample at one year and four years fol-lowing their scheduled graduation. These surveys will provide information about whether thestudents' actually graduated from high school (or received an alternative credential) and abouttheir enrollment and progress through post-secondary education, their labor market experiences,their preparation and planning for the future, and a range of youth development experiences.
ES - 23 35

Chapter 1
Introduction
This report summarizes results from the first phase of the Career Academies Evaluationbeing conducted by the Manpower Demonstration Research Corporation (MDRC). CareerAcademies have existed for over 30 years and have been implemented in approximately 1,500high schools across the country. The durability and broad appeal of the Academy approach canbe attributed, in part, to the fact that its core features offer direct responses to a number of prob-lems that have been identified in large comprehensive high schools.
Career Academies attempt to create more supportive and personalized learning environ-ments through a school-within-a-school structure. Their curricula combine academic and occu-pation-related course requirements that aim both to promote applied learning and to satisfy col-lege entrance requirements. Academies establish partnerships with local employers to build se-quences of career awareness and work-based learning opportunities for their students. The pri-mary goals of the Career Academy approach are to enhance students' performance in high schooland provide them with the credentials and skills needed to make a successful transition to post-secondary education and, eventually, a career.
This is the latest in a series of reports and papers from MDRC's Career AcademiesEvaluation, which is being funded by the U.S. Departments of Education and Labor and 17 pri-vate foundations and organizations. It adds to findings presented earlier in this evaluation in sev-eral ways.
First, this report assesses the impact Career Academies have on students' high school en-gagement and performance and on their preparation for post-secondary education and employ-ment. The previous reports from this study presented descriptive information about the Academyprograms and focused on measures of students' exposure to key dimensions of the Academy ap-proach earlier in their high school careers. This report adds to these findings by following stu-dents in the study sample through the end of their 12th-grade year and by examining a much moreextensive set of student outcomes. It assesses the impact Career Academies have on keeping stu-dents enrolled and engaged in school, on the types of courses they take, on math and readingachievement test scores, on participation in extracurricular activities, on risk-taking behaviors,and on whether students are prepared to enter post-secondary education and employment. As dis-cussed later in this chapter, the evaluation is built on a random assignment research design thatcan provide unusually rigorous evidence about the impact Career Academies have on students.
Second, this report examines the relative effectiveness of the Academy approach for sev-eral key subgroups of students and among the sites represented in the study sample. The previousreports and papers from MDRC's Career Academies Evaluation focused primarily on findings thatwere aggregated across the full sample of students and sites in the study sample. While such find-ings shed light on the implementation and impact of the Career Academy approach more generally,they mask the extent to which the Career Academies may change certain outcomes for some stu-dents but not necessarily for others. They also mask the high degree of variation among the sitesand the ways this variation may be associated with differences in effectiveness. A central goal of
-1- 36

this report, therefore, is to determine how the manner and context in which Career Academies areimplemented affect their capacity to make a difference for students.
Third, this report attempts to push much further in offering lessons about the efficacy ofthe Career Academy approach and of other school reform initiatives that are embedded in it.While the findings presented here provide an assessment of the effectiveness of particular CareerAcademies, the study design and the available data provide unique opportunities to go beyondthis. For example, the sites vary significantly in terms of the types of interpersonal and instruc-tional supports they offer students and in the types of work-related learning opportunities theyprovide. The contrast among the sites and the differences in effectiveness for key subgroups ofstudents provide a rich context for making judgments about what types of school reform initia-tives are likely to be effective and for whom.
Finally, this report serves as a platform for further analyses to determine the long-termimpact of the Career Academy approach. MDRC's Career Academies Evaluation is scheduled tocontinue until 2003, following students for up to four years beyond high school. During this sec-ond phase of the evaluation, MDRC will prepare additional reports examining the effect CareerAcademies have on students' post-secondary outcomes and exploring connections between highschool experiences and success in higher education and the labor market.
The remainder of this introductory chapter sets the context for the Career AcademiesEvaluation and this report. It is divided into four sections. Section I presents a short history ofthe Career Academy approach and sets the current policy context for the evaluation and itsfindings. Section II reviews findings from previous research on Career Academies and high-lights areas where the current evaluation can fill important gaps in what is known about theireffectiveness. Section III describes a conceptual framework for understanding the CareerAcademy approach and its potential effects on students during high school and beyond. Sec-tion IV describes several key features of the Career Academies Evaluation design that are par-ticularly relevant to this report.
The Origins of the Career Academy Approach and the Policy Contextfor This Report
The interpretation and significance of the findings from this evaluation should be viewedin the context of both the history of the Career Academy approach and the current policy initia-tives that intersect with that history. This section of the chapter provides a brief summary of theorigins of the Career Academy approach and an overview of the policy context into which thisreport will be released.
A. The Origins and Growth of the Career Academy Approach
The first Career Academy was established in 1969 in Philadelphia, Pennsylvania.' ThisElectrical Academy was designed primarily as a vocational training program targeted to non-
'For a more detailed history of the Career Academies, see Stem, Raby, and Dayton, 1992; Academy for Educa-tional Development, 1989; Snyder and McMullan, 1987. The term Career Academy was designated by Stern, Raby,and Dayton to encompass all the various strands of academies that had evolved up to that point.
-2-37

college-bound students. Building on the Philadelphia experience, in the 1980s, the Edna McCon-nell Clark Foundation provided initial funding to establish Academies in Pittsburgh, Pennsylva-nia; Portland, Oregon; and Menlo-Atherton and Redwood City, California. Based on the experi-ence of the programs established in Menlo-Atherton and Redwood City (known as the PeninsulaAcademies), the California State Legislature passed a bill providing funding for up to 10 schooldistricts to establish new Academies (later referred to as California Partnership Academies) be-ginning in the 1985-86 school year. Meanwhile, the American Express Company, in collabora-tion with the New York City Public schools, established Academy programs focused on the fi-nancial industry. By the end of the 1980s, it is estimated that there were over 100 Academies inPhiladelphia, California, and the cities that received Clark Foundation start-up grants or supportfrom the American Express Company.
These early Career Academies shared several characteristics that have important implica-tions for the current state of Academies and the Academy movement. First, the initial Academieswere primarily vocational education programs targeted for students who appeared to be at highrisk of dropping out of high school. The central goals of these early programs were to keep stu-dents engaged in school, provide them with work-related learning experiences both in the class-room and on the job, and establish clearer pathways between high school and work. This visionfor the Career Academy approach was adopted, in large part, to deal with many of the majorproblems that were identified with American high schools in the 1970s and 1980s. In fact, thelegislation authorizing funding for the California Partnership Academies expressly states that theprograms must target "educationally disadvantaged high school students," defined as "studentswho are at risk of dropping out of high school."'
Second, the early programs in Philadelphia and California established the basic organiza-tional elements that eventually came to define the Career Academy approach as a distinctive highschool reform initiative. They were organized as schools-within-schools and used a career themeto help coordinate academic and vocational curricula: Each of the programs also establishedpartnerships with local employers to build connections between school and work for its students,and to secure funding for the prograths. Although these organizational features were not used ex-plicitly to define the Career Academy approach until recently, they were clearly identifiable andcould be replicated under a wide range of circumstances.'
Third, beginning with the very first Academies in Philadelphia, there have been efforts todocument their success and to justify their ongoing operation and expansion on the basis of theirevidence. The initial replications sponsored by the Edna McConnell Clark Foundation were un-dertaken, in part, because of the documented success of the Philadelphia Academies. The ClarkFoundation, along with the William and Flora Hewlett Foundation, also provided funding for anevaluation of the first 10 California Academies. The evidence from this evaluation played a keyrole in extending and expanding the state legiSlation to create many more Academies. In additionto evaluation research, the initial Academies were the subject of implementation research todocument strategies for creating and sustaining new programs. This research and documentation
'Stem, Raby, and Dayton, 1992.'Researchers, policy advisors, and practitioners at the Career Academy Support Netwofic engaged in an exten-
sive consensus-building process among various organizations and individuals associated with Career Academies toarrive at a commonly agreed-upon definition of a Career Academy. This definition is articulated in Stem, Dayton,and Raby, 1998.
-3-
38

led to more systematic technical assistance and staff development efforts for both existingAcademies and those in the planning stages.
B. The Current State of the Career Academy Movement
The 1990s have seen extraordinary growth in the number of Career Academies around thecountry. Currently, there are estimated to be approximately 1,500 Career Academies nationwide(nearly a 15-fold increase over 10 years) and many more in the planning stages. Much of thisgrowth can be traced to the increasing number of national, state, and district Academy supportnetworks. As of the 1998-99 school year, the California Department of Education has providedfunding for nearly 200 Partnership Academies. It also provides support for several technical as-sistance and professional development services, including an annual conference. In addition tothe state-funded Partnership Academies, there are estimated to be over 200 other Academies inCalifornia that are patterned after the Partnership Academy model but are supported through lo-cal efforts. Building on the California legislation and Partnership Academy model, Illinois,Florida, Hawaii, and other states have also established statewide networks of Academies. In1988, a consortium of business, labor, and education leaders established the Philadephia HighSchool Academies (PHSA), Inc., to oversee the network of 28 Academies in Philadelphia. Sincethen, a growing number of other cities have developed Academy networks, including Atlanta,Baltimore, Chicago, Denver, Oakland, Pasadena, Seattle, and Washington, DC.
In 1988, the American Express Company and other employer partners established theNational Academy Foundation (NAF) to coordinate the expansion and ongoing development ofthe Academy of Finance model. Since then, NAF has received its largest support from AmericanExpress and Citigroup and has grown to include nearly 400 Academies nationwide. The NAFmodel has also been expanded to include themes in travel and tourism and public service. Re-cently, NAF began work on an Information Technology Academy model.
More recently, there have been other initiatives to create national Academy support net-works, and these networks have begun working together to coordinate their efforts. In 1996, theNational Career Academy Coalition (NCAC) was established by a consortium of technical as-sistance providers including PHSA, Inc., and GMS Partners, which had been providing technicalassistance to Academies in Washington, DC. NCAC received endorsements from several federalagencies led by the U.S. Department of the Treasury, and it offers an annual technical assistanceconference for new and established Academies nationwide. In 1998, the Dewitt Wallace-Reader's Digest Fund provided funding to establish the Career Academy Support Network(CASN) based at the University of California at Berkeley. CASN had led an effort to build con-sensus for a definition of a Career Academy and has developed a range of technical assistancetools for states, school districts, and schools interested in creating new Academies.
In addition to growth in the number of Academies, there has been a shift in the primarygoals and target population of most Career Academies. In particular, there is now wide agree-ment that the Career Academy approach should be explicitly distinct from traditional vocationaleducation by seeking to prepare students for both work and college.' Vocational education, asdefined in federal law and through its historical legacy, has been directed at preparing young
'See Stem, Dayton, and Raby, 1998, for a discussion of the current definition of a Career Academy and its keygoals.
39-4-

people for occupations that do not traditionally require advanced degrees. By contrast, CareerAcademies now seek to include a broad range of students and to combine a rigorous academiccurriculum with exposure to extensive information about an industry, both in the workplace andin the classroom.
Finally, although most Career Academies today continue to share the approach's basicorganizational elements, the Academy model has been adapted to a wide range of local needs andcircumstances, resulting in different versions of the approach that emphasize some features overothers. For example, the NAF network has focused a great deal on creating theme-related curric-ula in finance and travel and tourism, while many of the California programs placed somewhatgreater emphasis on creating smaller learning communities through the school-within-a-schoolstructure. Both types of programs have sought to develop strong employer partnerships. Evenwithin the California, Philadelphia, and NAF expansion efforts there has been considerablevariation in the roles employers played, the strategies used to integrate academic and vocationalcurricula, and the particular characteristics of their school-with-a-school organization. Thisvariation highlights the adaptability of the Academy approach.
The expansion of the target populations and goals of the Career Academy approach, aswell as the rapid growth in the number of Academies, has placed a premium on obtaining high-quality information about how the Academies may be affecting students' performance in highschool. How well does the Academy approach fit the needs of college-bound students, as well asthose who may be at high risk of dropping out? Are Academies more effective under some con-ditions than under others? Which aspects of the Academy approach make the most difference forstudents? MDRC's evaluation is intended to shed valuable light on these and other questions.
C. The Current Policy Context
This report is being released at a time when education policymakers and practitionersare pursuing a number of far-reaching strategies for improving American high schools. In ad-dition to the rapid expansion of Career Academies and Academy support networks, there havebeen several policy and school reform initiatives that build on or directly incorporate the Ca-reer Academy approach. Most notably, the School-to-Work Opportunities Act (STWOA) of1994 was designed to catalyze fundamental changes in the way states and localities supportpartnerships between employers and schools. These partnerships have been aimed at enhancingthe relevance and rigor of school- and work-based learning and at creating clearer pathwaysbetween high school and post-secondary education and careers. STWOA specifically identifiesCareer Academies as a "preferred approach" to creating such partnerships and implementingthe principles embedded in the legislation. States, school districts, and employers are nowlooking for strategies and approaches that can build on the foundation established by STWOAand address some of its limitations.
Federal education policymakers have been considering significant changes to the Ele-mentary and Secondary Education Act (ESEA). Such changes are likely to build on proposalsthat have already been put forward to address problems unique to high schools. For example, theEducational Excellence for All Children Act of 1999 supports education reforms in 5,000 Ameri-can high schools that will aid students by improving schoolwide Title I school programs,strengthening curricula and instruction and providing better professional development opportu-nities for school staff. The act emphasizes the need for creating smaller learning environments,
-5-
40

involving members of the community in schools, and establishing partnerships with other insti-tutions as important ways to promote safer and more supportive schools. These are all elementsthat are present in the Career Academy approach.
The Office of Vocational and Adult Education (OVAE) has established the New Ameri-can High Schools Initiative to showcase high schools that have implemented a diverse set ofstrategies for education reform, particularly focused on preparation for college and work. Theinitiative has provided evidence that high school reforms that are locally driven and standards-based are associated with better attendance and graduation rates for students.
Other researchers and reformers have also been developing a variety of approaches to im-proving high schools. These reforms include High Schools That Work (HSTW), developed bythe Southern Regional Education Board. HSTW is a whole-school, research-based reform de-signed to raise the academic achievement of career-bound high school students by combining thetraditional college preparatory curriculum with vocational classes. The Talent DevelopmentModel High School, developed at the Center for Research on the Education of Students Placed atRisk (CRESPAR), specifically includes Career Academies as a central feature of its reform ap-proach. The program divides large, urban high schools into smaller learning communities: a 9thGrade Success Academy and Career Academies in grades 10 through 12. Project GraduationReally Achieves Dreams (GRAD) was developed by the Houston Public Schools and uses acombination of innovative programs to build students' interpersonal and academic skills. ProjectGRAD begins in elementary and middle schools and then, in high schools, seeks to implementpersonal mentoring relationships and financial incentives for college. Currently, Project GRADis considering implementing a series of Career Academies within secondary schools to ensurethat the gains made in elementary and middle school are sustained and enhanced by small learn-ing communities and integrated curricula. Finally, the Institute for Research and Reform in Edu-cation (IRRE) has developed the First Things First (FTF) initiative in Kansas City, Kansas, tohelp improve feeder systems of elementary, middle, and high schools. The cornerstones of FTFare consistent with key features of the Academy approach, including efforts to create smalllearning communities; build strong relationships among students, parents, and teachers; and fos-ter collaborative and active learning opportunities based on academic standards.
Virtually all these approaches to improving American high schools include principlesembedded in the Career Academy approach and, in some cases, include the Career Academymodel as an explicit component. The findings presented in this report will shed light on the ex-tent to which the Career Academy model, and the key reform approaches embedded in themodel, can achieve the goals that have been espoused by their proponents, including improvingstudents' performance and engagement in high school as well as their preparation for post-secondary education and work.
II. Previous Research on Career Academies
MDRC's Career Academies Evaluation is built on a foundation laid by several earlierstudies of Academies. Some of these have documented the feasibility and institutional growth of
-6-

the Career Academy approach in a range of local settings.' Other studies have included assess-ments of the Academies' effects on student outcomes, such as graduation from high school, en-rollment in post-secondary education, and labor market participation.'
A number of studies have focused on the California Partnership Academies.' Several ofthese studies compared the performance of Academy students with that of other students in thesame high schools who had similar demographic characteristics and prior records of low grades,high absenteeism, and disciplinary problems. The results indicated that the Academy studentsearned more credits and had significantly better attendance, grades, and graduation rates thanstudents in the comparison groups. Other Partnership Academy studies have relied on school re-cords or survey data that compare Academy students with the general high school population.These studies also found that Academy students and graduates outperformed their non-Academypeers.' These results have been highlighted as particularly impressive, given that the state-fundedPartnership Academies are required to recruit a majority of students who have been identified aseconomically or educationally disadvantaged.
Outside California, several other studies using similar methodologies also reported posi-tive results. Evaluations of Academies in Philadelphia found that Academy students had higherattendance and graduation rates than the citywide average.' An evaluation of Academies affili-ated with the Junior Reserve Officers' Training Corps (JROTC) found positive effects on atten-dance, credits earned, grades, and dropout prevention.'
Despite the broad array of research on Career Academies, a number of questions remainunanswered. Most important, several of the prior studies recognized that the positive effects theyfound may actually under- or overestimate the true effects of the Academies on student out-comes." On the one hand, it may have been that these effects were the result of the extra motiva-tion of students who were attracted to the Academies rather than to the unique experiences of-fered by the programs. In other words, the Academies may attract students (even students whosebackground characteristics may indicate a risk of dropping out) who are motivated enough to dowell under a wide range of circumstances. On the other hand, because many Academies explic-itly attempt to serve at-risk students, the true effects of the programs may be understated in caseswhere such students are being compared with the general high school population, which includesmany highly engaged and high-performing students. Many who conducted prior evaluations ofCareer Academies have emphasized that a random assignment research design would be neces-sary to eliminate these types of concern. In recognition of this, the California state legislaturepassed legislation in 1993 authorizing an evaluation of the Academies using random assignmentof students under appropriate circumstances. The governor subsequently approved the presentstudy as that evaluation.
'Snyder and McMullan, 1987; Stem, Raby, and Dayton, 1992; Academy for Educational Development, 1989,1990; Pauly, Kopp, and Haimson, 1995; Stern, Finkelstein, Stone, Latting, and Dornsife, 1994.
'For the most comprehensive summary of this research, see Stern, Raby, and Dayton, 1992.'Stern, Dayton, Paik, and Weisberg, 1989; Stern, Raby, and Dayton, 1992.8Maxwell and Rubin, 1997, 1999; Dayton, 1997; Reller, 1987.'Snyder and McMullen, 1987; Academy for Educational Development, 1989; Linnehan, 1996.10Hansner, Elliott, and Gilroy, 1999; Hanser and Stasz, 1999; Stasz, 1999.'Stern, Raby, and Dayton, 1992.
-7-

A second important set of questions that has not received much attention concerns thevariation in Academy effectiveness across a wide range of contexts and networks. On a relatedissue, little is known about the relative effectiveness of Academies for several key subgroups ofstudents, such as those at high risk of dropping out of high school versus those highly likely to becollege bound. MDRC's Career Academies Evaluation is positioned to answer these questionsand fill other gaps in the research on Academies.
III. A Conceptual Framework of the Career Academy Approachand Its Potential Impact o Student Outcomes
The key goal of this evaluation has been to assess the extent to which Career Academieskeep students engaged in school, help them progress toward graduation, and prepare them forpost-secondary education and work. In an effort to shed light on how and why the Academies door do not affect changes in these outcomes, the evaluation has attempted to articulate a concep-tual framework, or theory of change, for the Career Academy approach. This framework identi-fies many of the key goals that have been proposed for Academies and attempts to make explicitsome of the pathways through which the core elements of the approach are likely to improve out-comes for students. It has also been used to guide the design and implementation of several keyfeatures of the evaluation, including site selection, data collection, and analyses strategies.'
Figure 1.1 is a simplified conceptual model listing the basic Career Academy elements onthe left and showing the hypothesized pathways through which these elements are likely to affectstudent outcomes during high school and beyond. The conceptual model covers four sets of con-structs delineated by the four columns in Figure 1.1:
Career Academy organizational elements that distinguish the Academy ap-proach from the regular high school environments in which it is implemented;
o supports and learning opportunities that are intended to evolve from the or-ganizational elements;
high school outcomes that the Academies aim to improve by enhancing thesupports and learning opportunities in the previous column; and
post-secondary outcomes that reflect some of the long-term goals of theAcademy approach.
'While the concept of grounding program evaluations in theories of change is not new (see Weiss, 1995, for adetailed discussion of theory-based evaluation strategies), this evaluation marks the first attempt to make the theorybehind Career Academies more explicit and then to collect and analyze data to examine empirically the hypothesesembedded in the theory. As such, the conceptual framework articulated in this report, and in the previous reportsfrom the study, does not necessarily reflect a previously agreed-upon set of program characteristics and underlyingprinciples on which Career Academies have been planned, implemented, and sustained. As noted earlier, only re-cently has a commonly agreed-upon definition of a Career Academy been articulated and disseminated. Also, thehistory and diversity of Career Academies highlights the fact that the goals of the approach are broad and evolving.
-8-
y3

Figure 1.1
Career Academies Evaluation
Simplified Conceptual Model
of the Career Academy Approach
Career Academy Supports andOrganizational Learning
Elements Opportunities
School-within-a-school organization
Academic andvocationalcurricula based oncareer theme
Interpersonalsupports
High SchoolOutcomes
Employerpartnerships
Focused curriculaand enrichedlearningopportunities
Career awarenessand work-basedlearningopportunities
School engagement
School performance
Youth developmentand risk-takingexperiences
College andemploymentpreparation
Post-SecondaryOutcomes
College degreesand other educationalattainment
Integration of schooland work
High-wage andcareer-orientedemployment
Linkages among these sections of the framework highlight the pathways through which theAcademies are hypothesized to affect students' experiences and behaviors. The conceptualframework is described briefly below.
A. Career Academy Organizational Elements
School-Within-a-School Organization. In this organizational arrangement, clusters ofstudents share several classes each day and often have the same small group of teachers fromyear to year. The student clusters vary in size but usually range from 30 to 60 students per gradein grades 9 through 12 or in grades 10 through 12. The number of classes students take within anAcademy, and thus the number of teachers they share, also varies from Academy to Academyand from year to year, but usually students take from two to seven Academy classes. Teachers,who come from a variety of academic and vocational disciplines, are scheduled to have mostlyAcademy students in their classes. These teachers make a commitment to meeting with eachother on a regular basis, and they share in decision-making related to administrative policies, cur-riculum content, and instruction. One teacher usually assumes lead responsibility for administra-tive tasks and serves as a liaison with the school principal and other administrators, school dis-trict officials, and employer partners. Students also take some regular classes along with the otherstudents in the high school, and all courses in the Academy are counted as credits toward a highschool diploma. Academy classes are often scheduled in blocks of three or four during themorning, leaving the remainder of the day for regular courses. This block scheduling allows for
-9-4 4 BEST COPY AVAILABLE

special activities during this time: field trips, for instance, or team teaching, or hosting speakersfrom the business community. Teachers also attempt to involve parents in the Academy program,and schools often require parents to attend meetings with their children.
Academic and Vocational Curricula Based on Career Theme. The Career Academies'curricula usually consist of three or more academic courses per year and at least one vocationalor occupation-related course per year that focuses on the selected career theme. These classesenable students to meet high school graduation and college entrance requirements and, at thesame time, provide them with marketable skills. Students take their remaining course require-ments and electives (usually 20 to 50 percent of the credits needed to graduate) outside the Ca-reer Academy in the regular high school. To link the academic and occupational classes, Acad-emy teachers work together to coordinate course content and instructional strategies. They alsofocus on providing instruction in employability skills, both in the occupational theme coursesand in one or more academic courses. Occupational classes, are structured around whole indus-tries: Health Academies, for example, attempt to expose students to diverse medical occupationsin the areas of direct care, technology, and administration. The Academy's career theme is typi-cally chosen on the basis of local employment needs and demand for expertise in the nationalmarketplace.
Employer Partnerships. Career Academies strive to build formal relationships with agroup of employers in their community. In general, the employer partnerships can be definedas ongoing coordinated efforts to engage local employers in supporting the Academy's pro-grams and sponsoring a range of work- and career-related activities for students. The partner-ship typically includes employer representatives, teachers, school administrators, parents, andstudents. Many Academies create formal advisory boards that provide guidance on curricularand extracurricular activity development and may even assist with the management and ad-ministration of the program. Employer partners typically support the Academies by providingadditional material resources or even making financial contributions. Most important, how-ever, is that employer partners contribute the time for their employees to appear as guestspeakers in the school, supervise student internships, serve as mentors for individual students,and provide other kinds of support.
Many Career Academies designate staff who serve as liaisons between the employers andthe Academies and coordinate the various employer-sponsored activities. This role is crucial increating and sustaining the various career development and awareness activities that are offeredto students, both in school and outside school. The people in this role also take responsibility fordeveloping work-based learning opportunities for students and monitoring student involvementin these activities. In some cases, this role is filled by Career Academy teachers who also haveclassroom responsibilities (although, usually, with a reduced course load). In other cases, the roleis filled by non-teaching administrators whose primary responsibilities focus on one or moreAcademies.
B. Supports and Learning Opportunities
The basic organizational elements of the Career Academy approach have particular ap-peal because they offer direct responses to several common structural problems that have beenidentified in high schools, particularly schools serving low-income communities and students
-10-
45

placed at risk of school failure:3 These core elements should be viewed as institutional mecha-nisms that are mutually reinforcing and, together, are intended to facilitate enhancements of in-terpersonal supports and enriched teaching and learning opportunities.
The second column of Figure 1.1 lists the types of supports and opportunities that are hy-pothesized to evolve from each of the three core organizational elements: (1) enhanced interper-sonal support through the intensive interaction and collaboration offered by the school-Within-a-school; (2) a focused curriculum and enriched teaching and learning experiences through the in-tegration of academic and occupational content; and (3) exposure to career awareness and work-based education through the employer partnerships. These are discussed briefly below.
Interpersonal Supports. Career Academies aim to function as "communities of support"for students and teachers. For students, such support includes the personalized attention they getfrom their teachers, their teachers' expectations of them, their classmates' level of engagement inschool, and the opportunities they have to collaborate with their peers on school projects. Acad-emy teachers in this study indicated that they were supported by, among other things, opportuni-ties for professional collaboration and development, adequate resources, the capacity to influenceinstructional and administrative decisions, and opportunities to give personalized attention tostudents. Both this study and previous research have identified these dimensions of support asfactors that can have important effects on both students' motivation and engagement in schooland teachers' job satisfaction and sense of having an impact on students' lives.
Focused Curricula and Enriched Learning Opportunities. Key goals of the CareerAcademy curricula are to ensure that students meet the core academic requirements they need tograduate and prepare for college and to focus students' non-Academy course-taking on a coher-ent set of vocational or occupation-related classes. In addition, curricula attempt to provide stu-dents with applied learning opportunities, including developing problem-solving skills, using com-puters or manipulative materials, working on long-term projects, and connecting what they learn toother subjects or the world of work. These types of activities have been identified as strategies forbreaking down the dichotomy between academic and vocational curricula, or between abstract andapplied learning. Such a dichotomy is often seen as a structural feature of high schools that limitstheir capacity to help students make the transition from school to work or to post-secondary educa-tion. Previous research has suggested that the separation of curricular tracks has created a false andunnecessary dichotomy between academic rigor and real-world relevance:4
Career Awareness and Work-Based Learning Opportunities. In general, CareerAcademies aim to provide students with two types of work-related learning opportunities thatare built on the employer partnerships. The first, referred to as career awareness and develop-ment activities, are intended to enhance students' understanding of the world of work in gen-eral as well as their awareness of occupations within the program's broad career theme. Someof these activities occur outside school. They include field trips designed to expose students tovarious work environments and to provide opportunities to observe a regular workday. An-other example is job-shadowing, which gives students the opportunity to accompany an adulton her or his job for a day or more. Some Career Academies develop mentoring programs tohelp students make connections with caring adults who can provide personal support and ca-
"See Kemple and Rock, 1996; Kemple, 1997a."Berryman, 1991; Raizen, 1989; Resnick, 1987; Dewey, 1916.
416

reer guidance. Other career awareness and development activities occur in school. These in-clude formal and structured attempts to infuse Career Academy classes with discussions andactivities focusing on careers or students' work-based learning experiences. They also includecareer counseling and the formal and informal discussions students have with their teachersand peers regarding preparation for work.
The second type of work-related learning opportunities are typically referred to as work-based learning, which has been defined as "work experiences that are planned to contribute tothe intellectual and career development of students."' Work-based learning activities are proba-bly the most intensive and distinctive work-related aspect of the Career Academy approach. Stu-dents are typically placed in jobs that have been developed in collaboration with the employerpartners and are connected to school. Students have the opportunity to learn both job-specificskills and more general work habits and behaviors.
C. High School Outcomes
The supports and opportunities listed in the second column of Figure 1.1 are also mutu-ally reinforcing and, together, are intended to affect students' engagement, performance, and de-velopment during their high school years The third column of the figure summarizes several keystudent outcomes that Career Academies are intended to improve. These include preventing stu-dents from dropping out of high school, helping them meet graduation requirements, enhancingtheir achievement, helping them meet college entrance requirements, providing necessary stepsto apply for and be accepted into college or a job, promoting constructive use of non-schoolhours, and reducing risk-taking behaviors.
As noted earlier, this report focuses on the extent to which the Career Academies changethese and other outcomes during students' high school years. Analyses presented later in the re-port will explore how particular organizational features of the Academies or the types of sup-ports or learning opportunities that develop from them may or may not help account for theprogram impacts or lack of impacts.
D. Post-Secondary Outcomes
As shown in Figure 1.1, graduating from high school and acquiring various credentialsshould be viewed as transitional outcomes as indications of students' level of preparedness forfuture education and work after high school. Ultimately, as indicated in the fourth column of thefigure, the Career Academies are intended to lead to higher levels of post-secondary educationand to higher-skilled and higher-paying careers.
Future reports from the Career Academies Evaluation will examine the impact Acade-mies may have on these types of outcomes and will explore the connections between high schoolexperiences and the impacts that may accrue after high school.
'5Office of Technology Assessment, 1995, p. 13.
-12-
4 7

IV. Key Features of the Career Academies Evaluation
In 1993, MDRC began development work for a unique study of the Career Academyapproach. Its primary purpose has been to provide reliable evidence about the efficacy of thetheories and hypotheses embedded in the conceptual framework illustrated in Figure 1.1. Theevaluation responds to the growing demand for rigorous evidence about the effectiveness ofschool-to-work and other high school reform initiatives. This section of the chapter describesthe key features of the evaluation design that are central to understanding the findings pre-sented in this report.
A. The Random Assignment Design
The Career Academies Evaluation is a rarity in the field of education research in that ithas been built on a random assignment research design and demonstrates the feasibility of im-plementing such a design within an ongoing high school program. In order to assess the differ-ence that Career Academies make in the lives of high school students, the research design in-volves a comparison between students who applied for and were randomly selected to enroll ina Career Academy and students who also applied but were not selected. During the evaluationperiod, a random selection process, or lottery, was used to make the final selection of studentsfor the Academies. This was possible because each Academy had more qualified applicantsthan it was able to serve and the sites were willing to implement the protocols called for in therandom selection process:6
This report focuses on a sample of 1,764 students from nine of the sites selected for thestudy." For the purposes of this report, this group of students is referred to as the study sample.Of the students in the study sample, 959 (54 percent) were randomly selected to enroll in anAcademy. For the purposes of this report, these students are referred to as the Academy group.The remaining 805 students (46 percent of the study sample) were not invited to participate in theAcademies but could choose other options available in the high school or school district. Thesestudents constitute the study's control group and are referred to in this report as the non-Academygroup. In most cases, non-Academy group students enrolled in the general programs in the par-ticipating high schools, but in some cases they enrolled in citywide magnet programs or schools.
Figure 1.2 illustrates the random assignment research design and shows the comparisonbeing made to determine the impact Career Academies have on high school outcomes. The boxeson the lower right side of Figure 1.2 correspond to the first three columns of Figure 1.1. The firstbox represents the distinctive organizational features of the Academies, and the second box rep-resents the resulting supports and learning opportunities that derive from those features. The thirdbox indicates the high school outcomes achieved by students randomly selected for the Academygroup. Each of these boxes has a counterpart on the left side of Figure 1.2 for students randomlyselected for the non-Academy group. The differences in outcomes between the two groups ofstudents represent impacts of the Career Academies.
'See Chapter 4 in Kemple and Rock, 1996, for a more detailed description of how the random assignment pro-cedure was implemented for this study.
"One of the 10 initial Career Academies was disbanded after two years in the study and was unable to providesufficient follow-up data for its students in the study sample.
-13-
48

Figure 1.2
Career Academies Evaluation
Random Assignment Design
tudents apply and are eligiblefor Career Academy
Random selection forenrollment in an Academy
Non-Academy group (notselected to enroll in Career
Academ
ISupports and learning opportunitiesexperienced in regular high school
High school outcomes for non-Academygroup
Academy group (selected toenroll in Career Academy)
iExposure to Career Academy
organizational elements
Supports and learning opportunitiesexperienced in Career Academy
High school outcomes for Academygroup
See Figure 1.1
K )4Differences in high school
outcomes
-14-
4 9

The random selection process ensured that the two groups of students were virtually thesame on average in terms of their background characteristics, prior school experiences, and initialmotivation and attitudes toward school. Any systematic differences in the outcomes that subse-quently emerged between the groups resulted from differences in their access and exposure to theCareer Academies." Differences in these school environments should have produced differencesin the types of supports and learning opportunities experienced by students in the Academy andnon-Academy groups. In fact, the previous reports and papers from the evaluation provide exten-sive evidence that Academy students experienced significant enhancements in the supports andlearning opportunities illustrated in Figure 1.1, compared with their non-Academy counterparts.Academy students were also more likely to participate in a broad range of career awareness andwork-based learning activities. Finally, Academy students were also somewhat more likely thantheir non-Academy counterparts to be exposed to various enriched learning activities in the class-room, such as applied learning and work-related problem-solving activities. The current reportaddresses the question of whether the Academies produced impacts on high school outcomes asrepresented by the three boxes at the bottom of Figure 1.2.
B. Sites in the Career Academy Evaluation
A second critical feature of the Career Academies Evaluation research design involvesthe selection of sites for participation in the study. MDRC was primarily interested in selectingsites that had already implemented versions of the organizational elements listed in the first col-umn of Figure 1.1.19 This was important because a key goal of the evaluation was to includefunctioning Academies that encompassed the central elements of the approach, rather than pro-grams that were in the initial stages of implementation.
In addition, MDRC sought high schools in which there was a clear contrast between theCareer Academy and other programs available to potential Academy students. This was impor-tant because one of the primary concerns of the study was whether Career Academies improvestudents' post-secondary education and employment outcomes above and beyond what wouldhave occurred had they not had the opportunity to attend an Academy. Some high schools andschool districts operate more than one Career Academy or other Academy-like programs. In suchcircumstances, many students in both groups would likely be involved in similar programs. Thiswould reduce the contrast between their experiences and could mistakenly obscure the real ef-fects of the Academies and make it appear that the Academies were ineffective.
Each participating site had established the basic Career Academy components describedin this chapter: a school-within-a-school organization, academic and vocational curricula basedon a career theme, and employer partnerships. This combination of features was not availableelsewhere in the participating high schools." Each Career Academy attempted to serve a wide
"As discussed in Chapter 2, not all students randomly selected for the Academy group actually enrolled andremained in an Academy, and a small percentage of students selected for the non-Academy group did enroll.
"The site selection process is described in greater detail in Kemple and Rock, 1996, which also includes a de-tailed description of the Career Academies in the sites.
'Although some participating high schools do operate other programs that they classify as Career Academies,information collected for this study indicated that most such programs do not include the basic components of theAcademy approach described earlier. As a result, the participating Career Academy programs represent a clear con-trast with other programs in the high schools.
-15- 50
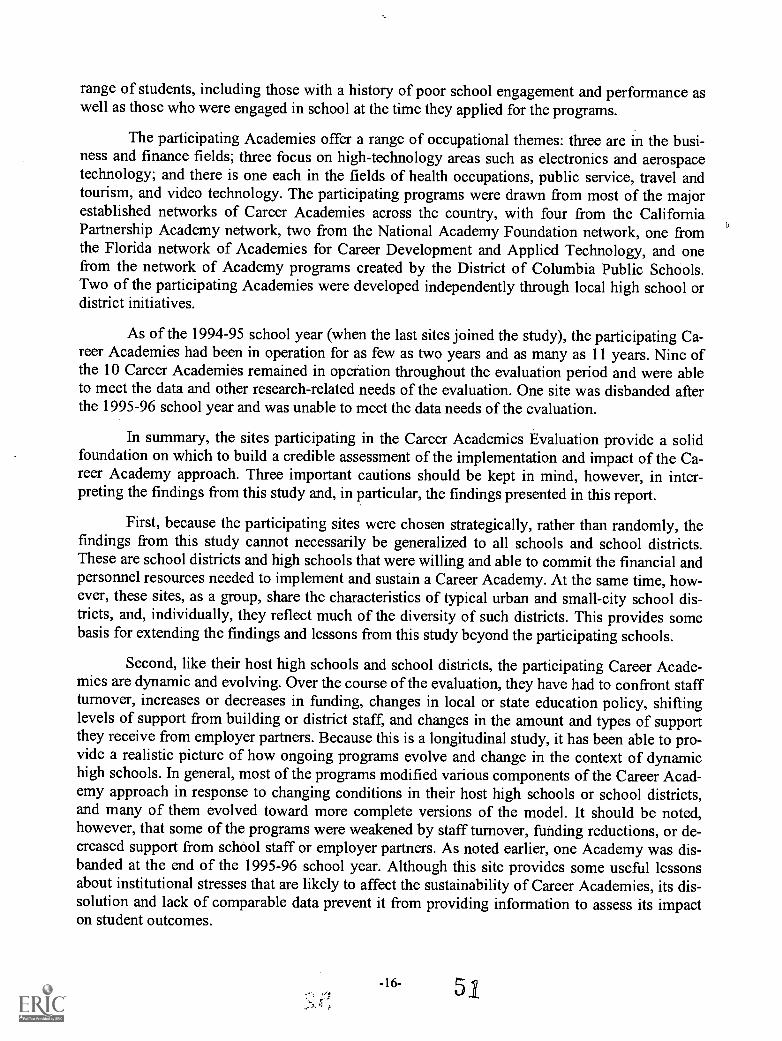
range of students, including those with a history of poor school engagement and performance aswell as those who were engaged in school at the time they applied for the programs.
The participating Academies offer a range of occupational themes: three are in the busi-ness and finance fields; three focus on high-technology areas such as electronics and aerospacetechnology; and there is one each in the fields of health occupations, public service, travel andtourism, and video technology. The participating programs were drawn from most of the majorestablished networks of Career Academies across the country, with four from the CaliforniaPartnership Academy network, two from the National Academy Foundation network, one fromthe Florida network of Academies for Career Development and Applied Technology, and onefrom the network of Academy programs created by the District of Columbia Public Schools.Two of the participating Academies were developed independently through local high school ordistrict initiatives.
As of the 1994-95 school year (when the last sites joined the study), the participating Ca-reer Academies had been in operation for as few as two years and as many as 11 years. Nine ofthe 10 Career Academies remained in operation throughout the evaluation period and were ableto meet the data and other research-related needs of the evaluation. One site was disbanded afterthe 1995-96 school year and was unable to meet the data needs of the evaluation.
In summary, the sites participating in the Career Academies Evaluation provide a solidfoundation on which to build a credible assessment of the implementation and impact of the Ca-reer Academy approach. Three important cautions should be kept in mind, however, in inter-preting the findings from this study and, in particular, the findings presented in this report.
First, because the participating sites were chosen strategically, rather than randomly, thefindings from this study cannot necessarily be generalized to all schools and school districts.These are school districts and high schools that were willing and able to commit the financial andpersonnel resources needed to implement and sustain a Career Academy. At the same time, how-ever, these sites, as a group, share the characteristics of typical urban and small-city school dis-tricts, and, individually, they reflect much of the diversity of such districts. This provides somebasis for extending the findings and lessons from this study beyond the participating schools.
Second, like their host high schools and school districts, the participating Career Acade-mies are dynamic and evolving. Over the course of the evaluation, they have had to confront staffturnover, increases or decreases in funding, changes in local or state education policy, shiftinglevels of support from building or district staff, and changes in the amount and types of supportthey receive from employer partners. Because this is a longitudinal study, it has been able to pro-vide a realistic picture of how ongoing programs evolve and change in the context of dynamichigh schools. In general, most of the programs modified various components of the Career Acad-emy approach in response to changing conditions in their host high schools or school districts,and many of them evolved toward more complete versions of the model. It should be noted,however, that some of the programs were weakened by staff turnover, funding reductions, or de-creased support from school staff or employer partners. As noted earlier, one Academy was dis-banded at the end of the 1995-96 school year. Although this site provides some useful lessonsabout institutional stresses that are likely to affect the sustainability of Career Academies, its dis-solution and lack of comparable data prevent it from providing information to assess its impacton student outcomes.
-16- 51

Third, the previous reports from MDRC's Career Academies Evaluation focused pri-marily on findings that were aggregated across all participating sites. Although such findingsshed light on the implementation and impact of the Career Academy approach more generally,they mask the high degree of variation among the sites and the ways this variation may be as-sociated with differences in program effectiveness. For example, some sites were able to de-velop a particularly cohesive school-within-a-school, while others made strong investments intheir employer partnerships. More important, the Academies in some sites represented an es-pecially dramatic contrast with the regular school environment in terms of the degree of inter-personal and instructional support they offered students. A central focus of this report, there-fore, is on determining whether some versions or contexts for the Academy approach are moreeffective than others.
C. Data Used in This Report
The conceptual framework described above has helped guide data-collection activities forthe evaluation. For example, MDRC researchers conducted a variety of field research activities todocument and describe the organizational features illustrated in the first column of Figure 1.1.Several surveys were developed and administered to students and teachers to gain systematic in-formation about various supports and learning opportunities that might be captured by the secondcolumn. MDRC has also collected data from school records and students' transcripts to obtaininformation about their progress and performance in high school. As part of the evaluation,MDRC administered standardized math and reading tests to a subsample of students, and it con-ducted a survey at the end of students' 12th-grade year to learn about their use of non-schoolhours and preparation and plans for the future. Finally, as the evaluation moves forward, MDRCwill continue to follow students beyond their high school years to collect information about theirprogress in post-secondary education and the labor market.
The primary data for this report were obtained from three sources: school transcript rec-ords, a survey that students in the study sample completed at the end of their 12th-grade year, anda standardized math computation and reading comprehension test administered to a subsample ofthe students at the end of their 12th-grade year. These are described briefly below.'
School Transcript Records. A complete set of school transcript records is available for1,454 students in the study sample.22 This is referred to in the report as the Student School Rec-ords Database. The Student School Records Database includes information about students' dailyattendance rates, credits earned toward graduation, and course-taking patterns. Of the students inthe Student School Records Database sample, 1,293 remained enrolled in high school through
'See Appendix A for a more detailed discussion of the response rates and analytical issues associated with thedata-collection efforts for the evaluation.
22MDRC attempted to collect school transcript records for all students in the study sample even if they hadtransferred to other high schools within the districts in which the participating Career Academies were located.MDRC was not able to obtain school transcript records for students who transferred to high schools outside thesedistricts. Analyses of differences in data availability among students in the study sample indicated that there were nosystematic differences in school records availability between Academy and non-Academy group students. MDRCobtained school records data for 82 percent of students in the Academy group and for 84 percent of students in thenon-Academy group. Among students in the Student School Records sample, there were no systematic differencesin the background characteristics of Academy and non-Academy group students. These analyses provide greaterconfidence that the Student School Records Database will yield valid estimates of Career Academy impacts.
-17-,
52

the end of their 12th-grade year. The remaining 161 students (12 percent) were confirmed to havedropped out of high school before the end of their 12th-grade year. A complete set of school tran-script records was obtained for these students up to the point at which they dropped out.
12th Grade Survey. The 12th Grade Survey was completed by 1,510 students in thestudy sample at the end of their 12th-grade year." This is referred to as the 12th Grade SurveyDatabase. The 12th Grade Survey asked students a wide range of questions about their schoolexperiences, employment and work-related experiences, extracurricular activities, preparation forcollege and post-secondary jobs, and plans for the future.
Achievement Test Scores. Math computation and reading comprehension achievementtests were administered to 490 students in the study sample.24 This is referred to as the 12th GradeAchievement Test Database. This test was initially designed by the Educational Testing Service(ETS) for the National Educational Longitudinal Surveys of 1988 (NELS: 88) follow-up and wasadministered to a nationally representative sample of students in their 12th-grade year. ETS per-mitted MDRC to administer the test to a subsample of students in the Career Academies Evalua-tion sample.' The Achievement Test Database provides national percentile scores both in read-ing comprehension and in math computation and problem-solving. It also provides criterion-referenced scores that indicate whether students demonstrated proficiency at particular skill lev-els of math and reading.
V. Overview of This Report
A central theme that has emerged from this evaluation is that an accurate and usefulassessment of the effectiveness of the Career Academy approach must recognize that the pro-gram is not a "one-size-fits-all" initiative and that it produces different impacts for different
'MDRC attempted to survey all students in the study sample even if they had transferred to high schools out-side the participating districts or had dropped out of high school altogether. Analyses of differences in data avail-ability among student& in the study sample indicated that there were no systematic differences in 12th Grade Surveyresponse rates between Academy and non-Academy group students. MDRC obtained completed surveys from 86percent of students in the Academy group and from 85 percent of students in the non-Academy group. Among stu-dents in the 12th Grade Survey sample, there were no systematic differences in the background characteristics ofAcademy and non - Academy. group students. These analyses provide greater confidence that the 12th Grade SurveyDatabase will yield valid estimates of Career Academy impacts.
24MDRC attempted to administer the achievement test to the 691 students in the study sample who were sched-uled to be in 12'h grade at the end of the 1997-98 school year. The 490 students who completed the achievement testrepresents 71 percent of those attempted. Analyses of differences in data availability among students in the studysample indicated that there were no systematic differences in achievement test completion rates between Academyand non-Academy group students who were attempted. MDRC obtained completed achievement tests from 72 per-cent of the Academy group students attempted and from 70 percent of the non-Academy group students attempted.Among students in the Achievement Test sample, there were no systematic differences in the background charac-teristics of Academy and non-Academy group students. These analyses provide greater confidence that theAchievement Test Database will yield valid estimates of Career Academy impacts.
"The achievement test was administered to students on a Saturday morning near the end of their 12th- gradeyear. They were offered a stipend of $50 if they completed the test. Some concerns have been raised about whetherthis test instrument and the conditions under which it was administered provide an adequate indication of studentachievement in math computation and reading comprehension. It should be noted, however, that the same test wasadministered under similar conditions as part of the U.S. Department of Education's National Educational Longitu-dinal Surveys of 1988 (NELS:88).
-18-

types of students. In order to highlight the importance of this theme, Chapter 2 describes thestudents who are in the study sample and identifies subgroups of students who are most likelyto derive various benefits from the programs. All the key analyses and findings presented inthis report are broken down by these subgroups. Chapter 2 also presents findings from ananalysis of the patterns by which students in the study's Academy group enrolled and re-mained in the Career Academy programs.
Chapter 3 assesses the impact Career Academies have on students' high school engage-ment and performance and on their preparation for post-secondary education and employment. Itfocuses first on the impacts Career Academies produce for students who were at high risk ofdropping out of high school. It then presents the results for students who entered the study highlyengaged in school and were at very low risk of dropping out. Finally, it presents the impactfindings for students who fell into a middle range of characteristics associated with a risk ofschool failure.
As noted earlier, this report also attempts to push much further in offering lessons aboutthe efficacy of the Career Academy approach and other school reform initiatives that are embed-ded in it. The contrast among the sites and the differences in effectiveness for key subgroups ofstudents provide a rich context for making judgments about what types of school reform initia-tives are likely to be effective and for whom. Chapter 4 presents findings from an analysis thatbegins to highlight some of the key mechanisms by which the Academies may produce the im-pacts described in Chapter 3. This chapter identifies a group of sites, within the evaluation sam-ple, in which the Career Academies represented a particularly dramatic contrast with their non-Academy school environments in terms of some of the key supports and learning opportunitiesdescribed earlier. It also identifies a second group of sites that had very little contrast between theAcademy and non-Academy school environments in these areas. Chapter 5 examines variation inimpacts across these two groups of sites.
-19- 54

Chapter 2
Career Academy Stade 4its andTheir Patterns of Enrollment in the Academy Programs
This chapter describes the background characteristics and prior school experiences of thestudents in the research sample for this report. It also summarizes findings on the patterns bywhich those selected for the Career Academies actually enrolled and remained in the programs.The chapter makes two key points.
First, the chapter highlights the fact that the students in the study sample come from di-verse backgrounds and prior school experiences. This suggests that analyses that do not accountfor this diversity are likely to mask variation in the difference that Career Academies may makefor some students and not for others. Section II of this chapter, therefore, identifies subgroups ofstudents defined by background characteristics and prior school experiences associated with dif-ferent patterns of school success or failure. The impact findings presented in Chapter 3 show thatthe Career Academies produced quite difference patterns of impacts for these three subgroups ofstudents.
Second, the analyses presented in this chapter show that 88 percent of the students ran-domly selected for the study's Academy group (and invited to enroll in a Career Academy pro-gram) actually enrolled. By the end of 12th grade, 59 percent of the students initially selected forthe programs were still enrolled in them. These enrollment and attrition patterns have implica-tions for Career Academy policies and implementation practices. They also provide an importantcontext for interpreting the impact findings presented later in the report.
I. Students in the Study Sample for This Report
This section of the chapter describes the background characteristics of the 1,764 studentswho constitute the study sample for this report. The description highlights the fact that no sys-tematic differences were found in the background characteristics of the Academy group and thenon-Academy group. This is the central purpose of the random selection process used in creatingthese two groups, and it extends to measured as well as unmeasured characteristics.
A. Background Characteristics of Stude i is in the Study Sample
The Career Academies Evaluation has included efforts to collect information about 1,764students who applied for one of nine Career Academies across the country between 1993 and1996.' In this report these students are referred to as the study sample. Table 2.1 lists a variety of
'See Kemple and Rock, 1996, for a more detailed discussion of the procedures used to select students for theCareer Academies Evaluation study sample. The initial sample for the Career Academies Evaluation consisted of1,953 students from 10 sites. As noted earlier, one of the initial sites was disbanded and was not able to providefollow-up information needed for the analyses in this report. Thus, the 126 students in the initial study sample fromthat site are not included in the analyses. Also, MDRC found that information could not be obtained for 59 of theinitial group of students because they should not have been included in the study sample. Four other students werefound to be deceased.
-20-
5 5

I:,
Table 2.1
Career Academies Evaluation
ackground Characteristics of Study Sample,by Research Status
Full SampleAcademy
GroupNon-Academy
GroupCharacteristic (%) (%) (%)
Demographic and family characteristics
GenderMale 43.8 44.6 42.9
Female 56.2 55.4 57.1
Age of student at time of application13 or younger 8.6 7.3 10.1
14 35.6 35.7 35.5
15 46.1 46.8 45.2
16 or older 9.7 10.1 9.2
Race/ethnicityBlack 30.2 30.9 29.4
White 6.4 6.0 6.9
Hispanic 56.2 55.5 57.0
Asian or Native American 7.2 7.5 6.7
Student speaks limited Englisha 7.6 7.0 8.3
Student lives withMother and father 61.7 61.1 62.5Mother only 28.6 29.0 28.1
Father only 4.6 5.0 4.1
Other family/nonrelative 5.1 4.9 5.4
Student lives in single-parent household 38.3 38.9 37.5
Father's education levelDid not finish high school 39.8 38.9 40.9High school graduate 32.4 32.2 32.6Completed some post-secondary 27.8 28.9 26.6
Mother's education levelDid not finish high school 36.1 35.2 37.1
High school graduate 34.8 34.5 35.3Completed some post-secondary 29.1 30.3 27.6
Neither parent has high school diploma 28.6 29.0 28.2
Parental WorkBoth parents work 47.3 46.5 48.3Father works 23.8 23.5 24.1
Mother works 17.8 19.2 16.2
Neither parent works 11.1 10.8 11.4
(continued)
-21- 56

Table 2.1 (continued)
Full SampleAcademy
GroupNon-Academy
GroupCharacteristic (%) (%) (%)
Family receives welfare or Food Stamps 24.2 23.6 25.0
Family mobility in past two yearsHave not moved 59.4 58.8 60.2Moved 1 or 2 times 33.6 34.8 32.2Moved 3 or more times 7.0 6.5 7.6
Student is home alone more than 3 hours per day 13.5 13.5 13.6
Educational characteristics
8`" -grade math test score°75th percentile or higher 8.5 8.8 8.150th to 74th percentile 20.4 21.0 19.725th to 49`" percentile 32.2 29.9 35.024th percentile or lower 38.9 40.3 37.2
8`" -grade reading test score`75`" percentile or higher 9.8 10.4 9.050th to 74th percentile 19.4 20.8 17.725th to 49th percentile 36.3 33.7 39.424th percentile or lower 34.6 35.1 33.9
Student does not feel safe at school 23.2 22.7 23.9
Frequency of cutting classesNever 78.9 79.5 78.3At least 1 time a week 19.7 19.4 20.1Daily 1.4 1.2 1.6
Sent to office for misbehaviorNever 81.3 81.0 81.61-2 times 15.7 16.2 15.23-10 times 3.0 2.8 3.2
Hours per week spent on homework1 hour or less 28.8 27.9 30.02-3 hours 38.2 39.3 36.94-6 hours 17.4 18.5 16.07 hours or more 15.6 14.3 17.2
Hours per day spent watching TVLess than an hour 12.3 11.7 13.01-2 hours 27.1 27.4 26.72-3 hours 26.8 24.9 29.1Over 3 hours 33.8 36.0 31.3
Student has worked for pay 36.3 35.8 36.9(continued)
-22-
57

Table 2.1 (continued)
Full SampleAcademy . Non-Academy
Group GroupCharacteristic (%) (%) (%)
Characteristics associated with dropping out of school
Attendance rate, year prior to random assignment96-100% 54.2 53.1 55.491-95% 24.1 23.3 24.986-90% 11.0 12.2 9.5
85% or lower 10.8 11.4 10.2
Credits earned in 9th grade°5 or more credits 80.9 80.4 81.43-4 credits 13.7 14.3 12.9
2 or fewer credits 5.5 5.3 5.7
Grade point average in year of random assignment'3.1 or higher 36.2 34.4 38.32.1-3.0 38.1 39.5 36.52.0 or lower 25.7 26.1 25.2
Student is overage for grade level' 21.1 21.5 20.7
School mobilityg0 or 1 different school 72.7 72.9 72.42 or more different schools 27.4 27.1 27.6
Student has sibling who dropped out of high school 20.2 19.8 20.6
Sample size 1,764 959 805
SOURCES: MDRC calculations from the Career Academies Evaluation Student Baseline Questionnaire Database andStudent School Records Database.
NOTES: All characteristics were measured at the time students applied to the Career Academy program and prior to beingrandomly selected to the Academy and non-Academy groups.
Invalid or missing values are not included in individual variable distribution. Rounding may cause slight discrepanciesin calculating of sums and differences.
A chi-square test was applied to differences in the distribution of characteristics across the Academy and non-Academygroups. Statistical significance levels are indicated as: *** = 1 percent; ** = 5 percent; * = 10 percent.
"These are students who responded that they spoke English "not well" or "not at all."bSeveral different standardized, nationally normed math tests were administered to students, depending on the district
where their school was located and the year they entered the study. National percentile scores were used because they werethe only standardized scores available across tests.
`Several different standardized, nationally normed reading tests were administered to students, depending on the districtwhere their school was located and the year they entered the study. National percentile scores were used because they werethe only standardized scores available across tests.
dThis was applicable only to students who applied to the Career Academy at the end of their 9th-grade year.
`Grade point averages were converted to a standard 4.0 scale from 100-point or 5-point scales for some sites.fA student is defined as overage for grade at the time of random assignment if she or he turns 15 before the start of the
9th grade, or 16 before the start of the 10th grade. This indicates that the student was likely to have been held back in aprevious grade.
gSchool mobility is defined as the number of schools attended since the 1st grade beyond the number expected to resultfrom promotions in grade level or graduations.
-23- 58 BEST COPY AVAILABLE

background characteristics and measures of prior school experiences for students in the studysample. The first column in the table lists the percentages of students in the full sample who hadeach of the characteristics listed.
The first section of Table 2.1 indicates that students in the study sample come from awide range of family backgrounds. The vast majority of students identified themselves as eitherHispanic (56 percent) or black (30 percent). The relatively large proportion of Hispanic studentsreflects the fact that several of the sites are located in predominantly Chicano and Latino com-munities in California, south Texas, and south Florida. The black students are concentrated inseveral large eastern cities.
The data collected for the evaluation does not include a direct measure of family income,but there are several indicators that the study sample includes a moderate proportion of studentsfrom low-income families. For example, Table 2.1 shows that 38 percent of the students lived insingle-parent households at the time they applied for an Academy. Further, 11 percent of the stu-dents indicated that neither of their parents was working, and 24 percent indicated that theirfamilies were receiving welfare or Food Stamps. Twenty-nine percent reported that neither par-ent had received a high school diploma or a GED. Forty-one percent indicated that their familieshad moved at least once during the two years prior to applying for the Academy. The table alsoindicates that many students may come from middle-income families. Forty-seven percent of thestudents reported that both parents were working, and many students indicated that at least one oftheir parents completed some post-secondary education.
The second section of Table 2.1 lists a variety of indicators of students' prior school en-gagement and performance. The vast majority of students indicated that they did not have disci-pline problems in school and had high aspirations for their education. For example, approxi-mately 80 percent reported that they had never skipped class during the second semester of 8th or9th grade, and about the same percentage reported that they had never been sent to the school of-fice for misbehavior. Also, although not shown in the table, virtually all the students reportedthat they expected to graduate from high school, and nearly two-thirds indicated that they ex-pected to graduate from college.
At the same time, many students appeared to be struggling somewhat in school. Less than10 percent of the students had 8th-grade math or reading test scores in the 75th percentile orhigher, while 35 to 40 percent had test scores below the 25th percentile. Twenty percent of thestudents reported that they had cut class at least once per week during the second semester of 8thor 9th grade, and nearly 20 percent indicated that they had been sent to the school office for mis-behavior. The table indicates an interesting comparison between the time students reportedspending on homework and the time they spent watching television. One-third reported that theyspent four or more hours per week doing homework (about one hour per weekday), and 61 per-cent that they spent two or more hours per day watching television.
The third section of Table 2.1 lists several demographic and school-related characteristicsthat have been found, both in prior research and in analyses conducted for this evaluation, tohave particularly strong associations with later school engagement and performance. As dis-cussed later in this chapter, these characteristics were used to create subgroups of students for theimpact analyses. The respective subgroups include students with markedly different prospects forschool success.
-24-
5 9

Many .of the students appeared to be highly engaged in school. Over half the students inthe study sample (54 percent) had attendance rates over 95 percent in the year they entered thestudy, and another 24 percent had attendance rates between 91 and 95 percent. Eighty-one per-cent of the students who applied to the Academies as 9th-graders had earned at least five credits inthat year and would be considered to be on track toward graduation.2 Over one-third of the stu-dents had a 3.1 grade point average or higher (approximately equivalent to a B average or higher)during the year they applied for an Academy.
A significant percentage of students in the study sample appeared to be disengaged fromschool. Eleven percent might be characterized as chronic absentees with attendance rates of lessthat 86 percent in the year they applied for the Academy programs. Nearly 20 percent of the stu-dents had already fallen behind in course credits, earning less than five in the 9th grade; 6 percenthad fallen well behind, earning two or fewer course credits in the 9th grade. Approximately 21percent of the students were overage for their grade level, indicating that they had been retainedin a previous grade. About 27 percent of the students reported that they had transferred schoolstwo or more times beyond the regular school transitions (such as from elementary to middleschool or middle school to high school), indicating that their attachment to school may have beendisrupted by family mobility or other reasons. Finally, about 20 percent of the students indicatedthat they had a sibling who had dropped out of high school.
TB. Characteristics of Students in the Academy and Non-Academy Groups
As noted in Chapter 1, each of the students in the study sample applied for and was de-termined to be eligible for enrollment in one of the participating Career Academies. Because theprograms had attracted more eligible students than they were able to serve, a lottery was used toselect students for enrollment in the Academies. Of the students in the study sample, 959 (54percent) were randomly selected to enroll in an Academy, and 805 (46 percent) were not selectedfor enrollment in an Academy but were eligible to enroll in other programs or classes in the hostschools or school district.
The second and third columns of Table 2.1 provide a comparison between characteristicsof students selected for the study's Academy group and those of students in the non-Academygroup. The table indicates that there were no statistically significant differences between thebackground characteristics and prior school experiences of students in the two groups. This is aresult of the random assignment design and can also be extended to characteristics that are notdirectly measured by the data collected for this evaluation. These include such constructs as ini-tial motivation, attitudes toward school, and other baseline attributes that may be associated withschool engagement and performance. In other words, the random assignment process created twogroups for which there were no systematic differences initially, in both measured and unmeas-ured characteristics. As a result, one can be confident that any systematic differences thatemerged after random selection can be attributed to the fact that the Academy group was selectedto enroll in the programs and the non-Academy group was not. This chapter also includes a dis-cussion of the rates at which students actually enrolled in the Academies and examines the extent
'It should be noted here that approximately 22 percent of the students were applying for the Academies as 8th-graders by virtue of the fact that the Academies began in 9th grade. These students were not included in calculationsof credits earned in 9th grade.
-25- 60

to which students remained in the programs and, thus, were likely to be exposed to the full rangeof Academy experiences.
II. Subgroups of Students Defined by Characteristics Associated withDropping Out of High School
Previous research on Career Academies has not typically examined the relative effective-ness of the approach among the different types of students the programs serve. Although findingsfrom previous research have been useful, they do not recognize the fact that Career Academies maychange certain outcomes for some students but not necessarily for others. The random assignmentresearch design used in this evaluation provides a unique opportunity to assess the potential forthe Academies to make a difference for various groups of students. As noted above, engagementand performance of students in the study's non-Academy group provide the best indication ofhow students in the Academy group were likely to behave if they did not have the opportunity toenroll in an Academy.
In particular, many students in the study's non-Academy group were unlikely to drop outof high school, making it unlikely that the Academies could reduce dropout rates or increase ba-sic school engagement much further for them. An important question about these students, how-ever, is whether the Academies expanded (or at least did not limit) their opportunities to pursue amore rigorous curriculum or increased their preparation for post-secondary education and em-ployment. By contrast, other students in the non-Academy group (for example, those who hadfailed several courses in 9th grade) were at relatively high risk of school failure and could be seenas having the potential to benefit from involvement in the Academies in a variety of ways, in-cluding being prevented from dropping out.
Given the dramatic differences in outcomes for various subgroups of students withinthe non-Academy group, the primary focus of this report is on the impact Career Academieshave for students at greater or lesser risk of dropping out of high school or of doing poorly, ifthey remain in high school. To assess this variation in impacts, students in the study samplewere divided into three subgroups based on selected background characteristics and priorschool experiences that were associated with dropping out of high school. This section of thechapter provides an overview of the strategy used to identify these subgroups and highlightsthe basic distinctions among them.
Student subgroups were defined using six characteristics found to be strong predictors ofdropping out among students in the study's non-Academy group. These characteristics were allmeasured at the time students applied for a Career Academy and before they were randomly se-lected for the Academy or non-Academy group. Each of these characteristics has also been identi-fied in prior research as being highly correlated with dropping out of high school.' They include:
o average daily attendance in the year the student applied for an Academy;
o grade point average for the year the student applied for an Academy;
'For a review of research literature on background characteristics, measures of prior school performance, andother factors associated with dropping out of school, see Natriello, 1987, and Roderick, 1993.
-26-
61

o the number of credits earned toward graduation in 9th grade (for students apply-ing for an Academy at the end of 9th grade);
o whether the student was overage for grade (indicating the student had been re-tained in a prior grade);
o whether the student had a sibling who dropped out of high school; and
o whether the student had transferred schools two or more times beyond the typi-cal school transitions.
In other random assignment studies, subgroups have been determined by identifying samplemembers using one or more characteristics associated with a difference in the way they are likely tobe treated by the program under study or in the outcomes they are likely to achieve without havingaccess to the program.' In education research, subgroups have been created by distinguishingbetween students who have, for example, two or more characteristics associated with school fail-ure and those who have only one such characteristic or none.' Such methods might be called"risk-factor accumulation" strategies because they involve simply adding up particular indicatorsand defining the subgroups based on the number of risk-related characteristics a given studenthas.
Risk-factor accumulation strategies, however, have some limitations. In particular, theygive equal weight to each of the selected risk-related background characteristics and prior schoolexperiences. As a result, they do not account for the fact that some characteristics are more highlyassociated with school failure than others. In addition, this strategy does not account for the fact thatsome students also have a number of related characteristics that are associated with school successand that may offset the risk associated with other characteristics. For example, some students mayhave failed several courses in 9th grade even though they attended regularly and did not have otherbackground characteristics associated with dropping out. As a result, various combinations of char-acteristics, along with different degrees of importance attached to some characteristics, may indi-cate a different degree of risk.
Given these limitations, a more systematic approach was used for this report, in order toidentify groups of students who were clearly distinct in terms of their likelihood of dropping outin the absence of access to a Career Academy.' In particular, the background characteristics andprior school experiences listed above were used to predict the probability that students in thenon-Academy group would drop out of high school. This provided an estimate of the uniquecontribution that each characteristic made to predicting that these students would drop out. Forexample, attendance rates and credits earned toward graduation were found to be better predic-tors of dropping out than students' being overage for grade. Also, the prediction model providedthe opportunity to give more weight to different specifications of a characteristic. For example,the lower a student's prior attendance rate, the more likely that he or she would drop out. Thus,students with very low attendance rates might be considered at high risk of dropping out, even
'See, for example, Friedlander, 1988.'See, for example, NCES, 1990 and NCES, 1992.6Appendix B provides a more detailed and technical discussion of the subgroup identification strategy used for
this report, including some potential limitations of this approach.
-27-
62

though they had not been held back in a previous grade and did not have a sibling who droppedout of school.
Because of the random assignment research design, this approach, based on these char-acteristics, best predicts which students in the Academy group would have dropped out in ab-sence of access to an Academy. Thus, students in the Academy group were sorted using the sameaverage background characteristics that were used to predict dropping out for the non-Academygroup. Following are brief definitions of the three risk subgroups, which are described furtherbelow.
High-risk subgroup: students in the study sample (approximately 25 percentof both the Academy and the non-Academy groups) with the combination ofcharacteristics associated with the highest likelihood of dropping out
Low-risk subgroup: students in the study sample (approximately 25 percentof both the Academy and the non-Academy groups) with the combination ofcharacteristics associated with the lowest likelihood of dropping out
Medium-risk subgroup: the remaining students in the study sample (ap-proximately 50 percent of both the Academy and the non-Academy groups)with a mix of characteristics indicating that they were not particularly likely todrop out but were not necessarily highly engaged in school
A. Characteristics of Students in the Risk Subgroups
Table 2.2 presents selected characteristics of students in the three risk subgroups, includ-ing the background characteristics and prior school experiences used to define the subgroups.Because each of the characteristics used to define the subgroups was measured before studentswere randomly assigned to the two main study groups, there are no systematic differences in ob-served background characteristics between Academy and non-Academy groups within each ofthe three risk subgroups.'
Students in the High-Risk Subgroup. The third section of Table 2.2 lists the six char-acteristics that were used to define the risk subgroups. It shows, for example, that 43 percent stu-dents in the high-risk subgroup had a sibling who dropped out of high school and that 43 percentwere overage for their grade level (indicating they had been held back in a prior grade). Aboutone-third of these students could be classified as chronic absentees (having an attendance rate of85 percent or lower in the year they applied to an Academy), and 62 percent had a grade pointaverage of 2.0 or lower (out of a possible 4.0). Also, over half of the students in the high-risk
'The initial prediction of dropping out was based on analyses using the non-Academy group. An index of aver-age characteristics of likely dropouts from the non-Academy group was then applied to the Academy group. Giventhe statistical properties of the analyses used, random differences in characteristics between the Academy and thenon-Academy groups are likely to yield somewhat more accurate predictions of likely dropouts for the non-Academy group. This means that, in the high-risk subgroups, the dropout rate for non-Academy students may beartificially higher than the dropout rate for Academy students. Extensive analyses were conducted to identify thepotential magnitude of this distortion. These analyses indicate that whatever distortion exists is negligible and didnot change the pattern of impacts. This issue is discussed in greater detail in Appendix B.
-28- 6 3

Table 2.2
Career Academies Evaluation
Background Characteristics of Study Sample,by Subgroups Defined by Risk of Dropping Out of School
Characteristic
High-RiskSubgroup
(%)
Medium-RiskSubgroup
(%)
Low-RiskSubgroup
(%)
Demo2raphic and family characteristics
GenderMale 43.0 45.5 41.3Female 57.0 54.6 58.7
Age of student at time of application13 or younger 2.1 10.6 11.7 ***
14 22.2 39.2 43.615 54.4 42.8 43.316 or older 21.3 7.4 1.4
Race/ethnicityBlack 37.6 29.9 22.7 ***
White 4.7 7.2 6.8Hispanic 51.8 56.0 61.5Asian or Native American 5.9 6.9 9.2
Student speaks limited Englishh 8.7 7.7 6.2
Student lives in single-parent household 49.7 39.2 ***23.8
Neither parent has high school diploma 26.6 29.5 28.8
Parental WorkBoth parents work 41.3 48.3 51.9Father works 24.9 20.6 29.0Mother works 19.4 19.8 12.1
Neither parent works 14.3 11.3 7.1
Family receives welfare or Food Stamps 31.8 23.0 ***18.6
Family mobility in past two yearsHave not moved 54.2 60.5 63.3Moved 1 or 2 times 33.5 34.6 31.7Moved 3 or more times 12.4 5.0 5.0
Educational characteristics
8th -grade math test score°75th percentile or higher 3.1 8.8 14.050th to 74th percentile 16.3 20.5 24.825"' to 49"' percentile 31.0 33.9 29.924° percentile or lower 49.5 36.8 31.3
(con inued)
BEST COPY AVAILABLE
-29-

Table 2.2 (continued)
High-RiskSubgroup
Medium-RiskSubgroup
Characteristic (%) (%)
8'h -grade reading test score75° percentile or higher 4.1 10.650th to 74th percentile 19.7 19.525m to 49th percentile 36.3 37.624th percentile or lower 40.0 32.3
Student does not feel safe at school 27.0 22.5
Frequency of cutting classesNever 63.4 82.2At least 1 time a week 33.2 16.9Daily 3.4 0.9
Sent to office for misbehaviorNever 73.6 81.01-2 times 20.7 16.43-10 times 5.7 2.5
Characteristics associated with dropping out of school
Attendance rate, year prior to random assignment96-100% 24.4 52.591-95% 23.6 32.386-90% 18.7 11.785% or lower 33.3 3.6
Credits earned in 9th grade°5 or more credits 47.2 93.83-4 credits 35.1 6.32 or fewer credits 17.7 0.0
Grade point average in year of random assignment`3.1 or higher 12.5 37.22.1-3.0 25.5 44.02.0 or lower 62.0 18.7
Student is overage for grade level' 43.0 18.2
School mobilityg0 or 1 different school 50.0 71.92 or more different schools 50.0 28.1
Student has sibling who dropped out of high school 42.7 17.5
Sample size (N=1,764) 474 869
-30-
Low-RiskSubgroup
(%)
14.618.933.533.1
20.6
89.710.30.0
90.48.71.0
91.07.91.00.2
100.00.00.0
58.639.3
2.1
2.4
99.01.0
0.5
***
* **
***
421(continued)

Table 2.2 (continued)
SOURCES: See Table 2.1.
NOTES: All characteristics were measured at the time students applied to the Career Academy program and prior tobeing randomly selected to the Academy and non-Academy groups.
Invalid or missing values are not included in individual variable distribution. Rounding may cause slightdiscrepancies in calculating of sums and differences.
A chi-square test was applied to differences in the distribution of characteristics across the Academy and non-Academy groups. Statistical significance levels are indicated as: *** = 1 percent; ** = 5 percent; * = 10 percent.
"These are students who responded that they spoke English "not well" or "not at all."bSeveral different standardized, nationally normed math tests were administered to students, depending on the
district where their school was located and the year they entered the study. National percentile scores were usedbecause they were the only standardized scores available across tests.
`Several different standardized, nationally normed reading tests were administered to students, depending on thedistrict where their school was located and the year they entered the study. National percentile scores were usedbecause they were the only standardized scores available across tests.
"This was applicable only to students who applied to the Career Academy at the end of their 9th-grade year.
`Grade point averages were converted to a standard 4.0 scale from 100-point or 5-point scales for some sites.fA
student is defined as overage for grade at the time of random assignment if she or he turns 15 before the start
of the 9th grade, or 16 before the start of the 10th grade. This indicates that the student was likely to have been heldback in a previous grade.
'School mobility is defined as the number of schools attended since the 1st grade beyond the number expected toresult from promotions in grade level or graduations.
subgroup who applied for an Academy at the end of 9th grade had already fallen behind in thenumber of course credits they needed to graduate.
Table 2.2 also highlights a number of other distinctive characteristics of students in thehigh-risk subgroup. It shows that these students were the most likely to have 8th-grade math orreading test scores below the 25th percentile nationally. About half of them lived in single-parenthouseholds, and 32 percent reported that their families received public assistance.
Students in the Low-Risk Subgroup. The vast majority of students in the low-risk sub-group had attendance rates higher than 95 percent, and all of those who applied to an Academy atthe end of 9th grade had earned at least five credits toward graduation. Over half had a grade pointaverage of 3.1 or higher, and very few were overage for grade. Almost none of the low-risk stu-dents had a sibling who dropped out of high school, and very few had transferred schools otherthan at the typical school transition points. The majority of these students lived in householdswhere at least one parent had a high school diploma or GED (over 70 percent), and over halflived in households where both parents worked.
Although students in the low-risk subgroup appeared to be highly engaged in school atthe time they applied to an Academy, their standardized test scores indicate that they were notnecessarily high-achieving students. Less than 15 percent of the low-risk subgroup had math or
-31- 66

reading test scores above the 75th percentile nationally, and almost a third scored in the bottomquartile.
Students in the Medium-Risk Subgroup. The students in the medium-risk subgroupreflect a mix of background characteristics and prior school experiences. Many of these studentsappeared to be highly engaged in school; the vast majority of those who applied for an Academyat the end of 9th grade had earned five or more course credits, and about half had attendancerates of higher than 95 percent. At the same time, just under 20 percent were overage for theirgrade level, and just under 20 percent had a grade point average of 2.0 or lower.
Selected Outcomes by Risk Subgroup for the Non-Academy Group
Figure 2.1 shows three outcomes that are central to the analyses conducted for this report:the dropout rate, the percentage of students who completed sufficient course credits to meet theirdistricts' graduation requirements, and the percentage of students who completed a basic coreacademic curriculum (four course credits in English, three course credits in social studies, andtwo course credits each in science and math). Each outcome was measured at the end of the stu-dents' 12th-grade year. The figure illustrates the percentages of students in the non-Academygroup from each of the three risk subgroups who attained each of these outcomes. It illustratesthe dramatic differences among the three subgroups.
Thirty-two percent of non-Academy students in the high-risk subgroup dropped out ofhigh school, and nearly three-quarters had not earned enough credits to graduate from highschool by the end of their 12th-grade year. Only 16 percent of the non-Academy students in thissubgroup had completed the basic core academic curriculum. The analysis in Chapter 3 assessesthe extent to which students in the Academy group who had the same background characteristicsfared better than their non-Academy counterparts.
Figure 2.1 also illustrates the relatively high level of engagement among non-Academystudents in the low-risk subgroup. In all, only 3 percent of these students in the non-Academygroup dropped out of high school, and 75 percent had earned enough credits to meet their dis-tricts' graduation requirements. Just over 60 percent had completed the basic core curriculum.The analysis in Chapter 3 assesses the extent to which the Career Academies enhanced or limitedthe capacity of these students to complete their course requirements for graduation and to preparefor post-secondary education.
As expected, the outcome levels for non-Academy students in the medium-risk subgroupfell between those in the high- and low-risk subgroups. Eight percent of non-Academy studentsin the medium-risk subgroup dropped out of high school, while 65 percent earned sufficientcredits to meet district graduation requirements. About half of these students completed the basiccore curriculum.
III. Career Academy Enrollment and Attrition Patterns
This section of the chapter examines the patterns by which students in the study sampleenrolled and remained in the Career Academies. This information is important to the evaluationbecause the patterns of Academy enrollment and attrition are the key indicators of the extent towhich students in the sample were exposed to the full range of Academy experiences. Thus, these
-32-
6 7

patterns are key determinants of program impacts and provide a crucial context for interpretingthe results discussed later in the report. This information is also relevant to policies and practicesaffecting Career Academies because they shed light on the demand for the programs and assesstheir capacity to keep students engaged in their activities and services.
Figure 2.1
Career Academies Evaluation
12th Grade Outcomes AmongNon-Academy Students, by Risk Subgroup
m70%
60%c7)
° 50%
f.1, 40%
11' 30%
20%
10%
0%
E High RiskO Medium RiskGI Low Risk
75%
61%
Dropped Out of School Completed Credits to Graduate
High School Outcomes
Completed Basic Core Courses a
SOURCES: MDRC calculations from the Career Academies Evaluation School Records and 12th Grade Survey Databases.
NOTES: A two-tailed t-test was applied to differences between Academy and non-Academy groups. Statistical significance levelsare indicated as *** = 1 percent; ** = 5 percent; * = 10 percent.
'Indicates completion of four English, three social studies, two math, and two science courses during high school.
The findings discussed in this section of the chapter are based on 782 students in thestudy sample who were randomly selected for the Academy group at the end of 8th or 9th grade.'The analysis follows these students through the end of their 12th -grade year to determine the per-centage who actually enrolled in a Career Academy and then examines the patterns by whichthey left or remained in the programs. It also examines the reasons why some of these studentschose not to enroll in a Career Academy or why they enrolled for a time and then left.
A. How Many Students Enrolled in a Career Academy and How Many Stayedin the Programs?
Figure 2.2 illustrates the enrollment patterns of a typical group of 100 students in thestudy sample selected to enroll in the Academy programs. The numbers in the boxes thus repre-
'This includes students in the Academy group from the Career Academies Evaluation Student School RecordsDatabase. The remaining Academy students in the study sample did not have a complete set of school records and,therefore, did not have a complete record of their school enrollment status.
BEST COPY AVAILABLE 68-33-

sent percentages of the 782 students in the Academy group who were randomly selected to enrollin programs. The figure shows that 88 percent of these students enrolled in a Career Academy atsome point during high school; the vast majority did so during the year following their applica-tion to the programs (the first semester of 9th or 10th grade). Figure 2.2 also shows that 58 percentof the initial group of students were still enrolled in an Academy at the end of their 12th-gradeyear. This means that 66 percent of those who were enrolled in an Academy for at least one se-mester remained in the programs throughout high school.
Figure 2.2 also indicates that a significant portion of those initially selected for the pro-grams were not exposed to the full range of Career Academy experiences. In all, 42 percent ofthe Academy group either did not enroll in the program or enrolled for a semester or more andthen left. The next two sections provide an overview of what happened to these students and re-view some of the factors that led to their not enrolling or not remaining in the programs.
. What Happened to the Students Who Never Enrolled in a Career Academyor Who Enrolled and Later Left the Programs?
The following is a summary of the high school enrollment status of those students whoeither never enrolled in a Career Academy or enrolled and then left the programs before the endof high school.
© 12 percent of the students randomly selected for the Academy groupnever enrolled in a Career Academy. Following is a summary of the highschool enrollment status at the end of their 12th-grade year:
o 4 percent were still enrolled in the high school in which the Academywas located (but were not enrolled in the Academy).
o 5 percent were enrolled in another high school in the same district.
o 1 percent were enrolled in a high school in another district.
o 2 percent dropped out of high school.
o 30 percent of the students randomly selected for the Academy group en-rolled in a Career Academy during at least one semester of high school,but they left the program before the second semester of their 12th-gradeyear. Nearly 90 percent of these students had left a Career Academy by theend of their 1 Ph-grade year. This begins an important stage of involvement inan Academy because most work-based learning activities occur during thesummer between 11 th.and 12th grades or during the 12th-grade year. These stu-dents spent an average of three semesters in the program before they left.Following is a summary of their school enrollment status at the end of their12th-grade year:
o 12 percent were still enrolled in the high school in which the Academywas located (but were not enrolled in the Academy).
o 9 percent were enrolled in another high school in the same district.
o 1 percent were enrolled in a high school in another district.
o 8 percent had dropped out of high school.
-34-
6 9

Figure 2.2
Career Academies Evaluation
Career Academy Enrollment and Attrition PatternsAmong Students Selected to Enroll
Enrolled in CareerAcademy
88
Stayed in CareerAcademy
58
Students selected toenroll in Career
Academy100
Left CareerAcademy
30
Stayed in highschool
22
Dropped out of highschool
8
Never enrolled inCareer Academy
12
Stayed in highschool
10
Enrollment Status at End of 12th GradeYear
Dropped ou of highschool
2
SOURCE: MDRC calculations from the Career Academies Evaluation Student School Records Database.
NOTE: Numbers are derived in proportion to 782 students who were selected to enroll in Career Academies.
In sum, therefore, 90 percent of the students randomly selected for the Academy groupwere still enrolled in high school at the end of their 12th-grade year. Following is a summary ofwhere they were enrolled in school:
o 58 percent were enrolled in a Career Academy.
o 16 percent were enrolled in the high school in which the Academy was located.
© 15 percent were enrolled in another high school in the same district.
o 1 percent were enrolled in a high school in another district.
Also, by the end of their 12th-grade year, approximately 10 percent of the students in the Acad-emy group had dropped out of high school.
C. Why Did Students Not Enroll i a Career Academy or Enroll and Then Leave?
Of the students who applied for a Career Academy and were selected to enroll, 42 percenthad either never enrolled in an Academy or had enrolled and then left before the second semesterof their 12th-grade year. A subset of 251 completed the 12th Grade Survey and provided infor-mation about why they did not enroll in an Academy or why they enrolled and then left. Studentswere asked to rate up to 16 items in terms of how important each was as a reason for not enroll-
-35- 70

ing in an Academy or enrolling and then leaving. For the purposes of this analysis, the primaryreasons for never enrolling, or for enrolling and then leaving, were divided into four mutuallyexclusive groups: student choice, family mobility and school transfer, being asked to leave, anddropping out.9
The following is a summary of the reasons that students listed as the most important fac-tors that led them to never enroll in a Career Academy or to enroll for at least one semester andthen leave before the end of their 12th-grade year.
Student choice. 54 percent of the students reported one or more reasons, indi-cating that they chose not to enroll or chose to leave the Academy. Amongthose who chose to leave or not to enroll, the most common reasons in-cluded:''
I wanted to enroll in another program. (42 percent)
I was not really interested in the program to begin with. (39 percent)
I did not think the program would help me get into the college Iwanted. (32 percent)
I did not like the teachers. (36 percent)
I lost interest in the occupational area. (35 percent)
Mobility. 23 percent of the students reported that they moved and had totransfer to another high school.
Being asked to leave. 16 percent reported that they were asked to leave theAcademy.
o Dropping out. 5 percent reported that they stopped going to high school.
o No primary reason. 2 percent did not indicate a primary or secondary reason.
This suggests that most of the attrition from the Career Academies is the result of a deci-sion on the part of students. However, nearly one-quarter of the attrition appears to be a functionof family mobility and school transfers.
'Students were asked to rate each reason on a 4-point scale: 1 = very important, 2 = sort of important, 3 = notvery important, and 4 = not important at all. Items that were rated as "very important" were designated as primaryreasons, and items rated as "sort of important" were designated as secondary reasons. If a student did not list a pri-mary reason, then the secondary reason was designated as the primary reason.
'These are not mutually exclusive categories. Many students listed several reasons as being "very important"or "sort of important." In addition to the reasons listed, other reasons students chose to leave or not enroll in theAcademies included: "The program was too hard"; "I wanted to be in classes with more of my friends"; "I was tiredof being in classes with the same students"; "I did not think the program would help me get the job I wanted"; and"I chose to leave for other reasons."
-36-
71

D. Who Is Most Likely to E i roll and Remain i a Career Academy?
Table 2.3 presents the Career Academy enrollment and attrition rates for selected sub-groups of students who were randomly selected for the Academy group. The table shows the per-centage of each subgroup who had enrolled in an Academy at some point during high school andthe percentage who remained enrolled in the programs through the end of 12th grade. The tablealso shows the percentage of each subgroup who enrolled during at least one semester of highschool but who then left before the end of 12th grade. Finally, the last column of the table showsthe average number of semesters that students in each subgroup were enrolled in an Academy.
In general, the table indicates that there were some modest differences among varioussubgroups in the percentage of students who had enrolled in an Academy during at least one se-mester during high school. Academy enrollment rates ranged from 80 to 95 percent for most ofthe subgroups. It is interesting to note that the initial Career Academy enrollment rates were quitesimilar among the three risk subgroups.
Table 2.3 does indicate somewhat more variation among the various subgroups in thepercentage of students who remained in a Career Academy through the end of their 12th-gradeyear. In general, students in the high-risk subgroup were less likely than medium- and low-riskstudents to be enrolled in a Career Academy through the end of 12th grade. This can be seen inthe last section of the table, which shows the enrollment rates for the risk subgroups. It showsthat 43 percent of students in the high-risk subgroup were enrolled in an Academy at the end of12th grade, indicating that about half of those who initially enrolled eventually left the programs.On average, these students spent just under four semesters in a Career Academy. For the majorityof high-risk students, therefore, the benefits that may have derived from the Academies werelikely to occur during 10th and 11th grades (or 9th and 10th grades in sites where the Academiesbegan in 9th grade). Thus, many students in the high-risk subgroup did not stay in the programslong enough to participate in the work-based learning programs and work internships, whichtypically occur after 11th grade.
By contrast, 73 percent of the students in the low-risk subgroup were enrolled in a CareerAcademy at the end of 12th grade. This means that over 80 percent of these students who initiallyenrolled in a Career Academy remained enrolled in the programs throughout high school. On av-erage, students in the low-risk subgroup spent over five semesters in a Career Academy."
E. Implications for Career Academy Implementation and for theCareer Academies Evaluation
The enrollment and attrition patterns discussed above have implications for policy andpractice related to the Career Academies. They also provide an important context for interpretingthe impact findings discussed in Chapter 3. These are discussed briefly below.
Implications for Career Academy Policies and Implementation. It is unclear howmuch of the attrition could theoretically be controlled or avoided by the Academies. Student mo-
"Note that for approximately 80 percent of the students in the sample, the Career Academies began in 10thgrade. These students had the opportunity to remain enrolled in an Academy for up to six semesters. For the re-maining students, the Career Academies began in 9th grade, providing students with the opportunity to enroll for upto eight semesters.
-37- 72--

00
73
Tab
le 2
.3
Car
eer
Aca
dem
ies
Eva
luat
ion
Car
eer
Aca
dem
y E
nrol
lmen
t and
Attr
ition
Rat
esfo
r Se
lect
ed S
ubgr
oups
of
the
Aca
dem
y G
roup
Subg
roup
sSa
mpl
eSi
ze
Eve
r E
nrol
led
in a
Car
eer
Aca
dem
y(%
)
Enr
olle
d th
roug
h12
th G
rade
(%)
Enr
olle
d in
aC
aree
r A
cade
my
and
The
n L
eft
(%)
Ave
rage
Num
ber
of S
emes
ters
Enr
olle
d in
aC
aree
r A
cade
my
All
stud
ents
ran
dom
ly s
elec
ted
for
Aca
dem
y gr
oup.
782
88.4
58.7
29.7
4.6
Dem
ogra
phic
and
fam
ily c
hara
cter
istic
sM
ale
345
88.4
55.4
33.0
4.4
Fem
ale
437
88.3
61.3
27.0
4.7
Age
of
stud
ent a
t tim
e of
app
licat
ion
13 o
r yo
unge
r60
85.0
58.3
26.7
5.6
1428
388
.359
.029
.34.
815
369
90.0
60.4
29.5
4.5
16 o
r ol
der
6982
.647
.834
.83.
7
Rac
e/et
hnic
ityB
lack
240
80.0
50.8
29.2
4.3
Whi
te45
97.8
64.4
33.3
4.7
His
pani
c42
392
.761
.930
.74.
8A
sian
or
Nat
ive
Am
eric
an62
83.9
61.3
22.6
4.3
Stud
ent s
peak
s lim
ited
Eng
lisha
4695
.776
.119
.65.
1
Stud
ent l
ives
in s
ingl
e-pa
rent
hou
seho
ld28
582
.850
.931
.94.
2
Nei
ther
par
ent h
as h
igh
scho
ol d
iplo
ma
194
94.8
66.0
28.9
4.9
Pare
ntal
Wor
kB
oth
pare
nts
wor
k33
988
.560
.827
.74.
6Fa
ther
wor
ks17
192
.461
.431
.04.
8M
othe
r w
orks
139
87.8
59.0
28.8
4.7
Nei
ther
par
ent w
orks
7978
.545
.632
.94.
0(c
ontin
ued)
74

Tab
le 2
.3 (
cont
inue
d)
Sam
ple
Subg
roup
sSi
ze
Eve
r E
nrol
led
in a
Car
eer
Aca
dem
y(%
)
Enr
olle
d th
roug
h12
th G
rade
(%)
Enr
olle
d in
aC
aree
r A
cade
my
and
The
n L
eft
(%)
Ave
rage
Num
ber
of S
emes
ters
Enr
olle
d in
aC
aree
r A
cade
my
Fam
ily r
ecei
ves
wel
fare
or
Food
Sta
mps
159
85.5
49.7
35.8
4.4
Fam
ily m
obili
ty in
pas
t tw
o ye
ars
Hav
e no
t mov
ed49
887
.154
.232
.94.
5M
oved
1 o
r 2
times
231
92.2
67.1
25.1
4.9
Mov
ed 3
or
mor
e tim
es43
79.1
58.1
20.9
4.3
Cha
ract
eris
tics
asso
ciat
ed w
ith d
ropp
ing
out o
f sc
hool
Stud
ent h
as s
iblin
g w
ho d
ropp
ed o
ut o
f hi
gh s
choo
l15
188
.153
.035
.14.
3
Atte
ndan
ce r
ate,
yea
r pr
ior
to r
ando
m a
ssig
nmen
t96
-100
%43
090
.767
.223
.55.
0
91-9
5%18
586
.554
.631
.94.
5
k...
)86
-90%
9485
.146
.838
.34.
0`P
Les
s th
an 8
5%70
82.9
32.9
50.0
3.2
Cre
dits
ear
ned
in 9
th g
rade
b5
or m
ore
cred
its48
290
.565
.425
.14.
63-
4 cr
edits
7688
.239
.548
.73.
62
or f
ewer
cre
dits
1881
.325
.056
.32.
8
Gra
de p
oint
ave
rage
in y
ear
of r
ando
m a
ssig
nmen
t`3.
1 or
hig
her
253
85.0
63.2
21.7
5.2
2.1-
3.0
282
91.5
61.7
29.8
4.5
2.0
or lo
wer
172
87.8
46.5
41.3
3.8
Stud
ent i
s ov
erag
e fo
r gr
ade
leve
l°15
383
.746
.437
.34.
0
Scho
ol m
obili
ty'
0 or
1 d
iffe
rent
sch
ool
558
88.5
60.6
28.0
4.7
2 or
mor
e di
ffer
ent s
choo
ls18
987
.856
.131
.74.
5(c
ontin
ued)
76
75

Tab
le 2
.3 (
cont
inue
d)
Sam
ple
Eve
r E
nrol
led
in a
Car
eer
Aca
dem
yE
nrol
led
thro
ugh
12th
Gra
de
Enr
olle
d in
aC
aree
r A
cade
my
and
The
n L
eft
Ave
rage
Num
ber
of S
emes
ters
Enr
olle
d in
aSu
bgro
ups
Size
(%)
(%)
(%)
Car
eer
Aca
dem
y
Ove
rall
risk
of
drop
ping
out
(H
igh
risk
185
86.5
42.7
43.8
3.8
Med
ium
ris
k39
388
.858
.830
.04.
6L
ow r
isk
204
89.2
73.0
16.2
5.2
Sam
ple
size
782
SOU
RC
ES:
MD
RC
cal
cula
tions
fro
m th
e C
aree
r A
cade
mie
s E
valu
atio
n St
uden
t Sch
ool R
ecor
ds D
atab
ase.
NO
TE
S:A
ll ch
arac
teri
stic
s w
ere
mea
sure
d at
the
time
stud
ents
app
lied
to th
e C
aree
r A
cade
my
prog
ram
and
pri
or to
bei
ng r
ando
mly
sel
ecte
d to
the
Aca
dem
y gr
oup.
Inva
lid o
r m
issi
ng v
alue
s ar
e no
t inc
lude
d in
indi
vidu
al v
aria
ble
dist
ribu
tion.
Rou
ndin
gm
ay c
ause
slig
ht d
iscr
epan
cies
in c
alcu
latin
g of
sum
s an
ddi
ffer
ence
s. T
ests
of
stat
istic
al s
igni
fica
nce
wer
e no
t per
form
ed. S
ampl
e si
zes m
ay v
ary
due
to m
issi
ng d
ata.
'The
se a
re s
tude
nts
who
res
pond
ed th
at th
ey s
poke
Eng
lish
"not
wel
l"or
"no
t at a
ll."
bilis
was
app
licab
le o
nly
to s
tude
nts
who
app
lied
to th
e C
aree
r A
cade
my
at th
e en
d of
thei
r 9t
h-gr
ade
year
.`G
rade
poi
nt a
vera
ges
wer
e co
nver
ted
to a
sta
ndar
d 4.
0 sc
ale
from
100
-poi
ntor
5-p
oint
sca
les
for
som
e si
tes.
d A s
tude
nt is
def
med
as
over
age
for
grad
e at
the
time
of r
ando
m a
ssig
nmen
t if
she
or h
e tu
rns
15 b
efor
e th
e st
art o
f th
e 9t
h gr
ade,
or
16 b
efor
e th
est
art o
f th
e 10
th g
rade
. Thi
s in
dica
tes
that
the
stud
ent w
as li
kely
to h
ave
been
hel
d ba
ck in
a p
revi
ous
grad
e.
`Sch
ool m
obili
ty is
def
ined
as
the
num
ber
of s
choo
ls a
ttend
ed s
ince
the
1st g
rade
bey
ond
the
num
ber
expe
cted
to r
esul
t fro
m p
rom
otio
ns in
gra
dele
vel o
r gr
adua
tions
.
(The
se s
ubgr
oups
wer
e de
fmed
usi
nga
com
bina
tion
of th
e ch
arac
teri
stic
s lis
ted
abov
e un
der
"cha
ract
eris
tics
asso
ciat
ed w
ith d
ropp
ing
out o
fsc
hool
." S
ee te
xt f
or d
etai
ls.
78

bility and dropout are not uncommon problems in most urban high school districts, and theywere factors associated with the attrition from the Career Academies in this evaluation. As dis-cussed earlier, nearly one-quarter of the students who never enrolled or left the Academies did sobecause they moved. This finding suggests that at least part of the attrition from the Academiesresults more from family relocation patterns than from any particular feature or shortcoming ofthe Academy (although some families may have moved to find better schools).
However, just over half of those who never enrolled or who enrolled and then left indi-cated that they chose to do so. It is not unreasonable to expect that a substantial number of theAcademy students who enroll in 90 or 10th grade would decide that the Academy program is notthe best context in which to pursue their education. In some cases students may leave the Acad-emy because they decide that they are no longer interested in the career theme or in the variouswork-related learning activities. This attrition need not imply shortcomings in the Academymodel or its implementation if the students made the choice to leave because they had access toopportunities that better suited their needs and interests.
Many high schools and school districts around the country are attempting to expand thenumber of Career Academies they operate. In some cases, there are efforts to convert entire highschools to a series of Career Academies (often referred to as "wall-to-wall" Academies). In thesecases, every student in the school would be required to enroll in an Academy beginning in 10th
grade (or, in some cases, in 9th grade). The findings on enrollment and attrition from this studysuggest that there may not be an excess of demand for Academies, at least under circumstanceswhere students have the opportunity to choose to leave and staff have the opportunity to ask stu-dents to leave.
Each of the programs in the study received applications from more students than it wasable to serve. This suggests that there was likely to be enough demand for Career Academies tojustify expanding the number of programs within the high schools. However, given the opportu-nity to choose to leave the programs or, on the part of staff, given the opportunity to dismissstudents from the programs less than 60 percent of the students remained in the programsthroughout high school. This suggests that the current programs may be operating at capacity,based on the number of students who choose to stay and whose mobility patterns permit them todo so.
Interpreting the Impact Findings. The fundamental comparison being made in the im-pact analysis is between outcomes for students who were selected to enroll in an Academy (theAcademy group) and outcomes for students who were not selected (the non-Academy group).Differences between the groups were driven by the extent to which the Academy group was ex-posed to the Academy experiences and the extent to which the non-Academy group was not. Theanalysis in this chapter shows, however, that not all the students randomly assigned to the Acad-emy group actually enrolled in an Academy. In addition, approximately 6 percent of the studentsin the non-Academy group were inadvertently allowed to enroll in Academies. Thus, differencesbetween the two groups reflect the Academy-related experiences of those students in the Acad-emy group who enrolled in an Academy (88 percent) and the experiences of those students in thenon-Academy group who did not enroll in an Academy (94 percent).
In order to produce unbiased estimates of the Academies' true impact, it is necessary toinclude all sample members in the analysis, regardless of their Academy enrollment status. For
-41-
7 9

example, students who dropped out of high school are considered to have attended school forzero days and to have earned zero credits during the period they had left school. To the extentthat the Career Academies keep students in their programs and prevent them from dropping out,excluding these zero values from the.analysis would lead to a serious underestimation of the pro-gram impacts. At the same time, the findings in the chapter show that students in the high-risksubgroup are more likely to leave the Academies. If these students were excluded from theAcademy group but not from the non-Academy group, it would appear that the Academies in-clude fewer low-achieving and less engaged students. This would represent a serious overesti-mation of the impact of Career Academies.
Nevertheless, it is highly unlikely that the Career Academies had much effect on studentsin the study's Academy group who never enrolled in them. It is also not accurate to assume thatthe Academies had no effect on students in the study's non-Academy group who did enroll. Fromthis perspective, the impact estimates may be perceived as being "diluted." Thus, it is useful toprovide impact estimates that account for these "crossovers" in research status.
In the case of the Career Academies Evaluation, the impacts are adjusted based on thedifference in actual enrollment rates among Academy and non-Academy groups. In particular,each of the tables in Chapters 3 and 5 includes the impactper enrollee for each outcome. This isdefined as the difference between the outcomes of Academy and non-Academy students dividedby the difference between the percentage of Academy and non-Academy students who ever en-rolled in an Academy. This adjustment is discussed further in Chapter 3.
These adjustments do not substantially change the overall impact story discussed inChapters 3 and 5. The impact per enrollee can be interpreted as the impact from actually enroll-ing in an Academy, as opposed to simply being recruited and selected for admission. Chapters 3and 5 explore the extent to which the patterns of the impacts of Career Academies on student out-comes vary across different subgroups of students. The analysis presented above suggests that theseimpacts are not greatly affected by differences across the subgroups in the extent to which thesestudents ever enroll in an Academy. However, it suggests the possibility that impacts are affectedby differences in how long subgroups remain in an Academy.
-42-

Chapter 3
Career Academy }Impacts onSt dent Engagement, Performance, and Achievement
Chapter 2 described the background characteristics and prior school experiences of thestudents who are the focus of this report. This chapter evaluates the impadt of Career Academieson a broad range of high school outcomes for students at different levels of risk of school failure.
The random assignment research design used in this study provides a uniquely rigorousway to identify the impact of Career Academies. The students in this study were randomly as-signed to either the Academy group, which had access to an Academy, or to the non-Academygroup, which did not. As a result, the impact of the Career Academies is defined as the differencein the outcome levels achieved by Academy students over and above those achieved by theirnon-Academy counterparts. These impact findings provide the most reliable estimates of the truedifference these Academies made for the students they aimed to serve.
Most previous evaluations of Career Academies have tended to focus on program out-comes and impacts for the "typical" or "average" Career Academy student. Like these previousstudies, this chapter provides a brief summary of results that are averaged across the diversegroup of students and sites participating in this evaluation. However, as discussed in Chapter 2, itis clear from both a substantive and a statistical standpoint that these "average" results mask thehigh degree of underlying variation in impacts. In particular, the analysis in Chapter 2 revealedthat, within this study sample, there are groups of students who had substantially different back-ground characteristics and who, in the absence of the Academy treatment, experienced substan-tially different academic outcomes at the end of high school.
Therefore, to adequately understand the impact of these Career Academies, it is impor-tant to recognize that they affect students differently depending on the types of skills, attributes,and prior experiences that the students bring to the programs. Thus, the impact findings dis-cussed in this chapter are presented separately for the three subgroups of students described inChapter 2: students at high risk of dropping out and highly likely to be disengaged if they stayedin school (approximately 25 percent of the study sample); students at low risk of dropping outand likely to remain engaged and perform well in school (approximately 25 percent of the studysample); and students at only medium risk of dropping out but not necessarily highly engaged inschool (approximately 50 percent of the study sample).'
The evidence presented in this chapter suggests the following conclusions:
Among students most at risk of dropping out, Career Academies significantlyimproved high school outcomes. The Academies reduced dropout rates, im-proved attendance, increased academic course-taking, and increased the likeli-hood that students graduated on time.
'Each of these subgroups comprises students from the study's Academy and non-Academy groups as deter-mined at random assignment. As discussed in Appendix B, there are no systematic differences in measured back-ground characteristics between Academy and non-Academy students within each subgroup.
-43- 81

Among the students least likely to drop out of high school, Career Academiesincreased the likelihood that students were prepared to graduate on time. Be-cause both Academy and non-Academy students in the low-risk subgroupwere likely to remain strongly engaged in high school, the Academies had lit-tle or no impact on most indicators of student engagement and performance.
On average, the Career Academies produced little or no change in outcomesfor students in the medium-risk subgroup.
When data are averaged across the diverse groups of students and sites par-ticipating in the evaluation, it appears that the Career Academies producedonly modest improvements in students' engagement and performance duringhigh school.
To provide a context for interpreting the estimates presented in this chapter, Section Ibriefly reviews several important analysis issues.
I. Analysis Issues
When examining the effectiveness of Career Academies in influencing students' behaviorand experiences, it is important to distinguish between measures of program "outcomes" andmeasures of program "impacts." Outcomes refers to the measures of student engagement, per-formance, behaviors, achievement, and attitudes in this case, during their high school years.The chapter examines five sets of outcomes that were measured through the end of each student's12th-grade year:
high school enrollment and attendance rates;
credits earned and course-taking patterns;
math and reading achievement test scores;
use of non-school hours and involvement in negative risk-taking behaviors;and
steps taken toward further education and work and plans for the future.
As noted in Chapter 1, these outcomes were measured using data collected from school tran-script records, a survey that students completed at the end of their 12th-grade year, and a mathand reading achievement test that a subsample of students completed at the end of their 12th-grade year.
An impact is defined as the effect that a Career Academy has on an outcome. The averageoutcome levels for students in the Academy group alone provide potentially misleading conclu-sions. Previous research and prior experience highlight the fact that many students succeed or failin high school for reasons not related to a special intervention like a Career Academy. In order todetermine the net effect, or "value added," of a Career Academy, it is necessary to compare theexperiences of a group of students who were exposed to a Career Academy with a similar groupof students who also applied but were not selected to enroll. As discussed in Chapter 1, the
-44-
82

Academy and non-Academy groups participating in this study were determined through a ran-dom selection process. The non-Academy group serves as a benchmark for how students in theAcademy group would have performed if they had not had access to the programs. Therefore, theimpacts (differences in outcomes between the Academy and the non-Academy groups) representthe difference in outcomes that Career Academies generate over and above what non-Academyenvironments do for comparable students.
Unless otherwise noted, the measures presented in the tables for this chapter indicatethe percentages of students in the Academy and non-Academy groups who attained a givenoutcome or reported a given behavior or experience. For example, some tables report the per-centages of students who dropped out of high school, who attended 95 percent or more of thetime throughout high school, or who earned a sufficient number of course credits to meet theschool district's graduation requirements. Other tables report the percentages of students whoreported working on volunteer projects, who reported being arrested, or who reported submit-ting a college application.
Each table compares the percentage of Academy group students who attained a givenoutcome with the percentage of non-Academy group students who did so. The difference be-tween the groups represents the impact of the Career Academies. The tables also present the per-centage change in the non-Academy group outcome level represented by the impact. This is de-fined as the impact divided by the non-Academy group average. For example, if 60 percent of theAcademy group attained a certain outcome compared with 50 percent of the non-Academygroup, this 10 percentage point difference would represent a 20 percent increase (10 divided by50) over the non-Academy group level of 50 percent.
It is important to note that the impact estimates discussed in this report are based onanalyses that include all students in both the Academy and the non-Academy groups. Thisincludes both Academy group students who may not have enrolled in a Career Academy andstudents from both groups who may have dropped out of high school altogether. As discussed inChapter 2, not all students randomly selected for the Academy group actually enrolled in anAcademy. To the extent that these students are different from their counterparts who did enroll(and, more important, different from students in the non-Academy group), excluding them fromthe analyses would lead to serious misrepresentation of the impacts.
At the same time, it is unlikely that the Academies had any effect on students who werenever involved with the program after they were selected to enroll. In an effort to account forthis, each table presents the impact per enrollee, defined as the estimated impact divided by thedifference in actual Academy enrollment rates of Academy and non-Academy students. In otherwords, the impact per enrollee can be interpreted as the impact from actually enrolling in anAcademy, as opposed to simply being recruited and selected for admission.2
'This adjustment was proposed by Bloom, 1984, and was used by Orr, Bloom, Bell, Doolittle, Lin, and Cave,1996. It relies on two assumptions: (1) selection for the Academy group had no effect on students who did not enrollin an Academy and (2) the average outcome levels for non-Academy students who did enroll would have been thesame if they had been assigned to the Academy group initially. Thus, the adjustment can be seen as discountingboth the zero impact for that portion of the Academy group who did not receive any part of the Academy treatmentand the non-zero impact for that portion of the non-Academy group who got the same treatment as the Academy
(continued)
83

It is also important to note that high school dropouts from both the Academy and thenon-Academy groups are included in calculations of outcomes. For example, estimates of av-erage attendance rates or credits earned toward graduation include zero values for school yearsor semesters in which students were confirmed to have dropped out of high school. To the ex-tent that Career Academies prevent Academy students from dropping out, excluding non-Academy group students with zero values (that is, dropouts) would lead to serious underesti-mation of program impacts.
Finally, another issue of interpretation concerns the "statistical significance" of impactestimates. Statistical significance is a measure of the degree of certainty one may have that somenon-zero impact actually occurred. If an impact estimate is statistically significant, then one mayconclude with some confidence that the program really had an effect. If an impact estimate is notstatistically significant, then the non-zero estimate is more likely to be the product of chance.Unless otherwise noted, the impacts discussed in this chapter were statistically significant at the10 percent level or lower. This means that there is no more that a 10 percent probability that thedifference resulted only from chance.
Statistical significance does not directly indicate the magnitude or importance of animpact estimate only whether any impact occurred. In an evaluation such as this one,numerically small impact estimates are usually not statistically significant; however, somenumerically large impact estimates may not be statistically significant, particularly when samplesizes are small. Smaller sample sizes yield less reliable impact estimates estimates in whichone can have less confidence than are possible when samples are larger. Therefore, anestimate of a given magnitude that is statistically significant for a relatively large subgroup maynot be statistically significant for a smaller subgroup.
II. Career Academy Impacts for Students in the High-Risk Subgroup
This section of the chapter focuses on those students in the study sample who were mostlikely to drop out of high school or to perform poorly if they stayed in school. As discussed inChapter 2, this subgroup of students was identified based on background characteristics andschool experiences prior to their applying for an Academy program. The high-risk subgroup rep-resents approximately 25 percent of the study sample. The subsequent behavior and performanceof students in the non-Academy group provide the best indication of how these students per-formed in high school without the opportunity to attend an Academy.
In general, non-Academy students in the high-risk subgroup dropped out of high schoolat relatively high rates and appeared to be quite disengaged if they stayed. In all, nearly one-thirdof these students dropped out of high school before the end of their 121h-grade year, and ap-proximately one-quarter had earned sufficient credits to meet their districts' graduation require-ments. Sixteen percent of the high-risk non-Academy group had completed what might be calleda basic core academic curriculum (four credits of English, three credits of social studies, twocredits of math, and two credits of science). On average, these students scored below the 20th per-
enrollees. This adjustment does not account for the fact that some students enrolled in an Academy for a semester ormore and then left. Further analysis is needed to explore the impact of different "doses" of Academy treatment.
-46-
8 4

centile nationally on a standardized math and reading achievement test, and just over 20 percentreported that they had taken the SATs or ACTs by the end of their 12" grade year.
The findings discussed in this section of the chapter indicate that the Career Academiessignificantly improved high school outcomes among students in the high-risk subgroup. Forthese students, the Career Academies substantially reduced dropout rates and chronic absentee-ism, and they improved attendance, credits earned, course-taking patterns, and preparation forpost-secondary educational and employment opportunities. Despite these significant positive im-pacts, the Academies did not produce changes in the high-risk subgroup's math or readingachievement test scores. Before discussing these findings in detail, it is useful to review the ratesat which these students enrolled in and remained in the Academy programs.
Table 3.1 provides a summary of Career Academy impacts on the school enrollmentstatus and attendance rates of students in the high-risk subgroup. The first row of the table showsthe percentage of Academy and non-Academy group students who enrolled in a Career Acad-emy. The difference between these percentages represents the basic difference in exposure to theCareer Academies between these groups. This is the primary source of impacts that are discussedin this section of the chapter. As noted above, in addition to the basic impact estimates, each ta-ble presents the impact per enrollee.
The second row of Table 3.1 shows the percentage of students in the high-risk subgroupwho remained enrolled in an Academy through the end of their 12"-grade year. It indicates that43 percent of the Academy students in the high-risk subgroup did so just under half of thosewho initially enrolled. This may be perceived as a high retention rate in the Career Academies,given that many of the students in the high-risk subgroup would have dropped out of high schoolaltogether, if they did not have access to an Academy. Also, as discussed in Chapter 2, a rela-tively high proportion of the high-risk subgroup came from families with a history of relativelyhigh mobility.
A. Impacts on School Enrollment and Attendance
The third row of Table 3.1 indicates that the Academies significantly reduced the per-centage of students in the high-risk subgroup who dropped out of high school. Among those inthe non-Academy group, 32 percent dropped out of high school before the end of 12' grade. Inother words, without access to an Academy, nearly one-third of the high-risk subgroup lefthigh school before they were scheduled to graduate. By comparison, 21 percent of the high-risk Academy group had dropped out before the end of their 12"-grade year. This 11 percent-age point difference represents a 34 percent reduction in dropout rates among students in thehigh-risk subgroup.
Rows 4 and 6 of Table 3.1 shows that the Academies also improved attendance rates,particularly by reducing chronic absenteeism (defined as attending class less than 85 percent ofthe time throughout high school). The non-Academy students in the high-risk subgroup, withoutthe opportunity to attend an Academy, had average attendance rates of 76 percent. Over half ofthese students were chronically absent, but the Academies significantly increased average atten-dance, from 76 to 82 percent. They also reduced chronic absenteeism, from 53 to 42 percent.
85

Table 3.1
Career Academies Evaluation
Impacts on School Enrollment and Attendancefor Students in the High-Risk Subgroup
OutcomeAcademy Non-Academy
Group Group ImpactPercentChange'
Impact perEnrollee
Ever enrolled in a Career Academyduring high school (%) 86.4 3.2 83.3 ***
Was enrolled in a Career Academyat the end of grade 12 (%) 42.5 2.1 40.5 ***
Dropped out of high schoolbefore the end of grade 12 (%) 21.3 32.2 -10.9 *** -33.8 -13.1
Average attendance,grades 9-12 (%) 81.5 76.0 5.6 *** 7.3 6.7
More than 95 percent averageattendance, grades 9-12 (%) 16.9 12.9 4.0 31.3 4.8
Less than 85 percent averageattendance, grades 9-12 (%) 41.9 53.4 -11.5 *** -21.5 -13.8
Sample size (N=345) 185 160
SOURCE: MDRC calculations from Career Academies Evaluation Student School Records Database.
NOTES: Attendance rates include zero values for grades in which sample members were identified asschool dropouts. Estimates are regression-adjusted using ordinary least squares, controlling forbackground characteristics of sample members. Rounding may cause slight discrepancies incalculating differences.
A two-tailed t-test was applied to differences between the Academy and non-Academy groups.In both cases, statistical significance levels are indicated as: *** = 1 percent; ** = 5 percent; * = 10percent.
'Percent change is defined as the impact divided by the non-Academy group average.bImpact per enrollee is defined as the impact divided by the difference in the percentage of Academy
and non-Academy group members ever enrolled in a Career Academy. It is italicized because itscalculation does not involve a direct comparison of Academy and non-Academy students.
B. Impacts on Credits Earned and Course-Taking
Table 3.2 presents several outcome measures that indicate the distribution ofcourse cred-its earned by Academy and non-Academy students in the high-risk subgroup.' The table indicates
'Throughout this report, one credit is equivalent to completing one full-year course, and a half-credit is equiva-lent to completing one semester-long course. In general, the grouping ofcourses into subject areas (such as English,math, vocational/career-related, and so on) and subject types (academic and non-academic) follows conventionsoutlined in NCES, 1995.
-48-

Table 3.2
Career Academies Evaluation
Impacts on Credits Earned and Course-Takingfor Students in the High-Risk Subgroup
OutcomeAcademy
GroupNon-Academy
Group ImpactPercentChange'
Impact perEnrollee°
Credits earned
Total course credits 19.3 17.3 2.0 *** 11.7 2.4
Total course credits meet thegraduation requirement (%) 39.9 26.2 13.7 *** 52.3 16.5
Earned 12 or more academiccourse credits (%) 47.6 31.9 15.8 *** 49.5 19.0
Earned 8 or more non-academiccourse credits (%) 46.4 47.2 -0.8 -1.8 -1.0
Course-taking
English (4), Social Studies (3),Math (3), Science (3)C (%) 13.9 5.7 8.2 145.4 9.9
English (4), Social Studies (3),Math (2), Science (2)c (%) 31.8 16.3 15.5 *** 94.8 18.6
Earned 2 or more foreign-languagecredits (%) 26.7 19.1 7.5 39.4 9.1
Earned 1/2 or more computercredits (%) 43.4 45.0 -1.6 -3.6 -2.0
Earned 3 or more career/vocationalcredits (%) 58.3 37.7 20.6 *** 54.5 24.7
Sample size (N=345) 185 160
SOURCE: See Table 3.1.
NOTES: Credits include zero values for grades in which sample members were identified as schooldropouts. Course credit data were not provided for approximately 4.5 percent of the sample. Course-takingdata were not provided for approximately 21 percentof the sample. Estimates are regression-adjusted usingordinary least squares, controlling for background characteristics of sample members. Rounding may causeslight discrepancies in calculating differences. All measures indicate credits earned up until the end of the
12th-grade year. 12th-grade year indicates the year that students were projected to reach the 12th grade whenthey initially enrolled in the Career Academy or regular high school program.
A two-tailed t-test was applied to differences between the Academy and non-Academy groups. Inboth cases, statistical significance levels are indicated as: *** = 1 percent; ** = 5 percent; * = 10 percent.
'Percent change is defined as the impact divided by the non-Academy group average.b Impact per enrollee is defined as the impact divided by the difference in the percentage of Academy
and non-Academy group members ever enrolled in a Career Academy. It is italicized because itscalculation does not involve a direct comparison of Academy and non-Academy students.
`Numbers refer to the amount of credits that were earned in each subject area.
-49-
87

that Career Academies increased total course credits earned by high-risk students and increasedthe percentage of students who earned sufficient course credits to meet their districts' graduationrequirements. Moreover, much of the increase in total course credits came from an increase in thenumber of academic course credits earned.
The first row of Table 3.2 reports the average number of course credits earned by Acad-emy and non-Academy students in the high-risk subgroup by the end of their scheduled 12th-grade year.4 It indicates that the Academies produced an increase of two full credits. While non-Academy students earned an average of approximately 17 credits by the end of 12th grade, theirAcademy counterparts earned an average of approximately 19 credits. This difference representsan increase of 12 percent over the non-Academy group level.
The second row of Table 3.2 reports the percentage of students in the Academy and non-Academy groups who earned enough credits to meet their districts' graduation requirements bythe end of their 12th-grade year.' It shows that 26 percent of the high-risk non-Academy groupearned enough credits to graduate. By contrast, nearly 40 percent of the Academy group studentsearned enough credits to graduate. This 14 percentage point difference represents a 52 percentincrease over the non-Academy group average.
The remainder of Table 3.2 presents findings on the credits earned in various subject ar-eas by Academy and non-Academy students in the high-risk subgroup. Career Academies sig-nificantly increased the number of academic courses students completed, as well as the numberof career-related and vocational courses.6 The third row of the table indicates that the Academiessignificantly increased the percentage of students in the high-risk subgroup who completed 12 ormore academic credits (a minimum of three per year). While 32 percent of the non-Academygroup earned 12 or more credits in academic courses, 48 percent of students in the Academygroup did so. This 16 percentage point difference represents a 50 percent increase over the non-Academy group average.
This overall increase in academic course credits translated into a substantial increase inthe percentage of students who completed a core academic curriculum. The fifth and sixth rowsof Table 3.2 indicate the percentages of Academy and non-Academy students from the high-risksubgroup who completed two versions of an academic curriculum that prepared them for col-lege.' The second measure (row 6) can be classified as a basic academic core curriculum con-sisting of four credits of English, three of social studies, two of math, and two of science. Thefirst measure (row 5) might be classified as a more intensive core curriculum that adds an extracredit in both math and science. Many school districts require student to complete this type of
'When available, this measure includes credits that students earned during summer school. Some of the partici-pating school districts were unable to provide a complete record of summer school credits.
'Students were considered to have earned enough credits to graduate from high school if their transcripts indi-cated that they had accumulated the number of credits needed to meet the official graduation requirements in theirschool district. This ranges from 21 to 24 credits, depending on the district. It is also important to note that thismeasure does not necessarily indicate that a student actually graduated from high school on time. Most school dis-tricts also require students to complete a certain number of courses in specific subject areas.
'Academic courses included those in English, social studies, math, science, and foreign language. Non-academic courses were all other courses, including career-related and vocational subjects, accredited work experi-ences, fine arts, physical education and health, and a broad range of school-specific electives.
'These measures have been proposed by the National Center for Education Statistics; see NCES, 1995.
-50-
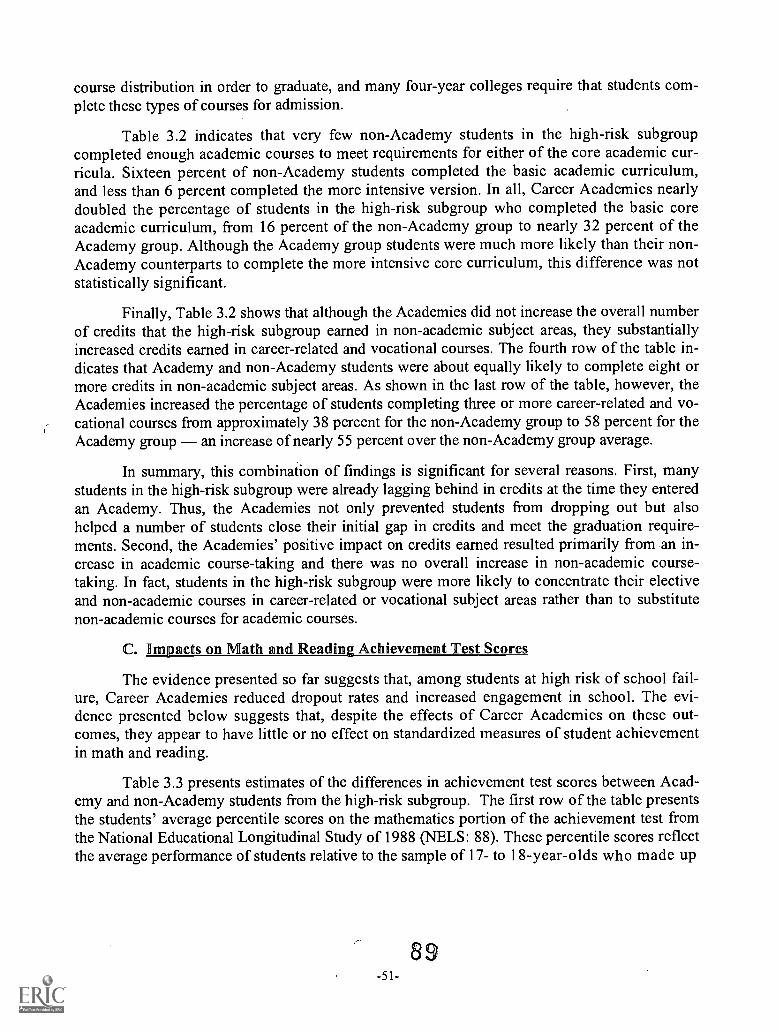
course distribution in order to graduate, and many four-year colleges require that students com-plete these types of courses for admission.
Table 3.2 indicates that very few non-Academy students in the high-risk subgroupcompleted enough academic courses to meet requirements for either of the core academic cur-ricula. Sixteen percent of non-Academy students completed the basic academic curriculum,and less than 6 percent completed the more intensive version. In all, Career Academies nearlydoubled the percentage of students in the high-risk subgroup who completed the basic coreacademic curriculum, from 16 percent of the non-Academy group to nearly 32 percent of theAcademy group. Although the Academy group students were much more likely than their non-Academy counterparts to complete the more intensive core curriculum, this difference was notstatistically significant.
Finally, Table 3.2 shows that although the Academies did not increase the overall numberof credits that the high-risk subgroup earned in non-academic subject areas, they substantiallyincreased credits earned in career-related and vocational courses. The fourth row of the table in-dicates that Academy and non-Academy students were about equally likely to complete eight ormore credits in non-academic subject areas. As shown in the last row of the table, however, theAcademies increased the percentage of students completing three or more career-related and vo-cational courses from approximately 38 percent for the non-Academy group to 58 percent for theAcademy group an increase of nearly 55 percent over the non-Academy group average.
In summary, this combination of findings is significant for several reasons. First, manystudents in the high-risk subgroup were already lagging behind in credits at the time they enteredan Academy. Thus, the Academies not only prevented students from dropping out but alsohelped a number of students close their initial gap in credits and meet the graduation require-ments. Second, the Academies' positive impact on credits earned resulted primarily from an in-crease in academic course-taking and there was no overall increase in non-academic course-taking. In fact, students in the high-risk subgroup were more likely to concentrate their electiveand non-academic courses in career-related or vocational subject areas rather than to substitutenon-academic courses for academic courses.
C. Impacts on Math and Reading Achievement Test Scores
The evidence presented so far suggests that, among students at high risk of school fail-ure, Career Academies reduced dropout rates and increased engagement in school. The evi-dence presented below suggests that, despite the effects of Career Academies on these out-comes, they appear to have little or no effect on standardized measures of student achievementin math and reading.
Table 3.3 presents estimates of the differences in achievement test scores between Acad-emy and non-Academy students from the high-risk subgroup. The first row of the table presentsthe students' average percentile scores on the mathematics portion of the achievement test fromthe National Educational Longitudinal Study of 1988 (NELS: 88). These percentile scores reflectthe average performance of students relative to the sample of 17- to 18-year-olds who made up
89-51-

Table 3.3
Career Academies Evaluation
Impacts on Achievement Test Scoresfor Students in the High-Risk Subgroup
OutcomeAcademy
GroupNon-Academy
Group ImpactPercentChange'
Impact perEnrollee °
Math achievement test scores
Average national percentile 19.5 16.1 3.5 21.7 4.2
Proficiency level (%)1: Rote memory operations 74.1 62.5 11.6 18.5 13.93: Simple problem-solving 11.0 12.1 -1.2 -9.6 -1.4
Reading achievement test scores
Average national percentile 23.4 18.9 4.6 24.2 5.5
Proficiency level (%)1: Simple comprehension 69.2 70.8 -1.6 -2.3 -1.92: Simple inferences 27.6 17.3 10.3 59.8 12.4
Sample size (N=110) 63 47
SOURCE: MDRC calculations from Career Academies Evaluation 12th Grade Achievement TestDatabase.
NOTES: Estimates are regression-adjusted using ordinary least squares, controlling for backgroundcharacteristics of sample members. Rounding may cause slight discrepancies in calculating differences.The reading and math achievement tests are the cognitive battery tests of reading and mathematics usedin the NELS: 88 study. There were a total of five proficiency levels for mathematics and three forreading. Particular proficiency levels are reported in the table to illustrate general trends in performancein the distribution of students. Percentile scores reflect students' performance in relation to a nationallyrepresentative sample of 126-graders.
A two-tailed t-test was applied to differences between the Academy and non-Academy groups. Inboth cases, statistical significance levels are indicated as: *** = 1 percent; ** = 5 percent; * = 10percent.
'Percent change is defined as the impact divided by the non-Academy group average.bImpact per enrollee is defined as the impact divided by the difference in the percentage of Academy
and non-Academy group members ever enrolled in a Career Academy. It is italicized because itscalculation does not involve a direct comparison of Academy and non-Academy students.
the original NELS: 88 sample.' The table indicates that, on average, the non-Academy studentsin the high-risk subgroup scored at the 16th percentile on the math achievement test and at the 19th
'The NELS: 88 sample comprised a nationally representative group of students who were identified as 8`h-graders in 1988. These young people were surveyed every two years through 1992, when they were scheduled tograduate from high school, and again in 1994, approximately two years after scheduled graduation. The achieve-ment test being used in the Career Academies Evaluation was administered to the NELS: 88 sample in 1992, at theend of their 12th-grade year.
-52-
9 0

percentile on the reading achievement test. Although students in the high-risk Academy groupscored somewhat higher, the differences were not statistically significant.
The second and third rows of Table 3.3 present the percentages of Academy and non-Academy students in the high-risk subgroup who, on the basis of their test scores, exhibited pro-ficiency at each of two different levels of math skills. Overall, the testing instrument covers fivelevels of math proficiency. Level 1 represents the most basic skills, and level 5 represents thehighest. Level 1, or basic proficiency, includes the abilities to perform simple rote memory op-erations and to carry out simple arithmetical operations on whole numbers. Level 3 reflects asomewhat more advanced level of proficiency, including the ability to perform simple problem-solving.9 Table 3.3 indicates that the Academy students were somewhat more likely to attain thebasic proficiency level than their non-Academy counterparts. Again, however, this difference isnot statistically significant, indicating that there was no systematic difference between the Acad-emy and non-Academy students on this measure. The table also indicates that very few of thehigh-risk subgroup attained the third level of proficiency and that the Academy and non-Academy students were about equally likely to do so.
The results for reading achievement test scores show a similar pattern. The average per-centile scores on the reading portion of the NELS: 88 achievement test indicate that non-Academy students scored at about the bottom fifth of the national distribution. Although theAcademy group scored somewhat higher, the difference was not statistically significant. Thereading test included three levels of proficiency. Approximately 70 percent of students in theAcademy and non-Academy groups scored at level 1, demonstrating basic reading comprehen-sion skills. Students in the Academy group were somewhat more likely than their counterparts inthe non-Academy group to attain level 2 reading proficiency, indicating that they were able tomake "simple inferences" from a reading passage. Again, however, these differences were notstatistically significant.
D. Impacts on Youth Development Experiences
Beyond their effect on student performance and engagement in school, Career Academiesare intended to improve a variety of outcomes that have been identified as important to youth de-velopment more generally. In particular, Career Academies aim to increase students' contactwith caring adults and to help them make constructive use of non-school hours. To the extent thatthis occurs, one might expect the high-risk Academy group to have more developmentallyhealthy high school experiences, to participate more in extracurricular activities, and to betteravoid negative behaviors.
The first three rows of Table 3.4 show the distribution of time spent on homeworkamong Academy and non-Academy students in the high-risk subgroup. These estimates sug-gest that there were no systematic differences in the amount of time that these students spenton homework.
Table 3.4 does indicate that the Academies increased the percentage of students whoreported spending some time in extracurricular activities. Specifically, 69 percent of studentsin the high-risk non-Academy group indicated that they did not spend any time in extracur-
9NCES, 1995.
-53- 9/

ricular activities during their 12th-grade year. By contrast, 59 percent of the Academy studentsindicated that they had not participated in extracurricular activities. To the extent that partici-pation in extracurricular activities is an effective measure of engagement, this indicates that,among the high-risk subgroup, Academy students were more engaged in school than their non-Academy counterparts.
Table 3.4
Career Academies Evaluation
Impacts on Experiences During the 12th Grade Yearfor Students in the High-Risk Subgroup
OutcomeAcademy
GroupNon-Academy
Group ImpactPercentChangea
Impactper Enrollee b
Use of non-school hours
Average time spent on homework (%)Less than 1 hour per week 49.8 52.5 -2.7 -5.2 -3.32 to 6 hours per week 34.7 36.6 -1.9 -5.3 -2.3More than 6 hours per week 15.5 10.9 4.6 42.8 5.6
Average time spent on extra-curricular activities (%)
None 58.5 68.9 -10.4 ** -15.2 -12.51 to 4 hours per week 23.5 18.4 5.2 28.2 6.2More than 4 hours per week 18.0 12.7 5.3 41.4 6.3
Youth development experiences
Reported any positive youthdevelopment experiences in past year (%)` 62.7 55.2 7.5 13.5 9.0
Worked on a volunteer project 41.9 31.6 10.3 ** 32.7 12.4
Received award for participationin athletics or a school organization 40.6 34.8 5.9 16.9 7.0
Received an academic award or scholarship 26.6 15.5 11.1 ** 71.6 13.3
Reported any risk-taking behaviorsin past year ( %)° 34.8 39.1 -4.3 -11.0 -5.2
Has become a parent or is pregnant 20.5 21.4 -1.0 -4.5 -1.1
Has been expelled from school 9.0 8.3 0.8 9.4 0.9
Has come to school high on drugs or alcohol 8.0 11.1 -3.1 -28.3 -3.8
Has been arrested 8.6 13.4 -4.8 * -36.0 -5.8
Sample size (N=366) 202 164
(continued)
-54- 92

Table 3.4 (continued)SOURCE: MDRC calculations from Career Academies Evaluation 12th Grade Survey Database.
NOTES: 12th grade year indicates the year that students were projected to reach the 12th grade,when they initiallyenrolled in the Career Academy or regular high school program. Estimates are regression-adjusted using ordinaryleast squares, controlling for background characteristics of sample members. Rounding may cause slightdiscrepancies in calculating differences.
A two-tailed t-test was applied to differences between the Academy and non-Academy groups. In both cases,statistical significance levels are indicated as: *** = 1 percent; ** = 5 percent; * = 10 percent.
aPercent change is defined as the impact divided by the non-Academy group average.bImpact per enrollee is defined as the impact divided by the difference in the percentage of Academy and non-
Academy group members ever enrolled in a Career Academy. It is italicized because its calculation does notinvolve a direct comparison of Academy and non-Academy students.
`Students reported one or more of the positive youth development submeasures.d Students reported one or more of the risk-taking behaviors submeasures.
The bottom panel of Table 3.4 lists the percentages of students who reported participationin various positive and negative youth development experiences. Specifically, the 12th GradeSurvey asked students whether, during the past year, they had worked on a volunteer project intheir community, received an award or recognition for participation in an athletic team or schoolorganization, or received an academic award or scholarship. The 12th Grade Survey also askedstudents whether they had become a parent or were currently pregnant, had been expelled fromschool, had come to school high on drugs or alcohol, or had been arrested.
The findings presented in Table 3.4 indicate that the Career Academies increased high-risk students' involvement in volunteer projects and increased the likelihood that they receivedrecognition for academic performance. Academies also reduced the percentage of students whohad been arrested.
E. Impacts on Plans and Steps Taken Toward Post-Secondary Educationand Work
The 12th Grade survey also asked students about their plans and preparation for collegeand work. Table 3.5 presents a summary of the impacts that Career Academies had on students'future plans, the steps they took toward admission to a two- or four-year college, and their over-all outlook for the future. The findings for the high-risk subgroup indicate that Career Academieshad a small impact on students' educational plans for the next year, at least in terms of reducingthe likelihood that they reported being unsure of whether they were going to school or work. TheAcademies also increased the percentage of students in the high-risk subgroup who took a num-ber of important steps toward attending a two-year or four-year college, and they enhanced stu-dents' ultimate expectations for their educational attainment.
The top four rows of the table present the distribution of students who planned to attendschool, work, or combine the two during the year following their scheduled graduation. In gen-eral, the table shows that the vast majority of students in both the Academy and the non-Academy groups planned to combine school and work. The estimates indicate that approximatelythe same proportions of Academy and non-Academy students planned to attend school only,work only, or combine school and work. The last row in this section of the table does show that
-55- 93

Academy students were somewhat less likely than their non-Academy counterparts to report thatthey did not know whether they would attend school or go to work during the following year.Thus, the Academies appear to help students plan for some type of constructive activities afterhigh school.
The Academies increased the extent to which students in the high-risk subgroup wereprepared to execute their plans for post-secondary education and employment. Table 3.5 showsthe percentages of Academy and non-Academy students in the high-risk subgroup who reportedcompleting a variety of steps needed to apply for and attend college or to find a job. These ac-tivities included collecting information about two- and four-year colleges, taking the SATs orACTs, submitting an application, and having an interview. The measures in Table 3.5 indicatethe percentage of students who reported completing these activities,' as well as the percentage ofstudents who completed various activities aimed at securing a job during the following year.
Table 3.5 first indicates that the Academies significantly increased the percentage of stu-dents in the high-risk subgroup who researched college options, took the SATs or ACTs, andsubmitted an application to a two-year or four-year college. For example, it shows that 22 per-cent of non-Academy students reported taking the SATs or ACTs during their 12th-grade year,compared with 35 percent of Academy students in the high-risk subgroup. This 12 percentagepoint difference represents a 55 percent increase over the non-Academy group average. In addi-tion, just over half of the Academy group students reported that they had submitted an applica-tion to a two-year or a four-year college, compared with 35 percent of the students in the non-Academy group.
Table 3.5 also shows that the Academies produced slight increases in the percentages ofstudents in the high-risk subgroup who took concrete steps toward post-secondary employment,although none of these differences was statistically significant.
Finally, the last several rows in Table 3.5 provide an indication of students' educationalexpectations and general outlook for their future. Most notably, the Academy students were morelikely than their non-Academy counterparts to report that they expected to graduate from college.
Career Academy Impacts for Students in the Low-Risk Subgroup
The behavior and performance of the students in the low-risk non-Academy group pro-vide the best indication of how these students performed in high school without the opportunityto attend an Academy. In general, these students were unlikely to drop out and appeared to re-main engaged in high school on a number of dimensions. In all, only 3 percent of the low-risknon-Academy group dropped out of high school before the end of their 12th-grade year, and ap-proximately three-quarters had earned sufficient credits to meet their districts' graduation re-quirements. Just over 60 percent had completed the basic core academic curriculum, and overone-third had completed the more intensive core curriculum. On average, these students scored at
'Students were asked about these activities in terms of their efforts to attend a two-year or a four-year college.Information-gathering activities included talking with a teacher or other advisor about college, looking at collegecatalogues, visiting a college campus, and talking with one's parents about how to pay for college. The measurespresented in Table 3.5 indicate the percentage of students who reported engaging in two or more of these activities.
-56-
94

about the 40th percentile nationally on a standardized math and reading achievement test. Sixtypercent of non-Academy students in the low-risk subgroup reported that they had taken the SATsor ACTs, and nearly 80 percent reported that they had submitted an application to a two-year or afour-year college by the end of their 12th-grade year.
Table 3.5
Career Academies Evaluation
Impacts on Planning and Preparation for College and Workfor Students in the High-Risk Subgroup
OutcomeAcademy
GroupNon-Academy
Group ImpactPercentChanges
Impactper Enrollee
Plans for next year (%)School only 8.7 6.7 2.0 30.4 2.4Work only 8.3 7.1 1.2 17.2 1.5Combine school and work 79.3 78.9 0.4 0.5 0.4Unknown 3.7 7.3 -3.6 ** -49.7 -4.4
Steps taken toward 2-year or 4-yearcollege admission
Researched college options` 82.1 72.5 9.6 * ** 13.2 11.5
Took SATs or ACTs 34.5 22.3 12.2 ** 55.0 /4.7
Submitted an application 50.5 35.3 15.2 * ** 43.1 18.3
Had an interview 24.8 18.5 6.3 34.1 7.6
Steps taken toward post-secondary employment (%)
Talked with a teacher or advisor about a job 44.1 43.8 0.3 0.6 0.3
Submitted an application for employment 60.7 55.8 4.9 8.7 5.8
Interviewed for a position 46.2 43.6 2.7 6.2 3.2
Has previous work experience with prospectiveemployer 35.3 31.1 4.2 13.5 5.0
Education expectations (%)Complete some post-secondary education 91.6 91.7 -0.1 -0.1 -0.1Attend college 71.3 66.1 5.2 7.9 6.3Graduate from college 53.7 45.3 8.3 * 18.4 /0.0
Has overall positive outlook for the futures 72.6 66.0 6.6 10.0 7.9
Sample size (N=366) 202 164
(continued)
S5-57-

Table 3.5 (continued)SOURCE: MDRC calculations from Career Academies Evaluation 12th Grade Survey Database.
NOTES: Estimates are regression-adjusted using ordinary least squares, controlling for background characteristicsof sample members. Rounding may cause slight discrepancies in calculating differences.
A two-tailed t-test was applied to differences between the Academy and non-Academy groups. In both cases,statistical significance levels are indicated as: *** = 1 percent; ** = 5 percent; * = 10 percent.
aPercent change is defined as the impact divided by the non-Academy group average.b Impact per enrollee is defined as the impact divided by the difference in the percentage of Academy and non-
Academy group members ever enrolled in a Career Academy. It is italicized because its calculation does not involvea direct comparison of Academy and non-Academy students.
`Indicates student engaged in two or more of the following activities: talking with teachers or advisors aboutcollege, discussing financing with parents, looking at college catalogues, or visiting schools.
dOverall positive outlook for the future was defined by high ratings on questions about expectations forachievement, potential for attaining jobs, and knowledge of methods of finding jobs.
For students in the low-risk Academy group, the findings discussed in this section indi-cate that, on most outcome measures, they remained engaged in high school at levels similar totheir non-Academy counterparts. The findings also show, however, that the Career Academiesdid improve several important outcomes. Academies significantly increased the likelihood thatthese students would earn sufficient credits to meet their districts' graduation requirements. Theyalso increased career-related and vocational course-taking while enabling students in the low-risksubgroup to keep pace with their non-Academy peers in academic course-taking. The Academystudents were somewhat less likely than their non-Academy counterparts to report that they hadsubmitted an application to a two-year or a. four-year college by the end of their 12th-grade year.Finally, the Academies did not produce systematic changes in the low-risk Academy group'smath or reading achievement test scores.
Table 3.6 provides a summary of Career Academy impacts on the school enrollmentstatus and attendance rates of students in the low-risk subgroup. The first row in the table showsthe percentages of Academy and non-Academy students who enrolled in a Career Academy.Most notably, it shows that 10 percent of students in the non-Academy group enrolled in a Ca-reer Academy. Although 8 percent of the non-Academy group students were identified as beingenrolled in an Academy at the end of 12th grade, very few of these students were enrolled in anAcademy throughout high school. Further analysis of this finding indicated that most of the non-Academy students enrolled in an Academy in 11th or 12th grade, typically because they were in-terested in taking elective classes that were offered only within the Career Academies.
The second row of Table 3.6 shows the percentage of students in the low-risk subgroupwho remained enrolled in an Academy through the end of their 12th-grade year. A relatively highpercentage in the Academy group (nearly 74 percent of those initially selected) remained in theprograms through the end of 12th grade. This represents 82 percent of those who initially enrolled
a rate that is particularly high compared with the retention rate of students in the high-risksubgroup.
-58- 9 6

Table 3.6
Career Academies Evaluation
Impacts on School Enrollment and Attendancefor Students in the Low-Risk Subgroup
OutcomeAcademy
GroupNon-Academy
Group ImpactPercentChange'
Impact perEnrollee°
Ever enrolled in a Career Academyduring high school (%) 89.5 10.2 79.3 ***
Was enrolled in a Career Academyat the end of grade 12 (%) 73.5 8.3 65.2 ***
Dropped out of high schoolbefore the end of grade 12 (%) 1.9 2.9 -1.0 -34.4 -1.2
Average attendance,grades 9-12 (%) 95.0 94.2 0.8 0.8 1.0
More than 95 percent averageattendance, grades 9-12 (%) 67.3 68.9 -1.6 -2.3 -2.0
Less than 85 percent averageattendance, grades 9-12 (%) 2.2 7.5 -5.3 -70.8 -6.7
Sample size (N=385) 204 181
SOURCE: See Table 3.1.
NOTES: See Table 3.1.
A. Impacts on School Enrollment and Attendance
Table 3.6 reports the dropout rates and average attendance rates for students in the low-risk subgroup. This data indicate that Career Academies had no significant impact on these stu-dents' attendance or retention in high school. A likely explanation for this finding is that veryfew students in the "low-risk" subgroup dropped out of high school, and few exhibited atten-dance problems or chronic absenteeism.
In general, Table 3.6 shows that students in the low-risk subgroup were likely to remainenrolled in high school and to attend regularly, regardless of whether they were in a CareerAcademy. Very few students in the low-risk subgroup dropped out of high school (3 percent ofthe non-Academy group and 2 percent of the Academy group). Although this is in sharp contrastto the relatively high dropout rates among students in the high-risk subgroup, it was difficult forthe Career Academies to improve on the very low dropout rates of non-Academy students in thelow-risk subgroup. Similarly, average attendance rates were nearly 95 percent throughout highschool for Academy and non-Academy group students. Interestingly, for the low-risk subgroup,the Academies did produce a slight reduction in chronic absenteeism (defined as having atten-dance rates of 85 percent or less throughout high school), although this difference was not statis-tically significant.
-59- 97

B. Impacts on Credits Earned and Course-Taking
Table 3.7 shows the distribution of course credits earned by Academy and non-Academystudents in the low-risk subgroup. It indicates that Career Academies increased the percentage ofthese students who earned enough total credits to meet their districts' graduation requirements. Inparticular, while approximately 75 percent of non-Academy students in this subgroup earnedenough credits to meet the graduation requirement, nearly 86 percent of students in the Academygroup did so. This 11 percentage point difference represents a 15 percent increase over the non-Academy group average. This finding suggests that although students in the low-risk subgroup ofthe study sample were highly unlikely to drop out of high school, a significant portion did notremain on course to earn enough credits to graduate on time. The Career Academies increasedthe likelihood that they would.
The Career Academies also changed the mix of courses that students in the low-risk sub-group completed during high school. Most notably, the Academies substantially increased thenumber of non-academic courses these students completed, particularly career-related and voca-tional courses. For example, the last row of Table 3.7 indicates that 42 percent of the low-risknon-Academy group completed three or more credits in career-related or vocational courses,compared with approximately 77 percent of students in the low-risk Academy group. This ismore than an 80 percent increase in career-related or vocational course-taking.
Table 3.7 also shows that this increase did not come at the expense of students' complet-ing academic courses, nor did it reduce the percentage of students in the low-risk subgroup whocompleted either the basic or the more intensive core academic curriculum. For example, 85 per-cent of the Academy group and approximately 89 percent of the non-Academy group completed12 or more academic credits (a difference that was not statistically significant).
Table 3.7 does suggest, however, that the increase in career-related and vocationalcourses may have led the Academy group students to take fewer foreign-language courses. Forexample, 74 percent of the non-Academy group students earned at least two course credits in aforeign language, compared with 50 percent of the Academy group students. This representsnearly a one-third reduction in the non-Academy group average. It is not clear how this potentialtradeoff may affect Academy students' attractiveness to colleges, particularly four-year collegesthat may prefer or require students to complete a foreign-language sequence during high school.
C. Impacts on Math and Reading Achievement Test Scores
Table 3.8 presents estimates of the impact of Career Academies on standardized measuresof student achievement for the low-risk subgroup. In general, these findings do not reveal anysystematic differences between Academy and non-Academy students; they exhibited similar lev-els of academic achievement as measured by standardized tests.
Both Academy and non-Academy students in the low-risk subgroup had math scores av-eraging at about the 39th percentile nationally. The vast majority of students in both groups per-formed at the basic proficiency level or higher, and just over 40 percent of both groups scored atthe middle proficiency level or higher. Although the reading test scores of Academy students inthe low-risk subgroup were slightly lower than those of non-Academy students, the differenceswere not statistically significant.
-60- 98

Table 3.7
Career Academies Evaluation
Impacts on Credits Earned and Course-Takingfor Students in the Low-Risk Subgroup
OutcomeAcademy Non-Academy
Group Group ImpactPercentChange°
Impact perEnrollee b
Credits earned
Total course credits 24.4 23.6 0.8 3.2 0.9
Total course credits meet thegraduation requirement (%) 85.7 74.6 11.1 ** 14.9 14.0
Earned 12 or more academiccourse credits (%) 85.0 88.5 -3.5 -3.9 -4.4
Earned 8 or more non-academiccourse credits (%) 68.4 51.1 17.2 *** 33.7 21.7
Course-taking
English (4), Social Studies (3),Math (3), Science (3)C (%) 39.2 36.3 2.9 8.1 3.7
English (4), Social Studies (3),Math (2), Science (2)c (%) 58.5 61.2 -2.7 -4.4 -3.4
Earned 2 or more foreign-languagecredits (%) 49.5 73.6 -24.1 *** -32.8 -30.4
Earned 1/2 or more computercredits (%) 59.2 65.4 -6.1 -9.4 -7.7
Earned 3 or more career/vocationalcredits (%) 76.5 42.0 34.6 *** 82.4 43.6
Sample size (N=385) 204 181
SOURCE: See Table 3.2.
NOTES: See Table 3.2.
-61- 9.9

Table 3.8
Career Academies Evaluation
Impacts on Achievement Test Scoresfor Students in the Low-Risk Subgroup
OutcomeAcademy Non-Academy
Group Group ImpactPercentChangea
Impact perEnrollee b
Math achievement test scores
Average national percentile 38.6 39.1 -0.5 -1.2 -0.6
Proficiency level (%)1: Rote memory operations 91.0 86.0 5.0 5.9 6.33: Simple problem-solving 45.8 42.3 3.5 8.3 4.4
Reading achievement test scores
Average national percentile 37.3 39.8 -2.5 -6.3 -3.2
Proficiency level (%)1: Simple comprehension 86.6 95.6 -9.0 -9.4 -/1.42: Simple inferences 40.0 49.2 -9.2 -18.7 -11.6
Sample size (N=147) 80 67
SOURCE: See Table 3.3.
NOTES: See Table 3.3.
D. Impacts on Youth Development Experiences
Table 3.9 shows the impacts that Career Academies had on a variety of student experi-ences during 12th grade. In general, these estimates do not reveal substantial differences betweenAcademy and non-Academy students in the low-risk subgroup, who exhibited similar levels ofparticipation both in positive youth development activities and in negative risk-taking behaviors.Career Academies did produce a modest increase in the percentage of students in the low-risksubgroup who were involved in a volunteer project during their 12th-grade year.
E. Impacts on Plans and Steps Taken Toward Post-Secondary Educationand Work
Table 3.10 lists a set of indicators of students' plans and preparation for education andwork during the year following their 12th-grade year. It shows that the vast majority of Academyand non-Academy students in the low-risk subgroup reported that they planned both to work andto go to school in the following year. The second-to-last row of the table also indicates that aboutthree-quarters of both Academy and non-Academy students reported that they eventually expectto graduate from college.
-62-
100

Table 3.9
Career Academies Evaluation
Impacts on Experiences During the 12th Grade Yearfor Students in the Low-Risk Subgroup
OutcomeAcademy
GroupNon-Academy
Group ImpactPercentChangea
Impactper Enrollee b
Use of non-school hours
Average time spent on homework (%)Less than 1 hour per week 23.0 24.6 -1.6 -6.6 -2.02 to 6 hours per week 58.4 49.6 8.8 * 17.7 11.0More than 6 hours per week 18.7 25.8 -7.1 * -27.6 -9.0
Average time spent on extra-curricular activities (%)
None 36.5 33.0 3.6 10.8 4.51 to 4 hours per week 29.0 33.4 -4.4 -13.3 -5.6More than 4 hours per week 34.5 33.6 0.9 2.6 1.1
Youth development experiences
Reported any positive youthdevelopment experiences in past year (%)a 80.3 75.9 4.4 5.7 5.5
Worked on a volunteer project 65.8 50.0 15.9 * ** 31.7 20.0
Received award for participationin athletics or a school organization 56.0 56.2 -0.2 -0.4 -0.3
Received an academic award or scholarship 41.7 36.9 4.8 12.9 6.0
Reported any risk-taking behaviorsin past year ( %)d 15.6 16.1 -0.5 -2.9 -0.6
Has become a parent or is pregnant 6.0 4.6 1.4 30.5 1.8
Has been expelled from school 1.7 2.0 -0.3 -13.3 -0.3
Has come to school high on drugs or alcohol 6.5 9.7 -3.3 -33.6 -4.1
Has been arrested 4.4 4.5 -0.1 -1.8 -0.1
Sample size (N=389) 218 171
SOURCE: See Table 3.4.
NOTES: See Table 3.4.
BEST COPY AVAILABLE-63-
101

Table 3.10
Career Academies Evaluation
Impacts on Planning and Preparation for College and Workfor Students in the Low-Risk Subgroup
OutcomeAcademy
GroupNon-Academy
Group ImpactPercentChange'
Impactper Enrollee b
Plans for next year (%)School only 9.2 8.9 0.3 2.9 0.3Work only 2.2 2.6 -0.4 -15.7 -0.5Combine school and work 86.3 86.9 -0.6 -0.6 -0.7Unknown 2.4 1.7 0.7 41.9 0.9
Steps taken toward 2-year or 4-yearcollege admission
Researched college options' 92.7 96.3 -3.7 -3.8 -4.6
Took SATs or ACTs 60.0 60.0 -0.1 -0.1 -0.1
Submitted an application 70.8 78.7 -7.9 * -10.0 -10.0
Had an interview 23.0 29.8 -6.7 -22.6 -8.5
Steps taken toward post-secondary employment (%)
Talked with a teacher or advisor about a job 47.6 37.8 9.8 * 25.9 12.4
Submitted an application for employment 55.8 56.6 -0.8 -1.5 -/./
Interviewed for a position 38.7 38.7 -0.1 -0.2 -0.1
Has previous work experience with prospectiveemployer 27.7 26.8 0.9 3.4 1.2
Education expectations (%)Complete some post-secondary education 97.4 97.3 0.0 0.0 0.0Attend college 88.7 85.8 2.8 3.3 3.6Graduate from college 75.2 74.5 0.6 0.9 0.8
Has overall positive outlook for the future° 78.4 78.1 0.2 0.3 0.3
Sample size (N=389) 218 171
SOURCE: See Table 3.5.
NOTES: See Table 3.5.
Table 3.10 does indicate that students in the Academy group were somewhat less likelythan their non-Academy counterparts to have submitted an application to a two-year or four-yearcollege by the end of their 12th-grade year. Interestingly, over 90 percent of students in bothgroups had investigated college options, and 60 percent had taken the SATs or ACTs a criticalstep in applying for college. However, whereas 79 percent of students in the non-Academy grouphad submitted an application to college, only 71 percent of Academy students in the low-risksubgroup had done so.
-64-
1.02

The reason for this lower rate of applying for college is not clear. One hypothesis is thatAcademy students in the low-risk subgroup may have been opting to go to work rather than tocollege. In general, there does not appear to be any support for this hypothesis. First, as notedearlier, Academy and non-Academy students were about equally likely to report that theyplanned to work or to combine work and school in the year following graduation. Table 3.10 alsoindicates that the groups were about equally likely to have applied or interviewed for a job forthe following year. Another hypothesis is that Academy students may have been more likely toplan on attending a two-year college, many of which may not require a formal application to besubmitted while students are still in high school. The 12th Grade Survey did not ask students todifferentiate between activities aimed at a two-year as opposed to a four-year college.
The findings regarding students' post-secondary activities are not clear. A longer follow-up period is needed to determine the actual college enrollment and completion rates of the Acad-emy and non-Academy groups and to assess the types of college programs they attend. This is akey feature of the second phase of the Career Academies Evaluation, which includes asking stu-dents in the study sample to complete a survey 12 months after their scheduled graduation fromhigh school and again four years after their scheduled graduation.
IN. Career Academy Impacts for Students in the Medium-Risk Subgroup
The final subgroup of students include those who were not at particularly high risk ofdropping out of high school, but appeared to exhibit at least a moderate level of disengagementfrom school. This medium-risk subgroup represents about half the student sample. Overall, 8percent of non-Academy students in the medium-risk subgroup dropped out of high school be-fore the end of their 12th-grade year, and approximately two-thirds earned sufficient credits tomeet their districts' graduation requirements. Just over half completed the basic core academiccurriculum, and about 30 percent completed the more intensive core curriculum. On average,these students scored at about the 30th percentile nationally on a standardized math and achieve-ment test and at the 35th percentile in a standardized reading test. About 47 percent of non-Academy students in the medium-risk subgroup reported that they had taken the SATs or ACTs,and over 60 percent reported that they had submitted an application to a two-year or a four-yearcollege by the end of their 12th-grade year.
The findings discussed in this section indicate that, on average, the Career Academies hadlittle or no impact on most outcomes for students in the medium-risk subgroup. In other words,most outcome levels for students in the Academy group were about the same as they were forstudents in the non-Academy group. As discussed in Chapter 5, however, these overall averagesfor students in the medium-risk subgroup mask a high degree of variation in impacts across thesites in the study.
Table 3.11 provides a summary of Career Academy impacts on the school enrollmentstatus and attendance rates of students in the medium-risk subgroup. The first two rows of thetable show that 89 percent of the Academy group enrolled in an Academy during at least onesemester of high school and that 59 percent remained enrolled in the programs through the endof their 12th-grade year. This means that, on average, about two-thirds of students in the me-dium-risk subgroup who initially enrolled in an Academy remained in the program throughouthigh school.
-65-
103

A. Impacts on School Enrollment and Attendance
Table 3.11 shows the average school enrollment and attendance outcomes among stu-dents in the medium-risk subgroup. The data suggest that the Career Academies had no impacton dropout prevention or average attendance for this subgroup. The third row of the table pro-vides an estimate of the dropout rate among Academy and non-Academy students in this sub-group. It shows that 9 percent of Academy students in the medium-risk subgroup dropped out ofhigh school, compared with 8 percent of their non-Academy peers. This difference was not sta-tistically significant. Similarly, the next three rows present estimates of several different meas-ures of attendance among Academy and non-Academy students in this subgroup. The resultssuggest no systematic differences in the attendance patterns of Academy and non-Academy stu-dents in the medium-risk subgroup.
Table 3.11
Career Academies Evaluation
Impacts on School E i rollment and Attendancefor Students i II the Medium-Risk Subgroup
OutcomeAcademy
GroupNon-Academy
Group ImpactPercentChange'
Impact perenrollee
Ever enrolled in a Career Academyduring high school (%) 89.0 6.7 82.3 ***
Was enrolled in a Career Academyat the end of grade 12 (%) 58.8 3.0 55.9 ***
Dropped out of high schoolbefore the end of grade 12 (%) 9.0 8.0 1.0 12.1 1.2
Average attendance,grades 9-12 (%) 88.4 89.6 -1.2 -1.4 -1.5
More than 95 percent averageattendance, grades 9-12 (%) 36.2 37.7 -1.5 -3.9 -1.8
Less than 85 percent averageattendance, grades 9-12 (%) 22.4 19.3 3.1 15.9 3.7
Sample size (N=724) 393 331
SOURCE: See Table 3.1.
NOTES: See Table 3.1.
-66-
104

B. Impacts on Credits Earned and Course-Taking
Table 3.12 presents measures of course-taking patterns for Academy and non-Academystudents in the medium-risk subgroup. The top panel of the table indicates that the Academiesdid not have a systematic effect on the number of credits students earned in high school or on thenumber of credits they earned in academic and non-academic courses. Also, about 65 percent ofstudents in both the medium-risk Academy and non-Academy groups had earned sufficient cred-its to meet their districts' graduation requirements.
Table 3.12
Career Academies Evaluation
Impacts on Credits Earned and Course-Takingfor Students in the Medium-Risk Subgroup
OutcomeAcademy
GroupNon-Academy
Group ImpactPercentChangea
Impact perEnrollee"
Credits earned
Total course credits 22.6 22.9 -0.4 -1.6 -0.4
Total course credits meet thegraduation requirement (%) 64.8 65.2 -0.3 -0.5 -0.4
Earned 12 or more academiccourse credits (%) 69.8 69.4 0.4 0.6 0.5
Earned 8 or more non-academiccourse credits (%) 59.1 56.9 2.2 3.9 2.7
Course-taking
English (4), Social Studies (3),Math (3), Science (3)c (%) 28.8 30.5 -1.7 -5.6 -2.1
English (4), Social Studies (3),Math (2), Science (2)c (%) 48.7 51.0 -2.3 -4.4 -2.7
Earned 2 or more foreign-languagecredits (%) 42.2 49.0 -6.8 * -13.9 -8.3
Earned 1/2 or more computercredits (%) 66.3 57.7 8.6 ** 15.0 10.5
Earned 3 or more career/vocationalcredits (%) 65.7 48.4 17.3 *** 35.9 21.1
Sample size (N=724) 393 331
SOURCE: See Table 3.2.
NOTES: See Table 3.2.
BEST COPY AVAILABLE
-67- 105

Table 3.12 does indicate that the Academies produced changes in some specific subjectareas for the medium-risk subgroups. Academy students were more likely to complete three ormore credits in career-related or vocational courses and were more likely to complete at leastone semester of computer-related courses. At the same time, the Academies reduced the per-centage of students who completed a sequence of at least two years in a foreign language.Given that there was no overall change in the total number of non-academic credits earned bystudents in the medium-risk subgroups, it appears that the Academy students were taking thecareer-related and computer-related courses instead of other non-Academy courses or elec-tives. Also, because there was no overall reduction in academic course-taking, it appears thatAcademy students were more likely than their non-Academy counterparts to take other aca-demic courses instead of a foreign language.
C. Impacts on Math and Reading Achievement Test Scores
Table 3.13 summarizes the results for students in the medium-risk subgroup who took theNELS: 88 reading and math achievement tests. It appears that the Academies produced a slightreduction in reading test scores. On average, students in the non-Academy group scored at the35th percentile nationally, compared with the 31' percentile for Academy group students. It ispossible that some of this difference may be due to differences in the composition of the Acad-emy and non-Academy students who completed the achievement tests. This may have resultedfrom the fact that the medium-risk Academy students were somewhat more likely than medium-risk non-Academy students to complete the test.
Table 3.13
Career Academies Evaluation
Impacts on Achievement Test Scoresfor Students in the Medium-Risk Subgroup
OutcomeAcademy
GroupNon-Academy
Group ImpactPercentChanges
Impact perEnrollee 6
Math achievement test scores
Average national percentile 29.1 29.7 -0.6 -2.0 -0.7
Proficiency level (%)1: Rote memory operations 84.8 80.9 3.9 4.8 4.73: Simple problem-solving 28.5 31.3 -2.8 -8.9 -3.4
Reading achievement test scores
Average national percentile 30.8 35.1 -4.3 * -12.2 -5.2
Proficiency level (%)1: Simple comprehension 80.1 85.9 -5.7 -6.7 -7.02: Simple inferences 39.7 43.5 -3.8 -8.7 -4.6
Sample size (N=233) 124 109
SOURCE: See Table 3.3.
NOTES: See Table 3.3.
-68- 106

D. Impacts on Youth Development Experiences
Table 3.14 lists measures of various high school experiences and extracurricular activitiesamong Academy and non-Academy students in the medium-risk subgroup. In general, the tableindicates that there was no systematic difference between Academy and non-Academy studentsin terms of their use of non-school hours or in their exposure to various positive or risk-relatedactivities.
Table 3.14
Career Academies Evaluation
Impacts on Experiences During the 12th Grade Yearfor Students in the Medium-Risk Subgroup
Outcome
AcademyGroup
Non-AcademyGroup Impact
PercentChanges
Impactper Enrollee b
Use of non-school hours
Average time spent on homework (%)Less than 1 hour per week 37.0 32.9 4.1 12.4 5.0
2 to 6 hours per week 47.9 46.0 1.9 4.1 2.3
More than 6 hours per week 15.1 21.1 -6.0 ** -28.3 -7.2
Average time spent on extra-curricular activities (%)
None 47.0 52.3 -5.3 -10.1 -6.4
1 to 4 hours per week 30.3 25.9 4.4 17.0 5.3
More than 4 hours per week 22.7 21.8 0.9 4.2 /./
Youth development experiences
Reported any positive youthdevelopment experiences in past year (%)` 71.3 69.2 2.0 2.9 2.5
Worked on a volunteer project 53.7 48.9 4.8 9.8 5.8
Received award for participationin athletics or a school organization 46.7 41.7 5.0 11.9 6.0
Received an academic award or scholarship 28.0 25.1 2.8 11.3 3.4
Reported any risk-taking behaviorsin past year (%)° 23.8 25.6 -1.8 -7.2 -2.2
Has become a parent or is pregnant 11.1 10.8 0.4 3.6 0.5
Has been expelled from school 3.9 6.0 -2.1 -35.5 -2.6
Has come to school high on drugs or alcohol 8.4 8.7 -0.3 -3.6 -0.4
Has been arrested 5.3 5.2 0.1 1.8 0.1
Sample size (N=755) 407 348
SOURCE: See Table 3.4.
NOTES: See Table 3.4.
BEST COPY AVAILABLE-69- 0 7

E. Impacts on Plans and Steps Taken Toward Post-Secondary Educationand Work
Table 3.15 presents findings on the Career Academies' impacts on the medium-risk sub-group's plans and preparation for post-secondary education and work. As with many outcomesdiscussed in this section, the table indicates that in the medium-risk subgroup there was no sys-tematic difference between Academy and non-Academy students in terms of their plans andpreparation for post-secondary education and work.
Table 3.15
Career Academies Evaluation
Impacts on Planning and Preparation for College and Workfor Students in the Medium-Risk Subgroup
OutcomeAcademy
GroupNon-Academy
Group ImpactPercent
Changes
Impactper Enrollee b
Plans for next year (%)School only 8.3 8.9 -0.7 -7.4 -0.8Work only 4.8 5.1 -0.3 -5.5 -0.3Combine school and work 83.9 83.9 0.1 0.1 0.1Unknown 3.0 2.1 0.9 41.8 1.1
Steps taken toward 2-year or 4-yearcollege admission
Researched college options` 87.1 85.7 1.4 1.6 1.7
Took SATs or ACTs 44.3 46.9 -2.5 -5.4 -3.1
Submitted an application 62.6 63.1 -0.5 -0.7 -0.6
Had an interview 24.3 25.6 -1.3 -5.0 -1.6
Steps taken toward post-secondary employment (%)
Talked with a teacher or advisor about a job 39.1 40.9 -1.8 -4.4 -2.2
Submitted an application for employment 60.7 55.4 5.3 9.5 6.4
Interviewed for a position 42.1 41.9 0.2 0.6 0.3
Has previous work experience with prospectiveemployer 30.8 26.8 4.0 14.9 4.9
Education expectations (%)Complete some post-secondary education 93.6 93.9 -0.3 -0.3 -0.3Attend college 81.4 81.2 0.2 0.3 0.3Graduate from college 63.4 66.2 -2.8 -4.2 -3.4
Has overall positive outlook for the future" 75.1 78.5 -3.4 -4.4 -4.2
Sample size (N=755) 407 348
SOURCE: See Table 3.5.
NOTES: See Table 3.5.
108-70-

V. Career Academy Impacts Averaged Across the Student Subgroups
As noted earlier, most previous studies of Career Academies have focused on findingsthat are averaged across the diverse groups of students they serve. To provide a sense of how thefindings for these Career Academies might compare with other such averages, this section sum-marizes impact findings for the full study sample. A key conclusion from this analysis is thatthese overall averages mask a great deal of variation in the potential that Academies have tomake a difference for students, particularly for students at risk of school failure.
Table 3.16 lists key outcomes that were discussed in previous sections of the chapter. Ingeneral, the pattern of impacts is consistent with the pattern seen in the subgroups, although the
Table 3.16
Career Academies Evaluation
Impacts on Selected High School Outcomes forStudents in the Study Sample
OutcomeAcademy
GroupNon-Academy
Group ImpactPercent Impact perChanged Enrollee°
Ever enrolled in a Career Academyduring high school (%) 88.5 6.8 81.7 ***
Dropped out of high schoolbefore the end of grade 12 (%) 10.1 12.4 -2.4 -19.0 -2.9
Total course credits meet thegraduation requirement (%) 64.8 58.8 6.0 ** 10.2 7.3
English (4), Social Studies (3),Math (2), Science (2)d (%) 47.8 46.3 1.4 3.1 1.8
English (4), Social Studies (3),Math (3), Science (3)d (%) 28.4 26.7 1.7 6.3 2.1
Reading achievement test scoreaverage national percentiled 31.2 32.9 -1.7 -5.3 -2.1
Math achievement test scoreaverage national percentiled 29.9 29.4 0.5 1.7 0.6
Reported any positive youth developmentexperiences in past year ( %)C 71.6 67.4 4.2 * 6.2 5.1
Reported any risk-taking behaviorsin past year (%)f 24.2 26.6 -2.4 -8.9 -2.9
Submitted application for 2- or 4-year college 62.0 60.2 1.8 3.0 2.2
Submitted application for post-secondaryemployment (%) 59.4 55.8 3.6 6.5 4.4
Sample size (N= )(continued)
BEST COPY AVAILABLE -71- 109

Table 3.16 (continued)
SOURCES: MDRC calculations from Career Academies Evaluation Student School Records, 12th GradeAchievement Test, and 12th Grade Survey Databases.
NOTES: Credits include zero values for grades in which sample members were identified as school dropouts.Estimates are regression-adjusted using ordinary least squares, controlling for background characteristics of samplemembers. Rounding may cause slight discrepancies in calculating differences. All measures indicate credits earned upuntil the end of the 12th -grade year. 12th -grade year indicates the year that students were projected to reach the 12th-grade when they initially enrolled in the Career Academy or regular high school program.
A two-tailed t-test was applied to differences between the Academy and non-Academy groups. In both cases,statistical significance levels are indicated as: *** = 1 percent; ** = 5 percent; * = 10 percent.
'Percent change is defined as the impact divided by the non-Academy group average.
blmpact per enrollee is defined as the impact divided by the difference in the percentage of Academy and non-Academy group members ever enrolled in a Career Academy. It is italicized because its calculation does not involve adirect comparison of Academy and non-Academy students.
'Numbers refer to the amount of credits that were earned in each subject area.
dThe reading and math achievement tests are the cognitive battery tests of reading and mathematics used in theNELS: 88 study. There were a total of five proficiency levels for mathematics and three for reading. Particularproficiency levels are reported in the table to illustrate general trends in performance in the distribution of students.
Percentile scores reflect students' performance in relation to a nationally representative sample of 12th-graders.
`Students reported one or more of the positive youth development submeasures.
Students reported one or more of the risk-taking behaviors submeasures.
magnitude of impacts for the full study sample is smaller. On average, across all the participatingstudents and sites, the Academies produced increases in credits earned toward graduation, par-ticularly in career-related and vocational courses. They also increased students' exposure topositive youth development activities. Not surprisingly, the averaged impacts tend to look morelike those for the medium-risk subgroup, the largest of the three.
VI. Conclusions
The evidence presented in this chapter suggests that the Career Academies have thestrongest positive effects on the outcomes of students who begin high school at a high risk ofschool failure. The Academies reduce dropout rates, increase attendance, and increase creditsearned in both academic and vocational subjects. They also appear to improve outcomesamong students who are at low risk of school failure. Although these students are alreadyhighly engaged in school and are unlikely to drop out, the Academies appear to improve sev-eral outcomes, including the percentage of these students who earn enough credits to graduateon time. On the other hand, the Academies do not appear to have much effect on students inthe medium-risk subgroup.
Importantly, although the estimates in this chapter are focused on individual subgroups,they are aggregated across all the sites in the study. To the extent that differences in the imple-mentation of the Academy model affect the impact of the Career Academies, these estimates may
-72-
11

still mask important variation in the effects of Academies on students' performance, engagement,and achievement in high school. To pursue this issue, Chapter 4 explores the variation acrosssites in the implementation of the Academy model, and Chapter 5 explores the effect of thisvariation on the impact of Academies on student outcomes.
, -73-

Chapter 4
Factors Associated With Student Outcomes and thePattern of Career Academy limpacts
This chapter and Chapter 5 explore some potential pathways through which the core ele-ments of the Career Academy approach may change students' educational and work-related out-comes. The findings from these chapters provide some further context for explaining and interpret-ing the pattern of impacts discussed in Chapter 3.
Section I of this chapter identifies several aspects of students' high school environments andexperiences that are most strongly associated with positive outcomes that students may attain by theend of 12th grade. In particular, it examines students' perspectives on three school-related domains:the degree of interpersonal support they received from teachers and peers, the extent to which theirclasses included applied teaching and learning activities, and their level of exposure to careerawareness and work-based learning activities. This analysis focuses on both Academy and non-Academy students to shed light on the relationship between these domains and students' level ofschool engagement through the end of 12th grade.
Section II of this chapter examines differences across the participating sites in the extent towhich the Career Academies increased the level of interpersonal support, applied learning, andwork-related learning activities available to students. This analysis shows that a subset ofAcademies represent a large contrast with their non-Academy environments, particularly in termsof the interpersonal supports they offer to students. Chapter 5 explores the extent to which theseAcademies produced a different pattern of impacts on student outcomes than Academies thatrepresented less of a contrast from their non-Academy environments.
L Potential Pathways to Positive St dent Outcomes
As discussed in Chapter 1, the Career Academy approach has attracted a great deal of atten-tion in recent years, in part because its core features offer direct responses to a variety of problemsthat have been identified in high schools. Figure 1.1 provided a conceptual model showing the po-tential pathways through which these features may affect student outcomes in ways that are consis-tent with the broad range of goals that have been ascribed to Career Academies. Analyses con-ducted earlier in the Career Academies Evaluation, and updated for this report, provide empiricalsupport for the conceptual framework illustrated in Figure 1.1. This section of the chapter brieflyreviews the general findings from these analyses.'
Recall that the conceptual model listed four groups of constructs leading from the coreelements of the Academy approach to various short- and long-term outcomes. The four sets ofconstructs are:
'See Kemple 1997a, 1997b; and Kemple, Poglinco, and Snipes, 1999.
-74-
1112

o Career Academy organizational elements that distinguish the Academy ap-proach from the regular high school environment in which it is implemented;
o supports and learning opportunities that are intended to evolve from the or-ganizational elements;
o high school outcomes that the Academies aim to improve by enhancing thesupports and learning opportunities; and
o post-secondary outcomes that reflect some of the long-term goals of theAcademy approach.
Analyses conducted for previous reports from this evaluation and updated for the currentreport have focused on testing the correlation between measures of constructs indicated in the sec-ond column of Figure 1.1 and measures of the outcomes indicated in the third column. In otherwords, the analyses have explored empirical relationships between supports and learning opportu-nities and the outcomes students attain during high school.
One strand of analysis has examined the relationships between supports and outcomes forall students in the study sample, regardless of whether they had access to an Academy. This hasbeen aimed at addressing such questions as whether students who experience higher levels of inter-personal support from teachers and peers are more likely to remain enrolled and engaged in schoolthan students who experience lower levels of such supports. In fact, survey data collected for theevaluation indicate that students who reported receiving a high degree of support from their teach-ers and peers during 9th and 10th grades were less likely to drop out of high school and more likelyto complete a core curriculum.' Similarly, students who participated intensively in career awarenessand work-based learning activities tended to be more engaged in school and were more likely to beprepared to graduate and go on to college than those who did not participate in such activities orparticipated less intensively.' Finally, the analyses indicated a positive, yet weaker, associationbetween students' exposure to integrated and applied learning activities and their school engage-ment and performance. In general, however, the strongest associations have been found between theinterpersonal supports (such as teachers' expectations and peer collaboration) and various measuresof student performance and engagement in school.'
To the extent that such relationships exist, on average, for all students in the study sample, itis likely that these types of supports serve as key pathways through which the Career Academiesimprove student engagement in school. As noted earlier, this is because the supports and learningopportunities are closely aligned with the organizational features of the Academy approach. Forexample, enhanced interpersonal support is likely to evolve from the intensive interaction and col-
'These supports included students' perceptions of the personalized attention they receive from teachers, teachers'expectations for student performance and achievement, engagement levels of classmates, and opportunities to workclosely with classmates.
'This finding should be interpreted with some caution because participation in these activities typically occurredafter 1 lth grade. Some Career Academies, as well as other high school programs, tended to select students for theirintensive career awareness and work-based learning activities based on students' level of engagement and perform-ance in school. As a result, a high degree of school engagement may lead to higher levels of participation in careerawareness and work-based learning activities, rather than the other way around.
Tor additional information on these analyses, please contact the authors.
-75- 113

laboration offered by the school-within-a-school. A more focused curriculum and enriched teachingand learning are intended to develop through the Academy's integration of academic and occupa-tional content. Greater exposure to career awareness and work-based education is promoted throughthe employer partnerships.
In fact, as discussed in the previous reports from this evaluation, Academy students wereconsiderably more likely to experience the types of support and learning opportunities listed in Fig-ure 1.1 than were their non-Academy counterparts in the study. It should be noted, however, thatCareer Academy impacts on supports and learning opportunities may not directly cause any of theimpacts on such outcomes as dropout rates and credits earned toward graduation. Although theselinkages make sense from an conceptual standpoint, it may be that the students who experiencedthe greatest increase in supports are different from the students who experienced the largest reduc-tions in dropout rates or the greatest increases in credits earned. This suggests that the Career Acad-emy impacts may follow from pathways other than those leading through the types of supports andlearning opportunities listed in Figure 1.1.
One way to further test these relationships is to identify subgroups of sites in the studywhere the Career Academies generated particularly large increases in the supports and learning op-portunities listed in Figure 1.1. The next step would be to determine whether the Academies inthese sites also generated larger impacts on such outcomes as dropout rates and progress towardgraduation. The next section of the chapter summarizes analyses that identify a group of sites thatrepresented a particularly dramatic contrast with their non-Academy environments, at least in termsof the supports and learning opportunities discussed above.
IL Sources of Variation Among the Sites That May e Associatedwith Differences in Impacts
The primary focus of this report is on the difference between Academy and non-Academyenvironments and on the effects that this difference may have on students' experiences and behav-iors. As discussed in previous reports and earlier in this report, all the Career Academies had im-plemented the core features of the Academy approach and represented a clear contrast with the non-Academy environments in their schools. This section of the report begins an exploration of whethersome versions or contexts for the Academy approach produce larger impacts on student outcomesthan others.
As noted above and in previous reports from this study, the sites participating in theCareer Academies Evaluation differ from one another along a number of dimensions.' As aresult, there are numerous characteristics or criteria that might be used to differentiate the sites.For the purposes of this report, the strategy for exploring cross-site variation in the impacts ofCareer Academies focuses on similarities and differences among sites in terms of the contrastbetween their Academy and non-Academy environments, as opposed to exploring variationonly on the basis of differences among the Career Academy programs. For example, some Ca-reer Academies with highly supportive school-within-a-school environments are located inhigh schools where the vast majority of students feel safe, challenged, and supported by their
'See Kemple and Rock, 1996, for more detailed information about the similarities and differences among sites.
-76-
114

teachers and peers. In such a context, the Academies may not add much to the high degree ofsupport' already offered by the non-Academy environment.
Conversely, other Academies are located in high schools where very high percentages ofstudents do not receive the support or instruction required to keep them engaged in school and ona path toward graduation. Even though these Academies may not be as "well implemented" asAcademies in other contexts, they provide much more support and challenge for their studentsthan is available in the non-Academy environments.
The strategy used in this report to highlight contrasts among the participating sites wasguided by the theory of change described in Chapter 1 and by analyses of the relationshipsamong the key constructs described above. As noted earlier, interpersonal supports were found tohave the strongest relationship with later outcomes such as dropout prevention and progress towardgraduation. In other words, students who reported a high degree of support from their teachersand peers in 9th or 10th grade were more likely, by the end of 12th grade, to remain enrolled inhigh school, to have high attendance rates (95 percent or higher), and to have completed a corecurriculum. In general, Career Academy students were more likely to experience high levels ofinterpersonal supports than their counterparts in non-Academy environments.
Given the strong association between interpersonal supports and later outcomes, theprimary construct used to distinguish among sites in the study was the difference in the level ofinterpersonal supports that Academy and non-Academy students received. In short, individualsites were ranked according to the difference between the percentage of Academy and non-Academy students who reported receiving a high level of support from teachers and peers.Such ranking indicated that a subset of five participating sites showed a particularly large dif-ference in the interpersonal supports of Academy and non-Academy students. Moreover, as agroup, these sites generated larger differences in the school experiences of Academy and non-Academy students along several other important dimensions. Therefore, throughout the report,the Career Academies in these sites are referred to as high-contrast Academies.' The remainingsites showed a substantially smaller difference in the level of teacher and peer support reportedby Academy and non-Academy students, as well as somewhat smaller differences along otherdimensions of the high school experience. The Career Academies in these sites are referred toas low-contrast Academies.
Table 4.1 lists a variety of measures that highlight some of the key differences betweenhigh- and low-contrast sites and their Career Academies.' The first row in Table 4.1 shows theaverage percentages of Academy and non-Academy students who gave a high rating on anoverall measure of teacher support. The left panel of the table shows the differences in thesepercentages for the high-contrast Academies, and the right panel shows the differences for thelow-contrast Academies. The difference in this outcome was much larger for the high-contrast
6It is important to note that high-contrast Academies are not necessarily the most highly supportive or best-implemented Academies in the study. Rather, they are the sites where the Career Academies presented the greatestcontrast with their non-Academy school environments according to the student survey data collected for the evalua-tion. In some low-contrast sites, a high percentage of Academy students reported receiving high levels of supportfrom teachers and peers, but they are characterized as "low-contrast" sites because equally high or higher percent-ages of non-Academy students also reported receiving high levels of support.
'For a detailed description of the measures presented in Table 4.1, see Kemple, 1997a, 1997b; and Kemple,Poglinco, and,Snipes, 1999.
-77-

Tab
le 4
.1
Car
eer
Aca
dem
ies
Eva
luat
ion
Stud
ents
' Per
cept
ions
of
Inte
rper
sona
l and
Ins
truc
tiona
l Sup
port
san
d Pa
rtic
ipat
ion
in W
ork-
Rel
ated
Act
iviti
es,
by H
igh-
Con
tras
t and
Low
-Con
tras
t Aca
dem
ies
Out
com
e
Stud
ents
who
gav
e a
high
rat
ing
on o
vera
ll m
easu
re o
f te
ache
r su
ppor
t
Stud
ents
who
gav
e a
high
rat
ing
on o
vera
ll m
easu
re o
f pe
er s
uppo
rt
Stud
ents
who
gav
e a
high
rat
ing
on p
aren
t inv
olve
men
t
Stud
ents
who
rep
orte
d a
high
deg
ree
ofex
posu
re to
enr
iche
d cl
assr
oom
inst
ruct
ion
Stud
ents
who
rep
orte
d a
high
deg
ree
ofex
posu
re to
wor
k-re
late
d le
arni
ng a
ctiv
ities
Stud
ents
who
rep
orte
d in
tens
ive
part
icip
atio
nin
car
eer
awar
enes
s an
d de
velo
pmen
t act
iviti
esin
and
out
side
sch
ool
Stud
ents
who
rep
orte
d w
orki
ng a
t a jo
bw
ith h
igh-
qual
ity le
arni
ng o
ppor
tuni
ties
Sam
ple
size
Hig
h-C
ontr
ast A
cade
mie
saL
ow-C
ontr
ast A
cade
mie
sa
Aca
dem
y N
on-A
cade
my
Gro
upG
roup
Impa
ctPe
rcen
tC
hang
ebA
cade
my
Non
-Aca
dem
yG
roup
Gro
upIm
pact
Perc
ent
Cha
nge°
67.9
47.8
20.1
***
42.1
51.1
46.6
4.5
9.6
ill
54.0
39.7
14.3
***
36.0
49.5
46.7
2.8
5.9
tt
54.6
45.1
9.5
**21
.052
.547
.35.
211
.0
63.4
44.2
19.3
***
43.6
51.9
50.8
1.2
2.3
t t t
54.7
33.3
21.4
***
64.4
52.4
34.3
18.1
***
52.9
60.9
42.2
18.8
***
44.5
62.9
47.7
15.2
***
31.9
47.3
41.2
6.2
15.0
50.8
45.9
4.9
10.8
328
233
394
328
116
(con
tinue
d)
117

Tab
le 4
.1 (
cont
inue
d)
SOU
RC
ES:
MD
RC
cal
cula
tions
fro
m C
aree
r A
cade
mie
s E
valu
atio
n St
uden
t Sch
ool E
xper
ienc
e Q
uest
ionn
aire
Dat
abas
e an
d 12
th G
rade
Sur
vey
Dat
abas
e.
NO
TE
S: E
stim
ates
are
reg
ress
ion-
adju
sted
usi
ng o
rdin
ary
leas
t squ
ares
, con
trol
ling
for
back
grou
nd c
hara
cter
istic
s of
sam
ple
mem
bers
. Rou
ndin
g m
ay c
ause
slig
ht d
iscr
epan
cies
in c
alcu
latin
g di
ffer
ence
s.A
two-
taile
d t-
test
was
app
lied
to d
iffe
renc
es b
etw
een
the
prog
ram
and
con
trol
gro
ups.
In
both
cas
es, s
tatis
tical
sig
nifi
canc
e le
vels
are
indi
cate
d as
:**
* =
1 p
erce
nt; *
* =
5
perc
ent;
* =
10
perc
ent.
aHig
h-co
ntra
st A
cade
mie
s ar
e de
fine
d as
Aca
dem
ies
that
pro
duce
d a
sign
ific
ant d
iffe
renc
e in
the
perc
enta
ge o
f A
cade
my
and
non-
Aca
dem
y st
uden
ts w
ho r
epor
ted
a hi
gh le
vel
of s
uppo
rt f
rom
teac
hers
and
pee
rs. L
ow-c
ontr
ast A
cade
mie
s ar
e de
fine
d as
Aca
dem
ies
prod
uced
ver
y lit
tle d
iffe
renc
e be
twee
n th
e pe
rcen
tage
of
Aca
dem
y an
d no
n-A
cade
my
stud
ents
who
rep
orte
d a
high
leve
l of
supp
ort f
rom
teac
hers
and
pee
rs.
"Per
cent
cha
nge
is d
efin
ed a
s th
e im
pact
div
ided
by
the
non-
Aca
dem
y gr
oup
aver
age.
118
BE
ST
CO
PY
AV
AIL
AB
LE
119

Academies, where there was a 20 percentage point difference between Academy and non-Academy students. This represents an increase of 42 percent in the proportion of Academy stu-dents who felt that they received a high degree of support from their teachers. For the low-contrast Academies, there was no statistically significant difference between the percentages ofAcademy and non-Academy students who indicated that they received a high degree of supportfrom their teachers.
The first row of Table 4.1 further indicates that the contrast between the two groups ofsites can be attributed mostly to differences between the Academy groups rather than to differ-ences between the non-Academy groups. In the high-contrast sites, 68 percent of the Academystudents reported receiving a high level of teacher support, compared with 51 percent of theAcademy students in the low-contrast sites. On the other hand, very similar percentages of thenon-Academy students from both groups of sites reported that they received a high level ofteacher support. This pattern suggests that a key difference between these two groups of sites re-flects differences among Academy implementation strategies or differences among Academyteachers (or, more likely, a combination of the two). There is little contrast at least on thismeasure in the non-Academy environments.
The second row of Table 4.1 indicates a somewhat different pattern with respect to peersupport. Again, there is a clear contrast in the difference in peer support reported by Academyand non-Academy students across the two groups of sites. In this case, however, the differenceacross the two groups of sites is driven both by differences between Academy students and bydifferences between non-Academy students. Academy students in the high-contrast sites weremore likely to give a high rating on peer support than were Academy students in the low-contrastsites. At the same time, non-Academy students in the high-contrast sites were less likely to give ahigh rating on peer support than were non-Academy students in the low-contrast sites.
What did the high-contrast Academies do that was different from the low-contrast Acade-mies? In general, they tended to implement tightly organized school-within-a-school organizations.Programs in high-contrast Academies tended to include a core group of four or five teachers whoseresponsibilities fell exclusively within the Academy. The vast majority of students in these pro-grams had their core courses scheduled in blocks within the Academy, and very few non-Academystudents were included (except, for example, to ensure adequate enrollments)! These programs alsotended to be located in a clearly identifiable area of the school building or campus. In addition, theAcademy teachers in high-contrast sites tended to indicate that they had more opportunities to col-laborate with colleagues, that they felt part of a strong learning community, that they were able toinfluence key areas of their work, and that they emphasized personalized attention to their students.'
It is important to note, however, that considerable variation existed among the Academieswithin the two groups of sites. In some sites, for example, the high contrast between the Acade-mies and regular school environments appears to have stemmed from an advanced level of pro-gram implementation a level that was closer to the ideal Academy model. In other cases,however, the high contrast appears to reflect that the regular high school environment was par-ticularly stressful and unsupportive, and so the Academies provided considerably higher levels of
8See'Kemple, 1997a, 1997b.9This information comes from site visits, teacher interviews, and classroom observations completed as part of
the Career Academies Evaluation.
-80-12

support even though their programs were less well implemented than programs in other sites. Insome high-contrast sites, a relatively low percentage of Academy students reported high levels ofteacher and peer support, but an even lower percentage of non-Academy students did so.
There was also variation among the low-contrast sites. In some of them, relatively largepercentages of both Academy and non-Academy students reported high levels of support from 'teachers and peers; in others, relatively small percentages did so. This suggests that, in somecases, the smaller effects on interpersonal support in the low-contrast sites were partly a func-tion of weaker implementation of the Academy model. In other cases, however, the lack of ef-fect was a function of the Academies' being implemented in environments that were alreadyrelatively supportive.
The remainder of Table 4.1 reveals that the two groups of sites differed along several otherdimensions of the Academy experience, including students' exposure to enriched learning opportu-nities and participation in career awareness and work-based learning activities. In general, therewere larger differences between the experiences of Academy and non-Academy students in thehigh-contrast sites than in the low-contrast sites. As discussed above and in Chapter 1, however,these constructs were not as strongly related to student engagement and performance. In addition,the variation within the two groups of sites was greater on these dimensions than on the interper-sonal supports.
The analyses in Chapter 5 focus primarily on the differences in impacts between thesetwo groups of sites. In general, the chapter explores the hypothesis that the high-contrastAcademies produced larger impacts on student engagement and performance than the low-contrast Academies.
121

Chapter 5
The Relationship Between Career Academy Implementationand Impacts
This chapter explores the relationship between variation in Career Academy implementa-tion across the sites in the study and variation in the impacts the different Academies had on stu-dent outcomes. In particular, this chapter explores the extent to which the pattern of impacts dis-cussed in Chapter 3 differed across the high- and low-contrast sites identified in Chapter 4.Chapter 3 found that the positive effects of Career Academies were concentrated among studentsat a high risk of dropping out but that impacts were relatively modest among students who werenot at such risk. The findings in Chapter 4 revealed that outcomes were strongly related to meas-ures of the interpersonal support that students experienced in their school environments; theAcademies in this evaluation substantially varied in the magnitude of contrast between the levelof interpersonal support experienced by Academy students and the level experienced by non-Academy students in the regular high school environment.
In short, this chapter explores the hypothesis that Academies which represented the mostdramatic contrast with their non-Academy environments produced larger and more consistentpositive impacts than did Academies that were more similar to their non-Academy environments.Following is a summary of key findings discussed in this chapter.
Among students in the medium-risk subgroup, Career Academies that repre-sented the greatest contrast with the regular high school environment producedpositive impacts, including lower dropout rates and increased completion of acore academic curriculum.
Academies that represented less contrast with the non-Academy environmentin terms of interpersonal support produced some negative effects for studentsin the medium-risk subgroup, including higher dropout rates, reduced atten-dance, and lower rates of academic course-taking.
In general, both high-contrast and low-contrast Academies produced similarpatterns of impacts among students in the high-risk subgroup. The primarydifference across these sites is that the low-contrast Academies somewhat re-duced this subgroup's dropout rates and produced much larger increases invocational and career-related course-taking.
In general, both high-contrast and low-contrast Academies also producedsimilar patterns of impacts among students in the low-risk subgroup. The pri-mary difference across the sites for this subgroup is that the low-contrastAcademies somewhat increased career-related and vocational credits while re-ducing academic course-taking.
In sum, these findings do not clearly support the hypothesis that the high-contrastAcademies produced larger and more consistently positive impacts than the low-contrastAcademies. Although this pattern can be seen among students in the medium-risk subgroup, for
-82-
122

the high- and low-risk subgroups the impacts across the groups of sites had more similarities thandifferences. Nevertheless, the differences that do exist suggest two implications:
o Increasing the level of interpersonal support for students in addition to of-fering more opportunities to participate in career awareness and work-basedlearning activities can produce a consistent pattern of positive effects forboth the high- and the medium-risk subgroups (representing approximately 75percent of the students Academies serve). Under such circumstances, studentsin the low-risk Academy group are likely to do at least as well as their non-Academy counterparts.
o If Academies do not increase the level of interpersonal support (again, relativeto the regular school environment), they may actually reduce engagementamong the medium-risk subgroup, and they may also lead the low-risk sub-group to replace some academic courses with career-related or vocationalcourses.
These findings and implications are discussed in greater detail below.
Contrasting Impacts for Students in the Medium-Risk Subgroup
Tables 5.1 and 5.2 report the impacts among students in the medium-risk subgroup (thatis, students who were not identified as being at a particularly high or low risk of dropping out).The left panel of each table presents findings for the high-contrast Academies, and the right panelpresents findings for the low-contrast Academies.'
The findings in the left panel of Table 5.1 indicate that, among students in the medium-risk subgroup, the high-contrast Academies had a positive impact on a number of key outcomes.In particular, the high-contrast Academies appeared to reduce dropout rates and increase the per-centage of students who completed a core academic curriculum. Specifically, the high-contrastAcademies reduced dropout rates for the medium-risk subgroup from 11 percent among non-Academy students to 5 percent among their Academy group counterparts. This 6 percentagepoint difference represents a 54 percent reduction in the dropout rate for non-Academy studentsin the medium-risk subgroup. In addition, the high-contrast Academies increased the percentageof the medium-risk subgroup who completed a basic core academic curriculum. Whereas 49 per-cent of non-Academy students in these sites completed the curriculum, 58 percent of Academystudents did so.
The right panel of Table 5.1 indicates that impacts at the low-contrast Academies oc-curred in the opposite direction from impacts at the high-contrast Academies. In particular, the
'In addition to providing statistical significance tests of the impacts within each group of sites, the tables in thischapter provide statistical significance tests of the difference in impacts across the two groups of sites. The daggersymbols (t) in the rightmost column of each table indicate whether or not the impact for the high-contrast Acade-mies was statistically significantly different from the impact observed for the low-contrast Academies. If a differ-ence in impacts is statistically significant, one may have greater confidence that it is a systematic difference betweenthe groups of sites and does not arise merely from chance.
-83-
123

Tab
le 5
.1
Car
eer
Aca
dem
ies
Eva
luat
ion
Impa
cts
on E
nrol
lmen
t, A
ttend
ance
, and
Cou
rse-
Tak
ing
for
Stud
ents
in th
e M
ediu
m-R
isk
Subg
roup
,by
Hig
h-C
ontr
ast a
nd L
ow-C
ontr
ast A
cade
mie
s
Hig
h-C
ontr
ast A
cade
mie
s'L
ow-C
ontr
ast A
cade
mie
s'
Out
com
eA
cade
my
Non
-Aca
dem
yG
roup
Gro
upIm
pact
Perc
ent I
mpa
ct p
erC
hang
eb E
nrol
lee
`A
cade
my
Non
-Aca
dem
yG
roup
Gro
upIm
pact
Perc
ent
Impa
ct p
erC
hang
ebE
nrol
lee`
Eve
r en
rolle
d in
a C
aree
r A
cade
my
duri
ng h
igh
scho
ol (
%)
85.8
6.5
79.3
***
92.2
6.9
85.3
***
Dro
pped
out
of
high
sch
ool
befo
re th
e en
d of
gra
de 1
2 (%
)5.
311
.3-6
.1 *
*-5
3.5
-7.7
12.6
4.8
7.8
***
161.
09.
1ttt
Ave
rage
atte
ndan
cegr
ades
9-1
2 (%
)87
.585
.71.
72.
02.
289
.593
.4**
*-4
.2-4
.6ttt
Tot
al c
ours
e cr
edits
mee
t the
grad
uatio
n re
quir
emen
t (%
)68
.461
.56.
911
.28.
661
.668
.6-7
.0-1
0.2
Eng
lish
(4),
Soc
ial S
tudi
es(3
),M
ath
(2),
Sci
ence
(2)
° (%
)58
.048
.59.
4*
19.5
11.9
37.2
54.2
-17.
0 **
*-3
1.4
-19.
9
Ear
ned
2 or
mor
e fo
reig
n-la
ngua
ge c
redi
ts54
.548
.65.
912
.17.
425
.749
.8-2
4.1
m-4
8.4
298
tttE
arne
d 3
or m
ore
care
er/v
ocat
iona
l cre
dits
61.5
49.9
11.6
**
23.3
14.6
72.0
45.7
26.2
***
57.4
321-
0898
....
Sam
ple
size
195
165
198
166
124
(con
tinue
d)
125

Tab
le 5
.1 (
cont
inue
d)
SOU
RC
E: M
DR
C c
alcu
latio
ns f
rom
Car
eer
Aca
dem
ies
Eva
luat
ion
Scho
ol R
ecor
ds D
atab
ase.
NO
TE
S:A
ttend
ance
rat
es in
clud
e ze
ro v
alue
s fo
r gr
ades
in w
hich
sam
ple
mem
bers
wer
e id
entif
ied
as s
choo
l dro
pout
s. E
stim
ates
are
reg
ress
ion-
adju
sted
usi
ng o
rdin
aryl
eak
squa
res,
cont
rolli
ng f
or b
ackg
roun
d ch
arac
teri
stic
s of
sam
ple
mem
bers
. Rou
ndin
g m
ay c
ause
slig
ht d
iscr
epan
cies
in c
alcu
latin
g di
ffer
ence
s.A
two-
taile
d t-
test
was
app
lied
to d
iffe
renc
es b
etw
een
the
Aca
dem
y an
d no
n-A
cade
my
grou
ps.
Stat
istic
al s
igni
fica
nce
leve
ls a
re in
dica
ted
as: *
** =
1 p
erce
nt; *
* =
5 p
erce
nt; *
=10
per
cent
.A
n f-
test
was
per
form
ed to
det
erm
ine
whe
ther
the
vari
atio
n in
impa
cts
acro
ss s
ite-s
ubgr
oups
was
sta
tistic
ally
sig
nifi
cant
. Sta
tistic
al s
igni
fica
nce
of th
ese
test
s ar
e in
dica
ted
as: t
t t=
1 p
erce
nt;
f t=
5 p
erce
nt; t
= 1
0 pe
rcen
t.
aHig
h-co
ntra
st A
cade
mie
s ar
e de
fine
d as
Aca
dem
ies
that
pro
duce
d a
sign
ific
ant d
iffe
renc
e in
the
perc
enta
ge o
f A
cade
my
and
non-
Aca
dem
y st
uden
ts w
ho r
epor
ted
a "h
igh"
leve
l of
supp
ort f
rom
thei
r te
ache
rs a
nd p
eers
ear
ly o
n in
hig
h sc
hool
. Low
-con
tras
t Aca
dem
ies
are
defi
ned
as A
cade
mie
s th
at p
rodu
ced
very
littl
e di
ffer
ence
bet
wee
n th
e pe
rcen
tage
of A
cade
my
and
non-
Aca
dem
y st
uden
ts w
ho r
epor
ted
a "h
igh"
leve
l of
supp
ort f
rom
teac
hers
and
pee
rs.
bPer
cent
cha
nge
is d
efin
ed a
s th
e im
pact
div
ided
by
the
non-
Aca
dem
y gr
oup
aver
age.
`Im
pact
per
enr
olle
e is
def
ined
as
the
impa
ct d
ivid
ed b
y th
e di
ffer
ence
in th
e pe
rcen
tage
of
prog
ram
and
con
trol
gro
up m
embe
rs e
ver
enro
lled
in a
Car
eer
Aca
dem
y.
dNum
bers
ref
er to
the
amou
nt o
f cr
edits
that
wer
e ea
rned
in e
ach
subj
ect a
rea.
127
126

low-contrast Academies appear to have increased dropout rates for the medium-risk subgroup,from 5 percent among the non-Academy students to 13 percent among the Academy students.The dropout rate for Academy students in these sites was about two and a half times larger than itwas for their non-Academy counterparts. Furthermore, while neither group of Academies pro-duced statistically significant changes in the percentage of students in the medium-risk subgroupwho earned enough credits to graduate on time, the patterns of impacts run in opposite directions.That is, the high-contrast Academies increased the percentage of students who earned enoughcredits to meet the districts' graduation requirements, while the low-contrast Academies de-creased this percentage. (Note that the difference in these impacts is statistically significant eventhough the individual impact estimates are not.)
There were particularly dramatic differences in impacts on course-taking patterns be-tween the high-contrast and low-contrast Academies. The low-contrast Academies reduced thepercentage of students in the medium-risk subgroup who completed the basic core academic cur-riculum, from 54 percent for students in the non-Academy group to 37 percent for students in theAcademy group. A similar reduction occurred in the percentage of students who completed twoor more foreign-language courses (from 50 percent for the non-Academy group to 26 percent forthe Academy group).
The last row of Table 5.1 indicates that the low-contrast Academies produced more thantwice as large an impact on vocational course-taking than did the high-contrast Academies. Specifi-cally, in the high-contrast Academies, the percentage of students in the medium-risk subgroups whocompleted three or more career-related or vocational courses increased from 50 percent for the non-Academy group to 62 percent for the Academy group. This 12 percentage point difference repre-sents an increase of about 23 percent over the non-Academy group average. In the low-contrastAcademies, however, the percentage of students who completed three or more career-related or vo-cational courses increased from 46 percent for the non-Academy group to 72 percent for the Acad-emy group an increase of 57 percent over the non-Academy group average.
Table 5.2 presents the impacts of each group of Academies on the medium-risk sub-group's youth development activities and the steps these students took toward post-secondaryeducation or employment opportunities. The primary differences between the two groups of sitesrelate to the steps students took toward employment. The high-contrast Academies slightly re-duced the percentages both of students who applied for post-secondary employment and of stu-dents who interviewed for a position, whereas the low-contrast Academies had significant posi-tive impacts on both outcomes.
Although the two groups of sites were differentiated by the level of interpersonal supportthat the Academies offered to students (relative to the non-Academy environment), it is notablethat several differences in impacts relate to curriculum and work-related activities. The patternsof findings presented in Tables 5.1 and 5.2 suggest that the low-contrast Academies placedgreater emphasis on career-related and vocational course-taking and on helping students takeconcrete steps toward post-secondary employment opportunities. Nonetheless, the high-contrastAcademies do appear to have produced stronger impacts on school engagement for students inthe medium-risk subgroup.
-86-
128

00
Tab
le 5
.2
Car
eer
Aca
dem
ies
Eva
luat
ion
Impa
cts
on Y
outh
Dev
elop
men
t Exp
erie
nces
and
Pre
para
tion
for
the
Futu
refo
r St
uden
ts in
the
Med
ium
-Ris
k Su
bgro
up,
by H
igh-
Con
tras
t and
Low
-Con
tras
t Aca
dem
ies
Hig
h-C
ontr
ast A
cade
mie
saL
ow-C
ontr
ast A
cade
mie
sa
Out
com
eA
cade
my
Non
-Aca
dem
yG
roup
Gro
upIm
pact
Perc
ent I
mpa
ct p
erC
hang
ebE
nrol
lee`
Aca
dem
y N
on-A
cade
my
Gro
upG
roup
Impa
ctPe
rcen
t Im
pact
per
Cha
ngeb
Enr
olle
e`
Rep
orte
d tw
o or
mor
e po
sitiv
e yo
uth
deve
lopm
ent e
xper
ienc
es in
pas
t yea
r (V
o)d
73.3
66.1
7.3
11.0
9.2
69.3
72.3
-3.0
-4.2
-3.5
Rep
orte
d an
y ri
sk-t
akin
g be
havi
ors
in p
ast y
ear
(%)e
24.9
25.7
-0.8
-3.0
-1.0
22.7
25.7
-3.1
-11.
9-3
.6
Too
k st
eps
tow
ard
2-ye
ar o
r 4-
year
colle
ge a
dmis
sion
(%
)
Too
k SA
Ts
or A
CT
s46
.348
.7-2
.4-5
.0-3
.042
.745
.3-2
.6-5
.7-3
.0
Subm
itted
an
appl
icat
ion
67.9
63.2
4.7
7.4
5.9
57.8
63.1
-5.2
-8.3
-6.2
Too
k st
eps
tow
ard
post
-sec
onda
ryem
ploy
men
t (%
)
Subm
itted
an
appl
icat
ion
for
empl
oym
ent
59.7
63.2
-3.5
-5.6
-4.5
62.1
48.0
14.1
* *
*29
.416
.5if
Inte
rvie
wed
for
a p
ositi
on41
.550
.3-8
.8 *
-17.
5-1
1.1
43.1
33.9
9.1
*26
.910
.7tt
Has
an
over
all p
ositi
veou
tlook
for
the
futu
re{
74.4
73.6
0.8
1.0
1.0
75.8
82.9
-7.1
*-8
.6-8
.3
Sam
ple
size
191
161
216
187
129
130
(con
tinue
d)

Tab
le 5
.2 (
cont
inue
d)
SOU
RC
E: M
DR
C c
alcu
latio
ns f
rom
Car
eer
Aca
dem
ies
Eva
luat
ion
12th
Gra
de S
tude
nt S
urve
y D
atab
ase
NO
TE
S: A
ttend
ance
rat
es in
clud
e ze
ro v
alue
s fo
r gr
ades
in w
hich
sam
ple
mem
bers
wer
e id
entif
ied
as s
choo
l dro
pout
s. E
stim
ates
are
reg
ress
ion-
adju
sted
usi
ng o
rdin
ary
leas
t squ
ares
,co
ntro
lling
for
bac
kgro
und
char
acte
rist
ics
of s
ampl
e m
embe
rs. R
ound
ing
may
cau
se s
light
dis
crep
anci
es in
cal
cula
ting
diff
eren
ces.
A tw
o-ta
iled
t-te
st w
as a
pplie
d to
dif
fere
nces
bet
wee
n th
e A
cade
my
and
non-
Aca
dem
y gr
oups
.St
atis
tical
sig
nifi
canc
e le
vels
are
indi
cate
d as
: ***
= 1
per
cent
; **
= 5
per
cent
; * =
10
perc
ent.
An
f-te
st w
as p
erfo
rmed
to d
eter
min
e w
heth
er th
e va
riat
ion
in im
pact
s ac
ross
site
-sub
grou
ps w
as s
tatis
tical
ly s
igni
fica
nt. S
tatis
tical
sig
nifi
canc
e of
thes
e te
sts
are
indi
cate
d as
: ttt
= 1
perc
ent;
tt =
5 p
erce
nt; t
= 1
0 pe
rcen
t.
aHig
h-co
ntra
st A
cade
mie
s ar
e de
fine
d as
Aca
dem
ies
that
pro
duce
d a
sign
ific
ant d
iffe
renc
e in
the
perc
enta
ge o
f A
cade
my
and
non-
Aca
dem
y st
uden
ts w
ho r
epor
ted
a "h
igh"
leve
l of
supp
ort f
rom
thei
r te
ache
rs a
nd p
eers
. Low
-con
tras
t Aca
dem
ies
are
defi
ned
as A
cadm
ies
that
pro
duce
d ve
ry li
ttle
diff
eren
ce b
etw
een
the
perc
enta
ge o
f A
cade
my
and
non-
Aca
dem
y st
uden
tsw
ho r
epor
ted
a "h
igh"
leve
l of
supp
ort f
rom
teac
hers
and
pee
rs.
bPer
cent
cha
nge
is d
efin
ed a
s th
e im
pact
div
ided
by
the
non-
Aca
dem
y gr
oup
aver
age.
`Im
pact
per
enr
olle
e is
def
ined
as
the
impa
ct d
ivid
ed b
y th
e di
ffer
ence
in th
e pe
rcen
tage
of
prog
ram
and
con
trol
gro
up m
embe
rs e
ver
enro
lled
in a
Car
eer
Aca
dem
y.
dPos
itive
you
th d
evel
opm
ent e
xper
ienc
es in
clud
e w
orki
ng o
n a
volu
ntee
r pr
ojec
t in
the
com
mun
ity, r
ecei
ving
an
awar
d or
rec
ogni
tion
for
part
icip
atio
nin
an
athl
etic
team
or
scho
ol o
rgan
izat
ion,
or
rece
ivin
g an
aca
dem
ic a
war
d or
sch
olar
ship
.
`Ris
k -
taki
ng b
ehav
iors
incl
ude
bein
g ex
pelle
d fr
om s
choo
l, co
min
g to
sch
ool h
igh
on d
rugs
or
alco
hol,
or b
eing
arr
este
d.
00(O
vera
ll po
sitiv
e ou
tlook
for
the
futu
re w
as d
efin
ed b
y hi
gh r
atin
gs o
n qu
estio
ns a
bout
exp
ecta
tions
for
ach
ieve
men
t, po
tent
ial f
or a
ttain
ing
jobs
, and
kno
wle
dge
of m
etho
dsof
fin
ding
00fo
bs.
132

II. Contrasting Impacts for Students in the High-Risk Subgroup
Tables 5.3 and 5.4 present the impact findings for the high-risk subgroup. These findingsindicate thatAhe patterns of impacts across the high-contrast and low-contrast Academies aregenerally similar. Both groups of Academies had positive effects on dropout rates, attendance,credits earned toward graduation, and completion of a core academic curriculum. With the ex-ception of the impacts on career-related and vocational course-taking, none of the differences inimpacts across the site groups is statistically significant.'
There are two notable exceptions to the pattern of similar impacts for students in thehigh-risk subgroups across the sites. First, although both groups of Academies produced reduc-tions in dropout rates, the impact on dropout rates for the high-contrast Academies was not sta-tistically significant. (Note that the differences in dropout rate impacts across the groups of sitesis not statistically significant.) In particular, the low-contrast Academies cut dropout rates in halffor the high-risk subgroups, while the high-contrast Academies reduced dropout rates by about25 percent. There is no clear explanation for this pattern of findings, and it runs counter to thehypothesis that increased interpersonal support in the high-contrast sites should have producedlarger reductions in dropout rates.
Despite the somewhat smaller impact on dropout rate reduction, however, Table 5.3 showsthat the high-contrast Academies produced comparable impacts on attendance and credits. For ex-ample, the high-contrast Academies increased the percentage of the high-risk subgroup who earnedsufficient credits to graduate, from 30 percent for the non-Academy students to 43 percent for theAcademy students. A similar pattern occurred among the low-contrast Academies. Whereas 19 per-cent of the high-risk non-Academy group at the low-contrast sites earned enough credits to graduateby the end of 12th grade, 36 percent of their peers in the Academy group did so a difference of 87percent. Again, although this impact appears to be somewhat larger among the low-contrastAcademies, the difference in impacts is not statistically significant.
Both high-contrast and low-contrast Academies increased the percentage of the high-risksubgroup who completed the basic core academic curriculum. Again, while this impact is statis-tically significant only in the high-contrast sites, there is no significant difference across the sitesin the magnitude of this impact. In fact, to the extent that there is a difference, the percentagechange at the low-contrast sites appears to be larger than at the high-contrast sites.
As noted above, vocational or career-related course-taking reflects the only dimensionalong which the difference in impacts across sites is statistically significant. While the impacton the percentage of students who took three or more vocational courses is significant for bothhigh-contrast and low-contrast Academies, the impact on vocational course-taking is substan-tially larger for low-contrast Academies. At these sites, 28 percent of the high-risk non-Academy group completed at least three career-related or vocational courses, compared with66 percent of the Academy group. This impact represents an increase of 141 percent over thenon-Academy group and is nearly four times larger than the impact for the high-contrastAcademies. This suggests that while the high-contrast and low-contrast Academies produced
'In other words, one cannot reject the hypothesis that the impacts for high-contrast Academies are the same asthe impacts for low-contrast Academies.
-89-
133

Tab
le 5
.3
Car
eer
Aca
dem
ies
Eva
luat
ion
impa
cts
on E
nrol
lmen
t, A
ttend
ance
, and
Cou
rse-
Tak
ing
for
Stud
ents
in th
e H
igh-
Ris
k Su
bgro
up,
by H
igh-
Con
tras
t and
Low
-Con
tras
t Aca
dem
ies
9
Out
com
e
Hig
h-C
ontr
ast A
cade
mie
saL
ow-C
ontr
ast A
cade
mie
sa
Aca
dem
y N
on-A
cade
my
Gro
upG
roup
Impa
ctPe
rcen
t Im
pact
per
Cha
ngeb
Enr
olle
e'A
cade
my
Non
-Aca
dem
yG
roup
Gro
upIm
pact
Perc
ent
Cha
ngeb
Impa
ct p
erE
nrol
lee`
Eve
r en
rolle
d in
a C
aree
r A
cade
my
duri
ng h
igh
scho
ol (
%)
Dro
pped
out
of
high
sch
ool
befo
re th
e en
d of
gra
de 1
2 (%
)
Ave
rage
atte
ndan
cegr
ades
9-1
2 (%
)
Tot
al c
ours
e cr
edits
mee
t the
grad
uatio
n re
quir
emen
t (%
)
Eng
lish
(4),
Soc
ial S
tudi
es(3
),M
ath
(2),
Sci
ence
(2)
" (%
)
Ear
ned
2 or
mor
e fo
reig
n-la
ngua
gecr
edits
(%
)
Ear
ned
3 or
mor
e ca
reer
/voc
atio
nal
cred
its (
%)
86.2
24.2
79.0
43.4
36.1
29.4
55.3
4.4
32.0
73.5
30.2
19.6
21.4
40.3
81.8
***
-7.9 5.5
**
13.1
*
16.5
**
8.0
15.0
-24.
6-9
.6
7.5
6.7
43.5
16.1
84.4
20.2
37.5
9.8
37.2
18.3
87.5
16.2
85.3
35.8
20.9
16.0
66.3
0.4
34.4
78.7
19.1 8.9
13.6
27.5
87.1
***
-18.
2 **
6.6
**
16.6
**
12.0
2.3
38.8
***
-52.
9
8.4
87.0
134.
6
17.2
140.
8
-20.
9
7.6
19.1
13.8
2.7
44.5
Sam
ple
size
103
9482
66
SOU
RC
E: S
ee T
able
5.1
.
NO
TE
S: S
ee T
able
5.1
.
J1513
4
t

Tab
le 5
.4
Car
eer
Aca
dem
ies
Eva
luat
ion
Impa
cts
on Y
outh
Dev
elop
men
t Exp
erie
nces
and
Pre
para
tion
for
the
Futu
refo
r St
uden
ts in
the
Hig
h-R
isk
Subg
roup
,by
Hig
h-C
ontr
ast a
nd L
ow-C
ontr
ast A
cade
mie
s
Hig
h-C
ontr
ast A
cade
mie
s'L
ow-C
ontr
ast A
cade
mie
s'
Out
com
eA
cade
my
Gro
upN
on-A
cade
my
Gro
upIm
pact
Perc
ent I
mpa
ct p
erC
hang
e E
nrol
lee'
Aca
dem
y N
on-A
cade
my
Gro
upG
roup
Impa
ctPe
rcen
t Im
pact
per
Cha
nge"
Enr
olle
e`
Rep
orte
d tw
o or
mor
e po
sitiv
e yo
uth
deve
lopm
ent e
xper
ienc
es in
pas
t yea
r (%
)d62
.152
.79.
417
.911
.563
.059
.04.
06.
74.
6
Rep
orte
d an
y ri
sk-t
akin
g be
havi
ors
in p
ast y
ear
(%)e
34.3
45.2
-10.
9-2
4.1
-13.
335
.231
.43.
812
.14.
4
Too
k st
eps
tow
ard
2-ye
ar o
r 4-
year
colle
ge a
dmis
sion
(%
)
Too
k SA
Ts
or A
CT
s33
.622
.211
.4*
51.5
14.0
34.5
23.5
11.0
46.8
12.6
Subm
itted
an
appl
icat
ion
47.5
35.5
12.0
*33
.714
.653
.535
.717
.8**
50.0
20.5
Too
k st
eps
tow
ard
post
-sec
onda
ryem
ploy
men
t (%
)
Subm
itted
an
appl
icat
ion
for
empl
oym
ent
61.7
60.9
0.8
1.3
1.0
59.9
48.4
11.5
23.8
13.2
Inte
rvie
wed
for
a p
ositi
on47
.546
.60.
92.
01.
144
.639
.74.
912
.35.
6
Has
an
over
all p
ositi
veou
tlook
for
the
futu
ref
75.8
66.8
9.0
13.5
11.0
69.7
63.3
6.5
10.2
7.4
Sam
ple
size
112
9590
69
SOU
RC
E: S
ee T
able
5.2
.
NO
TE
S: S
ee T
able
5.2
.
137
/3

similar patterns of impacts on student engagement generally, the low-contrast Academies pro-duced a much larger impact on career-related and vocational course-taking. It is important tonote that, for the high-risk subgroup, this increase in career-related and vocational course-takingdid not appear to result in a reduction in academic course-taking.
Table 5.4 presents the impacts for the high-contrast and low-contrast Academies on youthdevelopment outcomes and steps taken toward post-secondary education and employment. Ingeneral, the data suggest no real differences in impacts between the two groups of sites.
III. Contrasting Impacts for Students in the Low-Risk Subgroup
Table 5.5 presents the impact findings for the low-risk subgroups across the high-contrastand low-contrast Academies. Not surprisingly, the findings suggest that neither group of Acade-mies had a meaningful impact on dropout rates or attendance. Students in the low-risk subgroupat both groups of sites were unlikely to drop out of high school and had relatively high atten-dance rates, even in the absence of the Academy treatment. Given these outcome levels, therewas little opportunity for either group of Academies to make much difference.
Table 5.5 does show that both groups of Academies increased the percentage of the low-risk subgroup who earned enough credits to meet their districts' graduation requirements. Thetable indicates that, at the low-contrast sites, 75 percent of the non-Academy students earnedenough credits by the end of their scheduled 12th-grade year, compared with 88 percent of theAcademy students. Similarly, at the high-contrast sites, 73 percent of the non-Academy studentsearned enough credits to graduate on time, compared with 84 percent of the Academy students inthe low-risk subgroup.
The last three rows of Table 5.5 show that the primary differences in impacts across thetwo groups of sites occurred in course-taking patterns. The low-contrast Academies reduced thepercentage of students in the low-risk subgroup who completed the basic academic curriculum aswell as the percentage who completed two or more foreign-language courses. On the other hand,the high-contrast Academies produced a slight increase in the percentage of students who com-pleted the basic core curriculum and a smaller (not statistically significant) reduction in the per-centage taking two or more foreign-language courses.
Table 5.5 indicates that, at the low-contrast sites, 64 percent of the non-Academy studentsin the low-risk subgroup completed the basic core academic curriculum. In comparison, 54 per-cent of Academy students did so. Although this difference is not statistically significant, it is sig-nificantly different from the pattern at the high-contrast sites, where the Academies increased byalmost the same magnitude the percentage of students who completed the basic core curriculum.
Table 5.5 also indicates that the low-contrast Academies reduced the percentage of thelow-risk subgroup who completed two or more foreign-language courses. While 79 percent ofthe non-Academy students at these sites earned two or more foreign-language credits, 44 percentof their Academy counterparts did so. This difference is statistically significant and represents areduction of 44 percent. Although there is a negative effect on this outcome for the high-contrastsites, it is not statistically significant; moreover, it is substantially smaller than the effect at thelow-contrast sites.
3

Tab
le 5
.5
Car
eer
Aca
dem
ies
Eva
luat
ion
Impa
cts
on E
nrol
lmen
t, A
ttend
ance
, and
Cou
rse-
Tak
ing
for
Stud
ents
in th
e L
ow-R
isk
Subg
roup
,by
Hig
h-C
ontr
ast a
nd L
ow-C
ontr
ast A
cade
mie
s
Hig
h-C
ontr
ast A
cade
mie
s"L
ow-C
ontr
ast A
cade
mie
s'
Aca
dem
y N
on-A
cade
my
Perc
ent I
mpa
ct p
erA
cade
my
Non
-Aca
dem
yPe
rcen
t Im
pact
per
Out
com
eG
roup
Gro
upIm
pact
Cha
ngeb
Enr
olle
e`G
roup
Gro
upIm
pact
Cha
ngeb
Enr
olle
e `
Eve
r en
rolle
d in
a C
aree
r A
cade
my
duri
ng h
igh
scho
ol (
%)
82.6
6.9
75.7
***
94.1
12.5
81.6
*"
Dro
pped
out
of
high
sch
ool
befo
re th
e en
d of
gra
de 1
2 (%
)2.
44.
3-1
.8-4
2.9
-2.4
1.7
1.8
-0.1
-5.4
-0.1
--1'
Ave
rage
atte
ndan
ce
t..)
c)gr
ades
9-1
2 (%
)93
.192
.01.
11.
21.
595
.995
.90.
10.
10.
1
Tot
al c
ours
e cr
edits
mee
t the
grad
uatio
n re
quir
emen
t (%
)83
.772
.810
.9*
15.0
14.4
87.9
75.1
12.7
**
16.9
15.6
Eng
lish
(4),
Soc
ial S
tudi
es(3
),M
ath
(2),
Sci
ence
(2)
° (%
)64
.655
.78.
916
.011
.853
.864
.4-1
0.6
-16.
5-1
3.0
tE
arne
d 2
or m
ore
fore
ign-
lang
uage
cre
dits
57.6
66.9
-9.3
-14.
0-1
2.3
44.1
79.2
-35.
1 **
*-4
4.3
-43.
011
Ear
ned
3 or
mor
e ca
reer
/voc
atio
nal c
redi
ts72
.844
.328
.5 *
**64
.537
.779
.841
.038
.7 *
**94
.447
.4
Sam
ple
size
8569
119
112
SOU
RC
E: S
ee T
able
5.1
.
NO
TE
S: S
ee T
able
5.1
.
140

Finally, while both groups of Academies increased the vocational course-taking for stu-dents in the low-risk subgroup, the impact at low-contrast sites was slightly larger. The high-contrast Academies increased the percentage of students who earned three or more career-relatedor vocational credits from 44 to 73 percent (an increase of 65 percent), whereas the low-contrastAcademies increased this percentage from 41 to 80 percent (an increase of 94 percent).
Table 5.6 presents findings on the low-risk subgroup's youth development experiencesand steps taken toward post-secondary education and employment. In general, there were fewimpacts on these outcomes and few differences in the patterns at high-contrast and low-contrastAcademies. The one exception is the effect of Academies on positive youth development experi-ences. The first row of Table 5.6 presents the percentages of the low-risk subgroup who reportedsuch positive youth development experiences as working on a volunteer project in their commu-nity, receiving an award or recognition for participating in an athletic team or school organiza-tion, and receiving an academic award or scholarship. Among the high-contrast Academies, 70percent of the low-risk non-Academy group reported positive youth development experiences,compared with 84 percent of the Academy students. The low-contrast Academies did not have animpact on this outcome.
W. Summary
The findings reported in this chapter have several implications for policy and practice.First, it appears that Academies which produced the largest increases in: interpersonal supportsfor students (relative to their non-Academy environments) also produced positive impacts onstudent engagement among both the high-risk and the medium-risk subgroups (which representabout 75 percent of the students they serve). Thus, focusing on interpersonal supports appears tobe a particularly important factor for both policymakers and practitioners when implementingAcademies. As discussed in Chapter 4, such supports as increased teachers' expectations, per-sonalized attention, and students' connections with an engaged peer group are most likely to bederived from the school-within-a-school component of the Academy approach. This componentmay be a necessary, though perhaps not sufficient, condition to keep students in school and toprovide a foundation for improving their achievement.
Second, it appears that high-contrast and low-contrast Academies may differ in importantways other than in their levels of interpersonal support. This is suggested by the larger impactsthat the low-contrast Academies had on career-related and vocational course-taking and by theirreductions in academic course-taking, particularly among the medium-risk and low-risk sub-groups. Given that completion of a core academic curriculum and foreign-language courses areoften key requirements for admission to a four-year college, to the extent that the mission of theAcademies has evolved to include preparation for work and college, it is important that theAcademies avoid limiting opportunities for any subset of students. Therefore, policymakers andpractitioners may need to ensure that Academies are implemented in a way that increases bothinterpersonal support and exposure to career-related themes and experiences in school but thatdoes not limit students' opportunities to complete key academic courses.
-94- 1 4 1

Tab
le 5
.6
Car
eer
Aca
dem
ies
Eva
luat
ion
Impa
cts.
on
You
th D
evel
opm
ent E
xper
ienc
es a
nd P
repa
ratio
n fo
r th
e Fu
ture
for
Stud
ents
in th
e-L
ow-R
isk
Subg
roup
,by
Hig
h-C
ontr
ast a
nd L
ow -
Con
tras
t: A
cade
mie
s
Hig
h-C
ontr
ast A
cade
mie
saL
ow-C
ontr
ast A
cade
mie
sa
Out
com
eA
cade
my
Non
- A
cade
my
Gro
upG
roup
Impa
ctPe
rcen
t Im
pact
per
Cha
ngeb
Enr
olle
e `
Aca
dem
y N
on -
Aca
dem
y.G
roup
Gro
upIm
pact
Perc
ent I
mpa
ct p
erC
hang
ebE
nrol
lee`
Rep
orte
d tw
o or
mor
e po
sitiv
e. y
outh
deve
lopm
ent e
xper
ienc
es in
pas
t yea
r (%
)d84
.170
.313
.8 *
*19
.618
.278
.078
.9-0
.9-1
.1-1
.0
Rep
orte
d an
y ri
sk-t
akin
g be
havi
ors
in p
ast y
ear
(%)e
10.4
16.0
-5.6
-35.
0-7
.419
.515
.73.
824
.34.
7
Too
k st
eps
tow
ard
2-ye
ar o
r 4-
year
colle
ge a
dmis
sion
(%
)
Too
k SA
Ts
or A
CT
S63
.658
.74.
98.
36.
457
.760
.5-2
.8-4
.6-3
.4
Subm
itted
an
appl
icat
ion
73.0
81.5
-8.5
-10.
5-1
1.3
69.0
77.3
-8.3
-10.
7-1
0.1
Too
k st
eps
tow
ard
post
-sec
onda
ryem
ploy
men
t (%
)
Subm
itted
an
appl
icat
ionf
or e
mpl
oym
ent
55.1
64.2
-9.1
-14.
2-1
2.0
56.4
51.9
4.5
8.7
5.5
Inte
rvie
wed
for
a p
ositi
on33
.832
.81.
02.
9.1.
341
.742
.8-1
.1-2
.6-1
.3
Has
an
over
all p
ositi
veou
tlook
for
the
futu
re' _
80.1
81.1
-1.0
-1.2
-1.3
76.9
76.8
0.1
0.1
0.1
Sam
ple
size
9064
128
107
SOU
RC
E: S
ee T
able
5.2
.
NO
TE
S: S
ee T
able
5.2
.
142
143
t

Appendix A
Supplementary Information About theCareer Academies Evaluation Research Sample and Data
Sources
144

As discussed in Chapter 1, the primary data used in this report were obtained from threesources: school transcript records, a survey administered to students at the end of their 12th-gradeyear, and a standardized math and reading achievement test administered to a subsample of stu-dents at the end of their 12th-grade year. This appendix presents the percentage of students in thefull study sample for whom these data are available. It also examines the comparability of stu-dents in the Academy and non-Academy groups for whom data are availabile.
I. Data Availability for Students in the Study Sample
As noted in Chapter 1, MDRC attempted to obtain data for a sample of 1,764 studentsfrom nine of the sites selected for the study.' For the purposes of this report, this group of stu-dents is referred to as the study sample. Of the students in the study sample, 959 (55 percent)were randomly selected to enroll in an Academy. For the purposes of this report, these studentsare referred to as the Academy group. The remaining 805 students (45 percent of the study sam-ple) were not invited to participate in the Academies but could choose other options available intheir high school or school district. These students constitute the study's control group and arereferred to in this report as the non-Academy group.
These groups of students were identified over a three-year period including the 1992-93, 1993-94, and 1994-95 school years. The students in the study sample were identified at theend of their 8th- or 9th-grade year, depending on when they applied for an Academy program.Recall that two of the Academies began in the 9th grade and that the remaining seven began inthe 10th grade. Students applied for admission to the programs at the end of the year prior toexpected enrollment. This report follows students in the study sample through the end of theyear they were scheduled to graduate from high school. This corresponds to the 1995-96,1996-97, or 1997-98 school year, depending on the year and grade level when a student en-tered the study. In short, MDRC attempted to collect data for students over the four-year pe-riod they were scheduled to enroll in high school.
Table A.1 lists the percentages of students in the Academy and non-Academy groups forwhom each of the key data sources is available. These percentages are referred to here as responserates. The top panel of the table shows the response rates for the full study sample, and the bottomthree panels show the response rates for each of the three risk subgroups discussed throughout thereport. Although not shown in the table, the overall response rates are as follows: Student SchoolRecords data are available for just over 82 percent of the students in the study sample, and 12thGrade Survey data are available for just over 85 percent of the study sample. These response rates
'As discussed in Kemple and Rock, 1996, the initial research sample consisted of 1,953 students from 10 sites.A total of 189 of these students were dropped from the initial research sample, and efforts to collect data for themwere discontinued. These students include the following. First, as noted in Chapter 1, one of the initial CareerAcademies was disbanded after two years in the study and was unable to provide sufficient follow-up data for itsstudents in the study sample. Thus, the 126 students in the research sample from this site are not included in thestudy sample for this report. Second, MDRC learned that 59 of the students in the initial research sample applied foran Academy program during their 10th-grade year and should not have been included in the study. This informationwas obtained from pre-random assignment school records and was confirmed with school staff. Finally, over thecourse of the data collection period, MDRC learned through contact with the schools and families that four addi-tional students were deceased.
-98-
145

Table A.1
Career Academies Evaluation
Data Availability for the Full Study Sample and the Risk Subgroups
Subgroup and Data SourceAcademy
GroupNon-Academy
Group Difference
Full study sample
In Student School Records Database (%) 81.5 83.5 -2.0
In 12th Grade Survey Database (%) 86.2 84.8 1.4
In 12th Grade Achievement Test Database' (%) 71.8 69.9 1.9
Sample size (n=1,764) 959 805
High-risk subgroup
In Student School Records Database (%) 71.7 74.1 -2.4
In 12th Grade Survey Database (%) 78.3 75.9 2.4
In 12th Grade Achievement Test Database' (%) 60.0 56.0 4.0
Sample size (n=474) 258 216
Medium-risk subgroup
In Student School Records Database (%) 83.4 83.2 0.2
In 12th Grade Survey Database (%) 86.4 87.4 -1.0
In 12th Grade Achievement Test Database' (%) 74.3 69.9 4.4
Sample size (n=869) 471 398
Low-risk subgroup
In Student School Records Database (%) 88.7 94.8 -6.1 *
In 12th Grade Survey Database (%) 94.8 89.5 5.3 *
In 12th Grade Achievement Test Database' (%) 80.0 84.8 -4.8
Sample size (n=421) 230 191
SOURCES: MDRC calculations from Career Academies Evaluation Student Baseline QuestionnaireDatabase, Student School Records Database, and 12th Grade Survey Database.
NOTES: The statistical significance of the difference between Academy and non-Academy groups isindicated as *** = 1 percent; ** = 5 percent; * = 10 percent.
'Percentages based on those attempted for the 12th-grade achievement test:
Academy
Group
Non-AcademyGroup
Full sample 372 319
High-risk subgroup 105 84
Medium-risk subgroup 167 156
Low-risk subgroup 100 79
BEST COPY AVAILABLE-99-
146

are considered to be high, particularly given that they cover a four-year follow-up period. Typically,program evaluations such as this aim for response rates of 80 percent or higher. The 12th GradeAchievement Test data are available for approximately 71 percent of the students in the study sam-ple who were attempted for the test administration?
The top panel of Table A.1 shows that there are no systematic differences between theAcademy and non-Academy groups in the proportion of students for whom these data are available.Thus, although these data are not available for all students in the study sample, data availability isvirtually the same for the Academy and non-Academy groups. The second and third panels in thetable show that there also are no systematic differences in response rates for each of the datasources for the high-risk and medium-risk subgroups.
There are slight differences in response rates, however, between Academy and non-Academy students in the low-risk subgroup. In particular, response rates for Student School Rec-ords data are somewhat higher among the students in the low-risk non-Academy group than theyare for the students in the low-risk Academy group. Conversely, response rates for the 12th GradeSurvey are somewhat higher among students in the low-risk Academy group. When response ratesare larger for one research group, impact estimates may be biased slightly if there are systematicdifferences in background characteristics and pre-random assignment experiences between Acad-emy and non-Academy students who did respond. As discussed in the next section of this Appen-dix, there are no systematic differences between Academy and non-Academy students in any of thesubgroups for any of the data sources.
A key question for interpreting the findings presented in this report is whether students forwhom data are available are representative of the full study sample. To address this question, mul-tiple regression was used to determine the extent to which the average characteristics of the studentswith data differed from the average characteristics of students for whom data are not available. Thisanalysis was carried out for each of the three data sources. In each case, the analysis indicated thatthere were systematic differences in background characteristics between students with data andthose without data. An illustration of the differences can be seen by comparing the response rates ofthe high-risk, medium-risk, and low-risk subgroups in Table A.1. Across all three data sources, re-sponse rates are lowest for the students in the high-risk subgroup and are highest for students in thelow-risk subgroup.
In short, the analysis of response rates indicates that the samples of students for whom dataare available are not completely representative of the full study sample of 1,764 students. Thus,caution should be exercised when attempting to generalize the findings beyond the students whoare included in the analyses. Nevertheless, the overall response rates show that data are available forthe vast majority of students in the study sample, making the findings reflective of the behavior ofmost of the sample.
2As noted in Chapter 1, MDRC attempted to administer the achievement test to the 691 students in the study
sample who were scheduled to be in the 12th grade at the end of the 1997-98 school year.
-100-
147

II. Comparison of Characteristics of Academy and Non-Academy Groupsin the Database Samples
The unique strength of a random assignment research design is that it yields two groupsfor which there are no systematic differences in measured and unmeasured background charac-teristics at the time sample members are identified for the study. Because the two groups enteredthe study with equivalent characteristics, any differences that emerge after that point can be at-tributed with confidence to the fact that one group had access to an Academy and the other groupdid not.
Table 2.1 in Chapter 2 presents, one at a time, average characteristics of Academy andnon-Academy students in the full study sample. This table shows that there are not statisticallysignificant differences between the groups on any of the characteristics. A more rigorous way totest for such differences is to use multiple regression analysis. Table A.2 presents linear regres-sion estimates and statistical tests of whether there are any systematic differences between Acad-emy and non-Academy students in the full study sample and in each of the three risk subgroups.The first column in Table A.2 shows that only one characteristic (age at application to Academy)is statistically significant and that there is no systematic difference. The final entry in the column,the p-value of the F-statistic, is very close to 1, providing strong evidence that there is no overallpattern of differences between Academy and non-Academy students in the full study sample. Ap-value of .1 or lower is typically used to indicate a "high" likelihood that there are systematicdifferences between the groups.
The three remaining columns in Table A.2 present the same analysis for each of the threerisk subgroups. These columns indicate that there are slight differences in a few individual char-acteristics but no overall pattern of differences between Academy and non-Academy students forany of the subgroups. The p-value of the F-statistic for each subgroup ranges from .767 to .879.
As discussed in the previous section of this appendix, MDRC obtained school records forapproximately 82 percent of the full sample; obtained 12th Grade Survey data for approximately84 percent of the full study sample; and obtained 12th Grade Achievement Test data for ap-proximately 71 percent of those attempted for the test. Thus, the Student School Records Data-base sample consists of 1,454 students; the 12th Grade Survey Database sample consists of 1,510students; and the 12th Grade Achievement Test Database sample consists of 490 students.
A key question underlying the analyses presented in this report is: Do these responsepatterns preserve the random assignment design? In other words, does each of the database sam-ples exhibit the same lack of systematic differences between Academy and non-Academy stu-dents, both overall and for each of the risk subgroups? To assess this question, regression analy-ses were used in the same manner as exhibited in Table A.2. Table A.3 presents the results forthe Student School Records Database sample; Table A.4 presents the results for the 12th GradeSurvey Database sample; and Table A.5 presents the results for the 12th Grade Achievement TestDatabase sample.
These tables each indicate slight differences in a few particular characteristics, but there areno systematic differences between the Academy and non-Academy groups for any of the databasesamples. This is true for the full study sample and for each of the risk subgroups. Given the overalllack of differences in background characteristics between the two groups, one can be confident
-101-
148

that differences in the outcome measures used throughout the report were caused by one group'shaving had access to the Career Academies and the other group's not having had such access.
In summary, random assignment created two groups of students without systematic over-all differences in background characteristics and prior school experiences. The pattern of re-sponse rates for each of the data sources preserves this feature of the research design. The lack ofsystematic differences between the Academy and non-Academy research groups is also pre-served within each of the risk subgroups that are used throughout the report.
-102-

Tab
le A
.2
Car
eer
Aca
dem
ies
Eva
luat
ion
Reg
ress
ion
Coe
ffic
ient
s fo
r Pr
obab
ility
of
Bei
ng A
ssig
ned
to th
e A
cade
my
Gro
upfo
r Fu
ll St
udy
Sam
ple
and
by R
isk
Subg
roup
s
Var
iabl
e
Full
Stud
y Sa
mpl
eH
igh-
Ris
k Su
bgro
upM
ediu
m-R
isk
Subg
roup
Low
-Ris
k Su
bgro
upPa
ram
eter
Est
imat
e(S
tand
ard
Err
or)
Para
met
erE
stim
ate
(Sta
ndar
d E
rror
)
Para
met
erE
stim
ate
(Sta
ndar
d E
rror
)
Para
met
erE
stim
ate
(Sta
ndar
d E
rror
)
Inte
rcep
t0.
047
-0.6
850.
676
2.36
3(0
.383
)(0
.682
)(0
.734
)(1
.689
)
Site
sSi
te 1
-0.0
52-0
.277
**
0.11
4-0
.083
(0.0
72)
(0.1
39)
(0.1
10)
(0.1
53)
Site
2-0
.071
-0.2
51 *
-0.0
04-0
.127
(0.0
81)
(0.1
49)
(0.1
21)
(0.2
04)
o --)
Site
30.
034
(0.0
93)
-0.1
32(0
.199
)0.
028
(0.1
34)
0.02
2(0
.237
)Si
te 4
-0.0
93-0
.207
-0.0
88-0
.019
(0.0
91)
(0.1
57)
(0.1
38)
(0.2
84)
Site
5-0
.008
0.02
4-0
.032
-0.0
24(0
.060
)(0
.100
)(0
.093
)(0
.146
)Si
te 6
-0.0
110.
000
0.08
5-0
.236
*(0
.055
)(0
.097
)(0
.084
)(0
.126
)Si
te 7
0.00
6-0
.086
0.05
60.
045
(0.0
47)
(0.0
86)
(0.0
71)
(0.1
03)
Site
80.
023
-0.0
310.
019
0.03
4(0
.045
)(0
.092
)(0
.068
)(0
.096
)
Exp
ecte
d gr
adua
tion
year
1996
0.01
8-0
.021
0.04
5-0
.038
(0.0
38)
(0.0
82)
(0.0
55)
(0.0
80)
1997
0.01
5-0
.069
0.02
50.
015
(0.0
33)
(0.0
77)
(0.0
45)
(0.0
65)
(con
tinue
d)
150
151

152
Tab
le A
.2 (
cont
inue
d)
Var
iabl
e
Full
Stud
y Sa
mpl
eH
igh-
Ris
k Su
bgro
upM
ediu
m-R
isk
Subg
roup
Low
-Ris
k Su
bgro
upPa
ram
eter
Est
imat
e(S
tand
ard
Err
or)
Para
met
erE
stim
ate
(Sta
ndar
d E
rror
)
Para
met
erE
stim
ate
(Sta
ndar
d E
rror
)
Para
met
erE
stim
ate
(Sta
ndar
d E
rror
)
In 8
th g
rade
at a
pplic
atio
n to
Aca
dem
y0.
043
0.08
2-0
.023
0.19
2(0
.076
)(0
.136
)(0
.109
)(0
.212
)
Fem
ale
-0.0
230.
043
-0.0
51-0
.021
(0.0
25)
(0.0
51)
(0.0
36)
(0.0
53)
Age
at a
pplic
atio
n to
Aca
dem
y0.
045
**0.
092
**0.
009
0.04
7(0
.023
)(0
.042
)(0
.033
)(0
.049
)
Rac
e/et
hnic
ityH
ispa
nic
0.03
20.
147
-0.0
230.
054
(0.0
53)
(0.1
19)
(0.0
73)
(0.1
10)
Afr
ican
-Am
eric
an0.
104
0.25
1 *
0.01
50.
132
(0.0
68)
(0.1
41)
(0.0
99)
(0.1
42)
Asi
an/N
ativ
e A
mer
ican
0.07
30.
094
0.05
90.
168
(0.0
69)
(0.1
48)
(0.0
99)
(0.1
45)
Ave
rage
8th
-gra
de m
ath
test
per
cent
ile0.
000
0.00
0-0
.001
0.00
1(0
.001
)(0
.002
)(0
.001
)(0
.002
)
Mis
sing
8th
-gra
de m
ath
test
sco
re0.
168
0.10
20.
437
*0.
060
(0.1
39)
(0.2
39)
(0.2
57)
(0.2
52)
Ave
rage
8th
-gra
de r
eadi
ng te
st p
erce
ntile
0.00
1-0
.002
0.00
2 *
0.00
1(0
.001
)(0
.002
)(0
.001
)(0
.002
)M
issi
ng 8
th-g
rade
rea
ding
test
sco
re-0
.185
0.00
0-0
.385
-0.0
74(0
.140
)(0
.239
)(0
.258
)(0
.252
)H
as s
iblin
g w
ho d
ropp
ed o
ut-0
.021
0.00
7-0
.025
-0.5
05(0
.031
)(0
.053
)(0
.053
)(0
.372
)Is
ove
rage
for
gra
de le
vel
-0.0
34-0
.049
-0.0
140.
205
(0.0
38)
(0.0
67)
(0.0
60)
(0.1
84)
(con
tinue
d)15
3

Tab
le A
.2 (
cont
inue
d)
Var
iabl
e
Full
Stud
y Sa
mpl
eH
igh-
Ris
k Su
bgro
upM
ediu
m-R
isk
Subg
roup
Low
-Ris
k Su
bgro
upPa
ram
eter
Est
imat
e(S
tand
ard
Err
or)
Para
met
erE
stim
ate
(Sta
ndar
d E
rror
)
Para
met
erE
stim
ate
(Sta
ndar
d E
rror
)
Para
met
erE
stim
ate
(Sta
ndar
d E
rror
)
Tra
nsfe
rred
sch
ool 2
or
mor
e tim
es-0
.015
-0.0
16-0
.009
0.18
8(0
.028
)(0
.051
)(0
.047
)(0
.252
)A
ttend
ance
rat
e-0
.002
-0.0
03-0
.001
-0.0
24 *
(0.0
02)
(0.0
03)
(0.0
05)
(0.0
13)
Cre
dits
ear
ned
0.00
00.
000
-0.0
490.
006
(0.0
14)
(0.0
19)
(0.0
41)
(0.0
85)
Gra
de p
oint
ave
rage
0.00
60.
046
0.02
8-0
.107
(0.0
23)
(0.0
44)
(0.0
40)
(0.0
70)
Sam
ple
size
1,76
447
486
942
1D
egre
e of
fre
edom
2626
2626
Mea
n of
dep
ende
nt v
aria
ble
0.54
40.
544
0.54
20.
546
R-s
quar
e0.
008
0.03
80.
021
0.04
9F-
stat
istic
0.50
60.
684
0.69
10.
785
p-va
lue
of F
-sta
tistic
0.98
20.
879
0.87
50.
767
SOU
RC
ES:
MD
RC
cal
cula
tions
fro
m C
aree
r A
cade
mie
s E
valu
atio
n St
uden
t Bas
elin
e Q
uest
ionn
aire
Dat
abas
e an
d St
uden
t Sch
ool
Rec
ords
Dat
abas
e.
NO
TE
: The
sta
tistic
al s
igni
fica
nce
of p
aram
eter
est
imat
es is
indi
cate
d as
***
= 1
per
cent
; **
= 5
per
cent
; * =
10
perc
ent.
155
154

Tab
le A
.3
Car
eer
Aca
dem
ies
Eva
luat
ion
Reg
ress
ion'
Coe
ffic
ient
s fo
r Pr
obab
ility
of
Bei
ng A
ssig
ned
to th
e A
cade
my
Gro
up,
Stud
ent S
choo
l Rec
ords
Dat
abas
e,fo
r Fu
ll St
udy
Sam
ple
and
by R
isk
Subg
roup
s
Var
iabl
e
Full
Stud
y Sa
mpl
eH
igh
-Ris
k Su
bgro
upM
ediu
m -
Ris
k Su
bgro
upL
ow-R
isk
Subg
roup
Para
met
erE
stim
ate
(Sta
ndar
d E
rror
)
Para
met
erE
stim
ate
(Sta
ndar
d E
rror
)
Para
met
erE
stim
ate
(Sta
ndar
d E
rror
)
Para
met
erE
stim
ate
(Sta
ndar
d E
rror
)
Inte
rcep
t0.
070
-0.5
990.
800
1.39
2
(0.4
40)
(0.8
37)
(0.8
13)
(1.7
90)
Site
sSi
te 1
-0.0
19-0
.215
0.13
7-0
.139
(0.0
81)
(0.1
68)
(0.1
18)
(0.1
68)
Site
20.
037
-0.0
780.
057
-0.1
01
(0.0
90)
(0.1
81)
(0.1
28)
(0.2
19)
Site
30.
118
0.17
5-0
.026
0.09
8(0
.104
)(0
.243
)(0
.146
)(0
.253
)Si
te 4
-0.0
35-0
.080
-0.0
770.
015
(0.1
00)
(0.1
89)
(0.1
45)
(0.2
92)
Site
5-0
.002
0.07
1-0
.040
0.01
1
(0.0
66)
(0.1
19)
(0.0
99)
(0.1
50)
Site
60.
010
0.07
50.
119
-0.2
50 *
(0.0
62)
(0.1
17)
(0.0
93)
(0.1
31)
Site
70.
015
-0.0
630.
031
0.09
0(0
.053
)(0
.102
)(0
.078
)(0
.109
)Si
te 8
0.02
0-0
.008
-0.0
060.
086
(0.0
51)
(0.1
15)
(0.0
76)
(0.1
02)
Exp
ecte
d gr
adua
tion
year
1996
0.06
00.
039
0.06
5.0.
034-
(0.0
42)
(0.1
00)
(0.0
60)
(0.0
84)
1997
0.03
3-0
.046
0.02
80.
046
(0.0
36)
(0.0
93)
(0.0
51)
(0.0
68)
(con
tinue
d)15
7

Tab
le A
.3 (
cont
inue
d)
Var
iabl
e
Full
Stud
y Sa
mpl
eH
igh-
Ris
k Su
bgro
upM
ediu
m-R
isk
Subg
roup
Low
-Ris
k Su
bgro
upPa
ram
eter
Est
imat
e
(Sta
ndar
d E
rror
)
Para
met
erE
stim
ate
(Sta
ndar
d E
rror
)
Para
met
erE
stim
ate
(Sta
ndar
d E
rror
)
Para
met
erE
stim
ate
(Sta
ndar
d E
rror
)-
In 8
th g
rade
at a
pplic
atio
n to
Aca
dem
y-0
.027
-0.1
35-0
.044
0.28
2
(0.0
83)
(0.1
59)
(0.1
15)
(0.2
25)
Fem
ale
-0.0
130.
028
-0.0
18-0
.016
(0.0
28)
(0.0
61)
(0.0
40)
(0.0
55)
Age
at a
pplic
atio
n to
aca
dem
y0.
032
0.05
50.
007
0.05
6(0
.025
)(0
.051
)(0
.037
)(0
.052
)
Rac
e/et
hnic
ityH
ispa
nic
0.00
30.
220
-0.0
940.
008
(0.0
61)
(0.1
43)
(0.0
85)
(0.1
19)
Afr
ican
-Am
eric
an0.
050
0.29
0 *
-0.1
050.
129
(0.0
78)
(0.1
64)
(0.1
13)
(0.1
60)
Asi
an/N
ativ
e A
mer
ican
0.04
80.
174
0.00
30.
121
(0.0
79)
(0.1
80)
(0.1
12)
(0.1
53)
Ave
rage
86-
grad
e m
ath
test
per
cent
ile0.
000
-0.0
01-0
.001
0.00
3
(0.0
01)
(0.0
02)
(0.0
01)
(0.0
02)
Mis
sing
86-
grad
e m
ath
test
sco
re0.
224
0.10
90.
449
*0.
173
(0.1
51)
(0.3
12)
(0.2
57)
(0.2
56)
Ave
rage
86-
grad
e re
adin
g te
st p
erce
ntile
0.00
0-0
.001
0.00
10.
000
(0.0
01)-
-(0.
002)
(0.0
01)
(010
02)
Mis
sing
86-
grad
e re
adin
g te
st s
core
-0.2
48-0
.250
-0.3
99-
0.17
.7
(0.1
52)
(0.3
13)
(0.2
59)
(0.2
56)
Has
sib
ling
who
dro
pped
out
...
-0.0
080.
027
...
-0.0
40-0
.463
(0.0
34)
(0.0
65)
(0.0
56)
(0.4
96)
Is o
vera
ge f
or g
rade
leve
l-0
.016
-0.0
20-0
.002
0.13
1
(0.0
43)
(0.0
79)
(0.0
68)
(0.1
93)
(con
tinue
d)
158

Tab
le A
.3 (
cont
inue
d)
Var
iabl
e
Full
Stud
y Sa
mpl
eH
igh-
Ris
k Su
bgro
upM
ediu
m-R
isk
Subg
roup
Low
-Ris
k Su
bgro
upPa
ram
eter
Est
imat
e(S
tand
ard
Err
or)
Para
met
erE
stim
ate
(Sta
ndar
d E
rror
)
Para
met
erE
stim
ate
(Sta
ndar
d E
rror
)
Para
met
erE
stim
ate
(Sta
ndar
d E
rror
)
Tra
nsfe
rred
sch
ool 2
or
mor
e tim
es-0
.017
-0.0
770.
015
0.07
6(0
.032
)(0
.062
)(0
.052
)(0
.289
)
Atte
ndan
ce r
ate
0.00
00.
001
-0.0
02-0
.019
(0.0
02)
(0.0
04)
(0.0
05)
(0.0
14)
Cre
dits
ear
ned
0.00
0-0
.004
-0.0
430.
063
(0.0
17)
(0.0
26)
(0.0
45)
(0.0
91)
Gra
de p
oint
ave
rage
-0.0
060.
061
0.03
1-0
.135
*(0
.027
)(0
:057
)(0
.043
)(0
.074
)
Sam
ple
size
1,45
434
572
438
5
Deg
ree
of f
reed
om26
2626
26
Mea
n of
dep
ende
nt v
aria
ble
0.53
80.
536
0.54
30.
530
R-s
quar
e0.
008
0.04
70.
029
0.06
0
F-st
atis
tic0.
432
0.60
10.
797
0.88
1
p-va
lue
of F
-sta
tistic
0.99
50.
940
0.75
40.
636
SOU
RC
ES:
MD
RC
cal
cula
tions
fro
m C
aree
r A
cade
mie
s E
valu
atio
n St
uden
t Bas
elin
e Q
uest
ionn
aire
Dat
abas
e an
d St
uden
t Sch
ool R
ecor
ds D
atab
ase.
NO
TE
: The
sta
tistic
al s
igni
fica
nce
of p
aram
eter
est
imat
es is
indi
cate
d as
***
= 1
per
cent
; **
= 5
per
cent
; * =
10
perc
ent.
160
161

Tab
le A
.4
Car
eer
Aca
dem
ies
Eva
luat
ion
Reg
ress
ion
Coe
ffic
ient
s fo
r Pr
obab
ility
of
Bei
ng A
ssig
ned
to th
e A
cade
my
Gro
up,
12th
Gra
de S
urve
y D
atab
ase,
for
Full
Stud
y Sa
mpl
e an
d by
Ris
k Su
bgro
ups
Var
iabl
e
Full
Stud
y Sa
mpl
eH
igh-
Ris
k Su
bgro
upM
ediu
m-R
isk
Subg
roup
Low
-Ris
k Su
bgro
upPa
ram
eter
Est
imat
e(S
tand
ard
Err
or)
Para
met
erE
stim
ate
(Sta
ndar
d E
rror
)
Para
met
erE
stim
ate
(Sta
ndar
d E
rror
)
Para
met
erE
stim
ate
(Sta
ndar
d E
rror
)
Inte
rcep
t-0
.224
-1.1
420.
585
1.96
4(0
.430
)(0
.799
)(0
.802
)(1
.768
)Si
tes
Site
10.
004
-0.1
680.
144
-0.0
20(0
.079
)(0
.161
)(0
.121
)(0
.160
)Si
te 2
-0.0
33-0
.180
0.00
8-0
.059
(0.0
88)
(0.1
68)
(0.1
27)
(0.2
30)
Site
30.
075
-0.0
870.
089
0.06
1(0
.100
)(0
.224
)(0
.142
)(0
.261
)Si
te 4
-0.0
57-0
.105
-0.1
27-0
.016
(0.0
99)
(0.1
83)
(0.1
46)
(0.2
87)
Site
5-0
.010
-0.0
420.
002
-0.0
26(0
.066
)(0
.118
)(0
.100
)(0
.150
)Si
te 6
-0.0
10-0
.015
0.09
2-0
.244
*(0
.061
)(0
.115
)(0
.092
)(0
.130
)Si
te 7
-0.0
05-0
.154
0.05
80.
052
(0.0
51)
(0.0
99)
(0.0
76)
(0.1
06)
Site
8-0
.003
-0.1
73-0
.006
0.06
7(0
.050
)(0
.109
)(0
.073
)(0
.101
)E
xpec
ted
grad
uatio
n ye
ar19
960.
052
0.08
60.
065
-0.0
06(0
.041
)(0
.096
)(0
.059
)(0
.083
)19
970.
042
-0.0
020.
030
0.05
6(0
.035
)(0
.089
)(0
.049
)(0
.067
)(c
ontin
ued)
163
162

Tab
le A
.4 (
cont
inue
d)
Var
iabl
e
Full
Stud
y Sa
mpl
eH
igh-
Ris
k Su
bgro
upM
ediu
m-R
isk
Subg
roup
Low
-Ris
k Su
bgro
upPa
ram
eter
Est
imat
e(S
tand
ard
Err
or)
Para
met
erE
stim
ate
(Sta
ndar
d E
rror
)
Para
met
erE
stim
ate
(Sta
ndar
d E
rror
)
Para
met
erE
stim
ate
(Sta
ndar
d E
rror
)
In 8
°1 g
rade
at a
pplic
atio
n to
Aca
dem
y0.
019
0.06
4-0
.037
0.14
1(0
.082
)(0
.153
)(0
.115
)(0
.240
)Fe
mal
e-0
.045
-0.0
07-0
.052
-0.0
32(0
.027
)(0
.059
)(0
.039
)(0
.055
)A
ge a
t app
licat
ion
to A
cade
my
0.05
3 **
0.10
2 **
0.01
00.
062
(0.0
25)
(0.0
48)
(0.0
36)
(0.0
52)
Rac
e/et
hnic
ityH
ispa
nic
0.04
90.
241
*-0
.037
0.07
4(0
.057
)(0
.131
)(0
.079
)(0
.115
)A
fric
an-A
mer
ican
0.10
80.
275
*-0
.001
0.15
6(0
.073
)(0
.152
)(0
.107
)(0
.147
)A
sian
/Nat
ive
Am
eric
an0.
063
0.16
6-0
.004
0.19
1(0
.075
)(0
.167
)(0
.107
)(0
.148
)
Ave
rage
81h
-gra
de m
ath
test
per
cent
ile-0
.001
-0.0
02-0
.001
0.00
2(0
.001
)(0
.002
)(0
.001
)(0
.002
)
Mis
sing
81h
-gra
de m
ath
test
sco
re0.
120
0.29
40.
408
-0.1
90(0
.195
)(0
.522
)(0
.298
)(0
.326
)
Ave
rage
8th
-gra
de r
eadi
ng te
st p
erce
ntile
.0.
001
0.00
00.
002
*0.
000
(0.0
01)
(0.0
02)
(0.0
01)
(0.0
02)
Mis
sing
8°1
-gra
de r
eadi
ng te
st s
core
-0.1
50-0
.446
-0.3
830.
218
(0.1
96)
(0.5
27)
(0.2
99)
(0.3
24)
Has
sib
ling
who
dro
pped
out
-0.0
150.
003
-0.0
21-0
.600
(0.0
34)
(0.0
60)
(0.0
57)
(0.3
73)
Is o
vera
ge f
or g
rade
leve
l-0
.059
-0.0
72-0
.045
0.10
4(0
.041
)(0
.077
)(0
.064
)(0
.192
)(c
ontin
ued)
165

Tab
le A
.4 (
cont
inue
d)
Var
iabl
e
Full
Stud
y Sa
mpl
eH
igh-
Ris
k Su
bgro
upM
ediu
m-R
isk
Subg
roup
Low
-Ris
k Su
bgro
upPa
ram
eter
Est
imat
e(S
tand
ard
Err
or)
Para
met
erE
stim
ate
(Sta
ndar
d E
rror
)
Para
met
erE
stim
ate
(Sta
ndar
d E
rror
)
Para
met
erE
stim
ate
(Sta
ndar
d E
rror
)
Tra
nsfe
rred
sch
ool 2
or
mor
e tim
es0.
005
0.00
7-0
.001
0.04
6(0
.030
)(0
.059
)(0
.050
)(0
.287
)A
ttend
ance
rat
e0.
000
0.00
10.
000
-0.0
24(0
.002
)(0
.003
)(0
.005
)(0
.014
)C
redi
ts e
arne
d-0
.009
-0.0
16-0
.051
0.02
7(0
.016
)(0
.024
)(0
.044
)(0
.089
)G
rade
poi
nt a
vera
ge0.
016
0.07
60.
040
-0.1
01(0
.026
)(0
.054
)(0
.043
)(0
.072
)
Sam
ple
size
1,51
036
675
538
9D
egre
e of
fre
edom
2626
2626
Mea
n of
dep
ende
nt v
aria
ble
0.54
80.
552
0.53
90.
560
R-s
quar
e0.
099
0.05
30.
025
0.05
7F-
stat
istic
0.57
10.
729
0.71
20.
839
p-va
lue
of F
-sta
tistic
0.95
90.
832
0.85
40.
696
SOU
RC
ES:
MD
RC
cal
cula
tions
fro
m C
aree
r A
cade
mie
s E
valu
atio
n St
uden
t Bas
elin
e Q
uest
ionn
aire
Dat
abas
e, S
tude
nt S
choo
l Rec
ords
Dat
abas
e, a
nd 1
2th
Gra
de S
urve
y D
atab
ase.
NO
TE
: The
sta
tistic
al s
igni
fica
nce
of p
aram
eter
est
imat
es is
indi
cate
d as
***
= 1
per
cent
; **
= 5
per
cent
; * =
10
perc
ent.
167
166

168
Tab
le A
.5
Car
eer
Aca
dem
ies
Eva
luat
ion
egre
ssio
n C
oeff
icie
nts
for
Prob
abili
ty o
f B
eing
Ass
igne
d to
the
Aca
dem
y G
roup
,12
th G
rade
Ach
ieve
men
t Tes
t Sam
ple,
for
Full
Stud
y Sa
mpl
e an
d by
Ris
k Su
bgro
ups
Var
iabl
e
Full
Stud
y Sa
mpl
eH
igh-
Ris
k Su
bgro
upM
ediu
m-R
isk
Subg
roup
Low
-Ris
k Su
bgro
upPa
ram
eter
Est
imat
e(S
tand
ard
Err
or)
Para
met
erE
stim
ate
(Sta
ndar
d E
rror
)
Para
met
erE
stim
ate
(Sta
ndar
d E
rror
)
Para
met
erE
stim
ate
(Sta
ndar
d E
rror
)
Inte
rcep
t0.
303
6.72
63.
132
**1.
228
(0.7
60)
(9.7
81)
(1.4
75)
(2.7
87)
Site
sSi
te 1
0.16
8-0
.088
0.29
4-0
.081
(0.1
38)
(0.3
35)
(0.1
96)
(0.3
43)
Site
20.
162
-0.0
270.
020
-0.0
13(0
.145
)(0
.367
)(0
.199
)(0
.388
)Si
te 3
0.12
30.
184
0.05
2-0
.252
(0.1
49)
(0.3
52)
(0.2
09)
(0.4
31)
Site
40.
036
-0.1
20-0
.104
-0.0
32(0
.153
)(0
.389
)(0
.215
)(0
.432
)Si
te 5
Site
6
Site
70.
097
0.10
80.
240
0.23
1(0
.110
)(0
.247
)(0
.170
)(0
.228
)Si
te 8
0.03
5-0
.179
0.07
70.
134
(0.1
03)
(0.3
07)
(0.1
49)
(0.2
17)
Exp
ecte
d gr
adua
tion
year
1996
1997
(con
tinue
d)16
9

Tab
le A
.5 (
cont
inue
d)
Var
iabl
e
Full
Stud
y Sa
mpl
eH
igh-
Ris
k Su
bgro
upM
ediu
m-R
isk
Subg
roup
Low
-Ris
k Su
bgro
upPa
ram
eter
Est
imat
e
(Sta
ndar
d E
rror
)
Para
met
erE
stim
ate
(Sta
ndar
d E
rror
)
Para
met
erE
stim
ate
(Sta
ndar
d E
rror
)
Para
met
erE
stim
ate
(Sta
ndar
d E
rror
)
In 8
th g
rade
at a
pplic
atio
n to
Aca
dem
y0.
030
0.15
6-0
.079
0.45
6
(0.1
07)
(0.2
07)
(0.1
52)
(0.3
43)
Fem
ale
0.00
20.
012
0.12
5
(0.0
49)
(0.1
14)
(0.0
73)
(0.0
98)
Age
at a
pplic
atio
n to
Aca
dem
y0.
023
0.15
9*
-0.0
55-0
.051
(0.0
45)
(0.0
92)
(0.0
72)
(0.0
91)
Rac
e/et
hnic
ityH
ispa
nic
-0.0
43-8
.717
-0.1
810.
284
(0.1
51)
(9.4
72)
(0.1
80)
(0.3
43)
Afr
ican
-Am
eric
an-0
.102
-8.6
10-0
.147
0.24
5
(0.1
88)
(9.3
57)
(0.2
31)
(0.4
55)
Asi
an/N
ativ
e A
mer
ican
-0.1
75-9
.347
-0.2
890.
584
(0.3
06)
(9.5
77)
(0.4
27)
(0.7
12)
Ave
rage
8th
-gra
de m
ath
test
per
cent
ile-0
.002
0.00
0-0
.004
*0.
001
(0.0
01)
(0.0
04)
(0.0
02)
(0.0
03)
Mis
sing
8th
-gra
de m
ath
test
sco
re0.
209
0.52
80.
344
0.09
8
(0.2
38)
(0.5
70)
(0.3
80)
(0.4
39)
Ave
rage
8th
-gra
de r
eadi
ng te
st p
erce
ntile
0.00
3*
0.00
10.
003
0.00
3
(0.0
01)
(0.0
04)
(0.0
02)
(0.0
03)
Mis
sing
8th
-gr
ade
read
ing
test
sco
re-0
.185
-0.7
42-0
.280
0.20
4
(0.2
43)
(0.6
01)
(0.3
76)
(0.4
53)
Has
sib
ling
who
dro
pped
out
0.01
4-0
.042
0.08
4-0
.801
*
(0.0
61)
(0.1
18)
(0.1
00)
(0.4
27)
Is o
vera
ge f
or g
rade
leve
l0.
026
0.00
50.
039
2.77
0
(0.0
79)
(0.1
54)
(0.1
23)
(2.5
09)
(con
tinue
d)
171
170

Tab
le A
.5 (
cont
inue
d)
Var
iabl
e
Full
Stud
y Sa
mpl
eH
igh-
Ris
k Su
bgro
upM
ediu
m-R
isk
Subg
roup
Low
-Ris
k Su
bgro
upPa
ram
eter
Est
imat
e(S
tand
ard
Err
or)
Para
met
erE
stim
ate
(Sta
ndar
d E
rror
)
Para
met
erE
stim
ate
(Sta
ndar
d E
rror
)
Para
met
erE
stim
ate
(Sta
ndar
d E
rror
)
Tra
nsfe
rred
sch
ool 2
or
mor
e tim
es-0
.050
-0.0
34-0
.048
-0.5
13(0
.059
)(0
.111
)(0
.091
)(0
.505
)A
ttend
ance
rat
e0.
000
0.00
00.
000
0.00
00.
000
0.00
00.
000
0.00
0C
redi
ts e
arne
d-0
.015
-0.0
39-0
.138
*0.
228
(0.0
29)
(0.0
43)
(0.0
79)
(0.1
41)
Gra
de p
oint
ave
rage
-0.0
090.
022
0.05
9-0
.186
(0.0
49)
(0.1
40)
(0.0
77)
(0.1
26)
Sam
ple
size
490
110
233
147
Deg
ree
of f
reed
om22
2222
22M
ean
of d
epen
dent
var
iabl
e0.
545
0.57
30.
532
0.54
4R
-squ
are
0.02
70.
144
0.09
50.
123
F-st
atis
tic0.
568
0.66
70.
997
0.79
2p-
valu
e of
F-s
tatis
tic0.
926
0.86
00.
470
0.73
1
SOU
RC
ES:
MD
RC
cal
cula
tions
fro
m C
aree
r A
cade
mie
s E
valu
atio
n St
uden
t Bas
elin
e Q
uest
ionn
aire
Dat
abas
e, S
tude
nt S
choo
l Rec
ords
Dat
abas
e,an
d 12
th G
rade
Ach
ieve
men
t Tes
t Dat
abas
e.
NO
TE
: The
sta
tistic
al s
igni
fica
nce
of p
aram
eter
est
imat
es is
indi
cate
d as
***
= 1
per
cent
; **
= 5
per
cent
; * =
10
perc
ent.
172
BE
STC
OPY
AV
AIL
AB
LE
173

Appendix B
Strategies for Creating Subgroups of StudentsDefined by Characteristics Associated with Risk
of Dropping Out
174

Much of the analysis presented in this report focuses on subgroups of students defined bybackground characteristics and prior school experiences associated with dropping out of highschool. This appendix explains the manner in which these subgroups were created, including therationale behind this strategy and the implications it has for interpreting the findings presented inthis report.
I. Analytic Importance of Subgroup Analysis
A central theme that has emerged from the Career Academies Evaluation thus 'far is thatin order to understand the impact of the programs, it is important to recognize the heterogeneityof the student population and the likelihood that some groups of students may benefit differentlythan others. As discussed in Chapter 3, when the impact results are averaged across the diversegroups of students the Career Academies served, it appears that the programs produced onlyslight reductions in dropout rates and modest improvements in students' progress towardgraduation and increases in participation in youth development activities. These aggregate resultsmask the high degree of variation in the Career Academies' potential to make a difference and inthe actual differences they made for some students. In short, findings that are aggregated acrossthe diverse groups of students served by the Academies are unlikely to reveal many of the mostimportant effects that Academies have. Positive effects for some subgroups of students may beoffset or muted by small or zero impacts for other subgroups.
For example, an important goal of the Career Academies is to reduce dropout rates andincrease students' engagement in school. As noted earlier in the evaluation, Career Academiesserve a broad cross section of students, many of whom enter the programs highly engaged inschool. It is unlikely that the programs will have an effect on dropout rates among these students,who are highly unlikely to drop out of school even if they do not attend an Academy. On theother hand, a number of students in the sample who applied for the Academies were relativelydisengaged from high school and appeared to be at risk of dropping out of high school. To theextent that the Academies can have an effect on dropout rates, it is likely to be concentratedamong these students. The magnitude of this effect could be diluted or even completely hidden ifaveraged with the lack of impact for the rest of the students in the sample.
In order to assess the effect of the Academies more sensitively, therefore, it was neces-sary to differentiate among students with different needs and trajectories at the time they enteredthe Academy. The attempt to make distinctions among groups of individuals with different needsand characteristics, who might experience substantially different benefits from an intervention, isnot uncommon to experimental research in general or to education research in particular. An im-portant goal of these subgroup strategies is often to make distinctions among groups of individu-als who, in the absence of the treatment under study, would have experienced substantially dif-ferent outcomes.
The random assignment research design used in this evaluation provides a unique oppor-tunity to identify subgroups of students who, without access to an Academy, were relativelyhighly likely to drop out of high school and to compare them with similar students who did haveaccess to an Academy. The use of the random assignment research design is relatively rare in thecontext of large-scale evaluations of education programs, particularly at the secondary schoollevel. Not only does such a design provide the unusual opportunity to establish which outcomes
-116 -. 175

would have been observed in the absence of the Academy treatment, but it also provides an op-portunity to observe the relationships between background characteristics and important out-comes in the absence of the intervention.
There are several strategies for identifying subgroups. The following section describes amore traditional approach and highlights several limitations that led to the use of a strategy thatprovides greater insight into the variation in program effects.
II. Traditional Approach to Defini g Subgroups: Risk-FactorAccumulation
One of the strategies most frequently used to define subgroups might be called "risk-factor accumulation." It entails first identifying a list of background characteristics typically as-sociated with an important outcome or with the manner in which the program treatment is likelyto be delivered. A critical outcome for many high school interventions, including the CareerAcademy's approach, is dropping out of high school. A number of education research studieshave identified several background characteristics and prior school experiences that are associ-ated with a high likelihood of dropping out of high school. This includes prior school experi-ences such as poor attendance, low grades, or being held back in a previous grade. It also in-cludes demographic characteristics such as being from a low-income family, having a siblingwho dropped out, or having moved and transferred schools several times.
The risk-factor accumulation strategy classifies students into risk subgroups by countingthe number of risk factors an individual has, weighting all the factors equally. For example, ifone identified six characteristics associated with dropping out, individuals with two or more ofthese characteristics might be considered to be at "high risk" of dropping out; those with onlyone of the characteristics might be considered to be at "moderate" or "medium" risk of droppingout; and those with none of the characteristic factors might be considered at "low risk."
This strategy has the appeal of being straightforward in execution, and it can be translateddirectly into a strategy for targeting students to receive special services. For example, if a par-ticular school intervention were found to prevent students in the high-risk subgroup from drop-ping out, teachers or administrators might wish to ensure that students with two or more of therisk characteristics be included in that program.
At the same time, the accumulation strategy has several important limitations. First, suchan analysis gives equal weight to each of the risk-related background characteristics and priorschool experiences examined. As a result, it does not account for the fact that some characteristicsare more highly associated with school failure than others. This strategy also does not account forthe fact that some characteristics are associated with school success and may offset the risk associ-ated with other characteristics. As a result, it fails to account for the possibility that, given the samenumber of risk factors, different combinations of characteristics may indicate different degrees ofrisk. In other words, because some characteristics are more strongly associated with academic out-comes than others, students with the same number of characteristics may actually be substantiallymore or less likely than one another to drop out of high school. Finally, this strategy is based oncategorical variables and is therefore unable to take advantage of the more subtle distinctionsamong students that are captured by continuous variables.
-117-
176

Because it does not allow for a more complex set of relationships between risk factorsand student outcomes, the simple risk-factor accumulation strategy may fail to produce sub-groups with distinctly different academic trajectories. Therefore, in order to distinguish moreeffectively among subgroups of students who, in the absence of the program, would have ex-perienced distinctly different outcomes, the Career Academies Evaluation employed an impu-tation strategy for identifying subgroups. This is referred to throughout this report as a regres-sion-based subgroup strategy.
III. Regression-Based Subgroup Strategy
A. Overview of the Approach
The basic idea behind the regression-based subgroup strategy is to build on the opportu-nity created by the random assignment experimental design in order to identify the relationshipsbetween background characteristics and student failure in the absence of the Academy interven-tion. Based on these relationships, one then identifies the characteristics of the students who, inthe absence of the program, are most likely to drop out of high school.
The regression-based strategy involves three steps. The first step is to use multiple regres-sion to estimate the relationship between several background characteristics measured at the timestudents applied to the Academy and the probability that they would drop out of high school be-fore the end of the 12th grade. The background characteristics included in the Career AcademiesEvaluation are:
average daily attendance in the year the student applied for an Academy;
grade point average for the year the student applied for an Academy;
the number of credits earned toward graduation in the year the student appliedfor an Academy;
whether the student was overage for grade when entering the Academy;
whether the student had a sibling who dropped out of high school; and
whether the student had transferred schools two or more times beyond thetypical school transitions.
The goal of this analysis is to capitalize on the experimental design and estimate the rela-tionships between background characteristics and dropping out of high school in the absence ofaccess to an Academy. The random assignment research design ensures that the non-Academygroup provides the best counterfactual for what would have occurred to students in the absenceof access to an Academy. Thus, the non-Academy group was used as the basis for this regression.Table B.1 presents the results of this regression analysis. The first column of parameter estimatesreflects the relationship between the dropout rate and a unit change in the background character-istics. Numbers in the second column are standardized to reflect the relationship between thedropout rate and a standard deviation change in the background characteristics. As the table sug-gests, all the characteristics included in this regression model are statistically significant and are
-118-
177

Table B.1
Career Academies Evaluation
Relationship Between Baseline Characteristics and the Probability of Dropping Outof High School Among Non-Academy Students
Baseline CharacteristicCoefficients
Unstandardized Standardized
Sibling dropped out 0.08 *** 0.03 ***(0.03) (0.01)
Overage for grade 0.06 ** 0.02 **(0.03) (0.01)
Transferred schools 2 or more times 0.07 *** 0.03 ***(0.03) (0.01)
Attendance rate in year of random assignment -0.01 *** -0.04 ***(0.00) (0.01)
Credits earned in year of random assignment -0.05 *** -0.05 ***(0.01) (0.01)
Grade point average in year of random assignment -0.03 * -0.02 *(0.02) (0.01)
Intercept 0.94 *** 0.12 ***(0.14) -(0.14)
R-squared 0.10 0.10
Sample size 763 763
SOURCES: MDRC calculations from Student Baseline Questionnaire Database and Student School RecordsDatabase.
NOTES: Estimates are regression-adjusted using ordinary least squares, controlling for backgroundcharacteristics of sample members. Rounding may cause slight discrepancies in calculating differences.
A two-tailed t-test was applied to differences between the Academy and non-Academy groups. In bothcases, statistical significance levels are indicated as *** = 1 percent; ** = 5 percent; * = 10 percent.
related to the probability that students would drop out of high school before the end of the12th grade.'
The second step in this analysis is to combine the coefficients from the regression esti-mates for the non-Academy sample with the background characteristics of each individual in
'Other specifications of this model were tried. However, through an informal process of model specification,this six-variable model was found to be the most sensible and effective. The estimates (below) of the potential dis-tortion caused by the regression-based approach do not take into account any effects of the model specification pro-cess on the impact estimates.
-119-BEST COPY AVAILABLE

both the Academy and the non-Academy groups. In other words, the coefficient estimates fromthe regression are used as weights multiplied by the relevant measured background characteris-tics of each individual. The weighted sum of these characteristics yields an index indicating theprobability of dropping out of high school. This is referred to as the risk index, and it provides abasis for ranking sample members according to the predicted probability that they would dropout of high school.
For example, the parameter estimate associated with having a sibling who dropped out ofschool is .08 (that is, controlling for other background characteristics, students in the evaluationwho had a sibling who already dropped out of high school were predicted to be 8 percentagepoints more likely to drop out of high school). Therefore, students with siblings who dropped outhad .08 added to the index measuring their own risk of dropping out. By the same token, the re-gression estimates indicate that some characteristics are negatively correlated with dropping out.The weights assigned to these characteristics were multiplied by individual attributes and sub-tracted from the risk index.
In the third step of this regression analysis, the Academy and non-Academy students aredivided into three subgroups based on the risk index. Following is a brief definition of each ofthe three risk subgroups.
The high-risk subgroup: the students in the Academy and non-Academygroups with the combination of characteristics yielding scores at or abovethe 75th percentile of scores on the risk index (that is, those with the high-est likelihood of dropping out)
The low-risk subgroup: the students in the Academy and non-Academygroups with the combination of characteristics yielding scores at or belowthe 25'h percentile of scores on the risk index (that is, those with the lowestlikelihood of dropping out)
The medium-risk subgroup: the remaining students in the Academy andnon-Academy groups (approximately 50 percent of the study sample) witha mix of characteristics yielding scores between the 25th and 75th percentileon the risk index (that is, indicating they were not particularly likely todrop out but not necessarily highly engaged in school)2
B. Strengths of the Regression-Based Strategy
There are several important advantages to the regression-based strategy for defining sub-groups. First, it incorporates factors which are both conceptually and empirically related to stu-dents' risk of dropping out of high school. At the same time, because these characteristics weremeasured prior to students' random assignment to the Academy and non-Academy groups, theyare exogenous to the Academy treatment. In other words, while the background characteristicsused to create the subgroups were correlated with the likelihood of dropping out, these charac-teristics did not influence the selection of students into the Academy group.
'The 25th and 75th percentile cutoffs were based on the distribution of the risk index among the non-Academystudents.
-120-
.179

An important question for such an impact analysis is whether, within each subgroup, therandom assignment research design is preserved. In other words, are there systematic differencesbetween the background characteristics of the Academy and non-Academy students within eachsubgroup? To test this, a set of background characteristics is regressed against a dummy variableindicating whether the student was assigned to the Academy group. Appendix A presents the re-sults of this analysis, which revealed that while there are a few differences between the back-ground characteristics of Academy and non-Academy students within each subgroup, f-testsfailed to reject the hypothesis that there are no overall systematic differences between the back-ground characteristics of the Academy and non-Academy students. This suggests that the randomassignment research design was preserved within each subgroup. In other words, the existing dif-ferences are not greater than those which would be expected to occur by chance.
A second strength of this approach is that it incorporates the fact that the relationshipsbetween "risk factors" and student outcomes vary, depending on the background characteristic.For example, the coefficient estimates suggest that the effect of the number of credits earned inthe year prior to random assignment and the effect of baseline attendance on the dropout rate areeach at least twice as large as the effect of a student's baseline grade point average or whether astudent was overage for grade.' Basing the subgroup definitions on these relationships allowsthese differences to be factored into the classification of students into the three risk subgroups.For example, these regression estimates suggest that an average student who had a sibling whohad dropped out and who was overage for grade would have approximately a 24 percent chanceof dropping out of high school before the end of the 126 grade. However, if that same studentalso had 98 percent attendance and was about a standard deviation above the average in terms ofcredits earned, he or she would have only a 16 percent chance of dropping out.4
Moreover, the regression-based strategy is capable of incorporating variation across stu-dents along continuous variables such as attendance and grade point average. Less flexiblestrategies that fail to incorporate these factors would not be as effective at distinguishing amongstudents at different levels of academic risk. For example, an otherwise average student with per-fect attendance (that is, 100 percent) has a 9 percent chance of dropping out; a similar studentwith an attendance rate of 95 percent has a 12 percent chance of dropping out; a student with a 90percent attendance rate has a 15 percent chance of dropping out; and one with 85 percent atten-dance has a 17 percent chance of dropping out. In other words, there appears to be meaningfulvariation in the probability of dropping out that would not be captured by a simple categoricalmeasure of attendance. The regression-based subgroup strategy captures such variation and in-corporates it into the assessment of each student's risk of school failure.
The third and perhaps most important strength of the regression-based strategy is that iteffectively identifies students with distinct academic trajectories. Figure B.1 presents the dropoutrates for Academy and non-Academy students, as well as the difference between their dropout
'Note that these coefficients have been standardized to reflect the effect of a standard deviation change in theindependent variable on the dropout rate, thus making the coefficient estimates directly comparable with one an-other.
'The predicted probability of dropping out for the average student was estimated by multiplying the mean val-ues of the independent variables among the students in the study sample by the coefficients in Table B.1. The esti-mated probabilities for students with the hypothesized characteristics were estimated by substituting the hypothe-sized values for the mean values where appropriate.
-121-
180

Figu
re B
.1
Impa
ct o
f C
aree
r A
cade
mie
s on
Dro
pout
Rat
e, b
y D
ecile
s of
the
Reg
ress
ion-
Bas
ed R
isk
Inde
x
40%
30%
20% 0%
-10%
-20%
E N
on-A
cade
my
Gro
up
CI
Aca
dem
y G
roup
12 I
mpa
ct
11P
M,
111
7--
1
0-10
10-2
020
-30
30-4
040
-50
50-6
060
-70
Dec
iles
of th
e R
egre
ssio
n-B
ased
Ris
k In
dex
70-8
0
80-9
090
-100
SOU
RC
ES:
MD
RC
cal
cula
tions
fro
m C
aree
r A
cade
mie
s E
valu
atio
n St
uden
t Sch
ool R
ecor
ds D
atab
ase
and
12th
Gra
de S
urve
y D
atab
ase.
C.
181
182

rates, at 10 percentile intervals on the regression-based risk index. The black bars represent thepercentage of non-Academy students who dropped out of high school, and the white bars repre-sent the percentage of Academy students who did so. The striped bars represent the differencebetween these two groups, that is, the impact of the Academy treatment on dropout rates. Thepattern in this figure suggests that the risk index very effectively differentiates among studentswith different academic trajectories, and that the relationship between risk and the impact ofAcademies on dropout rates is not isolated to a small segment of the student population.
The figure indicates that both the risk of dropping out and the impact of the program onthis outcome generally increase with the percentiles of the risk index. In particular, the dropoutrate among the non-Academy group appears to increase steadily with the percentiles of the riskindex, and it grows sharply after the 70th percentile. The impact on the dropout rate followsessentially the same pattern. From the 30th percentile through the 90th, the difference betweenthe Academy and non-Academy groups becomes increasingly negative. The magnitude of thisreduction in dropout rates appears to increase dramatically after the 70th percentile, and then itshrinks slightly among students above the 90th percentile of risk. This pattern suggests that, forthe individuals with low to moderate risk of dropping out, the impact of the program on drop-out rates appears to be rather negligible. However, as the risk of academic failure becomesmore serious, the impact of the Academy approach appears to grow. Finally, for those at great-est risk, the impact on dropout rates is substantial, but it is not as great as for those who areslightly less at risk.
In short, this graph illustrates that the regression-based strategy is quite effective at dif-ferentiating among students with different degrees of Academic risk, and that the impact of theAcademies on the dropout rate is strongly related to this definition of academic risk.
Table B.2 illustrates that the regression-based strategy is effective at differentiatingamong students with different trajectories across a variety of school outcomes, and that it is moreeffective than the risk-factor accumulation strategy for making these distinctions. The table pres-ents several key measures of student performance during high school for the non-Academy stu-dents within each risk subgroup. The first panel of the table presents non-Academy outcome lev-els and estimated impacts based on the risk-factor accumulation approach, and the second panelpresents these estimates based on the regression-based approach to defining subgroups. As thetable illustrates, the regression-based strategy does a better job of making distinctions amongstudents with different levels of academic risk.
According to the estimates generated by the regression-based approach, while 32 percentof the non-Academy students in the high-risk subgroup dropped out of high school before theend of the 12th grade, 8 percent in the medium-risk subgroup dropped out, and less than 3 percentin the low-risk subgroup did so. Moreover, while only 27 percent of the non-Academy studentsin the high-risk subgroup earned enough credits to graduate from high school, 65 percent in themedium-risk subgroup and 75 percent in the low-risk subgroup did so. Similar patterns werefound for most other measures as well. This indicates that, without access to a Career Academy,the students in the different risk subgroups would have had substantially different outcomes.
Table B.2 also provides outcome levels and estimated impacts for subgroups based on therisk-factor accumulation approach. Not surprisingly, these estimates are not as distinct from oneanother as the estimates generated by the regression-based approach. For example, 22 percent of
-123-1 8 3

Table B.2
Career Academies Evaluation
Selected Outcomes Among Non-Academy Students,by Risk Subgroups Defined Using Risk-Factor
Accumulation and Regression-Based Index
Accumulation Approach Regression-Based Approach
OutcomeNon-AcademyOutcomes (%) Impact
Non-AcademyOutcomes (%) Impact
High -risk subgroup
27.4 -5.6 * 32.3 -11.4 ***Dropped out of high school
Earned credits to graduate 34.1 10.0 ** 27.0 12.8 ***
Completed basic academic core 9.9 9.1 * 5.6 8.0 *
Reported any negative risk-taking 36.9 -5.9 38.9 -3.8
Reported positive youth development 56.8 8.7 * 54.9 8.0
Medium-risk subgroup
Dropped out of high school 9.3 -2.0 7.9 0.9
Earned credits to graduate 66.2 -0.6 64.8 0.8
Completed basic academic core 31.0 -2.7 30.3 -1.2
Reported any negative risk-taking 23.1 0.5 25.7 -2.2
Reported positive youth development 67.5 4.1 69.7 1.6
Low-risk subgroup
Dropped out of high school 4.2 0.5 2.8 -1.2
Earned credits to graduate 69.5 8.4 ** 74.8 12.9 **
Completed basic academic core 33.9 0.9 36.6 4.5
Reported any negative risk-taking 22.0 -2.1 15.8 -1.0
Reported positive youth development 75.4 0.8 75.5 6.3
SOURCES: MDRC calculations from Career Academies Evaluation Student School Records Database and 12thGrade Survey Database.
NOTES: Estimates are regression-adjusted using ordinary least squares, controlling for background characteristicsof sample members. Rounding.may cause slight discrepancies in calculating differences.
A two-tailed t-test was applied to differences between the Academy and non-Academy groups. In both cases,statistical significance levels are indicated as *** = 1 percent; ** = 5 percent; * = 10 percent.
-124-
184

students in the "high-risk" subgroup dropped out of high school before the end of the 12th grade,compared with 7 percent in the "medium-risk" subgroup and 5 percent in the "low-risk" sub-group. Moreover, 44 percent in the "high-risk" subgroup earned enough credits to graduate,compared with 66 and 78 percent in the "medium-risk" and "low-risk" subgroups, respectively.
These patterns in outcome levels among students who weren't exposed to the Academytreatment suggest that the regression-based strategy is the more effective means for defining sub-groups of Career Academy students with substantially different academic trajectories. Interest-ingly, the impact estimates suggest that while the estimates generated by the regression-basedapproach tend to be somewhat larger, their pattern is similar to the pattern of estimates based onthe risk-factor accumulation model. For example, among students in the high-risk subgroup, boththe regression-based approach and the risk-factor accumulation approach found that Academiessignificantly reduced dropout rates, increased credits earned toward graduation, and increased thepercentage of students who completed a core academic curriculum. So while the regression-based approach was more effective at identifying students who, in the absence of the Academytreatment, would have had substantially different outcomes, it did not distort the basic pattern ofimpacts generated by the experiment.
C. Potential Limitations of the Regression-Based Approach
While the regression-based strategy is more effective than the risk-factor accumulationstrategy at identifying students who were likely to experience different academic trajectories inthe absence of the Academy, it has some potentially important limitations. First, although it ismore systematic, it is also less straightforward than the risk-accumulation strategy in terms ofthe manner by which subgroups of students might be identified by school administrators. Inparticular, to the extent that these subgroup findings might be used to target program resourcestoward particular individuals, the subgroups defined using the regression-based strategy mightbe more difficult to identify than subgroups based on a simple accumulation approach. Whileit is unclear that the implications of the findings from this particular study suggest that target-ing would be advantageous, such thinking may be a factor when applying this strategy to thestudy of programs in which the implications of targeting are less ambiguous. Although it is notdiscussed in this appendix, the regression-based approach can be applied in a practical way andmay, in fact, be a more systematic way of targeting resources toward students most likely tobenefit from them. For example, this type of approach has been used in research designed todevelop approaches for the targeting of benefits and associated employment services to work-ers eligible for unemployment insurance as well as for targeting employment resources to in-dividuals in welfare-to-work programs. In particular, several of these programs have used his-torical data to estimate the relationship between background characteristics and policy-relevantoutcomes, and then to combine these estimates with individual characteristics in order to pre-dict outcomes and target services. This has been done in welfare-to-work programs in Michi-gan as well as in unemployment programs in Michigan, New Jersey, and Washington(O'Leary, Decker, and Wadner, 1998; Eberts, 1997).
A more important potential limitation of the regression-based subgroup strategy is relatedto the manner in which the strategy generates weights relating background characteristics to risk.In short, theoretically, the strategy has the potential to overstate any positive impacts of the pro-gram on the high-risk subgroup and to overstate the magnitude of any negative impacts on thelow- and medium-risk subgroups.
-125-
185

The problem has its genesis in the fact that the regression parameter estimates that areused as weights to translate student characteristics into academic risk are the result of estimatesthat are specific to the non-Academy group. In a sample from any population, estimated regres-sion coefficients reflect both the relationships that exist in the population and a random elementthat is specific to that sample. In other words, on average, each coefficient from such a randomsample is unbiased. However, it is highly unlikely that, in any given sample, the estimated re-gression coefficient will exactly equal the true regression coefficient from the entire populationfrom which that sample is drawn. Therefore, the regression estimates from the non-Academygroup include some random error that is particular to the non-Academy group and that is corre-lated with the outcome in question in this case, whether or not a student dropped out beforethe end of the 12th grade.
For example, Equation 1 is a simple regression predicting dropout from a set of back-ground characteristics for a sample of students drawn from the population of students who ap-plied to a Career Academy:
where:
Y. = a + e, (1)
Y, = 1 if student i dropped out; 0 otherwise;
X. = 1 if student i had ever been held back; 0 otherwise (this could be any impor-tant background characteristic);
= the intercept term, that is, the average outcome ( Y, ) among those where X = 0;and
= the estimated relationship between X. and y , that is, the estimated effect ofX, on the probability that a student drops out of high school.
In this case, it would also be true that:
where:
13
RS =
113+13.s. (2)
the true relationship between X and Yin the population from which our samplewas drawn; and
the difference (or error) between the relationship between X and Y in thepopulation from which the sample was drawn and the relationship between X
-126- 186

and Y in the sample, that is, the element of the estimate which is idiosyncraticto the particular sample.
While 13 is a characteristic of the population and does not change from sample to sample,13s is particular to the sample upon which the regression is estimated, and it will vary from sam-
ple to sample. As a result, while 13 never changes, 13 will vary from sample to sample. Further-more, it is also highly unlikely that the random error in a coefficient estimated from one sampledrawn from a population will be exactly the same as the random element in any other sampledrawn from the same population.
The students in the Career Academies evaluation sample were assigned to the Academyor non-Academy groups at random; therefore, one can have a high degree of confidence thatthere are no systematic differences between these two groups in terms of observable or unobserv-able characteristics. They can be thought of as two random samples drawn from the same popu-lation of students at these sites who applied to and were eligible for the Career Academies. Whilethe program may have changed the relationships between background characteristics and theprobability of dropping out, the underlying relationship between background characteristics andthe likelihood of dropping out in the absence of the Academy intervention (13) is the same forthese two groups.
However, even in the absence of the Academy program, it is unlikely that the estimatedcoefficients relating the background characteristics to the dropout rate among the students whoended up in the program group would have been exactly the same as those in the non-Academygroup. In other words, while the underlying relationship between background characteristics andthe probability of dropping out (13) would not vary across these two samples, the idiosyncraticelement (or error term) of the estimated relationship (Rs), and therefore the estimated relation-
ship itself ( (3 ), would vary.
Therefore, it is highly unlikely that the estimated relationship between background char-acteristics and dropout would have been exactly the same among the Academy group as it wasamong their non-Academy group counterparts. Because the regression weights were generatedfrom the non-Academy group, the regression-based strategy might more accurately distinguishamong students with different levels of academic risk for this group than it does for the Academygroup. In other words, the risk index might distinguish different levels of risk more effectivelyamong non-Academy students that it does among Academy group students.
This creates the possibility that, although their observable characteristics were the same,students in the "high-risk" non-Academy group were actually more at risk than students in the"high-risk" Academy group. It also creates the possibility that students in the "low-risk" non-Academy group were actually less at risk than students in the "low-risk" Aademy group.
To the extent that this occurred, it would result in overstating positive impacts for thehigh-risk subgroups and overstating the magnitude of negative impacts for the "low-risk" sub-groups. However, as the next section will reveal, the magnitude of this potential distortion can beestimated. Furthermore, the magnitude of the distortion appears to be minimal, and it is not largeenough to have a meaningful effect on the overall pattern of impact estimates.
-127-
1 8.7

IV. Magnitude of Potential Distortion in the Regressions-Based Approach
In order to understand whether this potential limitation outweighs the analytic advantagesof the regression-based approach discussed earlier, it is important to estimate the magnitude ofthe potential distortion.
Theoretically, in order to estimate the magnitude of this distortion, one would like tocompare the outcomes of the students within each risk category in the non-Academy group withwhat would have been observed among the Academy students in the same risk subgroup in theabsence of the treatment. However, because the Academy group received the treatment and thetreatment may have actually affected these outcomes, this comparison cannot be made. The idealbasis for such a comparison would be a second non-Academy group that was neither used in or-der to estimate the dropout regression nor exposed to the program. In the absence of any distor-tion, one would expect that, within each risk subgroup, the outcomes for the students in this sam-ple would be identical to the outcomes for these in the original non-Academy group. Therefore,any differences between outcomes for these students and outcomes for the original non-Academygroup could be confidently attributed to the distortion created by the regression-based strategy.
Although a second non-Academy group for this study is not available, a strategy for esti-mating the potential distortion in the original estimates is to use bootstrap sampling in order tosimulate a second sample. Bootstrap sampling is commonly used to generate estimates of stan-dard errors and other population characteristics from relatively small samples (Stine, 1990). Itrests on the assumption that the sample from which the observations are drawn is representativeof the population as a whole. In this case, to the extent that the initial non-Academy group can bethought of as representative of the population of students from whom the evaluation sample wasdrawn, bootstrap sampling procedures can be used to simulate new samples of non-Academygroup students.' Within each subgroup, these samples can be used in order to compare the out-comes for the students on whom the dropout regression was based with the outcomes for a sam-ple of students who were not included in this regression. These differences would constitute areliable estimate of the distortion created by the regression-based subgroup strategy.
The mechanics of this process are as follows:
1. Use a random number generator to draw a bootstrap sample of students the size of theoriginal non-Academy group, sampling with replacement the observations from theoriginal non-Academy group sample.
a. Use a random number generator to select an observation from the originalnon-Academy group.
b. Copy that observation to a new data set.
c. Replace that observation into the sampling frame from which it was drawn(the original non-Academy group sample).
d. Repeat steps a through c until the new sample equals the size of the originalnon-Academy group (n=805 times). This sample will be referred to as themodel group.
-128- 1 88

This creates a sample which is the same size as the original non-Academysample and which, theoretically, is drawn from the same population.' How-ever, this sample is not the same as the non-Academy group, because steps athrough d typically create a sample which omits several ob: ;rvations from theoriginal sample and creates multiple copies of other observe ions.
2. Use this bootstrap sample to estimate the relationship bccween the six back-ground characteristics used to define academic risk and the probability that astudent will drop out of high school prior to the end of the 12th grade.
3. Repeat steps la through I d to draw (with replacement) a second bootstrapsample, the size of the Academy group, from the original non-Academy sam-ple. This sample will be referred to as the non-model group.
4. Repeat steps 1 a through 1 d once more, this time drawing from the Academysample, to produce a bootstrap sample of students from each risk subgroupwho received the Academy treatment. This sample will be referred to as thesimulated Academy group.
5. Apply the coefficients from the regression model to the background charac-teristics of the individuals in all three bootstrap samples in order to create therisk index.
6. Use the 25th and 75th percentiles of the risk index in the first bootstrap sample(the model group) in order to divide the samples into high-, medium-, andlow-risk subgroups.
7. Compare the average outcomes from the model group with those from thesecond bootstrap sample (the non-model group). The difference between thetwo groups represents the distortion created by the regression-based strategy.
8. Repeat steps 1 through 7 another 200 times. The average difference acrossthese iterations between the subgroup outcomes for the model group and thenon-model group provides a bootstrap estimate of the potential distortion cre-ated by the regression-based subgroup strategy. The average levels acrossthese iterations among the simulated Academy group represents a bootstrapestimate of the outcome levels among the Academy students.
Table B.3 presents the results of this estimation process for five key outcomes. The num-bers in this table represent the average outcomes of 200 iterations of the bootstrap process de-scribe above. As such, they are intended to simulate what one would expect to observe if one re-peated the experimental analysis contained in the report 200 times, with 200 different samplesfrom the same population. The first column of the table presents the average outcomes amongstudents from the bootstrap samples upon which the dropout regression was estimated (the modelgroup). The numbers in this column represent the outcome levels one would expect to observe as
'In particular, this replaces the unknown theoretical distribution of the population from which the non-Academygroup is drawn with the empirical distribution of the non-Academy sample itself.
-129
189

Table B.3
Career Academies Evaluation
Outcome Levels for Bootstrap Control Samples and Program Group,by Risk Subgroups
Outcome
ModelGroup
(%)
Non-ModelGroup
(%)
ModelMinus
Non-Model
ProgramGroup
(%)
ProgramMinusModel
ProgramMinus
Non-Model
High-risk subgroup
Dropped out of high school 31 30.3 0.7 ** 20.7 -10.3 -9.6
Earned credits to graduate 28.5 28.6 -0.1 40.2 11.7 11.6
Completed basic academic core 7.3 7.2 0.1 15.3 8 8.1
Reported any negative risk-taking 39.5 39 0.5 32.9 -6.6 -6.1
Reported positive youth development 55.4 56.1 -0.7 * 64.5 9.1 8.4
Medium-risk subgroup
Dropped out of high school 8.4 8.9 -0.5 *** 9 0.6 0.1
Earned credits to graduate 63.4 63.4 0 65.6 2.2 2.2
Completed basic academic core 28.9 29 -0.1 28.2 -0.7 -0.8
Reported any negative risk-taking 25.3 25.1 0.2 24.2 -1.1 -0.9
Reported positive youth development 68.6 68.8 -0.2 70.6 2 1.8
Low-risk subgroup
Dropped out of high school 2.8 2.9 -0.1 2.2 -0.6 -0.7
Earned credits to graduate 75.8 76.1 -0.3 84.9 9.1 8.8
Completed basic academic core 36.7 36.6 0.1 39 2.3 2.4
Reported any negative risk-taking 16.8 16.7 0.1 15.7 -1.1 -1
Reported positive youth development 77.2 76.8 0.4 80.3 3.1 3.5
SOURCES: MDRC calculations from Career Academies Evaluation Student School Records Database and 12th GradeSurvey Database.
NOTES: Estimates are regression-adjusted using ordinary least squares, controlling for background characteristics ofsample members. Rounding may cause slight discrepancies in calculating differences.
A two-tailed t-test was applied to differences between the model and non-model groups. In both cases, statisticalsignificance levels are indicated as *** = 1 percent; ** = 5 percent; * = 10 percent.
a result of the regression-based approach among the sample of non-Academy students on whomthe regression was fit.
Column 2 of Table B.3 presents the average outcomes among students from the bootstrapsamples which were not used for this regression (the non-model group). The numbers in this col-umn represent the pattern of outcomes one would expect to observe if one had a sample of non-
-130-
190

Academy students who were not the basis for the regression model but for whom the coefficientsfrom the regression-based strategy were combined with individual characteristics in order to es-timate the risk of school failure.
The third column of Table B.3 presents the differences between the two averages for themodel and non-model groups. Because the second column of estimates is not affected by the po-tential distortion described above, these numbers represent the estimate of the potential distortioncreated by the regression-based strategy for each outcome.
The fourth column of Table B.3 presents the average outcomes for the high-, medium-,and low-risk subgroups from the simulated Academy (program) group. The fifth column presentsthe average differences between the simulated Academy group and the model group from column1. This represents a bootstrap estimate of the program impact. The sixth column presents the av-erage differences between the simulated Academy group and the non-model group from column2. This represents a bootstrap estimate of the program impact, absent any distortion created bythe regression-based subgroup strategy.
The estimates in Table B.3 suggest that the magnitude of the distortion created by the re-gression-based subgroup strategy is not large enough to have a meaningful effect on the patternof impacts described in the report. In particular, for each of the outcomes in this table, the esti-mated distortion appears to be less than 1 percentage point. For example, the first row of the ta-ble presents the bootstrap estimates of the dropout rate for the high-risk subgroup. Inasmuch aswhether or not a student dropped out of high school was the dependent variable in the regressionused to define the subgroups, the potential magnitude of the distortion should be largest with re-spect to that outcome. However, the estimate in this row suggests that the potential distortion inthe impact estimate is seven-tenths of 1 percentage point. In particular, across 200 replications,the average dropout rate for the high-risk sample from the model group is 31 percent, while theaverage for the sample that was not used to estimate the regression (from the non-model group)is 30.3 percent, a difference of .7 percentage points.'
Columns 4 and 5 of Table B.3 indicate that subtracting the potential distortion does notresult in a meaningfully different estimate of the program impact. In particular, the estimate ofthe impact and the estimate of the impact minus any potential distortion appear to be withinrounding error of one another. Moreover, the other estimates in this table reveal a similar pattern.The estimated distortion is never larger than seven-tenths of a percentage point, and the patternof effects in the impact estimates is not substantially different from the pattern of effects in thecolumn estimates that account for the distortion. This suggests that, while the regression-basedsubgroup strategy has theoretical limitations, the limitations do not have any meaningful effecton the pattern of impacts presented in this report.
'An alternate estimate of the distortion was generated by performing what might be called a randomization test.This entailed taking the entire evaluation sample, including Academy and non-Academy students, and randomlyassigning them to two groups. The dropout regression was then estimated within one group, and the coefficientswere used to generate an index and divide the sample into risk categories in both groups. The difference between theoutcomes for these groups would represent an alternative estimate of the distortion. After performing this process200 times, it was found that this alternative method yielded a pattern of estimated distortion similar to that producedby the initial method. In particular, the estimated distortion on the dropout variable was 1.3 percentage points, andthe estimated distortion on all other variables was smaller than that.
-131 -
191

The asterisks in the table indicate the results of statistical significance tests regarding thedifferences between the model and non-model groups. They suggest that, across the five out-comes and three subgroups considered, the estimated distortion created by the regression-basedsubgroup strategy was statistically significant in only three cases. In particular, for the high-risksubgroup, the estimated distortion created with respect to the dropout variable and the percentageof students who participated in positive youth development activities was significantly differentfrom zero. For the medium-risk subgroup, the distortion created regarding the dropout rate wasalso statistically significant. The estimated distortion across all other outcomes was not signifi-cantly different from zero.
This pattern, combined with the magnitude of the effects, suggests two conclusions. First,the estimated distortion created by the regression-based subgroup strategy appears to convergearound some non-zero number, but that effect does not appear to be large enough to affect thebasic pattern of impacts. Second, the distortion appears to be restricted mainly to the outcomevariable that was the basis for defining the subgroups, and it was concentrated within the high-risk subgroup.
V. Conclusions
The evidence and discussion in this appendix strongly support the idea that accountingfor the heterogeneity of students in the Career Academies Evaluation is an important element ofany strategy designed to assess the impact of the Academies on the diverse group of studentsthey serve. Impact estimates which aggregate results across students with different academic tra-jectories conceal a substantial amount of variation across students in the effects of the Academieson key outcomes. Therefore, in order to assess the effects of Career Academies more sensitively,it is necessary to develop a strategy for differentiating among students who, in the absence of theAcademy treatment, would experience different academic outcomes.
Traditional approaches toward defining subgroups go part of the way toward differenti-ating among students with different academic trajectories. However, the experimental design pre-sent in the Career Academies Evaluation provides a rare opportunity to improve on these strate-gies by estimating the relationship between student characteristics and the likelihood of schoolfailure in the absence of the Academy treatment.
This regression-based approach offers a number of distinct advantages over its alterna-tives, and its potential limitations are highly unlikely to change the pattern of any of the find-ings. The regression-based approach takes multiple factors into account, weighting them ac-cording to the strength of their effect on student failure. It also allows the use of all relevantvariation in student characteristics in order to estimate risk, as opposed to classifying studentson the basis of arbitrary cutoffs in otherwise continuous measures of risk. Most important, it isa highly effective strategy for identifying students who, in the absence of the Academy inter-vention, would have had substantially different outcomes. As a result, it reveals differences inthe effects of Career Academies that would be masked by impacts which are averaged acrossthe entire population of Academy students and would be at least partly masked by tradi-tional approaches to defining subgroups.
192-132-

The major drawback of the regression-based strategy is that it has the potential to gen-erate a distortion in the impact estimates that would overstate the impact of the Academies onstudents in the high-risk subgroup. However, the best estimates of the potential distortion inimpact estimates suggest that its magnitude is negligible. In particular, the estimates suggestthat the distortion, at it largest, is seven-tenths of a percentage point. Moreover, any distortionwhich exists appears to be concentrated within the high-risk subgroup and to be restricted pri-marily to one outcome. In other words, both the magnitude and pattern of distortion suggestthat this phenomenon is neither large nor pervasive enough to affect the overall pattern of im-pacts presented in the report.
-133- -1 $3

References
Academy for Educational Development. 1989. Partnerships for Learning: School Completion andEmployment Preparation in the High School Academies. New York: Academy for EducationalDevelopment.
Academy for Educational Development. 1990. Employment and Educational Experiences of Academy ofFinance Graduates. New York: Academy for Educational Development.
Berryman, Sue. 1991. Cognitive Science: Indicting Today's Schools and Designing Effective LearningEnvironments. Washington, DC: U.S. Department of Labor, National Council on VocationalEducation and Employment and Training Administration.
Bloom, Howard S. 1984. "Accounting for No-Shows in Experimental Evaluation Designs." EvaluationReview 8 (2): 225-246.
Dayton, Charles. 1997. California Partnership Academies: 1995-96 Evaluation Report. Nevada City, CA:Foothill Associates.
Dewey, John. 1916. Democracy and Education: An Introduction to the Philosophy of Education. New York.Macmillan.
Friedlander, Daniel. 1988. Subgroup Impacts and Performance Indicators for Selected Welfare EmploymentPrograms. New York: Manpower Demonstration Research Corporation.
Hanser, Lawrence, M. Elliott, and C. Gilroy. 1999. Career Academies: Evidence of Positive StudentOutcomes. Santa Monica, CA: Rand Corporation.
Hanser, Lawrence, and Cathleen Stasz. 1999. "The Effects of Enrollment in the Transportation CareerAcademy Program on Student Outcomes." Unpublished paper. Santa Monica, CA: RandCorporation.
Kemple, James J. 1997a. Career Academies: Communities of Support for Students and TeachersEmerging Findings from a 10-Site Evaluation. New York: Manpower Demonstration ResearchCorporation.
Kemple, James J. 1997b. "Selected Dimensions of Applied Learning in Career Academy Classrooms."Unpublished paper. New York: Manpower Demonstration Research Corporation.
Kemple, James J., Susan M. Poglinco, and Jason C. Snipes. 1999. Career Academies: Building CareerAwareness and Work-Based Learning Activities Through Employer Partnerships. New York:Manpower Demonstration Research Corporation.
Kemple, James, and JoAnn Leah Rock. 1996. Career Academies: Early Implementation Lessons from a 10-Site Evaluation. New York: Manpower Demonstration Research Corporation.
Linnehan, Frank. 1996. "Measuring the Effectiveness of a Career Academy Program from an Employer'sPerspective." Educational Evaluation and Policy Analysis 18 (1):73-89.
Maxwell, Nan, and Victor Rubin. 1997. The Relative Impact of a Career Academy on Post-Secondary Workand Education Skills in Urban, Public High Schools. Hayward, CA: Human Investment Researchand Education Center.
Maxwell, Nan, and Victor Rubin. 1999. Improving the Transition from School to Work: Assessing theImpact of Old and New Strategies. Hayward, CA: Human Investment Research and EducationCenter.
-134-
194

National Center for Education Statistics (NCES). 1990. National Education Longitudinal Study of 1988: AProfile of the American Eighth Grade NELS: 88 Student Descriptive Summary. Washington, DC:U.S. Government Printing Office.
National Center for Education Statistics (NCES). 1992. National Education Longitudinal Study of 1988:Characteristics of At-Risk Students in NELS: 88. Washington, DC: U.S. Government Printing Office.
National Center for Education Statistics (NCES). 1995. National Education Longitudinal Study of 1988:Second Follow-Up: Transcript Component Data File User's Manual. Washington, DC: U.S.Government Printing Office.
Natriello, Gary, ed. 1987. School Dropouts: Patterns and Policies. New York: Teachers College Press.
Office of Technology Assessment (OTA), U.S. Congress. 1995. Learning to Work: Making the Transitionfrom School to Work (OTA-EHR-637). Washington, DC: U.S. Government Printing Office.
On, Larry, Howard Bloom, Stephen Bell, Fred Doolittle, Winston Lin, and George Cave. 1996. DoesTraining for the Disadvantaged Work? Washington, DC: Urban Institute Press.
Pauly, Edward, Hilary Kopp, and Joshua Haimson. 1995. Home-Grown Lessons: Innovative ProgramsLinking School and Work. San Francisco: Jossey-Bass.
Raizen, Senta. 1989. Reforming Education for Work: A Cognitive Science Perspective. Berkeley: NationalCenter for Research in Vocational Education, University of California at Berkeley.
Reller, D. 1987. A Longitudinal Study of the Graduates of the Peninsula Academies, Final Report. PaloAlto, CA: American Institutes for Research in the Behavioral Sciences.
Resnick, Lauren. 1987. Education and Learning to Think. Washington, DC: National Academy Press.
Roderick, Melissa. 1993. The Path to Dropping Out: Evidence for Intervention. Westport, CT: AuburnHouse.
Snyder, Phyllis, and Bernard McMullan. 1987. Allies in Education: A Profile of Philadelphia High SchoolAcademies. Philadelphia: Public/Private Ventures.
Stasz, Cathleen. 1999. "Students' Perceptions of Their Work-Based Learning Experiences: A Comparisonof Four Programs." Unpublished paper. Santa Monica, CA: Rand Corporation.
Stern, David, Charles Dayton, Il-Wu Paik, and Allen Weisberg. 1989. "Benefits and Costs of DropoutPrevention in a High School Program Combining Academic and Vocational Education: Third-YearResults from Replications of the California Peninsula Academies." Educational Evaluation andPolicy Analysis 11(4): 405-416.
Stern, David, Charles Dayton, and Marilyn Raby. 1998. Career Academies and High School Reform.Berkeley: Career Academy Support Network, University of California at Berkeley.
Stern, David, Marilyn Raby, and Charles Dayton. 1992. Career Academies: Partnerships for ReconstructingAmerican High Schools. San Francisco: Jossey-Bass.
Stern, David, Neal Finkelstein, James Stone III, John Latting, and Carolyn Dornsife. 1994. Research onSchool-to-Work Transition Programs in the United States. Berkeley, CA: National Center forResearch in Vocational Education, University of California at Berkeley.
-135-
15

Recent Publications on MDRC Projects
Note: For works not published by MDRC, the publisher's name is shown in parentheses. A complete publicationslist is available from MDRC and on its Web site (www.mdrc.org), which also contains copies of MDRC'spublications.
Education ReformCareer AcademiesThe largest and most comprehensive evaluation of a school-to-work initiative, this 10-site study examines apromising approach to high school restructuring and the school-to-work transition.
Career Academies: Early Implementation Lessons from a 10-Site Evaluation. 1996. James Kemple, JoAnn LeahRock.
Career Academies: Communities of Support for Students and Teachers Emerging Findings from a 10-SiteEvaluation. 1997. James Kemple.
Career Academies: Building Career Awareness and Work-Based Learning Activities Through EmployerPartnerships. 1999. James Kemple, Susan Poglinco, Jason Snipes.
School-to-Work ProjectA study of innovative programs that help students make the transition from school to work or careers.
Home-Grown Lessons: Innovative Programs Linking School and Work (Jossey-Bass Publishers). 1995. EdwardPauly, Hilary Kopp, Joshua Haimson.
Home-Grown Progress: The Evolution of Innovative School-to-Work Programs. 1997. Rachel Pedraza, EdwardPauly, Hilary Kopp.
Project TransitionA demonstration program that tested a combination of school-based strategies to facilitate students' transition frommiddle school to high school.
Project Transition: Testing an Intervention to Help High School Freshmen Succeed. 1999. Janet Quint, CynthiaMiller, Jennifer Pastor, Rachel Cytron.
Equity 2000Equity 2000 is a nationwide initiative sponsored by the College Board to improve low-income students' access tocollege. The MDRC paper examines the implementation of Equity 2000 in Milwaukee Public Schools.
Getting to the Right Algebra: The Equity 2000 Initiative in Milwaukee Public Schools. 1999. Sandra Ham, EricaWalker.
they Programs for Youth
The JO START Demonstration
A test of a program combining education, training, support services, and job placement for very disadvantagedyoung high school dropouts.
JOBSTART: Final Report on a Program for School Dropouts. 1993. George Cave, Hans Bos, Fred Doolittle, CyrilToussaint.
The Career Beginnings Evaluation
An evaluation of a program that seeks to increase college attendance and improve job quality among disadvantagedhigh school students.
Career Beginnings Impact Evaluation: Findings from a Program for Disadvantaged High School Students. 1990.George Cave, Janet Quint.
Note: For works not published by MDRC, the publisher's name is shown in parentheses.
-136-
196

The Youth Incentive Entitlement Pilot Projects (YIEPP) Demonstration
A test of a school-conditioned job guarantee for low-income youth.
Lessons from a Job Guarantee: The Youth Incentive Entitlement Pilot Projects. Monograph. 1984. Judith Gueron.
Teen Parents on WelfareTeenage Parent Programs: A Synthesis of the Long-Term Effects of the New Chance Demonstration, Ohio's
Learning, Earning, and Parenting (LEAP) Program, and the Teenage Parent Demonstration (TPD). 1998. RobertGranger, Rachel Cytron.
Ohio's LEAP ProgramAn evaluation of Ohio's Learning, Earning, and Parenting (LEAP) Program, which uses financial incentives toencourage teenage parents on welfare to stay in or return to school.
LEAP: Final Report on Ohio's Welfare Initiative to Improve School Attendance Among Teenage Parents. 1997.Johannes Bos, Veronica Fellerath.
New Chance Demonstration
A test of a comprehensive program of services that seeks to improve the economic status and general well-being ofa group of highly disadvantaged young women and their children.
New Chance: Final Report on a Comprehensive Program for Young Mothers in Poverty and Their Children. 1997.Janet Quint, Johannes Bos, Denise Polit.
Parenting Behavior in a Sample of Young Mothers in Poverty: Results of the New Chance Observational Study.1998. Martha Zaslow, Carolyn Eldred, editors.
BEST COPY AVAILABLE
-137- 197m ss
I t.

About MDRC
The Manpower Demonstration Research Corporation (MDRC) is a nonprofit,nonpartisan social policy research organization. We are dedicated to learning whatworks to improve the well-being of low-income people. Through our research andthe active communication of our findings, we seek to enhance the effectiveness ofsocial policies and programs. MDRC was founded in 1974 and is located in NewYork City and San Francisco.
MDRC's current projects focus on welfare and economic security, education, andemployment and community initiatives. Complementing our evaluations of a widerange of welfare reforms are new studies of supports for the working poor andemerging analyses of how programs affect children's development and theirfamilies' well-being. In the field of education, we are testing reforms aimed atimproving the performance of public schools, especially in urban areas. Finally, ourcommunity projects are using innovative approaches to increase employment inlow-income neighborhoods.
Our projects are a mix of demonstrations field tests of promising program modelsand evaluations of government and community initiatives, and we employ a wide
range of methods such as large-scale studies to determine a program's effects,surveys, case studies, and ethnographies of individuals and families. We share thefindings and lessons from our work including best practices for program operators
with a broad audience within the policy and practitioner community, as well as thegeneral public and the media.
Over the past quarter century, MDRC has worked in almost every state, all of thenation's largest cities, and Canada. We conduct our projects in partnership with stateand local governments, the federal government, public school systems, communityorganizations, and numerous private philanthropies.
198

MDRC
16 East 34 StreetNew York, New York 10016(212) 532-3200www.mdrc.org
88 Kearny Street, Suite 1800San Francisco, California 94108(415) 781-3800
199

U.S. Department of EducationOffice of Educational Research and Improvement (OERI)
National Library of Education (NLE)Educational Resources Information Center (ERIC)
NOTICE
Reproduction Basis
IC
This document is covered by a signed "Reproduction Release(Blanket)" form (on file within the ERIC system), encompassing allor classes of documents from its source organization and, therefore,does not require a "Specific Document" Release form.
11This document is Federally-funded, or carries its own permission toreproduce, or is otherwise in the public domain and, therefore, maybe reproduced by ERIC without a signed Reproduction Release form(either "Specific Document" or "Blanket").
EFF-089 (3/2000)