reproducibility of a soil organic carbon fractionation method to derive rothc carbon pools
TRANSCRIPT
European Journal of Soil Science, 2013 doi: 10.1111/ejss.12088
Reproducibility of a soil organic carbon fractionationmethod to derive RothC carbon pools
C . P o e p l a ua , A . D o na , M . D o n d i n ib , J . L e i f e l dc , R . N e m od , J . S c h u m a c h e re ,N . S e n a p a t i f & M . W i e s m e i e rg
aThuenen Institute for Agricultural Climate Research, Bundesallee 50, 38106, Braunschweig, Germany, bInstitute of Biological andEnvironmental Sciences, School of Biological Sciences, University of Aberdeen, 23 St Machar Drive, Aberdeen AB24 3UU, UK,cAgroscope Reckenholz-Tanikon Research Station ART, Zurich 8046, Switzerland, dINRA Clermont-Ferrand, Site de Crouel, UREP 5,Chemin de Beaulieu, Clermont-Ferrand Cedex, France, eInstitute for Stochastics, Friedrich Schiller University, 07751 Jena, Germany,fSchool of Environment and Rural Science, University of New England, Armidale, New South Wales 2351 Australia, and gLehrstuhl furBodenkunde, Wissenschaftszentrum Weihenstephan fur Ernahrung, Landnutzung und Umwelt, Technische Universitat Munchen, 85354,Freising, Germany
Summary
Fractionation of soil is undertaken to isolate organic carbon with distinct functional properties, such as stabilityand turnover times. Soil organic carbon (SOC) fractionation helps us to understand better the response of SOCto changes in land use, management or climate. However, fractionation procedures are often poorly defined andthere is little information available on their reproducibility in different laboratories. In a ring trial, we assessedthe reproducibility of a SOC fractionation method introduced by Zimmermann et al. (2007). The isolatedfractions were linked to the model pool sizes of the Rothamsted carbon model (RothC). We found significantdifferences between six laboratories for all five defined fractions in three different soils with coefficients ofvariation ranging from 14 to 138%. During ultrasonic dispersion, the output power (energy per unit time)was identified as an important factor controlling the distribution of SOC within these five fractions, whilecommonly only the output energy is standardized. The amount of water used to wet-sieve dispersed soilslurry significantly influenced the amount of extracted dissolved organic carbon (DOC). We therefore suggestusing a fixed amount of power for ultrasonic dispersion (20 W) and a minimum amount of water for wetsieving (2000 ml). RothC pool sizes were predicted from the measured fractions and compared with RothCequilibrium pool size distributions. This model initialization using measured SOC fractions, however, led toan over-estimation of stable RothC SOC pools when compared with pool size distributions derived fromRothC equilibrium runs under a bare fallow soil model simulation. To improve the isolation of particulateorganic matter from stable mineral-bound organic matter, we suggest that the density should be increased from1.8 to 2.0 g cm−3 in the density fractionation step. We formulated a modified fractionation procedure, whichaims specifically to enhance reproducibility across laboratories and to improve the match of the isolated SOCfractions with RothC’s SOC pools.
Introduction
Soil organic carbon (SOC) consists of several components, which
differ in their physico-chemical properties and hence their degree
of stabilization and turnover time (Bol et al., 2009). Active SOC
fractions are considered to respond relatively quickly to changes
in land use, climate or management, while other fractions are
hypothesized to be more stable or even inert (Krull & Skjemstad,
Correspondence: C. Poeplau. E-mail: [email protected]
Received 31 January 2013; revised version accepted 30 July 2013
2003). The distinct turnover times range from less than one year tothousands of years. The composition of SOC with its individualfraction size distribution thus determines its sensitivity towardsany kind of disturbance (Conant et al., 2004).
Modelling of SOC dynamics plays a key role in large-scaleestimates and predictions of SOC stock changes by accountingfor the variability of soils, climate and land use (Paustian, 2001).Starting in the late 1970s, several multi-compartment models havebeen developed (Jenkinson & Rayner, 1977). The majority of thesemodels are based on the partition of SOC into different functionalpools with distinct first-order kinetics and climatic and edaphic
© 2013 The AuthorsJournal compilation © 2013 British Society of Soil Science 1

2 C. Poeplau et al.
rate modifiers (Paustian, 2001). For almost two decades manyattempts have been made to develop SOC fractionation methodsto correlate laboratory-derived carbon fractions with functionalmodel pools in order to initialize the models or to validate theoutputs (Motavalli et al., 1994). Elliott et al. (1996) stated thatonly models that can be validated by measurements are reliableenough to predict SOC changes. However, it is challenging toachieve a good match of operationally defined SOC fractions withthe conceptional model pools, because the turnover of a specificfraction depends on its chemical and physical properties. Smithet al. (2002) stated that a measured fraction is only equivalent toa model pool if it is unique and does not contain ‘sub-fractions’with contrasting properties.
Existing fractionation methods can be divided into two majorgroups: physical and chemical fractionation, which are based ondifferent scopes regarding the mechanisms of SOC stabilization.Physical fractionation is based on the assumption that theassociation with soil particles and aggregates plays the keyrole in SOC stabilization and thus different SOC fractions areisolated by different degrees of disaggregation, dispersion, densityfractionation and particle size separation (Amelung & Zech,1999; Christensen, 2001; Six et al., 2001). In contrast, chemicalfractionation methods are based on the assumption that thechemical composition of each fraction determines its stabilityand thus its turnover time (Blair et al., 1995; Helfrich et al.,2007). Chemical fractions are obtained by extraction of SOC indifferent solutions, the hydrolysable nature of SOC with wateror acid and the resistance to oxidation. In several studies acombination of physical and chemical fractionation has been used(Trumbore et al., 1989; Leifeld & Kogel-Knabner, 2001). Theidea is to separate younger SOC from mineral-bound SOC bydensity or particle size fractionation and these physical fractionsare chemically treated to separate further fractions of differentstabilization degrees and turnover times. However, the use of looseterms, such as ‘recalcitrance’ or the vague definitions for fractionssuch as particulate organic matter (POM) or mineral-associatedorganic matter (MOM) has confused the discussion and hampereddirect comparisons of obtained results (Schmidt et al., 2011).Additionally, fractionation procedures are often poorly definedand there is little information available on their reproducibilityin different laboratories. Therefore, there is a need for morestandardized methods. A new attempt to combine physical andchemical fractionation has been made by Zimmermann et al.(2007). These authors isolated fractions that were related to
the modelled pools of the Rothamsted carbon model (RothC)(Jenkinson & Rayner, 1977): these were two active, two slowlycycling and one passive fraction. Meanwhile the method has beenused in different studies and has the potential to become a newwidely used fractionation method because of its simplicity andgood match with the RothC pools when applied to low altitudearable and grassland soils (Dondini et al., 2009; Leifeld et al.,2009a; Xu et al., 2011). However, not all steps of the fractionationprocedure are described in detail (Zimmermann et al., 2007). Itis therefore likely that each laboratory has developed its ownsystem and optimization, which might in turn lead to significantlydifferent results. Therefore, we set up a ring trial to compare themeasured SOC fractions from six different laboratories and relatethese to the RothC modelled carbon pools. Primarily, the aim ofthis work is to identify the most bias-sensitive steps. As a secondstep we aim to suggest a more standardized fractionation protocolfor this method.
Materials and methods
Soils, sample preparation and experimental setting
Three different cropland soils (0–20 cm) with contrasting proper-ties were selected for a ring trial. Soil ‘A’ is a loamy clay fromthe experimental farm Kungsangen (University of Uppsala, Swe-den), soil ‘B’ a loamy sand from the agricultural research stationReckenholz (ART, Switzerland) and soil ‘C’ is a coarse sand fromthe experimental farm Jyndevad (University of Aarhus, Denmark)(Table 1). A further description of the sites and their soils canbe found in Poeplau & Don (2013). The soils have been underpermanent crop cultivation for more than 100 years (Soils A andC) and 60 years (site B). The main crops at Kungsangen (site A)were spring barley, spring wheat, winter wheat, ley and oats. AtReckenholz (site B) the crops were winter wheat, maize, potatoes,spring barley and ley and at the Jyndevad (site C) they were springbarley, winter barley, winter rye and oats. At Kungsangen thefield received farmyard manure with an average carbon input of0.4 Mg C ha−1 year−1. All three soils were free of carbonate. Thesoils were dried at 40◦C, sieved to 2 mm and cleared of visuallydetectable fine roots. Soil sampling (to a depth of 80 cm), samplepreparation and SOC stock calculation are described in detail inPoeplau & Don (2013). To obtain homogenized and reproduciblesubsamples of 30 g, which is the required amount for the fraction-ation, we used a sample splitter (RT, Retsch, Haan, Germany).
Table 1 Characteristics of the three soils and site characteristics at the sampling sites, Corg concentration, SOC stock (0–20 cm depth), pH (KCl), andclay, silt and sand contents
Soil Site CountryCorg
/ %
Bulk density/ g cm−3
SOC stock/ Mg ha−1 pH(KCl)
Clay%
Silt%
Sand%
A Kungsangen Sweden 2.90 1.01 58.3 4.4 38.1 54.4 7.6B Reckenholz Germany 0.95 1.32 25 4.6 14.9 35.7 49.5C Jyndevad Denmark 1.19 1.27 30.3 5.6 4.7 5.7 89.6
© 2013 The AuthorsJournal compilation © 2013 British Society of Soil Science, European Journal of Soil Science

Soil carbon fractionation ring trial 3
The reproducibility was tested on five randomly selected subsam-ples for each soil. For the soils of sites A and B the coefficientof variation (CV) of the carbon content was 2 and 3% among thesubsamples. For site C, which is characterized by a large contentof particulate organic matter (POM) but a relatively small contentof total SOC (1.2%), there was a CV of 5%, which was, however,considered to be acceptable. Three randomly selected subsamplesof each soil (total n = 9) were sent to each of the participants inthe ring trial. There were six laboratories in the trial at the Thue-nen Institute of Climate Smart Agriculture (Germany), AgroscopeReckenholz (Switzerland), INRA, Clermont-Ferrand (France) incooperation with University of St Andrews (United Kingdom), theTechnical University Munich (Germany), the University of NewEngland (Australia) and the University of Aberdeen in coopera-tion with the Centre for Ecology and Hydrology (CEH) (UnitedKingdom). The participants were asked to conduct the fractiona-tion as described in Zimmermann et al. (2007) and to documentevery fractionation step in detail. The participating institutes havebeen made anonymous by randomly numbering (1–6). To avoidan additional instrumental bias, the participants were asked tosend the dried fractionated samples back to the Thuenen Institute,where all solid fraction samples were analysed for total carbonand nitrogen by dry combustion in an elemental analyser (LECOTruMac, St. Joseph. Michigan, USA). Only the dissolved organiccarbon fraction (DOC) was analysed by each laboratory becauseof the problems associated with sending frozen soil extracts.
SOC fractionation
The fractionation (Zimmermann et al., 2007) comprised thefollowing steps: (i) ultrasonic dispersion with 22 J ml−1 to disperselabile macroaggregates, (ii) wet-sieving over a 63-μm sieve to
separate the coarse, the fine and the dissolved fraction, (iii) densityfractionation with a sodium polytungstate solution with a densityof 1.8 g cm−3 to separate a light and a heavy fraction within thecoarse fraction; and (iv) a sodium hypochlorite (NaOCl) oxidationwith a 1-g subsample of the fine fraction to simulate aggressivedecomposition. The method isolates the following five fractions:particulate organic matter (POM), dissolved organic carbon (DOC)(both considered to be active C pools), SOC attached to sandgrains and in stable aggregates (S+A), SOC attached to silt andclay particles without being chemically resistant (both consideredto be slow cycling) and a chemically resistant fraction (rSOC)(Figure 1).
Modelling the pool sizes with RothC and converting fractionsto pools
To estimate the SOC pool size distributions for the three soils withRothC, we used the model’s inverse approach, which calculatesthe plant carbon input to achieve the measured total SOC stockat equilibrium. The required input data were thus reduced tothe following: precipitation, temperature, open-pan evaporationand plant cover on a monthly basis, clay content and amountand time of organic manure application. From these data themonthly C input was estimated with RothC and the pool of inertorganic matter (IOM) was calculated by the model and usingthe equation proposed by Falloon et al. (1998). Both sets ofinformation are required to initialize an equilibrium run, whichwe subsequently conducted. The assumption that all three soilswere in an approximate equilibrium at the time of sampling couldbe made because they have been under cultivation without majormanagement changes for 60 (site B) or more than 100 (sites Aand C) years.
Figure 1 Soil carbon fractionation schemeafter Zimmermann et al. (2007).
© 2013 The AuthorsJournal compilation © 2013 British Society of Soil Science, European Journal of Soil Science

4 C. Poeplau et al.
To compare the effect of pool size distribution, either derivedfrom the equilibrium runs or from soil fractionation, on the long-term fate of simulated SOC we converted the measured SOCfractions into pools according to the procedure described byZimmermann et al. (2007) (Figure 2). The splitting ratios fordecomposable plant material (DPM) and resistant plant material(RPM) (DPM/RPM) as well as microbial biomass (BIO) andhumified organic matter (HUM) (BIO/HUM) were derived fromthe modelled equilibrium situation at each site, in which thesize of each pool was predicted. We also used the measuredpools from the six laboratories and the RothC modelled poolsto initialize a short model run in RothC to predict the effectof the individual pool size distributions on relative SOC stockdepletion. The sensitivity of the total SOC stock, as determinedby the different pool size distributions, is thus assessed. To doso, an unrealistic scenario of 40 years bare fallow without any Cinput was assumed. In the following this modelling exercise willbe referred to as the ‘bare fallow simulation’.
A posteriori fractionation experiments
We found a large variability in quantified fractions amonglaboratories, as well as systematic deviations from the RothCmodelled pool size distributions, and therefore we conductedseveral a posteriori fractionation experiments in order to improvethe protocol and to verify identified sources of laboratory bias.
Wet sieving and density fractionation. As the amount ofextracted DOC was correlated with the amount of water usedfor wet sieving with a saturation occurring at 2000–3000 ml,
we a posteriori conducted the wet sieving for all three soilswith 3000 ml water. Zimmermann et al. (2007) isolated onlysmall amounts of DOC and POM, which resulted in a misfitwith the RPM+DPM pools. They proposed that the density ofsodium polytungstate (SPT) solution used for density fractionationshould be increased to 2.0–2.2. We tested the effect of thisincrease by conducting additional density fractionations with anSPT solution density of 2.0–2.2. To calculate the amount of POMneeded to match the modelled RPM and DPM pools, we usedthe amount of DOC that was a posteriori isolated with 3000 mlwater and subtracted this amount from the RPM and DPM pools.We also checked whether the amount of isolated DOC could beincreased by hot-water extraction of the suspension after ultrasonicdispersion. After a pretest, in which a sample was extracted for 5,10, 15, 30 and 60 minutes, we decided to extract the samples for60 minutes in a water bath.
NaOCl oxidation. Chlorine in NaOCl solution is easily lost, sowe varied the concentrations of NaOCl to test this as a potentialsource of bias and used 3, 4, 5, 6 and 7% NaOCl solutions.
Statistical analysis
To assess whether the size of each fraction is significantlyinfluenced by the laboratory that conducted the analysis andto quantify differences regarding the inter-laboratory variabilitybetween the three soils, we conducted linear mixed effectmodel analyses with crossed random effects. There were obviousdifferences in carbon content between the three soils, whichwere therefore accounted for by a fixed site effect. The six
Figure 2 Concept of converting measured carbon fractions to RothC pools after Zimmermann et al. (2007).
© 2013 The AuthorsJournal compilation © 2013 British Society of Soil Science, European Journal of Soil Science

Soil carbon fractionation ring trial 5
laboratories were considered as a random selection of a largernumber of possible laboratories and therefore treated as randomeffects. Similarly, the analysed soil samples constituted a randomselection of all possible soil samples. As they were split beforesending them to the different laboratories, the samples themselveshad to be treated as a random effect in the statistical analysis.Two modifications of this basic model were made: first, thedifferences in carbon content between the different soils wereassociated with differences in the within-laboratory variability(variance heterogeneity). The residual variance was thereforechosen to be sample-type specific. Second, we had to assume thatthe differences between laboratories were sample-type specific,demanding an additional random laboratory x sample interactionto be included in the model. Variance components in this modelwere estimated with the restricted maximum likelihood method asimplemented in the nlme-package of the statistical environmentR. Model selection was made by using the Akaike InformationCriterion (AIC). The level of significance was set to P = 0.05. Toquantify in which soil and fraction the laboratory effect was mostevident, we calculated the coefficient of variation (CV) for eachsoil and fraction, as well as a ratio of this CV and the residualerror (standard deviation) as revealed by the model, which wasrecalculated into a ‘residual CV’ (intra-laboratory variability). Thelarger this ratio, the larger was the difference between laboratories.A ratio <1 thus indicates that the intra-laboratory variabilityexceeded the inter-laboratory variability. In addition to the fivefractions, we conducted this analysis for the ratio of carbon inthe fine fraction (<63 μm) (s+c, DOC) and carbon in the coarsefraction (>63 μm) (POM, S+A).
Results and discussion
Inter-laboratory variability of SOC fractions
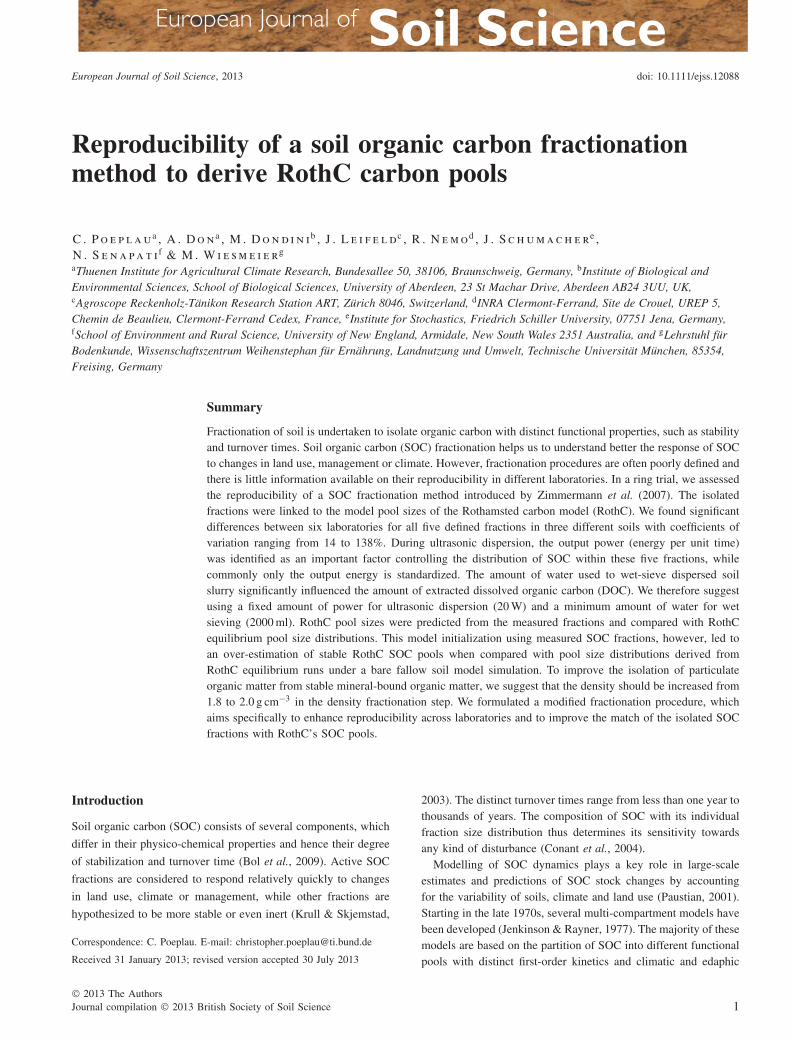
We found a significant difference between laboratories for allfractions and the C(<63 μm):C(>63 μm) ratio (Figure 3). ThePOM fraction had the least variability between laboratories andthus the best reproducibility with a CV of 12.9% for site A, 17.6%for site B and 13.1% for site C (Table 2). Density fractionation,which isolates the POM fraction, can thus be classified as the mostrobust fractionation step regarding the reproducibility betweenlaboratories. The residual CV of the POM fraction was of thesame order of magnitude as the CV between laboratories. Forsite C it was even larger, resulting in a CV:residual CV ratio of0.7. This was surprising because we expected the POM fractionto be variably distributed in the different soil samples. However,the largest variability between laboratories was observed for theS+A fraction, with a CV of 126.7% for site A, 86% for site Band 58.3% for site C, which is reflected by the large variabilityof the C(<63 μm):C(>63 μm) ratio and indicates that the firstfractionation steps (ultrasonic dispersion and wet sieving) werevery sensitive to a laboratory bias (Figure 3, Table 2). The largestreproducibility within laboratories was found for the s+c fraction,with a residual CV of 2.5 for site A, 2.1 for site B and 5.7 for siteC. This can be explained by the fact that this fraction contains
the largest proportion of the total SOC and is thus more robustagainst losses during fractionation than smaller fractions. Even atsite C, which contained only 10.4% clay and silt, 69 ± 17% ofthe total SOC was found in the s+c fraction (data not shown).Laboratories 1–5 isolated an s+c fraction of similar size (mg C),whilst laboratory 6 found a significantly smaller s+c fraction forall three soils (Figure 3). This was different for the rSOC fraction,which was obtained by NaOCl oxidation of 1 g of the s+c fraction.The variability between laboratories was much larger for the rSOCthan for the s+c fraction, which indicates that the NaOCl oxidationwas more sensitive to bias.
Modelled and measured SOC pools
The variability of the SOC pool size distributions among the sixlaboratories and the deviations from the corresponding modelledSOC pool size distribution were large for all three soils (Tables 3,4). The soil with the smallest variability in the total determinedSOC stock with a coefficient of variation of 2.6% was the finetextured, carbon-rich soil from Kungsangen (A). Three of the sixlaboratories (2, 4 and 6) measured a similar pool size distributionto that modelled by RothC for site A (Figure 4a, Table 4), whichis reflected in the bare fallow simulation (Figure 4b). Site A lost40.6% SOC in 40 years with the RothC equilibrium pool sizedistribution and 36.7, 37.6 and 39.4% SOC using the measuredSOC pool size distribution from laboratories 2, 4 and 6. Incontrast, with the fractionation data from laboratories 1, 3 and5, SOC depletions of only 33.8, 31.4 and 30.2% were computed.
The greatest variability in the total measured SOC stock amonglaboratories (21.8%) was observed in the sandy soil at site C(Table 3). The results of the bare fallow simulation ranged fromrelative SOC losses of 27.5–50.7%. The average deviation fromthe bare fallow simulation with the RothC equilibrium pools wasalso greatest for site C, as revealed by the residual sum of squares,which increased from site A (264) to site B (327) to site C (1163)(Table 4). The loamy sand (site B) had an intermediate variabilityin pool size distribution and SOC stock depletion after the barefallow simulation (Figure 4, Table 3).
The IOM pool had the largest variability among all pools andin all soils with coefficients of variation of 48.6% (site A), 54.7%(site B) and 59.7% (site C) (Table 3). Laboratories 1, 3 and 5measured an up to four times larger IOM pool than predictedby RothC; laboratories 3 and 5 quantified an up to seven timeslarger IOM pool than predicted by RothC. However, laboratories2, 4 and 6 were able to match the IOM pool at least for sites Aand B (Figure 4). Laboratory 4 isolated only half of the RothC-predicted IOM pool for site B. A systematic deviation from theRothC-predicted pool sizes was found in the RPM and DPMpools, for which all laboratories found smaller pool sizes in allthree soils (Figure 4), with laboratory 6 being an exception withsite C. This might be explained by the fact that laboratory 6 had arecovery rate of only 57% and that not all fractions were equallyaffected by C loss. On average, the quantified RPM+DPMpools together were 37% (site A), 45% (site B) and 35%
© 2013 The AuthorsJournal compilation © 2013 British Society of Soil Science, European Journal of Soil Science
6 C. Poeplau et al.
0
10
20
30
40
0
20
40
60
80
0
100
400
500
1 2 3 4 5 6 1 2 3 4 5 6 1 2 3 4 5 6 1 2 3 4 5 6 1 2 3 4 5 6 1 2 3 4 5 6
1 2 3 4 5 6 1 2 3 4 5 6 1 2 3 4 5 6 1 2 3 4 5 6 1 2 3 4 5 6 1 2 3 4 5 6
0
4
8
12
0
200
400
600
800
1 2 3 4 5 6 1 2 3 4 5 6 1 2 3 4 5 61 2 3 4 5 6 1 2 3 4 5 6 1 2 3 4 5 60
20
40
60POM
rSOC (1 g soil)
s+cS+A
DOC
Ratio
Laboratories 1 to 6
Fra
ctio
n si
ze /
mg
C (
30 g
soi
l)-1
Soil A Soil B Soil C Soil A Soil B Soil C
Figure 3 Isolated carbon in each measured fraction and the ratio C(<63 μm):C(>63 μm) with standard deviations for sites A, B and C and laboratories1–6.
(site C) smaller than the RothC equilibrium pools. This indicatesthat insufficient POM or DOC was isolated with the existingprocedure in order to match the RPM and DPM pools as predictedby RothC (Figure 4). As a result, all measured pool size distribu-tions, with the exception of laboratory 6 for site C, led to smaller
SOC losses with the simulated 40 years of bare fallow thanthe RothC-derived equilibrium pool size distribution. This wasbecause the amounts of isolated POM or DOC (RPM, DPM) weretoo small and, the rSOC fraction was mostly too large (IOM).Laboratory 6 was able to match the RothC pools most closely but
© 2013 The AuthorsJournal compilation © 2013 British Society of Soil Science, European Journal of Soil Science

Soil carbon fractionation ring trial 7
Table 2 Coefficients of variation (%) (inter-laboratory error), residualcoefficients of variation (%) (intra-laboratory error after fractionating threereplicate samples) and their ratio for the fractionation results of all sites andthe fractions particulate organic matter (POM), dissolved organic carbon(DOC), organic carbon in sand and stable aggregates (S+A), organiccarbon in silt and clay (s+c) and resistant soil organic carbon (rSOC)plus the ratio of carbon in the fine fraction (<63 μm) and carbon in thecoarse fraction (>63 μm)
CV(inter-laboratoryerror)
Residual CV(intra-laboratoryerror)
CV:residual CV
Fractions A B C A B C A B C
POM 12.9 17.6 13.1 10.4 13.7 17.5 1.2 1.3 0.7DOC 17.2 33.7 44.9 25.7 14.5 19.7 0.7 2.3 2.3S+A 126.7 86.0 58.3 13.1 69.7 11.2 9.6 1.2 5.2s+c 21.2 17.7 15.8 2.5 2.1 5.7 8.4 8.3 2.8rSOC 1 g 29.1 41.5 31.1 11.0 10.8 37.6 2.6 3.8 0.8C(<63 μm)
:C(>63 μm)48.1 29.4 53.9 7.6 18.0 8.0 6.4 1.6 6.8
Table 3 Coefficients of variations (%) among the six laboratories for eachpool and site after the mean fractionation results of each laboratory havebeen converted into RothC pools
Pool Site A Site B Site C
RPM+DPM 10.4 23.5 17.8HUM+BIO 13.4 14.4 24.2IOM 48.6 54.7 59.7Total C 2.6 8.5 21.8
had a poor carbon recovery rate during the fractionation procedureand in particular for site C (64 ± 9%). Poor recovery rates areindicators of C losses during the fractionation that may lead tostrong biases in the results. The mean carbon recovery rate for alllaboratories was 94 ± 10% and ranged from 93.9 to 102.7% forsite A, from 81.3 to 97.4% for site B and from 54.3 to 113.1% forsite C.
Critical work steps
Ultrasonic dispersion. Ultrasonic dispersion and wet sieving arethe first steps in the fractionation procedure and have thus a majorinfluence on the overall SOC fraction distribution. The ultrasonicdispersion determines the amount of destroyed macroaggregatesand thus the quantity of carbon washed into the <63 μmfractions. The ratio between the quantified s+c and DOC fractions(<63 μm) and the S+A and POM fraction together (>63 μm)describes the effect of ultrasonic dispersion and wet sieving. Wefound significant differences in C(<63 μm):C(>63 μm) betweenlaboratories for all three soils (Figure 3), which identifies thefirst fractionation steps as being bias-sensitive. The amountof applied ultrasonic power (energy per unit time) varied
considerably among laboratories and ranged from 22 to 90 W.In the current fractionation protocol, only the amount of energywas standardized, which allowed each laboratory to modify theamount of power and time. We found significant exponentialrelationships between the ratio C(<63 μm):C(>63 μm) and theamount of ultrasonic power used for all three soils (R2 = 0.43,R2 = 0.61 and R2 = 0.74 for soils A, B and C, respectively).The <63 μm fractions increased with increasing ultrasonicpower (Figure 5). This was surprising because standardization ofultrasonic dispersion in almost all SOC fractionation protocolsis done by means of the applied energy with little attentionbeing paid to the power of the ultrasonic dispenser. However,the importance of the power used is in line with the findings ofRaine & So (1997), who quantified significantly more dispersionwhen greater power was applied but the output energy was keptconstant. Aggregate breakdown during ultrasonic dispersion ismainly driven by the stresses caused by cavitation of the fluid(Mayer et al., 2002). The main factor driving cavitation duringultrasonic dispersion is the acoustic pressure of the ultrasound,which depends on the density of the fluid, the sound velocity inthe fluid and the sound vibration velocity amplitude (Kuttruff,1988). As the amount of water and soil were the same in eachlaboratory, the acoustic pressure varied as a function of the soundvibration velocity amplitude, which is proportional to the appliedpower (Mayer et al., 2002). We suggest that a standardized amountof power should be specified in the protocol to achieve morecomparable results. As the laboratory which used the smallestamount of power achieved the best overall fit with the RothC pools(laboratory 6: 22 W), we propose that 20 W should be used. Toobtain the output energy of 22 J ml−1, the dispersion time wouldbe 177 s for a volume of 161 ml (150 ml water and 30 g of soilwith an assumed density of 2.65 g cm−3).
Wet sieving. In the original protocol, Zimmermann et al. (2007)proposed that the samples should be flushed during wet sievinguntil the rinse water is clear. This, however, led to very differentamounts of water that were used in our ring trial, ranging from 533to 8500 ml to flush the same sample. The amount of water usedwas exponentially correlated with the size of the DOC fraction,with the greatest increase occurring at less than 2000 ml (Figure 6).The a posteriori test, which was conducted with 3000 ml of water,confirmed that the fitted exponential model is a valid predictor ofthe amount of DOC. When more than 2000 ml of water was usedto flush the samples no significant influence of the amount of wateron the amount of DOC could be observed. To exclude this sourceof variation, we therefore suggest using 2000 ml as a minimumamount of water to flush the sample.
Zimmermann et al. (2007) filtered the suspension through a0.45-μm membrane filter to obtain the DOC fraction. We observedthat filtering the suspension is, however, very time consuming,which led to the widespread use of centrifuging and decantingof the liquid before filtering. When 3000 ml of water was usedfor wet sieving, 10 minutes of centrifugation at 2000 g apparentlysufficed to separate the solid and the liquid phase.
© 2013 The AuthorsJournal compilation © 2013 British Society of Soil Science, European Journal of Soil Science

8 C. Poeplau et al.
1 2 3 4 5 60
20
40
60
DPMRPMBIOHUMIOM
Soil A
0
10
20
30Soil B
0
10
20
30
40Soil C
0
-50
-40
-30
-20
-10
0
RothCLab 1Lab2Lab3Lab 4Lab 5Lab 6
-60
-40
-20
0
Soil A
Soil B
Soil C
(a)
(e)
(d)
(c)
(b)
(f)
20Time / yearsLaboratories 1 to 6
-50
-40
-30
-20
-10
0
SO
C s
tock
/ M
g ha
-1
Mod
elle
d re
lativ
e S
OC
sto
ck c
hang
e / %
RothC
1 2 3 4 5 6RothC
1 2 3 4 5 6RothC
40302010
0 40302010
0 403010
Figure 4 Modelled and measured pool sizes (a, c, e) and relative SOC stock change after using each pool size distribution to initialize the 40-year barefallow simulation in RothC (b, d, f) for sites A, B and C.
© 2013 The AuthorsJournal compilation © 2013 British Society of Soil Science, European Journal of Soil Science

Soil carbon fractionation ring trial 9
Table 4 Deviation of each laboratory from the bare fallow simulationinitialized with the RothC equilibrium pools for all three soils (% SOCchangeRothC − % SOC changemeasured pool) and the residual sum of squares(RSS) for each laboratory and soil
Laboratory Site A Site B Site CRSS(laboratories)
1 −6.8 −9.4 −13.7 3222 −3.9 −4.8 −5.2 653 −9.2 −9.3 −21.8 6464 −3.1 −4.5 −13.7 2185 −10.4 −9.1 −16.8 4726 −1.3 −5.1 1.3 29RSS (soils) 264 327 1163 –
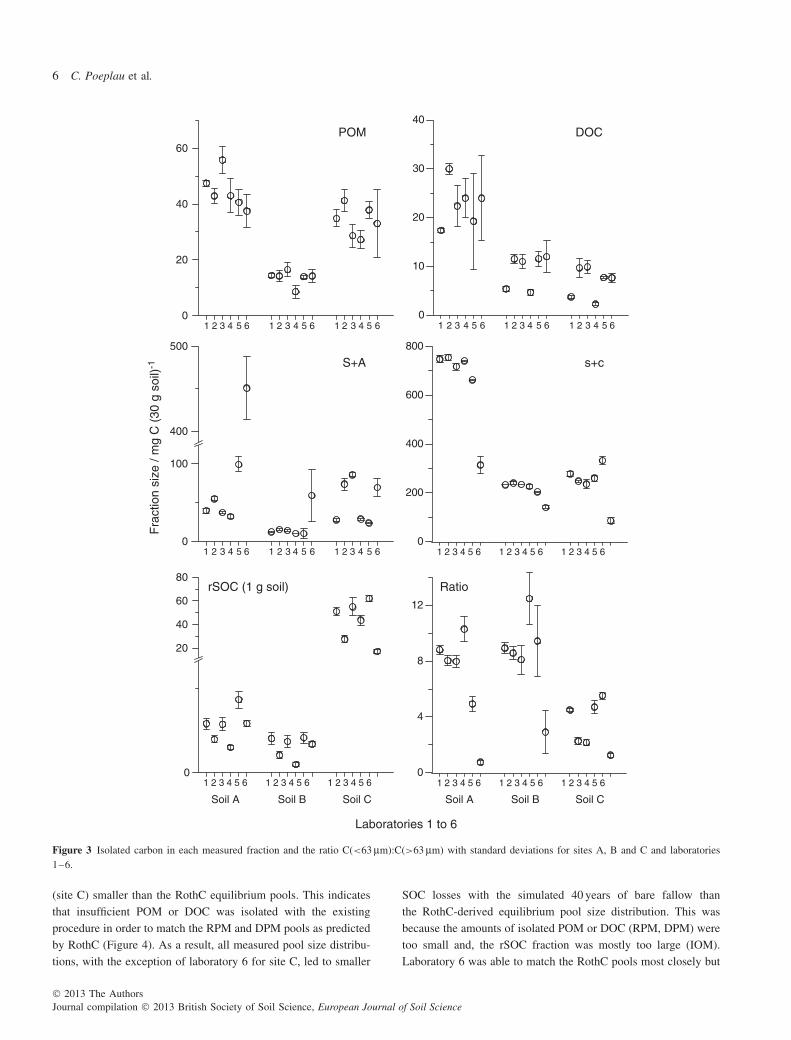
Density fractionation. The comparison of modelled andlaboratory-derived pool size distributions revealed that the RPMand DPM pools, which are calculated from the DOC and POMfractions, were under-estimated by all laboratories (Figure 4).This is in line with the finding of Zimmermann et al. (2007),who found the quantified pools to be systematically smallerthan the modelled ones. They proposed that the density of SPTbe increased to 2.0–2.2 g cm−3; however, this is not yet inwidespread practice. To our best knowledge in both published(Dondini et al., 2009; Leifeld et al., 2009b; Xu et al., 2011;Poeplau & Don, 2013) and unpublished work, the density of1.8 g cm−3 has been used. Additionally, Xu et al. (2011) couldnot confirm this systematic deviation, but found a large scatterof modelled compared with measured DPM and RPM pools.We therefore decided to maintain this density for the ring trial.However, a posteriori we tested whether an increased densityof the SPT solution would lead to a better match of modelledand laboratory-determined RPM and DPM pools. Even with adensity of 2.2 g cm−3 we isolated only 15% (A), 49% (B) and20% (C) more POM than with a density of 1.8 cm−3; an increaseof 84% (A), 144% (B) and 69% (C) would have been needed tomatch the labile modelled pools (Figure 7). We therefore testedwhether the amount of DOC could be increased by hot waterextraction (Landgraf et al., 2006) of the suspended sample beforewet sieving: this increased the amount of DOC by a factor of1.6, 1.8 and 1.9 for soils A, B and C, respectively. Summingthe increased amount of POM achieved with an SPT density of2.2 g cm−3 and the hot-water extracted amount of DOC, leadsto a total proportion of 88% (A), 85% (B) and 90% (C) of themodelled RPM and DPM pools. It is likely that the hot waterextraction would have decreased the amount of isolated POMif both steps had been conducted on the same set of samples.Therefore, we do not see a possibility of adjusting the protocolin order to match the RPM and DPM pools with POM andDOC. Moreover, Shaymukhametov et al. (1984) characterizedthe SOC in different density fractions and found that the SOC(density below 1.8–2.0 g cm−3) consisted of slightly decomposedmacro-organic matter of plant and animal origins with littlemineral content, the SOC (density between 2.0 and 2.4 g cm−3)
20 40 60 80 100
0
4
8
12
Rat
io C
(<63
μm
) / C
(>63
μm
)
Applied Ultrasonic Power / W
A (R2=0.43)B (R2=0.61)C (R2=0.74)
Figure 5 Ratio of C(<63 ym):C(>63 ym) as a function of appliedultrasonic power with exponential fits and R2 values for each soil.
0 2000 4000 6000 8000
Amount of rinsing water / ml
0
10
20
30D
OC
/ m
g (3
0 g
soil)
-1
A (R2=0.70)B (R2=0.22)C (R2=0.45)a posteriorifor A, B, C
Figure 6 Mean amount of DOC extracted as a function of the amount ofwater used during wet sieving.
consisted of organo-clay complexes and the heavy fraction(density < 2.4 g cm−3) consisted of sand grains coated withSOC. Sollins et al. (2006) determined a mean residence time of210 years for SOC separated with a density of 2.0–2.28 g cm−3
in a forest soil. Thus, even though an increased density doesincrease the amount of isolated POM and therefore comesempirically closer to the RPM and DPM pools of RothC, it isdoubtful whether a fraction obtained with a density of 2.2 g cm−3
or greater would resemble the functional role of the labile RPMand DPM pools. We suggest that a density of 2.0 g cm−3 shouldbe used and that the sample should not be hot-water extracted.
© 2013 The AuthorsJournal compilation © 2013 British Society of Soil Science, European Journal of Soil Science
10 C. Poeplau et al.
1.8 2 2.2 RothC
0
20
40
60
80
Soil ASoil BSoil C
PO
M /
mg
30 g
soi
l-1
Density of sodium polytungstate / g cm-3
Figure 7 Size of the POM fraction obtained using different densities ofsodium polytungstate compared with the fraction size, which should beobtained to match the RPM and DPM pools estimated by RothC.
NaOCl oxidation. The IOM pool had the largest variabilitybetween laboratories among all quantified pools and only threeout of six laboratories were able to isolate a fraction sizethat was comparable to the RothC-predicted pool (Figure 4,Table 3). As chloride in the NaOCl solution is volatile, theoxidation efficiency decreases with time and is dependent ontemperature during storage. We therefore recommend that freshNaOCl solution in which the Cl concentration is known is usedor that the Cl concentration is determined immediately before thesolution is used for oxidation. We tested a posteriori whether thedifferences between laboratories could be explained by differentconcentrations of Cl in the NaOCl solution (Figure 8). Allthree soils had a relatively smaller sensitivity to different Clconcentrations than the variability between laboratories, indicatingthat differences in Cl can only partly explain the observedvariability. Moreover, we found a significant positive correlationbetween the C(<63 μm):C(>63 μm) ratio and the proportion ofoxidizable carbon in the s+c fraction (r = 0.43, data not shown).This indicates that quality and quantity of SOC in the s+cfraction is again determined by ultrasonic dispersion through thebreakdown of macroaggregates and thus the release of occludedcarbon. The better the dispersion efficiency of the ultrasonicdispersion, the more potentially labile SOC is found in the s+cfraction and thus the more oxidizing agent is needed to isolatethe same amount of rSOC. This hypothesis is in line with thefindings of Siregar et al. (2005), who treated 12 different soilswith NaOCl and determined an oxidation efficiency range from12 to 72%, which was negatively correlated with the clay contentof the soils (r = 0.45). Similarly, Kleber et al. (2005) explainthe same results with either a varying degree of recalcitranceof SOM or a different degree of protection exerted by the soilmatrix. Thus, the oxidation efficiency is strongly dependent on the
0
20
40
60
80
100
ABC
3 4 5 6 7
Laboratories
NaOCl concentration / %
6 6 6
C lo
ss a
fter
oxid
atio
n / %
Figure 8 Carbon loss after oxidation as a function of NaOCl concentra-tion and the results from the laboratories using a NaOCl concentration at6% as a comparison.
Table 5 Mean deviations of the quantified POM+DOC andPOM+DOC+S+A fractions from the RothC equilibrium RPM+DPMpools (Mg C ha−1) for all three soils
A B C
LaboratoryPOM+DOC
POM+DOC+S+A
POM+DOC
POM+DOC+S+A
POM+DOC
POM+DOC+S+A
1 −2.98 −0.35 −2.05 0.32 −2.04 −0.972 −2.44 1.20 −1.01 5.24 −1.53 −0.213 −2.09 0.38 −2.06 5.22 −1.37 −0.144 −2.83 −0.72 −2.83 −0.39 −2.61 −1.735 −3.31 3.28 −1.45 0.56 −1.55 −0.676 −3.20 27.00 −1.94 5.50 −1.68 2.00
quality of the organic matter present. Furthermore, the differencesamong laboratories in the size of the s+c fraction, which isagain determined by ultrasonic dispersion, potentially contributeto explaining the variability in the size of the rSOC fraction. Theoxidation is conducted with 1 g of the sample but the fractionsize is determined by multiplying the resistant C in 1 g with thetotal amount (g) of s+c. The variability of the total amount ofs+c material thus contributed about one-third of the coefficientof variation for the rSOC fraction. This stresses the need foran improved standardized ultrasonic procedure. Another possiblesource of the large laboratory bias could be the different intensitiesof shaking the sample after the addition of fresh NaOCl. To ensurea complete oxidation of the oxidizable C in the soil sample, thesedimented soil a posteriori in the vessel must be brought fullyin suspension; ideally, a vortex mixer should be used. We did nottest this in the current study.
© 2013 The AuthorsJournal compilation © 2013 British Society of Soil Science, European Journal of Soil Science

Soil carbon fractionation ring trial 11
The role of the S+A fraction. The SOC in the S+A fractionis probably the most heterogeneous SOC fraction in terms ofcomposition and stability. It comprises POM >0.63 μm, which isvisually detectable, occluded POM in aggregates with differentcohesive strength, and also SOC in clay-sized organo-mineralparticles within these aggregates and as coatings on sand grains(which might have a long turnover time) (Shaymukhametovet al., 1984). This, however, contradicts the perception that SOCfractions should ideally be unique and non-composite in orderto match model pools (Smith et al., 2002). Zimmermann et al.(2007) considered the S+A fraction to be physically stabilized andthus slower cycling than the labile fractions of DOC and POM.However, recent work has shown that the S+A fraction had alarger or only slightly smaller sensitivity to land-use change thanDOC (Poeplau & Don, 2013). Dondini et al. (2009) observed alarger proportion of C4-derived carbon in the S+A fraction than inthe POM fraction 14 years after a C3-C4 vegetation change. Thisindicates that this fraction would contain a larger proportion of‘fresh’ SOC than of stabilized SOC. In contrast, Leifeld & Fuhrer(2009) calculated mean residence times (MRTs) of >100 years forthe S+A fraction, while the POM fraction was not older than 5and 7 years in the upper 4 cm of a subalpine pasture and meadow,respectively. This, however, does not exclude the possibility thatthe S+A fraction consists of old SOC, but also a substantialamount of fresh SOC. We therefore calculated the RPM and DPMpools by adding S+A to the POM and DOC fractions to testthis. Thirteen of 18 recalculated measurements (six laboratoriesand three soils) achieved a better match with the RPM and DPMpools than with the proposed calculation with only POM and DOC(Table 5). Eight of these 13 recalculated measurements with POM,DOC and S+A were still less than the RPM and DPM poolsfrom RothC. Laboratory 6, which used the smallest amount ofultrasonic power and thus isolated the largest S+A fraction, wouldover-estimate the RPM+DPM fractions when S+A is included. Incontrast, laboratory 1, which used the greatest amount of ultrasonicpower, would achieve a better match with the RPM+DPM poolsfor all three soils if the S+A fraction was included (Table 5).To maintain the current concept of the fractionation method, wetherefore suggest that a small amount of ultrasonic power (20 W) isused. However, to identify the functional role of the S+A fraction,as well as that of all other fractions, the mean residence time(MRT) of each fraction should be investigated by using repeated14C measurements (Baisden et al., 2011). Only this informationwould permit us to validate a mechanistic framework for theexisting fractionation procedure, which is currently based onlyon conceptual considerations and empirical relations of measuredfraction sizes and the modelled pools. Even so, a perfect fit offractions and conceptual pools will not be achievable because thenature of SOC is a continuum rather than consisting of distinctpools. In the specific case of RothC this is especially true for theIOM pool, which is estimated using the Falloon equation (Falloonet al., 1998), while the actual size of IOM in a specific soil or eventhe existence of such a pool remains very uncertain. Fractionation,
as well as modelling with different functional pools, will thusremain an approximation.
Conclusions
The conducted ring trial revealed that the fraction proceduredescribed by Zimmermann et al. (2007) was not described pre-cisely enough and led to individual laboratory-specific adjustmentsand thus significantly different results for three different soilsand all fractions. The amount of applied ultrasonic power duringultrasonic dispersion as the first step of the fractionation schemestrongly drives the disruption of aggregates and thus influencesthe quality and size of all fractions. We thus suggest standardiz-ing not only the ultrasonic energy, but also the ultrasonic power(20 W). The amount of isolated DOC is a function of the amountof water used for wet sieving, which demands a minimum amountof water (2000 ml) to be used. Calculating the distribution of SOCover pools of the RothC biogeochemical model led systematicallyto a stronger allocation of SOC to stable model pools than withthe RothC model’s equilibrium pool size distributions. Neitherincreasing the density of the SPT solution for density fractiona-tion, nor increasing the concentration of NaOCl for isolating therSOC fraction, could solve this entirely. Moreover, a substantialpart of the S+A fraction might be young and fast cycling material,contrary to the original concept that this fraction coincides witha relatively stable SOM pool. This hypothesis needs to be fur-ther tested and possibly an additional fractionation step would berequired to split the S+A fraction into a young component, whichadds to the RPM and DPM pools in the RothC model, and anold part, which would actually relate to the turnover of the HUMpool. However, to achieve more comparable results between lab-oratories and to achieve a better fit with RothC-predicted pools bymaintaining the current conceptual framework of this soil carbonfractionation method, we suggest an improved fraction protocol(see File S1).
Supporting Information
The following supporting information is available in the onlineversion of this article:File S1. Improved fractionation protocol.
Acknowledgements
This study was financed by the FP7 project GHG-Europe (grantno. 244122).
References
Amelung, W. & Zech, W. 1999. Minimisation of organic matter disruptionduring particle-size fractionation of grassland epipedons. Geoderma , 92,73–85.
Baisden, W.T., Parfitt, R., Ross, C., Schipper, L. & Canessa, S. 2011.Evaluating 50 years of time-series soil radiocarbon data: towards routinecalculation of robust C residence times. Biogeochemistry , 9, 1–9.
© 2013 The AuthorsJournal compilation © 2013 British Society of Soil Science, European Journal of Soil Science
12 C. Poeplau et al.
Blair, G.J., Lefroy, R.D.B. & Lise, L. 1995. Soil carbon fractions based ontheir degree of oxidation and the development of a carbon managementindey for agricultural systems. Australian Journal of Agricultural
Research , 46, 1459–1466.Bol, R., Poirier, N., Balesdent, J. & Gleixner, G. 2009. Molecular turnover
time of soil organic matter in particle-size fractions of an arable soil.Rapid Communications in Mass Spectrometry , 23, 2551–2558.
Christensen, B.T. 2001. Physical fractionation of soil and structural andfunctional complexity in organic matter turnover. European Journal of
Soil Science, 52, 345–353.Conant, R.T., Six, J. & Paustian, K. 2004. Land use effects on soil carbon
fractions in the southeastern United States. II. Changes in soil carbonfractions along a forest to pasture chronosequence. Biology & Fertilityof Soils , 40, 194–200.
Dondini, M., Hastings, A., Saiz, G., Jones, M.B. & Smith, P. 2009. Thepotential of Miscanthus to sequester carbon in soils: comparing fieldmeasurements in Carlow, Ireland to model predictions. GCB Bioenergy ,1, 413–425.
Elliott, E.T., Paustian, K. & Frey, S.D. 1996. Modelling the measurableor measuring the modelable: a hierarchical approach to isolatingmeaningful soil organic matter fractions. In: Evaluation of Soil OrganicMatter Models Using Existing Long-term Datasets (eds D.S. Powlson,P. Smith & J.U. Smith), pp. 162–179. Springer-Verlag, Berlin.
Falloon, P., Smith, P., Coleman, K. & Marshall, S. 1998. Estimating thesize of the inert organic matter pool from total soil organic carboncontent for use in the Rothamsted carbon model. Soil Biology &
Biochemistry , 30, 1207–1211.Helfrich, M., Flessa, H., Mikutta, R., Dreves, A. & Ludwig, B. 2007.
Comparison of chemical fractionation methods for isolating stable soilorganic carbon pools. European Journal of Soil Science, 58, 1316–1329.
Jenkinson, D.S. & Rayner, J.H. 1977. The turnover of soil organic matterin some of the Rothamsted classical experiments. Soil Science, 123,298–305.
Kleber, M., Mikutta, R., Torn, S. & Jahn, R. 2005. Poorly crystallinemineral phases protect organic matter in acid subsoil horizons. European
Journal of Soil Science, 56, 717–725.Krull, E.S. & Skjemstad, J.O. 2003. delta(13)C and delta(15)N profiles in
(14)C-dated Oxisol and Vertisols as a function of soil chemistry andmineralogy. Geoderma , 112, 1–29.
Kuttruff, H. 1988. Physik und Technik des Ultraschalls . S. Hirzel Verlag,Stuttgart.
Landgraf, D., Leinweber, P. & Makeschin, F. 2006. Cold and hot water-extractable organic matter as indicators of litter decomposition in forestsoils. Journal of Plant Nutrition and Soil Science, 169, 76–82.
Leifeld, J. & Kogel-Knabner, I. 2001. Organic carbon and nitrogen in finesoil fractions after treatment with hydrogen peroxide. Soil Biology &
Biochemistry , 33, 2155–2158.Leifeld, J. & Fuhrer, J. 2009. Long-term management effects on soil
organic matter in two cold, high-elevation grasslands: clues fromfractionation and radiocarbon dating. European Journal of Soil Science,60, 230–239.
Leifeld, J., Zimmermann, M., Fuhrer, J. & Conen, F. 2009a. Storage andturnover of carbon in grassland soils along an elevation gradient in theSwiss Alps. Global Change Biology , 15, 668–679.
Leifeld, J., Reiser, R. & Oberholzer, H.R. 2009b. Consequences ofconventional versus organic farming on soil carbon: results from a 27-year field experiment. Agronomy Journal , 101, 1204–1218.
Mayer, H., Mentler, A., Papakyriacou, M., Rampazzo, N., Marxer, Y. &Blum, W.E.H. 2002. Influence of vibration amplitude on the ultrasonicdispersion of soils. International Agrophysics , 16, 53–60.
Motavalli, P.P., Palm, C.A., Parton, W.J., Elliott, E.T. & Frey, S.D.1994. Comparison of laboratory and modeling simulation methods forestimating soil carbon pools in tropical forest soils. Soil Biology &
Biochemistry , 26, 934–944.Paustian, K. 2001. Modelling soil organic matter dynamics- global
challenges. In: Management of Soil Organic Matter (eds R.M. Rees,B.C. Ball, C.D. Campbell & C.A. Watson), pp. 43–53. CABInternational, Wallingford.
Poeplau, C. & Don, A. 2013. Sensitivity of soil organic carbon stocks andfractions to different land-use changes across Europe. Geoderma , 192,189–201.
Raine, S.R. & So, H.B. 1997. An investigation of the relationshipsbetween dispersion, power, and mechanical energy using the end-over-end shaking and ultrasonic methods of aggregate stability assessment.Australian Journal of Soil Research , 35, 41–53.
Schmidt, M.W.I., Torn, M.S., Abiven, S., Dittmar, T., Guggenberger, G.,Janssens, I.A., et al. 2011. Persistence of soil organic matter as anecosystem property. Nature, 478, 49–56.
Shaymukhametov, M.S., Titova, N.A., Travnikova, L.S. & Labenets, Y.M.1984. Use of physical fractionation methods to characterize soil organicmatter. Soviet Soil Science, 16, 117–128.
Siregar, A., Kleber, M., Mikutta, R. & Jahn, R. 2005. Sodium hypochloriteoxidation reduces soil organic matter concentrations without affectinginorganic soil constituents. European Journal of Soil Science, 56,481–490.
Six, J., Guggenberger, G., Paustian, K., Haumaier, L., Elliott, E.T. &Zech, W. 2001. Sources and composition of soil organic matter fractionsbetween and within soil aggregates. European Journal of Soil Science,52, 607–618.
Smith, J.U., Smith, P., Monaghan, R. & Macdonald, J. 2002. When isa measured soil organic matter fraction equivalent to a model pool?European Journal of Soil Science, 53, 405–416.
Sollins, P., Swanston, C., Kleber, M., Filley, T., Kramer, M., Crow, S.,et al. 2006. Organic C and N stabilization in a forest soil: evidencefrom sequential density fractionation. Soil Biology & Biochemistry , 38,3313–3324.
Trumbore, S.E., Vogel, J.S. & Southon, J.R. 1989. AMS C-14 measure-ments of fractionated soil organic matter- an approach to decipheringthe soil carbon cycle. Radiocarbon , 31, 644–654.
Xu, X.L., Liu, W. & Kiely, G. 2011. Modeling the change in soilorganic carbon of grassland in response to climate change: effects ofmeasured versus modelled carbon pools for initializing the Rotham-sted Carbon model. Agriculture, Ecosystems & Environment , 140,372–381.
Zimmermann, M., Leifeld, J., Schmidt, M.W.I., Smith, P. & Fuhrer,J. 2007. Measured soil organic matter fractions can be related topools in the RothC model. European Journal of Soil Science, 58,658–667.
© 2013 The AuthorsJournal compilation © 2013 British Society of Soil Science, European Journal of Soil Science