reprint 848 observed by the hong kong tdwr radar
TRANSCRIPT

Reprint 848
Estimate of Eddy Dissipation Rate Using Spectrum Width
Observed by the Hong Kong TDWR Radar
P. Zhang1, P.W. Chan, R. Doviak2, and M. Fang1
34th Conference on Radar Meteorology,
Williamsburg, VA, USA, 5-9 October 2009
1CIMMS, University of Oklahoma, Norman, Oklahoma
2 NOAA/National Severe Storms Laboratory, Norman, Oklahoma

P6.9 Estimate of Eddy Dissipation Rate Using Spectrum Width Observed by the Hong Kong TDWR Radar
P. Zhang*1, P.W. Chan2, R. Doviak3, and M. Fang1
1CIMMS, University of Oklahoma, Norman, Oklahoma
2 Hong Kong Observatory, Hong Kong, China 3 NOAA/National Severe Storms Laboratory, Norman, Oklahoma
1. Introduction Eddy Dissipation Rate (EDR) is a well established parameter to measure turbulence intensity. The relationship between Doppler radar measured spectrum width and EDR has been established for decades (Frisch and Strauch, 1976; Knupp and Cotton, 1982; Istok and Doviak, 1985). EDR estimation has a very practical application to aviation safety (Lee, 1977; Lewis, 1981). A Terminal Doppler Weather Radar (TDWR) and two Light Detection And Ranging (LIDAR) systems are operated by the Hong Kong Observatory (HKO) to provide low-level wind shear and turbulence alerting services for the Hong Kong International Airport (HKIA). Due to their wavelengths, these two types of equipment are complementary to each other under different weather conditions. TDWR works best in rainy weather, and LIDARs have their advantage in clear air conditions. To improve turbulence alerting, a method based on structure function approach to estimate EDR in the vicinity of HKIA using LIDAR’s Doppler velocity measurements has been developed by HKO (Chan and Kwong, 2008). In order to monitor turbulence in rainy weather, the feasibility of
developing a method using TDWR measurements to estimate EDR is also needed. In this paper, the algorithm that estimates Eddy Dissipation Rates (EDR) from Hong Kong TDWR radar measured spectrum width has been introduced and applied to 14 cases under different weather conditions. The results are also presented and compared with EDR estimation from the aircraft (commercial jets). 2. Methodology The measurement of spectrum width is determined not only by the Doppler velocity distribution and density distribution of the scatterers within the resolution volume, but also radar observation parameters like beamwidth, pulse width, antenna rotation rate, etc. According to Doviak and Zrnic (2006), there are five major spectral broadening mechanisms that contribute to the spectrum width measurements, which can be written as follow
222222odtsv σσσσσσ α ++++= (1)
where σs represents mean wind shear contribution, σt represents turbulence, σα represents antenna motion, σd represents different terminal velocities of hydrometeors of different sizes, and σo represents variations of orientations and
_______________________________*Corresponding author address: Pengfei Zhang, CIMMS, University of Oklahoma, Norman, OK 73072; e-mail: [email protected]
vibrations of hydrometeors. Except σs
and σt, the rest of the terms on the right hand side of the Eq.(1) are considered to be negligible for the measurements of σv in this paper (Brewster and Zrnic, 1986). Thus the turbulence term σs can be obtained, σt
2 = σv2 - σs
2 . (2) In the Eq.(2), mean wind shear width term σs can be decomposed into three terms due to mean radial velocity shear at three orthogonal directions in radar coordinate(Doviak and Zrnic, 1993):
2222srsss σσσσ φθ ++=
220
20 )()()( rrkkrkr σσσ φφθθ ++= , (3)
where σr
2 = (0.35cτ/2)2, σθ2 = θ1
2/16ln2, and σφ
2 = θ12/16ln2. Here cτ/2 is range
resolution, and θ1is the one-way angular resolution (i.e., beamwidth). kθ, kφ, and kr are the components of shear along the three orthogonal directions. In order to use σt to estimate EDR ε, it must be assumed that within radar resolution volume turbulence is isotropic and its outer scale is larger than the maximum dimension of the radar’s resolution volume V6. Under these assumptions, in the case of θσσ rr ≤ the relation between turbulence spectrum width σt and EDR ε can be approximately written as (Labitt, 1981)
2/3
372.0Ar
t
θσσ
ε ≈ , (4)
where A is constant (i.e., about 1.6). When θσσ rr ≥ , the relation can be approximated by
2/32
22
2/3
2/32
)154
1511](
)35.1([ −+
><≈
rr
t rA σ
σσ
σε θ
. (5) In section 4, Eqs.(4) and (5) are used to estimate EDR using Hong Kong TDWR observed spectrum width. 3. Hong Kong TDWR Radar Data For monitoring microburst and low altitude wind shear, the Hong Kong TDWR radar is strategically deployed at Tai Lam Chung, about 12 km to the northeast of HKIA (see Fig.1). The radar beams over the airport are almost aligned with the orientation of the runways. Thus changes in the tail or head wind encountered by the aircrafts as they are landing or taking-off can be well measured by the TDWR. In hazardous weather mode, the Hong Kong TDWR conducts sector scans from azimuth 182o to 282o (i.e., confined to the approach and departure paths; Shun et al., 2003). Each sector scan takes about 4 minutes. Thus, the low altitude wind shear can be detected within a minute. The scan strategy of TDWR in hazardous weather mode is listed on Table 1. The range and angular resolutions of the radar are 150 m and 0.5o respectively. The maximum range reaches 90 km. The radar data includes reflectivity, Doppler velocity, spectrum width, and signal-to-noise ratio (SNR) recorded with the azimuth interval of 1o.

Fig.1 The locations of the Hong Kong TDWR (red dot) radar and Hong Kong International Airport (HKIA). The blue beams illustrate the radar beams over the runways corridor 07LA of the airport with 1o azimuth interval. Three yellow lines indicate the approach paths and their names are marked. Table 1: Volume scan strategy of Hong Kong TDWR in the hazardous weather mode. Scan No. 1 2 3 4 5 6 7 8
Elev. angle 0.6 0.6 0.6 2.4 6.0 9.2 13.0 16.8
Scan No. 9 10 11 12 13 14 15 16
Elev. angle 20.6 24.4 0.6 1.0 28.2 32.0 35.8 29.6
Scan No. 17 18 19 20 21 22 23 24
Elev. angle 0.6 2.4 6.0 9.2 13.0 16.8 20.6 0.6
Scan No. 25 26 27 28 29 30 31
Elev. angle 24.4 28.2 32.0 35.8 39.6 0.6 1.1
TDWR
HKIA
25RA
07LA
25LA

4. EDR Estimation Using Spectrum Width Based on the Eqs.(4) and (5), EDR can be estimated when spectrum width observation is available. In this feasibility study, EDR estimation is only performed at the lowest elevation angle of 0.6o. The vertical wind shear contribution to the EDR is calculated by using spatially averaged mean Doppler velocity at two lowest elevation angles. Because the closet two elevation angles at lowest level are 0.6o and 1.0o at scans 11 and 12 (Table 1), vertical wind shear is calculated by using the Doppler velocity fields at these two scans. For the simplicity, EDR is estimated at scan 17 with elevation angle of 0.6o. Azimuthal and radial wind shear is also calculated at this scan. So in the current algorithm, one EDR field at elevation angle of 0.6o will be generated for each volume scan. The control of the TDWR spectrum width data quality is very important for EDR estimation. It has been found that there is a variety of sources of errors in spectrum width measurements in the previous studies (Fang et al. 2004). Especially if signal to noise ratio (SNR) is low, spectrum width measurements have large variance. In this study, SNR >
20 dB is assigned as a simple and straightforward threshold for the EDR estimates. In other words, EDR at the gate with SNR < 20 dB is marked as missing data (MD) in our algorithm. In the future, more comprehensive quality control processor will be designed and implemented in our algorithm to deal with other error sources.
4.1 EDR maps Following international practice, EDR values are classified into four categories in terms of the intensity of turbulence (see Table 2). For convenience and in line with alerting purpose of low-level turbulence, EDRs in the following figures and context will be labeled or indicated as insignificant (LL), light (L), moderate (M), and severe (S) instead of its value. It is also worth mentioning that EDR values presented in this paper are derived from the spectrum width data after smoothing by using a 9 point median filter along the radar beams in order to suppress the fluctuations in the determination of spectrum width values. This kind of fluctuation is expected, for instance, to arise from the limited and finite number of data points in the digitization of the spectrum of the return signal.
Table 2: Turbulence intensity category.
Turbulence Intensity insignificant light moderate severe
EDR ( sm /3/2 ) 0-0.1 0.1-0.3 0.3-0.5 > 0.5 As mentioned in the previous section, the spectrum width errors are large in region of low SNR. Here we selected a case to demonstrate the importance of the SNR threshold in the quality control of EDR data. Around 21 UTC on 6 June 2008, the TDWR radar observed
thunderstorms over HKIA. Without SNR threshold, estimated EDR suggested severe turbulence region (red color; Fig.2a) in the region about azimuth of 270o and centered at about 25 km. High spectrum widths (~4.5 m/s) are indeed measured in this region (See Fig.2c). But
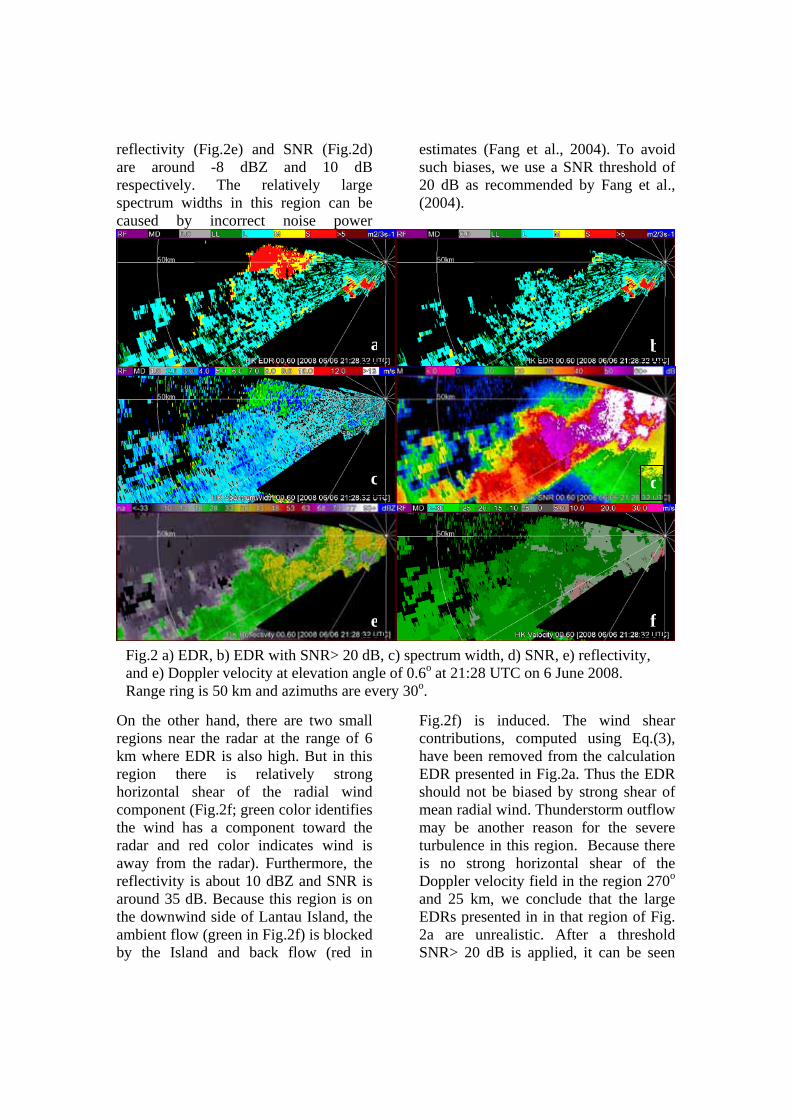
reflectivity (Fig.2e) and SNR (Fig.2d) are around -8 dBZ and 10 dB respectively. The relatively large spectrum widths in this region can be caused by incorrect noise power
estimates (Fang et al., 2004). To avoid such biases, we use a SNR threshold of 20 dB as recommended by Fang et al., (2004).
On the other hand, there are two small regions near the radar at the range of 6 km where EDR is also high. But in this region there is relatively strong horizontal shear of the radial wind component (Fig.2f; green color identifies the wind has a component toward the radar and red color indicates wind is away from the radar). Furthermore, the reflectivity is about 10 dBZ and SNR is around 35 dB. Because this region is on the downwind side of Lantau Island, the ambient flow (green in Fig.2f) is blocked by the Island and back flow (red in
Fig.2f) is induced. The wind shear contributions, computed using Eq.(3), have been removed from the calculation EDR presented in Fig.2a. Thus the EDR should not be biased by strong shear of mean radial wind. Thunderstorm outflow may be another reason for the severe turbulence in this region. Because there is no strong horizontal shear of the Doppler velocity field in the region 270o and 25 km, we conclude that the large EDRs presented in in that region of Fig. 2a are unrealistic. After a threshold SNR> 20 dB is applied, it can be seen
a b
c
e
d
f
Fig.2 a) EDR, b) EDR with SNR> 20 dB, c) spectrum width, d) SNR, e) reflectivity, and e) Doppler velocity at elevation angle of 0.6o at 21:28 UTC on 6 June 2008. Range ring is 50 km and azimuths are every 30o.

that these large EDR values are removed (Fig.2b). Using the Hong Kong TDWR observations in 2006 and 2008, many EDR maps were produced and examined. Here wind shear contribution has been removed from spectrum width measurements. Here the mean wind shears in horizontal and vertical directions are calculated by using mean radial velocity field smoothed by a 9 points median filter along the radar beam in the Eq.(3). Fig.3 shows two typical EDR maps during light rain at 21:32 UTC on 27 April 2006 (Fig.3a) and during a thunderstorm at 13:17 UTC on 13 June 2008 (Fig.3b). For most of the scanned area, EDR is low and turbulence is classified as insignificant or light (green and light blue). Small pockets of moderate and severe turbulence (yellow and red) are scattered in the scanned area. Near the Lantau Island (see Fig.1), moderate and severe levels of turbulence are frequently observed in the cases we
studied. The blockage of the Island on the ambient flow may be a reason for the occurrence of the turbulent airflow. Based on the numerical simulations, Clark et al. (1997) and Chan (2009) found that mechanical effect of a mountainous island is a source of the generation of the turbulence. Clear air cases have been investigated as well, but we found that SNR of the Hong Kong TDWR is too low to provide reliable and meaningful EDR maps. 4.2 EDR comparisons After the EDR maps were generated, EDR profiles along the flight paths can be compared with aircraft measured EDR. A total of 14 cases are selected to make the comparison. The flight time, flight number, aircraft type, their runway, and maximum EDR measured along the 5 nm approach paths are listed in Table 3. The aircraft EDRs are estimated based on the vertical wind measured by aircraft (Cornman et al., 2004).
Table 3: List of maximum EDR measured by aircrafts at HKIA.
Case No.
Date UTC Flight No.
Aircraft Type
Runway Max. EDR
1 20060427 21:20 CX138 A330 25LA 0.1933 2 20060427 21:29 CX081 B747 25LA 0.3131 3 20080419 13:05 CX367 B777 25RA 0.6274 4 20080606 03:51 CX710 B777 07LA 0.4689 5 20080613 13:16 CX451 B747 25RA 0.4240 6 20080624 23:12 CX252 B747 25RA 0.3461 7 20080625 06:53 CX718 B777 25RA 0.4504 8 20080625 07:17 CX110 A330 25RA 0.2716 9 20080625 12:13 CX467 A330 25RA 0.2811 10 20080626 06:04 CX708 A330 25RA 0.1778 11 20080806 18:52 CX883 B747 07LA 0.3641 12 20080924 00:05 CX288 B747 07LA 0.5812 13 20081005 10:03 CX066 B747 25RA 0.4226 14 20081005 10:26 CX411 A330 25RA 0.3116
Radar derived EDR profile is constructed by selecting the EDRin a resolution volume V6 closest to the flight path and at an elevation angle of 0.6o. There are still differences in the measurement heights between the aircraft and the radar beam for these two EDR datasets. Only a part of the flight path is covered by the radar beam. For example, aircraft approaching runway 25RA is in the radar beam only at the distance between 0.5 and 1.5 nm from the end of runway. From this point of view, EDRs estimated by aircraft and the radar would be compared within this distance interval. It should also be mentioned that radar estimated EDR is based on the spectrum width of the Doppler velocity, i.e. velocity in the radial direction along a radar beam. On the other hand, the aircraft estimated EDR is based on the vertical wind. As such, the two EDR datasets are derived from different components of the wind. Put aside errors in measurement, in order to have agreement turbulence must be isotropic. Another issue of the comparison is the contribution of mean wind shear to the measured spectrum width. For the estimation of EDR, the contribution of wind shear has to be extracted from the radar measured spectrum width. But for the comparison with aircraft measured EDR or even turbulence alert for aviation safety, wind shear might not need to be removed. For example if the aircraft experiences a sharp change in altitude, this may not be caused by isotropic turbulence but it is a measure of aircraft response to vertical shear of mean wind. As such, the aircraft estimated EDR based on vertical velocity may be slightly higher. Pilots
and passengers in aircraft may also experience severe “turbulence”, which is a combination of the effects of both turbulence and wind shear. Scatterplots of median and maximum EDR along the 5 nm of flight paths estimated by aircraft and radar are shown in Fig.4. Two plots for each are shown; one in which mean wind shear contributions to the observed spectrum widths are removed and a second plot in which mean wind shear contribution has been retained. All median EDRs are smaller than 0.4 sm /3/2 (i.e., moderate or light turbulence). 13 of 14 median EDRs indicate turbulences are light. Based on maximum EDRs, two severe turbulent patches (EDR > 0.5 sm /3/2 ) are detected by both aircraft and radar with wind shear, but they are not on the same flight paths (Fig.4d). With wind shear contribution, median and maximum radar EDRs evidently increase. Comparing maximum intensity between aircraft and radar without wind shear, 8 of the 14 cases are in the same category. Seven of them are moderate turbulence. For 4 aircraft estimated light turbulence cases, the radar tends to overestimate them as moderate (3 cases) and severe (1 case) with wind shear contribution. After closer examination of the overestimation case at 07:17 UTC on 25 June 2008 (case No. 8), it is found that the maximum severe turbulence only occurs at one radar gate at the distance of 0 nm, closest to the end of the runway. It is noted that at this location, the radar beam is higher than the flight path by about 160m.

Fig. 4 Scatterplots of median and maximum EDR estimated by aircraft and radar along the 5 nm of flight paths for the selected 14 cases. We have also compared aircraft and radar estimated EDR profiles including wind shear contribution along the aircraft flight path. The case we selected to illustrate this comparison is case No. 3 in Table 3. For this case, aircraft B777 flew through a storm with maximum reflectivity of 42 dBZ and landed in clouds and light rain at HKIA (Fig.5; the blue arrow line represents the flight path).
Fig.6 shows the EDR estimated by aircraft and the radar along the flight path 25RA around 13:05 UTC on 19 April 2008 (case No. 3). It is one of the two cases in which severe turbulence was encountered by the aircraft. Blue dots in Fig.6 represent the EDR estimated by the aircraft as it was landing at HKIA. Three peaks over 0.5
sm /3/2 , classified as severe turbulence, are recorded at distance of 0.77, 3.65,
Median EDR
Median EDR
Maximum EDR
Maximum EDR
Shear removed Shear removed

and 4.90 nm away from the runway end. EDR profiles estimated by using radar data at an elevation angle of 0.6o (scan No. 18 in Table 1) with the wind shear contribution included in the volume scans around 13:05 UTC are overlaid onto the aircraft estimated EDR in Fig.6. The radar estimated EDR profiles at 13:01, 13:05, and 13:09 UTC (brown dots, red squares, and green dots in Fig.5) matches well with aircraft EDR between distance of 0.5 and 1.5 nm, shaded in green color in Fig.5, where the aircraft was in a region common to the 0.6o radar beam. It means that radar and aircraft were measuring turbulence in approximately the same region at nearly the same time. The peaks of these 3 EDR profiles at 13:01, 13:05, and 13:09 UTC are in the green shaded interval and the maximum value is 0.48 sm /3/2 , just slightly smaller than 0.5 sm /3/2 . In order to find if there are higher EDR near the flight time (13:05 UTC), we examined the EDR for the two scans one minute before and after the passage of the aircraft at 13:05 UTC (i.e., used scans No. 12 and 25 in Table1) in the same volume scan at 13:05 UTC. The profiles are shown with light and dark purple dots in Fig.6. High EDRs with values of 0.69 and 0.76 sm /3/2 are found within the shaded interval. This convinces us that the EDR peak is not caused by random error of radar measurements. It raises another question: the aircraft may contaminate the radar
measurements of the atmospheric status, since the aircraft disturbs the atmosphere and changes the original atmospheric condition in the measurement region as it flies by. In addition, aircraft itself as a target embedded in other scatterers, such as raindrops, may contaminate the spectrum width measurements as well. Both of the two factors could affect spectrum width and EDR value. It could also be seen that the radar EDR profiles do not match the two aircraft estimated EDR peaks at the distance of 3.65 and 4.90 nm. It might be caused by the spatial difference between the aircraft and the radar beams. The flight heights at the distance of 3.65 and 4.90 nm are higher than the radar beams by about 260 m and 400 m respectively. Wind shear contribution to spectrum width measurement for this case has been examined. After removing wind shear contribution, the EDR peak at the distance of 0.69 nm is reduced from 0.48 to 0.46 sm /3/2 (not shown) at 13:05 UTC. It means that wind shear contribution is small in this region. Because wind shear of the large scale mean wind should be persistent over the 4 minute for entire volume scan, the EDR peaks without wind shear contribution at 13:04 and 13:06 UTC at the distance of 0.69 nm are reduced to 0.67 and 0.74 sm /3/2 respectively. It indicates severe turbulence that is matched with aircraft estimate at 13:05 UTC.

Fig.5 a) EDR, b) spectrum width, c) reflectivity factor, and d) Doppler velocity at elevation angle of 0.6o at 13:05 UTC on 19 April 2008. Range ring is at 10 km. Blue arrow line indicates the 5 nm approach path to runway 25RA with length of 5 nm. End of the runway is at the tip of arrow.
Fig.6 EDR along the flight path estimated by the aircraft B777 (blue dots) at 13:05 UTC and by the TDWR radar at the time indicated in the legend on 19 April 2008. X axis is the distance between aircraft and the end of runway. The distance interval shaded by the green color indicates where the aircraft passes through the altitude interval observed with the 0.6o elevated beam.
Note that the aircraft estimated EDR is considered as ground truth in the above analysis, but it also contains errors and
requires significant QC effort, especially as airplane is climbing or descending (Gilbert et al., 2004).
a b
c d
5. Conclusions and Discussions This preliminary study shows that the Hong Kong TDWR measurements provide a good means of estimating EDR in the precipitation environment. Comparing radar EDR estimates with those derived from aircraft measurements, radar EDRs are reasonable and agree with aircraft measurements. Based on the results on the present study, it is believed that estimating EDR by using the TDWR radar measured spectrum width should be useful for monitoring low-level turbulence at HKIA. Certainly, more in-depth study on the design of the operational algorithm and integration of this algorithm into the wind shear and turbulence alerting system would be required. For example, how to deal with wind shear of the mean radial velocity at different scale and magnitude is a critical issue. Moreover, in this study, only the EDR value at lowest elevation angle (0.6o) is generated and examined. The EDR value at the higher elevation angles should also be considered, noting that some of the discrepancies with the aircraft data might be explained by the height difference. So what kind of temporal and spatial resolution of radar EDR product is proper to monitor turbulence? This is another question that needs to be answered. References Brewster, K.A. and D.S. Zrnic, 1986: Comparison of eddy dissipation rate from spatial spectra of Doppler velocities and Doppler spectrum widths. J. Atmos. Oceanic Technol., 3, 440-452. Chan, P.W., 2009: Atmospheric turbulence in complex terrain: verifying
numerical model results with observations by remote-sensing instruments. Meteorology and Atmospheric Physics, 103, 145–157. Chan, P.W., and K.M. Kwong, 2008: Performance of LIDAR-based turbulence detection algorithm. Preprints, 13th Conf. on Aviation, Range and Aerospace Meteorology. New Orleans, LA, Amer. Meteor. Soc.,CD-ROM, P4.5. Clark, T.L., T. Keller, J. Coen, P. Neilley, H. Hsu, and W.D. Hall, 1997: Terrain-induced turbulence over Lantau Island: 7 June 1994 Tropical Storm Russ case study. J. Atmos. Sci., 54, 1795-1814. Cornman, L. B., G. Meymaris, and M. Limber, 2004: An update on the FAA Aviation Weather Research Program’s in situ turbulence measurement and reporting system. Preprints, Eleventh Conf. on Aviation, Range, and Aerospace Meteorology, Hyannis, MA, Amer. Meteor. Soc., P4.3. Fang, M., R.J. Doviak, and Melnikov, 2004: Spectrum width measured by the WSR-88D radar: Error sources and statistics of various weather phenomena. J. Atmos. Oceanic Technol., 21, 888-904. Frisch, A.S., and R.G. Strauch, 1976: Doppler radar measurements of turbulent kinetic energy dissipation rates in northeastern Colorado convective storm. J. Appl. Meteor., 15, 1012-1017. Gilbert, D., L.B. Cornman, A.R. Rodi, R.G. Frechlich, and R.K. Goodrich, 2004: Calculating EDR from aircraft wind data during flight in and out of Juneau AK: Techniques and challenges associated with non-straight and level flight patterns. Preprints, 11th Conf. on
Aviation, Range and Aerospace Meteorology. Hyannis, MA, Amer. Meteor. Soc., CD-ROM, 4.4. Doviak, R. J., and D. S. Zrnic, 2006: Doppler radar and weather observations. Dover Publications Inc., Mineola, New York, 562 pp. (except for the preface with links to online errata and supplements, this is an exact copy of the 1st and 2nd printing of the 1993 Academic Press edition). Istok, M.J., and R.J. Doviak, 1986: An analysis of the relation between Doppler spectral width and thunderstorm turbulence. J. Atmos. Sci., 43, 2199-2214. Knupp, K.R. and W.R. Cotton, 1982: An intense quasi-steady thunderstorm over mountainous terrain. Part II: Doppler radar observations of turbulence structure. J. Atmos. Sci., 69, 359-368. Labitt, M., 1981: Coordinated radar and aircraft observations of turbulence. Project Rep. ATC 108, MIT, Lincoln Lab, 39 pp. Lee, J. T., 1977: Application of Doppler radar to turbulence measurements which affect aircraft. Final Rep. FAA-RD-77-145. FAA Syst. Res. Dev. Serv., Washington, DC, 45pp. Lewis, W., 1981: Doppler radar and aircraft measurement of thunderstorm turbulence. Preprints, 20th Conf. on Radar Meteorology. Boulder, Amer. Meteor. Soc, 158-161. Shun, C.M, S.Y. Lau, and O.S.M. Lee, 2003: Terminal Doppler weather radar observation of atmospheric flow over complex terrain during tropical cyclone
passages. J. Appl. Meteor. 42, 1697-1710