representation strategies in two-handed melodic sound-tracing
TRANSCRIPT

Representation Strategies in Two-handed MelodicSound-Tracing
Tejaswinee KelkarUniversity of Oslo
Department of Musicology, fourMs LabOslo, Norway
Alexander Refsum JenseniusUniversity of Oslo
Department of Musicology, fourMs LabOslo, Norway
ABSTRACT�is paper describes an experiment in which the subjects performeda sound-tracing task to vocal melodies. �ey could move freelyin the air with two hands, and their motion was captured usingan infrared, marker-based system. We present a typology of dis-tinct strategies used by the recruited participants to represent theirperception of the melodies. �ese strategies appear as ways torepresent time and space through the �nite motion possibilitiesof two hands moving freely in space. We observe these strategiesand present their typology through qualitative analysis. �en wenumerically verify the consistency of these strategies by conductingtests of signi�cance between labeled and random samples.
KEYWORDSSound-tracing, music-related body motion, melody perception, mo-tion capture, musical gesture
ACM Reference format:Tejaswinee Kelkar and Alexander Refsum Jensenius. 2017. Representa-tion Strategies in Two-handed Melodic Sound-Tracing . In Proceedings ofMovement and Computing Conference, London, UK, July 2017 (MOCO’17),4 pages.DOI: 10.475/123 4
1 INTRODUCTIONMoving the hands in the air when listening to music, what wewill refer to as sound-tracing, may be seen as a representation ofour experience of the music in question [8]. Spontaneous sound-tracing can be found in many di�erent musical contexts, both inpublic (such as at concerts) or in private se�ings. �ere are alsoexamples of more formalized sound-tracing, for example in varioustypes of dance and theatre performances, but also in music perfor-mance, such as the music-accompanying hand gesturing found inNorth Indian music. �e common denominator seems to be thatthe hand actions represent changes in musical expression over time.�ey may also be seen to have both representative and communica-tive functions, not unlike co-speech hand gestures [10] [5]. �e
Permission to make digital or hard copies of all or part of this work for personal orclassroom use is granted without fee provided that copies are not made or distributedfor pro�t or commercial advantage and that copies bear this notice and the full citationon the �rst page. Copyrights for components of this work owned by others than ACMmust be honored. Abstracting with credit is permi�ed. To copy otherwise, or republish,to post on servers or to redistribute to lists, requires prior speci�c permission and/or afee. Request permissions from [email protected]’17, London, UK© 2017 ACM. 123-4567-24-567/08/06. . .$15.00DOI: 10.475/123 4
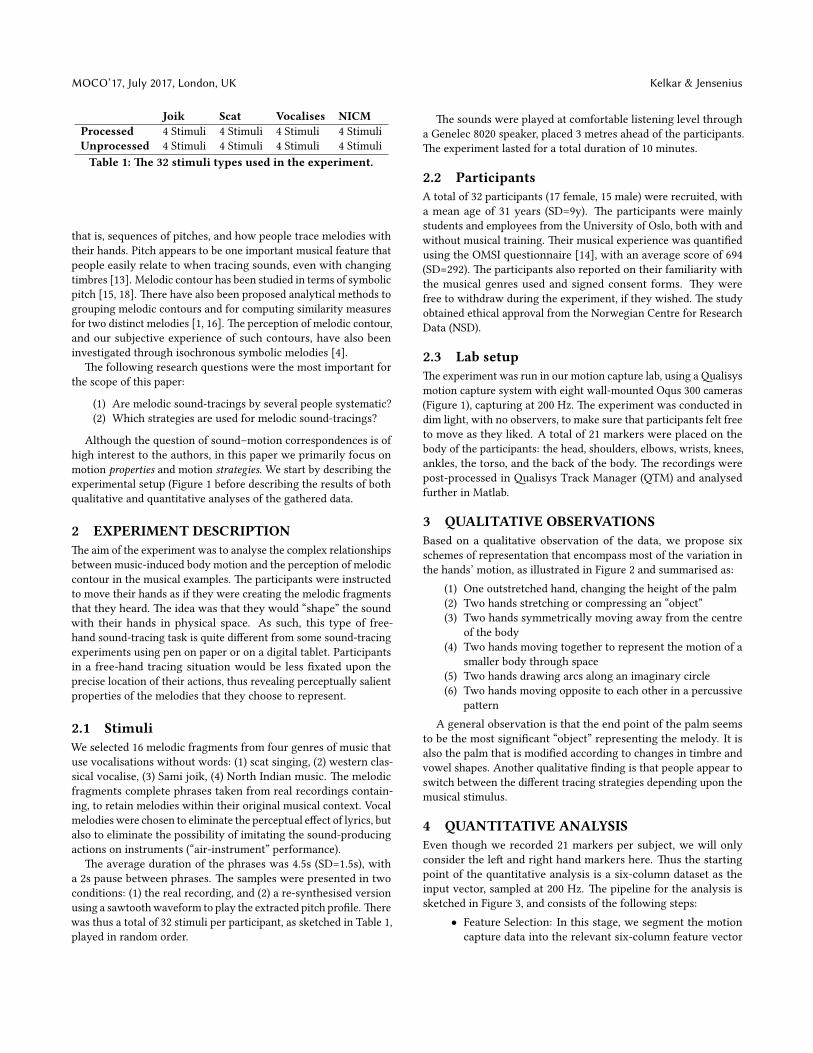
Figure 1: �e experimental setup for the sound-tracingstudy: a subject wearing amotion capture suit with 21mark-ers, with eight wall-mounted cameras in the lab.
cognitive aspects of such motion have been explained through ex-perimental listener studies [2], and by comparing the relationshipof sound and music features in various contexts [6].
Sound-tracing has also been used as a research method to under-stand more about our cognition of music by looking at how peoplemove when listening to music [7, 12, 13, 17]. �e starting pointhere is the belief that our cognition of music is inherently embodiedin nature [9], and that this may be connected to the way in whichthe auditory and motor regions of the brain are connected to eachother at a neural level. Auditory activity automatically triggersmotor regions in the brain, regardless of any physical motion beingcarried out [3]. �e theory of bimanual motor control, symmetricalpa�erns of hand motion, and the in�uence of perception for theproduction of hand motion on each other is also pertinent to thediscussion of this study. [11]
Several of the previous sound-tracing studies have found thatthere seems to be a correlation between how diverse people inter-pret the same musical stimuli. �is paper is concerned with melody,
MOCO’17, July 2017, London, UK Kelkar & Jensenius
Joik Scat Vocalises NICMProcessed 4 Stimuli 4 Stimuli 4 Stimuli 4 StimuliUnprocessed 4 Stimuli 4 Stimuli 4 Stimuli 4 StimuliTable 1: �e 32 stimuli types used in the experiment.
that is, sequences of pitches, and how people trace melodies withtheir hands. Pitch appears to be one important musical feature thatpeople easily relate to when tracing sounds, even with changingtimbres [13]. Melodic contour has been studied in terms of symbolicpitch [15, 18]. �ere have also been proposed analytical methods togrouping melodic contours and for computing similarity measuresfor two distinct melodies [1, 16]. �e perception of melodic contour,and our subjective experience of such contours, have also beeninvestigated through isochronous symbolic melodies [4].
�e following research questions were the most important forthe scope of this paper:
(1) Are melodic sound-tracings by several people systematic?(2) Which strategies are used for melodic sound-tracings?
Although the question of sound–motion correspondences is ofhigh interest to the authors, in this paper we primarily focus onmotion properties and motion strategies. We start by describing theexperimental setup (Figure 1 before describing the results of bothqualitative and quantitative analyses of the gathered data.
2 EXPERIMENT DESCRIPTION�e aim of the experiment was to analyse the complex relationshipsbetween music-induced body motion and the perception of melodiccontour in the musical examples. �e participants were instructedto move their hands as if they were creating the melodic fragmentsthat they heard. �e idea was that they would “shape” the soundwith their hands in physical space. As such, this type of free-hand sound-tracing task is quite di�erent from some sound-tracingexperiments using pen on paper or on a digital tablet. Participantsin a free-hand tracing situation would be less �xated upon theprecise location of their actions, thus revealing perceptually salientproperties of the melodies that they choose to represent.
2.1 StimuliWe selected 16 melodic fragments from four genres of music thatuse vocalisations without words: (1) scat singing, (2) western clas-sical vocalise, (3) Sami joik, (4) North Indian music. �e melodicfragments complete phrases taken from real recordings contain-ing, to retain melodies within their original musical context. Vocalmelodies were chosen to eliminate the perceptual e�ect of lyrics, butalso to eliminate the possibility of imitating the sound-producingactions on instruments (“air-instrument” performance).
�e average duration of the phrases was 4.5s (SD=1.5s), witha 2s pause between phrases. �e samples were presented in twoconditions: (1) the real recording, and (2) a re-synthesised versionusing a sawtooth waveform to play the extracted pitch pro�le. �erewas thus a total of 32 stimuli per participant, as sketched in Table 1,played in random order.
�e sounds were played at comfortable listening level througha Genelec 8020 speaker, placed 3 metres ahead of the participants.�e experiment lasted for a total duration of 10 minutes.
2.2 ParticipantsA total of 32 participants (17 female, 15 male) were recruited, witha mean age of 31 years (SD=9y). �e participants were mainlystudents and employees from the University of Oslo, both with andwithout musical training. �eir musical experience was quanti�edusing the OMSI questionnaire [14], with an average score of 694(SD=292). �e participants also reported on their familiarity withthe musical genres used and signed consent forms. �ey werefree to withdraw during the experiment, if they wished. �e studyobtained ethical approval from the Norwegian Centre for ResearchData (NSD).
2.3 Lab setup�e experiment was run in our motion capture lab, using a �alisysmotion capture system with eight wall-mounted Oqus 300 cameras(Figure 1), capturing at 200 Hz. �e experiment was conducted indim light, with no observers, to make sure that participants felt freeto move as they liked. A total of 21 markers were placed on thebody of the participants: the head, shoulders, elbows, wrists, knees,ankles, the torso, and the back of the body. �e recordings werepost-processed in �alisys Track Manager (QTM) and analysedfurther in Matlab.
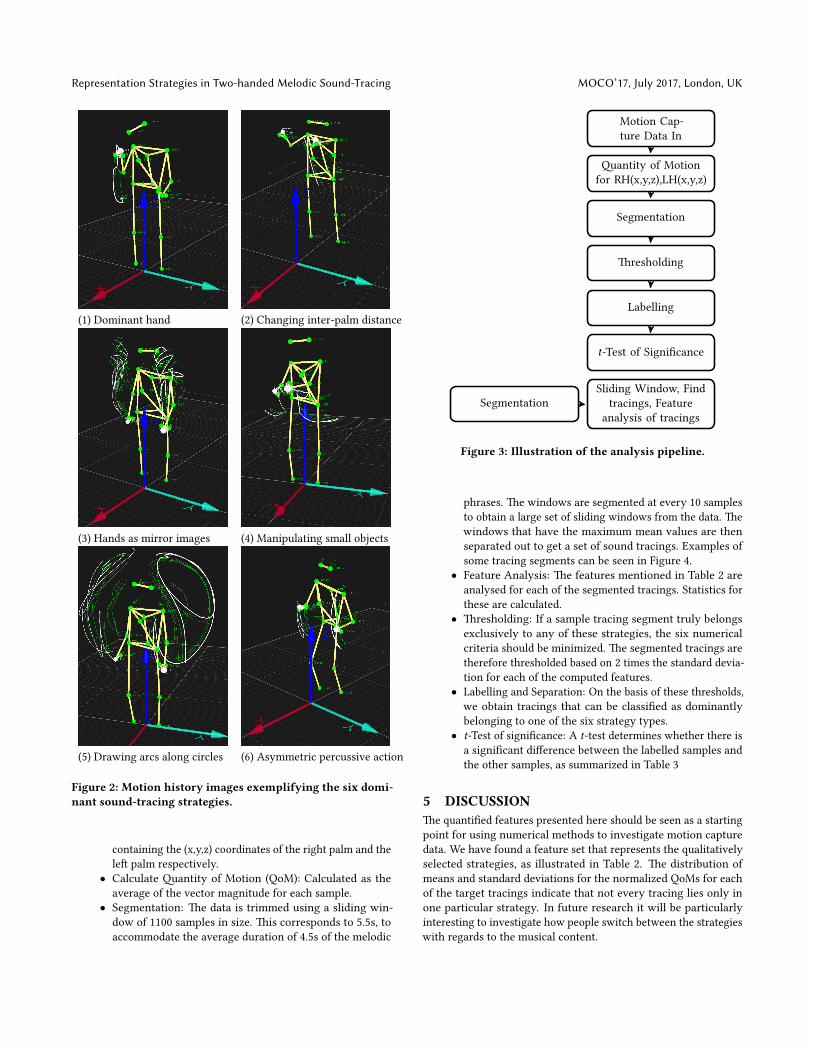
3 QUALITATIVE OBSERVATIONSBased on a qualitative observation of the data, we propose sixschemes of representation that encompass most of the variation inthe hands’ motion, as illustrated in Figure 2 and summarised as:
(1) One outstretched hand, changing the height of the palm(2) Two hands stretching or compressing an “object”(3) Two hands symmetrically moving away from the centre
of the body(4) Two hands moving together to represent the motion of a
smaller body through space(5) Two hands drawing arcs along an imaginary circle(6) Two hands moving opposite to each other in a percussive
pa�ernA general observation is that the end point of the palm seems
to be the most signi�cant “object” representing the melody. It isalso the palm that is modi�ed according to changes in timbre andvowel shapes. Another qualitative �nding is that people appear toswitch between the di�erent tracing strategies depending upon themusical stimulus.
4 QUANTITATIVE ANALYSISEven though we recorded 21 markers per subject, we will onlyconsider the le� and right hand markers here. �us the startingpoint of the quantitative analysis is a six-column dataset as theinput vector, sampled at 200 Hz. �e pipeline for the analysis issketched in Figure 3, and consists of the following steps:
• Feature Selection: In this stage, we segment the motioncapture data into the relevant six-column feature vector
Representation Strategies in Two-handed Melodic Sound-Tracing MOCO’17, July 2017, London, UK
(1) Dominant hand (2) Changing inter-palm distance
(3) Hands as mirror images (4) Manipulating small objects
(5) Drawing arcs along circles (6) Asymmetric percussive action
Figure 2: Motion history images exemplifying the six domi-nant sound-tracing strategies.
containing the (x,y,z) coordinates of the right palm and thele� palm respectively.
• Calculate �antity of Motion (QoM): Calculated as theaverage of the vector magnitude for each sample.
• Segmentation: �e data is trimmed using a sliding win-dow of 1100 samples in size. �is corresponds to 5.5s, toaccommodate the average duration of 4.5s of the melodic
Motion Cap-ture Data In
�antity of Motionfor RH(x,y,z),LH(x,y,z)
Segmentation
�resholding
Labelling
t-Test of Signi�cance
Sliding Window, Findtracings, Feature
analysis of tracingsSegmentation
Figure 3: Illustration of the analysis pipeline.
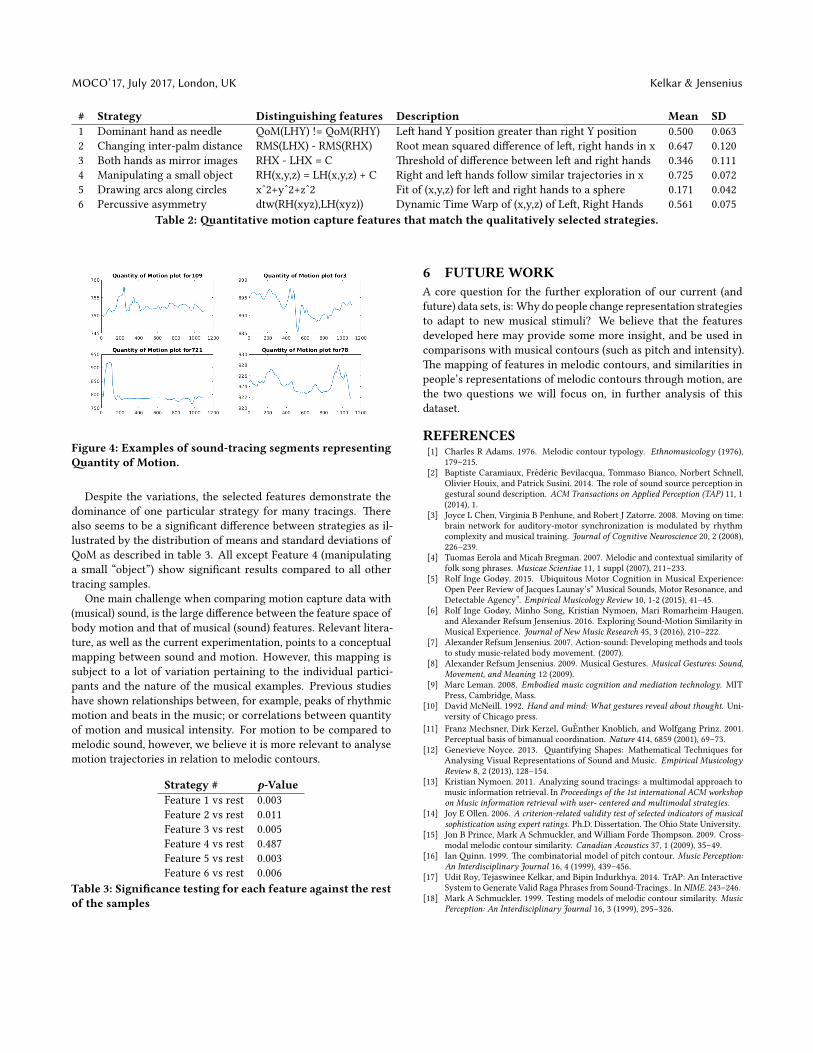
phrases. �e windows are segmented at every 10 samplesto obtain a large set of sliding windows from the data. �ewindows that have the maximum mean values are thenseparated out to get a set of sound tracings. Examples ofsome tracing segments can be seen in Figure 4.
• Feature Analysis: �e features mentioned in Table 2 areanalysed for each of the segmented tracings. Statistics forthese are calculated.
• �resholding: If a sample tracing segment truly belongsexclusively to any of these strategies, the six numericalcriteria should be minimized. �e segmented tracings aretherefore thresholded based on 2 times the standard devia-tion for each of the computed features.
• Labelling and Separation: On the basis of these thresholds,we obtain tracings that can be classi�ed as dominantlybelonging to one of the six strategy types.
• t-Test of signi�cance: A t-test determines whether there isa signi�cant di�erence between the labelled samples andthe other samples, as summarized in Table 3
5 DISCUSSION�e quanti�ed features presented here should be seen as a startingpoint for using numerical methods to investigate motion capturedata. We have found a feature set that represents the qualitativelyselected strategies, as illustrated in Table 2. �e distribution ofmeans and standard deviations for the normalized QoMs for eachof the target tracings indicate that not every tracing lies only inone particular strategy. In future research it will be particularlyinteresting to investigate how people switch between the strategieswith regards to the musical content.
MOCO’17, July 2017, London, UK Kelkar & Jensenius
# Strategy Distinguishing features Description Mean SD1 Dominant hand as needle QoM(LHY) != QoM(RHY) Le� hand Y position greater than right Y position 0.500 0.0632 Changing inter-palm distance RMS(LHX) - RMS(RHX) Root mean squared di�erence of le�, right hands in x 0.647 0.1203 Both hands as mirror images RHX - LHX = C �reshold of di�erence between le� and right hands 0.346 0.1114 Manipulating a small object RH(x,y,z) = LH(x,y,z) + C Right and le� hands follow similar trajectories in x 0.725 0.0725 Drawing arcs along circles xˆ2+yˆ2+zˆ2 Fit of (x,y,z) for le� and right hands to a sphere 0.171 0.0426 Percussive asymmetry dtw(RH(xyz),LH(xyz)) Dynamic Time Warp of (x,y,z) of Le�, Right Hands 0.561 0.075
Table 2: �antitative motion capture features that match the qualitatively selected strategies.
Figure 4: Examples of sound-tracing segments representing�antity of Motion.
Despite the variations, the selected features demonstrate thedominance of one particular strategy for many tracings. �erealso seems to be a signi�cant di�erence between strategies as il-lustrated by the distribution of means and standard deviations ofQoM as described in table 3. All except Feature 4 (manipulatinga small “object”) show signi�cant results compared to all othertracing samples.
One main challenge when comparing motion capture data with(musical) sound, is the large di�erence between the feature space ofbody motion and that of musical (sound) features. Relevant litera-ture, as well as the current experimentation, points to a conceptualmapping between sound and motion. However, this mapping issubject to a lot of variation pertaining to the individual partici-pants and the nature of the musical examples. Previous studieshave shown relationships between, for example, peaks of rhythmicmotion and beats in the music; or correlations between quantityof motion and musical intensity. For motion to be compared tomelodic sound, however, we believe it is more relevant to analysemotion trajectories in relation to melodic contours.
Strategy # p-ValueFeature 1 vs rest 0.003Feature 2 vs rest 0.011Feature 3 vs rest 0.005Feature 4 vs rest 0.487Feature 5 vs rest 0.003Feature 6 vs rest 0.006
Table 3: Signi�cance testing for each feature against the restof the samples
6 FUTUREWORKA core question for the further exploration of our current (andfuture) data sets, is: Why do people change representation strategiesto adapt to new musical stimuli? We believe that the featuresdeveloped here may provide some more insight, and be used incomparisons with musical contours (such as pitch and intensity).�e mapping of features in melodic contours, and similarities inpeople’s representations of melodic contours through motion, arethe two questions we will focus on, in further analysis of thisdataset.
REFERENCES[1] Charles R Adams. 1976. Melodic contour typology. Ethnomusicology (1976),
179–215.[2] Baptiste Caramiaux, Frederic Bevilacqua, Tommaso Bianco, Norbert Schnell,
Olivier Houix, and Patrick Susini. 2014. �e role of sound source perception ingestural sound description. ACM Transactions on Applied Perception (TAP) 11, 1(2014), 1.
[3] Joyce L Chen, Virginia B Penhune, and Robert J Zatorre. 2008. Moving on time:brain network for auditory-motor synchronization is modulated by rhythmcomplexity and musical training. Journal of Cognitive Neuroscience 20, 2 (2008),226–239.
[4] Tuomas Eerola and Micah Bregman. 2007. Melodic and contextual similarity offolk song phrases. Musicae Scientiae 11, 1 suppl (2007), 211–233.
[5] Rolf Inge Godøy. 2015. Ubiquitous Motor Cognition in Musical Experience:Open Peer Review of Jacques Launay’s” Musical Sounds, Motor Resonance, andDetectable Agency”. Empirical Musicology Review 10, 1-2 (2015), 41–45.
[6] Rolf Inge Godøy, Minho Song, Kristian Nymoen, Mari Romarheim Haugen,and Alexander Refsum Jensenius. 2016. Exploring Sound-Motion Similarity inMusical Experience. Journal of New Music Research 45, 3 (2016), 210–222.
[7] Alexander Refsum Jensenius. 2007. Action-sound: Developing methods and toolsto study music-related body movement. (2007).
[8] Alexander Refsum Jensenius. 2009. Musical Gestures. Musical Gestures: Sound,Movement, and Meaning 12 (2009).
[9] Marc Leman. 2008. Embodied music cognition and mediation technology. MITPress, Cambridge, Mass.
[10] David McNeill. 1992. Hand and mind: What gestures reveal about thought. Uni-versity of Chicago press.
[11] Franz Mechsner, Dirk Kerzel, GuEnther Knoblich, and Wolfgang Prinz. 2001.Perceptual basis of bimanual coordination. Nature 414, 6859 (2001), 69–73.
[12] Genevieve Noyce. 2013. �antifying Shapes: Mathematical Techniques forAnalysing Visual Representations of Sound and Music. Empirical MusicologyReview 8, 2 (2013), 128–154.
[13] Kristian Nymoen. 2011. Analyzing sound tracings: a multimodal approach tomusic information retrieval. In Proceedings of the 1st international ACM workshopon Music information retrieval with user- centered and multimodal strategies.
[14] Joy E Ollen. 2006. A criterion-related validity test of selected indicators of musicalsophistication using expert ratings. Ph.D. Dissertation. �e Ohio State University.
[15] Jon B Prince, Mark A Schmuckler, and William Forde �ompson. 2009. Cross-modal melodic contour similarity. Canadian Acoustics 37, 1 (2009), 35–49.
[16] Ian �inn. 1999. �e combinatorial model of pitch contour. Music Perception:An Interdisciplinary Journal 16, 4 (1999), 439–456.
[17] Udit Roy, Tejaswinee Kelkar, and Bipin Indurkhya. 2014. TrAP: An InteractiveSystem to Generate Valid Raga Phrases from Sound-Tracings.. In NIME. 243–246.
[18] Mark A Schmuckler. 1999. Testing models of melodic contour similarity. MusicPerception: An Interdisciplinary Journal 16, 3 (1999), 295–326.