reportofthe icesinafo …demersal fish committee ices cmi997/g:i reportofthe icesinafo...
TRANSCRIPT

Demersal Fish Committee ICES CMI997/G:I
REPORT OF THE
ICESINAFO WORKSHOP ON GREENLAND HALIBUT AGE DETERMINATION
Reykjavik. Iceland
26 - 29 November 1996
This report is not to be quoted without prior cousultatiou with theGeueral Secretary. The document is a report of an expert group under theauspices of the International Council for the Exploration of the Sea and doesnot necessarily represent the views of the Council.
International Council for the Exploration of the Sea
Conseil International pour I'Exploration de la Mer
Palregade 2-4 DK-1261 Copenhagen K Denmark


Section
TABLE OF CONTENTS
Page
1 INTRODUCTION 11.1 Participants 11.2 Tenns of reference 11.3 Importance of Age Detennination 11.4 General Biology 2
1.4.1 Distribution 21.4.2 Spawning 21.4.3 Maturity 21.4.4 Age and Growth 31.4.5 Mortality 3
2 AGE VALIDATION 3
3 REVIEW OF THE EXCHANGE PROGRAM PRIOR TO THE WORKSHOP 4
4 AGE READING COMPARISONS DURING THE WORKSHOP 54.1 Experienced readers comparison 54.2 Other comparisons 7
5 PROTOCOL FOR AGE DETERMINATION OF GREENLAND HALIBUT OTOLITHS 85.1 Standardized terminology 85.2 Sampling and Storing 95.3 Preparation Techniques 95.4 Reading Procedure 10
5.4.1 Reflected versus transmitted light 105.4.2 Counting axes and magnification 105.4.3 Determination of the first annulus 105.4.4 Edge (marginal) growth 10
6 FUTURE EXCHANGES , 10
7 RECOMMENDATIONS 11
8 REFERENCES 12
Tables 2.1 - 5.3 14
Figures 2.1 - 5.1 22
APPENDIX 1 - Bibliography 37
APPENDIX 2 - Participants Addresses 42
APPENDIX 3 - Pairwise comparison plots 44
APPENDIX 4 - Raw data from the comparative age reading experiment 51
E:\ACFM\WKGHAD\REPORT.DOC 07102197


1 INTRODUCTION
1.1 Participants
Alpoim, Ricardo M.R.Andresson, HordurBabaluk, JohnBowering, W. RayBragadottir, SolrunDrevetnyak, KonstantinGodinho, M. Lourdes M.Greene, BrianGretarsdottir, EsterHj¢rleifsson, EinarJunquera, SusanaKeast, MargaretLarsen, Per O.Morin, BernardMlI5gster, MonsNedreaas, Kjell H.Simonsen, Claus S.Sreverud, Anne
1.2 Terms of reference
PortugalIcelandCanadaCanada (NAPO Chairman)IcelandRussiaPortugalCanadaIcelandIcelandSpainCanadaGreenlandCanadaNorwayNorway (ICES Chairman)GreenlandNorway
In the 83rd Statutory Meeting of ICES in 1995 it was decided that:
2:37 A Joint ICESINAFO Workshop on Greenland halibut age reading (Chairmen: K. Nedreaas, Norway, andW.R. Bowering, Canada) will meet in Reykjavik, Iceland from 26-29 November 1996 to:
a) intercalibrate the age reading and age determination methodology of Greenland halibut and describe aprotocol for handling Greenland halibut otoliths;
b) evaluate research from comparative age determinations and evaluate results using the methods described bythe Working Group on Sampling Strategies for Age and Maturity;
c) establish a protocol for the age determination of otoliths using diagrams and photographs to illustrate agereading criteria;
d) establish a Greenland halibut otolith exchange programme on a regular basis between laboratories involved;
e) in the light of the Workshop results, identify new research and action needed to improve the consistency ofage reading.»
1.3 Importance of Age Determination
Most mathematical models used in modern fish stock assessment for the purpose of providing scientific advice tofisheries managers are age based models. Therefore, any errors in age determinations of fish samples introducedto these models will also create errors in the assessment results of the respective fish stocks for whichmanagement advice is being developed. The implications can be serious with respect to the fishing industryregarding possible assignment of incorrect catch quotas and ,other management measures advised from the resultsof the assessment. In addition, the well being of the fish resources can also be detrimentally affected especially ifassigned quotas are inadvertently set too high as a result of these errors.
Besides the importance to fish stock assessment models per se, it must be recognized that the study of biologicalparameters such as growth rates and maturity rates are very much related to precise knowledge of age structure inorder to properly understand the dynamics of commercial fish populations. Results of these studies also play aninstrumental role in the formation of appropriate scientific advice used for fisheries management.
E:\ACFM\WKGHAD~EPORT.DOC 05/02197

1.4 General Biology
1.4.1 Distribution
Greenland halibut (Reinhardtius hippoglossoides) are distributed throughout the North Atlantic (Nizovtsev 1970;Sigurdsson 1977. 1980, 1981; God¢ and Haug 1987; Bowering and Brodie 1995) in depths up to at least 2200 m(Boje and Hareide 1993; de Cardenas et al. 1996) and are known to exhibit extensive migrations (Sigurdsson 1981;Bowering 1984; God¢ and Haug 1987). Because the continental slope is rather continuous at such depths fromwestern to eastern Atlantic, Greenland halibut distribution is more or less continuous along the .continental slope.Recent mtDNA studies have also concluded that Greenland halibut throughout the entire North Atlantic aregenetically homogeneous which is consistent with known depth distribution and migratory patterns. Any variation inphenotypic characteristics within the species is therefore considered to bea result of the environmental influence ofthe area in which individual fish live (Vis et al. 1997). The species comprises a significant commercial groundfishresource in the North Atlantic. In order to regulate fishing, the Greenland halibut population is managed according tosix separate management units as follows: I - Gulf of St. Lawrence (NAPO Divisions 4RST, 2 - Labrador to FlemishCap (NAPO Sub-area 2 and Divisions 3KLMNO), 3 - Davis Strait (NAPO Sub-area 0 and Divisions IB-IF), 4 Northwest Greenland inshore (NAPO Division IA), 5 - East Greenland-Iceland-Faroe Islands (ICES Sub-areas Vand XIV) and 6 - Northeast Arctic (ICES Regions I and II).
1.4.2 Spawning
In the northwest Atlantic the main spawning area is located in the deep waters (at least 600-1000 m) of Davis Strait(Bowering and Chumakov 1989) although recent investigations have indicated that some spawning occurs all alongthe continental slope of eastern Canada to as far south as the Flemish Cap (lunquera and Zarnarro 1994; Morgan andBowering 1997). Some localized spawning also takes place in the Gulf of St. Lawrence (Bowering 1982) andpossibly in some West Greenland fjords although the extent to which it occurs there is not entirely clear (Riget andBoje 1989). Time of spawning is highly variable and has been observed from December to August (Jensen 1935;Smidt 1969; lunquera and Zarnarro 1994; Morgan and Bowering 1997). However, most spawning likely takes placeduring winter and may' not occur on an annual basis for all Greenland halibut that have reached maturity (Fedorov1971).
In the Iceland area spawning usually occurs in winter northwest Iceland most likely along the continental slope ofeast Greenland at depths to 1000 m (Sigurdsson 1977). From O-Group surveys conducted during 1970-79, young ofthe year Greenland halibut were caught throughout the Irminger Sea from western Iceland to the southern tip ofGreenland with the higher catches taken on the east Greenland continental shelf (Sigurdsson 1980). During spring itis reported that most post-spawning fish begin a feeding migration to the north and northeast of Iceland where theyencounter a rich food sOurce of shrimp (Nizovtsev 1970). Some fish migrate as far as to the southeast ofIceland. It isfurther reported that by September the main feeding migration is over and from September to December the returnmigration to western Iceland takes place for spawning.
According to God¢ and Haug (1987) the Greenland halibut in the northeast Atlantic area of the Barents andNorwegian seas spawn mainly during winter along the continental slope from as far south as Traena Bank (66° - 67°N) northward to 76° N off southwestern Spitsbergen. They found that there was a relatively high proportion of smallfish north of 76° N and this may indicate a nursery area although they also attributed the heterogeneity in sizecomposition in part to a southern migration of larger fish.
1.4.3 Maturity
Proportions of Greenland halibut mature-at-Iength from the northwest Atlantic are subject to large spatial andtemporal variation. Proportions mature-at-age also exhibited inconsistency with the age at 50% maturity rangingfrom 9.5 to 15.0 years for females and 8.2 to 11.6 years for males (Morgan and Bowering 1997). These authorsobserved that there were no apparent trends in this variation and considered it to be likely a result of irregularities inthe maturation process and spawning of Greenland halibut leading to variability in the distribution of adult fish.
Very little data are readily available on size and age at maturity for the Iceland-East Greenland and northeast Arcticareas. However, data used in the assessment of the Greenland halibut stock in Iceland-East Greenland indicate theyreached 50% maturity most often between 9 and 10 years old (sexes combined) since the early 1980's. On the otherhand, the estimated age at 50% maturity in 1995 was considerably younger at 7-8 years old (Anon. 1996a). Datafrom the assessment of the Northeast Arctic Greenland halibut stock (Anon. 1995a) show that males mature at a
E:\ACFM\WKGHAD\REPORT,DQC 05102197 2

much younger age than females. Data collected during the 1970's and early 1980's suggest that 50% of males aremature at about 5 years old whereas females reach 50% maturity between 9 and 10 years old. The most recentinformation from Russian surveys in the Barents Sea (1993-95) show that 50% maturity was reached at about 6 yearsold for sexes combined.
1.4.4 Age and Growth
Based on age and growth studies of Greenland halibut in the northwest Atlantic as an example, it is believed thatthey can live to at least 18 years old and are common up to a length of 110 cm (Smidt 1969; Bowering 1978, 1983;Boje and Jl'lrgensen 1991). However, males have a considerably shorter life span than females with very few malesencountered beyond age 12 or a length of about 65 cm. These studies also suggest that while there appears to besome divergence of the growth rate between males and females at about the age range of 8-10 years old, 'it is notsignificant, likely a result of there being few males available beyond this age. The only comparison in the literatureof growth rates of Greenland halibut in the North Atlantic is in Krzykawski (1976). His results show that Greenlandhalibut have a faster growth rate overall in the Newfoundland area compared to the Barents Sea and those of theIceland area are the slowest growing of the three areas examined. It must be noted, however, that this study wasbased on very limited data and a more detailed investigation is warranted before any firm conclusions can bereached.
1.4.5 Mortality
Due to the considerable difference in the age span between males and fetriales it follows that there is likely to be aconcomitant difference in natural mortality. Because there is also a depth distribution trend associated withincreasing size (see Bowering and Chumakov 1989) the exploitation pallern of commercial fisheries can have asignificant effect on a population with respect to differential fishing mortality between the sexes. If fishing effort ismainly directed in deep water, for example, then the catch can often be entirely of large females likely resulting inhigh fishing mortality that can cause undesirable repercussions for the spawning stock biomass. On the other hand,very low fishing mortality on mature males can result in losses in yield. Trying to reach an appropriate balancebetween the two presents both a difficult stock assessment problem and serious implications for fisheriesmanagement. For a preliminary evaluation of the problem as it exists in the Flemish Cap fishery in the northwestAtlantic see de Cardenas (1996).
2 AGE VALIDATION
The only otolith age validation studies on Greenland halibut that have been published are in Lear and Pill (1975) forthe Canada Newfoundland area and in Smidt (1969) for the West Greenland area. In both instances, the validationwork was largely based on evaluating highly distinctive modes in the length frequency distributions (Petersentechnique) of young Greenland halibut in conjunction with age distributions determined from otolith interpretations(Figure 2.1). Interpretation of the first year was of paramount importance in order that the subsequent two to threedistinctive modes in the length frequency distribntions could be determined as age classes. Establishing the first yearwas greatly enhanced by knowledge of the early life history stages as studied primarily by Jensen (1935).Information from recent pelagic D-Group surveys in eastern Newfoundland (Figure 2.2) accompanied by lengthfrequencies of Greenland halibut from shrimp surveys conducted mainly during July from 1979-1987 off Labrador(Figure 2.3) confirmed the validation results of earlier studies. In addition, observations on the formation of thegrowth zones at the otolith edge suggested that very little growth occurs during the months of February and Marchthen increases significantly in spring (Lear and Pill 1975) (Figure 2.4). Maximum growth occurred during July andAugust followed by September and October. Growth in November was about the same as in the spring months.
Larval studies by Jensen (1935) and observations from pelagic surveys indicate that Greenland halibut in the westernAtlantic spawn mainly in winter to early spring. They have a lengthy pelagic period and in most instances appear tobecome demersal in late summer to early fall at a length range of 6-8 cm (Figure 2.5). Similar observations weremade from O-Group survey data in both Icelandic (Table 2.1) and Barents Sea waters (Figure 2.6). According to thedata in Smidt (1969), O-Group Greenland halibut first appeared in commercial shrimp trawler catches in SeptemberOctober at a mode of about 8 cm. By November-December the by-catch of O-Group Greenland halibut had greatlyincreased at a size mode of about 9-10 cm (Figure 2.5). It can be inferred from these data that Greenland halibutcaught at lengths ofS-1O cm very late in the year are O-Group and it follows that those of similar size caught early inthe year are definitely I year olds. Further examination of the length frequency modes also suggest that Greenlandhalibut can be expected to grow about 6-8 cm per year on average at least for the first 2-4 years for most areas where
E:\ACFM\WKGHAD\REPORT.DOC 05102/97 3

data were evaluated (Figures 2.3, 2.5 and 2.7). The range of lengths observed fot each age class will vary with thelength of the spawning season from which a particular year-class is spawned.
It is important to recognize that the validation work is specific for the years and areas in which the respective datawere collected. Nevertheless, the above infonnation should serve as general, if not specific, guidelines forinterpreting the first 2-4 age groups of Greenland halibut as detennined from otoliths.
3 REVIEW OF THE EXCHANGE PROGRAM PRIOR TO THE WORKSHOP
During the North Western Working Group meeting in May 1995, it was recommended that exchange programs ofGreenland halibut otoliths should be continued and extended to reveal differences in the age readings prior to arecommended workshop (Anon. 1995b). Altogether four otolith exchanges and respective analyses wereconducted in advance of the workshop as follows:
Exchange no.1 (ISBN 87-90024-08-7):Greenlandic otoliths read by Greenland (TEKCON), Iceland and Norway.
Exchange no.2 (ISBN 87-90024-09-5):Norwegian otoliths read by Greenland (TEKCON), Iceland and Norway.
Exchange no.3 (ISBN 87-90024-12-5):Icelandic otoliths read by Canada (St.John's), Canada (Mont Joli), Greenland (TEKCON), Iceland andNorway.
Exchange no.4 (ISBN 87-90024-14-1):Canadian otoliths (St.John's) read by Canada (St.John's), Canada (Mont Joli), Greenland (Nuuk), Iceland andNorway.
The Greenland Institute of Natural Resources had otoliths for exchanges nos.I-3 read by a private company inCanada (TEKCON Management Ltd.) while a new age reader was being trained at the institute. The exchangesand analyses were conducted under the direction of Gert Bech, Greenland Institute of Natural Resources, P.O.Box 570, 3900 Nuuk, Greenland, and a report from each of the exchanges is available at the above address. Forstatistical analyses we refer to the individual reports.
Table 3.1 shows the percent agreement. The overall best agreement between the readers was achieved in the lastexchange. This is believed to indicate that regular calibrations among readers will increase precision. The ratherunusual deviation between the readings by TEKCON and other laboratories during the third exchange wassurprising. It may be a result of possible drift in a reader's interpretation of an otolith when collaboration withother readers is not conducted regularly. lu three of the exchanges two Norwegiau readers participated to showpotential inter-reader bias when using exactly the same method. An average of the agreements between the twoNorwegian readers was used when comparing with other laboratories. In the last exchange the average agreementbetween Norway and the other laboratories was 37%, between Iceland and the others 36%, between Greenlandand the others 40%, between St.John's and the other 34%, and between Mont Joli and the others 34%.
Pairwise comparisons of the readers from the last two exchanges are shown in Appendix 3.
Some relationships among various pairs of readings show clear examples of bias, either over the entire age rangeor only for certain parts of the age range. Other relationships are more random and non-systematic. For example,the age-bias plot of the two Canadian readers from Mont Joli and St.John's using the same method indicate thatthe St.John's reader invariably interpreted more annuli for fish younger than about age 6 while the opposite wasobserved for fish older than 6 years. A similar type of bias occurs between the Norwegian reader and theSt.John's reader (using different methods) in all the exchanges but the deviation in direction of bias takes place atab.out age 9 as opposed to age 6 above.
Appendix 3 illustrates that readers using the same method can also develop biases similar to those using differentmethods. This may suggest that methodology used for age-determination by otoliths is not the most importantfactor for increasing precision among readers. Even two readers from the same laboratory demonstrated bias,although to a small but nevertheless significant extent.
E:\ACFM\WKGHAD\REPORT.DOC 05/02197 4
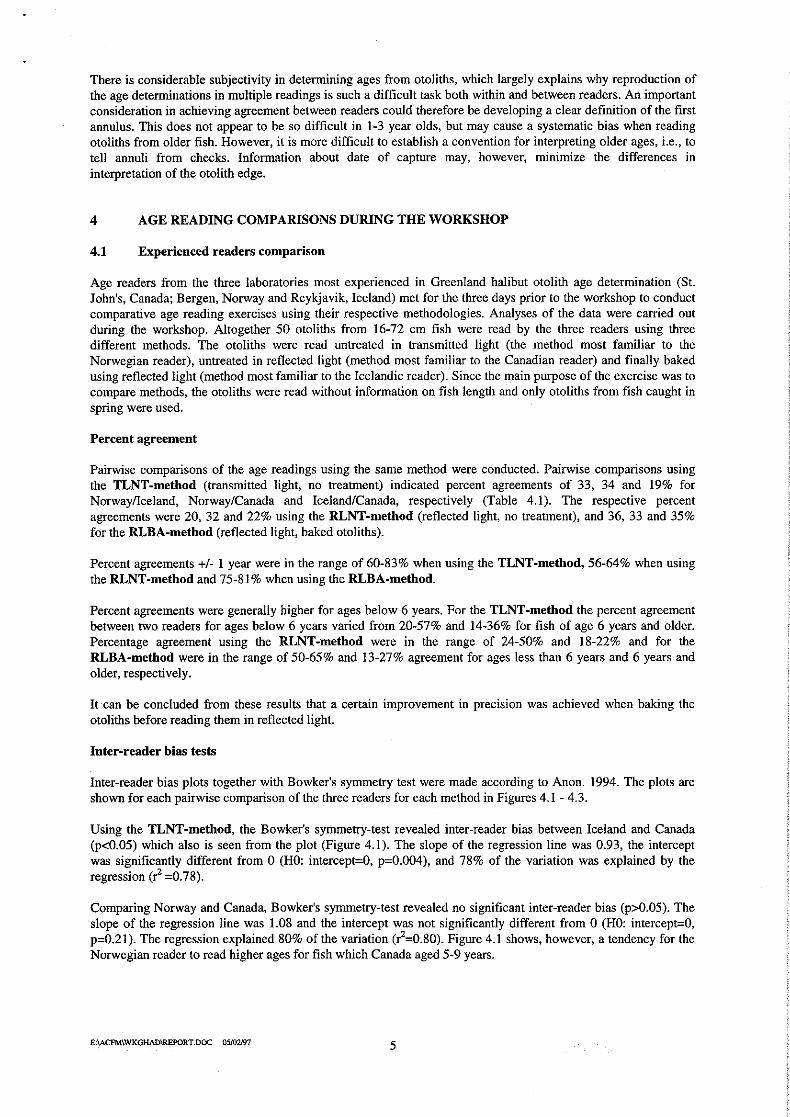
There is considerable subjectivity in detennining ages from otoliths, which largely explains why reproduction ofthe age determinations in multiple readings is such a difficult task both within and between readers. An importantconsideration in achieving agreement between readers could therefore be developing a clear definition of the firstannulus. This does not appear to be so difficult in 1-3 year oIds, but may cause a systematic bias when readingotoliths from older fish. However, it is more difficult to establish a convention for interpreting older ages, i.e., totell annuli from checks. Information about date of capture may, however, minimize the differences ininterpretation of the otolith edge.
4 AGE READING COMPARISONS DURING THE WORKSHOP
4.1 Experienced readers comparison
Age readers from the three laboratories most experienced in Greenland halibut otolith age determination (St.John's, Canada; Bergen, Norway and Reykjavik, Iceland) met for the three days prior to the workshop to conductcomparative age reading exercises using their respective methodologies. Analyses of the data were carried outduring the workshop. Altogether 50 otoliths from 16-72 cm fish were read by the three readers using threedifferent methods. The otoliths were read untreated in transmitted light (the method most familiar to theNorwegian reader), untreated in reflected light (method most familiar to the Canadian reader) and finally bakedusing reflected light (method most familiar to the Icelandic reader). Since the main purpose of the exercise was tocompare methods, the otoliths were read without information on fish length and only otoliths from fish caught inspring were used.
Percent agreement
Pairwise comparisons of the age readings using the same method were conducted. Pairwise comparisons usingthe TLNT-method (transmitted light, no treatroent) indicated percent agreements of 33, 34 and 19% forNorwayllceland, Norway/Canada and Iceland/Canada, respectively (Table 4.1). The respective percentagreements were 20, 32 and 22% using the RLNT-method (reflected light, no treatroent), and 36, 33 and 35%for the RLBA-method (reflected light, baked otoliths).
Percent agreements +1- I year were in the range of 60-83% when using the TLNT-method, 56-64% when usingthe RLNT-method and 75-81% when using the RLBA-method.
Percent agreements were generally higher for ages below 6 years. For the TLNT-method the percent agreementbetween two readers for ages below 6 years varied from 20-57% and 14-36% for fish of age 6 years and older.Percentage agreement using the RLNT-method were in the range of 24-50% and 18-22% and for theRLBA-method were in the range of 50-65% and 13-27% agreement for ages less than 6 years and 6 years andolder, respectively.
ltean be concluded from these results that a certain improvement in precision was achieved when baking theotoliths before reading them in reflected light.
Inter-reader bias tests
Inter-reader bias plots together with Bowker's symmetry test were made according to Anon. 1994. The plots areshown for each pairwise comparison of the three readers for each method in Figures 4. I - 4.3.
Using the TLNT-method, the Bowker's symmetry-test revealed inter-reader bias between Iceland and Canada(p<0.05) which also is seen from the plot (Figure 4.1). The slope of the regression line was 0.93, the interceptwas significantly different from 0 (HO: intercept=O, p=0.004), and 78% of the variation was explained by theregression (1 =0.78).
Comparing Norway and Canada, Bowker's symmetry-test revealed no significant inter-reader bias (p>0.05). Theslope of the regression line was 1.08 and the intercept was not significantly different from 0 (HO: intercept=O,p=0.21). The regression explained 80% of the variation (r'=0.80). Figure 4.1 shows, however, a tendency for theNorwegian reader to read higher ages for fish which Canada aged 5-9 years.
E;\ACFM\WKGHAD\REPORT.DOC 05/02197 5

Comparing Norway and Iceland, Bowker's symmetry-test revealed no significant inter-reader bias (p>0.05). Theslope of the regression line was 1.04, the intercept was not significantly different from 0 (p=0.54), and 87% ofthe variation was explained by the regression (r2=0.87). Figure 4.1 shows, however, that the Icelandic reader readhigher ages on the younger fish and lower ages on the older fish compared with the Norwegian reader.
Using the RLNT-method, the Bowker's symmetry_test revealed also inter-reader bias between Iceland andCanada (p<0.05) which is seen clearly from the plot (Figure 4.2). The slope of the regression line was 1.01, andthe intercept was not significantly different from 0 (HO: intercept=O, p=0.06). However, only 66% of thevariation could be explained by the regression (r2 =0.66).
Comparing Norway and Canada, Bowker's symmetry-test revealed no significant inter-reader bias (p>0.05). Theslope of the regression line was 0.94, and the intercept was not significantly different from 0 (HO: intercept=O,p=O.17). The regression explained 71% of the variation in the data (r'=0.71).
Comparing Norway and Iceland, Bowker's symmetry-test revealed no significant inter-reader bias (p>0.05). Theslope of the regression line was only 0.71, but the intercept was not significantly different from 0 (p=0.14). Only57% of the variation in the data was explained by the regression (r2=0.57). Figure 4.2 shows especially onestriking outlier which was aged 6 and 17 years by Norway and Iceland, respectively.
Using the RLBA-method, the Bowker's symmetry-test revealed no inter-reader bias between Iceland and Canada(p>0.05) although Iceland in many cases interpreted the otoliths to be much older (Figure 4.3). The slope of theregression line was 0.96 and the intercept was significantly different from 0 (HO: intercept=O, p=0.03) althoughthe readers agreed on the interpretation of I and 2 year olds. The regression explained 85% of the variation in thedata (r2 =0.85).
Comparing Norway and Canada, Bowker's symmetry-test revealed no significant inter-reader bias (p>0.05). Theslope of the regression line was 0.94, and the intercept was not significantly different from 0 (HO: intercept=O,p=0.17). The regression explained 85% of the variation in the data (r2 =0.85).
Comparing Norway and Iceland, Bowker's symmetry-test revealed no significant inter-reader bias (p>0.05). Theslope of the regression line was 0.95, and the intercept was not significantly different from 0 (p=O.92). Theregression explained 87% of the variation in the data (r' =0.87).
The RLBA-method was the only one of the three methods investigated where none of the reader comparisonsshowed any significant deviance from symmetry. The coefficients of determination (r2
) were also generallyhigher for this method, although the intercept for the regression between the Icelandic and Canadian readers wasdifferent from O.
Residual plots with regression lines
Differences in age readings were plotted against length of the fish (Figure 4.4). However, Figure 4.4 showsvariation in the residuals by length. The size of the residuals may differ with regard to the length of the fish andthe regression lines also reveal trends in the residuals over the length range.
The transmitted light-no treatment method (TLNT) shows higher residuals with increasing length, and theregression lines show a trend in the mean size of the residuals by fish length.
The reflected light-no treatment method (RLNT) shows overall higher residuals among readers although themagnitude of the residuals appear to be independent of fish length compared with the TLNT-method.Nevertheless, there is a trend in the residuals over the length range of the fish. An outlier of -11 between theNorwegian and the Icelandic reader for a 68 em fish is not shown in the figure nor in the regression due to thefigure scaling.
The reflected light-baked method (RLBA) shows overall lower residuals, although there is a slight increase in theresiduals with increasing fish length. The regression lines are, however, more flat and close to the zero-linecompared to the other two methods.
E:\ACFM\WKGHAD\REPORT.DOC 05/O'2J97 6

Comparison of three readers by method
Figure 4.5 shows age-length regressions of the three readers' age interpretations by method. The regression linesamong readers are closer to each other for the RLBA.method, suggesting a slightly better agreement between thereaders. Using the RLBA·method there was complete agreement in age interpretation among readers for all fishless than 30 em.
Comparison of all three methods for each reader
Figure 4.6 illustrates the level of internal consistency for each reader when reading the same otoliths using threedifferent methods. From the regression lines it can be seen, as an exarople, that Norway would age a 80 cm fish to13-14 years, Iceland 13-15 years and Canada 11-13 years dependent on method used.
Comparison of the three readers each using their most familiar method
Figure 4.7 compares the age-length regressions for each reader using his or her most familiar method. There is arelatively good agreement for fish less than 30 cm. Canada's readings result in a slightly higher growth rate ofGreenland halibut for the saroples used compared to Norway and Iceland.
4.2 Other comparisons
In order to facilitate discussion and comparisons among all readers participating at the workshop, several readingexercises were conducted. Due to the time constraints of the workshop and the relatively large number ofparticipants, the sample sizes for comparative readings were necessarily kept small and therefore any statisticalcomparisons were not considered useful and were not done. The participants' experience in otolith age reading ofGreenland halibut ranged from no experience to a maximum of about 6 years.
Exercise 1. Age reading of juvenile (8-23 em) fish vs. age validation
The results from this exercise are shown in Table 4.2. The main objective was to discuss and then define the firstannulus taking into account the saropling date and the growth at the edge of the otolith. The readers used thereading method most familiar to them prior to the workshop. Information on fish length and saropling date wereprovided to make it possible for the reader to include independent information about growth in the agedetermination (see Section 2). When all otoliths had been read once, the readers discussed each otolithcollectively by viewing it on a video monitor. In many cases readers changed their previous age interpretation asa result of the discussion with others. The readers disagreed in only a few of the otoliths.
Exercise 2. Age reading of jnvenile (11·25 em) fish using baked otoliths
Otoliths from ten juvenile fish were baked in an oven at approximately 190°C for 2.5 hours to investigatewhether this preparation technique increased the precision aroong the readers. Although the differences weresmall, no clear improvement could be seen when compared to the exercise conducted above. The results areshown in table 4.3.
Exercise 3. Age reading of adult (45·76 em) fish using baked otoliths
Otoliths from fifteen adult fish were baked and read knowing the respective fish lengths in advance (Table 4.4).This sarople was used for investigating the precision among readers when reading baked otoliths from older fish.It was then used as basis for discussion with respect to the growth at the edge. Differences in age determinationbetween readings of the same fish varied from 0 to 5 years aroong readers, however, a maximum of +/- 2 yearswas more the case among the most experienced readers.
Exercise 4. Comparing nntreated and baked otoliths from adult (44·74 em) fish
The purpose of the last exercise was to compare the age readings of the same adult fish before and after bakingthe otoliths. Only information about saropling date was given in advance. The results which are given in Table4.5 show that the modes of the two age readings were fairly similar. Although no clear improvement could beseen, the range of ages assigned to each otolith by the readers was reduced after the otoliths had being baked,except for the oldest three fish.
E:\ACFM\WKGHAD\REPORT.DOC 05102197 7

It was concluded by the workshop that different interpretations of the otolith edge may cause systematic bias dueto different practices in utilizing information with respect to date of capture.
5 PROTOCOL FOR AGE DETERMINATION OF GREENLAND HALIBUT OTOLITHS
The various techniques used currently by the different laboratories represented at the workshop were reviewed andare summarized for presentation in Tables 5.1-5.3. Examples of Greenland halibut otoliths are shown as illustrationsin Figure 5.1.
5.1 Standardized terminology
The workshop agreed that the following terminology be used for consistency among Greenland halibut otolith agereaders:
Based on recent international work (Secor ef al. 1995, Anon. 1996b) that has taken place in order to standardize,as much as possible, the terminology used during otolith interpretation, it is recommended. that the followingdefinitions be used when making reference to Greenland halibut otoliths and interpretation of their ages:
• Accuracy: The closeness of a measured or computed value (e.g. age) to its true value. Accuracy can beproven or estimated: estimates of accuracy are less valuable, but in some cases only an estimate is possible.
• Age estimation, age determination: These terms are preferred when discussing the process of assigning agesto fish. The term aging should not be used as it refers to time-related processes and the alteration of anorganism's composition. structure, and function over time.
• Age-group: The group of fish that has a given age (e.g., the 5-year-old age-group). The term is notsynonymous with year-class.
• Annulus (pI. annuli): (Winter zone) A translucent growth zone that forms once a year representing a time ofslower growth. For Greenland halibut populations the annulus is generally formed during the fall and wintermonths.
• Annual growth zone: A growth zone that consists of one opaque zone (summer zone) and one annulus(winter zone).
• Bias: A lack of precision that is not normally distributed around the mean; it is skewed to one side or theother. For age reading it may apply to one reader's interpretations which are predominantly more or less thanthose of another for all ages; or it may only apply to a portion of the age range.
• Birth date: Based on the internationally accepted standard all Greenland halibut are assumed to have a birthdate of January 1.
• Check: Translucent zone that forms within the opaque (summer) zone representing a slowing of growth. Sucha zone is not usually as prominent as annuli and should not be included in the age estimate.
• Cohort: A group of fish that were born during the same year (Jan. I - Dec. 31).
• Edge (marginal) growth: The amount and type of growth (opaque or translucent) on an otolith's margin oredge. The amount and type of growth on the edge must be related to the time of year the fish was caught andthe internationally accepted and standard January 1st birthday. New opaque growth forming on the margin ofthe otolith is often referred to as plus growth or incremental growth.
• Nucleus: The central area of the otolith formed during the larval stage.
• Opaque zone: (Summer zone) A growth zone that restricts the passage of light. In untreated otoliths undertransmitted light, the opaque zone appears dark. Under reflected light it appears bright.
E:\ACFM\WKGHAD\REPORT.DOC 05102197 8

• Precision: A process that measures the closeness of repeated independent age estimates. Precision relates toreproducibility and is not a measure of accuracy. The degree of agreement among readers is a measure of theprecision of the determinations and not the accuracy of the technique.
• Reflected light: Light that shines onto the surface of an otolith from above, or from the side if the surface isnot shadowed.
• Sagitta (pl. sagittae): The largest of three otolith pairs found in Greenland halibut. It is usually compressedlaterally and is elliptical in shape. The sagitta is the otolith used most frequently in otolith studies.
• Summer zone: Opaque growth that is normally deposited during the spring and summer seasons when fishare growing relatively quickly.
• Transition zone: A region of change in an otolith growth pattern between two similar or dissimilar regions. Itis recognized as a region of significant change in the form (e.g., width or clarity) of the annual growth zones.A transition zone is often defined as the region of change from juvenile to mature growth. The juvenile annualgrowth zones are relatively larger than those of later adult zones. For some fishes this transition zone has beenvalidated as coinciding with the onset of first maturity. In some instances otoliths may also show a change inwidth and clarity of the annual growth zones which may be related to habitat changes (e.g., movement todeeper waters).
• Translucent zone: (Hyaline zone, annulus, check) A growth zone that allows a better passage of light. Thedefinition of the term hyaline has often been misunderstood and is not recommended for use. In untreatedotoliths under transmitted light, the translucent zone appears bright. Under reflected light it appears dark.
• Transmitted light: Light that is passed through the otolith from below (e.g., sections); for broken otoliths isalso from the side if the surface is shadowed.
• Validation: The process of estimating the accuracy of an age estimation method, etc.
• Winter zone: Translucent growth (annulus; not check) that is normally deposited during the fall and winterseasons when fish are growing relatively slowly.
• Year-class: The cohort offish that were born in a given year (Jan. I - Dec. 31) (e.g., the 1990 year-class).
• Zone: Region of similar structure or optical density (opaque or translucent). Synonymous with ring, band,and mark. The term zone is preferred.
5.2 Sampling and Storing
There were a variety of sampling methods and storing procedures presented to the workshop (see Table 5.1). It wasconcluded, however, that there did not appear to be any that were considered superior enough to warrantrecommending standardization among laboratories recognizing the logistical difficulties that significant changes maypose to some. Nevertheless, it was noted that probability of increased damage may be higher for those stored inpaper envelopes and an extra degree of caution shonld be exercised. There was also some concern that otolithsstored in glycerin solutions may cause long term damage to the clarity of the annuli although this could not be provenconclusively at this time. It was proposed that further investigation in this matter be undertaken.
5.3 Preparation Techniques
A number of techniques used in preparing otoliths for age reading were examined by the workshop and aresummarized in Table 5.2. After some debate it was considered that most of the techniques used were largely a matterof personal preference and there were no apparent influences on the precision among readers of the varioustechniques. Therefore, readers should continue to use the techniques with which they are most comfortable butshould experiment with small changes, for example, varying otolith immersion medium among alcohol, immersionoil, glycerin mixtures, etc. Notwithstanding the lack of overall increased precision, many readers did feel that bakingthe otoliths did increase the resolution between the translucent and opaque zones. It was proposed that this methodbe the subject of further experimentation.
E:\ACFM\WKGHAD\REPORT.DOC OS!02197 9

5.4 Reading Procednre
A summary of current reading practices by the laboratories of the respective participants are presented in Table 5.3.
5.4.1 Reflected versus transmitted light
Most readers used reflected light although some readers used mainly transmitted light. Readers normally usingreflected light found it more difficult to become accustomed to transmitted light as they found that transmitted lighthighlighted the very small check rings more succinctly, making the interpretation of the annuli more difficult. Thiswas even more exaggerated on otoliths that had been baked. On the other hand, the readers normally usingtransmitted light adjusted to the reflected light method much more easily during the course of the workshopexercises. It was concluded that either method was acceptable if readers felt more comfortable with one more thanthe other except when reading otoliths that had been baked. It was agreed that reflected light should be used whenreading otoliths that had been baked.
5.4.2 Counting axes and magnification
Most readers found the convex side of the left sagital otolith to be more suitable for interpreting the age of Greenlandhalibut. The reading axis used mostly was somewhere within the widest half of the otolith's longitudinal axis. Whilethis was the most common approach, all readers when finding difficulty in assigning an age, often used both otolithsin their entirety to assist in interpretation and in some cases used the concave surface to examine the edge. In light ofthe difficulties encountered in reading Greenland halibut otoliths, the workshop could find no better alternative thanthis procedure already being used and proposes that it be continued. It was also indicated that all readers each used afixed magnification between 1O-16X. It was agreed that using an individual fixed magnification was appropriate as itmaintained a constant perception of where the annuli of particularly the younger years are located. It was also notedthat it is acceptable to increase magnification on some large thick otoliths to get some better idea of the zonalformation near the edge, however, magnification should be returned to normal before a final decision on ageinterpretation is taken.
5.4.3 Determination of the first annulus
The correct interpretation of the first annulus is one of the more critical features of precise aging of Greenlandhalibut. To assist in this the reader should have otoliths of known age juveniles as determined using the agevalidation procedures described earlier (see Section 2). Using these otoliths, measurements should be taken with anocular micrometer to establish the extent of the first year's growth. These measurements should then be used as ageneral guideline for determination of the first year in other otoliths. When making ocular micrometer measurementsit is imperative that they be taken at the usual fixed magnification of the reader and along a constant axis to maintainconsistency.
5.4.4 Edge (marginal) growth
Correct interpretation of the extent and type of growth at the otolith edge is necessary in order to assign theappropriate age-class. New (plus) growth at the edge must be related to the time of year the fish was caught and theinternationally accepted convention of a standard January 1st birthday. Consequently, it is important to haveinformation available to the reader on the size of fish and time of capture of the samples being aged. In addition, thereader should use the edge growth analysis in Lear and Pitt (1975) as a general guideline regarding the time of yearwhen a particular growth zone is more likely to occur as well as its anticipated size. It is recognized, however, thatmany exceptions will be encountered especially among different regions where validation data have not beenavailable. Therefore, logic combined with considerable discretion must be exercised. Edge growth may be verydifficult to interpret on older otoliths at any time of the year as the growth zones are so small. The reader should tryto trace the last annulus seen from the axis of preferred reading, around the edge to establish confidence that thegrowth zone being traced is in fact an annulus and not a check zone.
6 FUTURE EXCHANGES
In accordance with the terms of reference, it was agreed that an otolith exchange program be continuedimmediately following the workshop. The Marine Research Institute (MRI) in Iceland was given theresponsibility for arranging the first exchange including dispatching Icelandic Greenland halibut otoliths
E;\ACFM\WKGHAD\REPORT.DOC 05102197 10

(supplemented with East-Greenland otoliths of juvenile fish if necessary) to Nuuk, Greenland. In addition, theMRI will collect and analyse the data from the various participants and report the results to both ICES and NAFOfor scientific review. Responsibility for arranging further exchanges, analyzing the data and reporting the resultswill alternate among the participating laboratories.
The first exchange should consist of 5 baked otolith samples for each 5 em length group. The otoliths should bebaked following the established Icelandic procedure. The samples should be dispatched in secure, dry conditionto Greenland no later than the end of December, 1996 including information on fish length and date of capture.Data on round weight, sex and maturity is also desirable where available. The participating laboratories shouldnot treat the otoliths in any manner that may alter their original condition in order to ensure consistency in theappearance of the samples for all readers.
The otoliths should be dispatched to the countriesllaboratories and responsible age readers in the following order:
o1234567
Country
Reykjavik, IcelandNuuk, GreenlandIqaluitlWinnipeg, CanadaMont Joli, CanadaSt.John's, CanadaLisbon, PortugalVigo, SpainBergen, Norway
Responsible Reader
Hordur AndressoDPer Otto LarsenMargaret Keast/John BabalukBernard MorinBrian GreeneLourdes GodinhoSusana JunqueraAnne Sreverud
Each laboratory should send the results (one set of age readings per laboratory) by postal mail to the responsiblelaboratory, in this case Iceland, immediately after reading. The otolith sample then should be securely repackaged and sent to the next laboratory on the list above.
7 RECOMMENDAnONS
The Workshop recommends the following research activities in order to facilitate more precision and ensureaccuracy of age interpretations of Greenland halibut otoliths among regions of the North Atlantic:
• Age validation
In order to assist in the proper assignment of the final age of an otolith, the development of growth incrementsthroughout the year at the edge of the otolith should be described for each fishing area in a fashion similar tothat reported in Lear and Pitt (1975).
Validation of the first 1-3 years of growth should be conducted for each fishing area by analyzing modes inlength frequency data (Petersen technique) in conjunction with back-calculation of annual growth incrementsfrom the otolith. Following known strong year-classes can be especially helpful in this regard.
Validation is needed for ages older than approximately 3 years and fish larger than about 30 em in length.Traditional tagging data that contain otoliths, fish size at tagging and recapture and time in sea betweentagging and recapture should be analysed. Although traditional tagging data does not give us an exact agewhen the fish were first tagged, such analyses can be particularly informative if there is a lengthy periodbetween time of tagging and recapture especially if fish were small when tagged (then Petersen technique maybe used to give an approximate age). The Workshop was informed that MR!, Iceland has valuable taggingdata that may be useful in this respect and recommends that these data be thoroughly examined as early aspossible.
Oxytetracycline marking in conjunction with regular, traditional tagging programs should be encouraged.
• Radionucleotide dating should be further investigated.
E:\ACFM\WKGHAD\REPORT.DOC 05102197 11
• Investigation into determining an optimal storage medium for Greenland halibut otoliths that could enhancethe acuity between annuli without long tenn detrimental effects to the otolith structure.
• Investigation into determining an optimal temperature and treatment time when baking otoliths for agedetennination purposes.
• As opportunities arise, any intermediate results from the otolith exchanges should be presented both to ICESand NAFO for review and further recommendations for improvements.
8 REFERENCES
Anon. 1995a. Report of the Arctic Fisheries Working Group. ICES Headquarters, Copenhagen, 23"31 August 1995.ICES CM 1996/Assess:4.
Anon. 1995b. Report of the North Western Working Group. ICES Headquarters, Copenhagen, 3-10 May 1995.ICES CM 1995/Assess:19.
Anon. 1996a. Report of the North Western Working Group. ICES Headquarters, Copenhagen, 1-8 May 1996. ICESCM 1996/Assess:15.
Anon. 1996b. Report of the workshop on age reading of Sebastes spp. Bremerhaven, Gennany, 4-8 December1995. ICES CM 1996/G:1.
Boje, J. and J¢rgensen, O. 1991. Growth of Greenland halibut in the North Atlantic. ICES C.M. 1991/G:40, 12p.
Boje, J. and Hareide, N.R. 1993. Trial deepwater longline fishery in the Davis Strait, May-June, 1992. NAFO SCRDoc. 93/53, Serial No. N2236, 6p.
Bowering, W.R. 1978. Age and growth of the Greenland halibut, Reinhardtius hippoglossoides (Walbaum), inICNAF Sub-areas 2-4. ICNAF Res. Bull. No.4: 5-10.
Bowering, W. R. 1982. Population dynamics of Greenland halibut in the Gulf of SI. Lawrence. J. Northw. Atl. Fish.Sci. 3: 141-147.
Bowering, W.R. 1983. Age, growth, and sexual maturity of Greenland halibut, Reinhardtius hippoglossoides(Walbaum), in the Canadian Northwest Atlantic. Fishery Bulletin: Vol. 81, No.3: 599-611.
Bowering, W. R. 1984. Migrations of Greenland halibut, Reinhardtius hippoglossoides, in the Northwest Atlanticfrom tagging in the Labrador-Newfoundland region. J. Northw. Atl. Fish. Sci. 5: 85-91.
Bowering, W. R. and Chumakov, A. K. 1989. Distribution and relative abundance of Greenland halibut(Reinhardtius hippoglossoides (Walbaum» in the Canadian Northwest Atlantic from Davis Strait to thenorthern Grand Bank. Fish. Res. 7: 301-328.
Bowering, W.R. and Brodie, W.B. 1995. Greenland halibut (Reinhardtius hippoglossoides). A review of thedynamics of its distribution and fisheries off eastern Canada and Greenland. In NATA ASI Series VolumeXX: Deep water fisheries of the North Atlantic oceanic slope, pp. 113-160. Ed. by A.G. Hopper. KluwerAcademic Publishers, Netherlands.
de Cardenas, E. 1996. The females ratio by length as an indicator of sexual differences in mortality of Greenlandhalibut, Reinhardtius hippoglossoides, at ages 8+. NAFO SCR Doc. 96/35, Ser. No. N2710, lOp.
de Cardenas, E., Casas, J.M., Alpoim, R. and Muma, H. 1996. Preliminary results of the European longline survey inthe NAFO Regulatory Area. NAFO SCR Doc. 96/34, Ser. No. N2709, 6p + corrigendum.
Fedorov, K. Yeo 1971. The state of the gonads of the Barents Sea Greenland halibut (Reinhardtius hippoglossoides(Walbaum)) in connection with failure to spawn. J. Icthyol. 11:673-682.
E:\ACFM\WKGHAD\REPORT.DOC 05102197 12

God~, O.R. and Haug, T. 1987. Migration and recruitment to the commercial stock of Greenland halibut(Reinhardtius hippoglossoides (Walbaum)), in the Svalbard area. FiskDir. Skr. Ser. HavUnders., 18: 311328.
Jensen, A. S. 1935. The Greenland halibut (Reinhardtius hippoglossoides) its development and migrations. K. Dan.Vidensk. Selsk. Skr. 9Rk. 6: 1-32.
Junquera, S. and Zarnarro, J. 1994. Sexual maturity and spawning of the Greenland halibut (Reinhardtiushippoglossoides) from Flemish Pass area. NAFO Scientific Council Studies No. 20: 47-52.
Krzykawski, S. 1976. A characteristic of growth of Greenland halibut, Reinhardtius hippoglossoides (Walbaum),from the North Atlantic. Acta Icthyologica et Piscatoria: Vol. VI, Fasc. 2: 79-101.
Lear W.H. and Pitt, T.K. 1975. Otolith age validation of Greenland halibut (Reinhardtius hippoglossoides).J.Fish.Res.Board Can. 32: 289-292.
Morgan, MJ., and Bowering, W.R. 1997. Variation in maturity of Greenland halibut (Reinhardtius hippoglossoides(Walbaum)) throughout the Northwest Atlantic with implications for fisheries management. ICES J. Mar.Sci. (In press).
Nizovlsev, G.P. 1970. Migrations of Greenland halibut (Reinhardtius hippoglossoides (Walbaum» in Icelandicwaters. ICES C.M Doc. 1970/F:24, 6p.
Riget, F. and Boje, J. 1989. Fishery and some biological aspects of Greenland halibut (Reinhardtiushippoglossoides) in West Greenland waters. NAFO Sci. Coun. Studies 13: 41-52.
Secor, D.H., Dean, LM., and Campana, S.E. 1995. Recent developments in fish otolith research. University ofSouth Carolina Press, Columbia, USA. 735 pp. ISBN 1-57003-011-1.
Sigurdsson, A. 1977. On the spawning grounds of Greenland halibut in Icelandic waters. ICES C.M. Doc.1977/F:28, lip.
Sigurdsson, A. 1980. On the nursery grounds of the Greenland halibut spawning in Icelandic waters. ICES C.M.Doc. 19801G:45, 8p.
Sigurdsson, A. 1981. Migrations of Greenland halibut (Reinhardtius hippoglossoides (Walb.» from Iceland toNorway. Rit Fiskideildar 6, 1981, 3-6.
Smidt, E. 1969. The Greenland halibut (Reinhardtius hippoglossoides), biology and exploitation in Greenlandwaters. Medd. Dan. Fisk. Havunders. 6: 79-148.
Vis, M.L., Steven, M. c., Bowering, W.R. and Davidson, W.S. 1997. Greenland halibut (Reinhardtiushippoglossoides) in the North Atlantic are genetically homogeneous. Can. J. Fish. Aquat. Sci. (In press).
E:\ACFM\WKGHAD\REPORT.DOC 05/02197 13

Table 2.1. Length of O-Group Greenland halibut off East Greenland during1970-79 from Icelandic O-Group surveys.
Year No. Length range Average Time of surveyMeas. Cmm) length
1970 9 52-69 60.33 August 1-11
1972 133 40-80 60.91 August 2-25
1973 212 23-72 56.06 August 9-29
1974 14 50-66 57.71 July 27-Aug 8
1976 29 27-72 51.83 August 5-29
1978 94 46-80 63.06 Aug 9-Sept 2
1979 109 41-81 67.60 Aug 20-Sept 10
E:\ACFM\WKGHAD\T-2-1.DOC 04102197 14
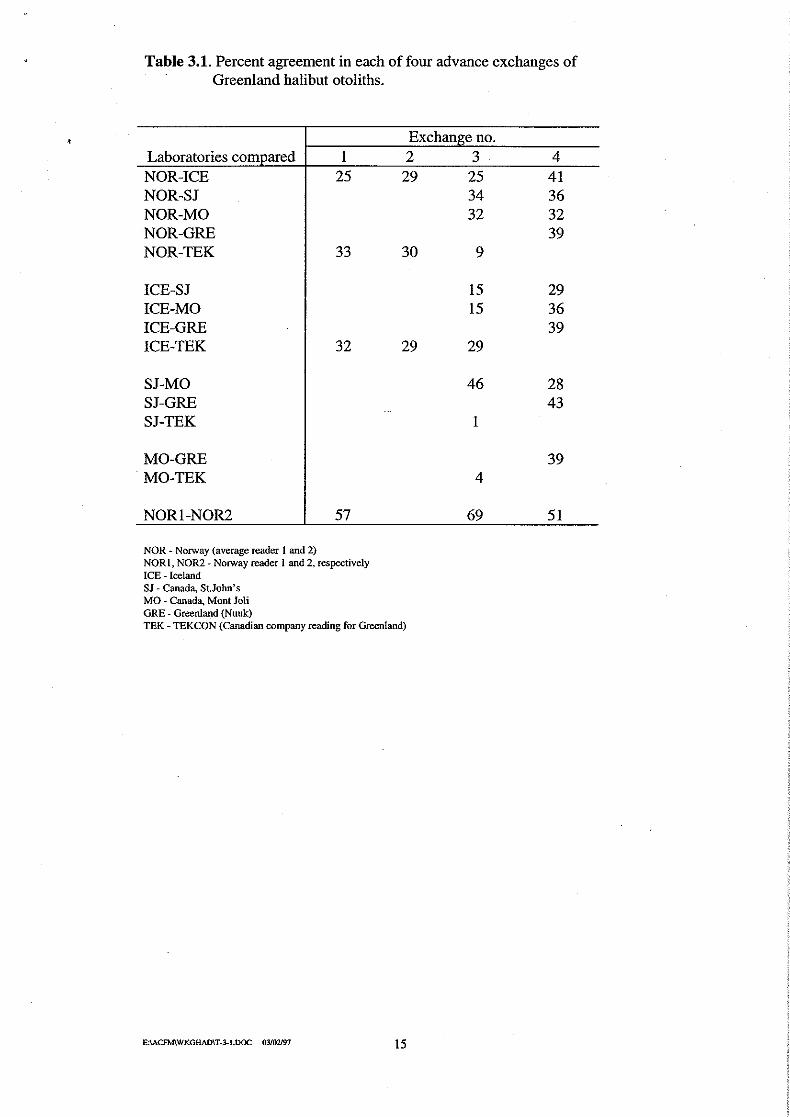
Table 3.1. Percent agreement in each of four advance exchanges ofGreenland halibut otoliths.
Exchange no.Laboratories compared I 2 3 4NOR-ICE 25 29 25 41NOR-SJ 34 36NOR-MO 32 32NOR-GRE 39NOR-TEK 33 30 9
ICE-SJ 15 29ICE-MO 15 36ICE-GRE 39ICE-TEK 32 29 29
SJ-MO 46 28SJ-GRE 43SJ-TEK I
MO-GRE 39MO-TEK 4
NORI-NOR2 57 69 51
NOR - NOIway (average reader I and 2)NORl, NOR2 - NOlWay reader 1 and 2, respectivelyICE - Iceland5J - Canada, St.John'sMO - Canada, Mont lotiGRE - Greenland (Nuuk)TEK - TEKCON (Canadian company reading for Greenland)
E:\ACFM\WKGHAD\T-3-I.DOC 03102197 15

Table 4.1 Comparison of age estimates for Greenland halibut from three different otolithmethods (all ages).
Percent agreement
Percent agreement
Percent agreement
Norway/Iceland
Norway/Canada
Iceland/Canada
e:\acfm\wkghad\T-4-l.xts
Age difference(years)
o1234
11
Age difference(years)
o12345
Age difference(years)
o1234567
Baked,reflected light
36.280.997.997.9
100.0
Baked,reflected light
33.377.191.7
100.0
Baked,reflected light
35.475.091.797.9
100.0
16
Untreated,reflected light
20.060.084.491.197.8
100.0
Untreated,reflected light
32.064.086.092.0
100.0
Untreated,reflected light
22.255.675.688.991.195.697.8
100.0
Untreated,transmitted light
33..383.397.9
100.0
Untreated,transmitted light
34.064.078.096.098.0
100.0
Untreated,transmitted light
18.860.489.695.8
100.0

Tab
le4.
2.A
gere
adin
gof
juve
nile
fish
(8-2
3cm
)us
ing
untr
eate
dot
olith
san
dbo
thre
flect
edan
dtr
ansm
itted
light
whi
chva
ried
with
read
ers.
Oto
liths
are
from
New
foun
dlan
dan
dN
orw
ay.
Num
ber
inbr
acke
tsis
the
orig
inal
read
ing
that
was
chan
ged
afte
ra
plen
ary
disc
ussi
on. Le
ngth
#(e
m)
Sea
son
Bria
nA
nne
Ber
nard
Ric
ardo
Per
John
Mar
gare
tE
ster
Lour
des
Sus
ana
Hor
dur
114
Fal
l1
11
11
1 (2)
1(2)
21
11(
2)2
15F
all
11
11
11
11
11
13
16F
all
11
11
21
11
11
14
18F
all
11
21
22
1(2)
21
12
519
Fal
l2
22
2(1
)3
12
11
2(1
)1
69
Spr
ing
1(0)
1(0)
11
11
11
11
17
8F
all
00
00
00
00
0O
·0
88
Fal
l0
00
00
00
00
00
918
Spr
ing
22
22
22
2(1
)2
2(1
)2
2-....,
1020
Spr
ing
22
22(
1)
22
22
22(
1)
211
22S
prin
g2
22
22
22
22
22
1223
Fal
l2
22(
3)2
2(3)
22
22
22
138
Fal
l0
00
00
00
00
00
148
Fal
l0
00
00
00
00
00
158
Fal
l0
00
00
00
00
00
1621
Spr
ing
22
32
32
22
22
2
E:\
aefm
\wkg
had\
T-4
-2.x
ls

-00
Tab
le4.
3.A
gere
adin
gof
juve
nile
fish
(11-
25em
)us
ing
bake
dot
olith
s.
Leng
th#
(em
)S
easo
nB
rian
Ann
eB
erna
rdR
ieha
rdo
Per
Cla
usJo
hnM
arga
ret
Est
erLo
urde
sS
usan
aH
ordu
r1
13Ju
ly2
11
1?
11
11
214
July
11
11
11
11
13
12Ju
ly1
11
1?
?1
11
411
July
11
11
11
11
15
15A
ug.
22
22
22
22
26
16A
ug.
21
22
12
21
27
18A
ug.
11
11
12
21
28
20A
ug.
32
32
22
22
29
24A
ug.
22
32
33
1?
23
1025
Aug
.2
33
1o
r2
33
?2
3
e:la
efm
lwkg
had\
T-4
-3.x
ls

Tab
le4.
4.A
gere
adin
gof
bake
dot
olith
sfr
omad
ultf
ish
(45-
76cm
)us
ing
both
refle
cted
and
tran
smitt
edlig
htw
hich
varie
dw
ithre
ader
s.O
tolit
hsar
efr
omIc
elan
d. Leng
th#
(em
)S
easo
nB
rian
Ann
eB
erna
rdR
icar
doP
erC
laus
John
Mar
gare
tE
ster
Lour
des
Sus
ana
Hor
dur
152
Su
mm
er
77
76
77
66
87
67
27
6S
um
me
r12
1311
1112
1114
1215
1111
16
359
Su
mm
er
910
97
77
878
98
79
450
Su
mm
er
67
85
67
56
66
57
551
Su
mm
er
77
77
76
767
76
66
647
Su
mm
er
77
76
76
66
65
57
751
Su
mm
er
88
810
78
109
77
77
845
Su
mm
er
66
66
667
66
66
66
956
Su
mm
er
99
98
87
86
98
89
1049
Su
mm
er
77
86
67
76
67
56
1152
Su
mm
er
88
87
77
66
86
68
1253
Su
mm
er
77
96
78
96
75
59
'013
49S
um
me
r7
67
67
67
67
76
8
1452
Su
mm
er
77
86
75
77
75
57
1565
Su
mm
er
109
108
108
128
98
810
e:\a
efm
\wkg
hadl
T-4
-4.x
ls

Tab
le4.
5.A
gere
adin
gsof
otol
iths
from
adul
tfis
h(4
4-74
em),
first
untr
eate
d(A
)an
dth
enba
ked
(B).
Oto
liths
from
Gre
enla
nd
A)Ag
ere
adin
gof
untre
ated
otol
iths.
Leng
th#
(em
)S
easo
nB
rian
Ann
eB
erna
rdR
icar
doP
erC
laus
John
Mar
gare
tE
ster
Lour
des
Sus
ana
Hor
dur
Mod
e1
44A
ug.
75
87
78
96
910
107
7
247
Aug
.6
68
96
107
85
77
86
353
Aug
.6
611
78
107
66
96
86
456
Aug
.9
912
107
813
87?
1011
88
559
Aug
.10
912
98
98
97
1010
89
664
Mar
ch11
1010
1111
910
127
1010
1010
765
Mar
ch10
1012
912
1210
109
88
1010
869
Mar
ch12
1011
119
710
1110
77
712
119
74A
ug.
1011
119
1312
99
8711
1212
1110
70A
ug.
1010
1011
1210
1210
712
711
10
NB)
Age
read
ing
ofth
eot
olith
sin
(A)a
fterb
akin
gth
em.
0
#Le
ngth
Sea
son
Bria
nA
nne
Ber
nard
Ric
ardo
Per
Cla
usJo
hnM
arga
ret
Est
erLo
urde
sS
usan
aH
ordu
rM
ode.
144
Aug
.5
57
76
66
77
86
7
247
Aug
.9
810
87
77
710
107
7
353
Aug
.8
67
77
67
67
77
7
456
Aug
.8
109
97
86
69
98
9
559
Aug
.10
1011
97
810
910
1010
10
664
Mar
ch11
99
98
99
810
1010
9
765
Mar
ch9
1010
118
1010
1010
1210
10
869
Mar
ch13
1111
910
710
1011
1110
119
74A
ug.
1012
99
96
810
1212
1010
1070
Aug
.10
99
108
79
910
108
10
Ligh
tdire
ctio
nR
efl.
Ref
l.R
efl.
Refl.
Tran
s.Tr
ans.
Ref
l.R
efl.
Ref
l.R
efl.
Ref
l.
e:\a
cfm
\wkg
had\
T-4-
5.xl
s

Table 5.1. Various techniques currently used by the different laboratories for sampling and storing Greenland halibutotoliths.
Laboratory Both otoliths are Scales washed in 1-2% Stored dry Stored in 50:50removed ammonium solution glYcerin:thYmol solution
Greenland X XIceland X X XNorway X XPortugal X XRussia X XSpain X XCanada
Iaaluit X XMont loli X XSt.John's X X
USASeattle X X
Table 5.2. Various preparation techniques currently used by the different laboratories.
Laboratory Soaked in Soaked in Baking 280°C, 30 Grinding if No Scales placedglycerin: glycerin: 190°C, min. necessary preparation between twothymol alcohol (25:75) 2-3 hours microscope
(50:50) for at for approx. 12 slidesleast 48 hours hours
Greenland XIceland X XNorway XPortugal XRussia XSpain XCanada
Iaaluit XMont loliSt.John's X
USASeattle X
Table 5.3 Reading procedures currently used by the different laboratories.
Laboratory Left! right Hyaline ys. Light direction Reading Magnification Otherotolith opaaue zones medium
Greenland Both Opaaue Transmitted Water 16xIceland Left Hyaline Reflected Water lO-16xNorway Both Ooaaue Transmitted Water 16xPortugal Both Hyaline Reflected Oil 8-lOx
MicrophotRussia IprojectorSpain Both Hyaline Reflected Glyc:alcohol lO-16xCanada
Iaaluit Left Hyaline Reflected Water lOxMontloli Left Hyaline Reflected Alcohol lO-16xSt.John's Both Hyaline Reflected Alcohol lOx
USASeattle Both Hyaline Reflected Water 9x Image analysis
E:\ACFM\WKGHAD\T-511-3.DOC 03/02197 21

I--1
..~I
l
l
OCT. 21-26, 1967HAMILTON INLET BANKo FROM COD STOMACHS
~C~ ~I=~;-I~~:·T -j T I r-,"lHAMILTON INLET BANK ~-- LENGTH DISTRIBUTlON(ALL FISH-- --- LENGTH DISTRIBUTlON(AGES)
-1
~3+ ~
I
\,,II\I,
1+ ~,,"' ..... _,
,I
'\I
,\ ,........I +' +\, I ,,/,, 2 \
o .~-,' .... - - .... :::-<:~3~1'~"":---"""''---./'---'--'--'-......L---J.-..JIL..-._L.L I I I L I I ...L..LL.....L-L--'-----'-..JL..-.-.L-.J
4 8 16 20 24 28 32 36 40 44 48 52FORK LENGTH (eM)
10
30
20
0+10
20
30
50
60 iT50 r-40r
40
ex: 0UJCD
~ 60z
Figure 2.1. Length distributions of otolith age-groups superimposed upon the length distributions ofGreenland halibut (Reinhardtius hippoglossoides) from Hamilton Inlet Bank duringOctober 11-17, 1966 and October 21-26, 1967. From Lear and Pitt (1975).
22

A100
75
N V CDCO CD 0) CD N It)
If)If) It) It) - CO50 -
25~
z'"u 0/I:
'" 8Go
100
75
,...50
,...
25
0JAN. FEB. MAR. APR. MAY JUNE JULY AUG. SEPT. OCT. NOV.
Figure 2.4. Monthly incidence of opaque edge deposits on otoliths from all areas for: A, fish of allages, and B, fish of age 0+ - 6 years inclusive. Numbers of fish are shown. From Lear andPill (1975).
23

1995
1996
40 50 60 70 80 90100110120130140150
20 ~-------------,
18
16
14
12
10
8
6
4
2o "-"-'c-----,----J'
30
Length (mm)
o ~j!
3040 50 60 70 80 90100110120130140150
20 ~-------------,,
18 j
16 114 ~,12 -1
lOi8 i
,
6 ~
4 ~,
2 1
20
18 O-Group G. halibut from 199216 Pelagic O-Group Gadoid14 Surveys
12
10
8
6
4
2 ~. IllyJ III030 40 50 60 70 80 90 100110 120 130 140 150
20 I
.c 18 " 1993Oil 16 1~
...J 14 101 12 j.E
10,OIl~
'" 8 1u0 6 i;z:
4 j.2 J
In01
30 40 50 60 70 80 90 100110 120 130 140 150
20 .
18 j 199416 ,
14 i12ilOi
,
8 16 j4 1
'i l2 i \;~o i
30 40 50 60 70 80 90 100110 120 130 140 150
Length (mm)
Figure 2.2. Length distributions of O-group Greenland from Canadian pelagic O-group gadoid surveysoutside eastern Newfoundland in August 1992-1996.
24

100 100 J1979 1984
80 18.5 80 I
60 10.5 60 j 10.522.5
40 40
20\.J
20
0 00 10 20 30 40 50 60 70 0 10 20 30 40 50 60 70
100 10022.5
10.5 1980 10.5 18.5 198580 80 28.5
26.5
60 60
40 40
20 20
0 0
'Q) 0 10 20 30 40 50 60 70 0 10 20 30 40 50 60 70
'" 100 100l-<
1981 12.5 1986Q)
10.50- 80 80 I0<::§ 60 16.5 60 16.5Q)
f\
~E .40 40
"0Q)
t;::; 20 20.~ \.2~5 32.5.l:l "--V). 0
~ ~
0
1000 10 20 30 40 50 60 70
1000 10 20 30 40 50 60 70
1982 198780 80
60 60 18.5
40 40
20 32.5 20
0 0
100 0 10 20 30 40 50 60 70 0 10 20 30 40 50 60 70
1983 Length (em)80
6032.5
40
20 10.5
00 10 20 30 40 50 60 70
Length (em)Figure 2.3. Length distributions of Greenland halibut from Canadian shrimp surveys conducted mainly
in July off Labrador in 1979-1987.
25

20·'.
15
10
5
o
20
15
January- February
3
~ ~ 2~ ~ ~ JS 40 ~ ~~
I
March-April
Figure 2.5. Length frequency percentages offish from shrimp trawl, only fish under 50 em used. Yearclasses indicated by Arabic numerals. Black sections used for calculation of mean lengthsof year-classes. Data from nursery ground, coastal area south of Godthab, (JanuaryFebruary 1954-58, 1960-63; March-April 1954-58, 1960-63; May-June 1956, 1958-61,1963; July-August 1953-63; September-October 1953, 1955-57, 1960-62; NovemberDecember 1953-55, 1959-62). From Smidt (1969).
26

40 -_._-_.- 40
35 O-Group G. halibut 1981 35 1986
30Norwegian Surveys
30Barents Sea25 Aug.-Sept. 25
20 20
15 15
10 10
5 5
0 030 40 50 60 70 80 90 20 30 40 50 60 70 80 90
40 40
35 1982 35 198730 30
25 25
20 20
15 15
10 10
5 5
0 030 40 50 60 70 80 90 20 30 40 50 60 70 80 90
40 40
351983
351988
30 30
E 25 25
'"~ 20 20<l.. 15 15
10 10
5 5
0 020 30 40 50 60 70 80 90 30 40 50 60 70 80
40 r--- 40
351984
35
30 30
25 25
20 20
15 15
10 10
5 5
0 020 30 40 50 60 70 80 90 100 30 40 50 60 70 80
40Length (nun)
351985
30
25
20
15
10
5
030 40 50 60 70 80 90
Figure 2.6. Length distributions of O-group Greenland from joint Norwegian-Russian pelagic O-groupgadoid surveys in the Barents Sea and Svalbard areas in August-September 1981-1988 (i.e.,before the recruitment failure) and in 1995 (seem to be a relative good year-class comparedto the surrounding ones).
27

6 21
o 5 10 15 20 25 30 35 40 45 50 55 60
Length (em)
Figure 2.7. Length distributions of Greenland halibut from Norwegian shrimp surveys in the BarentsSea and Svalbard areas in August 1988 (before the recruitment failure) and June 1996 (aftera few years with better recruitment). The recruitment in 1989-1993 seem to have beenexceptionally poor, and length distributions from this period are therefore not useful for agevalidation purposes.
28

--~----------f-----~~--~
14 _
1d :j:+ +
10 ·i ++++I ++
w
;1++ +
2 ++ + ++++++++
0 2 4 6 8 10 12 14
NFL
"I12 +++++10 +++++ +
0:: 8 +++ +0 ++z 6 +
4t+
+++2 ,o I I
0 2 4 6 8 10 12 14
NFL
14 T
12 .j. ++ +10 + ++ ++ + +8+ :j:++ +
0::0 ,z 6-1- +,
++ +4+ ++2+ ++0 I
0 2 4 6 8 10 12 14
ICE
Figure 4.1. Pairwise laboratory comparisons of age readings using untreated otoliths read intransmitted light (TLNT-method). ICE=lceland, NFL=St.John's and NOR=Norway. Notethat some of the crosses may represent more than one fish.
29

r------!
'"116 +14 :t:12 +
w 10 tt+ +2 6
6+ + :t: +
~t +0+ I
0 2 4 6 6 10 12 14 16 16
NFL
+
4 6 6 10 12 14 16 16
NFL
'"oz
16 T
16 +14 -+-12 + +
'" 104- +061z6 -i- +4+2 ++ +01 I
0 2 4 6 6 10 12 14 16 18
ICE
Figure 4.2. Pairwise laboratory comparisons of age readings using untreated otoliths read in reflectedlight (RLNT-method). ICE=Iceland, NFL=StJohn's and NOR=Norway. Note that some ofthe crosses may represent more than one fish.
30

Figure 4.3. Pairwise laboratory comparisons of age readings using baked otoliths read in reflectedlight (RLBA-method). ICE=Iceland, NFL=StJohn's and NOR=Norway. Note that some ofthe crosses may represent more than one fish.
31

Co
mp
ari
son
am
on
gre
ader
san
dm
eth
od
s
w•
•u
••
••
••-
-••
•-
..••
I
•••••
....
....
._...-
....
..•.
....
..0:
:..
.-_.
._.
...-
..o
:_.
••
•••
•••
•••
••
111
••
••
z-
••
••
••
1020
3040
5060
7080
10T
ran
smitt
ed
-no
trm
t.
•
••• ...
....
....
••
• ....
...
'ee
••
..........
........
•••••
2030
4050
6070
80R
efle
cted
-bak
ed
..•"._-
-.
••••
•••
••
••
2030
4050
6070
8010
Ref
lect
ed-n
otr
mt.
• .....
~0'N
...
j···
o·!J
.'.:IP9!
'..··0
··..::;
0···
...
.•••
••
.....
~.
....~
....
.II
I•
..
...
....
•••
••
'. •• ••
.....
-..
••••
•••
••
·"0
.·0
0..
····
..·.
.·.
• ...'
l..
.as
....
11
.0••
...
IIII
.
•• •
..I
U.
Z I W
u-
...J
U.
Z I 0::
_0
Z
-
-en :to- m Q) >- - C) s:::: .- "C m Q)
:to-
Q)
C)
;dm s:::
: .- Q) o s::::
Q)
:to-
Q) - -.- C
Le
ng
th(e
m)
age0
02.s
tg
Fig
ure
4.4.
Com
pari
son
amon
gre
ader
san
dm
etho
ds.
Res
idua
lsar
epl
otte
dag
ains
tfi
shle
ngth
.R
egre
ssio
nli
nes
have
been
draw
nto
illu
stra
tean
ytr
ends
inth
ere
lati
ons
tole
ngth
.N
ote
that
the
-11
outl
ier
has
been
omit
ted
inth
epl
ot.

Transmitted light: no treatment
80
ageOOla"lg
706040 50
Length (em)
3020
181r;;;;:~:;::::::::;:::;;-,-,--"T--'-'--117 '0. COU: NOR _· , .16 '0.. COU: ICE , , ·1 ..15 COU:NFL , , ! .,14 .;. ,..... . +.... . j.... . - ····· .. ·······1 :;....-13 , ,.... ... ·..· .."'0 · ·..\..·0·0'.."' ·
~~.:'·?~CD.;9:O .10 , _ ,.... ··<:II:t-~.·.".·· ..o_·.:.·..:.O;..•j.~.~....•...• o.
9 ,. .. , ,8 ...., · .. ·· · ..,,·.·<:0·0·:7' · · ..'00·0 .Ql,--o·::-o+.o@~ +:~:::.o.... . .,..::.~'!::t:~:::=~: ..::::::~t:: .4 0 ' :0'00 @ \ i.... . ...,
3;0·<»·'····"2 . p li){!)~:·.····1·············· ·· ..·.. ·1 <. •••••••••••••••••••••••••••• , •••••
1 ..• ~.:..:- : <. ,.... .. , •••••••
oc.......:....:::.._-'---__'---__-'---__'---__'---__-'----_-----J10
w
~
Reflected light: no treatment
ageOOOlb.slg
. ··········i····
··..···..·t··......................... ~ L ..............1 1....
..........................! ! ····························!r·· ..
18 [;:;~~;:;:=====::::::::I====;::C=::=J17 '0. COU: NOR···· L.....j ··0··;···, ..........•.'16 '0.. COU: ICE ,.... .. ,....... . , ..
15 COU: NFL , ,..... .. , L , ..14 , ,.·····'0\13 i.......,. .. ,... .100' . '"12 1_,.) ...\ 60'" .11 ............\.................. ., :;.. ::" .
1~ ••••••••••••••••••.•••••••••:: ••••••••••••••••~~~ ••••••• ?..i.~:~i!f;'.~~':'··; •••·7 ,...... ~~-::,,·O' .i. , ..
6-0 ~O "'OL5 .. '0 ' , ..4 .....<>\. ..,321O~'---'-----'-----'------'-----'-----'--------J10 20 30 40 50 60 70 80
Length (em)
w
~
Reflected light: baked
80ageOOlc.slg
7060
.............................! + ) .
40 50
LENGTH
......................., , " ······..······..············1········............................1....
3020
18 ,----,-----,-----,----,------,---,--------,
~ ~ .•••••• '0. COU: NOR L.15 "0.. COU: ICE i ,.... .·.... i .14 COU: NFL ) , ,.... .. ) ..
13 " ····························1··· , , ..
12"" ····f .•.•.....•...•.•...•.•.•.•.•.•.•.•.•.•.•...•.•.•.• ',.," ····································cIDoO© '~6Jt .······0 .~¥:~
~ ·····I:~;;·~~f~~~··6\m .
~J3 ) ....-."~_2 ',..·e1O~c:...---'------'-----'-----'------'-----'--------'10
w
~
Figure 4.5. Age-length plot of Greenland halibut aged in the experiment. Comparison of three readersby method.
33

Norwegian age reader
ageoro...tg
. +....................•....:•••·•• ····0···'···. , i , .
.........•............, + ~ .
.............................! +····························1·····........................!..............•...............~... . ~ .
18 rr.~"'==:C==;=~~=:"l--,-----,...---....,---,-----.-..--,17 "0- Transmitted - no treatment ' i i
l! ~.:.::::I::::~==~:~:~~:~:~~~:~:~:~~~~k~t:~:a::::tm::::e::::n::::t::::J.. ::.:.:.:.: ::C..::.•·•·•·•·.•·.·.·.·.·.·.·.·.·.·.·.·.·.·.·.·.:.:.·." jJ.:.:.:.:.:.:.:.:.: ..•.•:........ 1J .13 f·····················,··· .....................•... . ,............................................•.12 ~.... : :11 ..............................J~1O···· ··········,············T·············,;;;:·~~~····, .9······, ,..i...•.8 , ,..7 I·········· ; ,..6 ; .5 , .4 .,32 ·······O···~;lIII':W""1 ................•.............L.,..o~L::---'-__-'---__--'--__L-_--'-__-'---_------J10 20 30 40 50 60 70 80
Length (em)
Icelandic age reader
80
aoeOO3b.$tg
7060
..................... ; 0
40 50
Length (em)
3020
18 r;=:;:;:::=======:::;--,...----,------r---,--i17 \).. Transmitted· no treatment , ..,,···········..···0···)····
16 '0... Reflected· no treatment "" , ~ ·· ..··············.. ···· 1· ·
15 " Reflected .. baked ; , ; ..14131 ··· ·, ··· ··; ,..12 I · ·.., , ,..11 f f· ·.. ; ,..10 ···························,···················0·····6
9'+008 ..... (f>..
~ f·· ····· ··,· ··· ·· ,... O~·~.I?:~.~l..L ; ..
50 , + , .4 f · ; iJ' i
3 ·e·+ ·..·" · ········!·····························! .2 ="'-""'. . , , .1 ~z~!ItOtL:::..__L....__L....__L....__J-.__J-.__J-._----J
10
Newfoundland age reader
8geOO3<:.6Ig
180~~~~~+========l17 ~..... "0- Transmitted· no treatment
16 '0.... Reflected - no treatment f+ , ·..· ·· ,
15 f.l;:"~~R~ef~le~ct~ed'!=!-b~a~ke~d~=:J••••••••!................ 1[................ :........................ j........................ j14 ~
l~I + , + ; ~,".:''':'~;
~ "1·· ~".J: ~OvO;o7 ........"...•..~...?: .00CD6 .,. ........~ • ,\XI o~ce .~ ...........................'07?-,~;~TO .; , ..~ ·:::::::;~······~~:O·ot?~ ;.l~t··················O""""~_L....__J-.__J-.__J-.__..L.--__-'--__
10 20 30 40 50 60 70 80
Length (em)
Figure 4.6. Age-length plot of Greenland halibut aged in the experiment.. Comparison of all threemethods for each reader.
34

Len
gth
vers
us
age:
"pre
ferr
edm
eth
od
"
80
age0
04.s
tg
70
.....
).
6040
50
Len
gth
(em
)
....
....
....
....
....
....
....
....
....
....
...~
....
••..
•..•
..•.
•.••
•...
....
....
....
....
..
30
...:::::::
::::::.:::
::::.:::.:
::::::::::
::..6¢
>.
·Oc:m·········
·~·
.·
....
......
...,
;....
....
•...
..
....
....
....
....
....
....
....
....
....
....
....
.••.
..••
....
....
•...
....
....
....
•..
·.
·.
....
....
....
....
....
....
....
....
....
....
....
....
....
....
.~.
20
Nor
way
:tra
nsm
itted
light
-no
trea
tmen
tI··
:·..
·..·
····
····
····
····
····
···:
····
····
····
····
··,
.
Icel
and:
refle
cted
light
-ba
ked
,_
.
New
foun
dlan
d:re
flect
edlig
ht-
notr
eatm
ent
I'.
....
....
....
....
....
....
....
....
....
....
....
....
....
....
....
....
....
....
....
....
....
....
....
....
....
....
....
....
....
....
....
....
....
....
....
....
....
....
....
....
....
....
....
...
18 17..
...'Q
16...
..'R
15..
...
..........
.14 13 12 11 10
w9
C)
w«
8u
.
7 6 5 4 3 2 1 0 10 Fig
ure
4.7.
Age
-len
gth
plot
of
Gre
enla
ndha
libu
tag
edin
the
expe
rim
ent.
Com
pari
son
of
the
thre
ere
ader
sea
chus
ing
thei
rm
ostf
amil
iar
met
hod.

A
Posterior
Left
Left
Right
Right
Figure 5.1. Illustration of left and right Greenland halibut otoliths. The left otolith is generally moreuniform in shape and has less outstanding «fingers» than the right one, and the nucleus ofthe left otolith is situated in the center with possible reading axes all around. The rightotolith has more outstanding «fingers» when compared with the left otolith from the samespecimen, and the nucleus, which may be more oval, is situated more to the posterior partof the otolith making it impossible to read the posterior part of a right otolith. (A) is takenfrom a 42 em fish and has been aged to 6 years while (B), which shows that also the leftotolith may have «fingers», is from a 69 em fish which has been aged 11-12 years. The fishwere caught in May, and the illustration shows how the otoliths look like in transmittedlight (e.g., the opaque zones are dark). The illustrated otoliths were magnified 6.3x.
36

APPENDIXl
BIBLIOGRAPHY
Alton, M.S., Bakkala, RG., Walters, G.B. and Munro, P.T. 1988. Greenland turbot, Reinhardtiushippoglossoides, of the eastern Bering Sea and Aleutian Islands region. NOAA Technical Report NMFS71,31 pp.
Anon. 1994. Report of the workshop on sampling strategies for age and maturity. ICES CM 19941 D: 1,67 pp.
Armstrong, D.W. and Ilardia, S. 1986. On bias in estimates of population parameters obtained by means oflength-stratified sampling for agellength keys. ICES, Doc. C.M. 1986/G: 10.
Atkinson, D. B., Bowering, W. R., Parsons D. G., Horsted Sv. Aa., and Minet J. P. 1982. A review of the biologyand fisheries for roundnose grenadier, Greenland halibut and northern shrimp in Davis Strait. NAFOSci. Coun. Studies. 3: 7-27.
Beamish, RJ. and McFarlane,G.A. 1983. The forgotten requirement for age validation in fisheries biology.Trans.Amer.Fish.Soc. 112(6): 735-743.
Beamish, RJ. and Fournier, D.A. 1981. A method for comparing the precision of a set of age determinations. Can. J.Fish. Aquat. Sci. 38: 982 - 983.
Bernard, D.R. 1981. Multivariate analysis as a means of comparing growth in fish. Can. J. Fish. Aquat. Sci., 1981.38(2): 233-236.
Blacker, RW. 1974. Recent advances in otolith studies. In Harden Jones, F.R. red]. Sea fisheries research. ElkScience, London: 67-90. Doc.66/69. Ser. No. 1686.
BoeWert, G.W. 1985. Using objective criteria and multiple regression models for age determination in fishes. Fish.Bull. 83(2): 103-117.
Boje, J. 1991. An assessment of the Greenland halibut stock component in NAFO Sub-areas 0+1. NAFO SCR Doc.91138. 12 p.
Boje, J. and Riget, F. 1989. Results of the 1986, 1987 and 1989 Greenland-Canada Greenland halibut otolithexchange. NAFO SCR Doc. 89/42. 3p.
Boje, J. and J¢rgensen, O.A. 1991. Growth of Greenland halibut in the Northwest Atlantic. ICES Demersal FishCommittee CM 199I1G:40. 12 p.
Bowering, W.R. 1978. Age and growth of the Greenland halibut, Reinhardtius hippoglossoides (Walbaum), inICNAF Sub-areas 2-4. ICNAF Res Bull No. 13: 5-10.
Bowering, W.R. 1981. Greenland halibut in the Gulf of St. Lawrence - from immigrants to entigrants. CAFSAC Res.Doc. 81/55.18 p.
Bowering, W. R. 1982. Population dynamics of Greenland halibut in the Gulf of St. Lawrence. J. Northw. Atl.Fish. Sci. 3: 141- 147.
Bowering, W. R 1983. Age, growth, and sexual maturity of Greenland halibut, Reinhardtius hippoglossoides(Walbaum), in the Canadian Northwest Atlantic. Fish. Bnll. 81: 599-611.
Bowering , W.R and Stansbury, D.E. 1984. Regressions of weight on length for Greenland halibut, Reinhardtiushippoglossoides, from Canadian waters of the northwest Atlantic. J.Northw.AtI.Fish.Sci., vol. 5: 107108.
E;\ACFM\WKGHAD\REPORT.DOC 05102/97 37
Bowering, W.R. and Brodie, W.B. 1988. A review of the status of the Greenland halibut resources in NAFOSubarea 2 and Divisions 3K and 3L. NAFO SCR Doc. 88/69. 23 p.
Bowering, W.R. and Brodie, W.B. 1991. Distribution of commercial flatfishes in the Newfoundland - Labradorregion of the Canadian Northwest Atlantic and changes in certain biological parameters sinceexploitation. Neth. J. Sea. Res. 27(3/4): 407-422.
Bradford, M.J. 1991. Effects of ageing errors on recruitment time series estimated from sequential populationanalysis. Can. J. Fish. Aquat. Sci. 48: 555- 558.
Brothers, E.B., Mathews, c.P. and Lasker, R. 1976. Daily growth increments in otoliths from larval and adult fishes.U.S.Fish.Bull.74: 1-8.
de Cardenas, E. 1996. The females ration by length as an indicator of sexual differences in mortality ofGreenland halibut (Reinhardtius hippoglossoides) at ages 8+. NAFO SCR Doc. 96/35. 10 p.
Chang, W.Y.B. 1982. A statistical method for evaluating the reproducibility of age determination. Can. J. Fish.Aquat. Sci. 39: 1208- 1210.
Chaine, 1. and Duvergier, J. 1934. Research on the otoliths of fishes, a descriptive and comparative study of thesagitta ofteleosts. Actes Soc. Linn. Bordeaux 86: 5-24.
Chilton, D.E. and Beamish, RJ. 1982. Age determination methods for fishes studied by the groundfish program atthe Pacific Biological Station. Can.spec. Publ.Fish. Aquat.Sci. 60: 102 p.
Christensen, J.M. 1964. Burning of otoliths, a technique for age determination of soles and other fish. J. Cons. Int.Explor. Mer. 29: 73-81.
Crawford, R. E. (1992). Life history of the Davis Strait Greenland halibut, with reference to the CumberlandSound fishery. Can. Man. Rep. Fish. Aquat. Sci. No. 2130,19 p.
Ernst, P. and Borrman, H. 1987. Investigations on growth of the Greenland halibut stock (Reinhardtiushippoglossoides Walb.) off Canada and West Greenland. NAFO SCR Doc. 87n5. 15 p.
Flatman, S. 1990. The evaluation of biological sampling targets and the precision of estimated age composition withreference to demersal fish sampling in ICES Divisions VIla, VIle, and VIIf,g. MAFF Internal Report No.21.
Fryd, C. 1901. Fish otoliths in relation to importance for systematics and aging. Inaugural-dissertation, Univ.Kiel,Germany.
God~, O.R. and Haug, T. 1989. A review of the natural history, fisheries, and management of Greenland halibut(Reinhardtius hippoglossoides) in the eastern Norwegian and Barents Seas. J. Cons. Ciem. 46(1): 62-75.
Gudmunsdottir, A. Steinarsson, B.A. and Stefansson, G. 1988. A simulation procedure to evaluate the efficiency ofsome otolith and length sampling schemes. ICES, Doc. C.M. 19881D:14.
Gulland, J.A. 1955. Estimation of growth and mortality in commercial fish populations. Fish., Invest., Lond.(2),18(9). 49 p.
Haug, T. and Gulliksen, I. 1982. Size, age, occurrence, growth, and food of Greenland halibut, Reinhardtiushippoglossoides (Walbaum) in coastal waters of western Spitzbergen. Sarsia 67 (4): 293-297.
Haug, T., Bj~rke, H. and Falk-Petersen, I-B. 1989. The distribution, size composition, and feeding of larvalGreenland halibut (Reinhardtius hippoglossoides Walbaum) in the eastern Norwegian and Barents Seas.Rapp. P.-v. Reun.Cons.int.Explor.Mer, 191:226-232.
Jensen, A.S. 1935. The Greenland halibut (Reinhardtius hippoglossoides) its development and migrations. K. Dan.Vidensk. Selsk. Skr. 9Rk. 6: 1-32.
E;\ACFM\WKGHAD\REPORT.DOC 05f02l97 38

Keir, RS. 1960. Answers to the qnestionnaire on age reading. 1CNAF MD. 4. Ser.No. 714
Kimura, D.K. 1977. Statistical assessment of the age-length key. J. Fish. Res. Board Can. 34: 317-324.
Kimura, D.K. and IJ. Lyous 1991. Between reader bias and variability in the age-determination process. Fish.Bull.89: 53-60.
Kochkin, P.N. 1980. How to prepare fish vertebrae for age determination. J. Ichthyol. 20(6): 153-157.
Koslow, J.A. 1984. Recruitment patterns in northwest Atlantic fish stocks. Can. J. Fish. Aquat. Sci. 41(12): 17221729.
Kovtsova, M.V. and Nizovtsev, G.P. 1985. Peculiarities of growth and maturation of Green-land halibut of theNorwegian-Barents Sea stock in 1971-1984. ICES C.M. 1985/G:7. 17 p.
Krzykawski, S. 1975. Age and growth rate of the Greenland halibut Reinhardtius hippoglossoides (Walbaum) fromthe Northern Atlantic. ICES C.M. 19751F: 24. 8 p.
Krzykawski, S. 1976. A characteristic of growth of Greenland halibut, Reinhardtius hippoglossoides (Walbaum),from the North Atlantic. Acta Icthyol Piscatoria. 6(2): 79-102.
Krzykawski, S. 1991. Morphometry and growth of Greenland halibut Reinhardtius hippo-glossoides (Walbaum,1792) from the Barents Sea. Acta Ichthyol Piscatoria 21(2) 1991: 87-106.
Krzykawski, S. 1992. Biometric characters and growth of Greenland halibut Reinhardtius hippoglossoides(Walbaum, 1792) off Labrador. Acta Ichthyol Piscatoria. 22(1) 1992: 97-111.
Lahn Johannessen, J.H. 1965. Bliikveiten og bliikveitefisket pii egga. University of Bergen. Thesis in zoology. 52pp., 33 tables, 24 figures. (In Norwegian).
Lai, H.L. 1987. Optimum allocation for estimating age composition using age-length key. Fishery Bulletin, 85(2):179-185.
Leaman, B.M. and Beamish, RJ. 1984: Ecological and management implications of longevity in some NortheastPacific groundfishes. Bull.42. Int. North. Pac. Fish. Corum. 1984.
Lear, W.H. 1970a. Catch statistics, length and age composition of Greenland halibut in the Newfoundland area. Fish.Res. Board Can. Tech. Rep. No. 179.27 p.
Lear, W. H. 1970b. The biology and fishery of the Greenland halibut (Reinhardtius hippoglossoides Walbaum) inthe Newfoundland area. M.Sc. thesis, Memorial Univ. Newfoundland, St. John's, Nfld. 132 p.
Lear, W.H. and T.K. Pitt. 1975. Otolith age validation of Greenland halibut (Reinhardtius hippoglossoides). J. Fish.Res. Bd. Can. 32(2): 289-292.
Mathias, J. and Keast, M. 1996. Status of the Greenland halibut (Reinhardtius hippoglossoides) fishery inCumberland Sound, Baffin Island 1987-95. NAFO SCR Doc. 96nl. 20 p.
Mikawa, M. 1969. Ecology of the lesser halibut, Reinhardtius hippoglossoides matsuurae Jordan and Snyder.Translation series (Fish. Res. Board Can.) No. 1260. 106 p.
Milinskii, G.!. 1968. The biology and fisheries of Greenland halibut of the Barents Sea. Translation series (Fish.Res. Board Can.) No. 1159.22 p.
Morgan, M.J. and Bowering, W.R 1995. Maturity at size and age of Greenland halibut in NAFO Sub-area 2 andDivisions 3KLM. NAFO SCR Doc. 95/54. 19 p.
E:\ACFM\WKGHAD\REPORT.DOC 05102197 39

Morgan, M.l. and Bowering, W.R. 1997. Temporal and geographical variation in matnrity at length and age ofGreenland halibut (Reinhardtius hippoglossoides) from the Canadian Northwest Atlantic withimplications for fisheries management. ICES J. Mar. Sci. (In Press).
Mulligan, TJ. and Leaman, B.M. 1992. Length-at-age analysis: Can you get what you see? Can. J. Fish. Aquat.Sci. 49(4): 632-643.
Nicholson, M.D. and Armstrong, D.W. 1974. A note on a possible source of bias in the estimation of meanlength at age. ICES, C.M. 19741F:35.
Nizovtsev, G.P. 1987. Growth pattern of Greenland halibut (Reinhardtius hippoglossoides W.) from thenortheast Atlantic. NAFO SCR Doc. 87/89. 20 p.
Nizovtsev, G.P. 1991. Growth patterns of Greenland halibut (Reinhardtius hippoglossoides) in the NorthwestAtlantic. NAFO. Sci. Coun. Studies, 15: 35-41.
Pope, J.G., and Knights, B. 1975. Sources of variation in catch at age data and the optimal use of age reading effort.ICES, Doc. 19751F: 20.
Pope, J.G., and Grey, D. 1983. An investigation of the relationship between the precision of assessment data and theprecision of total allowable catches, p. 151-157. In W.G. Doubleday and Rivard, W. [ed.]. Samplingcommercial catches of marine fish and invertebrates. Can. Spec. Pub!. Fish. Aquat. Sci. 66.
Richards, L.l., Schnute, J.T., Kroulund, A.R. and Beamish, R.J. 1992. Statistical models for the analysis of ageingerror. Can. J. Fish. Aquat. Sci. 48: 1801- 1815.
Riget, F. and Boje, J. 1987. Biology and fishery of Greenland halibut at West Greenland. NAFO SCR Doc.87/81. 29 p.
Riget, F. and Boje, J. 1988. Mean length at age of Atlantic halibut (Hippoglossus hippoglossus) in WestGreenland. NAFO SCR Doc. 88/10. 4 p.
Riget, F. aud Boje, J. 1989. Fishery and some biological aspects of Greenland halibut (Reinhardtiushippoglossoides) in West Greenland waters. NAFO Sci. Coun. Studies, 13: 41-52.
Rivard, D. 1989. Overview of the systematic, structural, and sampling errors in cohort analysis. Am. Fish. Soc.Symp. 6: 49- 65. .
Rivard, D. and Foy, M.G. 1987. An analysis of errors in catch projections for Canadian Atlantic fish stocks. Can. J.Fish. Aquat. Sci. 44(5): 967-981.
Schouten, HJ.A. 1982. Measuring pairwise interobserver agreement when all subjects are judged by the sameobservers. Statistica Neerlandica 36: 45- 61.
Schweigert, J.F. and Siber, J.R. 1983. Optimizing survey design for determining age structure of fish stocks: anexample from British Columbia Pacific herring (Clupea harengus pallasi). Can. J. Fish. Aquat. Sci. 40:588- 597.
Scott, T. 1906. Observations on the otoliths of some teleostean fishes. 24th Ann. Rep. Fish. Bd. Scot. Part 3(Sci.Invest.): 48-82.
Shepherd, C.E. 1910. Comparisons of otoliths found in fishes. The Zoolog., London, SerA, 14: 292-298.
Shepherd, J.G. and Nicholson, M.D. 1986. Use and abuse of multiplicative models in the analysis of fish catchat-age data. The Statistician 35(2): 221- 227.
Sigurdsson, A. 1979. The Greenland halibut, Reinhardtius hippoglossoides (Walb.), at Iceland. In Hafrannsoknir16.31 pp., 18 figures, 21 tables. (Summary, figure and table legends in English).
E:\ACFM\WKGHAD\REPORT.DOC 05/02197 40

Skalkin, V.A. 1963. Otoliths of Some Fishes in Far Eastern Seas. IZV.TINRO 49: 159-199.
Smidt, E. 1969a. The Greenland halibut (Reinhardtius hippoglossoides), biology and exploitation in Greenlandwaters. Medd. Dan. Fisk. Havunders. 6: 79-148.
Smidt, E. 1969b. The Greenland halibut. Translated from Tidsskrifted Gr0nland, p 259-366, by the TranslationBureau, Multilingual Servo Div., Dept. of Sec. of State ofCanada, Trans. Ser. No. 3094.
Sorokin, V.P. 1980. Some features of the biology of the Greenland halibut, Reinhardtius hippoglossoides(Walbaum), in the Barents Sea. Can. Trans. Fish. and Aquat. Sci. No. 4672. 35 p.
Tanaka, S. 1953. Precision of age-composition of fish estimated by double sampling method using the length forstratification. Bull. Jap. Soc. Sci. Fish. 19: 657- 670.
Trippel, B.A. and Harvey, H.H., 1991. Comparison of methods used to estimate age and length of fishes at sexualmaturity using populations of white sucker (Catostomus commersom). Can. J. Fish. Aquat. Sci. 48: 14461459.
Vernidub, M.P. and Panin, K.l. 1983. Some data on the systematic position and biology of a Pacific member of thegenus Reinhardtius Gill. Can.Trans.Fish and Aquat. Sci. No. 5018. 35 p.
Westrheim, SJ. and Ricker, W.E. 1978. Bias in using an age-length key to estimate age-frequency distributions.J.Fish.Res.Bd.Can. 35(2): 184-189.
Wiedemann Smith, S. 1968. Otolith age reading by means of surface structure examination.J.Cons.Int.Explor.Mer. 32: 270-277.
Yatsu, A. and J0rgensen, O. 1989. Distribution, abundance, size, age, gonad index and stomach contents ofGreenland halibut (Reinhardtius hippoglossoides) off West Greenland in September/October 1988.NAPO SCR Doc. 89/31. 12 p.
E:\ACFM\WKGHAD\REPORT.DOC 05f02J97 41

Participants' addresses:
APPENDIX 2
NAME ADDRESS TELEPHONE FAX E-MAILBowering, W. Ray Northwest Atlantic Fisheries Centre +1709772 0563 +1709772 4188 [email protected].(Chainnan) P.O. Box 5667 nf.ea
St. John's, NewfoundlandCanada AIC 5XI
Alpoim, Ricardo M.R. Institute de Investigacao Jas Peseas +351 13010814 +351 1 301 5948 http://www.ipimar.pte do Mar (IPIMAR)Avenida Brasilia1400 LisboaPortugal
Andresson, H6rdur Marine Research Institute +354 552 0240 +3545623790 [email protected] 4ReykjavikIceland
Babaluk, John Canadian Department of Fisheries +12049835143 +1 204 984 2403 [email protected] Oceans mpo.x400.gc.ca501 University CrescentWinnipeg MB R3T 2N6Canada
Bragad6ttir, S6lrlin Ranns6knast06in, +3544237870Gardavcgi 1245 Sanger6iIceland
Drevetnyak, Konstantin PINRO +47789 10423 +4778910518 [email protected]. 6 Knipovieh St. ru
183763 MurmanskRussia
Godinho, M. Lourdes M. Institute de Investigacao Jas Peseas +351 13010814 +351 13015948 http://www.ipimar.pte do Mar (IP1MAR)Avenida Brasilia1400 LisboaPortugal
Greene, Brian Northwest Atlantic Fisheries Centre +1 709 772 0563 +17097724188 [email protected]. Box 5667St. John'sNewfoundlandCanada AIC 5XI
Gretarsd6ttir,Ester Ranns6knast66in, +3544237870Gardavegi 1245 Sanger6iIceland
Hj6rleifsson, Einar Marine Research Institute +3545520240 +3545623790 [email protected] 4ReykjavikIceland
Junquera, Susana Instituto Espanol de Oceanografia +34 86 492 I I I +3486492 351 [email protected]. 1552VigoSoain
Keast, Margaret Canadian Department of Fisheries +18199796274 +18199794539and Oceans,Box 358 Iqaluit, NT., XOA OHOCanada
E:\ACFM\WKGHAD\REPORT.DOC 07/02/97 16:01 42

NAME ADDRESS TELEPHONE FAX E-MAILLarson, Per Otto Greenland Inst. for Natural +29921095 +29925957 [email protected]
ResourcesP.O. Box 5703900 NuukGreenland
Morin, Bernard Institute Maurice-Lamontagne +14187750695 +14187750740 [email protected] Route de la merC.P. 1000 Mont-JotiQuebecCanada G5H 3Z4
Mogster, Mons Institute of Marine Research +47 5523 8500 +475523 8687 [email protected]. Box 18705024 BergenNorway
Nedreaas, Kjell Harald Institute of Marine Research +47 5523 8500 +475523 8687 [email protected]. Box 18705024 BergenNorway
Simonsen Claus Stenberg Greenland Inst. for Natural +29921095 +29925957 [email protected]. Box 5703900 NuukGreenland
Saeverod, Anne Institute of Marine Research +47 5523 8500 +475523 8687 [email protected]. Box 18705024 BergenNorwav
E:IACFMlWKGHADIREPORT.DOC 07/02197 tl:29 43

APPENDIX 3
Pairwise comparison plots from the two last otolith exchanges in advance of the workshop.
20 T
i18 +16 +14.1-
+12
...I +... 10 +z + ++8 + ++
+ +6 +4i-
i2 1
IIo ' -t--+- I I I
0 2 4 6 8 10 12 14 16 18 20
MO
20
18
16+++
14 + + +++ ++
12 + +...I +... 10 +++z ++
8 + ++ +
6 ++ +
4 ++
2 +0
0 2 4 6 8 10 12 14 16 18 20
MO
Age-bias plot of St.john's (NFL) and Mont Joli (MO) readings.
44
.'

++
++ ++
+ +++ +
+
20 T18 t16 I14 I12
IoJ... 10iz !
atI
a+4+
2+
0-10
~ ~ I t . j.. "------~ ---f -"-I ... .+.....2 4 6 8 10 12 14
t--- --t----- I
16 18 20
+
20
18
16
14
12oJ
10 ~...z
8·
6·
4
2
00
MO
++++ ++
+ +++ +
++++
+++ +
+ ++
+ ++
++
I I I I I I
2 4 6 8 10 12 14 16 18 20
MO
Age-bias plot of St.John's (NFL) and Mont Joli (MO) readings.
45

20
18
16
14
12~
c:: 10·0z8
6·I4+I
2fI
01
0
201
18j
16i
14
12
Ii: 10 .0z8 "I
I6+4 12
0
0
NOR1-MO
++ ++
++ +
+ ++++
++
. ,,-,",1 .. .. /.. .. j".". .+," /.. / ..... / ... /
2 4 6 8 10 12 14 16 18 20
MO
++ + +++++ +++++
+ ++ +++
++
+++
++++
++
++2 4 6 8 10 12 14 16 18 20
MO
Age-bias plot of Norway, reader 1 (NOR1). and Mont Joli (MO) readings.
46

20
18
16
14
12
'" 10:10 t0z8
6
4 ~
2
00
NOR2-MO
++
++
+++
+ +++
+
"···1 ·"·······-1 ....--""+ ~ ~ ~ + ~ j ·1 ......-j "".----1- ~~~~ +~~ 1
2 4 6 8 10 12 14 16 18 20
MO
~: j16 ....
+++14 + + ++
+12 ++ +
'" ++0: 10 ~ .. +++0Z +
8 + +++
6 T +4 1 +
+++
2+
00 2 4 6 8 10 12 14 16 18 20
MO
Age-bias plot of Norway, reader 2{NOR2) , and Mont Joli (MO) readings.
47

ICE-MO
~: t:: j12
w 102
:t4-1
~ t..... -1--
0 2
20
18
16 .
14
12w 102
8I
6i
4
2
00 2
++
+++
+ ++++
+++++++
+++
-·····1 ..... .. !-"" f-------t ----I ---1---- "'-1' .. 1-.,", .. I
4 6 8 10 12 14 16 18 20
MO
++
+ +++ +++ +
++++++
+++ + ++
++
+ +++++
+ ++++
4 6 8 10 12 14 16 18 20
MO
Age-bias plot of Iceland (ICE) and Mont Joli (MO) readings.
48

ICE-NORl
20
18
16
14
12 ++
-~~- ----------------
o
+++++
++ +++++ ++ +
+ +++ +++
+
f t 1 "1,,, ...+_... - +-----j
4 6 8 10 12 14 16 18 20
NOR1
-------------------- -- -----
I
..... j... ...." ,- -- I- ,- -- , .........+". ... j. - -f I
2 4 6 8 10 12 14 16 18 20
NORl
20
18
16
14
12w 1012
:14
2-
00
++
+++ +++ +
+ +++
+
++
++ ++
++
++++ ++
Age-bias plot of Iceland (ICE) and Norway, reader 1 (NOR1), readings.
49

20,
18.1
16i~ ::j
8+
6 ji
4-1i2t
01" [- """+o 2 4
ICE-NOR2
++
+ ++
+ ++++ ++
+ +++ +++
+++
"",--1", ..... +" ---j--- "j --1---- -[ ..... [
6 8 10 12 14 16 18 20
NOR2
-
20
18
161
++
14-! +121
++ ++ ++ ++
w 10 J +2 , +
I + + +81 + +
+
:1 +++ ++ +
+ ++
2 I +o .
0 2 4 6 8 10 12 14 16 18 20
NOR2
Age-bias plot of Iceland (ICE) and Norway, reader 2 (NOR2), readings.
50

APPENDIX 4,
Raw data from the comparative age reading experiment by the three experienced readers from Iceland,Norway and Canada (St.John's).
TRMT No. Length NOR ICE NFL NOR-ICE NOR-NFL ICE·NFL
TLNT 38 16 1 1 1 0 0 0TLNT 17 20 2 2 2 0 0 0TLNT 44 22 2 2 2 0 0 0TLNT 2 24 2 3 2 -1 0 1TLNT 25 24 2 3 2 -1 0 1TLNT 5 26 2 4 2 -2 0 2TLNT 39 28 3 3 2 0 1 1TLNT 11 31 3 4 4 -1 -1 0TLNT 32 32 3 5 3 -2 0 2TLNT 14 34 4 4 3 0 1 1TLNT 20 35 5 6 4 -1 1 2TLNT 21 37 4 5 4 -1 0 1TLNT 4 38 5 6 5 -1 0 1TLNT 41 38 6 7 5 -1 1 2TLNT 46 39 5 6 5 -1 0 1TLNT 47 39 6 6 5 0 1 1TLNT 7 40 8 7 6 1 2 1TLNT 26 40 4 5 4 -1 0 1TLNT 30 42 8 7 6 1 2 1TLNT 37 43 6 6 5 0 1 1TLNT 48 43 6 6 6 0 0 0TLNT 15 44 8 7 7 1 1 0TLNT 16 45 5 6 5 -1 0 1TLNT 27 45 5 4 4 1 1 0TLNT 49 45 8 9 7 -1 1 2TLNT 29 46 7 7 5 0 2 2TLNT 28 47 6 6 5 0 1 1TLNT 34 48 6 6 6 0 0 0TLNT 36 50 7 7 6 0 1 1TLNT 31 51 9 7 7 2 2 0TLNT 12 52 8 8 6 0 2 2TLNT 18 54 8 7 5 1 3 2TLNT 40 55 9 8 6 1 3 2TLNT 6 56 10 12 10 -2 0 2TLNT 23 56 9 10 8 -1 1 2TLNT 22 57 10 10 7 0 3 3TLNT 1 58 10 7 8 3 2 -1TLNT 50 58 12 11 12 1 0 -1TLNT 33 59 11 9 6 2 5 3TLNT 13 60 9 8 10 1 -1 -2TLNT 35 60 12 10 9 2 3 1TLNT 45 61 8 8 7 0 1 1TLNT 24 62 11 13 9 -2 2 4TLNT 19 63 11 7 4TLNT 8 64 10 9 7 1 3 2TLNT 10 64 8 7 11 1 -3 -4TLNT 43 67 12 12 9 0 3 3TLNT 9 68 11 10 8 1 3 2TLNT 42 70 12 9 3TLNT 3 72 12 13 12 -1 0 1
E:IACFMlWKGHADIREPORT.DOC 07/02197 11 :30 51

TRMT No. Length NOR ICE NFL NOR·ICE NOR·NFL ICE·NFL
RLNT 1 16 2 1 1 1 1 0RLNT 2 20 2 3 2 -1 0 1RLNT 3 22 1 3 2 -2 -1 1RLNT 4 24 2 3 2 -1 0 1RLNT 5 24 2 6 2 -4 0 4RLNT 6 26 3 3 3 0 0 0RLNT 7 28 3 3 3 0 0 0RLNT 8 31 2 6 5 -4 -3 1RLNT 9 32 4 6 4 -2 0 2RLNT 10 34 4 5 4 -1 0 1RLNT 11 35 5 5 4 0 1 1RLNT 12 37 5 5 5 0 0 0RLNT 13 38 5 6 5 -1 0 1RLNT 14 38 7 8 5 -1 2 3RLNT 15 39 5 6 4 -1 1 2RLNT 16 39 6 6 6 0 0 0RLNT 17 40 8 11 6 -3 2 5RLNT 18 40 4 6 6 -2 -2 0RLNT 19 42 7 9 6 -2 1 3RLNT 20 43 7 8 7 -1 0 1RLNT 21 43 6 6 7 0 -1 -1RLNT 22 44 8 7 5 1 3 2RLNT 23 45 5 6 6 -1 -1 0RLNT 24 45 6 8 5 ·2 1 3RLNT 25 45 8 6 7 2 1 -1RLNT 26 46 8 8 6 0 2 2RLNT 27 47 7 10 7 -3 0 3RLNT 28 48 6 8 7 -2 -1 1RLNT 29 50 8 10 8 -2 0 2RLNT 30 51 9 9 7 0 2 2RLNT 31 52 7 9 6 -2 1 3RLNT 32 54 8 9 7 ·1 1 2RLNT 33 55 10 8 8 2 2 0RLNT 34 56 10 14 8 ·4 2 6RLNT 35 56 11 10 9 1 2 1RLNT 36 57 8 10 10 -2 -2 0RLNT 37 58 10 9 6 1 4 3RLNT 38 58 11 8 9 3 2 -1RLNT 39 59 11 10 8 1 3 2RLNT 40 60 10 11 -1RLNT 41 60 11 10 11 1 0 -1RLNT 42 61 9 9 9 0 0 0RLNT 43 62 10 11 -1RLNT 44 63 9 10 11 -1 -2 -1RLNT 45 64 12 13 8 -1 4 5RLNT 46 64 8 8 0RLNT 47 67 12 13 11 -1 1 2RLNT 48 68 6 17 10 -11 -4 7RLNT 49 70 12 13 -1RLNT 50 72 12 8 4
E:\ACFMlWKGHADIREPORT.DOC 07/02197 11:30 52

,
TRMT No. Length NOR ICE NFL NOR-ICE NOR·NFL ICE-NFL
RLBA 38 16 1 1 1 0 0 0RLBA 17 20 2 2 2 0 0 0RLBA 2 24 2 3 3 -1 -1 0RLBA 25 24 2 2 2 0 0 0RLBA 5 26 3 3 3 0 0 0RLBA 39 28 3 3 3 0 0 0RLBA 11 31 2 3 3 -1 -1 0RLBA 32 32 4 5 4 -1 0 1RLBA 14 34 4 6 3 -2 1 3RLBA 20 35 4 6 4 -2 0 2RLBA 21 37 5 5 4 0 1 1RLBA 4 38 5 5 5 0 0 0RLBA 41 38 5 5 4 0 1 1RLBA 46 39 6 6 5 0 1 1RLBA 47 39 6 6 7 0 -1 -1RLBA 7 40 8 9 7 -1 1 2RLBA 26 40 5 5 0RLBA 30 42 5 6 5 -1 0 1RLBA 37 43 8 8 5 0 3 3RLBA 48 43 7 6 7 1 0 -1RLBA 15 44 7 6 6 1 1 0RLBA 16 45 5 6 5 -1 0 1RLBA 27 45 4 5 4 -1 0 1RLBA 49 45 8 8 8 0 0 0RLBA 29 46 8 7 6 1 2 1RLBA 28 47 6 6 7 0 -1 -1RLBA 34 48 8 7 6 1 2 1RLBA 36 50 7 9 7 -2 0 2RLBA 31 51 11 9 9 2 2 0RLBA 12 52 8 9 7 -1 1 2RLBA 18 54 7 7 7 0 0 0RLBA 40 55 7 7 7 0 0 0RLBA 6 56 11 12 8 -1 3 4RLBA 23 56 9 10 11 -1 -2 -1RLBA 22 57 12 10 11 2 1 -1RLBA 1 58 10 10 8 0 2 2RLBA 50 58 12 11 11 1 1 0RLBA 33 59 7 9 8 -2 -1 1RLBA 13 60 8 10 9 -2 -1 1RLBA 35 60RLBA 45 61 8 9 7 -1 1 2RLBA 24 62 11 12 13 -1 -2 -1RLBA 19 63 9 11 -2RLBA 8 64 12 11 9 1 3 2RLBA 10 64 8 9 9 -1 -1 0RLBA 43 67 12 12 11 0 1 1RLBA 9 68 7 11 10 -4 -3 1RLBA 42 70 9 10 10 -1 -1 0RLBA 3 72 12 13 11 -1 1 2RLBA ? 10 12 9 -2 1 3
E:IACFM\WKGHADIREPORT.DOC 07102197 11:30 53