reporting of derivatives transactions in europe
TRANSCRIPT

IFC workshop on “Combining micro and macro statistical data for financial stability analysis. Experiences, opportunities and challenges”
Warsaw, Poland, 14-15 December 2015
Reporting of derivatives transactions in Europe – Exploring the potential of EMIR micro data against the
challenges of aggregation across six trade repositories1
Malgorzata Osiewicz, Linda Fache-Rousova and Kirsi-Maria Kulmala, European Central Bank
1 This paper was prepared for the meeting. The views expressed are those of the authors and do not necessarily reflect the views of the BIS or the central banks and other institutions represented at the meeting.
Reporting of derivatives transactions in Europe 1
Reporting of derivatives transactions in Europe Exploring the potential of EMIR micro data against the challenges of aggregation across six trade repositories1
Linda Fache Rousová, [email protected]
Kirsi-Maria Kulmala, Kirsi-Maria.Kulmala@ ecb.europa.eu
Małgorzata Osiewicz, [email protected]
European Central Bank, Frankfurt, Germany2
Abstract
Since February 2014, the European Market Infrastructure Regulation (EMIR) requires all counterparties in the European Union (EU) entering into a derivative contract to report its details to one of the six authorised trade repositories (TRs). Over the first year of reporting, the six TRs have received more than 10 billion of data records and thus represent a very rich source of information for regulators in Europe. However, the decentralized and heterogeneous landscape for this reporting obligation poses significant challenges for data analysis and aggregation. This paper elaborates on these challenges, putting particular emphasis on the lack of common standards, the monitoring of data quality and the need to reconcile the data from the different trade repositories. Furthermore, it also compares aggregates derived from EMIR data with those available from other sources such as the semi-annual OTC derivatives survey run by Bank of International Settlements (BIS).
Keywords: derivatives; European Market Infrastructure Regulation (EMIR); trade repositories; harmonisation.
JEL classification:
1 The authors thank to Julius Cerniauskas and Valeria Uliano for the statistical support and comments
in preparation of this paper but the authors remain solely responsible for any remaining errors or omissions.
2 The views expressed in this paper are solely those of the authors and do not necessarily reflect the opinion of the European Central Bank.

2 Reporting of derivatives transactions in Europe
Contents
1. Introduction .......................................................................................................................................... 3
2. Overview of EMIR data .................................................................................................................... 3
3. Challenge of data scattered across six different TRs ............................................................ 5
4. Data quality caveats .......................................................................................................................... 8
5. Comparison of EMIR OTC credit data with BIS CDS survey data on OTC derivatives ........................................................................................................................................ 10
6. Conclusions and way forward ...................................................................................................... 11
References ................................................................................................................................................ 12

Reporting of derivatives transactions in Europe 3
1. Introduction
According to European Market Infrastructure Regulation (EMIR), since 12th February 2014 all counterparties located in the European Union (EU)3 that enter into a derivative contract have to report the details of the contract to one of six trade repositories (TR) authorised under EMIR. These are (i) CME Trade Repository Ltd. (CME), (ii) DTCC Derivatives Repository Ltd. (DDRL), (iii) ICE Trade Vault Europe Ltd. (ICE), (iv) Krajowy Depozyt Papierów Wartościowych S.A. (KDPW), (v) Regis-TR S.A. (Regis-TR), and (vi) UnaVista Limited (UnaVista). As a result, the data are currently scattered among the six TRs, which embraced different technical solutions for storing, providing and representing the data. Moreover, the data are not standardised and suffer from serious drawbacks in terms of quality.
This decentralized and heterogeneous landscape poses significant challenges to more than 50 regulators in Europe accessing, managing and analysing the EMIR data from the six TRs. Moreover, high data confidentiality causes additional difficulty, restricting the exchange of knowledge gained by individual regulators in handling the dataset.
In this paper, we first describe the main features of the EMIR data (Section 2). Drawing on the experience gathered in the Directorate General Statistics of the European Central Bank (ECB), we elaborate on the challenges in handling these data, putting particular emphasis on the lack of common standards and difficulties in the reconciliation of trades reported to the different TRs – a necessity stemming from the double-reporting obligation under EMIR (Section 3). Furthermore, Section 4 focusses on the monitoring of EMIR data quality from the micro data perspective, while Section 5 takes the macro data view and presents the comparison of the aggregated EMIR over-the-counter (OTC) credit derivatives data with similar data collected through the semi-annual surveys conducted by the Bank of International Settlement (BIS). Finally, Section 6 concludes.
2. Overview of EMIR data
EMIR is a far-reaching reform of the derivatives market in Europe and introduces, inter-alia, a reporting obligation to all counterparties located in EU, which trade a derivative contract. The reporting obligation applies to all types of derivatives contracts – both OTC and exchange-traded derivatives (ETD) on all main five derivatives classes (credit, commodity, equity, interest rates and foreign exchange). Trades cleared via Central Clearing Counterparties (CCPs) are also included.
Around 85 data fields are to be reported for each transaction and they are divided into two groups. The first group contains information on the counterparties involved, which usually remain static over life cycle of a transaction. The second group provides details on the characteristics of the contract (e.g. type of derivative,
3 This paper focusses on the implementation of EMIR in the EU. EMIR is however an EU legal act
marked as European Economic Area (EEA) relevant and currently under consideration for incorporation into the EEA Agreement by Iceland, Liechtenstein and Norway.

4 Reporting of derivatives transactions in Europe
underlying, prices, amount outstanding), how/on which venue the contract was executed and/or cleared, valuation and collateral, and life-cycle events (e.g. new contract, modification, termination).
The high granularity in principle allows for the derivation of positions and aggregate data. This process is facilitated by some TRs, which compile and provide regulators with reports that contain all outstanding trades at the end of the day (so called “trade state report”). However, as this report is not mandatorily required from TRs, not all of them provide such report. In such a case, TRs only provide reports with transactions carried out (or modified) on a given day (so called “trade activity reports”). This in turn means that outstanding positions can only be derived by accumulating information on all past trades (and their modifications) from the individual trade activity reports generated since the reporting start.
Such a wide-scaled and detailed reporting implies huge data volumes. Over the first year of reporting, almost 10 billion of records were received and processed by the six TRs in Europe according to European Securities and Markets Authority (ESMA), the supervisor of the TRs (ESMA, 2015a). In addition, Figure 1 shows the number of outstanding (open) trades and notional values as obtained from the aggregated EMIR data published on a weekly basis by the six TRs on their websites.
Focussing on the OTC market segment, the number of open trades reaches over 50 million outstanding trades at the end of October 2015. The figures are relatively consistent over time (except for one outlier in OTC commodities in week 33 of 2015). However, this is not the case for notional values, which tend to be very volatile and thus do not seem reliable. They show over EUR 4,000 trillion outstanding in the OTC European market at the end of August 2015, whereas only around EUR 500 trillion are reported in BIS OTC derivatives survey for the global OTC market. The error seems coming from data on FX derivatives in one TR (UnaVista). After removing the transactions from this TR, the total EU OTC market amounts to over EUR 300 trillion, where interest rates derivatives with around 70% represent by far the most important derivative class, followed by FX and equity derivatives (10% each). However, interest rates derivatives tend to be associated with relatively large notional values. Therefore, the distribution among the different asset classes is much more balanced, when considering the number of open trades.
Regarding the ETD market, the time-series constructed from the EMIR public data show a couple of structural breaks and potential outliers. As this impedes for now to draw any conclusions about this market segment, we leave such analysis for further investigations.

Reporting of derivatives transactions in Europe 5
Figure 1: Derivatives market in Europe – public aggregates from EMIR data
Number of open trades (million), week 14 to 44 of 2015 OTC
ETD
OTC market, notional outstanding (EUR trillion), week 18 to 43 of 2015 Before corrections
After corrections (UnaVista removed)
Note: To avoid double-counting, the figures are calculated as sum of 100% of dual sided and 50% of single-sided trades in each TR (see also Section 5). Notional outstanding before corrections are presented from week 18 to 43 of 2015, given that earlier and later periods contain improbable outliers (sextillion). Source: Public EMIR data from TRs’ websites.
3. Challenge of data scattered across six different TRs
The EMIR legislation and TR supervision do not currently provide a sufficiently detailed and coherent framework to provide regulatory authorities in the EU with standardised high quality data about the derivatives market. Although data quality has been gradually improving, mainly owing to recent steps by ESMA (see Section 4), the heterogeneous landscape in TR data provision and non-standardised data
0
10
20
30
40
50
60
70
2015
w14
2015
w17
2015
w20
2015
w23
2015
w26
2015
w29
2015
w32
2015
w35
2015
w38
2015
w42
mill
ions
IRS Equity FXCDS Other Commodity
0
10
20
30
40
50
60
70
2015
w14
2015
w17
2015
w20
2015
w23
2015
w26
2015
w29
2015
w32
2015
w35
2015
w38
2015
w42
mill
ions
0
1,000
2,000
3,000
4,000
5,000
6,000
2015
w18
2015
w20
2015
w22
2015
w24
2015
w26
2015
w28
2015
w30
2015
w32
2015
w34
2015
w36
2015
w38
2015
w40
2015
w42
Trill
ions
0
50
100
150
200
250
300
350
2015
w14
2015
w17
2015
w20
2015
w23
2015
w26
2015
w29
2015
w32
2015
w35
2015
w38
2015
w41

6 Reporting of derivatives transactions in Europe
collection pose significant challenges for regulators accessing and analysing the data.
First and foremost, since the EMIR secondary legislation leaves significant room for interpretation of the reported fields, the data are not standardised at the input point, when entered into TRs by reporting agents. In particular, the EMIR reporting relies on concepts such as the Unique Trade Identifier (UTI) and Unique Product Identifier (UPI), which are not yet developed, several reported fields are not accompanied by code-lists (lists of allowed values) and the interpretation of their content raises questions (see ESMA, 2015c). Second, the EMIR framework does not provide any detailed guidance on how the six TRs shall treat, structure and present the collected data. For instance, even the variable names, the number and structure of the data files provided to regulators vary from TR to TR. Moreover, the “trade state report” is not mandatorily required from TRs, though it is a key report for many uses including financial stability. Another level of complexity in EMIR is added by the differences in certain aspects of reporting across EU member states with the remarkable example of the definition of a derivative contract, and consequently what type of transactions should be reported (see e.g. Maxwell, 2014).
A peculiar point in EMIR reporting is the so called ‘double reporting obligation’, i.e. both counterparties to a derivative transaction have the reporting obligation, if they are located in the EU (while in other jurisdictions one counterparty is usually obliged to report on behalf of both sides to the trade). As a result, trades are frequently reported twice under EMIR (i.e. always when the two counterparts are EU resident), possibly to two different TRs. Hence, any meaningful data aggregation requires the reconciliation of the information between the duplicated trades, which shall in principle rely on the use of a Unique Trade Identifier (UTI), but its definition on a global level is still under development4. In the meantime, ESMA put forward temporary guidelines how an interim UTI should be generated (see ESMA, 2015b).
Our results show that the pairing rate is particularly low in case of trades reported to different TRs. Moreover, even if the two legs are paired using an interim UTI, information in the other data fields submitted by the two counterparties very often do not match, which raises the question which of the two to keep in the final database with de-duplicated trades. Even for trades reported to the same TR, there can be significant discrepancies for variables such as execution timestamp, price per contract or notional value.
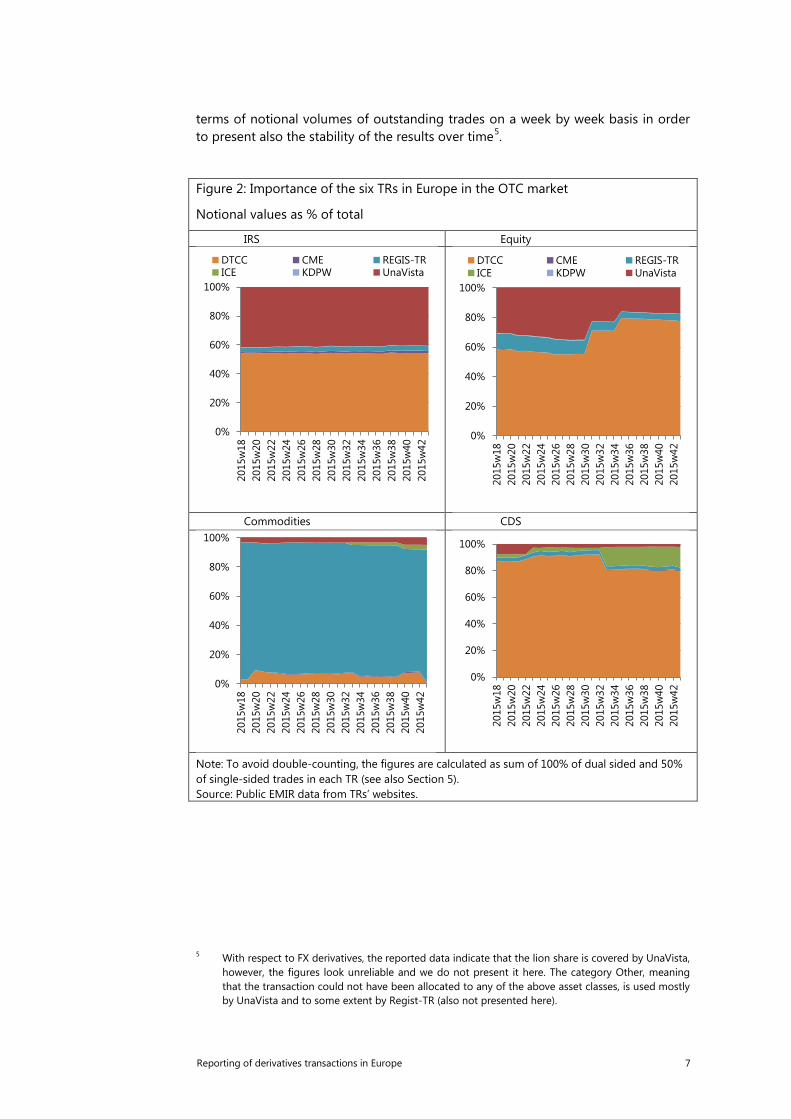
Reconciling and aggregating data across the different TRs may be easier in certain market segments, especially when reporting of a particular asset class is concentrated in one TR. This is the case for OTC credit and equity derivatives, which are reported currently in around 80% (in terms of notional values) to DDRL. Interest rates derivatives are split between DDRL and UnaVista, while commodities are reported mostly to Regis-TR. See Figure 2, which shows the shares of each TR in
4 The Financial Stability Board (FSB) has asked the Committee on Payments and Market
Infrastructures (CPMI) and the International Organization of Securities Commissions (IOSCO) to develop global guidance on harmonisation of data elements that are reported to trade repositories, in particular the UTI and the UPI. It is envisaged that the sub-structure created for this purpose, the CPMI-IOSCO Harmonisation Group, will publish final guidelines on the UTI at the beginning of 2016 (see CPMI-IOSCO 2015a and CPMI-IOSCO 2015b).
Reporting of derivatives transactions in Europe 7
terms of notional volumes of outstanding trades on a week by week basis in order to present also the stability of the results over time5.
Figure 2: Importance of the six TRs in Europe in the OTC market
Notional values as % of total
IRS Equity
Commodities CDS
Note: To avoid double-counting, the figures are calculated as sum of 100% of dual sided and 50% of single-sided trades in each TR (see also Section 5). Source: Public EMIR data from TRs’ websites.
5 With respect to FX derivatives, the reported data indicate that the lion share is covered by UnaVista,
however, the figures look unreliable and we do not present it here. The category Other, meaning that the transaction could not have been allocated to any of the above asset classes, is used mostly by UnaVista and to some extent by Regist-TR (also not presented here).
0%
20%
40%
60%
80%
100%
2015
w18
2015
w20
2015
w22
2015
w24
2015
w26
2015
w28
2015
w30
2015
w32
2015
w34
2015
w36
2015
w38
2015
w40
2015
w42
DTCC CME REGIS-TRICE KDPW UnaVista
0%
20%
40%
60%
80%
100%
2015
w18
2015
w20
2015
w22
2015
w24
2015
w26
2015
w28
2015
w30
2015
w32
2015
w34
2015
w36
2015
w38
2015
w40
2015
w42
DTCC CME REGIS-TRICE KDPW UnaVista
0%
20%
40%
60%
80%
100%
2015
w18
2015
w20
2015
w22
2015
w24
2015
w26
2015
w28
2015
w30
2015
w32
2015
w34
2015
w36
2015
w38
2015
w40
2015
w42
0%
20%
40%
60%
80%
100%
2015
w18
2015
w20
2015
w22
2015
w24
2015
w26
2015
w28
2015
w30
2015
w32
2015
w34
2015
w36
2015
w38
2015
w40
2015
w42

8 Reporting of derivatives transactions in Europe
4. Data quality caveats
To monitor the quality of EMIR data, we have developed several checks on the micro-data accessible to the ECB. In particular, we regularly check the number of missing values and the use of the key identifiers such as Legal Entity Identifiers (LEI), interim UTI and International Securities Identification Numbers (ISINs).
The results suggest that the quality of EMIR data was relatively low in the first reporting months, but that the situation has been gradually improving, owing to large extent to ESMA’s on-going efforts to improve EMIR data quality. Figure 3 illustrates the significant improvement in the completeness of reported fields in December 2014, after the introduction of ESMA Level 1 validation rules6. The number of missing values dropped virtually to zero for the trade activity reports, i.e. reports which contain the current transactions. In the trade state report, which comprises all outstanding trades, part of the dataset remains still with missing values given that the older trades, before the introduction of the validation rules, are not updated.
Figure 3: Data quality checks – percentage of missing values per month
Based on data from four TRs DDRL – field: Beneficiary ID
Source: EMIR data from four trade repositories available to the ECB.
Similarly, as the same UTI is expected to appear only once or twice in the data on outstanding trades on a given date, we monitor the cases of triplicated or more often repeated UTIs and found out that those cases dropped from more than 30,000 in the initial reporting stage to about 1,000 in 2015 (based on data available to the ECB).
6 ESMA, the supervisor of TRs, aims at improving EMIR data quality through a data quality action
plan, which foresees that TR run consistent data validations at the data submitted by reporting agents. The Level 1 validations were put in place in December 2014, while Level 2 validations In November 2015 (see ESMA, 2015a for more details).
0%
20%
40%
60%
80%
14_0
4
14_0
6
14_0
8
14_1
0
14_1
2
15_0
2
15_0
4
Beneficiary IDDelivery typeEffective datePrice multiplierConfirmation meansAction Type
0%
20%
40%
14_0
4
14_0
6
14_0
8
14_1
0
14_1
2
15_0
2
15_0
4
DDRL Trade Activity
DDRL Trade State

Reporting of derivatives transactions in Europe 9
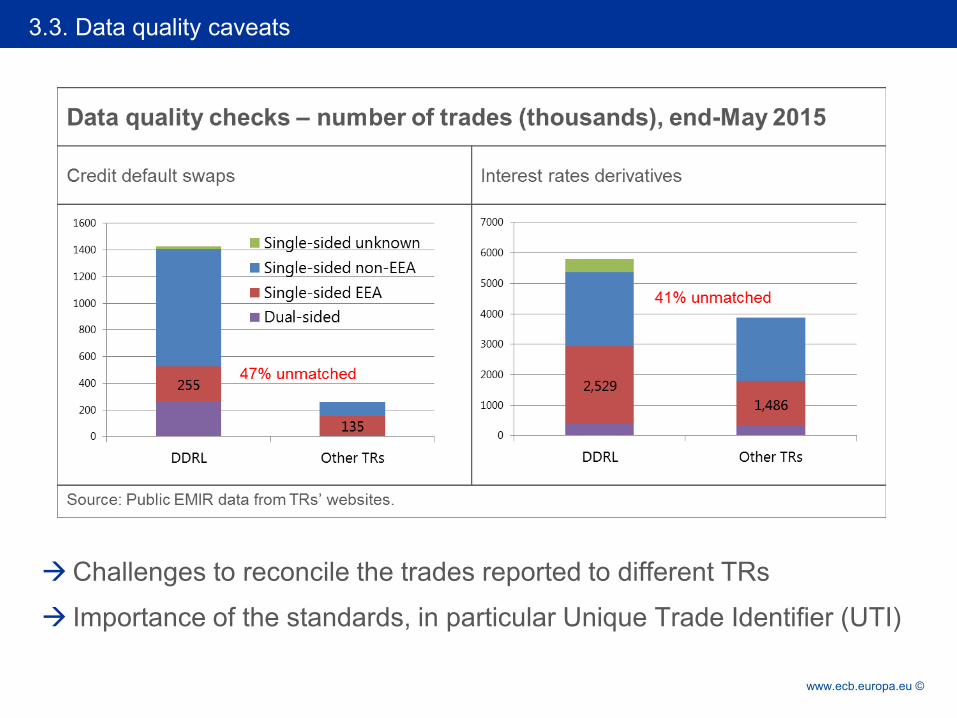
However, the reconciliation of the trades reported to different TRs is still one of the most challenging issues. In the EMIR public data, the transactions are divided into the categories of dual-sided and single-sided trades, while the latter is further split into: (i) single-sided non-EEA, (ii) single-sided EEA counterparties and (iii) single-sided unknown (see Table 1). The category “single-sided EEA” contains the trades, where both counterparties are located in EEA and thus shall report the trade, but the transaction cannot be reconciled with any other transaction in the same TR. Assuming correct reporting, the other leg of the trades should be submitted to another TRs under the same category. However, looking at the DDRL example for credit and interest rates derivatives, the combined number of trades in all other TRs is smaller than the single-sided EEA trades in DDRL (see Figure 4). Even if all trades from other trades repositories could be reconciled with the DDRL, still around 47% of trades for credit derivatives in the category “single-sided EEA” and 41% for interest rates would be left unmatched.
Figure 4: Data quality checks – number of trades (thousands), 2015 week 22
CDS: DDRL and other TRs IRS: DDRL and other TRs
Source: Public EMIR data from TRs’ websites.
We also match the reported counterparty identifiers with those in the official LEI database as published by Global LEI Foundation7 to examine to what extent LEI codes are used in reporting. The match is quite successful for the field of the reporting counterparty (in 97% of trades) but remains significantly lower for the field of the other counterparty (around 75%) as the reporting counterparty may not know the LEI of the other entity. The number of distinct LEIs in the data has been significantly increasing since the reporting start (e.g. doubled for the reporting counterparty within one year from May 2014 to May 2015), as more entities apply for LEI and join the reporting.
7 This list of valid LEIs can be downloaded from the website of the Global LEI Foundation:
https://www.gleif.org/en
255
135 0
200
400
600
800
1000
1200
1400
1600
DDRL Other TRs
Single-sided unknown
Single-sided non-EEA
Single-sided EEA
Dual-sided
2,529
1,486
0
1000
2000
3000
4000
5000
6000
7000
DDRL Other TRs
10 Reporting of derivatives transactions in Europe
5. Comparison of EMIR OTC credit data with BIS CDS survey data on OTC derivatives
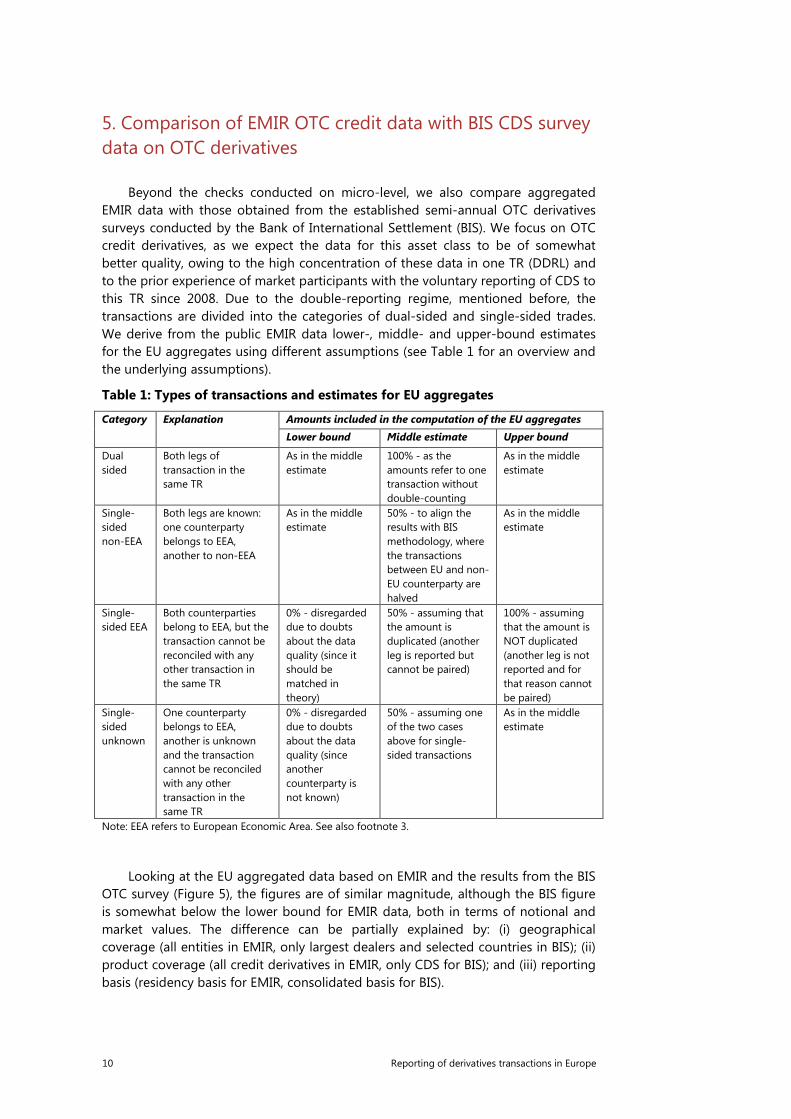
Beyond the checks conducted on micro-level, we also compare aggregated EMIR data with those obtained from the established semi-annual OTC derivatives surveys conducted by the Bank of International Settlement (BIS). We focus on OTC credit derivatives, as we expect the data for this asset class to be of somewhat better quality, owing to the high concentration of these data in one TR (DDRL) and to the prior experience of market participants with the voluntary reporting of CDS to this TR since 2008. Due to the double-reporting regime, mentioned before, the transactions are divided into the categories of dual-sided and single-sided trades. We derive from the public EMIR data lower-, middle- and upper-bound estimates for the EU aggregates using different assumptions (see Table 1 for an overview and the underlying assumptions).
Table 1: Types of transactions and estimates for EU aggregates
Category Explanation Amounts included in the computation of the EU aggregates
Lower bound Middle estimate Upper bound
Dual sided
Both legs of transaction in the same TR
As in the middle estimate
100% - as the amounts refer to one transaction without double-counting
As in the middle estimate
Single-sided non-EEA
Both legs are known: one counterparty belongs to EEA, another to non-EEA
As in the middle estimate
50% - to align the results with BIS methodology, where the transactions between EU and non-EU counterparty are halved
As in the middle estimate
Single-sided EEA
Both counterparties belong to EEA, but the transaction cannot be reconciled with any other transaction in the same TR
0% - disregarded due to doubts about the data quality (since it should be matched in theory)
50% - assuming that the amount is duplicated (another leg is reported but cannot be paired)
100% - assuming that the amount is NOT duplicated (another leg is not reported and for that reason cannot be paired)
Single-sided unknown
One counterparty belongs to EEA, another is unknown and the transaction cannot be reconciled with any other transaction in the same TR
0% - disregarded due to doubts about the data quality (since another counterparty is not known)
50% - assuming one of the two cases above for single-sided transactions
As in the middle estimate
Note: EEA refers to European Economic Area. See also footnote 3.
Looking at the EU aggregated data based on EMIR and the results from the BIS OTC survey (Figure 5), the figures are of similar magnitude, although the BIS figure is somewhat below the lower bound for EMIR data, both in terms of notional and market values. The difference can be partially explained by: (i) geographical coverage (all entities in EMIR, only largest dealers and selected countries in BIS); (ii) product coverage (all credit derivatives in EMIR, only CDS for BIS); and (iii) reporting basis (residency basis for EMIR, consolidated basis for BIS).

Reporting of derivatives transactions in Europe 11
Figure 5: Comparison of EMIR OTC credit derivatives data with BIS OTC survey
EUR billion, end-June 2015
A. Notional value B. Market value
Note: EMIR data refer to all OTC credit derivatives, while BIS data to credit-default-swaps (CDS) data only.. Source: Semi-annual BIS OTC derivatives survey and public EMIR data from TRs’ websites.
While the higher EMIR coverage with respect to geographical and product coverage (points i and ii) are consistent with the results, these conceptual differences should not have a significant impact on the comparability of the two statistics given the high concentration in the CDS market (i.e. the largest dealers cover most of the CDS trades) and the fact that CDS products constitute the lion share in the credit derivatives asset class. On the other hand, the effect of differences in the reporting basis (point iii) – consolidated reporting for the banking groups in BIS versus inclusion of only EU resident entities under EMIR – is more difficult to quantify without access to the data reported by the overseas subsidiaries of the EU entities.
We perform the exercise of comparison of EMIR data and BIS statistics on a regular basis and results from previous periods are similar to those presented above. It should be mentioned that the long time lag of the BIS publication illustrates the superiority of the EMIR data with respect to the timeliness.
6. Conclusions and way forward
The introduction of the daily reporting obligation for the derivatives market on the transaction-by-transaction basis is a challenging undertaking by the global authorities, due to its enormous scale and complexity of the financial products. We have described some of the biggest challenges faced in Europe in the first stage of the data reporting. In particular, the experience shows that clear and detailed guidance on the fields to be reported to the TRs (e.g. code-lists, formats) and the validation checks run by TRs at the input point can enormously improve the consistency and quality of the collected data. This is the case in Europe, when the continuous clarifications via ESMA’s Questions and Answers document (ESMA,
-
2,000
4,000
6,000
8,000
10,000
12,000
14,000
EMIR lowerbound
EMIR middleestimate
EMIR upperbound
Single-sided unknownSingle-sided EEASingle-sided non-EEADual sidedBIS EU aggregate
-
50
100
150
200
250
300
350
EMIR lowerbound
EMIR middleestimate
EMIR upperbound

12 Reporting of derivatives transactions in Europe
2015b), and in particular the introduction and the enforcement of the validation rules on each reported transaction, help gradually improve the quality.
However, in order to make the dataset suitable for a wide range of analytical studies, further harmonisation of reporting is needed. There are currently two work streams which should greatly contribute to further improvements: i) ESMA’s recently updated reporting standards (see ESMA, 2015c) and ii) the CPMI-IOSCO work on the global guidelines on the harmonisation of the derivatives reporting, including the global identifiers such as UTI and UPI (see CPMI-IOSCO 2015a and CPMI-IOSCO 2015b). Moreover, detailed guidance to TRs on the final data provided to authorities is another key step to enable authorities to aggregate and analyse the data across TRs.
Drawing from the European experience will be useful during the process of the global data aggregation, given that the double-reporting obligation resembles the situation at the time of trying to match cross-border trades, where the two counterparties report the transaction to two different TRs. The challenge of the reconciliation of two sides of the trade highlights the importance of fully standardised rules, not only within jurisdictions, but also globally. In this respect one of the most crucial elements is the globally applicable and unique UTI as well as clear rules about its generation. The development of the UPI and harmonization of other data elements are further key steps to obtain data of high quality.
References
CPMI-IOSCO (2015a). Harmonisation of the Unique Transaction Identifier - consultative report, 19 August 2015 (available here).
CPMI-IOSCO (2015b). Harmonisation of key OTC derivatives data elements (other than UTI and UPI) - first batch, consultative report issued by CPMI-IOSCO, 2 September 2015 (available here).
European Parliament and Council (2012). Regulation (EU) No 648/2012 of the European Parliament and of the Council of 4 July 2012 on OTC derivatives, central counterparties and trade repositories, Official Journal of the European Union (available here).
European Securities and Markets Authority (2015a). ESMA supervision of Credit Rating Agencies and Trade Repositories, Annual report 2014 and work plan, 16 February 2015 (available here).
European Securities and Markets Authority (2015b). Questions and Answers, Implementation of the Regulation (EU) No 648/2012 on OTC derivatives, central counterparties and trade repositories (EMIR), 1 October 2015 (available here).
European Securities and Markets Authority (2015c). Review of the Regulatory and Implementing Technical Standards on reporting under Article 9 of EMIR, 13 November 2015 (available here)
F. Maxwell (2014). Esma trying to avoid commodities rerun of forex spat. Risk magazine, 30 Sep 2014 (available here).

IFC workshop on “Combining micro and macro statistical data for financial stability analysis. Experiences, opportunities and challenges”
Warsaw, Poland, 14-15 December 2015
Reporting of derivatives transactions in Europe – Exploring the potential of EMIR micro data against the challenges of aggregation across six trade repositories1
Malgorzata Osiewicz, Linda Fache-Rousova and Kirsi-Maria Kulmala, European Central Bank
1 This presentation was prepared for the meeting. The views expressed are those of the authors and do not necessarily reflect the views of the BIS or the central banks and other institutions represented at the meeting.
Reporting of derivatives transactions in Europe: Exploring the potential of EMIR micro data against the challenges of aggregation across six trade repositories
Irving Fisher Committee Workshop 2015 15 December 2015, Warszawa
Małgorzata Osiewicz Linda Fache Rousová Kirsi-Maria Kulmala European Central Bank*
*The views expressed in this presentation and the underlying paper are solely those of the authors and do not necessarily reflect the opinion of the European Central Bank.

Rubric
www.ecb.europa.eu ©
Overview
EMIR derivatives data in Europe 2
1
2
3
Six trade repositories in Europe
Data quality caveats
Introduction
4 Comparison of EMIR data with BIS OTC derivatives survey
Conclusions and way forward 5
Rubric
www.ecb.europa.eu ©
EMIR - European Market Infrastructure Regulation
EMIR derivatives data in Europe 3
1.1 Introduction
• Far-reaching reform – introduction of clearing and reporting obligations
• Since February 2014, all counterparties in the EU have to report the details of any derivative contract:
– both over-the-counter (OTC) and exchange-traded derivatives (ETD)
– all asset classes: interest rates, equity, credit, FX and commodities derivatives
– collateral valuation and transaction valuation (since August 2014)
• Data reported to one of the 6 authorised trade repositories (TRs), which:
– provide the confidential data to different authorities (incl. ECB)
– publish aggregated data
• Important role of European Securities and Markets Authority (ESMA)
– drafts regulatory standards and supervises TRs

Rubric
www.ecb.europa.eu © EMIR derivatives data in Europe 4
1.2 Introduction – public data
Category Explanation Amounts included in the computation
of the EU aggregates
Lower
bound
Middle
estimate
Upper
bound
Dual sided Both legs of transaction in the same TR 100%
Single-sided
non-EEA
Both legs are known: one counterparty belongs
to EEA, another to non-EEA
50%
Single-sided
EEA
Both counterparties belong to EEA, but the
transaction cannot be reconciled with any other
transaction in the same TR
0% 50% 100%
Single-sided
unknown
One counterparty belongs to EEA, another is
unknown and the transaction cannot be
reconciled with any other transaction in the
same TR
0% 50%

Rubric
www.ecb.europa.eu © EMIR derivatives data in Europe 5
1.3 Introduction – EMIR data volumes (public data)
Huge data volumes, e.g. more than 10 billion of records received by TRs over the first year. Over 90 million outstanding trades on a given day.
Similar volumes for OTC and ETD market

Rubric
www.ecb.europa.eu © EMIR derivatives data in Europe 6
1.4 Introduction – EMIR data volumes (public data)
Significant market size (notional value of over EUR 300 trillion)
Interest rates are the most important class (in terms on notional value)
ETD public data not reliable
Rubric
www.ecb.europa.eu ©
Overview
EMIR derivatives data in Europe 7
1
2
3
Six trade repositories in Europe
Data quality caveats
Introduction
4 Comparison of EMIR data with BIS OTC derivatives survey
Conclusions and way forward 5

Rubric
www.ecb.europa.eu ©
2. Six trade repositories in Europe – some more important than others
OTC trades are largely captured in DTCC/DDRL with the exception of commodity derivatives
Concentration in reporting may help trade reconciliation and aggregation

Rubric
www.ecb.europa.eu ©
Overview
EMIR derivatives data in Europe 9
1
2
3
Six trade repositories in Europe
Data quality caveats
Introduction
4 Comparison of EMIR data with BIS OTC derivatives survey
Conclusions and way forward 5

Rubric
www.ecb.europa.eu ©
The six TRs are different and provide different data
• More detailed guidance needed on how TR should structure, treat and present the collected data – application (legal) procedures and technical connections differ – regularity and time-window of data provision – number, structure, types and content of data files differ
• One trade can be reported to two different TRs due to double-reporting obligation – need to reconcile trades to aggregate the data – even if two legs are paired, information in other fields very often do
not match
Around 50-60 regulators in Europe accessing the data have to overcome these difficulties
EMIR derivatives data in Europe 10
3.1 Data quality caveats

Rubric
www.ecb.europa.eu © EMIR derivatives data in Europe 11
3.2. Data quality caveats
Situation is improving
ESMA’s on-going efforts to improve data quality: − level 1 and level 2 validation rules (Dec 2014 and Nov 2015 respectively) − Q&As and revision of RTS and ITS
Rubric
www.ecb.europa.eu ©
3.3. Data quality caveats
Challenges to reconcile the trades reported to different TRs
Importance of the standards, in particular Unique Trade Identifier (UTI)

Rubric
www.ecb.europa.eu ©
Overview
EMIR derivatives data in Europe 13
1
2
3
Six trade repositories in Europe
Data quality caveats
Introduction
4 Comparison of EMIR data with BIS OTC derivatives survey
Conclusions and way forward 5

Rubric
www.ecb.europa.eu ©
4. Comparison of EMIR OTC data with data from BIS OTC survey
Reasonable match despite various differences – collection mode, coverage, group reporting
Data quality seems to vary across asset classes - credit data of higher quality than other EMIR data

Rubric
www.ecb.europa.eu ©
Overview
EMIR derivatives data in Europe 15
1
2
3
Six trade repositories in Europe
Data quality caveats
Introduction
4 Comparison of EMIR data with BIS OTC derivatives survey
Conclusions and way forward 5

Rubric
www.ecb.europa.eu ©
Clear reporting rules and standardised data validations at input point (TRs) can enormously improve consistency and quality.
In Europe, ESMA’s on-going efforts contribute to improved reporting but more is needed such as detailed guidance regarding TR’s output.
European experience with double-reporting obligation highlights the crucial importance of a globally applicable UTI and clear rules for its generation.
Similar challenges with derivatives reporting to TRs are experienced across the globe. To aggregate the data globally, derivatives data have to be standardised and/or harmonized across jurisdictions.
CPMI-IOSCO* data harmonization group to develop global guidance is a step in the right direction (UTI, UPI and other data elements).
EMIR derivatives data in Europe 16
6. Conclusions and way forward
* CPMI - The Committee on Payments and Market Infrastructures IOSCO - The International Organization of Securities Commissions