reporting and interpreting quality of life data - eadph · reporting and interpreting quality of...
TRANSCRIPT
Reporting and Interpreting quality of life data
Georgios Tsakos Dept. of Epidemiology and Public Health, UCL
EADPH 16th Annual Meeting 20th – 22nd September 2011
Rome
Presentation Outline
“Oral Health-Related Quality of Life” (“OHRQoL”) Definition / concepts
State of play: measures
Challenges in measurement – problems in interpretation: aggregate scores
Interpretability Different approaches
Minimally Important Difference (MID)
Reporting and interpretation guide
Subjective measures of oral health 1.Single standing questions.
Self-Rated Oral Health Perceived Dental Treatment Needs
2.Battery of questions Pain and its effects daily life (even for young children) Dental Discomfort Questionnaire Chewing Ability (usually for older adults)
3.Oral Health-Related Quality of Life (OHRQoL) indicators Composite measures – different domains / age groups
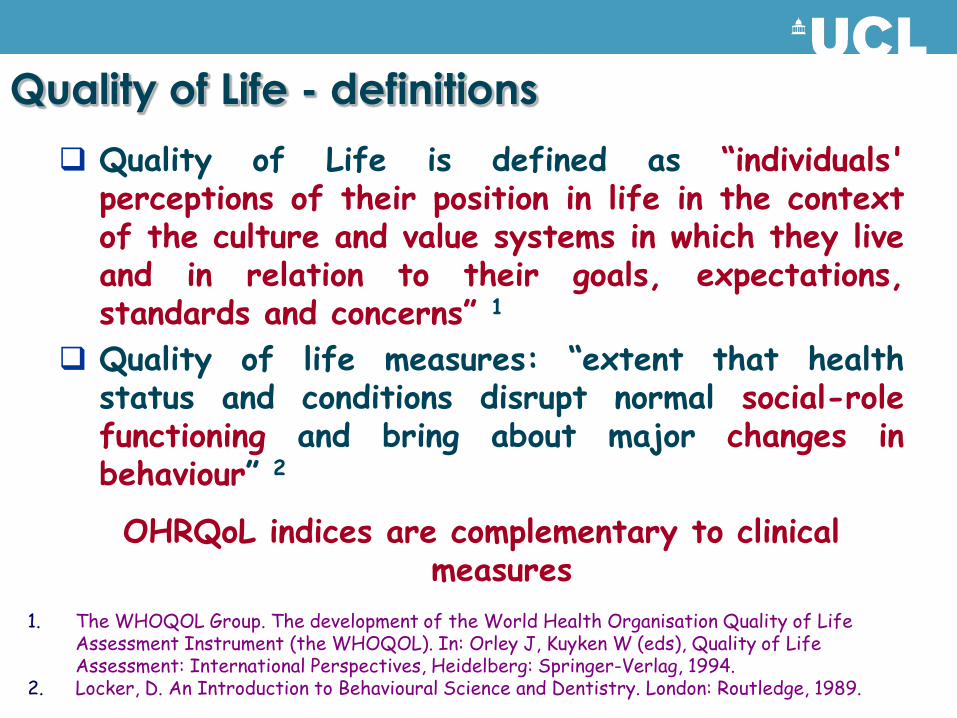
Quality of Life - definitions Quality of Life is defined as “individuals'
perceptions of their position in life in the context of the culture and value systems in which they live and in relation to their goals, expectations, standards and concerns” 1
Quality of life measures: “extent that health status and conditions disrupt normal social-role functioning and bring about major changes in behaviour” 2
OHRQoL indices are complementary to clinical measures
1. The WHOQOL Group. The development of the World Health Organisation Quality of Life Assessment Instrument (the WHOQOL). In: Orley J, Kuyken W (eds), Quality of Life Assessment: International Perspectives, Heidelberg: Springer-Verlag, 1994.
2. Locker, D. An Introduction to Behavioural Science and Dentistry. London: Routledge, 1989.
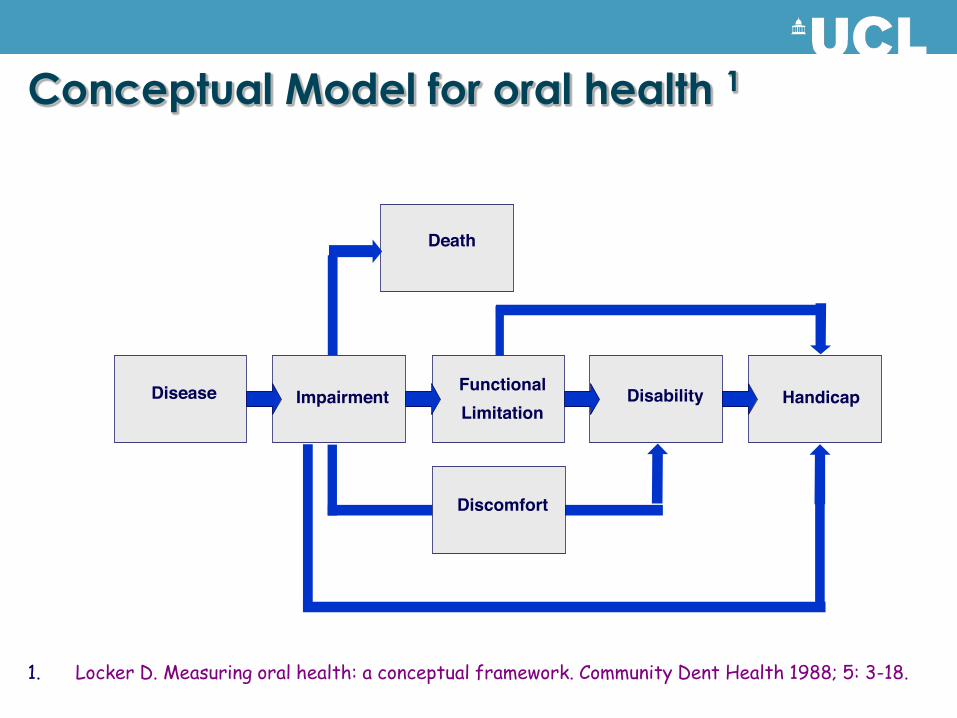
Conceptual Model for oral health 1
1. Locker D. Measuring oral health: a conceptual framework. Community Dent Health 1988; 5: 3-18.
Disease
Death
Discomfort
Impairment Functional Limitation
Disability Handicap
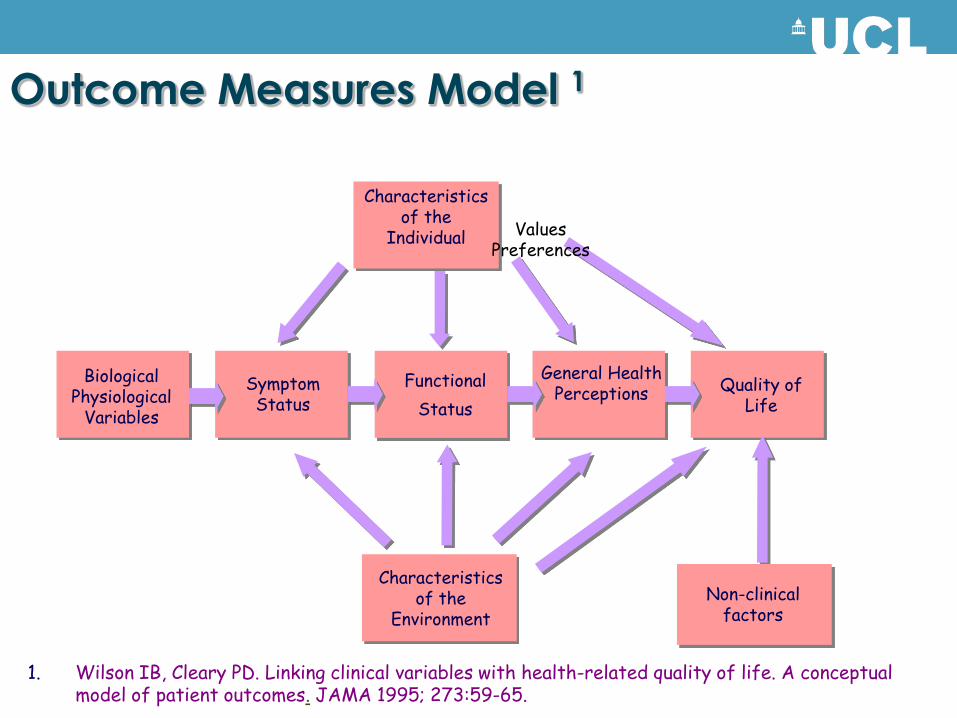
Outcome Measures Model 1
Biological Physiological
Variables
Characteristics
of the Individual
Characteristics of the
Environment
Symptom Status
Functional Status
General Health Perceptions Quality of
Life
Non-clinical factors
Values Preferences
1. Wilson IB, Cleary PD. Linking clinical variables with health-related quality of life. A conceptual model of patient outcomes. JAMA 1995; 273:59-65.
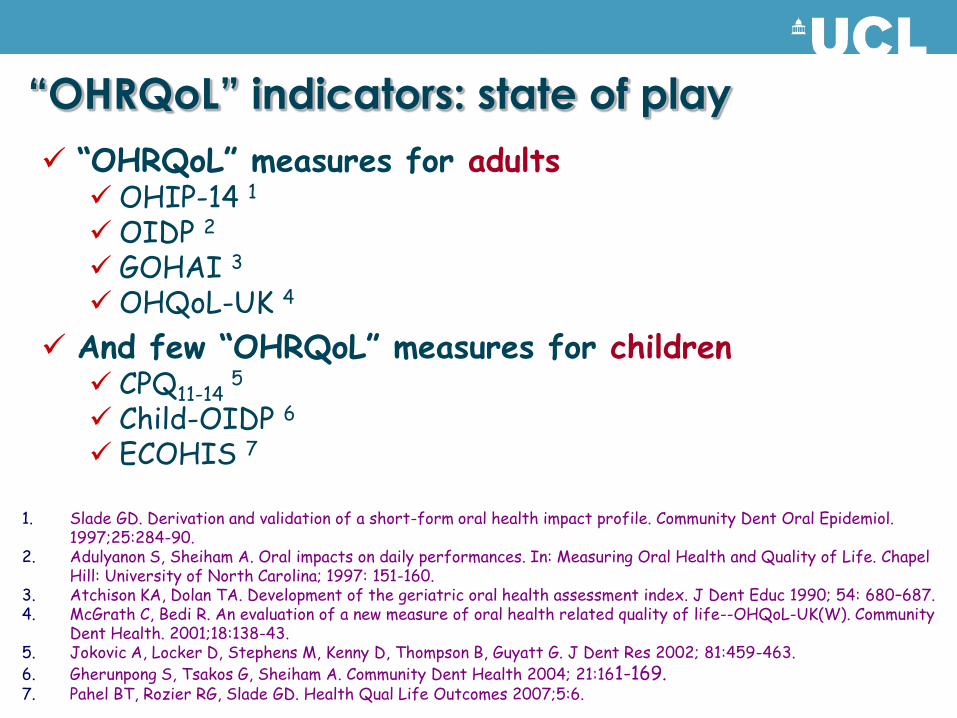
“OHRQoL” indicators: state of play “OHRQoL” measures for adults OHIP-14 1
OIDP 2
GOHAI 3
OHQoL-UK 4 And few “OHRQoL” measures for children CPQ11-14 5
Child-OIDP 6
ECOHIS 7
1. Slade GD. Derivation and validation of a short-form oral health impact profile. Community Dent Oral Epidemiol. 1997;25:284-90.
2. Adulyanon S, Sheiham A. Oral impacts on daily performances. In: Measuring Oral Health and Quality of Life. Chapel Hill: University of North Carolina; 1997: 151-160.
3. Atchison KA, Dolan TA. Development of the geriatric oral health assessment index. J Dent Educ 1990; 54: 680–687. 4. McGrath C, Bedi R. An evaluation of a new measure of oral health related quality of life--OHQoL-UK(W). Community
Dent Health. 2001;18:138-43. 5. Jokovic A, Locker D, Stephens M, Kenny D, Thompson B, Guyatt G. J Dent Res 2002; 81:459-463. 6. Gherunpong S, Tsakos G, Sheiham A. Community Dent Health 2004; 21:161-169. 7. Pahel BT, Rozier RG, Slade GD. Health Qual Life Outcomes 2007;5:6.
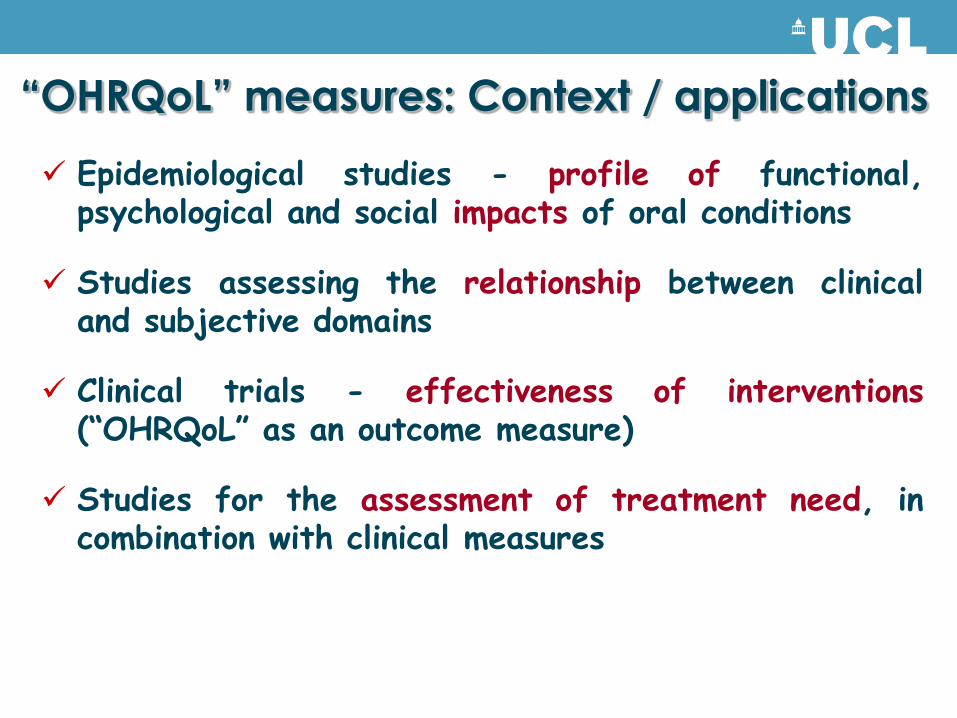
“OHRQoL” measures: Context / applications Epidemiological studies - profile of functional,
psychological and social impacts of oral conditions
Studies assessing the relationship between clinical and subjective domains
Clinical trials - effectiveness of interventions (“OHRQoL” as an outcome measure)
Studies for the assessment of treatment need, in combination with clinical measures
What do “OHRQoL” scores measure?
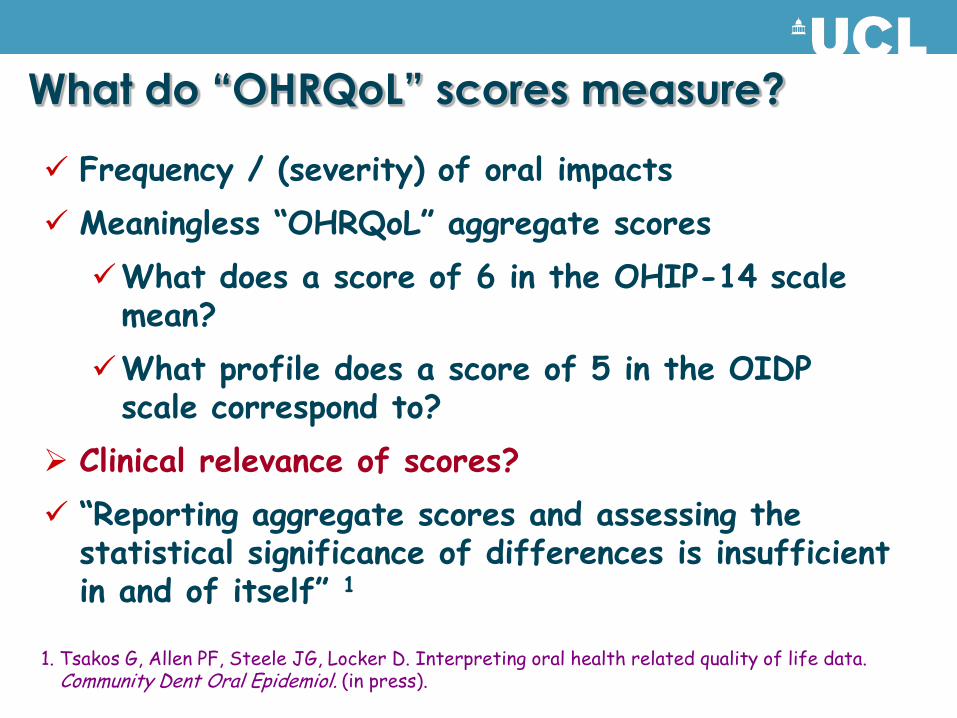
Frequency / (severity) of oral impacts Meaningless “OHRQoL” aggregate scores What does a score of 6 in the OHIP-14 scale
mean? What profile does a score of 5 in the OIDP
scale correspond to? Clinical relevance of scores? “Reporting aggregate scores and assessing the
statistical significance of differences is insufficient in and of itself” 1
1. Tsakos G, Allen PF, Steele JG, Locker D. Interpreting oral health related quality of life data. Community Dent Oral Epidemiol. (in press).
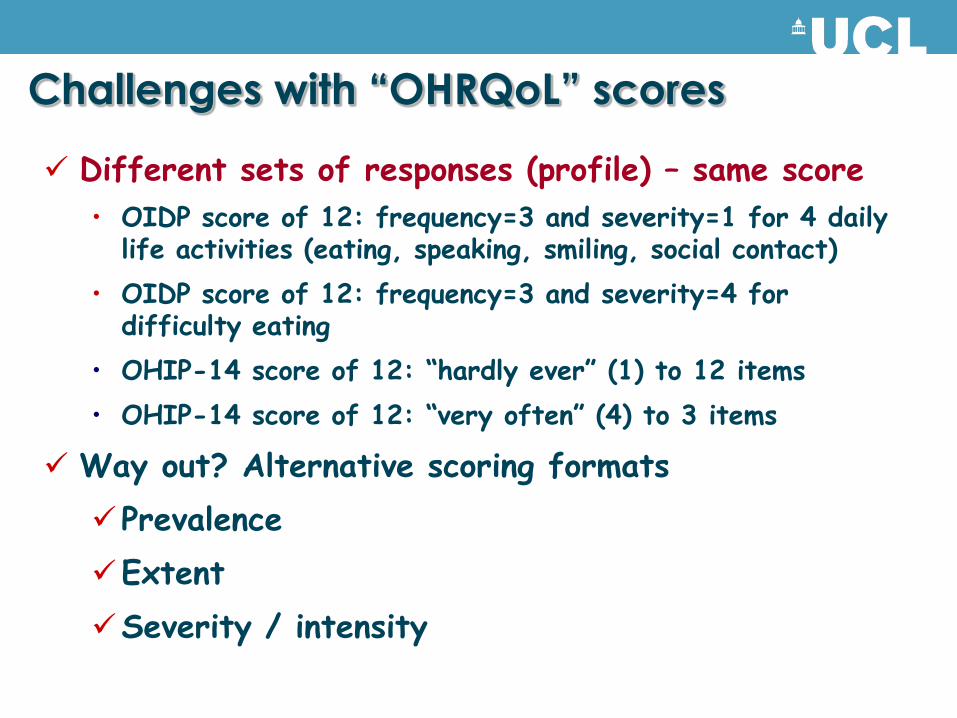
Challenges with “OHRQoL” scores
Different sets of responses (profile) – same score • OIDP score of 12: frequency=3 and severity=1 for 4 daily
life activities (eating, speaking, smiling, social contact) • OIDP score of 12: frequency=3 and severity=4 for
difficulty eating • OHIP-14 score of 12: “hardly ever” (1) to 12 items • OHIP-14 score of 12: “very often” (4) to 3 items
Way out? Alternative scoring formats Prevalence Extent Severity / intensity
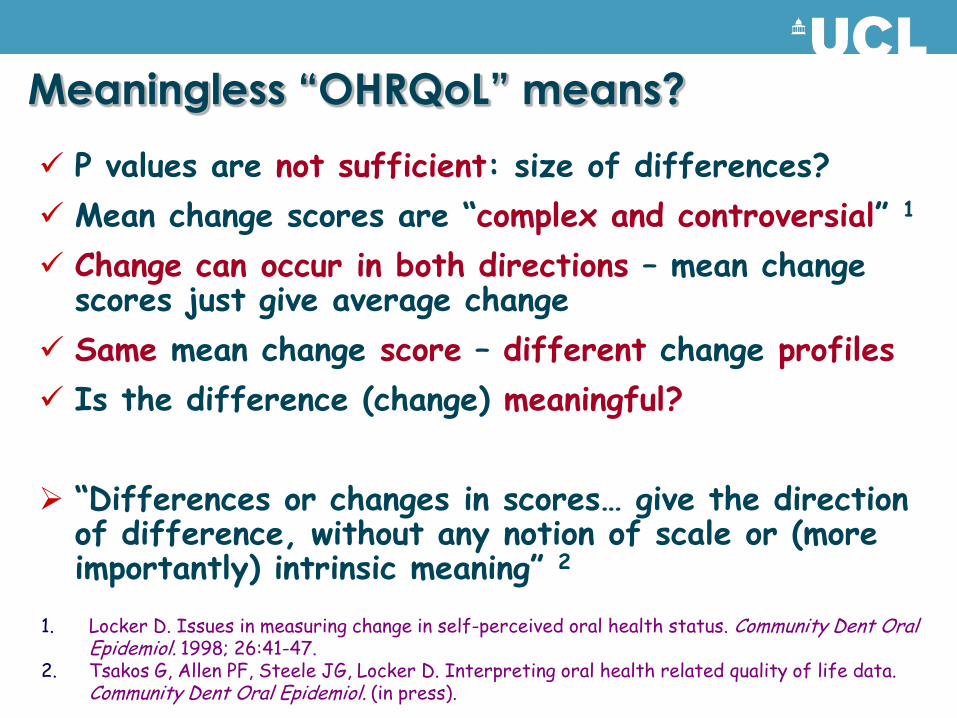
Meaningless “OHRQoL” means? P values are not sufficient: size of differences? Mean change scores are “complex and controversial” 1 Change can occur in both directions – mean change
scores just give average change Same mean change score – different change profiles Is the difference (change) meaningful? “Differences or changes in scores… give the direction
of difference, without any notion of scale or (more importantly) intrinsic meaning” 2
1. Locker D. Issues in measuring change in self-perceived oral health status. Community Dent Oral Epidemiol. 1998; 26:41-47.
2. Tsakos G, Allen PF, Steele JG, Locker D. Interpreting oral health related quality of life data. Community Dent Oral Epidemiol. (in press).
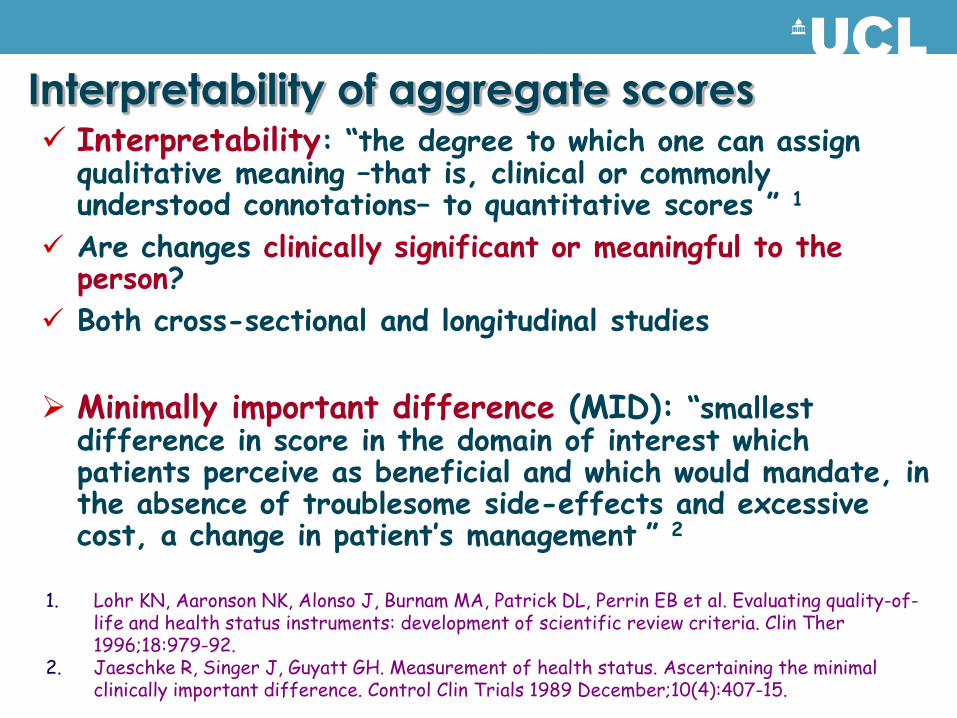
Interpretability of aggregate scores Interpretability: “the degree to which one can assign
qualitative meaning –that is, clinical or commonly understood connotations– to quantitative scores ” 1
Are changes clinically significant or meaningful to the person?
Both cross-sectional and longitudinal studies Minimally important difference (MID): “smallest
difference in score in the domain of interest which patients perceive as beneficial and which would mandate, in the absence of troublesome side-effects and excessive cost, a change in patient’‛s management ” 2
1. Lohr KN, Aaronson NK, Alonso J, Burnam MA, Patrick DL, Perrin EB et al. Evaluating quality-of-life and health status instruments: development of scientific review criteria. Clin Ther 1996;18:979-92.
2. Jaeschke R, Singer J, Guyatt GH. Measurement of health status. Ascertaining the minimal clinically important difference. Control Clin Trials 1989 December;10(4):407-15.
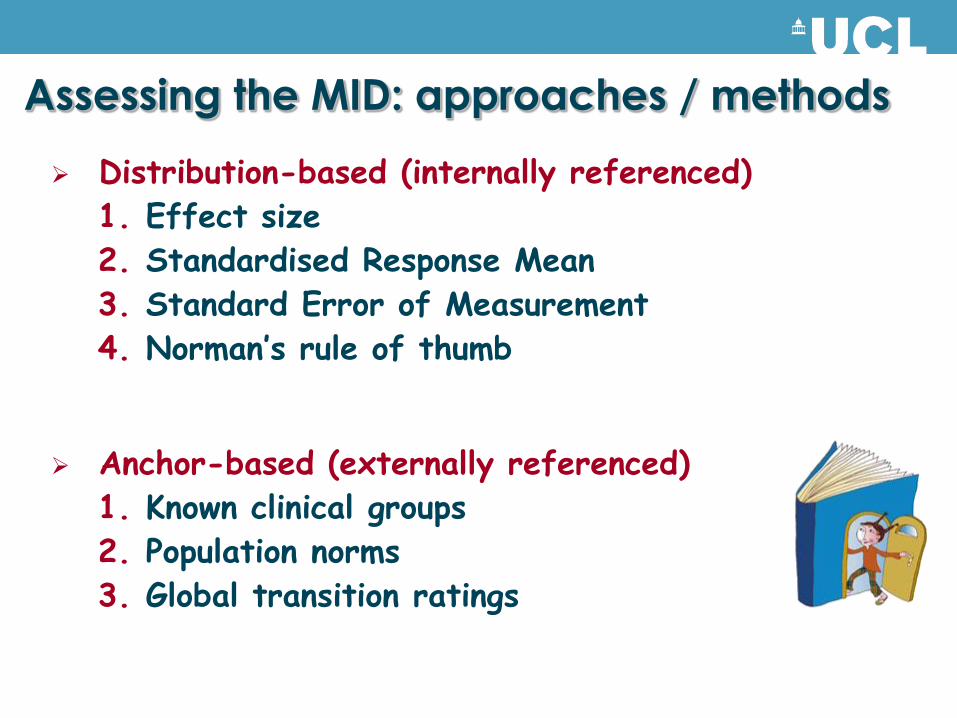
Distribution-based (internally referenced) 1. Effect size 2. Standardised Response Mean 3. Standard Error of Measurement 4. Norman’‛s rule of thumb
Anchor-based (externally referenced) 1. Known clinical groups 2. Population norms 3. Global transition ratings
Assessing the MID: approaches / methods
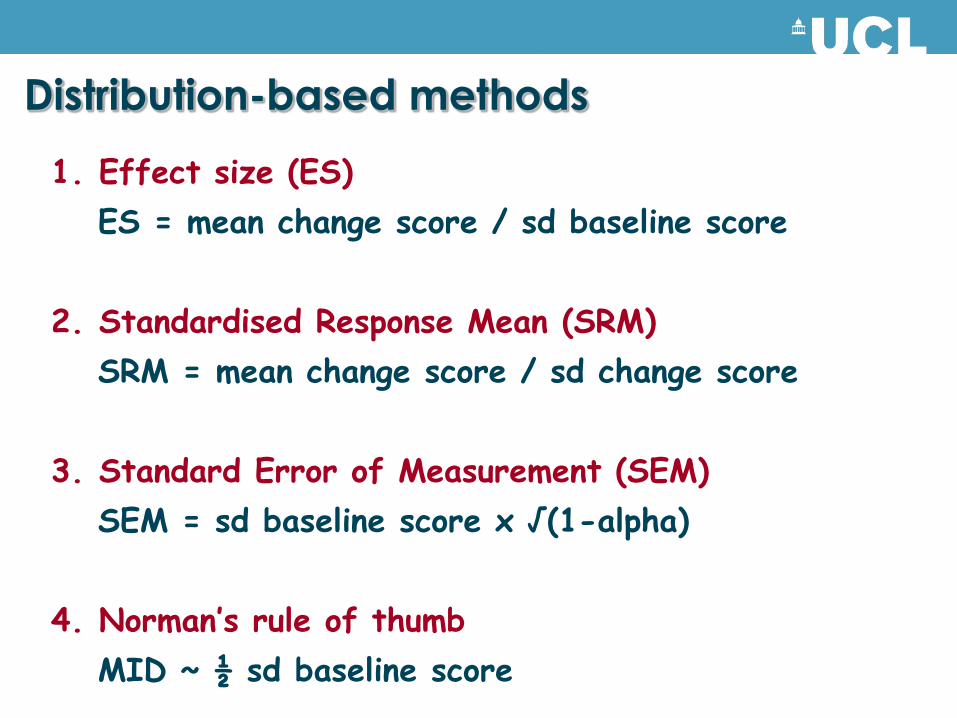
1. Effect size (ES) ES = mean change score / sd baseline score
2. Standardised Response Mean (SRM) SRM = mean change score / sd change score
3. Standard Error of Measurement (SEM) SEM = sd baseline score x √(1-alpha)
4. Norman’‛s rule of thumb MID ~ ½ sd baseline score
Distribution-based methods

OHIP-14 scores by socioeconomic and clinical status: Canadian adults
Mean P ES SEM
Education Secondary 20.1 <0.001 0.24 2.7
Higher 18.3
Income Lowest 17.2 <0.001 0.78 2.7
Highest 23.0
Oral health Dentate 18.6 <0.001 0.42 2.7
Edentate 21.8
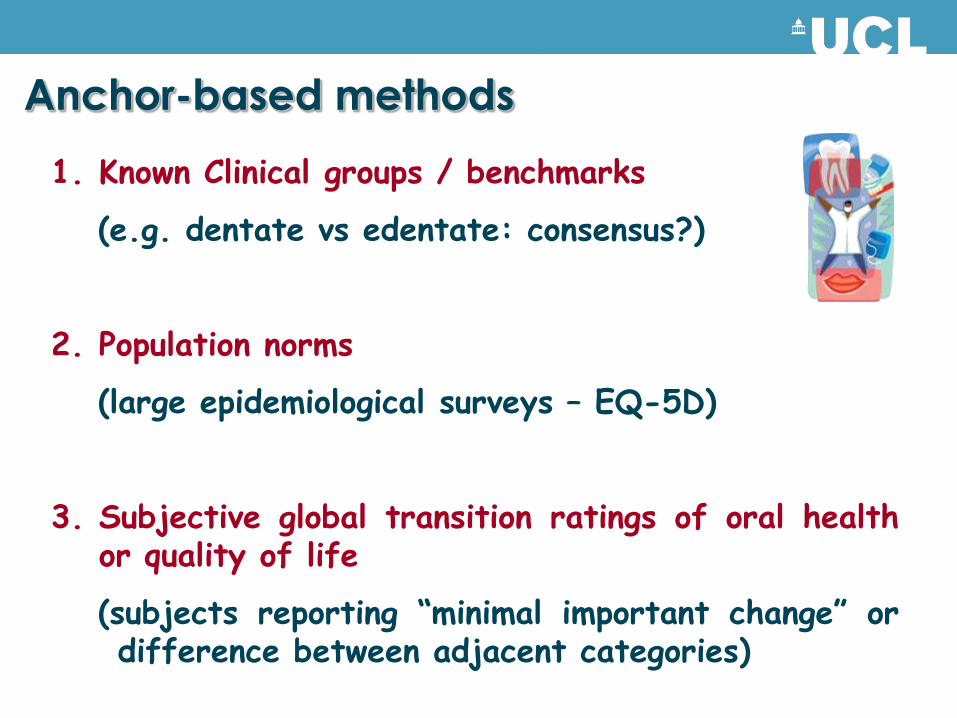
1. Known Clinical groups / benchmarks
(e.g. dentate vs edentate: consensus?)
2. Population norms
(large epidemiological surveys – EQ-5D)
3. Subjective global transition ratings of oral health or quality of life
(subjects reporting “minimal important change” or difference between adjacent categories)
Anchor-based methods
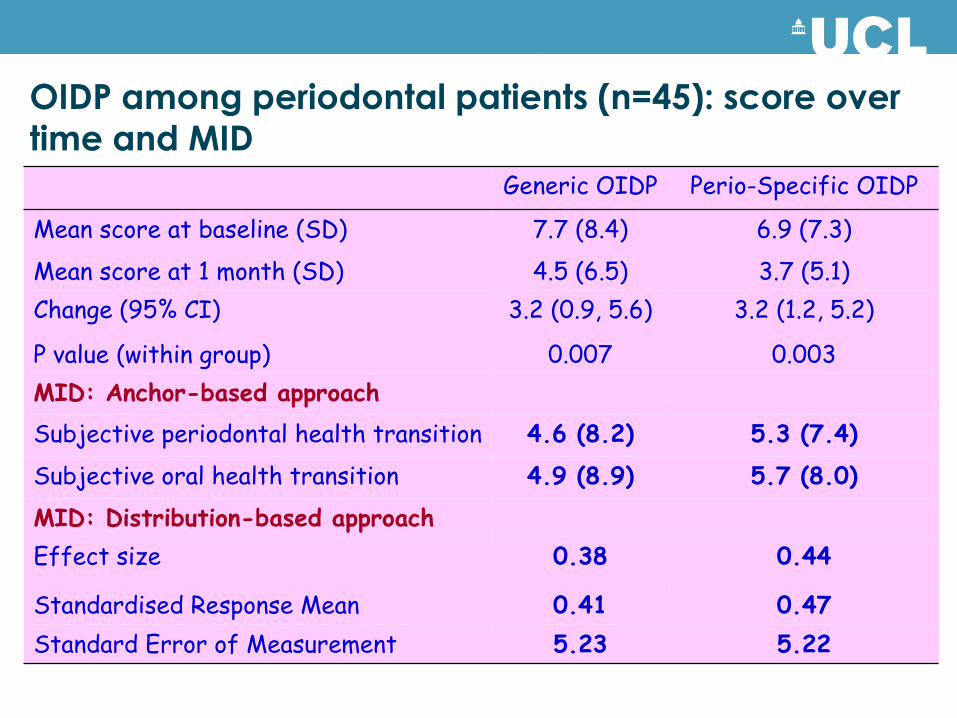
OIDP among periodontal patients (n=45): score over time and MID
Generic OIDP Perio-Specific OIDP
Mean score at baseline (SD) 7.7 (8.4) 6.9 (7.3) Mean score at 1 month (SD) 4.5 (6.5) 3.7 (5.1) Change (95% CI) 3.2 (0.9, 5.6) 3.2 (1.2, 5.2)
P value (within group) 0.007 0.003 MID: Anchor-based approach Subjective periodontal health transition 4.6 (8.2) 5.3 (7.4)
Subjective oral health transition 4.9 (8.9) 5.7 (8.0)
MID: Distribution-based approach Effect size 0.38 0.44
Standardised Response Mean 0.41 0.47 Standard Error of Measurement 5.23 5.22
MID in the oral health context
MID is context and condition specific

Minimum Reporting standards for “OHRQoL” studies
Cross-sectional Longitudinal Description Mean / Median X X
Alternative scoring formats X (X)
Change scores distribution X
Interpretation Statistical significance (X) (X)
Effect Size X X
Standardised Response Mean X
Standard Error of Measurement X X
Global ratings X X
Clinical benchmarks X X

THANK YOU!