reported trade figure discrepancy, regulatory arbitrage
TRANSCRIPT

Reported trade figure discrepancy, regulatory
arbitrage, and round-tripping: Evidence from
the China–Hong Kong trade data
Hung-Gay Fung1, Jot Yau2
and Gaiyan Zhang3
1College of Business Administration & Center
of International Studies, University of Missouri –St Louis, St Louis, USA; 2Albers School of Business
and Economics, Seattle University, Seattle, USA;3College of Business Administration, University ofMissouri-St Louis, St Louis, USA
Correspondence:H-G Fung, College of BusinessAdministration & Center of InternationalStudies, University of Missouri – St Louis,One University Blvd, St Louis, MO 63121,USA.Tel: þ1 314 516 6374;Fax: þ1 314 516 6420
Received: 22 October 2008Revised: 18 March 2010Accepted: 25 April 2010Online publication date: 9 September 2010
AbstractThis study uses reported trade figures from China and Hong Kong to examine
the relationships among market impediments, trade figure irregularities, andtax-induced regulatory arbitrage. The empirical findings, consistent with our
tax-induced regulatory arbitrage models and the round-tripping phenomenon
in China (that is, moving funds across the Mainland Chinese border throughtrade, typically to Hong Kong or an offshore tax haven, before re-entering
China as foreign direct investment), provide support for several conclusions.
First, the spurious flows of funds to and from China, via the underreporting ofexports and the overreporting of imports, closely follow the preferential tax
incentives accorded to foreign investors. Second, the underreporting of exports
is negatively related to export tax rebates. Third, the overreporting of imports isnegatively related to import tariffs. Finally, both of these two appear to be most
prevalent in state-owned enterprises.
Journal of International Business Studies (2011) 42, 152–176.
doi:10.1057/jibs.2010.35
Keywords: regulatory arbitrage; round-tripping; tax evasion; trade figure discrepancies;trade mispricing
INTRODUCTIONSince late 1978, China has grown at an average rate of 9% per yearunder the guidance of market-liberalization policies (Fung, Pei, &Zhang, 2006). International trade, with the help of trade-relatedtax incentives, has also grown at a phenomenal rate, in pace witheconomic development during the same period. During the courseof this market-economic reform, the Chinese government hassuccessfully attracted substantial foreign direct investment (FDI) tohelp stimulate the economy, and hopes to attract further foreigninvestment by offering preferential tax treatment to foreigninvestors. Despite China’s willingness to allow greater trade, it stillmaintains controls on the flow of capital and on its exchange ratein order to insulate its domestic economy from external influence.Chinese firms find ways to circumvent the impediments of capitaland currency controls; moreover, firms have found innovativeways to profit from the growing economy because of incentivesavailable for trade and foreign investment activities.
This study documents several persistent empirical irregulari-ties in the reporting of China’s trade figures and investment
Journal of International Business Studies (2011) 42, 152–176& 2011 Academy of International Business All rights reserved 0047-2506
www.jibs.net

flow patterns. These irregularities are not easilyexplainable by the traditional trade theory. First,China’s exports are understated in comparison withimport figures reported by its trading partners.Second, China’s imports are overstated in compar-ison with the export figures reported by its tradingpartners. Third, round-tripping (i.e., moving fundsacross the Mainland Chinese border throughtrade, typically to Hong Kong or an offshore taxhaven, before re-entering China as FDI) constitutesa significant and integral part of inflows of FDI toChina. These patterns occur in a regulated econom-ic environment that offers export tax rebates toencourage exports, import tariffs to discourageimports, and market impediments such as differ-ential tax treatment to domestic and foreigninvestors, currency inconvertibility, and capitalcontrols.
Previous studies attempt to explain some of theabove empirical irregularities. For example, Fismanand Wei (2004) present evidence that Chinese firmstend to underreport the value of imports to evadetariffs, but this does not explain the observedpattern, in which the value of imports has beenoverreported. Prasad and Wei (2005) suggest severalpossible reasons for China’s FDI inflow pattern,but they have not tested them empirically in atheoretical model. While Xiao (2004) estimates thatround-tripping represents about 40% of China’sFDI, Dollar and Kraay (2005) and Prasad and Wei(2005) estimate that round-tripping represents asmuch as one-third.1 Even though these studiesdocument the amount of FDI accounted for byround-tripping, no study to date has demonstratedexactly how capital leaves China, changes hands,and then returns to China as FDI.
Previous studies thus address the empiricalirregularities as unrelated anomalies, and do notattempt to examine whether these irregularitiesoccur at the same time for a reason. More impor-tantly, since these irregularities involve both tradeand FDI transactions that may be intricatelyconnected in a regulated economy, using a singletrade or FDI theory alone may not satisfactorilyaddress all the issues concerned.
This paper uses a tax-induced regulatory arbitragemodel that coherently incorporates trade, tax, andFDI in a market with impediments. Our model is anapplication of the transaction cost theory of thefirm by Coase (1937) and an extension of Buckleyand Casson (1976). It explains why multinationalenterprises (MNEs), and Chinese firms in parti-cular, engage in tax-induced regulatory arbitrage
(with round-tripping) that increases the firms’profitability and their flexibility in circumventingmarket impediments, which are prevalent indeveloping countries.
The transaction cost theory by Coase (1937)argues that firms act to minimize the impact oftransaction costs, such as information asymmetriesand other market impediments. Inspired by Coase(1937), the internalization theory of FDI proposedby Buckley and Casson (1976) posits that MNEsovercome market imperfections by creating theirown market within the firm hierarchy.2 Moregenerally, firms circumvent market imperfectionsor impediments by arbitraging in different markets.Examples of different types of arbitrage includefinancial market arbitrage, tax arbitrage, regulatoryarbitrage, and credit arbitrage (Shapiro, 2006).
Our study focuses on tax-induced regulatoryarbitrage. Specifically, we develop a model toexplain how Chinese tax incentives for trade anddifferential tax treatment between domestic andforeign investors are related to round-tripping FDIbetween Mainland China and its trading partners.The thinking behind our model is as follows.Chinese firms engaged in exporting or importingcan move funds across the border through tradefigure manipulation (discussed later), and the fundsre-enter China as FDI, enjoying preferential taxtreatment. In view of the benefits from engaging intax evasion related to round-tripping FDI, anexporting firm considers the tradeoff between thebenefit of tax evasion (producing higher earnings)and the cost of losing export tax rebates and beingcaught for tax evasion when the firm underreportsexports; an importing firm similarly considers thetradeoff between the benefits of tax evasion byround-tripping and the cost of paying more tariffswhen the firm overreports imports.3 One uniquefeature of our model is that it incorporates taxincentives, trade figure discrepancies, and round-tripping in a unified way so that several observedempirical irregularities can be explained within oneframework.
The contribution of this paper is threefold. First,it extends the extant FDI studies by developing atax-induced regulatory arbitrage model in whichcorporations circumvent market impediments (e.g.,government controls) and arbitrage the differentialtax treatment by round-tripping FDI via trade figuremanipulation. Second, it adds to the literatureon trade mispricing and illicit financial flows byexplaining documented discrepancies betweenactual and reported fund inflows and outflows in
China–Hong Kong trade data Hung-Gay Fung et al
153
Journal of International Business Studies

China in an integrated framework. In contrast toprior studies, where the magnitude of trade mispri-cing was estimated using a broad-brush app-roach, which examines the omitted numbers inthe balance of payments accounts, official reserves,and others,4 this study compares the reported tradedata discrepancy at the product level and examinesits relationship with import tariffs, export subsidies,and preferential taxes at the micro level. Third,with regard to the balancing act of the costs andbenefits of tax evasion, this paper fits in well withthe corporate tax evasion literature with stylizedresults from the Chinese economy, where theexchange rate is fixed and foreign investment isgiven preferential tax treatment. Chen and Chu(2005) show that a risk-neutral owner of a firm willevade taxes only if the expected gain from taxevasion is by a substantial margin greater than thatfrom honest reporting. In the case of China, Fismanand Wei (2004) present evidence that Chinesefirms tend to evade import tariffs by reclassifyingthe higher-taxed product categories as lower-taxedones, in addition to underreporting the value ofimports.
The rest of the paper is organized as follows. Thenext section first reviews the background literaturethat leads to the development of the model for ourstudy, and then presents two tax-induced regula-tory arbitrage models. Several testable hypothesesare derived. The Data section discusses the dataand research methodology used in the empiricalanalysis. Results of the empirical tests and severalrobustness tests are presented and discussed inthe Empirical Analysis section. The final sectionconcludes the paper.
THEORETICAL MODELS AND HYPOTHESES
Review of Literature Pertaining to ModelDevelopmentMany approaches and trade theories have beenadvanced to explain the observed patterns ininternational trade flows. A conventional approachto explaining these patterns is grounded in theneoclassical trade theory, which was developed byRicardo (1817/1950) and expanded separately byHeckscher (1919/1950), Ohlin (1933), and Vanek(1968) (henceforth, HOV). Neoclassical trade theo-ry suggests that countries produce and exportproducts in which they have a comparative advan-tage in exchange for products in which they donot have a comparative advantage, where compa-rative advantage is defined in terms of factor
endowments, such as labor and capital (or technol-ogy). Although the HOV model is not supportedwell by empirical evidence, Trefler (1993) showsthat a modification of the HOV model that allowsfor factor-augmenting international productivitydifferences explain reasonably well why countriesexport products that they do not have in abun-dance (but in which they have relatively highproductivity), while importing products in whichthey are well endowed (but in which they haverelatively low productivity).
More recently, intra-industry trade frequentlyoccurs between countries, particularly rich coun-tries, which export and import more or less thesame goods from one another: for example, Swedenexports Volvos and imports BMWs. Krugman(1979) explains this type of foreign trade with theconcept of economy of scale, in which massproduction diminishes the cost per unit produced,giving rise to concentrated production in a fewfactories and in a few countries.
Thus trade theories, neoclassical or new, attemptto explain the observed trade patterns based on theprinciples of comparative advantage and economyof scale. Yet this trade-based approach will behandicapped in explaining the trade and invest-ment patterns if (1) trade figures are not accurate,or (2) trade flows are related to FDI. It is estimatedthat 60% of world trade is directly or indirectlyconnected to FDI (Aizenman & Noy, 2006), andover 30% of world trade is within the same organi-zational entity (intra-firm trade) (Antras, 2003). Ifthese estimates are correct, empirical results basedon the reported trade figures will inevitably bedifferent from what the trade theories predict,because a large proportion of capital flows are alsocaused by FDI, not just by trade alone. Moreover, ithas been observed that reported trade figures arefar from accurate, as a result of manipulation byreporting firms. Furthermore, trade figure mani-pulation may be related to FDI. Although tradetheory cannot satisfactorily explain patterns oftrade and investment flows, FDI theories may helpexplain the pattern of the international flow offunds.5
One FDI theory views MNEs as firms with marketpower that set up wholly owned subsidiaries in aforeign nation specifically for the purpose of takingadvantage of ownership-specific advantages, suchas monopolistic access to raw materials and intan-gible assets (e.g., trade names or patents) (Hymer,1976; Kindleberger, 1969).6 Market imperfectionsin fact are a sufficient condition for justifying the
China–Hong Kong trade data Hung-Gay Fung et al
154
Journal of International Business Studies

firm’s move to a foreign country to make use ofits monopolistic advantages.7 Inspired by Coase(1937), who argues that firms will act to minimizetheir transaction costs of doing business, Buckleyand Casson’s (1976) internalization theory sug-gests that a firm overcomes market imperfectionsthrough creating its own market by becoming anMNE engaging in international production anddistribution, while Rugman (1985) argues thatvertical integration, transfer pricing, and qualitycontrol are examples of internalization or multi-national hierarchical activity. In addition to own-ership- and internalization-specific advantages, FDItheories also suggest that firms combine them withlocation- or country-specific advantages (Dunning,1981).
While the internalization theory predicts thatMNEs would arise that solve the product marketimperfections, Mehta and Fung (2004) suggest thatthe product market, the financial market, and theforeign exchange market are parts of a hierarchy inwhich impediments in any one market will compelor prompt arbitrage activities that seek economicgains by participating in other markets or bycreating new products and markets.8
Firms can use different types of arbitrage toexploit market imperfections. Financial marketarbitrage entails the transfer of funds among unitsin the MNE in order to circumvent exchangecontrols, earn higher risk-adjusted yields on excessfunds, reduce their risk-adjusted cost of borrowedfunds, and tap previously unavailable capitalsources (Shapiro, 2006). For example, MNEs canuse the covered interest arbitrage strategy to benefitfrom a lower cost of financing while covering theforeign exchange risk.9
Shapiro (2006) also suggests other types ofarbitrage activities that MNEs can use to circum-vent market impediments and increase profitabil-ity. For instance, credit arbitrage occurs when anaffiliate of an MNE borrows from external sources,negating the effect of credit restraint or controls inits country of operation, where local credit marketsare made inaccessible to MNEs by the host govern-ment. Tax arbitrage involves the shifting of gains orlosses from one tax jurisdiction to another to profitfrom differences in tax rates or, in the case ofChina, shifting between two different sets of taxrates applicable to different entities, domestic andforeign, within the same tax jurisdiction. Regula-tory arbitrage aims at enhancing returns by gettingaround government regulations. For example,Chinese firms engaging in round-tripping to avoid
capital controls are involved in regulatory arbitrage.Also, MNEs have the ability to disguise the trueprofitability of their subsidiaries and reallocate theprofits among units with transfer pricing.10
This brief review of tax and regulatory arbitragehighlights the importance of taxes as incentives ordeterrents for MNEs considering FDI. It is thusreasonable to expect that favorable tax treatmentwill attract FDI, whereas high tax rates along withstrict capital control (including repatriation ofprofit) will discourage FDI. Because many factorsinfluence the location and volume of FDI, theimpact of taxation on FDI can only be empiricallydetermined. Previous studies (e.g., Altshuler,Grubert, & Newlon, 2001) suggest that FDI issensitive to taxation. In particular, countries withlower tax rates receive much more FDI than docountries with higher tax rates (Grubert & Mutti,1991, 2001). Moreover, Grubert and Mutti (1991,2001) find evidence that the FDI-location deci-sion made by US MNEs is consistent with income-shifting behavior, and Altshuler and Grubert (2005)find that income shifting has increased amongUS manufacturing firms during recent years.Furthermore, for a given country, FDI is greaterin years during which associated tax burdensare lighter (Boskin & Gale, 1987; Hartman, 1984;Slemrod, 1990). These results indicate that indetermining the location and amount of FDI, MNEshave become more sensitive to differences in taxrates, as they can now move capital across nationalborders much more easily as a result of technolo-gical advances and the loosening of trade restric-tions and capital controls in recent years. Gordonand Hines (2002) point out that even thoughmany other important variables determine FDI,which may overshadow the importance of taxation,the impact of taxation on FDI is so great that itstands out as a significant factor in most empiricalstudies.
A strand of international tax literature pertainingto MNEs is tax avoidance. Evidence from previousstudies indicates that US MNEs have used sophis-ticated tax avoidance schemes to shift taxableincome from high-tax countries to low-tax coun-tries, including changing the timing of incomerecognition for tax purposes (Grubert, 1998;Grubert & Mutti, 2001; Hines, 1995; Hines &Hubbard, 1990), paying royalty to the parentcompany (Grubert, 1998; Hines, 1995), and estab-lishing affiliates in tax haven countries and usingtransfer pricing (Clausing, 2000; Harris, Morck,Slemrod, & Yeung, 1993).
China–Hong Kong trade data Hung-Gay Fung et al
155
Journal of International Business Studies
A number of studies examine the transfer pricingof MNEs in China (e.g., Chan & Chow, 1997a, b;Ho & Lau, 2002). They find that transfer pricingmanipulations in China were motivated by thedifferential between the income tax rate in Chinaand the income tax and import tariff rates inthe tax domiciles of MNEs. In addition, Chanand Chow (1997b) find that, contrary to popularallegation that, in aggregate, foreign-funded enter-prises employ transfer pricing to siphon profitsout of China, foreign-funded enterprises in Chinapaid more for both their imports and theirexports than their domestic counterparts. In con-trast, our model focuses on the regulatory arbitrageinduced by the tax rate differential within China,that is, the differential in those rates applicable toChinese domestic companies and preferential taxtreatment applicable to foreign-funded enterprisesin China.
The current study is closely related to theliterature on trade mispricing, which is believedto be a major conduit for illicit financial flows(typically outflows) from developing countries.Trade mispricing includes:
(1) transfer pricing, where the misinvoicing occurswithin the same invoice as a matter ofagreement between buyer and seller, and nodifference between export and import valuesoccurs;
(2) trade misinvoicing, where misinvoicing occurson different invoices (i.e., import prices reportedby the importing country do not match thosevalues reported by the exporting country); and
(3) other illicit trades.
Prior studies estimate the magnitude of trademispricing using a broad-brush approach, whichexamines the omitted numbers in the balance ofpayments accounts, official reserves, and others.11
In contrast, the current study compares thereported trade data discrepancy at the productlevel, and relates it to the product-level importduties and export subsidies, and industry-levelpreferential taxes. While previous studies docu-ment the amount and pattern of trade mispricingaround the world and a significant amount inChina in particular, an in-depth analysis of thefactors driving such outflows from China is calledfor in previous studies. For example, Kar andCartwright-Smith (2008: 24) propose that “thevolume of illicit flows from China is so high thatthere is a strong case for future research to carry outan in-depth analysis of the (i) factors driving such
outflows from China and (ii) possible destinationsand types of investments where such outflowsare being absorbed”. Our study attempts to fill thisimportant void.
The literature discussed in this section motivatesus to develop a regulatory arbitrage model toexplore the interconnectedness among trade figurediscrepancies, tax incentives, and round-trippingFDI.
Model Development
Exporting firm. Consider an exporting firm thatsells goods in an offshore market. In an effort toencourage firms to export, the Chinese governmentgives out export tax rebates. The rebate rate varies,depending on the type of product exported.12
We assume that the exporting firm is motivatedto find a way to keep its export earnings offshore(outside China) for several reasons. First, theexporting firm can avoid currency conversionrestrictions at home and convert its earnings intoany currency. Second, earnings kept offshore canbe returned home through a foreign entity (butacting on behalf of the exporting firm) as foreigninvestment, which enjoys preferential taxation. Inother words, some of the export earnings willreturn to China through different means, whilesome will remain offshore. How much of theunderreported earnings stay outside China andhow they eventually return to China via round-tripping is not known, and must be assumed in anytheoretical model. It is reasonable to expect thatthe money involved in underreported exportearnings will return to China as FDI inflows viaround-tripping if three conditions are met:
(1) the future tax payable on the money returned isminimal;
(2) the money returned is deemed legitimate andprivate (see discussion below); and
(3) most important, the money returned is notsubject to capital controls.
Since FDI inflows meet all three conditions, itis reasonable to assume that all underreportedexports earnings will return to China as FDI. Inreality, other factors affect the actual percentagereturning to China. For example, when the realestate markets are hot in Hong Kong, it is obser-ved that hot money flows in and remains therebefore it eventually returns to China. Because weare interested not in estimating the parameters, butin testing for the presence of such an effect, for the
China–Hong Kong trade data Hung-Gay Fung et al
156
Journal of International Business Studies
sake of simplicity our model assumes that under-reported export earnings will all return.13
To make the money remaining offshore looklegitimate, the exporting firm understates its exportearnings to the authorities so that the remittedearnings match the reported export earnings athome. This is typically done with the help of anintermediary, a trading agent of the exporting firmthat acts as a bridge between the exporting firm andthe ultimate buyers (trading partners). Typically,the agent is a firm set up outside China by theexporting firm (for private enterprises) or by somemanagers of the exporting firm (for state-ownedenterprises) who run the round-tripping scheme,and thus we assume that there is no search feeinvolved.14
Thus we formulate a model of the behavior of anexporting firm as follows:
CX ¼½ðX� xÞ � C�ð1� tÞ þ ðX� xÞdþ x½1þ rð1� btÞ� � P
ð1Þ
where CX represents the after-tax incrementalcash flows of an exporting firm; X is the level oftrue (actual) export earnings; x is the amountof export earnings understatement;15 C is the costof business operations; t is the corporate tax rate;and d is the export tax rebate rate. The x amount ofthe export earnings understatement that returns toChina is invested for a return, r (x). Thus x, the moneyinvested in China, is designated as FDI because themoney is remitted from an offshore market.
We assume that the return on investment is adiminishing function of the investment x, that is,rxo0 and rxxo0. The first condition implies adiminishing return to the foreign investment. Thesecond condition implies a diminishing marginalreturn with an increase in foreign investment.Foreign investment enjoys a tax break, which is areduction in the corporate tax rate, t, for a foreignentity. The reduction in the corporate tax ratedepends on the tax bracket, b, to which a foreign-funded enterprise belongs. The tax bracket, b, isbetween 0 and 1. If b equals 1, the foreign invest-ment enjoys no tax break; if it is 0, the foreignentity pays no taxes.
P is the amount of the penalty for underreportingexports and misleading the export authority.16
We assume that Px(x)40 and Pxx(x)40. The firstinequality implies that the marginal cost of under-reporting and misleading the exports authority ispositive. The second inequality implies a highermarginal cost of underreporting exports as exportearnings manipulation increases.
Differentiating CX with respect to foreign invest-ment, x, gives the first-order condition as
CXx ¼� ð1� tÞ � dþ ½1þ rð1� btÞ�þ xð1� btÞrx � PxðxÞ ¼ 0
ð2Þ
Solving Eq. (2) yields
rð1� btÞ þ t ¼ dþ PxðxÞ � xð1� btÞrx ð3Þ
The equilibrium condition in Eq. (3) suggests thatthe exporting firm is trading off the benefits of theafter-tax return of the foreign investment fromround-tripping, r(1�bt), and the tax shield ofunderreporting exports, t, against the loss of theexport tax rebate, d, the cost of penalty in round-tripping, Px(x), and the diminishing returns frominvestment, x(1�bt)rx.
By differentiating the first-order condition withrespect to the export tax rebate, d, we obtain therelation between x and d at the equilibriumcondition:
� 1þ rxð1� btÞ dx
dd
� �þ rxð1� btÞ dx
dd
� �
þ xrxxð1� btÞ dx
dd
� �� PxxðxÞ
dx
dd
� �¼ 0
Rearranging the terms, we have
dx
dd¼ 1
ð1� btÞð2rx þ xrxxÞ � Pxxo0 ð4Þ
The denominator of Eq. (4) is negative because ofour assumptions of the return, r, and the penaltycost, P.17
Result 1: In China, an increase in exportincentives reduces the amount of exports under-reported. Alternatively, export incentives arenegatively related to export underreporting.
Similarly, differentiating the first-order conditionwith respect to the tax bracket, b, for a foreigninvestor gives us the relation between the foreigninvestment, x, and the tax bracket, b (i.e., a hightax bracket, b, implies less tax breaks for foreigninvestors). That is,
ð1� btÞrxdx
db
� �� rt þ rxð1� btÞ dx
db
� �
þ xrxxð1� btÞ dx
db
� �� PxxðxÞ
dx
db
� �¼ 0
China–Hong Kong trade data Hung-Gay Fung et al
157
Journal of International Business Studies

Rearranging terms, we obtain
dx
db¼ rt
ð1� btÞ½2rx þ xrxx � PxxðxÞ�o0 ð5Þ
Result 2: The amount of foreign investmentsecured through export underreporting is posi-tively related to tax breaks for foreign invest-ment.18
Importing firm. Importing firms have the samemotivations for keeping money offshore as expor-ting firms do. In order to have money availableoutside the jurisdiction of the Chinese government,an importing firm overstates the import invoice andpays the seller more than the actual amount due inthe offshore market. An agent who receives theexcess payment on behalf of the Chinese importingfirm in the offshore market (e.g., Hong Kong orThailand) could either leave it in a tax haven orreturn it to China as FDI. Thus an importing firmcan effectively circumvent capital controls and con-vert a controlled, nonconvertible currency into afreely convertible currency offshore through aninternational trade transaction. This scheme has acost. As the importing firm overpays for goodspurchased, it has to pay extra tariffs. To reduce thisburden and maximize the gains from round-tripping,the importer finds ways to reduce the tariff burden.Fisman and Wei (2004) provide empirical evidencethat Chinese firms evade taxes by underreportingimports as well as by shifting items in higher-tariffcategories to lower-tariff categories.
In our model, Chinese importing firms evaluatethe tradeoff between the benefit of a tax break onforeign investment from round-tripping and thecost of import tariffs if the imports are overstated.We hypothesize that round-tripping is part of thetax-induced regulatory arbitrage for Chinese firmsto capture the tax differential between foreign anddomestic investments. Thus, on the one hand,Chinese firms have incentives to send excessmoney offshore by overstating the import invoiceand return the money to China as FDI. On theother hand, importing firms also have incentives tounderreport imports or to misclassify imports fromhigher-tax product categories to lower-tax ones toreduce tariff payments.
We formulate the after-tax cash flows of theimporting firm as follows:
CM ¼½S� ðM þmÞ�ð1� tÞ � ðM þmÞiþm½1þ rð1� btÞ� � PðmÞ
ð6Þ
where CM is the after-tax cash flows for an
importing firm with sales revenue S. The importing
firm imports an actual amount M, but overreports it
by an amount m. The reported imports amount is
Mþm. Thus the trading partner of the importing
firm receives the M amount, and the m amount is in
the hands of an agent of the importing firm. The
importing firm, with the aid of the agent, then
forms a company offshore with a registered capital
of m, the amount by which imports have been
overstated. This offshore company, with capital
originating in China, then invests its money in
China; the investment is now qualified as FDI and
enjoys preferential tax treatment.The importing firm faces an import tariff rate, i.
The return on investment of the importing firm, r,is a function of m. We assume that rm(m)o0 andrmm(m)o0.
Differentiating the after-tax cash flows of theimporting firm, CM, with respect to the overstatedimports, m, and setting it to 0 yields the first-ordercondition:
CMm ¼� ð1� tÞ � iþ ½1þ rð1� btÞ�þmð1� btÞrm � Pm ¼ 0
ð7Þ
The optimal condition for m can be obtained bysolving Eq. (7). We have
t þ rð1� btÞ ¼ iþ Pm �mð1� btÞrm ð8Þ
Differentiating the first-order condition, CMm,with respect to i and setting it to zero yields therelation between the amount of the overstatedimports, m, and the tariff rate, i, at the equilibriumcondition:
� 1þ ð1� btÞrmdm
diþ ð1� btÞrm
dm
di
þmð1� btÞrmmdm
di� Pmm
dm
di¼ 0
We rearrange terms to obtain
dm
di¼ 1
ð1� btÞð2rm þmrmmÞ � PmmðmÞo0 ð9Þ
Result 3: The amount of the overstatement ofimports is negatively related to the tariff rate.
Differentiating the first-order condition, CMm, withrespect to the tax bracket, b, yields the relation
China–Hong Kong trade data Hung-Gay Fung et al
158
Journal of International Business Studies

between the amount of import overstatement, m,and the tax bracket, b (i.e., a high tax bracketimplies less tax break for foreign investors), at theequilibrium condition:
dm
db¼ rt
ð1� btÞð2rm þmrmmÞ � PmmðmÞo0 ð10Þ
Result 4: FDI in an import overreporting schemeis positively related to tax breaks for foreigninvestment.
If the cost of the penalty, P, is linear with overstatedimports or understated exports (Pmm¼0 in Eq. (10)or Pxx¼0 in Eq. (5)), FDI through exporting andimporting firms (i.e., the signs of dx/db and dm/dbin Eqs. (5) and (10), respectively) depends primarilyon the return function.
When an exporting firm is state-owned, publicassets are being transferred to managers (who areprivate individuals) through export underreporting.Underreporting exports and linking up with anagent offshore facilitate the transfer of public assetsto private hands. In this case, Eq. (1) will become
CX ¼af½ðX� xÞ � C�ð1� tÞ þ ðX� xÞdgþ x½1þ rð1� btÞ� � P
ð11Þ
In this model, controlling managers of state-owned enterprises have a% of the firm’s incremen-tal cash flows and full ownership of the value of theexport understatement, which returns to China asFDI. We can reasonably assume a is a low number ifthe scheme is sustained for a long time.
Thus differentiating Eq. (11) with respect toinvestment secured through export underreport-ing, x, gives
CXx ¼� að1� tÞ � adþ ½1þ rð1� btÞ�þ xð1� btÞrx � PxðxÞ ¼ 0
ð12Þ
Differentiating Eq. (12) with respect to a andrearranging terms yields
dx
da¼ dþ ð1� tÞð1� btÞrx þ xrxx
o0 ð13Þ
Result 5a: This result implies that the lower thepersonal ownership of the managers in the firm,the greater the amount of foreign investmentthat state-owned enterprises amass through
export underreporting. Put another way, control-ling managers tend to misappropriate wealthfrom the state-owned enterprises throughround-tripping.
Result 5b: Using the same analysis, it can beshown that controlling managers of the im-porting firm overstate their imports in order totransfer public assets to private hands. In short,dm/da o0, implying that controlling managersof state-owned importing firms are likely tooverstate imports in order to engage in round-tripping, which has the same wealth misappro-priation effect as in the case of exports.
Research HypothesesBased on the discussion of our models above, wedevelop six hypotheses (i.e., two sets of threehypotheses) regarding Chinese export understate-ment (E) and Chinese import overstatement (I).
Hypothesis E1: The extent of export understate-ment is negatively related to export incentives.That is, the greater the export incentives, thelower the incentives for Chinese exporters tounderreport exports (from Result 1).
Hypothesis E2: The extent of export understate-ment is positively related to China’s preferentialincentives for firms involved in FDI. That is, thegreater the FDI incentives, the greater the incen-tives for Chinese exporters to underreport exports(from Result 2).
Hypothesis E3: The extent of export understate-ment is positively related to state ownership. Thatis, the greater the level of state ownership, thegreater the incentives for Chinese exporters tounderreport exports (from Result 5a).
Hypothesis I1: The extent of import overstate-ment is negatively related to import tariffs. Thatis, the higher the import tariffs, the lower theincentives for Chinese importers to overreportimports (from Result 3).
Hypothesis I2: The extent of import overstate-ment is positively related to China’s preferentialincentives for firms involved in FDI. That is, thegreater the FDI preferential incentives, the greaterthe incentives for Chinese importers to over-report imports (from Result 4).
China–Hong Kong trade data Hung-Gay Fung et al
159
Journal of International Business Studies

Hypothesis I3: The extent of import overstate-ment is positively related to state ownership. Thatis, the greater level of state ownership, the greaterthe incentives for Chinese importers to over-report imports (from Result 5b).
DATA
Trade Flow DataThe trade flow data in this paper were collectedfrom the United Nations Statistical Division’sCommodity Trade (COMTRADE) database, whichcontains data on exports and imports by commod-ity that is classified by the six-digit HarmonizedCommodity Description and Coding System (HS)and by partner country for each individual country.Access to the COMTRADE database was facilitatedby a data inquiry tool, the World Integrated TradeSolution (WITS) developed by the World Bank, inclose collaboration with the United Nations Con-ference on Trade and Development (UNCTAD), tocreate easy retrieval of information on trade andtariffs compiled by various international organiza-tions.19
To detect discrepancies between the trade flowfigures reported by China and the figures reportedby Hong Kong, we first matched the value ofthe direct trade flows of the two related parties atthe six-digit HS level after eliminating indirecttrade flows through Hong Kong as an entrepot.20
We then compared China’s reported trade figureswith those reported by Hong Kong, whose trade
figures are believed to be accurate and are notsusceptible to manipulation, since there is noincentive for firms to misreport the trade figuresin Hong Kong, where there is no tariff (Fung, 2005).
We define the gap between two trading partnersas the difference between the value of one party’simports and the value of the counterparty’s exportswith China. Thus China’s export gap is defined asthe difference between the value of importsreported by Hong Kong and exports reported byChina, while China’s import gap is defined as thedifference between the value of imports reported byChina and exports reported by Hong Kong. Theexport sample for 2000 consists of China’s exportsto Hong Kong (reported by China) and HongKong’s imports from China (reported by HongKong), with 3754 observations that have completeinformation on China’s export tax rebate rates. Theimport sample for 2000 consists of China’s importsfrom Hong Kong (reported by China) and HongKong’s exports to China (reported by Hong Kong),with 2203 observations that have complete tariffand value-added tax (VAT) rates.
Figures 1 and 2 show that the trade statisticsreported by Mainland China and those by HongKong differ substantially. In Figure 1, the exports toHong Kong for the period 1996–2004 as reported byChina are consistently lower than those reportedby Hong Kong. For 2004, China’s exports to HongKong were reported as $98.71 billion, whereas theimports from China were reported by Hong Kong as$113.01 billion, a difference of $14.3 billion. The
$0
$5
$10
$15
$20
$25
$30
$35
$40
$45
$50
$0
$20
$40
$60
$80
$100
$120
Gap
(bn
)
Exp
ort/I
mpo
rt V
alue
(bn
)
Year
China Exports Hong Kong Imports Gap
1996 20042003200220012000199919981997
Figure 1 Trade figure discrepancies: Mainland China’s exports to Hong Kong.
China–Hong Kong trade data Hung-Gay Fung et al
160
Journal of International Business Studies

export gap (i.e., Hong Kong imports less Chinaexports) is even greater earlier, with a peak in 2000of $47.2 billion, implying that the Chinese figure is52% lower than the Hong Kong figure. This hugegap in the reported trade figures seems to beexplainable by statistical errors, the entrepot tradebetween China and Hong Kong, or the FDI round-tripping. Fung (2005), however, rules out the firsttwo as the culprits for the huge gap. First, statisticalerror cannot explain the huge gap, because randomreporting errors would be expected to occurin both directions. The statistics in Table 1, how-ever, indicate that the gap is mostly positive andconsistently large in size, making it difficult toattribute the gap to pure statistical errors. Second,the huge discrepancy persists even after accountingfor the entrepot trade flows. This leaves us with thethird possible explanation: round-tripping-relatedinvestment flows, which have not been officiallyaccounted for.
Panel A of Table 1 shows export understatementin nine of the ten product categories aggregated atthe first-digit HS level. Understatement is pervasivein almost all product categories, which would makeit less likely to be a result of misclassification ofproduct categories across the board. Panel B ofTable 1 lists the categories with the highest under-statement amounts.
The pattern in Figure 2 (China’s imports fromHong Kong) contrasts with that in Figure 1, inwhich China’s import figures are typically higherthan those reported by Hong Kong. For 2004, Hong
Kong’s exports to China were recorded as $4.88billion, whereas China’s imports from Hong Kongwere reported as $11.80 billion, an overstatementof $6.92 billion, or 142% of the Hong Kongfigure.21 The overstatements were $5.44 billion in2002 and $6.41 billion in 2003. Overall, thereseems to be an overstatement problem of Chineseimports for the period 1999–2004.
Panel C of Table 1 shows the overstatement ineight of the ten product categories aggregated atthe first-digit HS level. As in the export sample, itappears unlikely that overstatement is the result ofmisclassification of product categories. Panel D ofTable 1 lists the product categories with the highestlevels of overstatement.
To address scale issues, we controlled for the sizeeffect of the variable gap in two ways. First, sgap isdefined as the gap divided by the average of oneparty’s exports and the counterparty’s imports:
sgap ¼ gap
ðimportsþ exportsÞ=2 ð14Þ
We also took a logarithmic transformation for gap.To maintain the original sign and order, we definedlgap as the natural logarithm of the absolute valueof gap, multiplied by the sign function:
lgap ¼ sign� log gapj j ð15Þ
where sign is þ1 if gap is more than 0, and �1 if gapis less than 0. One advantage of this function isthat it retains the monotonic property: that is, the
-$2
-$1
$0
$1
$2
$3
$4
$5
$6
$7
$8
$0
$2
$4
$6
$8
$10
$12
$14
Gap
(bn
)
Exp
ort/I
mpo
rt V
alue
(bn
)
Year
China Imports Hong Kong Exports Gap
1996 20042003200220012000199919981997
Figure 2 Trade figure discrepancies: Mainland China’s imports from Hong Kong.
China–Hong Kong trade data Hung-Gay Fung et al
161
Journal of International Business Studies

Table 1 Trade figure discrepancies between China and Hong Kong (2000): China exports
Panel A: China’s exports to Hong Kong 2000 (in millions of US$)
HS
code
Obs. Imports reported by Hong
Kong
Exports reported by
China
Gap
0xxxxx 227 1231.0 837.2 393.8
1xxxxx 119 445.0 405.0 40.0
2xxxxx 456 1893.6 1889.0 4.0
3xxxxx 311 3876.1 1943.3 1932.8
4xxxxx 281 6316.0 2331.1 3984.9
5xxxxx 428 4400.7 3764.2 636.5
6xxxxx 412 17,624.8 7950.9 9673.9
7xxxxx 349 2520.2 3219.1 �698.9
8xxxxx 824 33,076.1 16,881.8 16,194.3
9xxxxx 347 14,531.8 4033.5 10,498.3
Total 3754 85,915.3 43,255.7 42,659.6
Panel B: China export understatement: Top 10 products (in millions of US$)
Rank Imports reported by Hong
Kong
Exports reported by China Gap Product name (from data source)
1 1521.8 46.1 1475.7 Travel containers with outer face of
plastic sheeting or of textile materials
2 987.4 33.9 953.5 Radio-broadcast receivers
3 2779.6 1845.3 934.3 Digital automatic data-processing machines:
parts and accessories
4 960.8 104.8 856.0 Articles for funfair, table or parlor games
5 1191.3 354.8 836.5 Reception apparatus: parts
6 1247.2 412.1 835.1 Digital automatic data-processing machines:
input or output units
7 846.4 48.9 797.5 Telephone sets with cordless handsets
8 1482.8 738.3 744.5 Audio or video recording apparatus:
parts and accessories
9 766.5 74.6 691.9 Handbags, of plastic sheeting or of
textile materials
10 800.9 120.2 680.7 Cameras
Panel C: China’s imports from Hong Kong 2000 (in millions of US$)
HS
code
Obs. Imports reported by China Exports reported by Hong
Kong
Gap
0xxxxx 38 3.7 2.3 1.4
1xxxxx 51 12.8 15.1 �2.3
2xxxxx 80 126.2 104.8 21.4
3xxxxx 197 939.7 674.1 265.6
4xxxxx 186 455.0 390.5 64.5
5xxxxx 306 1009.6 376.6 633.0
6xxxxx 264 837.5 2221.8 �1384.3
7xxxxx 263 540.7 237.5 303.2
8xxxxx 562 3926.2 1847.2 2079.0
9xxxxx 256 744.1 678.0 66.1
Total 2203 8595.5 6547.9 2047.6
China–Hong Kong trade data Hung-Gay Fung et al
162
Journal of International Business Studies

transformation does not alter the order of theoriginal variable (Table 2).22
Rebates and Tariffs: Trade Policy VariablesExport tax rebates are one of the most importantpreferential economic policies that the Chinesegovernment has implemented to encourageexports. In this study, export tax rebates for eachproduct category (rebate) were taken from ExportRebate: Policies and Practices (2000).23 Data onChinese tariffs were collected from the ChineseImports Tariff Schedule.24 Following Fisman andWei (2004), we measured the import stage taxationat the product level, tax_import, as the sum of tariffsand VAT. In addition, Fisman and Wei (2004) findthat import tax evasion takes place by intentionallymisclassifying more highly taxed imported pro-ducts as lower-taxed ones. To account for thispossible practice in our import sample, we followedtheir method and defined average_tax as the averagelevel of tax for all other products in a product’sfour-digit HS product category, weighted by theexport value reported by Hong Kong.
Tax Break: Proxy for Preferential Incentives for FDIAccording to the Chinese Ministry of Commerce,the bulk of Chinese FDI, nearly half, comes fromHong Kong. Many believe that part of the reportedFDI from Hong Kong is in fact capital originatingin Mainland China, but disguised as Hong Kong
investment to make it appear foreign, and thusqualify for a tax break and other benefits accordedto foreign investments. We hypothesized thatround-tripping FDI takes place via the underreport-ing of exports or overreporting of imports. That is,capital originating in China is sent and parked inHong Kong for future return to China as foreigncapital with the help of trade figure manipu-lation. We tested our hypothesis of round-trippingvia trade figure manipulation by using a proxyfor China’s preferential incentives for FDI firms.25
The proxy, tax_break, is the difference between theaverage effective VAT rate for China-funded enter-prises and the effective VAT rate for foreign-fundedenterprises in each industry.26
The effective VAT rate is the ratio of the VATpayable over total sales. Information on paid VAT isavailable separately for China-funded and foreign-funded enterprises. To compute the VAT payable byChina-funded enterprises for each industry, theoutput and the input taxes need to be computedseparately for the current period. The differencebetween them is the amount of VAT payable. Theoutput (input) VAT rate varies from 13% to 17%.The basic rate is set at 17%, with a lower rate at13% for basic foodstuffs, utilities, newspapers, andagricultural production inputs. After deducting theappropriate input tax, the average effective VAT ratefor China-funded enterprises in all industries isestimated to be about 8% of the sales volume.27
Table 1 Continued
Panel D: China import overstatement: top ten products (in millions of US$)
Rank Imports reported by
China
Exports reported by Hong
Kong
Gap Product name (from data source)
1 384.0 48.5 335.5 Monolithic integrated circuit
2 219.1 8.1 211.0 Hybrid integrated circuits
3 166.2 24.0 142.2 Plastics waste: of other plastics
4 146.0 13.7 132.3 Monolithic digital integrated circuit
5 109.3 0.1 109.2 Woven fabrics of synthetic filament yarn: dyed
6 105.4 1.4 104.0 Digital automatic data-processing machines:
storage units
7 208.2 104.8 103.4 Digital automatic data-processing machines:
parts and accessories
8 147.3 51.8 95.5 Optical appliances and instruments: other
9 113.0 25.0 88.0 Electric motors of an output not exceeding
37.5 watts
10 110.5 25.6 84.9 Copper waste and scrap
Panel A reports the trade figures of China exports to Hong Kong reported by the two economies, and the discrepancies are aggregated at the first-digitHS level, in millions of US dollars. Panel B lists the top 10 products (at the six-digit HS level) with the greatest export understatement. Exports, imports,and gap are measured in millions of US dollars. Panel C reports the trade figures of China imports from Hong Kong reported by China, by Hong Kong,and the discrepancies, Gap (China imports less Hong Kong exports), are aggregated at the first-digit HS level, in millions of US dollars. Panel D lists thetop ten products at the six-digit HS level with the greatest import overstatement. Exports, imports, and gap are measured in millions of US dollars.
China–Hong Kong trade data Hung-Gay Fung et al
163
Journal of International Business Studies

The Chinese government has also implemented avariety of tax incentives to attract FDI. For example,technology transfer and technological develop-ment by foreign enterprises and enterprises withforeign investments are exempt from VAT. Foreign-funded enterprises invested in projects in theexempt categories are entitled to a full refund ofthe VAT on Chinese-made equipment purchased.Thus we estimated the effective VAT rate forforeign-funded enterprises in each industry as theratio of the total VAT paid by these enterprises overtotal sales of these enterprises, where sales and VATsdata for each industry are obtained from the ChinaStatistical Yearbook.
Finally, we constructed tax_break for each indus-try as the average effective VAT rate for China-funded enterprises (8%) less the effective VAT ratefor foreign-funded enterprises in the correspondingindustry. That is, a firm enjoys tax benefits whenthe value of tax_break is positive.
State CapitalUsing data from the China Statistical Yearbook, weconstructed a variable, state, for each of the 29
manufacturing industries in our sample to measurethe percentage of state capital (e.g., state-ownedenterprises) over the total non-foreign capital(the sum of state and private capital). We use thisvariable to test whether a higher level of stateownership is associated with greater incentives forChinese firms misreporting their trade figures.
Control Variables28
In addition to the key hypothesis-testing variables,we use several control variables to account for thesystematic differences in our sample that poten-tially affect the gap. First, size, measured by thetotal value of exports (imports) for each industryfor the export (import) sample, is used to accountfor the possibility that the greater the size ofan industry, the greater the amount of exportor import misreporting. The natural logarithm ofsize is used in all regressions. Second, foreign isconstructed as the percentage of sales of foreign-funded enterprises over the industry total sales (thesum of sales of all enterprises – state, private, andforeign – in an industry) in separating the possibledifferent impact of trade figure misreporting by
Table 2 Definition of variables
Variable Definition
gap The difference between the import value of one party and the export value of the counterparty, that is, Hong Kong
imports less China exports for China exports analysis; China imports less Hong Kong exports for China imports
analysis.
sgap The gap divided by the average of one party’s exports and imports of the counterparty.
lgap The natural logarithm of the absolute value of gap, multiplied by the sign function, where sign is equal to +1 if gap is
greater than 0, and �1 if gap is less than 0.
rebate The rate that Chinese government returns to exporting enterprises for the value-added tax (VAT) they pay in the
production and distribution process.
tax_break* The difference between the average VAT rate and the effective VAT rate for FDI firms.
tax_import The sum of tariffs and VAT.
state* The percentage of state capital over non-foreign capital (the sum of state capital and private capital).
average_tax The average level of tax for all other products in a product’s four-digit HS product category, weighted by the exports
value reported by Hong Kong.
Size* The total value of exports of an industry for the export sample and the total value of imports of an industry for the
import sample. The natural logarithm of size is used in the regressions.
foreign* The percentage of sales of foreign-funded enterprises over industry total sales (the sum of sales of state, private, and
foreign enterprises).
Complex* A dummy variable, which equals 1 if the industry produces complex products, and 0 otherwise. Specifically,
complex is equal to 1 for the following industry groups: communication equipment; computers and other electronic
equipment; electrical machinery and equipment; pharmaceuticals; petroleum, coking and processing of nuclear
fuel; chemical products; special purpose machinery; and transport equipment.
*Denotes variables taken at the industry level; others are taken at the product level.
China–Hong Kong trade data Hung-Gay Fung et al
164
Journal of International Business Studies

foreign-funded enterprises from that by state-owned enterprises, since foreign-funded enterpriseshave less incentive for trade figure misreporting.29
Third, a dummy variable, complex, is added tocontrol for possible correlation between productcomplexity and tax incentives; it is equal to 1 if theindustry produces complex products and 0 other-wise. Specifically, complex is equal to 1 for productsin the following industries: communication equip-ment; computers and other electronic equipment;electrical machinery and equipment; pharmaceuti-cals; petroleum, coking and processing of nuclearfuel; chemical products; special-purpose machin-ery; and transport equipment.
Summary StatisticsTable 3 provides the summary statistics for variablesin the sample of Chinese exports to Hong Kong andChinese imports from Hong Kong. A total of 3754observations in six-digit HS product categories withcomplete data are included in the export sample.Panel A shows that the average export amountof a product category reported by China is $11.52
million, compared with $22.89 million reported byHong Kong. The understatement is an export gap(Hong Kong imports less Chinese exports) of $11.37million. The average export rebate rate is 14%, witha maximum of 17% and a minimum of zero. Thissuggests that some export products obtain a fullrefund of the VAT, whereas others receive a fractionof the refund, or nothing.
The average tax_break is 5%, suggesting that theeffective VAT rate is 3% on average for the FDI firms,implying a five-percentage-point saving over theaverage effective VAT rate for all Chinese firms,which is in general 8%.30 The percentage of statecapital, state, is on average 65% of the total non-foreign capital, whereas foreign sales, foreign, is onaverage 32% of the industry total sales. The averagesize of an exporting industry is $11.97 billion. Aboutone-fourth (25%) of export products are classified ascomplex manufactured products.
Panel B provides the descriptive statistics for asample of 2203 observations in six-digit HS productcategories for the Chinese import data. The averageimport amount of a product category reported by
Table 3 Summary statistics (China–Hong Kong 2000)
Mean Median Max Min s.d.
Panel A: China exports (N¼3754)
Hong Kong imports (millions) 22.89 1.07 2779.59 0.00 103.81
China exports (millions) 11.52 0.78 1845.26 0.00 58.18
gap (millions) 11.37 0.11 1475.70 �856.70 68.72
sgap 0.28 0.34 2.00 �2.00 1.11
lgap 3.76 11.62 21.11 �20.57 13.27
rebate 0.14 0.15 0.17 0.00 0.03
tax_break* 0.05 0.06 0.08 �0.01 0.01
state* 0.65 0.66 0.99 0.23 0.22
size* (billions) 11.97 6.38 37.43 0.30 11.36
foreign* 0.32 0.27 0.72 0.01 0.16
complex* 0.25 0.00 1.00 0.00 0.43
Panel B: China imports (N¼2203)
China imports (millions) 3.90 0.29 384.00 0.00 16.57
Hong Kong exports (millions) 2.97 0.10 386.96 0.00 16.51
gap (millions) 0.93 0.06 335.52 �350.96 16.46
sgap 0.50 0.75 2.00 �2.00 1.22
lgap 4.50 11.03 19.63 �19.68 11.76
tax_import 0.34 0.33 0.84 0.13 0.09
tax_break* 0.05 0.06 0.08 �0.01 0.01
state* 0.60 0.58 0.99 0.23 0.22
average_tax 0.34 0.33 0.84 0.13 0.09
size* (billions) 10.31 5.03 36.48 0.16 9.84
foreign* 0.35 0.33 0.72 0.01 0.16
complex* 0.28 0.00 1.00 0.00 0.45
*Denotes variables taken at the industry level; others are taken at the product level.
China–Hong Kong trade data Hung-Gay Fung et al
165
Journal of International Business Studies

China is $3.9 million, compared with $2.97 millionreported by Hong Kong. The overstatement isan import gap (Chinese imports less Hong Kongexports) of $0.93 million. The average import taxrate (tariff rate plus VAT rate on the imports) is 34%,with a maximum of 84% and a minimum of 13%.The average import tax rate for other productswithin the same four-digit category (i.e., average_tax) is also 34%. The average tax_break is 5%, aresult similar to that of the export sample. The statecapital, state, is averaged at 60% of the total non-foreign capital for all industries, whereas foreignsales, foreign, account for an average of 35% of thetotal industry sales, which is similar to that for theexport sample. The average size of an importingindustry, size, is $10.31 billion. Over one-fourth(28%) of import products are classified as complexmanufactured products.
EMPIRICAL ANALYSISEmpirical analysis is conducted based on thefollowing general specification:
sgapiðlogapiÞ ¼aþ b�trade policyi
þ g�tax breaki þ l�statei
þ d�control variablesi þ ei
ð16Þ
where sgap and lgap are the dependent variables,and i refers to a product category. The key hypoth-esis-testing variables are the trade policy variable,FDI preferential policies (tax_break), and state capital(state). Specifically, the trade_policy variable refers toeither the export tax rebate (rebate) for the exportsample, or the import_tax, defined as the sum oftariffs and VAT for the import sample.
For the export sample, we test whether exportunderstatement is related to rebate, tax_break, andstate. Our model predicts a negative sign for baccording to Hypothesis E1, a positive sign for gaccording to Hypothesis E2, and a positive sign forl according to Hypothesis E3. Panel A of Table 4reports the results of the regression for the exportsample. Results with sgap as the dependent variableare summarized in Models 1 and 2, where severalcontrol variables are included in Model 2 in theregression analysis. All t-statistics in the regressionare based on robust standard errors, accountingfor the clustering of standard errors at the industrylevel.31
Results from both models support our Hypoth-eses E1, E2, and E3, which are related to the exportsample. Consistent with the theoretical predic-tions, the sgap is significantly negatively associated
with export tax rebates, suggesting that under-statement is less severe for products with a higherexport tax rebate incentive (i.e., in supportof Hypothesis E1). For example, the tax rebatecoefficient in Model 1 is �2.52, implying that aone standard deviation increase in rebate will betranslated into a reduction of 0.08 (�2.52�0.03) insgap, or $1.4 million [�0.08� ($22.89 millionþ$11.52 million)/2] in gap, on average, for a productcategory, holding other things constant, where$22.89 million and $11.52 million are, respectively,the Hong-Kong-reported import and China-reportedexport figures for an average product category(Panel A of Table 3) The tax_break coefficient(12.39) is positive and significant, confirming ourprediction that understatement is greater for pro-ducts with a higher tax break for foreign invest-ments. The result implies that, for a one standarddeviation increase in tax_break, there is an asso-ciated increase of 0.12 (12.39�0.01) in sgap, or$2.06 million [0.12� ($22.89 millionþ$11.52million)/2] in gap, on average, for a product cate-gory, holding other things constant. Thus, for thetotal export sample of 3754 product categories,the increase in export understatement associatedwith one standard deviation increase in tax_breakis a sizable $7.73 billion ($2.06 million�3754).These results are consistent with the conjecturethat firms tend to report lower exports and takeadvantage of preferential FDI policies throughround-tripping (i.e., in support of Hypothesis E2).When the state variable is used to examine whetherthe magnitude of export understatement is greaterfor sectors with high levels of state ownership,the results show that the sign for this variable ispositive and statistically significant (i.e., in supportof Hypothesis E3).32
For a robustness check, we repeated the same setof tests using lgap as the dependent variable inModels 3 and 4. Results presented in Tables 3 and 4show that this alternative dependent variable yieldssimilar results for the three variables of interestwith higher adjusted R2 than Models 1 and 2.Overall, results in Panel A of Table 4 suggest thatChinese export firms seem to have engagedthrough round-tripping in a tradeoff betweenthe cost of losing tax rebates if they underreportexports values and the benefits of qualifying forpreferential FDI tax breaks.
For the import sample, our model predicts anegative sign for b (tax_import) according to Hypo-thesis I1, a positive sign for g (tax_break) accordingto Hypothesis I2, and a positive sign for l (state)
China–Hong Kong trade data Hung-Gay Fung et al
166
Journal of International Business Studies

according to Hypothesis I3. Panel B of Table 4reports the regression results. The negative bcoefficient of Model 1 (�1.27) confirms thattax_import is negatively related to import over-statement (i.e., in support of Hypothesis I1). That
is, a one standard deviation increase in tax_importwill have a reduction of 0.12 (�1.30�0.09) inimport overstatement (sgap). This result lendssupport to our tax-induced regulatory arbitragemodel, in which firms try to minimize importtariffs while round-tripping. Moreover, as ourtheoretical model predicts, the coefficient g oftax_break is found to be positive and stronglysignificant even after controlling for tax_import(supporting Hypothesis I2). The result impliesthat for a one standard deviation increase intax_break, there is an associated increase of 0.08(7.97�0.01) in sgap, or $0.27 million [0.08� ($3.9millionþ$2.97 million)/2] in gap, on average, for aproduct category, holding other things constant.Thus, for the total import sample of 2203 productcategories, the increase of import overstatementassociated with one standard deviation increase intax_break across all product groups is a significantamount of $594.81 million ($0.27 million�2203).The coefficient for the state variable (0.82) inModel 1 is significant. Results for Model 2 includingcontrol variables are similar to those for Model 1,indicating robustness in these results. In Models3–4, where lgap is the dependent variable, similarresults obtain for all variables in terms of directionand significance with higher adjusted R2 thanModels 1 and 2.
To summarize, the results in Panel B are consis-tent with our tax-induced regulatory arbitragehypothesis. While importers have incentive toreport lower values of imports to evade tariffs andtaxes, they need to balance the benefits obtainingfrom import overreporting in a tax-induced regu-latory arbitrage through round-tripping. Overall,evidence seems to support the tradeoff hypo-thesis that importers weigh the benefits of FDIincentives (if they report more than the actualvalue of imports) against the costs of higher importtariffs.33
Robustness Test: Hong Kong (2004)As a robustness check, we examined China–HongKong trade data for 2004, when the Closer Econo-mic Partnership Arrangement (CEPA), which aimsto foster a closer economic relationship betweenMainland China and Hong Kong, took effect.The pact promises to increase access to mainlandmarkets for the Hong Kong service industries, to cuttariffs on Hong Kong-manufactured exports toChina, and to improve bilateral cooperation intrade and investment between Mainland China andHong Kong. CEPA was expected to have an impact
Table 4 Multivariate regression results (China–Hong Kong 2000)
Model Dependent variable
sgap lgap
1 2 3 4
Panel A: China exports (N¼3754)
Constant �0.30 �0.30 �6.59 �6.99
(t-stat.) �1.29 �0.91 �1.96** �1.51
rebate �2.52 �2.61 �16.45 �24.21
�2.63*** �2.07** �1.66* �1.88*
tax_break 12.39 17.39 180.18 195.66
3.82*** 3.46*** 4.55*** 3.40***
state 0.47 0.35 5.41 4.63
3.50*** 2.19** 2.64*** 1.65*
size �0.01 0.21
�0.23 0.26
foreign �0.49 �0.37
�1.60 �0.11
complex 0.22 1.76
1.43 0.82
Adj. R2 (%) 2.35 3.07 2.54 2.82
F-value 10.65*** 6.43*** 14.13*** 8.36***
Panel B: China imports (N¼2203)
Constant 0.14 �0.35 0.68 �4.55
(t-stat.) 0.40 �0.88 0.18 �1.14
tax_import �1.30 �1.48 �14.31 �11.38
�1.95** �2.34** �2.34** �1.96**
tax_break 7.97 8.91 82.14 94.54
2.03** 2.05** 1.85* 2.24**
state 0.65 0.56 7.44 6.18
1.98** 1.71* 2.00** 1.84*
average_tax 0.31 �2.14
0.44 �0.37
size 0.13 1.30
1.81* 2.19**
foreign �0.22 �1.09
�0.60 �0.32
complex �0.07 �0.04
�0.45 �0.03
Adj. R2 (%) 2.62 3.22 3.55 4.47
F-value 3.01*** 4.67*** 5.11*** 6.03***
Panel A shows the results for China’s exports to Hong Kong, and Panel Bshows the results for China imports from Hong Kong, in 2000. All t-statistics, reported immediately beneath the coefficient estimates, arebased on robust standard errors accounting for the clustering of standarderrors at the industry level.***, **, and * denote significance at the 1%, 5% and 10% level,respectively.
China–Hong Kong trade data Hung-Gay Fung et al
167
Journal of International Business Studies

on the trade and investment behavior of firms inboth parties to the agreement. We hypothesize thatif our tax-induced regulatory arbitrage model withround-tripping is robust, results found previouslyin the above analyses on import overstatementshould persist even after CEPA went into effect.
As shown in Panel A of Table 5, the average valueof the exports of a product category to Hong Kongreported by China is $26.53 million, $3.85 millionlower than the figure reported by Hong Kong andlower than the understatement ($11.37 million) in2000. Panel B shows that the average value ofimports reported by China is $7.13 million, whileHong Kong exports reported total $3.73 million,approximately half the level reported by China.The average import gap for the import sample is$3.4 million, about four times the overstatementin 2000.
These data suggest that the import overstatementproblem has become more severe, but the exportunderstatement problem has lessened since 2000.The substantial decrease in import tariffs and taxesmay explain the widening import gap when the
average import tax was reduced from 34% in 2000(Table 3B) to 27% in 2004 (Table 5B). Likewise, themaximum tax_import was reduced to 52% in 2004,32 percentage points lower than that in 2000 (84%in Table 3B), reflecting China’s efforts to reduceimport tariffs upon its entry to the WTO.
Panel A of Table 6 presents the regression resultsfor the export sample for 2004. Model 1 reports thetest results on rebate, tax break, and state variables,and Model 2 reports the results with controlvariables. The results are consistent with those forthe sample for 2000. All coefficients on rebate,tax_break, and state have the expected signs and aresignificant in both models, regardless of whethersgap or lgap is used as the dependent variable.
Could trade and tax policies explain the pheno-menal import overstatement in 2004? Panel Bof Table 6 presents the regression results for theimport sample for 2004. Coefficients on tax_importare consistently negative and strongly significantfor all specifications, regardless of whether sgapor lgap is used as the dependent variable. Thecoefficients of tax_break are positive and significant
Table 5 Summary statistics (China–Hong Kong 2004)
Mean Median Max Min s.d.
Panel A: China exports (2004) (N¼3720)
Hong Kong imports (millions) 30.38 1.46 7069.92 0.00 181.87
China exports (millions) 26.53 1.47 7708.93 0.00 198.64
gap (millions) 3.85 0.02 1250.71 �3765.90 108.67
sgap 0.09 0.07 2.00 �2.00 1.06
lgap 1.14 9.70 20.95 �22.05 14.00
rebate 0.12 0.13 0.17 0.00 0.03
tax_break* 0.06 0.06 0.07 �0.01 0.01
state* 0.54 0.56 1.00 0.14 0.21
size* (billions) 28.21 12.91 106.12 0.51 29.69
foreign* 0.45 0.42 0.86 0.01 0.16
complex* 0.25 0.00 1.00 0.00 0.43
Panel B: China imports (2004) (N¼1208)
China imports (millions) 7.13 0.49 872.20 0.00 36.38
Hong Kong exports (millions) 3.73 0.12 295.01 0.00 19.48
gap (millions) 3.40 0.13 670.65 �275.22 30.28
sgap 0.64 0.93 2.00 �1.99 1.17
lgap 5.63 11.75 20.32 �19.43 11.80
tax_import 0.27 0.27 0.52 0.13 0.06
tax_break* 0.06 0.06 0.08 �0.01 0.01
state* 0.48 0.39 1.00 0.14 0.23
average_tax 0.27 0.27 0.52 0.13 0.06
size* (billions) 24.48 13.64 100.18 0.26 26.47
foreign* 0.49 0.48 0.82 0.00 0.16
complex* 0.25 0.00 1.00 0.00 0.43
China–Hong Kong trade data Hung-Gay Fung et al
168
Journal of International Business Studies

in Models 1–4. The import overstatement isstrongly positively related to state ownership inall models. These results are consistent with ourhypothesis that tax-induced regulatory arbitragehas been prevalent in China via round-tripping, a
trade-tax-investment strategy in a market wherethere are impediments, and round-tripping appearsto be associated with enterprises where stateownership is greater.
Further Test of the Impact of CEPA onChinese Firms’ Behavior34
Under CEPA, import tariffs on certain commoditieswere to start being phased out in 2004, and allimport tariffs were to be abolished by the end of2006. Phase I product categories that would haveimport tariffs removed in 2004 include electricaland electronic products, plastic articles, textilesand clothing, chemical products, pharmaceuticals,clocks and watches, cosmetics, and metal products(Fung & Zhang, 2007). This phase-out arrangementprovides us with an opportunity to test for anyimpact from CEPA on the practice of import over-reporting. Specifically, we expect the removal oftariffs to increase import overstatement, becausefirms no longer have to worry about the additionalcost of inflating import values. Instead, firms wouldtend to maximize the overstatement so that theycould send more money offshore for round-trip-ping. By comparing the imports overstatementfigure of Phase I products for 2000 to that for 2004,we can estimate the overall change in overreportingwhen all products became tariff-free in 2006.
Panel A of Table 7 reports the changes in theimport gap for the entire sample, Phase I sample,and non-Phase I sample. The import gap, onaverage, increased significantly in both groups, asindicated by the significant t-tests (in the lastcolumn). The increase in the import gap for PhaseI sample, $6.59 million, is particularly noteworthy,because it is more than five times the change inthe import gap ($1.25 million) of the non-Phase Isample.
Panel B of Table 7 shows the result for theregression, where the dependent variable is thechange in the import gap between 2000 and 2004.Model 1 uses the change in sgap as the dependentvariable, and includes the change in import tax(tax_import), the change in tax_break, and the changein state as independent variables. Model 2 includesall variables in Model 1 with additional controlvariables (the change in average_tax, the change insize, and the change in foreign). Models 3 and 4 havethe change in lgap as the dependent variable.Results show a negative and significant effect ofthe change in tax_import across all four models, anda positive and significant coefficient for the changein tax_break, change in state, and change in size.
Table 6 Multivariate regression results (China–Hong Kong 2004)
Model Dependent variable
sgap lgap
1 2 3 4
Panel A: China exports (N¼3720)
Constant �0.38 �0.59 �5.64 �9.19
(t-stat.) �1.49 �1.75* �1.69* �2.15**
rebate �3.26 �3.42 �26.80 �33.04
�4.21*** �3.42*** �3.02*** �3.00***
tax_break 10.09 8.21 120.46 72.71
3.76*** 1.89* 3.17*** 1.71*
state 0.45 0.55 5.17 6.44
2.35** 1.81* 2.02** 1.73**
size 0.08 1.13
1.33 1.42
foreign �0.12 2.73
�0.46 0.76
complex �0.17 �1.80
�0.90 �0.74
Adj. R2 (%) 1.98 2.22 1.19 1.56
F-value 12.30*** 7.44*** 7.64*** 7.20***
Panel B: China imports (N¼1208)
Constant �0.67 �0.99 �7.53 �9.77
(t-stat.) �1.24 �1.91* �1.37 �1.65*
tax_import �2.60 �4.10 �27.18 �33.14
�2.99*** �2.39** �3.43*** �2.26**
tax_break 22.89 17.91 226.65 188.55
4.10*** 1.85* 3.71*** 1.87**
state 1.27 1.09 13.90 11.90
3.74*** 3.40*** 3.88*** 3.40***
average_tax 1.87 8.74
1.13 0.60
size 0.17 1.46
1.77* 1.73*
foreign �0.33 �3.91
�0.73 �0.86
complex �0.23 �1.88
�1.02 �0.76
Adj. R2 (%) 10.91 11.91 12.10 12.80
F-value 11.79*** 7.23*** 11.04*** 7.90***
Panel A contains results for Chinese exports to Hong Kong in 2004, andPanel B contains results for Chinese import from Hong Kong in 2004. Allt-statistics, reported immediately beneath the coefficient estimates, arebased on robust standard errors accounting for the clustering of standarderrors at the industry level.***, **, and * denote significance at the 1%, 5% and 10% level,respectively.
China–Hong Kong trade data Hung-Gay Fung et al
169
Journal of International Business Studies
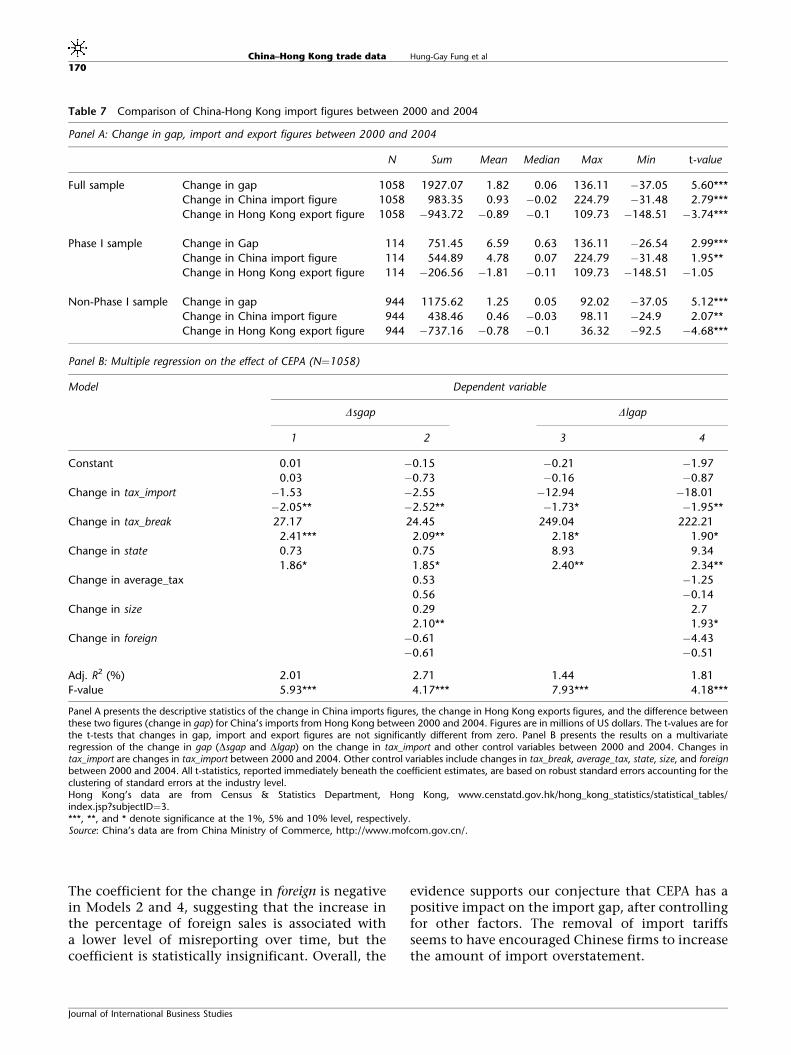
The coefficient for the change in foreign is negativein Models 2 and 4, suggesting that the increase inthe percentage of foreign sales is associated witha lower level of misreporting over time, but thecoefficient is statistically insignificant. Overall, the
evidence supports our conjecture that CEPA has apositive impact on the import gap, after controllingfor other factors. The removal of import tariffsseems to have encouraged Chinese firms to increasethe amount of import overstatement.
Table 7 Comparison of China-Hong Kong import figures between 2000 and 2004
Panel A: Change in gap, import and export figures between 2000 and 2004
N Sum Mean Median Max Min t-value
Full sample Change in gap 1058 1927.07 1.82 0.06 136.11 �37.05 5.60***
Change in China import figure 1058 983.35 0.93 �0.02 224.79 �31.48 2.79***
Change in Hong Kong export figure 1058 �943.72 �0.89 �0.1 109.73 �148.51 �3.74***
Phase I sample Change in Gap 114 751.45 6.59 0.63 136.11 �26.54 2.99***
Change in China import figure 114 544.89 4.78 0.07 224.79 �31.48 1.95**
Change in Hong Kong export figure 114 �206.56 �1.81 �0.11 109.73 �148.51 �1.05
Non-Phase I sample Change in gap 944 1175.62 1.25 0.05 92.02 �37.05 5.12***
Change in China import figure 944 438.46 0.46 �0.03 98.11 �24.9 2.07**
Change in Hong Kong export figure 944 �737.16 �0.78 �0.1 36.32 �92.5 �4.68***
Panel B: Multiple regression on the effect of CEPA (N¼1058)
Model Dependent variable
Dsgap Dlgap
1 2 3 4
Constant 0.01 �0.15 �0.21 �1.97
0.03 �0.73 �0.16 �0.87
Change in tax_import �1.53 �2.55 �12.94 �18.01
�2.05** �2.52** �1.73* �1.95**
Change in tax_break 27.17 24.45 249.04 222.21
2.41*** 2.09** 2.18* 1.90*
Change in state 0.73 0.75 8.93 9.34
1.86* 1.85* 2.40** 2.34**
Change in average_tax 0.53 �1.25
0.56 �0.14
Change in size 0.29 2.7
2.10** 1.93*
Change in foreign �0.61 �4.43
�0.61 �0.51
Adj. R2 (%) 2.01 2.71 1.44 1.81
F-value 5.93*** 4.17*** 7.93*** 4.18***
Panel A presents the descriptive statistics of the change in China imports figures, the change in Hong Kong exports figures, and the difference betweenthese two figures (change in gap) for China’s imports from Hong Kong between 2000 and 2004. Figures are in millions of US dollars. The t-values are forthe t-tests that changes in gap, import and export figures are not significantly different from zero. Panel B presents the results on a multivariateregression of the change in gap (Dsgap and Dlgap) on the change in tax_import and other control variables between 2000 and 2004. Changes intax_import are changes in tax_import between 2000 and 2004. Other control variables include changes in tax_break, average_tax, state, size, and foreignbetween 2000 and 2004. All t-statistics, reported immediately beneath the coefficient estimates, are based on robust standard errors accounting for theclustering of standard errors at the industry level.Hong Kong’s data are from Census & Statistics Department, Hong Kong, www.censtatd.gov.hk/hong_kong_statistics/statistical_tables/index.jsp?subjectID¼3.***, **, and * denote significance at the 1%, 5% and 10% level, respectively.Source: China’s data are from China Ministry of Commerce, http://www.mofcom.gov.cn/.
China–Hong Kong trade data Hung-Gay Fung et al
170
Journal of International Business Studies

CONCLUSIONThis study examines several empirical irregularities(export underreporting, import overreporting, andthe significant presence of round-tripping FDI) inthe trade and investment flow statistics pertainingto China. Theoretical models are developed toexplain these irregularities by hypothesizing tax-induced regulatory arbitrage at work in a marketwith various structural impediments via tradefigure manipulation and round-tripping FDI. Ourmodels demonstrate a tax–trade–investment strat-egy manifested in round-tripping arbitrage througha nexus of market imperfections, synthesizingthe stylized patterns with regard to trade figurediscrepancies and round-tripping in China.
Empirical results based on China’s exports andimports data with Hong Kong provide strongsupport for all six hypotheses that we tested onthe pattern of irregularities:
(1) Export understatement is negatively related toexport tax rebates (Hypothesis E1).
(2) Import overstatement is negatively related toimport tariffs (Hypothesis I1).
(3) The underreported amount of export earnings ispositively related to variables that proxy for taxbreaks offered to foreign investors (HypothesisE2), while the overreported amount of importsis also positively related to variables that proxyfor tax breaks offered to foreign investors(Hypothesis I2).
(4) Export understatement and import overstate-ment appear to be significant in the Chinesestate-owned enterprises (Hypotheses E3 and I3).
The empirical results are robust to different speci-fications with various control variables.
Consistent with Hypothesis E1, export under-statement is found to be negatively related toexport tax rebates, suggesting that the exportingfirms try to reduce export understatement in orderto reap more gains from tax rebates when exporttax rebate is higher. The empirical result suggeststhat a firm’s decision to underreport exports isbased on the expected tradeoff between the benefitsof tax breaks on its own investment coming fromabroad (from round-tripping) and the loss of theexport tax rebate if the firm underreports exports.Our results also show that Chinese firms system-atically underreport exports to Hong Kong, eventhough the export tax rebates do offset some of theincentive to do so. The analysis supporting Hypoth-esis E2 is consistent with the conjecture that aportion of FDI (i.e., the round-tripping FDI) in
China may be in part due to the underreporting ofChina’s export earnings. We believe that exportunderreporting will continue as long as exportingfirms are motivated to send money offshore.
On the import side, we find that import over-statement is linked to trade policy (Hypothesis I1)and the preferential incentives for firms involvedin FDI (Hypothesis I2), providing support for theregulatory arbitrage for Chinese firms to capturethe tax differential between foreign and domesticinvestments. These results are consistent with theconjecture that money sent offshore resulting fromthe overstatement of imports will return to Chinaas FDI from a foreign entity. Overall, our resultssuggest that Chinese importing firms evaluate thetradeoffs between the benefits of tax breaks onforeign investment from round-tripping and thecost of import tariffs if they overreport imports. Webelieve regulatory arbitrage will continue as long asmarket impediments such as currency inconvert-ibility and capital controls exist in China.
This paper contributes to the literature in twoimportant ways. First, it provides a crucial linkbetween China’s trade figure discrepancies and itsFDI (from round-tripping). That is, it contributes tothe traditional trade and FDI theories in explainingthe stylized patterns that cannot be explainedcompletely by existing theories. Second, this paperdemonstrates how MNEs utilize tax-inducedregulatory arbitrage to circumvent market imper-fections in a developing economy where thereare preferential incentives accorded by the hostcountry to foreign investors. It also shows that,under certain imperfect market conditions, prefer-ential treatment for foreign investors may attractcapital inflows but at the risk of being used forother unintended purposes by domestic as well asforeign firms.
Our results indicate that state-owned enter-prises appear to engage in significant export under-reporting and import overreporting, implying ahigh possibility of outflow of state capital throughtrade transactions. This situation warrants closeexamination by Chinese policymakers, if mitigat-ing the outflow of state capital is a top policypriority.
A caveat to our study is that results are basedonly on the manufacturing industries. Despitethe importance of the manufacturing sector in theChinese economy, it is possible that foreign hotmoney flowing into China ends up in other sectorsof the economy, for example, the real estate market.Our study does not examine the impact of these
China–Hong Kong trade data Hung-Gay Fung et al
171
Journal of International Business Studies

short-term capital flows, which warrants furtherstudy. In addition, the gradual removal of differ-ential tax treatment between domestic and foreignfirms is expected to have an impact on FDI inChina, which we leave for future research.
ACKNOWLEDGEMENTSWe are grateful to Louis T. W. Cheng, Joseph Lau,Wai-Kin Leung, Kui-Wai Li, Dileep Mehta, three anony-mous reviewers, Lee Radebaugh (Editor), and LorraineEden (Editor-in-Chief) for valuable comments andsuggestions, and Stephen M. Miller for assistance indata collection. We also thank the Editor-in-Chief forsuggestions on the final title of the paper.
NOTES1Bermuda, British Virgin Islands, Cayman Islands,
Hong Kong, Mauritius, and Samoa accounted for 58%of China’s FDI inflows in 2006 (China StatisticalYearbook, 2007).
2Likewise, Rugman (1985) argues that verticalintegration, transfer pricing, and quality control areexamples of market imperfections, which lead tointernalization or multinational hierarchical activity.
3Some studies list other reasons for round-tripping,such as leaving money overseas to reduce the currencyrisk due to inconvertibility of the Chinese currency,and protecting the property rights (ownership) ofexport earnings (Fung, Leung, & Zhu, 2004; Xiao,2004). We discuss other motivations in the TheoreticalModels and Hypotheses section.
4While the extant literature has documentedsignificant trade misinvoicing for China trade, there isa dearth of analysis of the factors driving this pheno-menon. For recent studies, see Kar and Cartwright-Smith (2008) and the Christian Aid Report (ChristianAid, 2009). Kar and Cartwright-Smith find highvolumes of illicit flows from China, and call for anin-depth analysis of factors driving such outflowsfrom China.
5Dunning (1977, 1979) proposes an eclecticparadigm of international production, known as theOLI framework in the international business literature,combining ownership – (O), location – (L), andinternalization – (I) specific advantages of an MNE toexplain why FDI occurs. The OLI framework sug-gests that FDI occurs if the MNE has a comparativeadvantage in these one of these three sets of factors.For example, among other things, China’s preferentialtax treatment of foreign investors represents anattractive location- or country-specific advantage forMNEs. For this paper, however, the OLI framework,which was originally intended for MNEs investing in
a foreign country, is not strictly applicable, becauseround-tripping FDI originates from Chinese firms. Werefer to this framework here only for referencing theconcepts encapsulated in these sets of “advantages”,which are commonly referred to in the FDI literature.
6The economy of scale in Krugman’s (1979)new trade theory is an ownership or firm-specificadvantage.
7Market impediments can also include non-economicfactors. Filatotchev, Strange, Piesse, and Lien (2007)find that cultural factors, historic ties, and equity stakesplay an important role in affecting the decision toundertake FDI in emerging markets.
8The creation of the eurodollar market was the resultof market impediments caused by government policy,that is, the Interest Equalization Tax imposed in 1963by the US government on foreign investors. Similarly,Fung et al. (2004) suggest that the non-deliverableforward market for the Chinese currency is the result ofinconvertibility of the Chinese currency.
9Aliber (1978) shows how arbitrageurs exploitdifferential rates in the interest rate and foreignexchange markets in a covered interest arbitrage.
10Transfer pricing entails shifting the corporateprofits from a high- to a low-tax jurisdiction throughthe manipulation of prices of goods and servicescharged for intra-firm transactions. In a typicaltransfer-pricing scheme, affiliates of an MNE chargeeach other a lower than the fair market price for intra-firm transactions. This type of “misinvoicing within thesame invoice” as a matter of agreement betweenbuyer and seller as a form of transfer pricing will notproduce any discrepancy in the reported export andimport values, as pointed out by Kar and Cartwright-Smith (2008). Thus transfer pricing cannot be used toexplain the discrepancies in reported trade figures inthis study, which is the main focus of the currentstudy.
11Recent studies, such as Kar and Cartwright-Smith(2008) and the Christian Aid Report (Christian Aid,2009), using different methodologies, attempt to quan-tify trade mispricing in China as an estimate of illicitfinancial outflows. Since the focus of the current study issolely on trade misinvoicing, whereas previous studieson trade mispricing include all types of illicit financialflows, estimates from the current study are not strictlycomparable with those from previous studies.
12For tax rebate policy changes in China, see Cui(2003).
13It is noted that the relaxation of this assumptionwill not affect the outcome of the theoretical model,because the amount of export earnings understate-ment, x, in Eq. (1) can simply be adjusted by a fraction
China–Hong Kong trade data Hung-Gay Fung et al
172
Journal of International Business Studies

that indicates the percentage of underreportedearnings returning to China.
14Should there be any search fees for the agent, theycan easily be incorporated into the model in Eq. (1).The fee is a fixed cost that does not vary withthe dependent variable in Eq. (1), so leaving it out ofthe model will not significantly affect the result.
15In this paper, the terms “understatement”and “underreporting” (“overstatement” and “over-reporting”) have the same meaning. However, incontexts where confusion could arise, we carefullychoose the term that clarifies its meaning.
16The penalty, P, can be defined as a variable with aprobability of being caught times the penalty ratherthan a fixed dollar amount. Because the probability ofbeing caught does not change with the dependentvariable in the model, and will not affect the modelsolution, we use a fixed penalty amount in the interestof simplicity. We thank an anonymous reviewer forsuggesting this clarification.
17If the marginal cost of penalty is high enough, thedenominator on the right-hand side of the equation issure to be negative.
18Relaxation of the assumption that not all of theunderstated amount returns to China as FDI does notaffect our results. If a partial amount of the under-statement returns to China, the two results (Results 1and 2) will still hold as before, with a slightly differentscaling factor. (See also footnote 11.)
19The WITS website is http://wits.worldbank.org. Inaddition to the United Nations Statistical Division’sCommodity Trade (COMTRADE) database (http://data.un.org/wiki/ComTrade.ashx), WITS can get accessto: the UNCTAD Trade Analysis Information System,which contains information on imports and varioustariffs and non-tariff measures for 119 countries; theWorld Trade Organization (WTO) Integrated Data-base, which contains imports by commodity and bypartner country, and MFN applied tariffs for over80 countries; and the Consolidated Tariff Scheduledatabase, which contains WTO bound tariffs, initialnegotiating rights, and other indicators.
20In estimating the global volume of trade mispri-cing, Kar and Cartwright-Smith (2008) exclude theHong Kong data from the database, IMF Direction ofTrade Statistics (DOTS), because trade partner coun-tries of China often mislabeled the exports originatingin Hong Kong as coming from China and vice versa.This “mislabeling” problem arising from the HongKong re-export trade has severe implications forestimating the trade mispricing between China andits trading partners (not Hong Kong). However, thispotential problem does not affect the current study,
since our focus is on the trade mispricing (morespecifically, misinvoicing) between China and HongKong, and not between China and other tradepartners. There is no reason to believe that such“mislabeling” of Hong Kong’s exports by China’s tradepartners will systematically bias our results in one wayor another. Moreover, the COMTRADE databaseprovides detail entrepot trade by product and bytrading partner country, allowing us to exclude HongKong’s re-export trade from our sample. Other tradedatabases such as the IMF DOTS, which recordaggregated data at national or regional group level,would not allow separation of the re-exports fromdirect exports/imports.
21Kar and Cartwright-Smith (2008) estimate a totalof trade mispricing at $253.26 billion in 2004 forall China’s trading partners excluding Hong Kong.Our estimate of $21.22 billion (the sum of exportunderstatement of $14.3 billion and import over-statement of $6.92 billion) is about 8.4% of China’strade mispricing as estimated by Kar and Cartwright-Smith. Our estimate seems to be in line with theirs,given that Hong Kong’s trade accounted for 9.8%of China’s total trade amount in 2004 (based onstatistics from China Statistical Yearbook, 2005). TheChristian Aid Report (Christian Aid, 2009) estimatestrade mispricing at $27.03 billion in 2005, arising fromthe bilateral trade between China and the UnitedStates and European countries. Given that the US andEU trade accounts for about 32.9% of China’s totaltrade amount in 2004, this estimate seems to beconservative as compared with the $253.26 billionestimate for all China’s trading partners given by Karand Cartwright-Smith (2008) and the $21.22 billionestimate for China and Hong Kong in our study. Thiscomparison should be made with a caveat that theestimate from the current study is solely for trademisinvoicing, whereas estimates from the two pre-vious studies are for trade mispricing. Thus the esti-mate from the current study may serve as an estimatefor the lower bound of the trade mispricing problem inChina.
22The monotonic property may be distorted for gapvalues between �$1 and $1 when the naturallogarithm is taken for the absolute value, but in oursample we have no observation whose gap value fallswithin this range.
23The main purpose of the export tax rebate policyis to avoid double taxation on export goods and toenhance the country’s competitiveness in foreignmarkets. Under both the General Agreement on Tariffsand Trade and the WTO , export tax rebates are notconsidered a subsidy as long as the tax rebate does not
China–Hong Kong trade data Hung-Gay Fung et al
173
Journal of International Business Studies

exceed the amount of tax paid to domestic taxauthorities (Cui, 2003).
24Data were obtained from http://www.mac.doc.gov/China/Docs/searchableothertariffs.pdf.
25China’s preferential policies and tax incentives forforeign direct investment are presented in the Appendix.
26Although Hong Kong and Macau are part ofChina, for statistical reporting and tax purposesthey have always been considered “foreign” by theChinese authorities. We therefore use “foreign-fundedenterprises” to refer to “real” foreign-funded enter-prises and those enterprises funded by Hong Kong,Macau, and Taiwan, allowing readers to reconcile thefigures with China’s official statistics, at the expense ofa slight misnomer.
27This rate is taken from “Briefing of VAT underChina’s tax system”, accessed at www.itdweb.org.
28We thank an anonymous reviewer for suggestingthese control variables for robustness.
29We also ran all the tests using an alternativedefinition for “foreign”, defined as the percentage offoreign capital over total capital in an industry. Resultsare qualitatively the same.
30Note that the effective rate for the tobacco industryis 9%, resulting in a negative tax break at �1%.
31Regressions with clustering at the four-digitproduct level yield similar results, not reported hereto conserve space.
32Since a higher percentage of state capital implies alower percentage of foreign capital, the significantpositive coefficient on the state variable suggests thata greater percentage of state-owned enterprises inan industry is associated with a more severe mis-statement problem, or a greater percentage of foreignenterprises is associated with a less severe mis-statement problem.
33If our theory is correct, we should observe similarover- or underreporting patterns in China’s tradeflows with other countries, particularly countrieswith high FDI in China. Thus, as a robustnesscheck, we tested our hypotheses using anothersample: China–Thailand trade flows in 2000, thesame year as in the China–Hong Kong trade flowsanalyzed above. Results in the China–Thailandsample are similar to those in the China–Hong Kongsample, and are consistent with the round-trippingargument. Results are available from authors uponrequest.
34We thank an anonymous reviewer for inspiring usto conduct this further test.
REFERENCESAizenman, J., & Noy, I. 2006. FDI and trade: Two-way linkages?
Quarterly Review of Economics and Finance, 46(3): 317–337.Aliber, R. Z. 1978. Exchange risk and corporate international
finance. London: Macmillan.Altshuler, R., & Grubert, H. 2005. The three parties in the
race to the bottom: Host governments, home governments,and multinational corporations. Florida Tax Review, 7(3):137–209.
Altshuler, R., Grubert, H., & Newlon, T. S. 2001. Has US invest-ment become more sensitive to tax rates? In J. R. Hines, Jr. (Ed.),International taxation and multinational activity: 9–32. Chicago:University of Chicago Press.
Antras, P. 2003. Firms, contracts, and trade structure. QuarterlyJournal of Economics, 118(4): 1375–1478.
Boskin, M., & Gale, W. G. 1987. New results on the effects oftax policy on the international location of investment. InM. Feldstein (Ed.), The effects of taxation on capital accumula-tion: 201–219. Chicago: University of Chicago Press.
Buckley, P. J., & Casson, M. 1976. The future of the multinationalenterprise. London: Macmillan.
Chan, K. H., & Chow, L. 1997a. An empirical study of tax auditsin China on international transfer pricing. Journal of Accountingand Economics, 23(1): 83–112.
Chan, K. H., & Chow, L. 1997b. International transfer pricing forbusiness operations in China: Inducements, regulations andpractice. Journal of Business, Finance & Accounting, 24(9/10):1269–1289.
Chen, K.-P., & Chu, C. Y. 2005. Internal control versus externalmanipulation: A model of corporate income tax evasion. RandJournal of Economics, 36(1): 151–164.
China Statistical Yearbook. Various issues Beijing: NationalBureau of Statistics of China, http://www.stats.gov.cn/english/statisticaldata/yearlydata/.
Chinese Imports Tariff Schedule. 2004. http://www.mac.doc.gov/China/Docs/searchableothertariffs.pdf.
Christian Aid. 2009. Christian Aid report – False profits: Robbingthe poor to keep the rich tax-free. London: Christian Aid.
Clausing, K. A. 2000. The impact of transfer pricing on intra-firm trade. In J. R. Hines, Jr. (Ed.), International taxationand multinational activity: 173–200. Chicago: University ofChicago Press.
Coase, R. 1937. The nature of the firm. Economica, 4(16):386–405.
Cui, Z. 2003. China’s export tax rebate policy. China: AnInternational Journal, 1(2): 339–349.
Dollar, D., & Kraay, A. 2005. Neither a borrower nor a lender:Does China’s zero net foreign asset position make economicsense? World Bank Working Paper Series 3801, World Bank,Washington, D.C.
Dunning, J. H. 1977. Trade location of economic activity andthe MNE: A search for an eclectic approach. In B. Ohlin,P.O. Hesselborn and P.M. Wijkman (Eds), The internationalallocation of economic activity: Proceedings of a Nobel Sympo-sium held at Stockholm: 395–418. London: Macmillan.
Dunning, J. H. 1979. Explaining changing patterns ofinternational production: In defence of the eclectictheory. Oxford Bulletin of Economics and Statistics, 41(11):269–296.
Dunning, J. H. 1981. International production and the multi-national enterprise. London: Allen & Unwin.
China–Hong Kong trade data Hung-Gay Fung et al
174
Journal of International Business Studies

Export Rebate: Policies and Practices. 2000 Beijing: Import andExport Tax Department of the Chinese Tax Bureau.
Filatotchev, I., Strange, R., Piesse, J., & Lien, Y. C. 2007. FDI byfirms from newly industrialised economies in emergingmarkets: Corporate governance, entry mode and location.Journal of International Business Studies, 38(4): 556–572.
Fisman, R., & Wei, S.-J. 2004. Tax rates and tax evasion:Evidence from “missing imports” in China. Journal of PoliticalEconomy, 112(2): 471–496.
Fung, H.-G. 2005. China’s foreign trade and investment:An overview and analysis. China and World Economy,13(May): 3–16.
Fung, H.-G., & Zhang, J. 2007. An assessment of the CloserEconomic Partnership Arrangement between China and HongKong. Chinese Economy, 40(2): 36–50.
Fung, H.-G., Leung, W. K., & Zhu, J. 2004. Nondeliverableforward market for Chinese RMB: A first look. China EconomicReview, 15(3): 348–352.
Fung, H.-G., Pei, C., & Zhang, K. 2006. China and the challengeof economic globalization: The impact of WTO membership.Armonk, NY: M.E. Sharpe.
Gordon, R. H., & Hines Jr., J. R. 2002. International taxation. InA. J. Auerbach & M. Feldstein (Eds), Handbook of publiceconomics, Vol. 4, 1935–1995, Amsterdam: North-Holland.
Grubert, H. 1998. Taxes and the division of foreign operatingincome among royalties, interest, dividends, and retainedearnings. Journal of Public Economics, 68(2): 269–290.
Grubert, H., & Mutti, J. 1991. Taxes, tariffs and transfer pricingin multinational corporation decision making. Review ofEconomics and Statistics, 73(2): 285–293.
Grubert, H., & Mutti, J. 2001. Taxing international businessincome: Dividend exemption versus the current system. Washing-ton, DC: American Enterprise Institute.
Harris, D., Morck, R., Slemrod, J., & Yeung, B. 1993. Incomeshifting in US multinational corporations. In A. Giovannini,R. G. Hubbard, & J. Slemrod (Eds), Studies in internationaltaxation: 277–307. Chicago: University of Chicago Press.
Hartman, D. G. 1984. Tax policy and foreign directinvestment in the United States. National Tax Journal, 37(4):475–487.
Heckscher, E. F. 1919/1950. The effect of foreign trade onthe distribution of income. Ekonomisk Tidskrift, 21(2): 1–32(In Swedish). Reprinted in Readings in the Theory of Interna-tional Trade. Homewood, IL: Irwin, for American EconomicsAssociation.
Hines Jr., J. R. 1995. Taxes, technology transfer, and the R&Dactivities of multinational firms. In M. Feldstein, J. R. Hines, Jr.,& R. G. Hubbard (Eds), The effects of taxation on multinationalcorporations: 225–248. Chicago: University of Chicago Press.
Hines Jr., J. R., & Hubbard, R. G. 1990. Coming home to America:Dividend repatriations by US multinationals. In A. Razin &J. Slemrod (Eds), Taxation in the global economy: 161–200.Chicago: University of Chicago Press.
Ho, D. H. K., & Lau, P. T. Y. 2002. A tax study of transfer pricingin China. The International Tax Journal, 28(4): 62–78.
Hymer, S. H. 1976. The international operations of national firms:A study of direct foreign investment. Cambridge, MA: MIT.
Kar, D., & Cartwright-Smith, D. 2008. Illicit financial flows fromdeveloping countries: 2002–2006. Washington, DC: GlobalFinancial Integrity.
Kindleberger, C. P. 1969. American business abroad: Six lectureson direct investment. New Haven: Yale University Press.
Krugman, P. 1979. Increasing returns, monopolistic com-petition, and international trade. Journal of InternationalEconomics, 9(4): 469–479.
Mehta, D. R., & Fung, H.-G. 2004. International bank manage-ment. London: Blackwell.
Ohlin, B. G. 1933. Interregional and international trade.Cambridge, MA: Harvard University Press.
Prasad, E., & Wei, S.-J. 2005. The Chinese approach to capitalinflows: Patterns and possible explanations. IMF Working Paper,WP/05/79, International Monetary Fund, Washington, DC.
Ricardo, D. 1817/1950. The principles of political economy andtaxation. New York: Dutton.
Rugman, A. M. 1985. Internalization is still a general theoryof foreign direct investment. Weltwirtschaftliches Archiv,121(3): 570–575.
Shapiro, A. C. 2006. Multinational financial management.Hoboken, NJ: John Wiley & Sons.
Slemrod, J. 1990. Tax effects on foreign direct investmentin the United States: Evidence from a cross-country com-parison. In A. Razin & J. Slemrod (Eds), Taxation in the globaleconomy: 79–117. Chicago: University of Chicago Press.
Trefler, D. 1993. International factor price differences: Leontiefwas right! Journal of Political Economy, 101(6): 961–987.
Vanek, J. 1968. The factor proportions theory: The N-factor case.Kyklos, 21(4): 749–756.
Xiao, G. 2004. People’s Republic of China’s round-tripping FDI:Scale, causes and implications. ADB Institute Discussion Paper,July.
APPENDIX
Preferential Policies and Tax Incentivesfor Foreign Direct Investment (FDI)(as at the end of 2007)FDI incentives in China include significant reduc-tions in national and local income taxes, land fees,import and export duties, and priority treatment inobtaining basic infrastructure services. There arealso special preferences for projects involvinghigh-tech and export-oriented investments. Prior-ity sectors include transportation, communica-tions, energy, metallurgy, construction materials,machinery, chemicals, pharmaceuticals, medicalequipment, environmental protection, and electro-nics. Tax incentives are among the most prominentinvestment promotion policies.
(1) Income tax
(a) General rate of income tax(a.a) The income tax rate on enterprises with
foreign investment is 33%.(a.b) The income tax rate on enterprises with
foreign investment located in specialeconomic zones, new- and high-techindustrial zones, or economic and techno-logical development zones is 15%. Taxreduction and exemption
1.Production enterprises with foreign invest-ments made for 10 years are exempt fromincome tax for the first 2 years, and enjoy a50% reduction for the next 3 years.
2.Enterprises with foreign investment engagedin agriculture, forestry, and animal husbandry,and enterprises with foreign investment estab-lished in remote and underdeveloped areas,may, upon approval, be allowed a 15–30%reduction in the income tax for another 10
China–Hong Kong trade data Hung-Gay Fung et al
175
Journal of International Business Studies

years after the tax exemption and reductionperiod described above.
3.The income tax on enterprises with foreigninvestment located in mid-west China that areengaged in projects encouraged by the govern-ment is 15% for another 3 years following theexpiration of the 5-year period of tax exemp-tion and reduction.
4.Enterprises with foreign investment that adoptadvanced technology are exempt from incometax for the first 2 years and allowed a 50%reduction for the next 6 years.
5. In addition to the 2-year tax exemption and 3-year tax reduction treatment, foreign-investedenterprises producing for export enjoy areduced income tax of 50% as long as theirannual export accounts for 70% or more oftheir sales volume.
6. Foreign investors in an enterprise with foreigninvestment that reinvests its share of profitobtained from the enterprise in a project withan operation period of at least 5 years benefitfrom, upon approval, a 40% refund of theincome tax already paid on the reinvestedamount.
(2) Circulation-stage tax (value-added tax, VAT)
(a) Technology transfer and technological develop-ment by foreign enterprises and enterprises withforeign investment are exempted from VAT.
(b) For foreign-invested enterprises engaged inprojects in the encouraged or restricted-Bcategories, the VAT on China-made equipmentpurchased by the enterprises within their totalamount of investment is fully refunded forqualified equipment.
(3) Tax policy for the software industry and theintegrated circuit industry
(a) VAT rates: 3% and 6%.(b) In addition to a 15% reduced rate of income
tax, after approval of the application, there is anexemption from tax for the first 5 years and areduced corporate tax rate of 7.5% for thefollowing 5 years.
ABOUT THE AUTHORSHung-Gay Fung is Dr Y. S. Tsiang Endowed ChairProfessor of Chinese Studies and department chair,Finance and Legal Studies, College of BusinessAdministration, University of Missouri-St Louis.Fung obtained his PhD in business administrationfrom the Georgia State University. He is currentlythe editor of Chinese Economy.
Jot Yau is Professor of Finance at the Albers Schoolof Business and Economics at Seattle University. Hisresearch interests include international finance,China’s capital markets & economy, and sustain-able investments. He holds a PhD in finance fromthe University of Massachusetts at Amherst.
Gaiyan Zhang is Assistant Professor of Finance atthe College of Business Administration, Universityof Missouri-St Louis. She obtained her PhD from theUniversity of California, Irvine. Her research inter-ests include international finance and credit defaultswaps. She has published in Journal of FinancialEconomics, Journal of Finance, Financial Managementand others.
Accepted by Edward Mansfield, Guest Editor, 25 April 2010. This paper has been with the authors for three revisions.
China–Hong Kong trade data Hung-Gay Fung et al
176
Journal of International Business Studies