reportannual - grieg.no grieg group’s head office at grieg-gaarden is certified as an...
TRANSCRIPT

2017
REPORTANNUAL

3
9
10
12
13
32
Directors’ report ....................Page 3-6 Profit and loss statement Page 7 Balance sheet ........................Page 8-9 Cashflow statement ...........Page 10 Notes .........................................Page 11-30
Content

3 ANNUAL REPORT2017
Highlights
Grieg Seafood celebrated its 25th anniversary with solid results. Salmon prices were down compared to 2016, but the demand for salmon continued to increase. Produc-tion in Norway fell due to low sea temperatures, but was still at a satisfactory level. Actions taken in British Columbia impacted positively on production in 2017, but Shet-land had another year with biological challenges. The company has focus on increas-ing the number of smolt in the sea, and met its goals set for 2017 with 26 million smolt. The extension of the hatchery in Rogaland was completed and the work of extending the hatchery in Finnmark has started. The production of salmon in 2017 stood at 62 600 tons, and the company now has considerable unused growth capacity after sus-tainable investment in new farming capacity both on land and at sea.
For Grieg Star a new chapter was started with the establishment of G2 Ocean together with Gearbulk. All of Grieg Star’s ships are now part of the G2 Ocean Pool, which is the world’s largest within the Open Hatch segment. This joint venture positions us for future cost benefits and streamlined ship operations. With a large part of the revenues related to long-term contracts, the recovery in freight rates in 2017 is not immediately reflected in the results for G2 Ocean and Grieg Star. This will first become apparent as the contracts are renewed in the coming years. Grieg Star recorded another deficit in 2017 due to depressed market and substantial reorganisation costs. As a result of establishing G2 Ocean, Grieg Star is now reporting net operating revenues, effectively down NOK 2 bill.
Grieg Logistics increased its earnings in 2017, and most of the subsidiaries delivered positive results. Grieg Strategic Services was established in order to enter into a stra-tegic cooperation agreement with the Norwegian Armed Forces for the delivery of lo-gistics services to military operations. The company is implementing new technology for seamless operations between harbours, terminals, ships and shipowners. Grieg Shipbrokers had a positive year with good results in most of its business seg-ments, while at the same time carrying out major investments. The company expand-ed with the establishment of offices in Singapore and Shanghai focusing on chartering of Capesize and Kamsarmax, in addition to a new department in Norway to handle the purchase and sale of offshore and service vessels for the fish farming industry.
Grieg Investor made another year of profit and growth, and is well positioned for further expansions.
The investment companies Grieg Holdings and Grieg International delivered a good result mainly due to high return on the investment portfolio.
Grieg Group
KEY FIGURES (NOK mill.) 2017 2016
Turnover 9 058 10 985EBIT 815 1280Profit before tax 671 870Profit after tax 464 654
DIRECTORS’ REPORT 2017 GRIEG MATURITAS
Grieg GroupThe Grieg Group is a global group of companies. Through our flexibility and international culture, we gather experience and know-how globally, which we share within the Group, and in the societ-ies in which we operate. The business is based on long-term partnerships, creating value in our var-ious activities – shipping, shipbroking, maritime services & port operations, seafood, investments and financial advisory services. The headquarter is located at Grieg-Gaarden, Bergen, Norway, and the Group is represented in 15 countries all over the world. Grieg Maturitas AS owns 75% of the shares and Grieg Foundation the remaining 25%.
Grieg Maturitas ASGrieg Maturitas is the parent company of the Grieg Group and is owned by the Grieg family. The company is responsible for organizing and facil-itating a good corporate structure and branding, as well as challenging the companies within the Group to develop strategically and profitably in a sustainable manner, and in accordance with our principles.
The Grieg Group continues to develop within all our business areas. Last year was influenced by large investments now becoming operational through G2 Ocean, Grieg Strategic Services, new brokerage offices, expanded hatcheries and the completion of our headquarter Grieg-Gaarden in Bergen. In addition, Grieg Investor continued to deliver good results.
2017 was a good year for the Grieg Group overall, mainly due to a strong market in the salmon industry and the positive results from Grieg Sea-food. Grieg Star is still facing tough markets, while several of the other companies within the Grieg Group delivered good results. Group turn-over was NOK 9 bill., the operating profit NOK 815 mill. and the profit before tax was NOK 671 mill. The Group is well positioned for the future.

4 ANNUAL REPORT2017
Rensefiskgruppen, producing cleanerfish for the salmon farming industry, had its 5th year of consecutive growth, and is now the largest company in this segment.The Group’s headquarter, Grieg-Gaarden in Bergen, has undergone expansion and upgrading in recent years. This has now been completed, and the building is the loca-tion of modern and functional office premises in the heart of Bergen.
We are in the process of establishing the UN’s sustainability goals as an active part of and a framework for the Group and the companies’ strategy, innovation and entre-preneurship.
For more information on financial results per segment, see note 2.
Balance sheet, financial situation and cash flow The Grieg Group has a strong financial position. Total current assets amount to NOK 5 424 mill., of which NOK 1 865 mill. is made up of bank deposits, market based financial investments and other current assets. Current liabilities total NOK 2 382 mill., which gives positive working capital of NOK 3 042 mill. The Group’s fixed assets total NOK 10 445 mill., of which NOK 6 027 mill. is financed through loans in financial institutions. Total long-term interest-bearing debt is NOK 600 mill. less than in 2016.
Cash flowIn total, the Group had a positive cash flow of NOK 742 mill. from operations. Due to investments in fixed assets, mainly Grieg Seafood’s expansion of fish hatcheries in Finnmark and Rogaland, the net cash flow from investing activities is negative at NOK 72 mill. The net cash flow from financing activities is negative at NOK 927 mill., mainly due to loan repayment and dividends paid. In total, the Group had a negative cash flow of NOK 257 mill. in 2017.
Financial risk and risk managementWhen operating in a global market and across different business areas, the companies of the Grieg Group are exposed to different types and degrees of risk, ranging from market operations and financial risk to compliance and the regulatory framework. Risk management is a continuous process and an integrated part of the Group’s govern-ing model. Thus, we are constantly focusing on how to identify and monitor the risk areas in the Group companies as well as developing strategies to mitigate such risks. For further information concerning financial risk, see note 17 to the Group accounts.
Organization and working environment The companies of the Grieg Group are to a large extent based on expert-knowledge, and the employees’ qualifications constitute a substantial part of the business capital. Our aim is to be an attractive employer where people can develop and enjoy working. The Board is of the opinion that job satisfaction is generally high and that the working environment is good. Throughout the organization there are ongoing training and learning activities.
Equal opportunitiesThe Grieg Group seeks at all times to ensure equal opportunities and rights for all its employees. We do not accept discrimination on the basis of gender, religion, cultural background or race, or in any other form.
Health and safetyThere is continuous focus on training, and the quality of work processes in the Grieg Group companies aims at reducing the risk of serious incidents. The workforce in gen-eral is stable, and both the absence and injury rates are low. Besides organizing medi-cal follow-ups, the Group encourages and facilitates participation in physical activities.
Corporate Social Responsibility The Grieg Group emphasizes the creation of economic and social values in a long-term perspective, recognizing the environmental and social impacts of our business activities. As well as complying with both national and international environmental
15COUNTRIES REPRESENTED IN
2017 2016
Sick-leave 2,5% 2,2%
Long-term sick-leave 1,9% 1,4%
Major injuries - -
EMPLOYEES 31.12.2017
1881
Grieg Group
KEY FIGURES (NOK mill.) 2017 2016
Equity 6 980 7 640Total assets 15 869 16 926Equity ratio 44% 45%

5 ANNUAL REPORT2017
regulations, laws and rules, the Group’s companies strive to play an active role in im-plementing as well as developing environmental procedures and technology in order to reduce the risk of environmental damage.
The Grieg Group is in the process of establishing the UN’s sustainability goals as an active part of and a framework for the Group and the companies’ strategy, innovation and entrepreneurship. This involves all employees and strengthens our focus on sus-tainability, building it into our established values, while taking account of the environ-ment, society and profitable growth.
Shipping operations entail the discharge of harmful emissions. The Grieg Star Group works continuously to be a visible and distinct contributor to environmental aware-ness and development. In 2017, the organization worked on short and medium-term plans for the execution of the environmental strategy towards end-2020. The Group’s environmental vision: “No harmful emissions to air, sea and land” remains as a basis. The focus going forward is on how to achieve efficient and smart initiatives under extremely challenging market conditions. A plan has been established setting out how to achieve the 2020 emission reduction target of 35% compared to 2007 levels. The new strategy and action plan constitute the Group’s road map for achieving environ-mental responsibility in the conduct of its business going forward. Grieg Star is com-mitted to the UN Global Compact and transparent reporting on progress. For more information, please visit www.griegstar.com.
As demand for seafood continues to grow, intense pressure has been put on the in-dustry in aquaculture to meet this demand in a sustainable manner. The salmon indus-try is currently favoured as a long-term solution to global animal protein shortages, which gives it a competitive advantage compared to other industries. Grieg Seafood’s main cost drivers, risks and opportunities are increasingly connected to managing the impact on the environment. Systematic efforts to secure balanced sustainability are therefore fundamental in order to facilitate long-term profitable growth and are also increasingly becoming a premise for the public licence of the industry.
In 2017 Grieg Seafood continued its work on common sustainability goals through the Global Salmon Initiative (GSI) and has made great progress to improve its impact on society and the local community, ensuring that it produces a healthy and nutritious product in a sustainable way. For further information about Grieg Seafood’s work on sustainability goals, please find the sustainability report published on www.griegsea-food.com.
The Grieg Group’s head office at Grieg-Gaarden is certified as an eco-lighthouse.
Grieg FoundationGrieg Foundation owns 25% of the Grieg Group. The Foundation supports global proj-ects for the education of children and youth, medical research and environmental projects, as well as art and cultural projects. In 2017 Grieg Foundation’s contributions amounted to NOK 32 mill. Since its establishment in 2002 the Foundation’s total dis-tributions amount to approx. NOK 546 mill.
Corporate GovernanceIn order to ensure that the division of responsibility for tasks and roles between the administration, the Board of Directors and the General Meeting is based on sound practice, the Norwegian Recommendation on Corporate Governance is applied. Devi-ations may arise given the fact that the Group is privately owned.
Most of Grieg Group’s companies are doing business globally. The companies within the Group operate independently, but close cooperation across company borders is encouraged. This contributes to a higher knowledge level and a shared culture. In or-der to ensure an ethical foundation for our business as well as a solid company culture, we have four common core values; Solid, Proud, Open and Committed. These values define the compass by which we navigate when doing business across the world.
Grieg Foundation - distributions
(Amounts in NOK mill.) 2017 2002-2017
Education of children & youth 10,8 207,5
Musical art 6,5 78,8
Cultural projects 3,6 103,2
Medical research and projects 4,1 68,3
Other projects 6,8 88,7
Total 31,8 546,5

6 ANNUAL REPORT2017
Going concernThe Board of Directors confirms that the annual accounts have been prepared on a going concern basis and that this assumption is valid, based on the Group’s solid financial position and expectations of future profits. The Board believes that the sub-mitted annual accounts give a correct picture of the result, cash flow and economic situation. No events have taken place after the balance sheet date that could materi-ally affect the accounts.
OutlookAlthough many of our business areas are still being tested by challenging markets, tough competition and economic difficulties, we are continuously developing in an innovative way, making us better prepared for the future. Globalized and exponential technology trends represents opportunities for growth and profitability.
Within the seafood segment we believe in increased demand for salmon and relative good market prices in the future. Grieg Seafood works hard to bring the cost level down to the industry average and lower, and to shorten the production time. Other initiatives within the aquaculture segments also further strengthens the Group’s pres-ence in this industry. After strong investment in new capacity the recent years, the salmon farming group expects a substantial lift in production and turnover during the next 2-3 years both on land and in sea.
Through Grieg Star’s joint venture with G2 Ocean, we are steadily moving towards our vision of «pioneering sustainable shipping». In the shipping segment, a gradual nor-malization of rates and values is expected to materialize over the next few years. This, combined with further synergies from G2 Ocean corporation, and further improve-ment and innovation from the operation in Grieg Star is expected to increase earnings.
Going forward, we will focus on adapting to changing markets and pursue opportuni-ties as they arise. Supporting new business ideas and facilitating innovation initiatives within the Group are highly focused. In 2018 we are also establishing a new invest-ment entity to coordinate investing activities and further strengthen the Group’s as-set management activities.
The Board of Directors would like to express our thanks to the employees of the Grieg Group for their hard work and efforts throughout the year.
Bergen, 5th of April 2018 The Board of Directors of Grieg Maturitas AS
Elna-Kathrine Grieg Board Member
Elisabeth Grieg Chair
Per Grieg jr. Board Member
Camilla Grieg Board Member
Stig Grimsgaard Andersen Board Member
Wenche Kjølås Managing Director

7 ANNUAL REPORT2017
PROFIT AND LOSS STATEMENT
GRIEG MATURITAS AS GRIEG GROUP
(Amounts in NOK 1000) (Amounts in NOK 1000)
2016 2017 Note 2017 2016
3 421 3 431 2 Operating Revenue 9 058 834 10 984 508
Operating Costs
-3 340 -3 858 4 Payroll and social security costs -872 703 -952 516
- - Profit (loss) sale of tangible assets - -4 470
- - 6,7 Depreciation -596 761 -560 550
- - 6 Reversal (write-down) fixed assets -2 974 6 033
- - 3 Operating costs - shipping -864 608 -2 974 948
- - 3 Cost of sales - fish farming - 3 754 704 -3 327 298
-916 - 1 306 3,23 Other operating expenses -2 151 641 -1 890 355
-4 256 - 5 164 Total operating expenses - 8 243 391 -9 704 105
-835 - 1 733 2 Operating profit - EBIT 815 444 1 280 403
Financial items
74 525 416 014 8 Income from investments in subsidiaries - -
1 216 932 10 Other Financial income 156 217 89 940
- - 14 Change in value of market based assets 34 309 22 441
- - 9 Results of investments in associated companies -55 013 12 637
-1 -2 10 Other Financial expenses -279 951 -535 845
75 741 416 944 2 Net financial items -144 439 -410 827
74 906 415 211 2 Profit before tax 671 005 869 576
-107 - 177 19 Tax -207 362 -215 705
74 799 415 387 20 Profit for the year 463 643 653 871
To minority interests 394 415 484 871
Majority proportion 69 228 169 000

8 ANNUAL REPORT2017
BALANCE SHEET
GRIEG MATURITAS AS GRIEG GROUP
(Amounts in NOK 1000) (Amounts in NOK 1000)
2016 2017 Note 2017 2016
Assets
Fixed assets
Intangible assets
- - Research and development 28 480 22 163
- 149 19 Deferred tax assets - -
- - Contracts 39 867 41 018
- - Goodwill 19 283 23 993
- - Licenses 1 087 834 1 078 272
- 149 7 Total intangible assets 1 175 464 1 165 446
Tangible assets
- - Land and real estate 1 091 720 1 018 142
- - Loading and discharge equipment - 90 684
- - Vessels 6 463 659 7 099 523
- - Vehicles, machinery and equipment 1 535 086 1 222 741
- - 6 Total tangible assets 9 090 465 9 431 090
Long-term financial assets
4 021 796 4 021 796 8 Investments in subsidiaries - -
- - 9 Investments in associated companies 78 834 4 407
- - 13 Loans to associated companies 28 033 20 524
- - 11 Shareholding and other investments 51 774 27 976
- - 13 Other receivables 20 230 281 196
4 021 796 4 021 796 Total long-term financial assets 178 872 334 103
4 021 796 4 021 995 Total fixed assets 10 444 801 10 930 639
Current assets
- - 12 Stocks 2 150 716 1 869 267
- Accounts receivable 862 455 984 131
74 525 292 500 Receivables from subsidiaries - -
12 93 Other receivables 545 847 523 815
74 537 292 593 Total receivables 1 408 302 1 507 946
- - 11 Shareholding and other investments 148 330 132 887
- - 14 Market based financial investments 802 891 1 313 997
144 515 43 660 16 Cash and bank deposits 914 140 1 171 006
219 052 336 253 Total current assets 5 424 379 5 995 103
4 240 848 4 358 198 Total assets 15 869 180 16 925 742

9 ANNUAL REPORT2017
Bergen, 5th of April 2018 The Board of Directors of Grieg Maturitas AS
Elna-Kathrine Grieg Board Member
Elisabeth Grieg Chair
Per Grieg jr. Board Member
Camilla Grieg Board Member
Stig Grimsgaard Andersen Board Member
Wenche Kjølås Managing Director
BALANCE SHEETGRIEG MATURITAS AS GRIEG GROUP
(Amounts in NOK 1 000) (Amounts in NOK 1000)
2016 2017 Note 2017 2016
Equity and liabilities
Equity
Paid-up equity
1 124 1 124 21 Share capital (1 123 530 shares of NOK 1 ) 1 124 1 124
702 263 409 763 Share premium 409 763 702 263
703 387 410 887 Total 410 887 703 387
Retained earnings
3 461 825 3 653 699 Other equity/group reserves 3 833 459 4 111 162
- - Minority interests 2 735 613 2 824 977
3 461 825 3 653 699 Total retained earnings 6 569 070 6 936 139
4 165 212 4 064 585 20 Total equity 6 979 957 7 639 526
Liabilities
Provisions
- - 5 Pension liabilities 60 191 74 610
28 - 19 Deferred tax 408 960 360 019
- - Other provisions 10 276 12 424
28 - Total provisions 479 427 447 053
Other long-term liabilities
- - 15,16 Liabilities to financial institutions 5 959 416 6 623 751
- - 15 Other long-term liabilities 67 952 3 329
- - Total long-term liabilities 6 027 368 6 627 080
Current liabilities
- - 16 Bank overdrafts 541 848 512 535
25 138 Accounts payable 673 691 612 075
22 14 Accounts payable group companies - -
115 - 19 Taxes payable 165 587 177 956
271 289 Public duties payable 58 118 91 239
74 525 292 500 20 Dividend 398 233 102 117
650 672 Other current liabilities 544 952 715 262
75 608 293 613 Total current liabilities 2 382 428 2 212 084
75 636 293 613 Total liabilities 8 889 224 9 286 216
4 240 848 4 358 198 Total equity and liabilities 15 869 180 16 925 742

10 ANNUAL REPORT2017
CASHFLOW STATEMENT
GRIEG MATURITAS AS GRIEG GROUP
(Amounts in NOK 1 000) (Amounts in NOK 1000)
2016 2017 2017 2016
Cashflow from operations
74 906 415 211 Profit before tax 671 005 869 576
-212 -115 Taxes paid -177 956 -23 289
- - Gain/loss from sale of fixed assets - 4 470
-74 525 -416 014 Dividends receivable taken to income -
- - Ordinary depreciation 635 506 560 551
- - Write-down (reversal) of fixed assets -273 -6 033
- - Unrealised gain/loss market based investments -34 309 -22 441
- - Unrealised gain/loss investments in shares - 129 676
- - Change in inventory -281 449 -22 819
- -81 Change in accounts receivable 121 676 -162 730
-21 105 Change in accounts payable 61 616 -177 776
35 40 Change in accruals - 2 148 -129 730
- - Difference in expenses pensions and payment in/out -2 862 -2 073
- - Effect of change in exchange rate 8 468 99 160
- - Share of profit from associated companies and joint ventures 55 013 -12 637
- - Gain/loss on sales of shares without cash effect -134 827 -35 674
- - Change in other provisions -176 987 -
183 -855 Net cashflow from operations 742 473 1 068 230
Cashflow from investing activities
- - Sale of fixed assets 10 908 382 668
- - Purchase of fixed assets/newbuilding contracts -777 512 -615 560
- - Purchase of intangible assets -31 467 -18 908
67 500 198 039 Payments from other group companies - -
- - Payments from other claims (short/long term) - 17 911
- - Sale of shares 963 700 496 056
- - Purchase of shares and securities -237 618 -671 893
67 500 198 039 Net cashflow from investing activities -71 989 -409 727
Cashflow from financing activities
- - Net change in bank overdraft 27 465 174 304
- - Loan repayment (short/long-term) -705 058 -3 526 560
- - Loan proceeds 400 759 2 853 697
-67 500 -298 039 Dividends paid -650 515 -198 026
-67 500 -298 039 Net cashflow from financing activities -927 349 -696 585
183 -100 855 Net cashflow for the period - 256 866 -38 082
144 332 144 515 Opening balance of cash and cash equivalents 1 171 006 1 209 088
144 515 43 660 Cash and equivalents 31.12 914 140 1 171 006

NOTESNOTE 1 Accounting principles 12
NOTE 2 Segment information 14
NOTE 3 Other operating expenses 14
NOTE 4 Payroll costs, number of employees, remuneration etc. 15
NOTE 5 Pensions and pension commitments 16
NOTE 6 Fixed assets 17
NOTE 7 Intangible assets 18
NOTE 8 Investments in subsidiaries 18
NOTE 9 Investments in associated companies and joint ventures 21
NOTE 10 Financial items 21
NOTE 11 Shareholdings and other investments 22
NOTE 12 Stock and bunkers 23
NOTE 13 Receivables due in more than one year 23
NOTE 14 Marketbased financial investments 23
NOTE 15 Debt payable in more than 5 year 23
NOTE 16 Mortgages/guarantee liability/restricted funds 24
NOTE 17 Financial risk 25
NOTE 18 Contingencies and subsequent events 26
NOTE 19 Taxes 26
NOTE 20 Equity 28
NOTE 21 Share capital and share information 28
NOTE 22 Related parties 29
NOTE 23 Remuneration to auditor 29
NOTE 24 Discontinued operations 30

12 ANNUAL REPORT2017
Note 1 Accounting principlesThe Annual Accounts for Grieg Maturitas AS have been prepared in accor-dance with Norwegian Accounting Act and generally accepted accounting principles.
Group AccountsThe consolidated accounts include the subsidiaries specified in note 8 and shows the accounts of the parent company and the subsidiaries as a single economic unit. Shareholdings and investments in sub-sidiaries are eliminated on the basis of the acquisition method. The cost of shareholdings and investments in subsidiaries is eliminated against the book equity of the shares/investments at the date of acquisition. Any difference arising is posted to the identifiable assets. Any surplus value that cannot be attributed to specific assets, or the company’s own intangible assets, is described as goodwill and is depreciated over its estimated lifetime. Intra-group transactions and internal balances are eliminated.
Companies that are bought or sold during the year, is included in the group accounts from the time of control arises or ceases.
Changed owner share in subsidiaries, where the company after the trans-action still is a subsidiary, is an equity transaction for the Group.The income statements and balance sheets of the group entities that have a functional currency different from the presentation currency are translated into the presentation currency as follows:
(i) assets and liabilities are converted at the closing rate on the date of the balance sheet, (ii) income and expense items in the income statement are converted at av-erage exchange rates for the period (unless this average is not a reasonable estimate of the cumulative effect of the rates prevailing on the transaction dates, in which case income and expenses are translated on the dates of the transactions). (iii) translation differences are recorded against equity and specified sepa-rately.
Operating RevenueOperating revenues are entered as income at the time of delivery. The time of delivery is understood as the time of transfer of risk and control related to the delivery. Freight revenues from voyages are recognised on the basis of the number of days the voyage lasts. Revenue is shown, net of value added tax, returns and discounts.
Classification of assets and liabilities – main ruleAssets intended for long-term ownership or use are classified as fixed assets. Other assets are classified as current assets. Receivables due within one year are classified as current assets. The corresponding criteria are applied to classify liabilities. Certain items are stated on the basis of special valuation rules, in accordance with accounting legislation, as detailed below. Other assets and liabilities are classified as fixed assets and long-term liabilities, respectively.
InventoriesInventories are recognised at the lower of cost and fair value. Goods in progress, and finished goods are recognised at the lower of full cost and net sales value. The net sales value of finished goods is calculated as sales value less sales costs. The stock of bunkers consists of fuel and diesel and are recognised at cost on the basis of the FIFO method.
Foreign currencyAssets and liabilities denominated in foreign currencies are stated at the year-end exchange rate. Agio, or disagio, on settlements or conversion of monetary items in foreign currency on the day of balance is allocated. Transactions in foreign currencies is recalculated to transaction rate.
Foreign exchange hedging derivatives purchased in order to reduce the currency risk for the sub-group Grieg Star Group are recognised as hedging transactions. Gains/losses of foreign exchange contracts are therefore recorded in the same period as the hedged transactions. Please refer to note 17. Unrealized gain/loss on the hedging contracts is not posted on the balance sheet.
Foreign exchange rates (NOK)
01.01.2017 31.12.2017 Average 2017
CAD 6,4042 6,5432 6,3696
GBP 10,6130 11,0910 10,6386
EUR 9,0863 9,8403 9,3271
USD 8,6200 8,2050 8,2630 Interest rate hedging Interest rate hedging contracts are recognised and classified in the same way as the related mortgage loan. The interest received/paid under the contract is therefore recognised in the interest period in question, and is included in interest cost/income for the period. Unrealized gain/loss on the hedging contracts is not posted on the balance sheet.
Accounts receivableAccounts receivable are stated at nominal value less provisions for expect-ed losses. The loss provision is based on an individual assessment of each accounts receivable.
Investments in subsidiariesA company is defined as a subsidiary if the Group has a decisive influ-ence on its operations. This is normally the case where the Group holds more than 50% of the voting share capital. Subsidiaries are posted in the company accounts applying the cost method. The investment is stated at historical cost of the shares unless a write-down has been necessary. The investment is written down to fair value when the reduced value is due to causes which are not deemed to be temporary. Write-downs are reversed when the grounds for the write-down no longer exist. Dividends and other distributions are recognised in the year in which they are provided for in the accounts of the subsidiary. If the dividend exceeds the profit after the acquisition, the surplus amount represents repayment of the capital investment and the distributions are deducted from the amount of the investment in the balance sheet.
Investments in limited partnershipsInvestments in limited partnerships are recorded on the basis of the cost method whereby the investment is stated at cost in the balance sheet. The distribution of profits/contribution to cover losses from investments in lim-ited partnerships is taken to income/charged against profits under financial items. Profits from investments in limited partnerships are taxable in the hands of the respective participants.
Investements in portfolio and private equity companiesA portfolio of investments are recorded as a current asset, and is valued at the lower of cost price and estimated fair value for the portfolio as a whole when the intention behind the portfolio is to diversify the risk through a balanced portfolio with respect to time, branches and geography. For un-listed investments, with no observable price, the fair value are determined by recently third-party-trades, or with a reference to the fair value of similar investments.
Investments in associated companies and joint venturesAn associated company is a company where the Group has significant influence, but not control. Significant influence is deemed to exist for investments where the Group has between 20% to 50% of voting capital. In-vestments in associated companies and joint ventures are recorded on the basis of the equity method in the consolidated accounts, unless the invest-ment value is immaterial. The share of the results in associated companies is posted separately under financial items. The investments in associated companies are posted as a financial asset. The Group’s share of a loss is not posted in the income statements if this means that value of the investment in the balance sheet becomes negative. Provisions will be made if the Group has undertaken an obligation on behalf of the associate.
Fixed assetsFixed assets are valued at acquisition cost, but are written down to fair mar-ket value where the decline in value is not expected to be temporary. Fixed assets with a limited economic lifetime are depreciated on a straight-line basis over the expected lifetime of the asset. Long-term liabilities are stated in the balance sheet at the nominal amount on the establishment date. Cur-rent assets are valued at the lower of acquisition cost and fair market value. Current liabilities are stated in the balance sheet at the nominal amount on the establishment date. Periodic classification and maintenance costs are posted in the balance sheet and depreciated on a straight-line basis until

13 ANNUAL REPORT2017
the next planned docking. The docking costs are included in the balance sheet along with the value of the ship. The depreciation of docking costs is included in operating costs.
Intangible assetsGoodwill is depreciated over its economic lifetime. The surplus value attached to the fleet’s contracts of employment and the company’s right to renominate Grieg Star tonnage is defined as ”contracts” in the balance sheet and is depreciated over 20 years. Licenses with unlimited economic lifespan is subject to an annual impairment test. Licenses with limited eco-nomic lifespan is depreciated annually. Expenses related to the company’s own development are recorded in the balance sheet from the point when it is likely that the development work will result in an identifiable intangible asset.
Asset impairmentsAssets that are subject to depreciation are reviewed for impairment whenever events or changes in circumstances indicate that the carrying amount may not be recoverable. An impairment loss is recognised for the amount by which the asset’s carrying amount exceeds its recoverable amount. The recoverable amount is the higher of an asset’s fair value less costs to sell and value in use. For the purpose of assessing impairment, assets are grouped at the lowest levels for which there are separately identifiable cashflows (cash-generating units).
The Group’s open hatch vessels have been sailing in a pool which has been marketed and operated by Grieg Star Shipping AS until 1st of May 2017. 2nd of May 2017 Grieg Star Shipping AS established a joint venture with Gearbulk AS called G2 Ocean Holding AS, which now markets and operates the Group’s vessels in a pool.
Having the vessels sail in a pool means that the operational use of the vessels, including optimization of routes, is combined for the fleet. Earnings of each individual vessel is therefore affected by the earnings of other vessels in the pool. The open hatch fleet and the bulk fleet are therefore considered to be the respective cash-earnings of other vessels in the pool. The open hatch fleet and the bulk fleet are therefore considered to be the respective cash-generating units.
Newbuilding contracts are included in the fleet impairment and unpaid installments are deducted.
Non-financial assets other than goodwill which have been impaired are reviewed for possible reversal of the impairment at each date.
Pension commitments Defined contribution plansThe Group’s main pension scheme is a defined contribution plan, for which the companies pay contributions to an insurance company. The companies have no further payment obligations once the contributions have been paid. Contributions are recorded as payroll expenses.
Defined benefit planSome companies have defined benefit plans, including AFP. A defined ben-efit plan is a pension scheme that defines the pension payment an employ-ee will receive on reaching retirement age. The pension payment normally depends on one or more factors, such as age, period of service with the company and salary level. The pension commitment under defined benefit schemes posted in the balance sheet is the present value of the defined benefit schemes at year-end less the fair value of the pension fund assets, adjusted for unposted deviations from estimate. The pension commitment is calculated annually by an independent actuary based on a linear accrual of pension entitlements. Changes in benefits under the pension plan are posted in the profit and loss account on an ongoing basis. The pension schemes are funded through payments to insurance companies or financed through operations. Post-employment benefit obligations associated with the early retirement pension (AFP), under the LO/NHO arrangement, are a multi-employer defined benefit plan, but the plan is recorded as defined contribution, as it is not measurable.
Market based financial assetsShort-term investments in shares and mutual funds are regarded as part of the trading portfolio and are stated at fair value at year-end. Dividends re-ceived and other distributions are entered as income under other financial income.
EstimatesWhen preparing the annual accounts in accordance with good accounting practice, the management make estimates and assumptions which affect the profit and loss account and the valuation of assets and liabilities as well as information about contingent assets and liabilities at year-end. Contin-gent losses which are likely and quantifiable are charged against income on an ongoing basis.
LeasingThe companies differentiates between financial leasing and operational leasing based on an evaluation of the lease contract at the time of incep-tion. A lease contract is classified as a financial lease when the terms of the lease transfer substantially all the risk and reward of ownership to the lessee. All other leases are classified as operational leases. When a lease contract is classified as a financial lease where the company is the lessee, the rights and obligations relating to the leasing contracts are recognised in the balance sheet as assets and liabilities. The interest element in the lease payment included in the interest costs and the capital amount of the lease payment is recorded as repayment of debt. The lease liability is the remaining part of the principal. For operational leases, the rental amount is recorded as an operating cost.
TaxationThe tax charge in the profit and loss account consists of the tax payable and the change in net deferred tax. Taxes are charged when they arise. Deferred tax in the balance sheet is calculated on the basis of timing differ-ences between values for taxation and accounting purposes. Taxable and tax-deductible timing differences which are reversed or can be reversed within the same period are netted against each other and entered net. Some of the companies of the Group are subject to shipping taxation under the Norwegian tonnage tax system pursuant to chapter 8 of the Taxation Act.
Cash flow statementThe statement of cashflows is prepared on the basis of the indirect method. Accordingly, the cashflows from investment and financing activities are reported gross, while the accounting result is reconciled against the net cashflow from operations. Cash and cash equivalents include cash, bank deposits and other short-term liquid investments that can immediately and with no major exchange rate risk be converted into a known amount and maturing less than three months from the transaction date.

14 ANNUAL REPORT2017
Note 2 Segment information
GROUP(Amounts in NOK mill.)
Operating revenue Operating profit Net financial Items Profit before tax
2017 2016 2017 2016 2017 2016 2017 2016Grieg Seafood (NGAAP) 7 038 6 598 904 1 160 -15 -122 889 1 038
Grieg Star 1 1 335 3 850 -121 104 -132 -167 -253 -64
Grieg Logistics 397 330 -6 -14 -44 13 -50 -2
Grieg Investor 75 69 12 15 0 0 12 16
Grieg Shipbrokers 115 105 9 6 1 -5 10 1
Ryfylke Rensefisk 101 54 23 9 -2 -2 21 7
Finance/Investment companies 3 3 -24 -19 392 30 368 11
Other 2 -43 -59 3 5 -337 -156 -334 -150
Sum Grieg Group 9 059 10 985 815 1 280 -144 -411 671 870‘1 On May 2nd, 2017, Grieg Star and Gearbulk established their new joint venture G2 Ocean. Although the establishment of G2 Ocean took place well into the financial year 2017, Grieg Star’s annual accounts have been restated for the entire 2017, in order to reflect the actual situation going forward, where Grieg Star’s freight income is made
up of an equivalent to net time charter hire received on its open hatch and dry bulk fleet. The 2017 figures are concequently not comparable to previous years accounts.
2 Other includes the Groups’s holding company, management service company and eliminations.
Note 3 Other operating expenses
GROUP(Amounts in NOK 1000)
Operating costs - shipping 2017 2016
Voyage costs - shipping 77 633 2 067 761
Timecharter costs - shipping 240 847 335 217
Ship operating costs 546 128 571 970
Operating costs - shipping 864 608 2 974 948
Cost of sales - fish farming 2017 2016
Cost of sales - fish farming 3 756 423 3 671 731
Change in inventories -1 719 -344 433
Cost of sales - fish farming 3 574 704 3 327 298
Other operating expenses 2017 2016
Freight and cost of services 285 997 240 739
Other operating expenses 1 865 644 1 649 615
Other operating expenses 2 151 641 1 890 355
The Group has the following long term operating lease agreements related to chartering of vessels, offices, plant and machinery.
2017 Duration Number of vessels Operating lease expense
Long-term time charter 0-4 years 5 185 918
Bare-boat hire 1-14 years 4 106 593
Other lease amount charged in the year 2-10 years 177 775
Total lease amount charged 470 285

15 ANNUAL REPORT2017
Note 4 Payroll costs, number of employees, remuneration etc.
PARENT COMPANY(Amounts in NOK 1000)
Total payments for salary, pension premium and other remuneration to Managing Director:
Payroll and social security costs 2017 2016Salaries and other benefits 3 093 2 706
Social security costs 463 399
Pension costs 163 96
Other benefits 139 139
Total 3 858 3 340
The Managing Director is the only employee in the company. There has been no renumeration to the Board of Directors in Grieg Maturitas. Total remu-neration to Managing Director is specified under renumeration to executives below.
GROUP(Amounts in NOK 1000)
Payroll and social security costs 2017 2016Salaries 656 585 736 401
Social security costs 69 451 66 562
Pension costs 47 662 49 443
Other benefits 99 005 100 109
Total 872 703 952 516
Number of employees 1 138 1 155
Number of sailing personnel1 743 755
Total 1 881 1 9101 Salary costs are recognised in the P&L as operating costs - shipping.
Remuneration to executives
In 2017 total payments to salary, pension premium and other remuneration to Managing Director was NOK 3,7 mill. and to Board members NOK 13,3 mill. (14,6 mill. last year). Remuneration to the Board members and Group Managing Director is paid from the companies where the Director is employed or a member of the Board.
2016 Duration Number of vessels Operating lease expense
Long-term time charter 0 - 5 years 6 220 949
Bare-boat hire 2-12 years 4 105 854
Other lease amount charged in the year 3-10 years 62 036
Total lease amount charged 388 839

16 ANNUAL REPORT2017
Note 5 Pensions and pension commitments
PARENT COMPANY
Defined contribution based pension scheme
The defined contribution based pension scheme covers all full-time and part-time employees and amounts to between 7% and 20% of salary. At year-end 2017 one person was covered by the scheme. The contribution charged in the accounts for 2017 amounted to TNOK 163 (excluding National Insurance Contributions).
GROUP
(Amounts in NOK 1000)
The Group companies in Norway have pension schemes which meet the requirements of the Act relating to compulsory occupational pension schemes. Most of existing employees in Group companies in Norway are now transferred from having a defined benefit based pension scheme to having a defined contribution based pension scheme. All new employees are offered a contribution based pension scheme. Most of the Group companies abroad have a defined contribution based pension scheme.
Total pension costs distributes as follows 2017 2016
Defined contribution pension 35 238 38 299
Defined benefit pension, incl. AFP 6 083 11 144
Pension costs - discontinued operations 6 361 -
Total 47 662 49 443
Defined contribution based pension scheme
The defined contribution based pension scheme covers full-time and part-time employees and amounts to between 7% and 20% of salary. The contribu-tion charged in the accounts in 2017 amounted to NOK 35,3 mill. (excluding National Insurance Contributions).
Defined benefit based pension scheme
Some companies in the Group have defined benefit pension scheme. The Group pension scheme is funded through the accumulation of pension fund assets in an insurance company or through operations. The scheme gives an entitlement to defined future benefits.
In 2017 a total of 132 persons (including pensioners and persons on early retirement) were covered by the benefits based scheme.
Net pension costs, including National Insurance Contribution 2017 2016
Present value of pension entitlements 3 410 8 184
Interest expenses on pension entitlements 2 006 4 030
Return on pension fund assets -2 137 -3 583
Accounting effect of estimate divergences and plan changes 1 858 891
This years change, provision for undercoverage CPA - 635
Administration expenses 926 987
Pension costs for the year 6 083 11 144
Pension fund assets/liabilities 2017 2016
Calculated pension commitments - 153 492 -182 401
Pension fund assets (at market value) 93 127 99 324
Unposted effect of estimate divergences 175 8 470
Net pension fund assets/(liabilities) -60 190 -74 610
of which unfunded obligations - 28 685 -44 493
2017 2016Financial assumptions: Norway Norway Canada
Discount rate 2,40% 2,10% 3,60%
Anticipated rise in salaries 2,50% 2,25% 2,40%
Anticipated return on pension fund assets 4,10% 3,00%
Anticipated increase of pensions 2,25% 2,00%
Anticipated rise in pensions, regulation of National Insurance Base rate 2,25% 2,00%

17 ANNUAL REPORT2017
Note 6 Fixed assets
GROUP
(Amounts in NOK 1000)
Land and real estate
Vehicles, machinery and
equipment
Loading and discharging equipment Vessels Total
Purchase cost at 01.01. 1 506 071 2 770 306 300 985 11 406 332 15 983 694
Currency translations differences -16 532 13 981 -14 491 -549 192 -566 233
Additions 156 628 547 941 - 72 942 777 512
Disposals -121 154 -85 422 -286 494 - -493 069
Purchase cost at 31.12. 1 525 013 3 246 808 - 10 930 082 15 701 903
Accumulated depreciation -432 895 - 1 669 750 - -4 231 163 -6 333 808
Accumulated write-down -399 -41 972 - -235 259 -277 630
Balance sheet value at 31.12. 1 091 720 1 535 086 - 6 463 659 9 090 465
Depreciation 64 975 189 756 - 317 253 571 983
Write-down (reversal) - 273 - - 273
Economic lifetime 20-50 years 3-20 years 10 years 25-30 years
Depreciation plan Linear Linear Linear Linear
Land & Realestate: Investments is mainly related to Grieg Seafood ASA and expansion of fish hatcheries in Finnmark and Rogaland, Ryfylke Rensefisk Group investing in production facilities at Talgje and Grieg Property refurnishing the Grieg Group head quarters in Bergen.
Vehicles, machinery and equipment: Additions is mainly related to equipment for Grieg Seafood ASA s expansion of fish hatcheries in Finnmark and Rogaland and Ryfylke Rensefisk Group s facilities at Talgje.
Loading and discharghing equipment: All loading and discharghing equipment is demerged to G2Ocean AS when Grieg Star enteried into the joint venture.
Vessels/Newbuildings: The newbuilding contract for Star Iris was cancelled in april 2017 and for Star Nike in September 2017. Paid in instalments have been refunded including interests. In addition, there is a realized loss of NOK 1.3 mill. regarding the two vessels in 2017.
Financial lease agreements: Grieg Seafood ASA has financial lease agreements on real estate, vehicles, machinery and other equipment. with book value of NOK 306 mill. per 31.12. Total depreciation on financial lease agreements in Grieg Seafood ASA in 2017 is NOK 37 mill. Estimated total lease amount on financial lease agreements for Grieg Seafood ASA is NOK 312 mill, with NPV of NOK 260 mill.

18 ANNUAL REPORT2017
Note 8 Investments in subsidiaries
COMPANY(Amounts in NOK 1000)
Subsidiary Registered office OwnershipProportion of
voting shares, %
Book equity 100% Book value Dividend
Grieg Maturitas II AS Bergen 75% 100% 5 109 851 4 021 796 416 014
Grieg Maturitas II AS, which is owned 75% by Grieg Maturitas AS and 25% by Grieg Foundation, is the common holding company of the Group.
GROUP
The consolidated financial statements comprise the company Grieg Maturitas AS and Grieg Maturitas II AS with the following subsidiaries:
Grieg Maturitas II AS owns the following companies: Registered officeDirectly
ownership %
Directly and indirectly
ownership %
Grieg Star Group AS Bergen 45,5% 100%
Grieg Logistics AS Bergen 100% 100%
Grieg Holdings AS Bergen 83,7% 100%
Grieg Property AS Bergen 58,99% 100%
Grieg International AS Oslo 100% 100%
Grieg Ltd AS Bergen 100% 100%
Grieg Group Resources AS Bergen 100% 100%
Note 7 Intangible assets
GROUP
(Amounts in NOK 1000)
Goodwill ContractsResearch and development Licenses Total
Purchase cost at 01.01 174 730 151 097 27 065 1 123 697 1 476 589
Currency translations differences -2 786 -7 254 - 9 290 -750
Additions 1 977 9 010 15 244 5 236 31 467
Disposals - - - -36 -36
Purchase cost at 31.12 173 921 152 852 42 309 1 138 187 1 507 270
Accumulated depreciation -65 036 -112 984 -11 129 -50 353 -239 503
Accumulated write-down -89 603 - -2 700 - -92 303
Balance sheet value at 31.12. 19 283 39 867 28 480 1 087 834 1 175 464
Depreciation 5 379 8 243 6 227 4 929 24 778
Write-down (reversal) - - 2 700 - 2 700
Economic lifetime 3-20 years 10 years 3-10 years 5-25 years/unlimited
Depreciation plan Linear Linear Linear Linear/none
Contracts: represent excess values related to the vessels’ contracts of affreightment through the participation in the G2 Ocean pool and purchased divi-dend rights in the Grieg Shipbrokers Group.
Research and development: relates to logistic systems in Grieg Logistics Group and new digital software solutions in Grieg Investor AS.
Licenses relates to fish-farming licenses in Grieg Seafood ASA and Ryfylke Rensefisk Group. Most licenses have an unlimited economic lifetime, but is subject to a yearly valueassessment to determine if write-downs are required.

19 ANNUAL REPORT2017
Grieg Holdings AS owns the following companies: Registered office Ownership %
Proportion of voting
shares, %
Grieg Seafood ASA Bergen 49,97% 49,97%
AS Joachim Grieg & Co Bergen 100% 100%
Grieg Shipbrokers KS Bergen 55,45% 55,45%
Joachim Grieg Star KS Bergen 59,91% 59,91%
Grieg Shipbrokers Ltd. London, UK 55% 55%
Grieg Shipbrokers Asia AS Bergen 100% 100%
Grieg Shipbrokers Asia Ltd Shanghai 100% 100%
Grieg Shipbrokers Asia Pte. Ltd Singapore 100% 100%
Grieg Holdings II AS Bergen 100% 100%
Rensefisk Holding AS Finnøy 60% 60%
Silves Odissey Inv. and Techn. Lda. Portugal 90% 90%
Grieg Property AS owns the following companies Registered office Ownership %
Proportion of voting
shares, %
Grieg Gaarden AS Bergen 100% 100%
AS Nestun Uldvarefabrik Bergen 100% 100%
CSG15 AS Bergen 100% 100%
Grieghallen Parkering II AS Bergen 36,25% 36,25%
Grieghallen Parkering AS Bergen 36,25% 36,25%
Grieg Star Group AS owns the following companies: Registered office Ownership %
Proportion of voting
shares, %
Grieg Shipowning AS Bergen 100% 100%
Grieg Shipping II AS Bergen 100% 100%
Grieg International II AS Oslo 100% 100%
Grieg Star 2017 AS Bergen 100% 100%
Grieg Star AS Bergen 100% 100%
Grieg Star Bulk AS Bergen 100% 100%
Grieg Green AS Oslo 100% 100%
Grieg Consulting and Advisory Company Ltd. Shanghai, China 100% 100%
Grieg Star Shipping AS Bergen 100% 100%
Grieg Star Shipping (Canada) Ltd. Vancouver B.C., Canada 100% 100%
Squamish Terminals Ltd. Squamish BC, Canada 100% 100%
Grieg Ltd AS owns the following companies: Registered office Ownership %
Proportion of voting
shares, %
Grieg Star Group AS Bergen 30,09% 39,80%
Grieg Property AS Bergen 41,01% 55,70%
Grieg Holdings AS Bergen 16,13% 21,50%
Grieghallen Parkering II AS Bergen 11,27% 11,27%
Grieghallen Parkering AS Bergen 11,27% 11,27%
Grieg Investor Holding AS Oslo 15,00% 26,67%
Grieg Investor AS Oslo 15,00% 26,67%
Grieg Seafood ASA Bergen 0,19% 0,19%

20 ANNUAL REPORT2017
Grieg International AS owns the following companies: Registered office Ownership %
Proportion of voting
shares, %
Grieg Star Group AS Bergen 24,38% 32,25%
Grieg Investor Holding AS Oslo 30,00% 53,33%
Grieg Investor AS Oslo 30,00% 53,33%
Grieg Logistics AS owns the following companies: Registered office Ownership %
Proportion of voting
shares, %
Scandinavian Harbour Service AS Tønsberg 100% 100%
Mosjøen Industriterminal AS Mosjøen 100% 100%
Seamless AS Kristiansand 70% 70%
Shiplog AS Kristiansund 51% 51%
Grieg Strategic Services AS Bergen 100% 100%
Grieg Port Security AS Bergen 100% 100%
Registered officeGrieg Seafood ASA owns the following companies: Ownership %
Proportion of voting
shares, %
Grieg Seafood Rogaland AS Bergen 100% 100%
Grieg Seafood Finnmark AS Alta 100% 100%
Grieg Seafood Canada AS Bergen 100% 100%
Grieg Seafood BC Ltd. Canada 100% 100%
Grieg Seafood Hjaltland UK Ltd. UK 100% 100%
Grieg Seafood Shetland Ltd. UK 100% 100%
Ocean Quality AS Bergen 60% 50%
Ocean Quality UK Ltd. UK 60% 50%
Ocean Quality North America Inc. Canada 60% 50%
Rensefisk Holding AS owns the following companies: Registered office Ownership %
Proportion of voting
shares, %
Ryfylke Rensefisk AS Finnøy 100% 100%
Finnmark Rensefisk AS Alta 100% 100%
Marin Innovasjon AS (former Sea Urchin Farm AS) Finnøy 100% 100%
Lønningdal Rensefisk AS Os 60% 60%
Austevoll Rensefisk AS Austevoll 72% 72%

21 ANNUAL REPORT2017
Note 9 Investments in associated companies and joint ventures
GROUP(Amounts in NOK 1000)
Ownership %Registered
officeBook value
01.01 Addition
Share of profit/loss
for the yearOther
changesBook value
31.12
Excess value incl. in book
value 31.12.
Fram Marine AS1 25% Oslo 2 281 - - - 2 281 219
Tytlandsvik Aqua AS 16,67% Bergen - 10 000 -550 - 9 450 -
Grieg Newfoundland AS 50% Bergen - - - - - -
Gulen Base AS2 51% Bergen - 40 204 -40 204 - -
G2 Ocean Holding AS 5
35% Bergen - 81 412 -14 259 -565 66 588 -
Rogaland Havbrukspark Eiendom AS 50% Finnøy 500 - - - 500 -
Rogaland Havbrukspark AS 30% Finnøy 15 - - - 15 -
Grieg Strategic Services AS3 100% Bergen 1 478 - - - 1 478 - -
Grieg Port Security AS4 100% Bergen 133 - - - 133 - -
Sum 4 407 131 616 -55 013 -2 176 78 834 219
� Booked according to the cost method.2 Gulen Base has been consolidated as a subsidiary until 2017. There has not been any acitivty in 2017 and the company is now for sale. Based on this process, it is as-sessed that Grieg Logistics AS no longer have controlling influence and as a consequence the investment in Gulen Base should be considered as an associated company, and booked according to the equity method. 3 In 2017, Norwind AS changed name to Grieg Strategic Services and is now a 100% owned subsidiary in the Grieg Group4 In 2017, Norwind Installer AS changed name in to Grieg Port Security AS and is now a 100% owned subsidiary in the Grieg Group5 In May 2017, Grieg Star and Gearbulk established their new joint venture G2 Ocean Holding AS.
Note 10 Financial items(Amounts in NOK 1000)
Parent company GroupOther Financial Income 2017 2016 2017 2016Interest income 932 1 216 25 700 24 070
Gain on sale of investments - - 80 773 34 938
Other financial income - - 49 745 30 932
Total financial income 932 1 216 156 217 89 940
Parent company GroupOther Financial Expenses 2017 2016 2017 2016Interest expenses - - 257 857 264 161
Write-down of financial fixed assets - - - 129 676
Other financial expenses 2 1 22 094 142 008
Total financial expenses 2 1 279 951 535 485
Tytlandsvik Aqua ASGrieg Seafood invested MNOK 10 in Tytlandsvik Aqua AS in 2017, which corresponds to 16.67% of the shares in the company Remaining shares are owned by Bremnes Sea-shore AS (16.67%) and Vest Havbruk AS (66.67%). Tytlandsvik Aqua AS will contribute to increased access to postmolt During 2018, Grieg Seafood and Bremnes Seashore AS will increase their ownershare by capital increase, so that all the owners have the same amount of shares in Tytlandsvik Aqua AS. The parties have agreed that Grieg Seafood and Bremnes Seashore AS will be guarantueed organizational rights as if they own 1/3 of the shares, already from the first payment of MNOK 10 in 2017, including the right to appoint board members and voting rights at the general meeting. Therefore, the Group has included share of the consolidated financial statements although the owner share is 16,67%. In the agreement, the Group has the right and obligation to purchase the remaining shares in 2018 , in three transactions of respectively MNOK 10, a total of MNOK 30. The share of income included corresponds to ownership interest (16.67%) in the ownership period in 2017.
22 ANNUAL REPORT2017
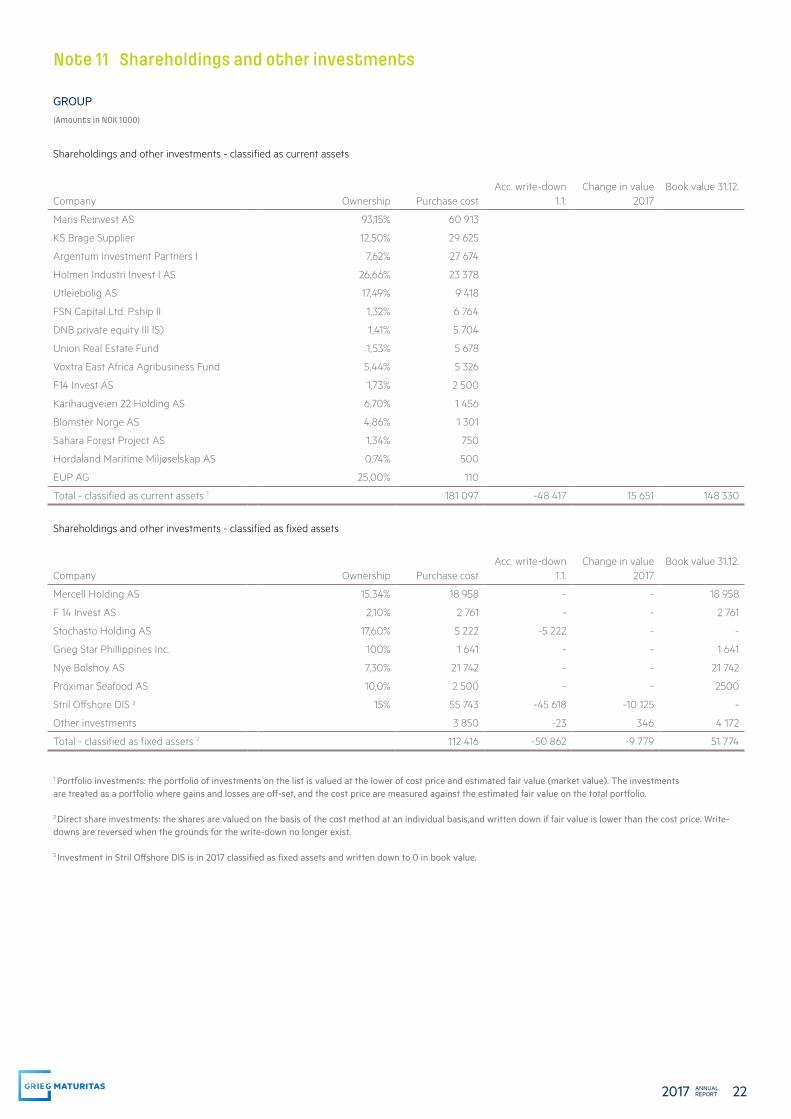
Note 11 Shareholdings and other investments
GROUP(Amounts in NOK 1000)
Shareholdings and other investments - classified as current assets
Company Ownership Purchase costAcc. write-down
1.1.Change in value
2017Book value 31.12.
Maris Reinvest AS 93,15% 60 913
KS Brage Supplier 12,50% 29 625
Argentum Investment Partners I 7,62% 27 674
Holmen Industri Invest I AS 26,66% 23 378
Utleiebolig AS 17,49% 9 418
FSN Capital Ltd. P.ship II 1,32% 6 764
DNB private equity III IS) 1,41% 5 704
Union Real Estate Fund 1,53% 5 678
Voxtra East Africa Agribusiness Fund 5,44% 5 326
F14 Invest AS 1,73% 2 500
Karihaugveien 22 Holding AS 6,70% 1 456
Blomster Norge AS 4,86% 1 301
Sahara Forest Project AS 1,34% 750
Hordaland Maritime Miljøselskap AS 0,74% 500
EUP AG 25,00% 110
Total - classified as current assets 1 181 097 -48 417 15 651 148 330
Shareholdings and other investments - classified as fixed assets
Company Ownership Purchase costAcc. write-down
1.1.Change in value
2017 Book value 31.12.
Mercell Holding AS 15,34% 18 958 - - 18 958
F 14 Invest AS 2,10% 2 761 - - 2 761
Stochasto Holding AS 17,60% 5 222 -5 222 - -
Grieg Star Phillippines Inc. 100% 1 641 - - 1 641
Nye Bolshoy AS 7,30% 21 742 - - 21 742
Proximar Seafood AS 10,0% 2 500 - - 2500
Stril Offshore DIS 3 15% 55 743 -45 618 -10 125 -
Other investments 3 850 -23 346 4 172
Total - classified as fixed assets 2 112 416 -50 862 -9 779 51 774
1 Portfolio investments: the portfolio of investments on the list is valued at the lower of cost price and estimated fair value (market value). The investments are treated as a portfolio where gains and losses are off-set, and the cost price are measured against the estimated fair value on the total portfolio. 2 Direct share investments: the shares are valued on the basis of the cost method at an individual basis,and written down if fair value is lower than the cost price. Write-downs are reversed when the grounds for the write-down no longer exist.
3 Investment in Stril Offshore DIS is in 2017 classified as fixed assets and written down to 0 in book value.

23 ANNUAL REPORT2017
Note 13 Receivables due in more than one year
GROUP
(Amounts in NOK 1000)
2017 2016
Loan to associated companies 28 033 20 524
Spoolbase project (Gulen Base AS) - 219 629
Other receivables 20 230 61 567
Total 48 263 301 720
Note 14 Market based financial investments
GROUP(Amounts in NOK 1000)
Purchase cost Market value
Individual shareholdings 11 884 8 728
Mutual funds 247 354 367 949
Bonds 231 233 236 353
Money market funds 188 950 189 861
Total 679 421 802 891
Unrealised gain this year of market based financial investments 34 309
Note 15 Debt payable after 5 years
GROUP(Amounts in NOK 1000)
2017 2016Long-term debt - maturity more than 5 years 736 761 843 147
Note 12 Stock and bunkers
GROUP
(Amounts in NOK 1000)
2017 2016Stocks raw materials - fish farming 94 619 91 448
Stocks goods in progress - fish farming 2 025 593 1 635 138
Stocks of finished goods 50 7 821
Stocks of bunkers and lub oil 30 454 134 860
Total stocks and bunkers 2 150 717 1 869 267

24 ANNUAL REPORT2017
Note 16 Mortgages/guarantee liability/restricted funds
PARENT COMPANY(Amounts in NOK 1000)
2017 2016Restricted deposits related to employees’ tax deduction 188 173
GROUP(Amounts in NOK 1000)
2017 2016Restricted deposits related to employees’ tax deduction 32 188 26 732
Short term fixed interest restricted deposits - 160 000
Total 32 188 186 732
Debt secured by mortgage (including overdraft facilities) 2017 2016Mortgaged debt - long term 5 922 420 6 623 751
Other long term liabilities - 3 328
Factoring and short term debt 509 849 502 535
Total mortgaged debt 6 432 269 7 129 614
Group assets have been given as mortgage security
Balance sheet value of mortgaged assets 2017 2016Receivables 783 146 945 373
Vessels and newbuildings 6 388 909 7 099 523
Other assets 2 134 746 2 292 432
Licences 1 068 552 1 060 622
Stocks 2 117 908 1 734 228
Total 12 493 260 13 132 179
Pledges include shares in subsidiaries. The book value of these shares is 0 in the consolidated accounts.
2017 2016Total guarantee liability 489 553 543 060
Undrawn borrowing facilities 609 650 826 200
Loan covenants
Grieg Star Group (GSG) is per year end 2017 required to have minimum liquid funds of USD 35 mill. A common covenant for all mortgage loans is that GSG must continue to be controlled by the Grieg familiy. GSG has met its loan covenant commitments throughout the year.
The covenants of Grieg Seafood’s credit facility is an equity ratio in excess of 35%, without consolidation of Ocean Quality Group, and a revolving NIBD/EBITDA ratio of 5.0 if the equity ratio is higher than 40% and 4.5 if the equity ratio is between 35% and 40%. As at 31 December 2017, the equity share exclusive of Ocean Quality was 52% and NIBD/EBITDA 1.2 Grieg Seafood has met its loan covenant commitments throughout the year. In 2018, Grieg Seafood has signed a term sheet regarding refinancing the credit facilities. See note Note 18 for further information.

25 ANNUAL REPORT2017
Note 17 Financial risk
The Group is exposed to a range of financial risks; market risk (including currency risk, cashflow interest rate risk, fair value interest rate risk and price risk), credit risk and liquidity risk. The Group uses various financial derivatives to manage its financial risk.
Market riskSeveral of the Group’s companies have considerable financial investment portfolios, and changes in the value of international securities and interest rates directly affect their results. The portfolios are managed in accordance with long-term strategies and within defined mandates, also reflecting the Group’s business principles.
Foreign exchange riskA large proportion of the Group’s revenues, assets and liabilities are in foreign currencies, mainly USD and EUR. Changes in foreign exchange rates therefore affect the accounts, which are prepared in NOK. The Group companies have strategies and procedures to reduce both the exchange rate and interest rate
Grieg Star Group hedges expenditures in currencies other than USD through forward contracts. At 31.12.17 the company had entered into hedging through the use of currency swaps for USD 1.9m. Total unrealised MTM value, not recognised in the balance sheet, at 31.12.17 was USD 0.009m.
Grieg Shipbrokers had 31.12.17 forward contracts to hedge a total of USD 17,4 m, of which USD 9,3 m applies to hedging of reasonably secure transac-tions, ref NRS 18. As of 31.12.17, the contracts had an unrealized, not recognised gain of TNOK 899.
Credit and counterparty risk
The Group’s credit risk that counterparties do not have financial ability to meet their obligations is considered to be relatively low, due to solid cus-tomers, a diversified portfolio, and historically there has been small losses on receivables. The Group works hard to mitigate the counterparty risk by building good procedures and systems. In some parts of the Group with a large customer portfolio, the risk is reduced by maintaining good procedures for assessing counterparty risk and credit rating.
Liquidity riskThe Group constantly monitors liquidity reserves and needs. The Group’s liquidity risk has increased, but strong liquidity and a focus on cash manage-ment ensure that there is sufficient liquidity to meet the Group’s obligations when they mature. Interest rate riskInterest rate risk arises in the short and long term as most parts of the Group’s debt are at a floating rate of interest. A change in interest rates will result in either an increase or a reduction of the financing cost. If certain interest rate derivatives are applied then the predictability of the financing cost will increase due to a limitation of the net effect of a change in interest rates. In addition a change in interest rates will affect the returns on the investment portfolio and the rates on cash deposits. The Group’s strategy is to employ a certain level of hedging using interest rate swap agreements to establish greater stability for the Group’s loan interest expenses.
Gains and losses rising from interest rate swaps in the Grieg Star Group are recognised in the same period as the related interest expense.
At 31.12.17 the Grieg Star Group held interest rate swap agreements of USD 224m. Total unrealised MTM value, not recognised in the balance sheet, was USD -5.1m.
Gains and losses rising from interest rate swaps in Grieg Seafood are not subject to hedge accounting and are recognised as the gains or losses arise. Grieg Seafood had interest swap agreement totalling NOK 660 mill. at 31.12.17. Unrealized loss attached to this agreement, recognised in the balance sheet, amounts to NOK -4,1 mill. Interest rate swap agreements have a horizon of 4 years and whether these periods are to be rolled over is a matter of constant evaluation.
Freight rate riskThe Group’s ship earnings are to a large extent related to cargo transportation contracts as a considerable share of the shipping activities are of an industrial character. The open hatch fleet’s earnings are to a large extent related to long term cargo contracts. This implies that revenues are less volatile than in the spot market, and that changing market conditions generally have a delayed effect on the results. The group’s dry bulk activity is on the other hand more exposed to general spot market movements.
Salmon pricesThe Group is also exposed to fluctuations in the spot prices for salmon, which is mainly determined by global supply. Although the effect of changing prices is somewhat reduced through Grieg Seafood’s geographical diversification, the long production cycles makes it challenging to respond rapidly to changing market prices. Salmon is primarily traded at spot prices. The price risk is partly hedged through financial purchase contracts. At year end 2017 unrealized gains of TNOK 42.914 related to these contracts is not recognized in the balance sheet, the Group had no financial price contracts or physical delivery contracts that would give a loss at year end.

26 ANNUAL REPORT2017
Note 19 Taxes
PARENT COMPANY
(Amounts in NOK 1000)
Tax expense consists of: 2017 2016Ordinary result before tax 415 211 74 905
Permanent differences -415 974 -74 472
Change in temporary differences 73 29
Basis of tax payable in profit and loss account -690 462
Tax losses carried forward - -
Basis for payable taxes in the income statement 0 462
Components of the income tax expense
Payable tax on this years result 0 116
Change in deferred tax -177 -8
Tax expense (-income) -177 108
Deferred tax 2017 2016Taxable differences 93 116
Tax-deductible differences -50 -
Tax credit carried forward -690 -
Basis for deferred tax -647 116
Deferred tax in the balance sheet -149 28
Note 18 Contingencies and subsequent events
The Grieg Group is neither a party to any court case nor the subject of any other litigation beyond what is normally associated with ordinary operations.
Grieg Seafood’s growth targets comprise increased smolt capacity and new sites. The planned investments are higher than what is considered to be a normal maintenance investment which requires increased working capital. Grieg Seafood has renegotiated the Group’s credit facilities before agreed ma-turity in 2019. Total credit facilities are increased from MNOK 1 910 to MNOK 1 700 in addition to MEUR 60. The revolving loan facility is extended from MNOK 700 to MNOK 1000. In addition, a bank overdraft of MNOK 100 is granted. Term loans of MNOK 600 and MEUR 60 will be repaid in semiannually installments of respectively MNOK 50 and MEUR 5. The financing has a maturity of 5 years, with due date 28 February 2023.
31 January 2018 Ocean Quality AS received a decision from the Norwegian Food Safety Authority (the “NFSA”) to suspend all export of Norwegian salmon from the company to China. Quality AS is suspended from exporting Norwegian Salmon to China on the basis that NFSA has received incorrect documentation regarding shipments of salmon exported to China. From what Ocean Quality knows, individuals in the company has, in violation of the internal guidelines, deliberately re-used earlier declarations. Neither, any individual employee nor the Company have had any gain from these alleged actions. After the NFSA’s control, Ocean Quality has conducted a complete review of its internal routines and export systems to find out how this could occur. New controls and improved routines have been implemented. Furthermore, two employees have been suspended with immediate effect. Grieg Seafood has a zero tolerance for the above-mentioned violation.
In February 2018 it was discovered a hole in a net on Shetland. The fish in the relevant cage has been counted. There was a deviation of 21 700 fish. Write-down related to this incident is assessed to GBP 200 101, equivalent to approx. MNOK 2,2.

27 ANNUAL REPORT2017
GROUP
(Amounts in NOK 1000)
Tax expense consists of: 2017 2016Profit before tax 671 005 869 577
Profit before tax, companies subject to shipping tax -425 414 -394 173
Profit before tax, companies not subject to shipping tax 1 096 419 1 263 750
Permanent differences -183 034 -193 307
Change in temporary differences -225 102 -140 372
Change in tax loss carried forward 31 302 -242 582
Group contribution - 55 883
Basis of tax payable, companies not subject to shipping tax 719 586 743 372
Tax payable, companies not subject to shipping tax 174 017 184 557
Tax charge in profit and loss account - 37 153
Tax payable 174 017 221 710
Increase / (decrease) in deferred tax 33 344 30 589
Adjustment prior year - -36 594
Tax charge for the year on ordinary result 207 362 215 705
Tax payable in balance sheet 2017 2016Tax payable, companies not subject to shipping tax 164 743 178 592
Tonnage tax 3 757 4 680
Tax prepaid -4 491 -3 402
Other adjustments (treasure trove) 1 577 -1 914
Total tax payable in balance sheet 165 586 177 956
Deferred tax 2017 2016Taxable timing differences 2 009 784 1 565 981
Tax-deductible timing differences -13 615 -48 834
Tax loss to be carried forward -748 643 -448 622
Net timing differences 1 247 526 1 068 525
Deferred tax on net timing differences 322 883 268 315
Unposted deferred tax assets 86 077 91 704
Net deferred tax in balance sheet 408 960 360 019
Loss carried forward 2017 2016Norway, companies not subject to shipping tax -305 870 -128 102
UK -92 427 -33 027
Companies subject to shipping tax -350 346 -287 492
Total -748 643 -448 622

28 ANNUAL REPORT2017
Note 21 Share capital and share information
At 31 December 2017 the share capital of Grieg Maturitas AS consisted of 1 123 530 shares of nominal value NOK 1.
The share capital consists of the following share classes:
Class Number of shares Nominal Book value
A-shares 201 600 1,- 201 600
B-shares 921 930 1,- 921 930
Total 1 123 530 1 123 530
The A class shares carry both voting and dividend rights. The B class shares carry no voting rights, but are entitled to dividends.
Note 20 Equity
PARENT COMPANY(Amounts in NOK 1000) Share
capital Share premium Other equity Total
Equity - Opening Balance 1 124 702 263 3 461 825 4 165 212
Profit of the year - - 415 387 415 387
Dividend paid during the year - - -223 514 -223 514
Provision for dividend - -292 500 - -292 500
Equity - Closing Balance 1 124 409 763 3 653 699 4 064 585
GROUP(Amounts in NOK 1000) Share
capitalShare
premiumGroup
reservesMinority interests Total
Equity - Opening Balance 1 124 702 263 4 111 162 2 824 977 7 639 526
Profit for the year - - 69 228 394 415 463 643
Provision for dividend at year end - -292 500 0 -105 733 -398 233
Dividend paid during the year - - -223 514 -324 884 -548 398
Effect of changed ownership in subsidiaries 1 - - -28 633 -9 276 -37 909
Currency translation differences 2 - - -120 681 -40 389 -161 071
Equity transactions 3 - - 9 432 4 923 14 355
Other changes - - 16 464 -8 420 8 044
Equity - Closing Balance 1 124 409 763 3 833 459 2 735 613 6 979 957
1 Please see note 9 for further information 2 Currency translation differences: this is primarily the effect of converting subsidiaries from local currencies into NOK, and the major effect is from Grieg Star Group.
3 Equity transactions: the total amount is similar to the OCI (other comprehensive income) from Grieg Seafood ASA in their IFRS financial statements, which is transformed into NGAAP for consolidation purposes in Grieg Maturitas Group.

29 ANNUAL REPORT2017
Note 22 Related parties
PARENT
(Amounts in NOK 1000)
Operating revenue
Operating cost
Financial income*
Financial expenses
Accounts payable
Current receivables*
Transactions 3 100 183 416 014 - 14 292 500
* Dividend from subsidiaries
GROUP
(Amounts in NOK 1000)
Members of the board and managing director of the parent company, including their related parties, are with companies in the Group considered as closely related parties. Transactions and intercompany balances with group companies are eliminated in the Group accounts, and is not mentioned below. Remuneration to directors and managing director, see Note 4.
Operating revenue
Operating cost
Financial income
Financial expenses
Long-term receivables
Current receivables
Transactions 1 227 19 275 171 0 785 1 466
Note 23 Remuneration to auditor
Specification of Group auditor’s fee
(Amounts in NOK 1000)
Parent company Group
Auditor 2017 2016 2017 2016Statutory audit 16 30 6 424 5 803
Taxation advice - - 578 1 140
Other assurance services - - 1 297 257
Other assistance - - 940 2 026
Total (exluding VAT) 16 30 9 239 9 226
The amount above includes remuneration to other auditors with: 1 364 1 999
The company’s shareholders are as follows: A-shares B-shares Total
Kvasshøgdi AS 12,63 % 40 420 101 480 141 900
Nye Ystholmen AS 5,89 % - 66 144 66 144
Nina WG. AS 3,85 % 9 980 33 323 43 303
Salthavn AS 15,64 % 35 224 140 440 175 664
Salthavn Invest AS 6,74 % 15 176 60 507 75 683
GMC Invest AS 22,37 % 50 400 200 947 251 347
Suletind AS 22,37 % 50 400 200 947 251 347
Capelka AS 10,52 % - 118 142 118 142
Total 100 % 201 600 921 930 1 123 530
Through the companies specified above, the shareholders and their families have control of 100% of the shares in Grieg Maturitas AS.

30 ANNUAL REPORT2017
Note 24 Discontinued operations
When establishing the joint venture G2 Ocean, it was agreed that certain assets and liabilities held by Grieg Star Group’s subsidiary Grieg Star Shipping AS should be demerged and sold to G2 Ocean. The demerger was carried out with accounting effect 1 January 2017. Profit/(loss), cash flows, assets and liabilities related to the discontinued operations are included in the consolidated financial statements for 2016 and 2017. Below is a summary of financial information for the discontinued operations:
(Amounts in NOK 1000) 2017 2016Operating revenue 0 3 168 038
Voyage related expenses 0 -2 005 944
Operating expenses 0 -114 337
Net TC 0 1 047 757
Hire chartered vessels 0 -77 019
Distributed TC hire to participating vessels 0 -960 312
Operating profit 0 10 426
Profit/(loss) before tax - 1 958 4 726
Tax 12 226 - 2 309
Profit/(loss) for the period 10 267 2 417
Gain disposal discontinued operations 57 263 -
G2 Ocean is recorded on the basis of the equity method in the consolidated accounts.


grieg.no