contents report - wced 2014... · contents part a: general information 1. ... province of the...
TRANSCRIPT


Contents
Part A: General Information
1. DEPARTMENT GENERAL INFORMATION ........................................................................................... 1
2. LIST OF ABBREVIATIONS/ACRONYMS .............................................................................................. 2
3. FOREWORD BY THE MINISTER ............................................................................................................ 3
4. REPORT OF THE ACCOUNTING OFFICER ......................................................................................... 5
5. STATEMENT OF RESPONSIBILITY AND CONFIRMATION OF ACCURACY FOR THE ANNUAL
REPORT ................................................................................................................................................ 13
6. STRATEGIC OVERVIEW ...................................................................................................................... 14
6.1 Vision ................................................................................................................................................. 14
6.2. Mission ................................................................................................................................................. 14
6.3. Values ................................................................................................................................................. 14
7. LEGISLATIVE AND OTHER MANDATES ............................................................................................ 14
8. ORGANISATIONAL STRUCTURE ........................................................................................................ 15
9. ENTITIES REPORTING TO THE MINISTER ............................................................................................ 15
Part B: Performance Information
1. AUDITOR GENERAL’S REPORT: PREDETERMINED OBJECTIVES ................................................... 17
2. OVERVIEW OF DEPARTMENTAL PERFORMANCE ......................................................................... 17
2.1 Service Delivery Environment ......................................................................................................... 17
2.2 Service Delivery Improvement Plan .............................................................................................. 19
2.3 Organisational Environment ........................................................................................................... 27
2.4 Key Policy Developments and Legislative Changes ................................................................. 30
3. STRATEGIC OUTCOME ORIENTED GOALS ..................................................................................... 34
4. PERFORMANCE INFORMATION BY PROGRAMME ....................................................................... 37
4.1 Programme 1: Administration......................................................................................................... 38
4.2 Programme 2: Public Ordinary School Education ..................................................................... 48
4.3 Programme 3: Independent School Subsidies ............................................................................ 66
4.4 Programme 4: Public Special School Education ........................................................................ 71
4.5 Programme 5: Further Education and Training ........................................................................... 81
4.6 Programme 6: Adult Basic Education and Training ................................................................... 86
4.7 Programme 7: Early Childhood ...................................................................................................... 91
4.8 Programme 8: Infrastructure Development ................................................................................ 96
4.9 Programme 9: Auxiliary and Associated Services .................................................................... 101
5. Transfer Payments ........................................................................................................................... 110
5.1. Transfer payments to public entities ........................................................................................... 110
5.2. Transfer payments to all organisations other than public entities......................................... 110

6. CONDITIONAL GRANTS .................................................................................................................. 112
6.1. Conditional grants and earmarked funds paid ....................................................................... 112
6.2. Conditional grants and earmarked funds received ............................................................... 112
7. DONOR FUNDS ................................................................................................................................ 118
7.1. Donor funds received .................................................................................................................... 118
8. CAPITAL INVESTMENT ...................................................................................................................... 118
8.1. Capital investment, maintenance and asset management plan ....................................... 118
PART C: GOVERNANCE
1. INTRODUCTION ................................................................................................................................ 124
2. RISK MANAGEMENT ........................................................................................................................ 125
3. FRAUD AND CORRUPTION............................................................................................................. 127
4. MINIMISING CONFLICT OF INTEREST ............................................................................................. 128
5. CODE OF CONDUCT ...................................................................................................................... 128
6. HEALTH SAFETY AND ENVIRONMENTAL ISSUES ........................................................................... 128
7. PORTFOLIO COMMITTEES ............................................................................................................... 128
8. SCOPA RESOLUTIONS ..................................................................................................................... 128
9. PRIOR MODIFICATIONS TO AUDIT REPORTS ................................................................................ 138
10. INTERNAL CONTROL UNIT ............................................................................................................... 139
11. INTERNAL AUDIT AND AUDIT COMMITTEES.................................................................................. 139
12. AUDIT COMMITTEE REPORT ............................................................................................................ 141
PART D: HUMAN RESOURCE MANAGEMENT
1. INTRODUCTION ................................................................................................................................ 144
2. OVERVIEW OF HUMAN RESOURCES .......................................................................................... 1444
3. HUMAN RESOURCES OVERSIGHT STATISTICS .............................................................................. 147
PART E: FINANCIAL INFORMATION
1. REPORT OF THE AUDITOR GENERAL ............................................................................................. 182
2. ANNUAL FINANCIAL STATEMENTS ................................................................................................. 188
APPENDICES
1. APPENDIX A: ACTION PLAN TO 2014 AND DELIVERY AGREEMENT INDICATORS
(NATIONAL) ....................................................................................................................................... 240
2. ANNEXURE B: SUMMARY OF NATIONALLY DETERMINED PROGRAMME PERFORMANCE
MEASURES .......................................................................................................................................... 242
3. ANNEXURE C: PROGRAMME PERFORMANCE INDICATORS – TECHNICAL INDICATORS ..... 249


Annual Report for 2013/14 Financial Year
Vote 5: Department of Education
Province of the Western Cape
1
1. Western Cape Education Department (WCED) General Information
The Western Cape Education Department (WCED) is responsible for public schooling in the
province, from Grades R to 12. The WCED operates in eight Education Districts and has a
Head Office in Cape Town.
Location Postal Address Telephone Fax
WCED Head Office Private Bag 9114, Cape Town, 8000 021 467 2000 021 467 2996
Metro Central Private Bag X4, Athlone, 7760 021 514 6700 021 659 4413
Metro East Private Bag X23, Kuilsriver, 7579 021 900 7000 021 903 9484
Metro North Private Bag X45, Parow, 7500 021 938 3000 021 938 3180
Metro South Private Bag X2, Mitchell's Plain, 7785 021 370 2000 021 372 1856
Cape Winelands Private Bag X3102, Worcester, 6849 023 347 6000 023 342 4138
Eden & Central Karoo Private Bag X6510, George, 6530 044 803 8300 044 873 2253
Overberg Private Bag X08, Caledon, 7230 028 214 7408 028 214 7400
West Coast Private Bag X3026, Paarl, 7620 021 860 1200 021 860 1231
WCED Call Centres:
Personnel and Finance queries: 0861 923 322; Safe Schools: 0800 45 46 47
Website: WCED Online http://wced.school.za
E-mail list: WCEDnews http://list.pgwc.gov.za/mailman/listinfo/wcednews.
Twitter (micro-blogging)
WCEDnews http://twitter.com/wcednews (for news-in-education-related tweets); WCEDlearn
http://twitter.com/wcedlearn (for education-related tweets)
Tumblr (blog)
WCED/News/Home http://wcednewshome.tumblr.com/ ; WCEDnews
http://wcednews.tumblr.com/
Posterous (blog)
WCEDnews http://posterous.com/wcednews

Annual Report for 2013/14 Financial Year
Vote 5: Department of Education
Province of the Western Cape
2
2. List of abbreviations/acronyms
A(B)ET: Adult (Basic) Education and Training IMG: Institutional Management and
Governance
ACE: Advanced Certificate in Education LSEN: Learners with Special Education
Needs
ANA: Annual National Assessment LTSM: Learning and Teaching Support
Materials
ASIDI: Accelerated School Infrastructure
Development Initiative
MTEF: Medium-Term Expenditure
Framework
ASS: Annual School Survey NCS: National Curriculum Statement
CAPS: Curriculum and Assessment Policy
Statement
NC (V): National Curriculum (Vocational)
CEMIS: Central Education Management
Information System
NEPA: National Education Policy Act
CTLI: Cape Teaching and Leadership
Institute
NQF: National Qualifications Framework
DHET: Department of Higher Education and
Training
NSC: National Senior Certificate
DBE: Department of Basic Education NSNP: National School Nutrition
Programme
DEMIS: District Education Management
Information System
PFMA: Public Finance Management Act
DIP: District Improvement Plan PILIR: Policy and Procedure on Incapacity
Leave and Ill-Health Retirement
ECD: Early Childhood Development PPI: Programme Performance Indicator
EIG: Education Infrastructure Grant PPM: Programme Performance Measure
EMIS: Education Management Information
System
RCL: Representative Council of Learners
EPWP: Expanded Public Works Programme SAQA: South African Qualifications
Authority
FAL: First Additional Language SASA: South African Schools’ Act
FET: Further Education and Training SETA: Sector Education and Training
Authority
GET: General Education and Training SGB: School Governing Body
GHS: General Household Survey SIM: School Improvement Monitoring
GIS: Geographic Information System SIP: School Improvement Plan
Gr: Grade SMT: School Management Team
HEI: Higher Education Institution U-AMP: User Asset Management Plan
HL: Home Language WCED: Western Cape Education
Department
ICT: Information and Communication
Technology
WSE: Whole School Evaluation

Annual Report for 2013/14 Financial Year
Vote 5: Department of Education
Province of the Western Cape
3
3. FOREWORD BY THE MINISTER
Over the last five years it has been my privilege to work with the
Western Cape Education Department in improving education
outcomes in this Province. I am proud of what we have, together,
achieved.
Over this period, we have made significant progress towards our
three strategic goals, namely:
improvement in Language and Mathematics in Primary Schools
improvement in the number and quality of passes in the National
Senior Certificate
reduction in number of under-performing schools
Work towards these three goals has led to a pleasing increase in the
retention rate at schools
Given the progress in these areas, I can state categorically that the system is in better shape
than it was five years ago. This is as a result of a team effort by WCED officials, SGBs, parents
and educators as well as partnerships with other Provincial Departments and education
agencies.
While the Western Cape still has some way to go to achieve all the objectives set out in its
strategic plan, we can point to significant progress so far.
In 2010/2011, we laid the foundations needed to complete this plan, and in 2011/2012 and
2012/2013, we built on these foundations, specifically targeting assistance to our poorer
schools and the Foundation Phase.
In 2013/2014, we re-enforced these foundations ensuring further stability in the system.
Some highlights of the 2013/2014 year include the introduction of the e-Recruitment System
which allows teachers to capture and store their CVs online, as well as apply for vacant
teaching posts. Over 20 000 educators registered on the system last year.
We are particularly proud of the various initiatives we have taken in order to assist our poorer
learners and schools. Some highlights included the introduction of a breakfast meal for
learners, in addition to the lunch meal they receive each day; an increase in funding at over
300 fee-paying schools serving less affluent communities; the payment of R42 million in fee
compensation to help schools by alleviating some of the challenges they face as a result of
the non-payment of school fees.
Two hundred and sixteen (216) fee-paying schools serving poor communities opted to
become no-fee schools in the 2014 school year when they were offered this opportunity.
Donald Grant

Annual Report for 2013/14 Financial Year
Vote 5: Department of Education
Province of the Western Cape
4
The 2013/2014 financial year also saw the launch of the School Resource Officer (SRO) pilot,
which aims to build safer school environments, and the construction and/or planning of 15
new schools and 33 replacement schools. 108 maintenance projects were also completed in
schools.
What we have now today is a maturing provincial education system which has responded
positively to a number of systems improvements.
In the 2014/2015 financial year we plan to deepen, re-enforce and strengthen these
strategies to ensure greater stability in the system in order to give effect to our commitment to
improving the lives of those most important of people – the learners. Where changing
circumstances and contexts require it, we will redefine and reshape these strategies.
The focus on quality and retention will contribute positively to economic growth and a
reduction in unemployment.
We look forward to making Education ‘Better Together’, improving education outcomes and
the system in the years to come.
Donald Grant
Minister of the Department of Education
2013/14

Annual Report for 2013/14 Financial Year
Vote 5: Department of Education
Province of the Western Cape
5
4. REPORT OF THE ACCOUNTING OFFICER
Overview of the operations of the department:
Academic performance
The WCED monitors academic performance on internal and external
assessment. In relation to internal assessment, the assessment tasks
are scrutinised by HODs and Subject Advisors. In addition, targets are
set for numbers passing all grades and language and mathematics.
External assessments are set in Grades 1-6 and 9 in the form of the
Annual National Assessments. The WCED administers independently
set Grade 3, 6 and 9 tests in language and mathematics and the DBE
sets the Grade 12 National Senior Certificate.
There has been a steady improvement in the number and quality of
passes in the National Senior Certificate. Once the re-marks and
supplementary results had been factored in, a further 651 learners
passed the NSC, increasing the percentage pass rate from the initial 85.1% to a figure of
86.5%.
Similarly there was an improved pass rate in other grades, notably in grades 10 and 11.
The external testing programme for Languages and Mathematics informed our interventions
with schools, including the formal teacher training programmes.
Support
Information about the support for the expanding learner population, including both those
remaining in the system and those enrolling for the first time, is provided in some detail in the
rest of this report. This includes infrastructure planning and provisioning, textbooks and
workbooks, food, transport, the increased number of no-fee schools and the fee-exemption
programme.
Systems and accountability
On the pages of this report that introduce each Programme we have included some
information about the provisioning in 2009/10 as compared with the figures for 2013/14. The
figures need to be understood alongside the focused drive, over this period, for increased
efficiencies.
Critically, staffing costs have been reduced through cutting down on contract posts;
reducing numbers of personnel in excess; tackling inefficient timetabling at schools and
dealing with the cases of those on extended periods of leave. The use of online ordering
systems, bulk buying and online recruitment have improved turnaround times and assisted
with monitoring and tracking. Data analysis and management have provided us with the
insights to make better decisions about almost every element in the education system. In a
system characterised by strengthening accountability we have concentrated on providing
for the most vulnerable children.
PA Vinjevold
Superintendent-
General

Annual Report for 2013/14 Financial Year
Vote 5: Department of Education
Province of the Western Cape
6
Overview of the financial results of the department:
Departmental receipts
Departmental
receipts
2013/2014 2012/2013
Estimate Actual
Amount
Collected
(Over)/Under
Collection
Expenditure
Estimate Actual
Amount
Collected
(Over)/Under
Collection
Expenditure
R’000 R’000 R’000 R’000 R’000 R’000
Sale of goods and
services other than
capital assets
11,906 11,959 (53) 10,974 13,172 (2,198)
Fines, penalties and
forfeits 228 774 (546) 228 761 (553)
Interest, dividends
and rent on land 1,998 1,818 180 1,998 3,530 (1,532)
Financial
transactions in
assets and liabilities
26,698 19,003 7,695 11,333 24,418 (13,085)
Total 40,830 33,554 7,276 24,533 41,881 (17,348)
Own revenue generated by the department amounts to 0.3 % of the total budget. The
Department’s main sources of own revenue are –
Collection of debts owing to the department.
Commission on insurance and garnishee order deductions.
Fees charged for examination related services such as re-marking of scripts, requests for
copies of senior and other certificates. These tariffs are determined by the (National)
Department of Basic Education.
Reprographic services to other provincial departments.
All tariffs have been listed in a tariff register that is kept in electronic format. Tariffs are
annually reviewed to provide for inflation. The under-collection on departmental receipts for
2013/14 is R7 million and is mainly attributed to the fact that fewer debts were written off
where receivable revenue is affected than was anticipated. All debts are written off in terms
of the department’s debt write-off policy and this requires a number of steps including efforts
to trace debtors.

Annual Report for 2013/14 Financial Year
Vote 5: Department of Education
Province of the Western Cape
7
Programme Expenditure
Programme Name
2013/2014 2012/2013
Final
Appro-
priation
Actual
Expenditure
(Over)/
Under
Expenditure
Final
Appro-
priation
Actual
Expenditure
(Over)/
Under
Expenditure
R’000 R’000 R’000 R’000 R’000 R’000
1. Administration 579,744 571,149 8,595 546,911 536,988 9,923
2. Public ordinary
school education 11,381,365 11,362,779 18,586 10,467,295 10,450,520 16,775
3. Independent
school subsidies 84,648 84,648 - 72,321 72,321 -
4. Public special
school education 910,338 910,338 - 824,291 820,101 4,190
5.Further education
and training 353,097 353,078 19 597,589 597,523 66
6.Adult basic
education and
training
37,898 37,898 - 36,920 36,920 -
7. Early childhood 465,637 465,535 102 383,894 383,894 -
8. Infrastructure
development 1,192,946 1,054,312 138,634 790,987 750,672 40,315
9.Auxiliary and
associated services 663,112 662,459 653 640,035 639,171 864
Total 15,668,785 15,502,196 166,589 14,360,243 14,288,110 72,133
The Department spent 98.94 percent of the adjusted budget for 2013/14. The under-
expenditure amounted to R166.589 million, or 1.06 percent of the adjusted budget, which is
well within the national benchmark of 2 per cent.
Reasons for under-spending are as follows:
R8.593 million for the Equitable Share. The amount of R6.1 million is committed for the
wrapping machine procured for the Directorate: Examination Administration. Due to the
time-delay in the manufacturing process abroad the machine could not be
manufactured and installed by the 31st of March 2014. The remaining balance of
R2.819 million under-spend for the Programme: Administration is due to efficiency
measures implemented within the department.
R10.181 million for the Technical Secondary School Recapitalisation Grant. This resulted
from delays in the construction of mechanical and civil technology workshops at two
technical high schools, as well as delivery delays for ICT hardware and mechanical,
electrical and civil technology toolkits to technical secondary schools. The amount of
R9.706 million is committed for the ICT hardware and mechanical, electrical and civil
technology toolkits. The outstanding amount of R0.475 million is to be surrendered to
National Treasury.

Annual Report for 2013/14 Financial Year
Vote 5: Department of Education
Province of the Western Cape
8
R138.635 million for the Education Infrastructure Grant (EIG). The underspending is due to
delays on the Accelerated School Infrastructure Development Initiative (ASIDI) capital
infrastructure projects at public ordinary schools. The full amount of R138.635 million is
committed for expenditure not paid by 31 March 2014.
R0.653 million for the HIV/AIDS (Life Skills Education) Grant. The full amount of R0.653 million
is committed for services rendered by suppliers/contractors during 2013/14, but invoices
were not submitted in time for payment and could not be paid by the 31st of March 2014.
R6.775 million for the National School Nutrition Programme Grant. A milk pilot was due to
be conducted early in 2013/14 financial year. The plan was for learners to be given a
sachet of milk once a week. Because of delays in sourcing a supply of the packaging
material, this pilot was delayed and only took place in November 2013. The full amount is
uncommitted and is to be surrendered to National Treasury.
R1.498 million for the Dinaledi Schools Grant. Tenders were awarded in April 2014 and the
full amount is uncommitted and is to be surrendered to National Treasury.
R0.234 for the Social Sector EPWP Incentive Grant to Provinces. Fewer claims were
received from FET colleges for capacity building of data capturers and First Aid training of
ECD practitioner assistants. The amount is uncommitted and is to be surrendered to
National Treasury.
R0.020 for the Further Education and Training Grant. The amount is uncommitted and is to
be surrendered to National Treasury.
It should be noted that, besides the uncommitted funding that has been surrendered to the
National Treasury, the unspent funds are all in respect of committed projects and a request
for rollover of the funds was submitted to Provincial Treasury. There was thus minimal impact
on any programmes or service delivery.
Virements/roll overs
Provincial Treasury approved the following virements between main divisions in the Vote:
Shifting of R12 024 000 from programme 1 to programme 4 for the implementation of the
Occupation Specific Dispensation (OSD) for Education Therapists, Counsellors and
Psychologists at Elsen schools.
Shifting of R8 925 000 from programme 1 to programme 7 for financial support to Grade R
quintiles 4 and 5 schools at public ordinary schools that were awarded no-fee status with
effect from January 2014.
Shifting of R11 303 000 from programme 1 to programme 8 for infrastructure upgrade of
schools halls and sport fields at public schools.

Annual Report for 2013/14 Financial Year
Vote 5: Department of Education
Province of the Western Cape
9
Shifting of R1 399 000 from programme 1 to programme 9 for GG-daily tariffs due to the
reclassification of the Standard Chart of Accounts (SCOA).
Shifting of R24 196 000 from programme 2 to programme 8 for infrastructure maintenance,
upgrade of school halls and sport fields and upgrade of classrooms at public schools.
Shifting of R284 000 from programme 3 to programme 8 for infrastructure maintenance,
upgrade of school halls and sport fields and upgrade of classrooms at public schools.
Shifting of R9 755 000 from programme 4 to programme 8 for infrastructure upgrade of
school halls and sport fields and upgrade of classrooms at public schools.
Shifting of R14 000 from programme 6 to programme 8 for infrastructure maintenance at
public schools.
The following rollovers were requested:
R6.1 million of the Equitable Share is requested for the wrapping machine procured for the
Directorate: Examination Administration. Due to the time-delay in the manufacturing
process abroad the machine could not be manufactured and installed by the 31st of
March 2014.
R9.706 million of the Technical Secondary School Recapitalisation Grant is requested for
the ICT hardware and mechanical, electrical and civil technology toolkits and for the
construction of the mechanical and civil technology workshops at two technical high
schools
R138.635 million of the Education Infrastructure Grant (EIG) is requested for the expenditure
not paid by 31 March 2014 for ASIDI capital infrastructure projects at public ordinary
schools.
R0.653 million of the HIV/AIDS (Life Skills Education) Grant is requested for invoices for
services rendered that could not be submitted in time for payment by
suppliers/contractors by the 31st of March 2014.
A description of the reasons for unauthorised, fruitless and wasteful expenditure and the
amounts involved as well as steps taken to address and prevent a recurrence.
The department did not incur any unauthorised expenditure during the period under review.
To minimise irregular expenditure, the department identified supply chain champions per
directorate. They were trained in all aspects of SCM. SCM templates, to structure and control
the required process and procedures were introduced. To reduce incidences of irregular
expenditure, the internal control unit performs a post audit. The unit provides feedback to SC
champions and their directorates on the rate of potential irregular expenditure. These steps
led to a reduction in irregular expenditure.

Annual Report for 2013/14 Financial Year
Vote 5: Department of Education
Province of the Western Cape
10
Future plans of the department
The proposed national education Action Plan to 2019 states that, to promote focus within the
education system, five of the 27 goals have been identified as priority goals. These deal with
Grade R, teacher development, learning materials, school management and support by
district offices. This will shape the WCED’s future plans.
The 3 goals of the WCED (Improved Language and Mathematics in Primary schools;
improved number and quality of passes in the National Senior Certificate; Reduction in the
number of under-performing primary schools) will be retained with an emphasis also on
continuing to improve learner retention rates.
The pro-poor emphasis will continue, with attention also to the security and well-being of
learners so that they are assured of the best possible education in all respects.
Teacher developmental needs will be addressed and the best environment for teaching and
learning will be provided and managed.
Public Private Partnerships
The Department did not enter into any such arrangement during the reporting period.
Discontinued activities / activities to be discontinued
None
New or proposed activities
None
Supply chain management
Unsolicited bid proposals concluded for the year under review
None
SCM processes and systems
The WCED relies on the Accounting Officers’ System, Standard Operating Procedures (SOPs)
and the Irregular Expenditure policy issued within the WCED.
Challenges experienced in SCM and how they were resolved
The department held a strategic planning session, which allowed prioritisation of main
activities. This allowed the department to produce a five-year procurement plan. Forward
planning is key for those goods and services that require procurement. The regulatory and
procedural aspects require ongoing attention.

Annual Report for 2013/14 Financial Year
Vote 5: Department of Education
Province of the Western Cape
11
Gifts and Donations received in kind from non-related parties
None
Exemptions and deviations received from the National Treasury
None
Events after the reporting date
No events occurred between 31 March 2014 and the date of approval of the financial
statements on 31 May 2014 that necessitated adjusting the financial statements.
Other
Infrastructure matters: Magqwaka case
The Magqwaka matter falls within the scope of the Department of Transport and Public Works
(DTPW) as Implementing Agent (IA). However, there have been joint efforts by DTPW and the
WCED to resolve the matter. DTPW has referred the matter to the Office of the State Attorney
for advice. According to DTPW, no response had been received from the State Attorney by
March 31 2014.
Agency/Principal Activities
The Department engaged in the following agency/principal activities:
With the Department of Transport and Public Works (DTPW) for infrastructure related
activities, where DTPW was the implementing agent for the WCED.
With the Department of Basic Education (DBE) for the Accelerated School Infrastructure
Development Initiative (ASIDI) for the building of schools and classrooms, where the
department acts as agent for DBE.
With the Department of Basic Education (DBE) for the Annual National Assessments
(ANA) for the administering of the ANAs on behalf of the DBE, where the department
acts as agent for DBE.
No fees were received or paid for the agency/principal services delivered over and above
the funding provided for the execution of the agreed tasks.
Acknowledgements
We acknowledge with thanks the work of diligent teachers as well as the leadership and
support provided by all stakeholders and roleplayers in ensuring that our work is dedicated to
learners and to improving their life chances.

Annual Report for 2013/14 Financial Year
Vote 5: Department of Education
Province of the Western Cape
12
Conclusion
The year under review has been characterised by a renewed focus on improving learning
outcomes, as evidenced in the School Improvement and District Improvement Plans. Service
Delivery has been strengthened through the appointment of key personnel and a variety of
management improvements. The fee-relief granted to schools is an important development.
The WCED looks forward to continued efficiencies and a stable education system.
Approval and sign off
As the Accounting Officer, I have approved the Annual Financial Statements supplied under
separate cover at this point.
PA Vinjevold
Accounting Officer
Department of Education
31 May 2014

Annual Report for 2013/14 Financial Year
Vote 5: Department of Education
Province of the Western Cape
13
5. STATEMENT OF RESPONSIBILITY AND CONFIRMATION OF ACCURACY FOR THE ANNUAL
REPORT
To the best of my knowledge and belief, I confirm the following:
All information and amounts disclosed throughout the Annual Report are consistent.
The Annual Report is complete, accurate and is free from any omissions.
The Annual Report has been prepared in accordance with the guidelines on the annual
report as issued by National Treasury.
The Annual Financial Statements (Part E) have been prepared in accordance with the
modified cash standard and the relevant frameworks and guidelines issued by the National
Treasury.
The Accounting Officer is responsible for the preparation of the annual financial statements
and for the judgements made in this information.
The Accounting Officer is responsible for establishing, and implementing a system of internal
control that has been designed to provide reasonable assurance as to the integrity and
reliability of the performance information, the human resources information and the Annual
Financial Statements.
The external auditors are engaged to express an independent opinion on the Annual
Financial Statements.
In my opinion, the Annual Report fairly reflects the operations, the performance information,
the human resources information and the financial affairs of the department for the financial
year ended 31 March 2014.
Yours faithfully
Accounting Officer
PA Vinjevold
31 May 2014

Annual Report for 2013/14 Financial Year
Vote 5: Department of Education
Province of the Western Cape
14
6. STRATEGIC OVERVIEW
6.1 Vision
Creating opportunity for all through improved education outcomes.
This is given expression through three over-arching goals:
1. Improved language and mathematics in primary schools
2. Improved number and quality of passes in the National Senior Certificate
3. Reduction in number of under-performing schools
6.2 Mission
To provide quality education to all learners in the province through the following:
Overall planning for, and management of, the education system
Education in public ordinary schools
Support to independent schools
Education in public special schools
Further Education and Training (FET) at public FET colleges
Adult Education and Training (AET) in community learning centres
Early Childhood Development (ECD) in Grade R
Training opportunities for teachers and non-teachers
A targeted food programme and other poverty alleviation and safety measures
Support to teachers through provision of basic conditions of service, incentives and an
employee wellness programme
6.3 Values
The prime importance of the learner
The values of the South African Constitution and the Bill of Rights
Excellence through the supply of, and support for, an equipped, positive and flourishing
teaching force that is professional and dedicated
Accountability and transparency
Integrity and excellence in administrative and support functions
7. LEGISLATIVE AND OTHER MANDATES
Constitution of the Republic of South Africa, 1996 (Act 108 of 1996)
Constitution of the Western Cape Province, 1998 (Act 1 of 1998)
Western Cape Provincial School Education Act, 1997 (Act 12 of 1997)
South African Schools Act (SASA), 1996 (Act 84 of 1996)
National Education Policy Act (NEPA), 1996 (Act 27 of 1996)
Further Education and Training Colleges Act, 1998 (Act 16 of 2006)
General and Further Education and Training Quality Assurance Act, 2001 (Act 58 of 2001)
Employment of Educators Act, 1998 (Act 76 of 1998)
Public Finance Management Act, 1999 (Act 1 of 1999)
Annual Division of Revenue Act, 2012 (Act 5 of 2012)

Annual Report for 2013/14 Financial Year
Vote 5: Department of Education
Province of the Western Cape
15
Public Service Act, 1994 (Proclamation 103 of 1994)
South African Qualifications Authority Act, 1995 (Act 58 of 1995)
South African Council for Educators Act, (Act 31 of 2000)
Adult Basic Education and Training Act, 2000 (Act 52 of 2000)
8. ORGANISATIONAL STRUCTURE
See overleaf
9. ENTITIES REPORTING TO THE MINISTER/MEC
Not applicable

16


Annual Report for 2013/14 Financial Year
Vote 5: Department of Education
Province of the Western Cape
17
1. AUDITOR GENERAL’S REPORT: PREDETERMINED OBJECTIVES
The AGSA currently performs certain audit procedures on the performance information to
provide reasonable assurance in the form of an audit conclusion. The audit conclusion on the
performance against predetermined objectives is included in the report to management,
with material findings being reported under the Predetermined Objectives heading in the
Report on other legal and regulatory requirements section of the auditor’s report.
Refer to page 184 of the Report of the Auditor General, published as Part E: Financial
Information.
2. OVERVIEW OF DEPARTMENTAL PERFORMANCE
2.1 Service Delivery Environment
The South African education sector plan is contained in Action Plan 2014, towards Schooling
2025. The plan contains 27 goals. The first 13 deal with learning outcomes and the other 14
goals deal with how these learning outcomes can be achieved.
The accountability system inherent in this plan is linked to the South African education goals,
their indicators, and to targets and their milestones. The number of goals is limited; the
indicators are measurable. The targets should be ‘in range’ and should aim to improve
education outcomes incrementally. They are disaggregated per province and should not be
regarded as a ceiling. Whilst national targets have been set over the long term, up to 2025,
milestones generally focus on desired achievements in the medium term (up to five years into
the future). Milestones have been set for goals 1 – 13 but have not been set for goals 14 to
27, the goals dealing with the how of achieving the learning outcomes.
The Delivery Agreement is a negotiated charter which was concluded in 2010 and signed by,
amongst others, the President, the Minister of Basic Education and the provincial MECs. The 27
goals are listed below. The five priority goals of the Delivery Agreement, for the period up to
2014, appear in bold.
The goals for learning outcomes are:
1 ►Increase the number of learners in Grade 3 who by the end of the year have mastered
the minimum language and numeracy competencies for Grade 3.
2 ►Increase the number of learners in Grade 6 who by the end of the year have mastered
the minimum language and mathematics competencies for Grade 6.
3 ►Increase the number of learners in Grade 9 who by the end of the year have mastered
the minimum language and mathematics competencies for Grade 9.
4 ►Increase the number of Grade 12 learners who become eligible for a Bachelors
programme at a university.
5 ►Increase the number of Grade 12 learners who pass mathematics.

Annual Report for 2013/14 Financial Year
Vote 5: Department of Education
Province of the Western Cape
18
The goals for learning outcomes (continued):
6 ►Increase the number of Grade 12 learners who pass physical science.
7 ►Improve the average performance of Grade 6 learners in languages.
8 ►Improve the average performance of Grade 6 learners in mathematics.
9 ►Improve the average performance in mathematics of Grade 8 learners.
10 ►Ensure that all children remain effectively enrolled in school at least up to the year in
which they turn 15.
11 ►Improve the access of children to quality early childhood development (ECD) below
Grade 1.
12 ►Improve the grade promotion of learners through Grades 1 to 9.
13 ►Improve the access of youth to Further Education and Training beyond Grade 9.
The goals for how the learning outcomes will be achieved are:
14 ►Attract in each year a new group of young, motivated and appropriately trained
teachers into the teaching profession.
15 ►Ensure that the availability and utilisation of teachers is such that excessively large
classes are avoided.
16 ►Improve the professionalism, teaching skills, subject knowledge and computer literacy
of teachers throughout their entire careers.
17 ►Strive for a teacher workforce that is healthy and enjoys a sense of job satisfaction.
18 ►Ensure that learners cover all the topics and skills areas that they should cover within
their current school year.
19 ►Ensure that every learner has access to the minimum set of textbooks and workbooks
required according to national policy.
20 ►Increase access amongst learners to a wide range of media, including computers,
which enrich their education.
21 ►Ensure that the basic annual management processes occur across all schools in the
country in a way that contributes towards a functional school environment.
22 ►Improve parent and community participation in the governance of schools, partly by
improving access to important information via the e-Education strategy.
23 ►Ensure that all schools are funded at least at the minimum per learner levels
determined nationally and that funds are utilised transparently and effectively.
24 ►Ensure that the physical infrastructure and environment of every school inspires learners
to want to come to school and learn, and teachers to teach.
25 ►Use schools as vehicles for promoting access to a range of public services amongst
learners in areas such as health, poverty alleviation, psychosocial support, sport and culture.
26 ►Increase the number of schools which effectively implement the inclusive education
policy and have access to centres which offer specialist services.
27 ►Improve the frequency and quality of the monitoring and support services provided by
district offices to schools, partly through better use of e-Education.
The WCED performance on the indicators linked to the national goals is provided in Appendix
A (page 240).

Annual Report for 2013/14 Financial Year
Vote 5: Department of Education
Province of the Western Cape
19
The WCED is responsible for Provincial Strategic Objective 2: Improving Education Outcomes,
which was published in November 2009. Although it pre-dated the national plan it contains
many of the indicators in that document. The provincial plan states that The Western Cape
Government will improve the life chances of all its children through the provision of quality
education. To this end, all children will remain in school for as long as possible and achieve
optimal results. In particular, the focus in the period 2010 to 2019 will be on improving the
reading, writing and calculating abilities of learners. The period 2010-2014 will lay the
foundations for these improvements. In the period 2014-2019, the province’s children will reap
the fruits of a system that has been designed and managed to deliver on the targets set.
The Annual Performance Plan of 2013/14 identified five Key Focuses. The first four were those
identified at a national level: i) Texts, including the national workbooks ii) Curriculum
strengthening measures in support of the Curriculum and Assessment Policy Statements
(CAPS) iii) Annual National Assessments iv) Infrastructure and v) Systems and support for
improved learning outcomes. Progress on Texts, Curriculum and the ANA are reported under
Programme 2. Infrastructure progress is reported in Programme 8 and also under point 8.1
(page 96). “Capital investment, maintenance and asset management plan”. Systems and
support are discussed under both Programme 1 and Programme 2.
2013/14 was a stable labour period. This allowed the WCED to focus on its core business of
improving education outcomes. Resources, human and financial, and all interventions were
focused on those schools in greatest need of support.
Violence, crime, and socio-economic conditions continue to place demands on schools,
schooling and the WCED.
There were some areas that experienced unexpected pressure on accommodation for
learners in January 2014. Officials were assigned the task of helping learners to find places in
schools. A new system is being set up to enable learners looking for places to register a query
with a unique registration number to ensure that there is clarity about the actual number of
learners not in school in order to refine and speed up this process. The fact that it is the right of
the school to determine its capacity and to define its enrolment policy sets a challenge in this
regard.
The increase in demand for places in schools is highlighted in the discussion under
Programme 2.
2.2 Service Delivery Improvement Plan
The department has completed a service delivery improvement plan. The tables below highlight
the service delivery plan and the achievements to date.

An
nu
al R
ep
ort
fo
r 2013/1
4 F
ina
nc
ial Y
ea
r
Vo
te 5
: D
ep
art
me
nt
of
Ed
uc
ati
on
Pro
vin
ce
of
the
We
ste
rn C
ap
e
20
Ma
in s
erv
ice
s a
nd
sta
nd
ard
s
Ma
in s
erv
ice
s B
en
efic
iarie
s C
urr
en
t/a
ctu
al st
an
da
rd o
f se
rvic
e
De
sire
d s
tan
da
rd o
f se
rvic
e
Ac
tua
l a
ch
iev
em
en
t
Pro
vid
e
Tele
co
mm
un
ica
tio
n
Se
rvic
e a
t W
CED
He
ad
Off
ice
Lea
rne
rs
Ed
uc
ato
rs
Off
icia
ls a
t H
ea
d
Off
ice
Me
mb
ers
of
Pu
blic
a)
Cu
rre
ntly S
witc
hb
oa
rd O
pe
rato
rs
an
swe
r a
nd
div
ert
/ d
ire
ct
211
43
2
inc
om
ing
(D
DI)
an
d in
tern
al c
alls
an
nu
ally
a)
Switc
hb
oa
rd O
pe
rato
rs a
nsw
ers
an
d
div
ert
/dire
ct
211
432 in
co
min
g (
DD
I)
an
d in
tern
al c
alls
an
nu
ally
a-d
) In
form
atio
n o
n a
ctu
al a
ch
iev
em
en
t
no
t a
va
ilab
le d
ue
to
lost
info
rma
tio
n
as
the
bu
ffe
r th
at
sto
res
the
info
rma
tio
n w
as
full.
Th
e W
CED
is
cu
rre
ntly in
th
e p
roc
ess
of
pro
cu
rin
g a
ne
w P
AB
X s
yst
em
b)
Cu
rre
ntly 6
0 7
62
ca
lls a
re u
n-
an
swe
red
by o
ffic
ials
an
nu
ally
b)
Ma
na
ge
th
e r
ed
uc
tio
n o
f u
n-
an
swe
red
ca
lls b
y o
ffic
ials
to
57 7
24
an
nu
ally
c)
Cu
rre
ntly 1
% o
f c
alls
are
dro
pp
ed
an
nu
ally
c)
Re
tain
1%
of
dro
pp
ed
ca
lls a
nn
ua
lly
d)
Tele
co
mm
un
ica
tio
ns
sup
po
rt
off
ice
cu
rre
ntly m
an
ag
es
the
ne
ed
s o
f 1
060 H
ea
d O
ffic
e
off
icia
ls, sp
rea
d a
cro
ss t
wo
bu
ildin
gs
d)
Tele
co
mm
un
ica
tio
ns
sup
po
rt o
ffic
e
ma
na
ge
s th
e n
ee
ds
of
1 0
60
He
ad
Off
ice
off
icia
ls, sp
rea
d a
cro
ss t
wo
bu
ildin
gs
*Ple
ase
No
te: N
um
be
r o
f H
ea
d
Off
ice
off
icia
ls c
an
flu
ctu
ate
su
bje
ct
to n
ew
ap
po
intm
en
ts a
nd
off
icia
ls
lea
vin
g t
he
WC
ED
.
Pro
vid
ing
first
lin
e o
f
sup
po
rt t
o v
ictim
s o
f
ab
use
, v
iole
nc
e a
nd
sch
oo
l c
rim
e a
t
WC
ED
in
stitu
tio
ns
900
000
+ le
arn
ers
31 0
00+
ed
uc
ato
rs
7 0
00+
pu
blic
serv
an
ts
Lea
rne
rs f
rom
1500+
sc
ho
ols
an
d
203 in
de
pe
nd
en
t
sch
oo
ls.
Me
mb
ers
of
Sc
ho
ol G
ove
rnin
g
Bo
die
s (S
GB
)
Me
mb
ers
of
Co
mm
un
ity
inc
lud
ing
pa
ren
ts
a)
19%
of
the
to
tal c
alls
re
ce
ive
d a
re
dro
pp
ed
a)
Re
du
ce
th
e d
rop
pe
d c
all
rate
to
14%
a)
The
Cyb
er
Ca
ll sy
ste
m h
as
no
t b
ee
n
up
gra
de
d a
s ye
t.
b)
Cu
rre
ntly t
he
ca
ll c
en
tre
ha
nd
les
12 2
67
ca
ses
b)
80%
of
ca
lls a
re c
on
clu
de
d o
n f
irst
ca
ll
b)
The
Sa
fe S
ch
oo
ls c
all
Ce
ntr
e r
ec
eiv
ed
14 8
54
ca
lls. (7
7%
co
nc
lud
ed
on
first
ca
ll)
c)
2 3
55
ca
ses
req
uire
fu
rth
er
follo
w-
up
an
d s
up
po
rt
c)
12%
of
ca
lls a
re r
efe
rre
d t
o S
afe
Sc
ho
ols
Co
-ord
ina
tors
fo
r fo
llow
-up
c)
3 4
33
ca
lls (
23%
) n
ee
de
d f
urt
he
r
ass
ista
nc
e a
nd
su
pp
ort
612
of
the
se c
alls
we
re c
rim
e r
ela
ted
inc
ide
nts
, w
hils
t 1
055
ca
lls d
ea
lt w
ith
rep
ort
s o
n b
urg
lary
an
d v
an
da
lism
d
) 8
% o
f c
alls
are
re
ferr
ed
fo
r fu
rth
er
co
un
selli
ng
d)
394
ab
use
ca
ses
we
re r
ep
ort
ed
– o
f
wh
ich
52 w
ere
re
late
d t
o b
ully
ing
an
d
228
ca
lls n
ee
de
d c
ou
nse
llin
g a
nd
psy
ch
olo
gic
al su
pp
ort
. A
fu
rth
er
524
ca
lls w
ere
Sc
ho
ol G
ove
rnin
g B
od
y
qu
erie
s

An
nu
al R
ep
ort
fo
r 2013/1
4 F
ina
nc
ial Y
ea
r
Vo
te 5
: D
ep
art
me
nt
of
Ed
uc
ati
on
Pro
vin
ce
of
the
We
ste
rn C
ap
e
21
Ba
tho
Pe
le a
rra
ng
em
en
ts w
ith
be
ne
fic
iari
es
(Co
nsu
lta
tio
n a
cc
ess
etc
.)
Cu
rre
nt/
ac
tua
l a
rra
ng
em
en
ts
De
sire
d a
rra
ng
em
en
ts
Ac
tua
l a
ch
iev
em
en
ts
Pro
vid
e t
ele
co
mm
un
ica
tio
n S
erv
ice
at
WC
ED
He
ad
Off
ice
Co
nsu
lta
tio
n:
Co
nsu
lta
tio
n:
Co
nsu
lta
tio
n:
a)
The
an
nu
al C
ust
om
er
Sa
tisf
ac
tio
n S
urv
ey is
a s
ou
rce
of
co
nsu
lta
tio
n a
s c
lien
ts a
re t
arg
ete
d
a)
The
an
nu
al C
ust
om
er
Sa
tisf
ac
tio
n S
urv
ey is
a s
ou
rce
of
co
nsu
lta
tio
n a
s c
lien
ts a
re t
arg
ete
d
a)
Sig
nific
an
t im
pro
ve
me
nts
on
pre
vio
us
ye
ar’
s
cu
sto
me
r sa
tisf
ac
tio
n s
urv
eys
we
re r
ec
ord
ed
b)
The
Th
eta
Na
thi c
om
pla
ints
an
d c
om
plim
en
ts
me
ch
an
ism
is u
sed
to
imp
rov
e c
urr
en
t se
rvic
e
de
live
ry le
ve
ls
b)
The
Th
eta
Na
thi c
om
pla
ints
an
d c
om
plim
en
ts
me
ch
an
ism
is u
sed
to
imp
rov
e c
urr
en
t se
rvic
e
de
live
ry le
ve
ls
b)
The
on
line
fe
ed
ba
ck s
yst
em
, w
hic
h r
ep
lac
ed
th
e
The
ta N
ath
i sy
ste
m r
ep
ort
ed
no
sp
ec
ific
te
lep
ho
ne
ma
na
ge
me
nt
co
mp
lain
ts f
or
the
re
po
rtin
g p
erio
d
c)
Fee
db
ac
k t
o D
ire
cto
rate
Co
mm
un
ica
tio
n t
hro
ug
h
the
“C
on
tac
t W
CED
Fo
rm” in
th
e W
CED
On
-lin
e
we
bsi
te
c)
Fee
db
ac
k t
o D
ire
cto
rate
Co
mm
un
ica
tio
n t
hro
ug
h
the
“C
on
tac
t W
CED
Fo
rm”
in t
he
WC
ED
On
-lin
e
we
bsi
te
c)
Co
mp
lain
ts r
eg
iste
red
inte
rna
lly w
ith
in W
CED
we
re
am
ica
bly
ma
na
ge
d
d)
All
ca
llers
(c
lien
ts)
are
we
lco
me
d t
o t
he
WC
ED
He
ad
-Off
ice
an
d d
ea
lt w
ith
dig
nity, w
hile
ask
ed
ho
w
the
co
nsu
lta
nts
ca
n b
e o
f se
rvic
e
d)
All
ca
llers
(c
lien
ts)
are
we
lco
me
d t
o t
he
WC
ED
He
ad
-Off
ice
an
d d
ea
lt w
ith
dig
nity, w
hile
ask
ed
ho
w
the
co
nsu
lta
nts
ca
n b
e o
f se
rvic
e
d)
All
ca
llers
(c
lien
ts)
are
we
lco
me
d t
o t
he
WC
ED
He
ad
-Off
ice
an
d d
ea
lt w
ith
dig
nity, w
hile
ask
ed
ho
w
the
co
nsu
lta
nts
ca
n b
e o
f se
rvic
e
e)
Switc
hb
oa
rd M
an
ag
er
att
en
ds
to c
om
pla
ints
e
) Sw
itc
hb
oa
rd M
an
ag
er
att
en
ds
to c
om
pla
ints
e
) N
o c
om
pla
ints
we
re r
ec
eiv
ed
Ac
ce
ss:
Ac
ce
ss:
Ac
ce
ss:
a)
WC
ED
He
ad
Off
ice
in C
ap
e T
ow
n
a)
WC
ED
He
ad
Off
ice
in C
ap
e T
ow
n
a)
WC
ED
He
ad
Off
ice
in C
ap
e T
ow
n
b)
Op
era
tin
g h
ou
rs o
f th
e C
all
Ce
ntr
e: 0
7:3
0 –
16:0
0.
(Clo
sed
lun
ch
tim
es
at
12:3
0-1
3:0
0)
b)
Op
era
tin
g h
ou
rs o
f th
e C
all
Ce
ntr
e: 0
7:3
0 –
16:0
0.
(Clo
sed
lun
ch
tim
es
at
12:3
0-1
3:0
0)
b)
Op
era
tin
g h
ou
rs o
f th
e C
all
Ce
ntr
e: 0
7:3
0 –
16:0
0.
(Clo
sed
lun
ch
tim
es
at
12:3
0-1
3:0
0)
Co
urt
esy
: C
ou
rte
sy:
Co
urt
esy
:
a)
All
ca
llers
(c
lien
ts)
are
we
lco
me
d t
o t
he
WC
ED
He
ad
-Off
ice
an
d d
ea
lt w
ith
dig
nity, w
hile
ask
ed
ho
w
the
off
icia
ls c
an
be
of
serv
ice
a)
All
ca
llers
(c
lien
ts)
are
we
lco
me
d t
o t
he
WC
ED
He
ad
-Off
ice
an
d d
ea
lt w
ith
dig
nity, w
hile
ask
ed
ho
w
the
off
icia
ls c
an
be
of
serv
ice
a)
All
ca
llers
(c
lien
ts)
are
we
lco
me
d t
o t
he
WC
ED
He
ad
-
Off
ice
an
d d
ea
lt w
ith
dig
nity, w
hile
ask
ed
ho
w t
he
off
icia
ls c
an
be
of
serv
ice
b)
Ca
llers
re
po
rt u
na
nsw
ere
d li
ne
s a
nd
re
po
rt
co
ng
est
ion
to
sw
itc
hb
oa
rd o
pe
rato
rs
b)
Ca
llers
re
po
rt u
na
nsw
ere
d li
ne
s a
nd
re
po
rt
co
ng
est
ion
to
sw
itc
hb
oa
rd o
pe
rato
rs. O
pe
rato
rs
no
te t
he
co
mp
lain
ts in
su
pp
ort
of
tele
ph
on
e
ma
na
ge
me
nt
rep
ort
s
b)
Re
ce
ive
s in
term
itte
nt
co
ng
est
ion
co
mp
lain
ts f
rom
Go
lde
n A
cre
use
rs. P
rim
ary
Ra
te In
terf
ac
e li
ne
s (P
RI’
s)
ha
ve
be
en
pro
cu
red
to
ad
dre
ss t
his
pro
ble
m.
c)
The
Th
eta
-Na
thi c
om
pla
ints
an
d c
om
plim
en
ts
me
ch
an
ism
pu
blis
he
d o
n t
he
WC
ED
Se
rvic
e C
ha
rte
r
is a
me
an
s to
co
mp
lain
ab
ou
t o
ffic
ials
’ b
eh
avio
ur
c)
The
Th
eta
-Na
thi c
om
pla
ints
an
d c
om
plim
en
ts
me
ch
an
ism
pu
blis
he
d o
n t
he
WC
ED
Se
rvic
e C
ha
rte
r
is a
me
an
s to
co
mp
lain
ab
ou
t o
ffic
ials
’ b
eh
avio
ur
c)
The
on
line
fe
ed
ba
ck s
yst
em
, w
hic
h r
ep
lac
ed
th
e
The
ta N
ath
i sy
ste
m r
ep
ort
ed
no
sp
ec
ific
te
lep
ho
ne
ma
na
ge
me
nt
co
mp
lain
ts f
or
the
re
po
rtin
g p
erio
d
d)
Fee
db
ac
k t
o D
ire
cto
rate
Co
mm
un
ica
tio
n t
hro
ug
h
the
”C
on
tac
t W
CED
Fo
rm”
in t
he
WC
ED
On
-lin
e
we
bsi
te
d)
The
exi
ste
nc
e o
f th
e T
he
ta-N
ath
i se
rvic
e w
ill b
e
bro
ad
ca
st t
o c
lien
ts w
hile
wa
itin
g t
o b
e t
ran
sfe
rre
d
to t
he
ir r
esp
ec
tiv
e o
ffic
ials
d)
On
ly 1
co
mp
lain
t w
as
rec
eiv
ed
in F
eb
rua
ry 2
01
4 a
nd
wa
s a
dd
ress
ed
with
Sw
itc
hb
oa
rd s
taff
imm
ed
iate
ly.
The
ma
tte
r w
as
suc
ce
ssfu
lly r
eso
lve
d
e)
Co
mp
lain
ts a
re r
efe
rre
d t
o t
he
Sw
itc
hb
oa
rd
Ma
na
ge
r
e)
Fee
db
ac
k t
o D
ire
cto
rate
Co
mm
un
ica
tio
n t
hro
ug
h
the
“C
on
tac
t W
CED
Fo
rm”
in t
he
WC
ED
On
-lin
e
we
bsi
te
e)
On
ly 1
co
mp
lain
t w
as
rec
eiv
ed
in F
eb
rua
ry 2
01
4 a
nd
wa
s a
dd
ress
ed
with
Sw
itc
hb
oa
rd s
taff
f)
C
om
pla
ints
are
re
ferr
ed
to
th
e S
witc
hb
oa
rd
Ma
na
ge
r
f)
No
co
mp
lain
ts w
ere
re
ce
ive
d

An
nu
al R
ep
ort
fo
r 2013/1
4 F
ina
nc
ial Y
ea
r
Vo
te 5
: D
ep
art
me
nt
of
Ed
uc
ati
on
Pro
vin
ce
of
the
We
ste
rn C
ap
e
22
Cu
rre
nt/
ac
tua
l a
rra
ng
em
en
ts
De
sire
d a
rra
ng
em
en
ts
Ac
tua
l a
ch
iev
em
en
ts
Op
en
ne
ss &
Tra
nsp
are
nc
y:
Op
en
ne
ss &
Tra
nsp
are
nc
y:
Op
en
ne
ss &
Tra
nsp
are
nc
y:
a)
On
th
e W
CED
we
bsi
te
a)
On
th
e W
CED
we
bsi
te
a)
No
su
gg
est
ion
s to
imp
rove
th
e C
lien
t C
on
tac
t
Ce
ntr
es
via
th
e W
CED
we
bsi
te w
ere
re
ce
ive
d
du
rin
g t
he
re
po
rtin
g p
erio
d
b)
Clie
nt
Co
nta
ct
Ce
ntr
es
ha
ve
su
gg
est
ion
bo
xes
for
clie
nt
co
mm
en
t
b)
Clie
nt
Co
nta
ct
Ce
ntr
es
ha
ve
su
gg
est
ion
bo
xes
for
clie
nt
co
mm
en
t
b)
No
su
gg
est
ion
s to
imp
rove
th
e C
lien
t C
on
tac
t
ce
ntr
es
via
th
e s
ug
ge
stio
n b
oxe
s w
ere
re
ce
ive
d
du
rin
g t
he
re
po
rtin
g p
erio
d
c)
The
an
nu
al C
ust
om
er
Sa
tisf
ac
tio
n S
urv
ey a
sse
sse
s
the
pe
rce
ptio
n o
f W
CED
se
rvic
es
an
d o
ffe
rs
op
po
rtu
nity f
or
critiq
ue
, su
gg
est
ion
s fo
r im
pro
ve
me
nt
an
d c
om
pla
ints
.
c)
Inp
ut
rec
eiv
ed
in t
he
su
gg
est
ion
bo
xe
s is
mo
nito
red
,
rep
ort
ed
up
on
an
d f
ea
sib
le in
pu
t in
co
rpo
rate
d in
to
the
WC
ED
te
lec
om
mu
nic
atio
n m
an
ag
em
en
t
po
licie
s
c)
Sig
nific
an
t im
pro
ve
me
nts
fro
m p
revio
us
ye
ar’
s
cu
sto
me
r sa
tisf
ac
tio
n s
urv
eys
we
re r
ec
ord
ed
d
) Th
e a
nn
ua
l C
ust
om
er
Sa
tisf
ac
tio
n S
urv
ey a
sse
sse
s
the
pe
rce
ptio
n o
f W
CED
se
rvic
es
an
d o
ffe
rs
op
po
rtu
nity f
or
critiq
ue
, su
gg
est
ion
s fo
r im
pro
ve
me
nt
an
d c
om
pla
ints
d)
Sig
nific
an
t im
pro
ve
me
nts
on
pre
vio
us
ye
ar’
s
cu
sto
me
r sa
tisf
ac
tio
n s
urv
eys
we
re r
ec
ord
ed
Va
lue
fo
r M
on
ey
: V
alu
e fo
r M
on
ey
: V
alu
e fo
r M
on
ey
:
a)
Ca
llers
wis
hin
g t
o e
nq
uire
ab
ou
t c
orp
ora
te s
erv
ice
s
(Hu
ma
n R
eso
urc
es,
an
d F
ina
nc
ial m
an
ag
em
en
t)
ma
tte
rs a
re r
efe
rre
d t
o t
he
WC
ED
Ca
ll C
en
tre
fo
r
de
dic
ate
d a
tte
ntio
n v
ia t
he
sw
itc
hb
oa
rd
a)
Ca
llers
wis
hin
g t
o e
nq
uire
ab
ou
t c
orp
ora
te s
erv
ice
s
(Hu
ma
n R
eso
urc
es,
an
d F
ina
nc
ial M
an
ag
em
en
t)
ma
tte
rs a
re r
efe
rre
d t
o t
he
WC
ED
Ca
ll C
en
tre
fo
r
de
dic
ate
d a
tte
ntio
n v
ia t
he
sw
itc
hb
oa
rd
a)
Switc
hb
oa
rd o
pe
rato
rs r
ec
eiv
e c
alls
fo
r th
e C
all
Ce
ntr
e o
n a
da
ily b
asi
s
b)
De
dic
ate
d li
ne
s fo
r W
CED
Sa
fe S
ch
oo
ls a
nd
Exa
min
atio
n li
ne
s (d
urin
g P
ea
k p
erio
ds)
are
sh
are
d
with
clie
nts
, fo
r in
form
atio
n
b)
De
dic
ate
d li
ne
s fo
r W
CED
Sa
fe S
ch
oo
ls a
nd
Exa
min
atio
n li
ne
s (d
urin
g P
ea
k p
erio
ds)
are
sh
are
d
with
clie
nts
, fo
r in
form
atio
n
b)
De
dic
ate
d li
ne
s fo
r W
CED
sa
fe s
ch
oo
ls a
nd
Exa
min
atio
n li
ne
s (d
urin
g P
ea
k p
erio
ds)
are
sh
are
d
with
clie
nts
, fo
r in
form
atio
n
c)
4 d
ed
ica
ted
op
era
tors
ma
na
ge
th
e c
alls
to
He
ad
–
Off
ice
bu
ildin
gs
c)
4 d
ed
ica
ted
op
era
tors
ma
na
ge
th
e c
alls
to
He
ad
–
Off
ice
bu
ildin
gs
c)
4 d
ed
ica
ted
op
era
tors
ma
na
ge
th
e c
alls
to
He
ad
–
Off
ice
bu
ildin
gs
d)
Ass
istiv
e d
evic
es
are
use
d t
o s
up
po
rt s
taff
with
vis
ua
l
imp
airm
en
t c
ha
llen
ge
s a
t th
e s
witc
hb
oa
rd
Po
licy f
or
tele
co
mm
un
ica
tio
n m
an
ag
em
en
t se
rvic
es
an
d s
up
po
rt is
log
ge
d o
n t
he
WC
ED
we
bsi
te
d)
Ass
istiv
e d
evic
es
are
use
d t
o s
up
po
rt s
taff
with
vis
ua
l
imp
airm
en
t c
ha
llen
ge
s a
t th
e s
witc
hb
oa
rd
Po
licy f
or
tele
co
mm
un
ica
tio
n m
an
ag
em
en
t se
rvic
es
an
d s
up
po
rt is
log
ge
d o
n t
he
WC
ED
we
bsi
te
d)
Ass
istiv
e d
evic
es
are
use
d t
o s
up
po
rt s
taff
with
vis
ua
l
imp
airm
en
t c
ha
llen
ge
s a
t th
e s
witc
hb
oa
rd
Po
licy f
or
tele
co
mm
un
ica
tio
n m
an
ag
em
en
t se
rvic
es
an
d s
up
po
rt is
log
ge
d o
n t
he
WC
ED
we
bsi
te
Pro
vid
ing
first
lin
e o
f su
pp
ort
to
vic
tim
s o
f a
bu
se, v
iole
nc
e
an
d s
ch
oo
l c
rim
e a
t W
CED
in
stitu
tio
ns
Co
nsu
lta
tio
n:
Co
nsu
lta
tio
n:
Co
nsu
lta
tio
n:
a)
Tele
ph
on
e c
on
sulta
tio
ns
a)
Initia
te d
isc
uss
ion
s w
ith
th
e s
erv
ice
pro
vid
er
co
ntr
ac
ted
by t
he
WC
ED
to
up
gra
de
th
e s
yst
em
to
en
sure
th
at
it is
en
ab
led
to
ca
ter
for
an
on
line
ra
tin
g
of
serv
ice
s
a)
The
Cyb
er
Ca
ll sy
ste
m h
as
no
t b
ee
n u
pg
rad
ed
as
ye
t. H
ow
ev
er,
a n
ew
Sa
fe S
ch
oo
ls M
an
ag
em
en
t
Syst
em
ha
s b
ee
n d
eve
lop
ed
wh
ich
exp
ed
ite
s th
e
ge
ne
ratio
n o
f re
fere
nc
e n
um
be
rs a
nd
th
e lo
gg
ing
of
the
ca
ller in
form
atio
n w
hils
t st
ill o
nlin
e

An
nu
al R
ep
ort
fo
r 2013/1
4 F
ina
nc
ial Y
ea
r
Vo
te 5
: D
ep
art
me
nt
of
Ed
uc
ati
on
Pro
vin
ce
of
the
We
ste
rn C
ap
e
23
Cu
rre
nt/
ac
tua
l a
rra
ng
em
en
ts
De
sire
d a
rra
ng
em
en
ts
Ac
tua
l a
ch
iev
em
en
ts
b)
Dis
tric
ts c
on
sult w
ith
sa
fe s
ch
oo
ls c
lust
er
b)
Tele
ph
on
e c
on
sulta
tio
ns
b)
A s
urv
ey f
orm
ha
s b
ee
n d
eve
lop
ed
to
ga
the
r se
rvic
e
pe
rce
ptio
ns
ma
nu
ally
. It
will
be
sig
ne
d-o
ff in
th
e
201
4/2
01
5 f
ina
nc
ial ye
ar
for
imp
lem
en
tatio
n u
ntil th
e
syst
em
up
gra
de
is
co
mp
lete
d
c)
Dire
ct
co
nsu
lta
tio
n w
ith
en
qu
ire
rs (
ca
llers
) ta
ke
s
pla
ce
wh
ile c
alls
are
log
ge
d a
nd
ca
ses
are
fo
llow
ed
thro
ug
h
c)
Dis
tric
ts c
on
sult w
ith
sa
fe s
ch
oo
ls c
lust
ers
c
) A
su
rve
y f
orm
ha
s b
ee
n d
eve
lop
ed
to
ga
the
r se
rvic
e
pe
rce
ptio
ns
ma
nu
ally
. It
will
be
sig
ne
d-o
ff in
th
e
201
4/2
01
5 f
ina
nc
ial ye
ar
for
imp
lem
en
tatio
n u
ntil th
e
syst
em
up
gra
de
is
co
mp
lete
d
d)
The
an
nu
al C
ust
om
er
Sa
tisf
ac
tio
n s
urv
ey is
a s
ou
rce
of
co
nsu
lta
tio
n a
s c
lien
ts a
re t
arg
ete
d
d)
Dire
ct
co
nsu
lta
tio
ns
with
en
qu
ire
rs (
ca
llers
) ta
ke
pla
ce
wh
ile c
alls
are
log
ge
d a
nd
ca
ses
are
follo
we
d-t
hro
ug
h
d)
Dire
ct
co
nsu
lta
tio
n w
ith
en
qu
ire
rs (
ca
llers
) ta
ke
s
pla
ce
wh
ile c
alls
are
log
ge
d a
nd
ca
ses
are
fo
llow
ed
thro
ug
h
e)
The
Dis
tric
t w
eb
site
fe
ed
ba
ck f
ac
ility
e
) Th
e a
nn
ua
l C
ust
om
er
Sa
tisf
ac
tio
n s
urv
ey is
a s
ou
rce
of
co
nsu
lta
tio
n a
s c
lien
ts a
re t
arg
ete
d
e)
Sig
nific
an
t im
pro
ve
me
nts
fro
m p
revio
us
ye
ar’
s
cu
sto
me
r sa
tisf
ac
tio
n s
urv
eys
we
re r
ec
ord
ed
f)
The
Th
eta
Na
thi c
om
pla
ints
an
d c
om
plim
en
ts
me
ch
an
ism
. In
pu
t is
use
d t
o im
pro
ve
cu
rre
nt
serv
ice
de
live
ry le
ve
ls
f)
The
Dis
tric
t w
eb
site
fe
ed
ba
ck f
ac
ility
f)
Th
e o
nlin
e f
ee
db
ac
k s
yst
em
wh
ich
re
pla
ce
d t
he
The
ta N
ath
i sy
ste
m r
ep
ort
ed
no
sp
ec
ific
te
lep
ho
ne
ma
na
ge
me
nt
co
mp
lain
ts f
or
the
re
po
rtin
g p
erio
d
g
) Th
e T
he
ta N
ath
i c
om
pla
ints
an
d c
om
plim
en
ts
me
ch
an
ism
. In
pu
t is
use
d t
o im
pro
ve
cu
rre
nt
serv
ice
de
live
ry le
ve
ls
g)
The
on
line
fe
ed
ba
ck s
yst
em
wh
ich
re
pla
ce
d t
he
The
ta N
ath
i sy
ste
m r
ep
ort
ed
no
sp
ec
ific
te
lep
ho
ne
ma
na
ge
me
nt
co
mp
lain
ts f
or
the
re
po
rtin
g p
erio
d
Ac
ce
ss
Ac
ce
ss:
Ac
ce
ss:
a)
2n
d F
loo
r G
ran
d C
en
tra
l Bu
ildin
g (
via
te
lep
ho
ne
/
pro
fess
ion
al c
all
ce
ntr
e)
a)
2n
d F
loo
r G
ran
d C
en
tra
l Bu
ildin
g (
via
te
lep
ho
ne
/
pro
fess
ion
al c
all
ce
ntr
e)
a)
2n
d F
loo
r G
ran
d C
en
tra
l Bu
ildin
g (
via
te
lep
ho
ne
/
pro
fess
ion
al c
all
ce
ntr
e)
b)
Toll
fre
e li
ne
: Sa
fe S
ch
oo
ls: 0
80
0 4
5 4
6 4
7
b)
Toll
fre
e li
ne
: Sa
fe S
ch
oo
ls: 0
80
0 4
5 4
6 4
7
b)
Toll
fre
e S
afe
Sc
ho
ols
lin
e: 0
80
0 4
5 4
6 4
7
c)
Op
era
tin
g h
ou
rs o
f th
e C
all
Ce
ntr
e: 0
7:3
0 –
16:0
0.
Aft
er
ho
urs
re
co
rdin
g o
f e
nq
uirie
s
c)
Op
era
tin
g h
ou
rs o
f th
e C
all
ce
ntr
e: 0
7:3
0 –
16:0
0.
Aft
er
ho
urs
re
co
rdin
g o
f e
nq
uirie
s
c)
Op
era
tin
g h
ou
rs o
f th
e C
all
Ce
ntr
e: 0
7:3
0 –
16:0
0.
Aft
er
ho
urs
re
co
rdin
g o
f e
nq
uirie
s is
fo
llow
ed
-up
on
the
ne
xt
wo
rkin
g d
ay
Co
urt
esy
: C
ou
rte
sy:
Co
urt
esy
:
a)
Ed
uc
atio
n S
afe
ty M
an
ag
er
a
) Ed
uc
atio
n S
afe
ty M
an
ag
er
a)
Ed
uc
atio
n S
afe
ty M
an
ag
er
att
en
ds
to a
ll q
ue
rie
s
an
d e
xhib
its
co
urt
esy
b)
Fee
db
ac
k t
o D
ire
cto
rate
Co
mm
un
ica
tio
n t
hro
ug
h
the
“C
on
tac
t W
CED
Fo
rm”
in t
he
WC
ED
On
-lin
e
we
bsi
te
b)
Fee
db
ac
k t
o D
ire
cto
rate
Co
mm
un
ica
tio
n t
hro
ug
h
the
“C
on
tac
t W
CED
Fo
rm”
in t
he
WC
ED
On
-lin
e
we
bsi
te
b)
The
on
line
fe
ed
ba
ck s
yst
em
wh
ich
re
pla
ce
d T
he
ta
Na
thi sy
ste
m r
ep
ort
ed
no
sp
ec
ific
te
lep
ho
ne
ma
na
ge
me
nt
co
mp
lain
ts f
or
the
re
po
rtin
g p
erio
d
c)
All
ca
llers
(c
lien
ts)
are
we
lco
me
d t
o t
he
WC
ED
He
ad
-Off
ice
an
d d
ea
lt w
ith
dig
nity, w
hile
ask
ed
ho
w
the
co
nsu
lta
nts
ca
n b
e o
f se
rvic
e
c)
All
ca
llers
(c
lien
ts)
are
we
lco
me
d t
o t
he
WC
ED
He
ad
-Off
ice
an
d d
ea
lt w
ith
dig
nity, w
hile
ask
ed
ho
w
the
co
nsu
lta
nts
ca
n b
e o
f se
rvic
e
c)
All
ca
llers
(c
lien
ts)
are
we
lco
me
d t
o t
he
WC
ED
He
ad
-Off
ice
an
d d
ea
lt w
ith
dig
nity, w
hile
ask
ed
ho
w
the
ca
llers
ca
n b
e a
ssis
ted
d)
The
Th
eta
-Na
thi c
om
pla
ints
an
d c
om
plim
en
ts
me
ch
an
ism
pu
blis
he
d is
use
d t
o s
ee
k r
ed
ress
, if
sta
nd
ard
s a
re n
ot
me
t
d)
The
Th
eta
-Na
thi c
om
pla
ints
an
d c
om
plim
en
ts
me
ch
an
ism
pu
blis
he
d is
use
d t
o s
ee
k r
ed
ress
, if
sta
nd
ard
s a
re n
ot
me
t
d)
The
on
line
fe
ed
ba
ck s
yst
em
wh
ich
re
pla
ce
d t
he
The
ta N
ath
i sy
ste
m r
ep
ort
ed
no
sp
ec
ific
te
lep
ho
ne
ma
na
ge
me
nt
co
mp
lain
ts f
or
the
re
po
rtin
g p
erio
d
e)
Dis
tric
t w
eb
site
fe
ed
ba
ck f
ac
ility
e
) D
istr
ict
we
bsi
te f
ee
db
ac
k f
ac
ility
e
) If a
nd
wh
en
co
mp
lain
ts w
ere
re
gis
tere
d, th
ese
reg
iste
red
co
mp
lain
ts w
ere
dis
cu
sse
d a
t sc
he
du
led
me
etin
gs
he
ld f
or
red
ress
with
dis
tric
t C
oo
rdin
ato
rs
an
d F
ield
wo
rke
rs

An
nu
al R
ep
ort
fo
r 2013/1
4 F
ina
nc
ial Y
ea
r
Vo
te 5
: D
ep
art
me
nt
of
Ed
uc
ati
on
Pro
vin
ce
of
the
We
ste
rn C
ap
e
24
Cu
rre
nt/
ac
tua
l a
rra
ng
em
en
ts
De
sire
d a
rra
ng
em
en
ts
Ac
tua
l a
ch
iev
em
en
ts
Op
en
ne
ss &
Tra
nsp
are
nc
y:
Op
en
ne
ss &
Tra
nsp
are
nc
y:
Op
en
ne
ss &
Tra
nsp
are
nc
y:
a)
On
th
e W
CED
we
bsi
te a
nd
th
e C
lien
t C
on
tac
t
Ce
ntr
es
ha
ve
su
gg
est
ion
bo
xes
for
Clie
nt
inp
ut
a)
On
th
e W
CED
we
bsi
te a
nd
th
e C
lien
t C
on
tac
t
Ce
ntr
es
ha
ve
su
gg
est
ion
bo
xes
for
Clie
nt
inp
ut
a)
The
on
line
fe
ed
ba
ck s
yst
em
wh
ich
re
pla
ce
d T
he
ta
Na
thi sy
ste
m r
ep
ort
ed
no
sp
ec
ific
te
lep
ho
ne
ma
na
ge
me
nt
co
mp
lain
ts f
or
the
re
po
rtin
g p
erio
d.
Su
gg
est
ion
bo
xes
we
re n
ot
utilis
ed
b)
The
an
nu
al C
ust
om
er
Sa
tisf
ac
tio
n S
urv
ey a
sse
sse
s
the
pe
rce
ptio
n o
f W
CED
se
rvic
es
an
d o
ffe
rs
op
po
rtu
nity f
or
critiq
ue
, su
gg
est
ion
s fo
r im
pro
ve
me
nt
an
d c
om
pla
ints
b)
The
an
nu
al C
ust
om
er
Sa
tisf
ac
tio
n S
urv
ey a
sse
sse
s
the
pe
rce
ptio
n o
f W
CED
se
rvic
es
an
d o
ffe
rs
op
po
rtu
nity f
or
critiq
ue
, su
gg
est
ion
s fo
r im
pro
ve
me
nt
an
d c
om
pla
ints
b)
Sig
nific
an
t im
pro
ve
me
nts
on
pre
vio
us
ye
ar’
s
cu
sto
me
r sa
tisf
ac
tio
n s
urv
eys
we
re r
ec
ord
ed
c)
Sa
fe S
ch
oo
ls c
o-o
rdin
ato
rs a
t D
istr
ict
leve
l in
clu
de
the
se
rvic
es
of
the
Sa
fe S
ch
oo
ls C
all
Ce
ntr
e
c)
Sa
fe S
ch
oo
ls c
o-o
rdin
ato
rs a
t D
istr
ict
leve
l in
clu
de
the
se
rvic
es
of
the
Sa
fe S
ch
oo
ls C
all
Ce
ntr
e
c)
Sa
fe S
ch
oo
ls c
o-o
rdin
ato
rs a
t D
istr
ict
leve
l in
clu
de
the
se
rvic
es
of
the
Sa
fe S
ch
oo
ls C
all
Ce
ntr
e
d)
Tele
ph
on
e m
ark
etin
g
d)
Tele
ph
on
e m
ark
etin
g
d)
The
Sa
fe S
ch
oo
ls D
istr
ict
Co
ord
ina
tors
an
d t
he
Sa
fe
Sc
ho
ols
Fie
ldw
ork
ers
at
the
dis
tric
t p
erf
orm
se
rvic
es
of
the
Sa
fe S
ch
oo
ls C
all
Ce
ntr
e. Jo
b d
esc
rip
tio
ns
ha
ve
be
en
am
en
de
d t
o r
efle
ct
this
inc
lusi
ve
ne
ss
fac
tor
Va
lue
fo
r M
on
ey
: V
alu
e fo
r M
on
ey
: V
alu
e fo
r M
on
ey
:
a)
Wh
ile t
he
ca
ll c
en
tre
sta
ff c
om
ple
me
nt
is s
ma
ll a
nd
the
nu
mb
ers
of
ca
lls r
eg
iste
red
are
min
ima
l, t
he
re
al
va
lue
ad
din
g w
ork
is
do
ne
in t
he
fie
ld, th
rou
gh
pa
rtn
ers
hip
, u
se o
f sa
fety
fie
ldw
ork
ers
an
d
psy
ch
olo
gis
ts
a)
Wh
ile t
he
ca
ll c
en
tre
sta
ff c
om
ple
me
nt
is s
ma
ll a
nd
the
nu
mb
ers
of
ca
lls r
eg
iste
red
are
min
ima
l, t
he
re
al
va
lue
ad
din
g w
ork
is
do
ne
in t
he
fie
ld, th
rou
gh
pa
rtn
ers
hip
s, u
se o
f sa
fety
fie
ldw
ork
ers
an
d
psy
ch
olo
gis
ts
a)
The
Sa
fe S
ch
oo
ls C
all
Ce
ntr
e m
an
ag
ed
14 8
54
ca
lls
b)
Sa
fety
Fie
ldw
ork
ers
fo
llow
up
on
tru
an
t le
arn
ers
an
d
ass
ess
lea
rne
r p
rob
lem
s
b)
Sa
fety
Fie
ldw
ork
ers
fo
llow
up
on
tru
an
t le
arn
ers
an
d
ass
ess
lea
rne
r p
rob
lem
s
b)
The
Sa
fe S
ch
oo
ls F
ield
wo
rke
rs f
ollo
w u
p o
n t
rua
nt
lea
rne
rs, a
sse
ss le
arn
er
pro
ble
ms
an
d f
ac
ilita
te t
he
re
-
inte
gra
tio
n o
f le
arn
ers
to
sc
ho
ol b
y p
art
ne
rin
g w
ith
the
re
lev
an
t ro
le-p
laye
rs s
uc
h a
s th
e D
ep
art
me
nt
of
So
cia
l De
ve
lop
me
nt
c)
Pro
vid
ing
me
nto
rin
g a
nd
co
ac
hin
g t
o le
arn
ers
at
risk
an
d e
nsu
re t
ha
t le
arn
ers
ac
ce
ss s
erv
ice
s th
ey n
ee
d
c)
Pro
vid
ing
me
nto
rin
g a
nd
co
ac
hin
g t
o le
arn
ers
at
risk
an
d t
o e
nsu
re t
ha
t le
arn
ers
ac
ce
ss s
erv
ice
s th
ey
ne
ed
c)
The
Sa
fe S
ch
oo
ls F
ield
wo
rke
rs m
en
tor
an
d c
oa
ch
lea
rne
rs a
t risk
to
en
sure
th
at
lea
rne
rs a
cc
ess
se
rvic
es
the
y n
ee
d
d)
Fac
ilita
tin
g t
he
Sa
fe S
ch
oo
ls Y
ou
th C
lub
s a
s p
art
of
the
ho
lida
y p
rog
ram
me
d)
Fac
ilita
tin
g t
he
Sa
fe S
ch
oo
ls Y
ou
th C
lub
s a
s p
art
of
the
ho
lida
y p
rog
ram
me
d)
The
Sa
fe S
ch
oo
ls C
all
Ce
ntr
e lo
gg
ed
314 t
rua
nc
y
inc
ide
nts
, o
f w
hic
h 2
85
we
re r
efe
rre
d t
o t
he
dis
tric
t fo
r
inte
rve
ntio
n b
y t
he
Sa
fe S
ch
oo
ls F
ield
wo
rke
r
The
20 e
mp
loye
d S
afe
Sc
ho
ols
Fie
ldw
ork
ers
fac
ilita
ted
th
e S
afe
Sc
ho
ols
Yo
uth
Clu
bs
as
pa
rt o
f
the
ho
lida
y p
rog
ram
me
7
8 y
ou
th c
lub
s h
ave
be
en
est
ab
lish
ed
1
01
ho
lida
y p
rog
ram
me
ve
nu
es
ca
tere
d f
or
13 9
68
lea
rne
rs

An
nu
al R
ep
ort
fo
r 2013/1
4 F
ina
nc
ial Y
ea
r
Vo
te 5
: D
ep
art
me
nt
of
Ed
uc
ati
on
Pro
vin
ce
of
the
We
ste
rn C
ap
e
25
Se
rvic
e d
eliv
ery
in
form
atio
n t
oo
l
Cu
rre
nt/
ac
tua
l in
form
atio
n t
oo
ls
De
sire
d in
form
atio
n t
oo
ls
Ac
tua
l a
ch
iev
em
en
ts
Pro
vid
e t
ele
co
mm
un
ica
tio
n S
erv
ice
at
WC
ED
He
ad
Off
ice
a
) A
ll in
tern
al c
lien
ts a
nd
clie
nts
lin
ke
d t
o t
he
sc
ho
ols
are
co
mm
un
ica
ted
with
via
off
icia
l c
orr
esp
on
de
nc
e
(circ
ula
rs/c
irc
ula
r m
inu
tes)
, w
hic
h a
re s
tore
d o
n t
he
we
bsi
te f
or
ge
ne
ral c
lien
ts t
o a
cc
ess
a)
All
inte
rna
l c
lien
ts a
nd
clie
nts
lin
ke
d t
o t
he
sc
ho
ols
are
co
mm
un
ica
ted
with
via
off
icia
l c
orr
esp
on
de
nc
e
(circ
ula
rs/c
irc
ula
r m
inu
tes)
, w
hic
h a
re s
tore
d o
n t
he
we
bsi
te f
or
ge
ne
ral c
lien
ts t
o a
cc
ess
a)
All
inte
rna
l c
lien
ts a
nd
clie
nts
lin
ke
d t
o t
he
sc
ho
ols
are
co
mm
un
ica
ted
with
via
off
icia
l c
orr
esp
on
de
nc
e
(circ
ula
rs/c
irc
ula
r m
inu
tes)
, w
hic
h a
re s
tore
d o
n t
he
we
bsi
te f
or
ge
ne
ral c
lien
ts t
o a
cc
ess
b)
Lett
erh
ea
ds
inc
lud
ing
th
e S
erv
ice
De
live
ry C
ha
rte
r,
ac
ce
ssib
le a
t a
ll e
du
ca
tio
n s
ite
s a
nd
su
pp
ort
off
ice
s
b)
Lett
erh
ea
ds
inc
lud
ing
th
e S
erv
ice
De
live
ry C
ha
rte
r,
ac
ce
ssib
le a
t a
ll e
du
ca
tio
n s
ite
s a
nd
su
pp
ort
off
ice
s b
) Le
tte
rhe
ad
s in
clu
din
g t
he
Se
rvic
e D
eliv
ery
Ch
art
er,
ac
ce
ssib
le a
t a
ll e
du
ca
tio
n s
ite
s a
nd
su
pp
ort
off
ice
s
c)
E-m
ail
c)
E-m
ail
c)
E-m
ail
d)
We
ste
rn C
ap
e E
du
ca
tio
n D
ep
art
me
nt
we
bsi
te
d)
We
ste
rn C
ap
e E
du
ca
tio
n D
ep
art
me
nt
we
bsi
te
d)
We
ste
rn C
ap
e E
du
ca
tio
n D
ep
art
me
nta
l we
bsi
te
e)
Switc
hb
oa
rd M
an
ag
er
e)
Switc
hb
oa
rd M
an
ag
er
e)
No
ne
ed
aro
se t
o c
om
mu
nic
ate
with
clie
nts
Pro
vid
ing
first
lin
e o
f su
pp
ort
to
vic
tim
s o
f a
bu
se, v
iole
nc
e
an
d s
ch
oo
l c
rim
e a
t W
CED
in
stitu
tio
ns
a)
Sa
fe S
ch
oo
ls C
lust
er
me
etin
gs
a)
Sa
fe S
ch
oo
ls C
lust
er
me
etin
gs
a)
The
Sa
fe S
ch
oo
ls C
all
Ce
ntr
e p
rovid
es
the
dis
tric
t
with
sta
tist
ics
of
all
inc
ide
nts
wh
ich
ass
ists
th
em
with
the
pla
nn
ing
of
de
ve
lop
me
nta
l a
nd
inte
rve
ntio
n
pro
gra
mm
es
b)
Dis
trib
ute
bro
ch
ure
s a
t e
ve
nts
b
) D
istr
ibu
te b
roc
hu
res
at
ev
en
ts
b)
Sc
he
du
led
me
etin
gs
we
re h
eld
with
Dis
tric
t C
o-
ord
ina
tors
an
d F
ield
wo
rke
rs
c)
Info
rma
tio
n t
ab
les
at
eve
nts
c
) In
form
atio
n t
ab
les
at
eve
nts
c
) Th
e S
afe
Sc
ho
ols
Ca
ll C
en
tre
nu
mb
er
is p
rin
ted
on
all
off
icia
l le
tte
rhe
ad
s a
nd
sta
tio
ne
ry
d)
Dis
tric
t w
eb
site
fe
ed
ba
ck f
ac
ility
d
) D
istr
ict
we
bsi
te f
ee
db
ac
k f
ac
ility
d
) D
istr
ibu
ted
bro
ch
ure
s a
t e
ve
nts
with
info
rma
tio
n
tab
les
e)
The
sa
fe s
ch
oo
ls c
all
ce
ntr
e n
um
be
r is
prin
ted
on
ca
ll
off
icia
l W
CED
Le
tte
rhe
ad
s in
clu
din
g t
he
Se
rvic
e
de
live
ry C
ha
rte
r, a
cc
ess
ible
at
all
ed
uc
atio
n s
ite
s
an
d s
up
po
rt o
ffic
es
e)
The
sa
fe s
ch
oo
ls c
all
ce
ntr
e n
um
be
r is
prin
ted
on
ca
ll
off
icia
l W
CED
Le
tte
rhe
ad
s in
clu
din
g t
he
Se
rvic
e
de
live
ry C
ha
rte
r, a
cc
ess
ible
at
all
ed
uc
atio
n s
ite
s
an
d s
up
po
rt o
ffic
es
e)
The
Sa
fe S
ch
oo
ls C
all
Ce
ntr
e n
um
be
r is
prin
ted
on
ca
ll o
ffic
ial W
CED
Le
tte
rhe
ad
s in
clu
din
g t
he
Se
rvic
e
de
live
ry C
ha
rte
r, a
cc
ess
ible
at
all
ed
uc
atio
n s
ite
s
an
d s
up
po
rt o
ffic
es
f)
Ma
rke
tin
g m
erc
ha
nd
ise
is d
istr
ibu
ted
an
nu
ally
to
imp
rove
info
rma
tio
n s
ha
rin
g a
nd
to
ad
ve
rtis
e t
he
un
iqu
e s
erv
ice
s o
n o
ffe
r
f)
Ma
rke
tin
g m
erc
ha
nd
ise
is d
istr
ibu
ted
an
nu
ally
to
imp
rove
info
rma
tio
n s
ha
rin
g a
nd
to
ad
ve
rtis
e t
he
un
iqu
e s
erv
ice
s o
n o
ffe
r
f)
The
Sa
fe S
ch
oo
ls C
all
Ce
ntr
e n
um
be
r a
pp
ea
rs o
n a
ll
WC
ED
le
tte
rhe
ad
s a
nd
sta
tio
ne
ry. Th
e n
um
be
r a
lso
ap
pe
ars
on
th
e h
an
d h
eld
me
tal d
ete
cto
rs a
s w
ell
as
Oc
cu
pa
tio
na
l H
ea
lth
an
d S
afe
ty (
OH
S)
info
rma
tio
n b
oa
rds
an
d o
the
r si
gn
ag
e (
pro
hib
itin
g
ille
ga
l su
bst
an
ce
an
d d
an
ge
rou
s w
ea
po
ns)
at
all
sch
oo
ls

An
nu
al R
ep
ort
fo
r 2013/1
4 F
ina
nc
ial Y
ea
r
Vo
te 5
: D
ep
art
me
nt
of
Ed
uc
ati
on
Pro
vin
ce
of
the
We
ste
rn C
ap
e
26
Co
mp
lain
ts m
ec
ha
nis
m
Cu
rre
nt/
ac
tua
l c
om
pla
ints
me
ch
an
ism
D
esi
red
co
mp
lain
ts m
ec
ha
nis
m
Ac
tua
l a
ch
iev
em
en
ts
Pro
vid
e t
ele
co
mm
un
ica
tio
n S
erv
ice
at
WC
ED
He
ad
Off
ice
a)
The
Th
eta
-Na
thi c
om
pla
ints
an
d c
om
plim
en
ts
me
ch
an
ism
pu
blis
he
d o
n t
he
WC
ED
Se
rvic
e C
ha
rte
r
is a
me
an
s to
se
ek r
ed
ress
if p
ub
lish
ed
sta
nd
ard
s
we
re n
ot
me
t
a)
The
Th
eta
-Na
thi st
atist
ics
are
mo
nito
red
, re
po
rt u
po
n
an
d s
tra
teg
ies
to a
dd
ress
an
d im
pro
ve
sta
tus
qu
o
imp
lem
en
ted
a)
The
on
line
fe
ed
ba
ck w
hic
h r
ep
lac
ed
th
e T
he
ta
Na
thi sy
ste
m r
ep
ort
ed
no
sp
ec
ific
exte
rna
l
tele
ph
on
e m
an
ag
em
en
t c
om
pla
ints
fo
r th
e
rep
ort
ing
pe
rio
d
b)
Co
mp
lain
ts a
re r
efe
rre
d t
o t
he
Sw
itc
hb
oa
rd
Ma
na
ge
r
b)
The
Th
eta
-Na
thi c
om
pla
ints
an
d c
om
plim
en
ts
me
ch
an
ism
is u
sed
to
se
ek r
ed
ress
, if s
tan
da
rds
are
no
t m
et
b)
306
inte
rna
l c
om
pla
ints
we
re r
ec
eiv
ed
an
d
suc
ce
ssfu
lly d
ea
lt w
ith
c)
Fee
db
ac
k f
ac
ility
on
we
bsi
te
c)
Co
mp
lain
ts a
re r
efe
rre
d t
o t
he
Sw
itc
hb
oa
rd
Ma
na
ge
r c
) Th
e o
nlin
e f
ee
db
ac
k w
hic
h r
ep
lac
ed
th
e T
he
ta
Na
thi sy
ste
m r
ep
ort
ed
no
sp
ec
ific
exte
rna
l
tele
ph
on
e m
an
ag
em
en
t c
om
pla
ints
fo
r th
e
rep
ort
ing
pe
rio
d
d
) Fe
ed
ba
ck f
ac
ility
on
we
bsi
te
d)
The
on
line
fe
ed
ba
ck w
hic
h r
ep
lac
ed
th
e T
he
ta
Na
thi sy
ste
m r
ep
ort
ed
no
sp
ec
ific
exte
rna
l
tele
ph
on
e m
an
ag
em
en
t c
om
pla
ints
fo
r th
e
rep
ort
ing
pe
rio
d
Pro
vid
ing
first
lin
e o
f su
pp
ort
to
vic
tim
s o
f a
bu
se, v
iole
nc
e
an
d s
ch
oo
l c
rim
e a
t W
CED
in
stitu
tio
ns
a)
Ed
uc
atio
n S
afe
ty M
an
ag
er
mo
nito
rs c
om
pla
ints
an
d
take
ap
pro
pria
te a
ctio
n
a)
Ed
uc
atio
n S
afe
ty M
an
ag
er
mo
nito
rs c
om
pla
ints
an
d
take
ap
pro
pria
te a
ctio
n
a)
The
Ed
uc
atio
n S
afe
ty M
an
ag
er
take
s a
pp
rop
ria
te
ac
tio
n w
he
n r
ec
eiv
ing
co
mp
lain
ts; th
ese
inc
lud
e
me
dia
tin
g w
ith
th
e a
ffe
cte
d p
ers
on
/s a
nd
/or
inte
rve
ntio
n/
rem
ed
ial s
tep
s fo
r th
e S
afe
Sc
ho
ols
Ca
ll
Ce
ntr
e C
on
sulta
nt
thro
ug
h o
n t
he
jo
b t
rain
ing
. Th
e
Sa
fe S
ch
oo
ls C
all
Ce
ntr
e m
an
ag
ed
14
854 c
alls
wh
ich
inc
lud
ed
inc
ide
nts
re
latin
g t
o b
urg
lary
an
d
va
nd
alis
m,
crim
e a
nd
vio
len
ce
, g
an
gst
erism
, a
bu
se
an
d S
ch
oo
l G
ove
rnin
g B
od
y q
ue
rie
s
b)
Ca
ll C
en
tre
Ma
na
ge
r a
va
ilab
le t
o a
tte
nd
to
co
mp
lain
ts
b)
Ca
ll C
en
tre
Ma
na
ge
r a
va
ilab
le t
o a
tte
nd
to
co
mp
lain
ts
b-d
)Th
e o
nlin
e f
ee
db
ac
k (
rep
lac
ed
Th
eta
Na
thi)
syst
em
rep
ort
ed
no
sp
ec
ific
te
lep
ho
ne
ma
na
ge
me
nt
co
mp
lain
ts f
or
the
re
po
rtin
g p
erio
d.
c)
Fee
db
ac
k f
ac
ility
n w
eb
site
c
) Fe
ed
ba
ck f
ac
ility
on
we
bsi
te
d)
The
Th
eta
-Na
thi c
om
pla
ints
an
d c
om
plim
en
ts
me
ch
an
ism
is u
sed
to
se
ek r
ed
ress
if s
tan
da
rds
are
no
t m
et
d)
The
Th
eta
-Na
thi c
om
pla
ints
an
d c
om
plim
en
ts
me
ch
an
ism
is u
sed
to
se
ek r
ed
ress
if s
tan
da
rds
are
no
t m
et

Annual Report for 2013/14 Financial Year
Vote 5: Department of Education
Province of the Western Cape
27
2.3 Organisational environment
The WCED comprises the provincial ministry of education, the provincial head office, district
offices and education institutions, including ordinary and special public schools and ECD
sites. The FET colleges and adult community learning centres are reflected in this Annual
Report but, as noted in the legislation below, management of these is in a transitional stage
pending finalisation of all details of the transfer to the Department of Higher Education and
Training.
There are four branches, each headed by a Deputy Director General. The branches are
Education Planning; Curriculum and Assessment Management; Institution Development and
Co-ordination and Finance. The Chief Directorate for People Management also reports
directly to the Head of Department, as do the Directorates for Internal Control,
Communication and Business Strategy and Stakeholder Management.
Changes in the year under review
In the past year, the Chief Directorate for Human Resources was re-configured as well as
being re-named “People Management Practices”. There are four People Management
directorates. The directorate “Service Benefits” attends to the needs of all eight district
offices. The other three directorates are “Strategic People Management”, “Recruitment and
Selection” and “Employee Relations”. Service benefits for SMS members and Head Office
staff are now managed by the office of the Chief Director.
In 2013/14, the Director: Management Accounting was promoted to the post of Chief
Director for Financial Management, responsible for the oversight of two directorates,
Financial Accounting and Management Accounting. New directors were appointed in both
of these directorates in the year under review. They filled the vacancies left by the above
promotion and because the Internal Control Unit was constituted as a full directorate.
A new Chief Director for Districts was appointed. The Directorate for Institutional
Management and Governance Planning (IMGP) was incorporated into this Chief Directorate,
in addition to the eight District Offices. A new District Director was appointed in the District
Cape Winelands.
The restructuring that led to the incorporation of the Directorate IMGP with the districts also
brought about the inception of a Chief Directorate for Inclusive Education and Special
Programmes. The Curriculum Chief Director was transferred into that new post. Because of
the vacancy left by that transfer, the only SMS vacancy as of the end of March 2014 is in the
post of Chief Director for Curriculum Development and Teacher Training.
The steps enumerated above have served to refine the ability of the WCED to deliver services
efficiently as follows: People Management is set to be more effective through a re-distribution
of work load and giving more focus to the sections concerned. The incorporation of the IMGP
directorate into the Chief Directorate for Districts will assist to align and focus services. The
inception of the Internal Control Directorate brings a new layer of accountability and
efficiency into the department.

Annual Report for 2013/14 Financial Year
Vote 5: Department of Education
Province of the Western Cape
28
The Department aims to develop a responsive and efficient organisational culture and
improve its business processes and systems. The Head Office and eight district offices of the
WCED are structured and designed to provide rapid response service and support to schools
and teachers.
In respect of the organisation, the Department aims to provide
officials who are caring, knowledgeable and organised to support schools, teachers and
learners
teachers who are present, prepared and using texts
funding which is deployed to maximize success and to provide targeted poverty-relief
sufficient and safe schools
an enabling environment for partners in education to contribute towards quality
education: teacher unions, School Governing Bodies, the private sector, Non-
Governmental Organisations, independent schools, Higher Education Institutions and
colleges.
WCED activities – scope and scale
Learners
Learners in Public Ordinary Schools Grades 1 – 12
inclusive 948 595
Learners in Grade R in Public Ordinary Schools 59 565
Learners in Grade R at Independent Sites 15 533
Learners in Special Needs’ Schools 19 876
Learners in Independent Schools 47 600
Students in FET Colleges (headcount) 71 594
Adult learners 33 595
Total 1 196 358
Educators
Educators 31 640
Public service staff (approved establishment) 9 118
Total 40 758
Institutions
Public ordinary schools 1 457
Schools for learners with special needs 71
Further education and training institutions 6
Adult community learning sites 308
District offices 8
Institutions current (All public ordinary schools) (31 March 2014)
Source 2013: Annual Survey for schools pre-Grade R to matric); PERSAL: 2014

Annual Report for 2013/14 Financial Year
Vote 5: Department of Education
Province of the Western Cape
29
The eight education district offices are made up of 49 circuits, which provide direct support to
schools. The circuit teams are multifunctional teams with curriculum advisers; special
education services professionals (psychologists, social workers, learning support advisers) and
institutional management and governance managers. Circuit team managers lead these
support teams.
District1 1 2 3 4 5 6 7 8 Total
Cape
Winelands
Schools 39 35 33 38 30 30 32 36 273
Learners 24 335 24 416 21 273 12 416 13 806 21 482 9 552 9 610 136 890
Eden and
Central Karoo
Schools 31 32 24 32 36 38 29 222
Learners 8 620 22 768 22 857 19 094 12 143 14 275 13 970 113 727
Metro Central Schools 33 44 36 35 30 33 211
Learners 20 793 21465 20 629 21 934 20 128 21 984 126 933
Metro East Schools 24 23 25 22 22 26 142
Learners 23 667 25 965 23 482 21 334 20 768 29 245 144 461
Metro North Schools 28 28 30 27 33 31 31 208
Learners 25 234 19 682 33 045 24 632 21 543 19 504 32 477 176 117
Metro South Schools 34 34 28 16 17 30 30 189
Learners 26 051 20 916 16 873 11 794 18 311 31 704 29 131 154 780
Overberg Schools 28 29 25 82
Learners 10 044 18 737 10 017 38 798
West Coast Schools 25 25 23 27 31 131
Learners 13 976 9 259 16 294 7 551 9 809 56 889
Grand Total Schools 242 250 224 197 199 188 122 36 1 458
Learners 152 720 163 208 164 470 118 755 116 508 138 194 85 130 9 610 948 595
1 Figures are taken from the Annual School Survey of 2013

Annual Report for 2013/14 Financial Year
Vote 5: Department of Education
Province of the Western Cape
30
2.4 Key policy developments and legislative changes
a. Schools
The Basic Education Laws Amendment Act, 2011 (Act 15 of 2011), was enacted on
19 September 2011. The purpose of the Act is, inter alia, to accommodate aspects of the
creation of the Department of Basic Education and related matters; amend the National
Education Policy Act (NEPA) and the South African Schools Act (SASA), the Employment of
Educators Act, 1998 (Act 76 of 1998), the South African Council for Educators Act, 2000
(Act 31 of 2000) and the General and Further Education and Training Quality Assurance Act,
2001 (Act 58 of 2001). The Act also provides for the various types of public school for learners
with special education needs, the additional functions of school principals and the training of
governing bodies by recognised governing body associations.
On 29 November 2013, the Minister of Basic Education prescribed the Regulations Relating to
Minimum Uniform Norms and Standards for Public School Infrastructure, in Government
Gazette No. 37081. These Regulations were promulgated in terms of Section 5A(1)(a) of the
South African Schools Act, 1996 (Act 84 of 1996). The Regulations seek to, inter alia, provide
minimum uniform norms and standards for public school infrastructure; ensure compliance
with minimum uniform norms and standards in the design and construction of new schools,
including alterations and improvements to existing schools, and for timeframes within which
school infrastructure backlogs must be eradicated.
The Department of Basic Education amended the National Norms and Standards for School
Funding from 1 April 2011. The amendments deal with the provision of operational funds to no
fee schools and with compensation for fee exemptions for fee-paying schools (Paragraph
170A). A later amendment allows for the Grade 3 and Grade 6 Annual National Assessments
in public schools, to be used to measure learner achievement in those independent schools
which are eligible for subsidy.
The National Curriculum Statement Grades R-12 has been refined and repackaged into the
Curriculum and Assessment Policy Statements (CAPS). The CAPS specify, for each subject, the
teaching time, content, skills, Learning and Teaching Support Materials (LTSM) needed and
the assessment weightings and prescriptions in one document. The CAPS was implemented
in the Foundation Phase and Grade 10 in 2012, in the Intermediate Phase and Grade 11 in
2013 and in the Senior Phase and Grade 12 in 2014.
The national policy pertaining to the progression and promotion requirements of the National
Curriculum Statement (NCS) Grade R – 12, the National Protocol for Assessment, Grades R –
12 and the regulations pertaining to the NCS were implemented to complement the CAPs.
On 1 April 2010, further amendments to the Children’s Act, 2005 (Act 38 of 2005) came into
effect. In terms of Section 196(3) of the Children’s Act, schools of industry and reform schools,
which were the responsibility of the provincial Department of Education, became the
responsibility of the provincial Department of Social Development, after two years of the
commencement of the relevant chapter in the Act. Following the decision of the
Constitutional Court in the matter between The Teddy Bear Clinic for Abused Children and
Another v Minister of Justice and Constitutional Development and Another, CCT 12/13,

Annual Report for 2013/14 Financial Year
Vote 5: Department of Education
Province of the Western Cape
31
amongst others, the Judicial Matters Amendment Act No. 42 of 2013, was published in
Government Gazette No. 37254, dated 22 January 2014. This Act amends, inter alia, the
Children’s Act, 2005, the Child Justice Act, 2008, the Criminal Law (Sexual Offences and
Related Matters) Amendment Act, 2007, including aspects of the Promotion of Access to
Information Act, 2000. These amendments are especially relevant in education as they deal
with, inter alia, sections of legislation deemed by the Constitutional Court to be unjustifiably
infringing on children’s constitutional rights, the National Register for Sex Offenders and
expungement of records, and the time period allowed to access information in terms of the
Public Access to Information Act (PAIA). It further amends the Criminal Law Amendment Act,
2007, so as to exclude persons under the age of 18 years from the operation of the Act.
New provincial legislative interventions
Section 63(1) of the Western Cape Provincial School Education Act, 1997 (Act 12 of 1997),
empowers the Provincial Minister to make regulations which are not inconsistent with any law,
and, where applicable, subject to any national norms and standards contemplated in
section 146(2) of the Constitution. Consequently, the following regulations have been
prepared in the relevant period:
1) The Regulations on the Declaration on the Declaration of Personal Interests of Members
of Governing Bodies in the Procurement of Goods and Services for Public Schools, 2013.
These Regulations were promulgated and published in the Provincial Gazette
Extraordinary No. 7197, dated 18 November 2013, and came into effect at the beginning
of the 2014 academic year. They were distributed to schools via Circular No. 0052/2013,
and seek to establish a protocol for governing body members and committee members,
to declare personal interests when dealing with matters relating to procurement of
goods and services for public schools, and thereby manage conflict of interests between
a member and a school.
2) The Draft Regulations relating to the Admission of Learners to Public Schools for Learners
with Special Education Needs, in terms of section 63(1), read with section 20A(2), were
published for public comment in the Provincial Gazette Extraordinary Number 7187 on 18
October 2013. Comments received are being considered for finalisation of the
Regulations. These draft Regulations seek to describe the process of assessment, support
and admission for learners to public schools for learners with special education needs.
3) The Regulations on the Duties of Attendance Officers, were published in the Provincial
Gazette Extraordinary No. 7205, dated 2 December 2013, and forwarded to schools via
Circular No. 0002/2014, on 17 January 2014. These Regulations provide for the duties of
Attendance Officers, list valid reasons for absence from school, and outline a written
notice to parents regarding learner attendance for learners of compulsory school going
age.
4) The Draft Regulations relating to the Representative Council of Learners will empower the
Provincial Minister to determine the functions and procedures for the establishment and
election of Representative Councils of Learners. They further provide for the roles and
functions of Teacher Liaison Officers and the duties attached to that officer as an
Electoral Officer for the election of Representative Councils of Learners.

Annual Report for 2013/14 Financial Year
Vote 5: Department of Education
Province of the Western Cape
32
These Regulations will also be published for public comment in the Provincial Gazette
Extraordinary. The Draft Regulations are in the process of being vetted by the Directorate:
Legislation in the Office of the Premier, whereafter they will be published in the Provincial
Gazette during May 2014 for comments.
5) The Draft Regulations relating to the Issuing of Performance Indicators Binding on Public
Schools, by the Head of Department, seek to set out indicators for public schools in order
to monitor and evaluate the academic performance of the public school to enable the
Department to assist, advise and provide the necessary support to help the relevant
public schools to perform better. These Regulations are currently the subject of legal
vetting and will be published for public comment.
6) The Regulations relating to the Disciplining, Suspension and Expulsion of Learners at Public
Schools in the Western Cape were promulgated, in terms of Section 63(1)(cE), in
Provincial Gazette Extraordinary No. 6932, and came into effect on 1 April 2012. Schools
are required to align their Code of Conduct with these Regulations, and to follow the
substantive and procedural standards prescribed in the Regulations on matters relating
to learner misconduct. These Regulations will be reviewed in the 2014/15 financial year
for further alignment with Codes of Conduct for public schools.
7) The Regulations relating to Visitation and Assessment of Public and Subsidised
Independent Schools, were promulgated in terms of Section 63(1)(cG), in Provincial
Gazette Extraordinary No. 6976, dated 29 June 2012. These regulations provide for the
evaluation of performance and monitoring of compliance in accordance with National
and Provincial Norms and Standards and were introduced to schools via circular
0026/2012.
8) The Regulations relating to the Minimum Teaching Hours per school week and school day
in public schools in the Western Cape, were promulgated in terms of section 63(1)(cC), in
Provincial Gazette Extraordinary No. 7065, dated 28 November 2012 and introduced to
schools via Circular 0044/2012. These regulations provide for the minimum teaching hours
per subject per phase, general principles which should be applied when calculating the
minimum school hours per week and per school day, individual support plans; and
staggered implementation dates.
The Department has also prepared the following Guidelines for public schools:
1) Guidelines on Playground Safety at Public Schools have been approved by the Minister
responsible for education in the Western Cape, and sent to schools via Circular No.
10/2014, for implementation in July, 2014. The guidelines provide for the roles and
responsibilities of staff members with regard to the safety of learners in the playground,
playground surfaces, poisonous and otherwise unsuitable plants, as well as guidance
with regard to the selection of playground equipment. It includes annexures dealing with
basic environmental surveys, precautionary measures when purchasing or installing
playground equipment and the inspection and maintenance of equipment.

Annual Report for 2013/14 Financial Year
Vote 5: Department of Education
Province of the Western Cape
33
2) The Guidelines on Social Networking are currently being finalised for approval by the
Head of Department and Provincial Minister. These Guidelines will regulate the use of
social networking sites by educators and learners as a resource tool to support curriculum
delivery and to enhance learning, provide for parameters for the interaction between a
learner and educator at the school, and to further advise on the dangers relating to the
use of social media by learners.
b. FET Colleges and Adult Education and Training
The Department of Higher Education and Training (DHET) was established in May 2009 with
the intention that it will ultimately be responsible for higher education institutions, including FET
colleges, SETAs and Adult Education and Training Centres. The DHET and provincial education
departments signed a protocol agreement on the transition, interim governance and
management of the FET colleges, and DHET has invited provinces to constitute provincial
technical task teams to manage and advise on the transfer of functions relating to FET
Colleges as a national competence.
The Higher Education and Training Laws Amendment Act, 2010 (Act 25 of 2010), was
published in Government Gazette No. 33853 on 7 December 2010. It amends the FET Colleges
Act, 2006, (Act 16 of 2006) and the Adult Basic Education and Training Act, 2000 (Act 52
of 2000), so as to make provision for the employment of educators at public centres, salaries
and other conditions of service, the educator establishment, powers of employers,
appointments and the filling of posts, the transfer of educators, secondment, retirement,
discharge, incapacity and misconduct and the performance of other work by educators.
It also provides for, inter alia, transitional arrangements with regard to public centres; the
determination of national education policy for public centres, for directive principles of
national education policy, consultation on policy and legislation, the publication of national
education policy and the monitoring and evaluation of adult education and training,
including quality assurance in respect of the qualifications offered by public and private
centres.
The Further Education and Training Colleges Amendment Act, 2012 (Act 3 of 2012), came into
effect on 3 May 2012, and amends the FET Colleges Act of 2006 (Act 16 of 2006).The Minister
of Higher Education and Training determined, in Government Notice No. 367, published in
Government Gazette No. 35336, dated 11 May 2012, that some of the provisions of the
Further Education and Training Amendment Act, 2012 (Act 3 of 2012), will come into effect
from the date of signature by the President (11 May 2012 as the date of Notice by the
Minister) except for Sections 11, 12, 13, 14, 28(3) and 32(b).
Section 14 deals with finances linked to the distribution of the Conditional Grant, and sections
11, 12, 13, 28(3) and 32(b) deal with the transfer of the staff from Provincial Education
Departments to DHET subject to the provisions of section 197 of the Labour Relations Act, 1995
(Act 55 of 1995). These processes must first be completed before the relevant sections can
come into effect on the date to be determined by the Minister and published by a further
Notice in the Government Gazette. However, on 26 March 2014, the Minister of Higher
Education and Training published a Notice (Notice No. 209), in Government Gazette
No. 37470, announcing that sections 13, 28(3) and 32(b) relating to staff, will come into effect

Annual Report for 2013/14 Financial Year
Vote 5: Department of Education
Province of the Western Cape
34
on 1 April 2014, while sections relating to management staff, in particular, sections 14, 11 and
12 came into effect on 1 April 2013.
The Norms and Standards for the funding of FET Colleges were implemented from 1 April 2010.
The norms and standards are based on the cost of providing the National Certificate:
Vocational Programmes. The funding formula has three components, namely personnel;
capital and non-personnel/non-capital. The funding of FET colleges takes the form of a
conditional grant, transferred on a monthly basis.
The Regulations relating to the Minimum Requirements for the Constitution of a Governing
Body of a Public ABET Centre, were promulgated in terms of section 8(7) of the Adult
Education and Training Act, 2000 (Act 52 of 2000), in Provincial Gazette Extraordinary No.
6952, dated 23 February 2012. They provide for, among others, the composition, meetings,
election and dissolution of a governing body of a public ABET centre.
c. Challenges presented by policy matters
Schools:
The Regulations relating to Minimum Uniform Norms and Standards (November 2013) have an
impact on planning for future buildings. The potential impact of these will need some time to
gauge in respect of the existing buildings and school sizes.
FET Colleges and AET:
The protracted length of time for the complete transfer of the colleges has placed some
burden on the staff concerned. At the same time, in the interests of a provincial skills
development thrust, the continued relationship has been welcomed.
In the case of AET the deliberations about the qualification itself has led to unpredictable
enrolment patterns and some degree of uncertainty in this sector. The WCED welcomes the
indications of progress in this regard.
3. STRATEGIC OUTCOME ORIENTED GOALS2
Strategic Outcome
Oriented
Goal 1
Improved Language and Mathematics in Primary Schools
Goal statement
Language and Mathematics performance to improve so that learners
perform according to age norms by 2014 as follows3:
Grade 3: Language: 40% of learners and Mathematics: 60% of
learners.
Grade 6: Language: 40% of learners and Mathematics: 50% of
learners.
Grade 9: Language: 55% of learners and Mathematics: 20% of
learners.
Scores to be tracked by means of annual testing and interventions to
be adjusted accordingly.
2 The targets were updated in the Annual Performance Plan for 2013/14. The original targets have been retained for
this report. 3 The pass mark is 50%. The targets should be read as “For Grade 3 40% of learners to pass at 50% for Languages and
60% to pass at 50% for Mathematics” etc.

Annual Report for 2013/14 Financial Year
Vote 5: Department of Education
Province of the Western Cape
35
Strategic Outcome
Oriented
Goal 2
Improved number and quality of passes in the National Senior
Certificate
Goal statement
To improve the number of learners passing the NSC examination
through provision of text books, teacher training programmes,
management and support. The targets for 2014 are 43 000 learners
passing the NSC and 17 500 gaining a Bachelor’s degree pass; 11 000
learners to pass Mathematics and 8 000 to pass Physical Science.
Strategic Outcome
Oriented
Goal 3
Reduction in number of under-performing schools
Goal statement
Reduction of under-performance in the National Senior Certificate in
high schools: that no schools have a pass rate of <60% by 2014.
Reduction in under-performance in other grades as measured
through the Annual National Assessment for grades 1 – 6 and 9 and
the WCED tests for grades 3, 6 and 9.
Progress towards targets in Strategic Plan
The WCED has made progress towards the targets expressed in the Strategic Plan.
Adjustments to the targets were outlined as required in the relevant Annual Performance
Plans.
Goal 1: Improved Language and Mathematics in Primary Schools
The table below shows what seems to be a decline in the results. The standard of the
language tests was adjusted after two years to make the tests more challenging. In 2009,
there was not yet a baseline score for Grade 9 so the initial targets were adjusted once the
baseline scores were available.
Yr 2010 Yr 2011 Yr 2012 Yr 2013 Target
Grade
3
Maths Target 40 45 50 55 Unadjusted
Maths Actual 48.3 47.2 51.5 55
Lang Target 55 60 33 40 Adjusted after test
changed
Lang Actual 54.9 30.4 38.9 37
Grade
6
Maths Target 15 20 25 30 Unadjusted
Maths Actual 24.4 23.4 26.4 28
Lang Target 45 50 35 37 Adjusted after test
changed
Lang Actual 52.3 31.5 36.9 30
Grade
9
Maths Target 40 42 12 15 Adjusted after pilot
Maths Actual 9.4 10.4 13.9 14
Lang Target 45 50 45 50 Adjusted after pilot
Lang Actual 51.8 44.2 48.2 48
Goals 2 and 3: “Improved number and quality of passes in the National Senior Certificate”
and “Reduction in number of under-performing schools”

Annual Report for 2013/14 Financial Year
Vote 5: Department of Education
Province of the Western Cape
36
The targets for Goals 2 and 3 originally set for Grade 12 overall performance for the five-year
period (2009 – 2014) are shown below, together with the actual numbers.


Annual Report for 2013/14 Financial Year
Vote 5: Department of Education
Province of the Western Cape
38
4.1 Programme 1: Administration
Purpose
To provide overall management of and support to the education system in accordance with
the National Education Policy Act, South African Schools’ Act, Public Finance Management
Act and other relevant policies.
The Administration programme consists of the following sub-programmes4:
Sub-programme 1.1: Office of the MEC
to provide for the functioning of the office of the Member of the Executive Council (MEC) for
education
Sub-programme 1.2: Corporate Services
to provide management services that are not education specific for the education system
to make limited provision for, and maintenance of, accommodation
Sub-programme 1.3: Education Management
to provide education management services for the education system
Sub-programme 1.4: Human Resource Development
to provide human resource development for office-based staff
Sub-programme 1.5: Education Management Information System (EMIS)
to provide education management information in accordance with the National Education
Information Policy
Strategic Objectives
Strategic
Objective 1.1
To direct human and financial resources to those districts and schools that
have historically experienced under-investment and ensure overall
financial and HR management.
Strategic
Objective 1.2
To improve the responsiveness and efficiency of the WCED through a focus
on improving the Department’s business processes and systems.
Strategic
Objective 1.3
To provide targeted management training for officials, members of school
management teams and School Governing Bodies.
Strategic objectives, performance indicators, planned targets and actual achievements
Financial
The WCED spent 98.9% of the approved adjusted budget for 2013/14.
Funds were directed to meet the goals of Action Plan 2014 and the three goals of the WCED.
73.8% of the budget was assigned to the compensation of employees (CoE), and over
R1.6 billion to the 8 Conditional Grants and other essential commitments. The WCED has
dedicated itself to judicious spending in order to redirect funds to meet the needs of those
most requiring support.
4 The sub-programmes are part of the national sector template and are Treasury funding categories.
The funds in Programme 1 cover costs related to the administration of the system.

Annual Report for 2013/14 Financial Year
Vote 5: Department of Education
Province of the Western Cape
39
Savings were recorded in the CoE, mainly due to efficiency measures implemented, such as
the reduction in the number of temporary and relief staff. These CoE savings were mainly re-
allocated to the improvement of school infrastructure (over R45m). Ongoing prudent
financial management allowed the WCED to set aside R30m to assist schools with municipal
services’ debt.
Cost-saving measures included the bulk ordering of CAPS textbooks for Grades 7– 9 and 12. In
addition, the efficiency measures enabled the bulk procurement of readers for Grades 1-3 in
2013/14, which was scheduled for procurement in the 2014/15 financial year.
The WCED was recognised by the Auditor-General of South Africa as the “most improved
department of the Western Cape”.
Human Resources
Management of the staff establishment of the WCED is critical to the educational success of
schools. The WCED allocated 85 more posts for the 2014 academic year. The WCED
continuously strives to improve the learner/educator ratio in the Foundation Phase. Because
the WCED has adopted a policy to ensure that more teachers are permanent, the system has
greater stability in general. The WCED maintained an average learner/teacher ratio of 1:36 in
primary schools and 1:34 in high schools.
There are fewer teachers in excess as a consequence of a designed deployment plan.
Optimal placement of teachers in excess is vital to ensure that their skills are best used and
that learners benefit in the best way possible. If funds go to salaries of teachers in excess then
this impacts on the appointment of teachers that are needed elsewhere. During the period 1
April 2013 to 31 December 2013, the WCED reduced the number of excess educators by 113.
A further 16 excess educators were placed in the first quarter of 2014.
The WCED is managing the Policy on Incapacity Leave and Ill-health Retirement (PILIR) cases.
This involves ensuring that only those who are entitled to leave with pay are granted this, and
that there is no unnecessary delay in assessing their eligibility or over-payments for those not
entitled to leave.
During the period 1 April 2013 to 31 December 2013, 384 Funza Lushaka bursary holders out of
671 were successfully placed in permanent, relief or temporary posts.
Special attention was paid in 2013 to the advertisement and filling of posts of Deputy
Principals and Principals. These posts were advertised in each of the vacancy lists and in
special vacancy lists and prioritised to ensure swift processing of the applications.
This development reduced the periods in which educators were in acting positions, reduced
the use of temporary staff, and contributed to school stability. Appointment criteria and
selection processes for principals were also strengthened.
The data on new principal appointments in the table below is for the period 1 April 2013 –
31 March 2014 and includes appointments at all public schools.

Annual Report for 2013/14 Financial Year
Vote 5: Department of Education
Province of the Western Cape
40
New Principals per year
Districts
Principal
posts
2013 2009 2010 2011 2012 2013/4 Total
Cape Winelands 287 13 22 20 10 19 84
Eden & Central Karoo 227 14 13 12 9 27 75
Metro Central 234 12 30 14 6 24 86
Metro East 153 9 21 6 10 12 58
Metro North 220 15 16 10 16 14 71
Metro South 202 14 18 8 8 5 53
Overberg 85 3 9 5 4 9 30
West Coast 134 8 13 11 5 15 52
Total 1 542 88 142 86 68 125 509
Information and Communication
The Central Education Management System (CEMIS)
In 2013/14, the CEMIS was further developed to enhance its use. It was developed to support
an increased number of automated business processes and also used to greater effect in
tracking learner registration. The CEMIS thus played a bigger role in supporting, guiding and
strengthening strategic decision-making. As in the past, CEMIS directly supported
examination and assessment administration and registration processes and provided data for
staff establishment calculations and for conducting online surveys in ordinary and special
schools. Regular tracking of learner enrolment at schools assisted all planning processes.
In 2013, CEMIS was again used for the ordering of textbooks by schools (CAPS and
workbooks). This automated process resulted in efficiencies in regard to time, labour and
costs, as well as allowing online monitoring of progress and facilitated reporting. The
automated applications for re-imbursement of fee exemptions to schools was refined which
resulted in greater transparency, control and reporting. Online notification of Norms and
Standards, staff establishment allocations, and assessment results also improved
communications to schools and helped them with their planning. A quarterly school
monitoring tool was used by district officials to track progress on specific areas of concern
through EduInfoSearch. A facility to upload the 2013 schools’ improvement plans was also
made available on CEMIS.
The District Management Information System (DMIS) is operational across all 8 district offices.
District officials continue to use the system to plan, capture and view reports for school
interventions.
In 2013, the WCED piloted the use of an automated e-Recruitment system. The on-line
application system: E-Recruitment for Educators: “Recruiting the Best” was launched in 2012.
All vacancies in 2013 were published via the on-line system. To date 24 600 users have
registered on the system and 14 985 users completed profiles on the system.

Annual Report for 2013/14 Financial Year
Vote 5: Department of Education
Province of the Western Cape
41
Communication
The media published more than 4 300 reports in various formats (print, radio, television and
online) on education in the Western Cape, reflecting intense media interest in the work of the
WCED.
The WCED conducted campaigns during the year to encourage parents and learners to
participate actively in improving learner outcomes and to support the department’s efforts to
improve access to quality education.
These were i) the Enrolment 2014 campaign to persuade parents to enroll their children early
if they were starting primary or high school, or if they were changing schools. ii) A Back-to-
School 2014 campaign informed parents of the WCED’s priorities for 2014 and what parents
could do to support their children’s education. iii) A Literacy and Numeracy 2014 campaign
explained to parents what they could do at home to help develop their children’s skills in
reading, writing and mathematics. The WCED distributed over 110 000 Grade 1 Parents’
Guides as part of the Literacy and Numeracy campaign.
Media used in the campaigns included radio, billboards and posters, information sheets in
community newspapers; and advertising on taxis.
The WCED produced a wide range of publications in 2013/14, including “Tips for Success”
guides for Grades 10 to 12; Matric Revision supplements distributed to every NSC candidate;
Grade 10 support supplements, on frequently asked questions and key concepts; a Citizen’s
Report on progress to date; the WCED newspaper, Education Update; a Grade 1 Parents’
Guide; and a bi-weekly newsletter for staff, WCED@work.
The number of visits to the WCED web site continued to grow. The monthly average passed
the 100 000 mark for the first time during the year (109 312). The site attracted 1 311 752 visits in
2013/14, up from 1 179 074 in 2012/13. 14% of schools rated the web site as “excellent”,
according to the 2013 Customer Satisfaction Survey. 98% rated the site as satisfactory or
good.
The WCED introduced an online Matric Support web featuring links to lessons on YouTube
from the WCED’s Telematics programme. The department loaded 171 videos by the start of
the matric exam period in October 2013. The 171 videos attracted 25 637 views from August
to the end of the exam period. The WCED has since loaded a total of 324 videos covering
Geography, Mathematics, Physical Sciences and Life Sciences.
WCED Client Services operates a Walk-in Centre, a Visitors’ Centre and a Call Centre. The
Walk-in Centre received an average of 1 827 visitors a month, while the Visitors’ Centre
received about 1 375 visitors a month. The Call Centre handled an average of 8 346 calls a
month. The WCED completed a refurbishment of the Walk-in Centre in 2013, and completed
a new Contact Centre specifically for Examinations and Assessments, mainly to assist
candidates with NSC queries.

Annual Report for 2013/14 Financial Year
Vote 5: Department of Education
Province of the Western Cape
42
The Customer Satisfaction Survey was conducted for the fifth year in 2013. The sample
surveyed was the final set of schools in the province surveyed over the period. In other words,
every school has been given an opportunity to assess the service delivery of the WCED at
some point between 2009 and 2013. In each year, including 2013, five educators per school,
at different post levels completed the questionnaires, including principals.
Respondents per job title 2013
Job Title Total %
Principal 259 24%
Deputy Principal 124 12%
HOD 197 19%
Senior Educator 110 10%
Educator 317 30%
Other 54 5%
TOTAL 1 061 100%
Respondents per Years of Experience
Experience Category Staff %
Less than 5 years 86 8%
5 - 10 years 108 10%
11 - 19 years 195 18%
20 - 30 years 407 38%
More than 30 years 265 25%
Grand Total 1 061 100%
Overall, the ratings show an improvement in the perceived service delivery levels since the
first survey was conducted.
Accountability
All officials are held accountable through job descriptions and performance agreements.
Head Office officials are held responsible for timeous and expert support to districts. Schools
and districts are held accountable for support to schools and the performance of learners.
Teacher and learner attendance and optimal use of the school day were key focus areas in
2013.
In February 2013 and again in 2014, all schools completed online School Improvement Plans
(SIPs), with targets for 3 years, for academic performance; management efficiencies
(teacher and learner absenteeism and academic planning); resourcing and maintenance.
The indicators correspond with the national targets under Action Plan 2014 (see Annexure).
The value of the online improvement plan is that all schools focus on driving key improvement
interventions. The SIP also forms part of the accountability system, since signatories to the plan
include the principal, the SGB and the WCED. The plan includes Action Plans to specify steps
each school will take to meet the targets set in their SIPs.

Annual Report for 2013/14 Financial Year
Vote 5: Department of Education
Province of the Western Cape
43
In 2012, the WCED introduced quarterly School Improvement Monitoring, linked to the School
Improvement Plans. The SIM for 2013/14 tracked use of textbooks and workbooks and key
aspects of resourcing and school functionality. Because the reports were captured online,
the data could be drawn and used for rapid support. In particular, the data enabled the
WCED to keep abreast of deliveries of workbooks and textbooks.
Accountability is extended through the oversight roles played by Provincial and National
Treasury in terms of the mandatory elements of the planning and reporting cycles and which
cover both financial and non-financial matters. Reporting intervals are monthly (e.g.
financial), quarterly or annual. All sections within the WCED have counterpart sections at the
Department of Basic Education or Department of Higher Education and Training through
which streams of reporting, performance analyses and projections are maintained. The
Department of the Premier exercises an oversight function on key WCED projects, which were
tracked through the Provincial Dashboard. Both Internal and External Audit processes
additionally govern controls and assist in assuring functionality and prudent management.
Substantive accountability resides in the formal relationship between the WCED and
UMALUSI, the national quality assurance body for learning outcomes. This relationship is
predicated on internal moderation of assessment processes and the provision of an
acceptable examination process.
In common with all government departments countrywide, the WCED participated in a
monitoring innovation of the Presidency, the Management Performance Assessment Tool
(MPAT) that studied 4 areas of governance, namely Strategic Planning, Human Resources,
Governance and Accountability and Financial Management. The exercise was a valuable
one and the WCED demonstrated improvement between the first and the second exercises
in this regard with a number of scores of 5/5. The results on the 2013/14 cycle were due in April
2014.
Whole School Evaluation continues to give valuable insights not only into the support needs
at individual schools but also into systemic issues. The evaluations, over 3 or 5 days depending
on the size of the school, are based on the 9 areas for evaluation specified in the WSE policy:
Basic functionality; Leadership, management and communication; Governance and
relationships; Quality of teaching and learning and educator development; Curriculum
provision and resources; Learner achievement; School safety, security and discipline; School
infrastructure and Parents and community. Differentiation in the length of visits has allowed for
additional schools to be visited. Schools are coded according to the WSE ratings. The findings
are shared in trend reports in addition to the extensive reports provided to the schools
concerned.
An Education Council, to advise the Minister responsible for Education in the Western Cape
on education matters, appointed in terms of The Regulations relating to the Education
Council for the Province of the Western Cape, met four times and provided advice to the
provincial minister and the WCED in regard to matters relating to education, including laws
and regulations.

Annual Report for 2013/14 Financial Year
Vote 5: Department of Education
Province of the Western Cape
44
Strategic Objectives
Programme 1
Programme
Performance Measure Ac
tua
l
Ac
hie
ve
me
nt
2012
/2013
Pla
nn
ed
Targ
et
2013
/2014
Ac
tua
l
Ac
hie
ve
me
nt
2013
/2014
De
via
tion
from
pla
nn
ed
targ
et to
Ac
tua
l
Ac
hie
ve
me
nt fo
r
2013
/2014
Comment on deviations
►PPM101: Number of
public schools that use
SASAMS to provide data
to the national learner
tracking system
1 458 1 459 1 459
►PPM102: Number of
public schools that can
be contacted
electronically (e-mail)
1 458 1 459 1 459
►PPM103: Percentage of
education current
expenditure going
towards non-personnel
items
21.76% 25.51% 21.52% - 3.99% The target was not achieved
as a consequence of
compensation absorbing a
greater part of the budget,
resulting mainly from a greater
than expected Improvement
in conditions of service
adjustment. Another
contributing factor was the re-
classification of functions within
the budget.
Performance indicators
Programme 1
Programme Performance
Indicator Ac
tua
l
Ac
hie
ve
me
nt
2012
/2013
Pla
nn
ed
Targ
et
2013
/2014
Ac
tua
l
Ac
hie
ve
me
nt
2013
/2014
De
via
tion
from
pla
nn
ed
targ
et to
Ac
tua
l
Ac
hie
ve
me
nt fo
r
2013
/2014
Comment on deviations
PPI 1.1 Ensure financial
management
Un
qu
alifie
d
Au
dit
Un
qu
alifie
d
Au
dit
PPI 1.2 Deviations in
respect of tenders above
R500 000
12 6 16 -10 The deviations were allowed
by policy and necessary in
view of the need to support
specialised curriculum
resourcing and physical
resourcing needs.

Annual Report for 2013/14 Financial Year
Vote 5: Department of Education
Province of the Western Cape
45
Strategy to overcome areas of under performance
The following are the key strategies of the WCED to address areas of under-performance:
Post-provisioning that ensures that teachers are placed at schools to match the
requirements at those schools.
Appointment of principals (attention to improving selection criteria and training of SGBs
in this regard; training opportunities for aspirant principals)
Attention to the appointment and support of Heads of Department and Deputy
Principals in schools
Training of both teachers and officials as required
School Improvement Plans and School Improvement Monitoring
Use of online processes to streamline and fast-track provisioning of all kinds
Funding equalisation for the support of schools in Quintiles 1 – 3
Fee exemption process for schools in Quintiles 4 and 5
Assistance to schools in respect of municipal debt
Internal control unit to provide feedback to management in respect of non-compliance
Review business processes as required
Ensure ongoing improvement in the application of procurement procedures
Update of all asset registers quarterly
Changes to planned targets
None
Linking performance with budgets
The expenditure incurred in Programme 1 contributed to achievement of the following key
outputs for the WCED:
WCED Strategic Plan, quarterly reports on organisational and school performance and
the Annual Report of the WCED
Compilation of financial planning and reporting documents, including the Estimates of
Provincial Revenue and Expenditure (EPRE), monthly in-year monitoring (IYM) reports, and
the interim and annual financial statements.
Procurement of assets, goods and services, and contract management
Maintenance of the WCED asset register
Payments to suppliers within 30 days
Management of the staff establishment of the WCED, recruitment of educators and
public servants, staff development and performance management, employee wellness,
and labour relations.
Maintenance and further development of the Central Education Management
Information System

Annual Report for 2013/14 Financial Year
Vote 5: Department of Education
Province of the Western Cape
46
Sub-programme expenditure
Sub-Programme
Name
2013/2014 2012/2013
Final
Appro-
priation
Actual
Expend-
iture
(Over)/
Under
Expend-
iture
Final
Appro-
priation
Actual
Expend-
iture
(Over)/
Under
Expend-
iture
R’000 R’000 R’000 R’000 R’000 R’000
1.1 Office of the MEC 6,117 6,117 - 6,340 6,340 -
1.2 Corporate Services 238,351 238,351 - 235,798 235,798 -
1.3 Education
Management 285,673 277,078 8,595 273,618 263,695 9,923
1.4 Human Resource
Development 20,699 20,699 - 9,016 9,016 -
1.5 Education Manage-
ment Information System
(EMIS)
28,904 28,904 - 22,139 22,139 -
Total 579,744 571,149 8,595 546,911 536,988 9,923


Annual Report for 2013/14 Financial Year
Vote 5: Department of Education
Province of the Western Cape
48
4.2 Programme 2: Public School Education
Purpose
To provide public ordinary education from Grades 1 to 12, in accordance with the South
African Schools Act, 1996 and the Western Cape Provincial School Education Act, 1997, as
amended
The Ordinary School Education programme comprises the following sub-programmes5:
Sub-programme 2.1: Public Primary Schools
to provide specific public primary ordinary schools with resources required for Grades 1 to 7
Sub-programme 2.2: Public Secondary Schools
to provide specific public secondary ordinary schools with the resources required for Grades
8 to 12
Sub-programme 2.3: Professional Services
to provide educators and learners in public ordinary schools with departmentally managed
support services
Sub-programme 2.4: Human Resource Development
to provide for the professional and other development of educators and non-educators in
public ordinary schools
Sub-programme 2.5: Conditional Grants
- to provide identified poor and hungry learners in public ordinary schools with the minimum
food they will need to learn effectively in school through the National School Nutrition
Programme (NSNP)
- to recapitalize the technical schools
- to provide support to Dinaledi schools
Strategic Objectives
Programme 2: Strategic objective
Strategic
Objective 2.1.
To ensure that teachers are equipped to teach by means of ongoing
professional development
Strategic
Objective 2.2.
To ensure that language and mathematics outcomes improve by
directing maximum resources (both human and financial) to the first three
years of schooling.
Strategic
Objective 2.3.
To ensure excellent management of schools
Strategic
Objective 2.4.
To ensure that every classroom is text-rich.
Strategic
Objective 2.5.
To provide targeted food and other poverty-alleviation and safety
measures
Strategic
Objective 2.6.
To ensure that schools are provided to match demographic trends.
5 The sub-programmes are part of the national sector template and are Treasury funding categories.
The funds in Programme 2 are assigned to cover the main budget of the WCED and include teacher
salaries, infrastructure and resourcing costs and the school nutrition programme.

Annual Report for 2013/14 Financial Year
Vote 5: Department of Education
Province of the Western Cape
49
Strategic objectives, performance indicators, planned targets and actual achievements
Enrolment
The biggest single factor to influence all planning and provisioning in education is the
enrolment of learners. The WCED has increasingly used General Household Survey data and
other trend analyses to assist with projections. Effective teaching and learning depends on
having an appropriate teacher:learner ratio, facilities and text books in place in areas of the
greatest need. The increase in enrolment of recent years has led to significant
accommodation and staffing pressures in certain areas. At the same time dwindling numbers
are experienced in other parts of the province.
Year Gr 1 Gr 2 Gr 3 Gr 4 Gr 5 Gr 6 Gr 7 Gr 8 Gr 9 Gr 10 Gr 11 Gr 12 Total
2002 86 969 77 026 64 134 83 022 93 188 86 786 80 865 75 601 80 450 69 752 51 618 40 468 889 879
2003 86 916 82 454 75 931 66 033 82 383 92 341 84 514 81 154 73 200 81 739 51 746 39 644 898 055
20046 104 105 82 130 81 489 76 781 66 060 82 574 89 614 85 053 78 964 80 756 54 199 39 451 921 176
2005 93 515 94 231 80 695 80 809 74 984 66 141 81 953 88 778 82 169 81 577 56 657 39 303 920 812
2006 87 650 85 972 89 828 80 443 77 811 73 106 65 347 78 926 80 595 83 529 57 536 40 198 900 941
2007 92 818 82 562 83 914 89 973 78 674 78 021 72 733 66 406 80 697 86 495 61 938 42 624 916 855
2008 91 853 83 267 79 454 85 891 87 116 78 290 76 146 71 410 72 914 79 133 63 819 43 470 912 763
2009 93 601 82 158 80 385 83 150 82 382 85 621 76 262 75 227 79 795 68 405 60 812 45 692 913 490
2010 98 086 83 046 79 155 84 234 80 290 81 402 82 777 75 426 85 114 70 630 53 799 44 876 918 835
2011 100 423 85 216 79 489 83 490 80 205 79 022 78 207 81 312 84 957 73 470 56 995 38 990 921 776
2012 103 444 88 536 81 415 83 922 79 900 78 384 76 432 77 561 90 815 72 714 58 758 43 111 934 992
2013 104 678 93 506 85 762 85 599 79 210 78 437 76 238 75 528 87 132 78 812 56 109 46 035 947 046
Data Source: 2013: Annual Survey for Schools (Public Ordinary schools excluding LSEN unit
learners).
The table above shows an overall increase of 57 167 learners over the 12 year cycle. It
illustrates significant growth in the enrolment in Grade 1 and the impact of improved
retention between Grades 10 and 12.
6 Enrolment patterns are influenced by the change, at a national level, in the Grade 1 admission age policy in 2000,
which permitted schools to enrol only learners aged seven in the year of first admission. As a result, the Grade 1
intake was lower than in previous years. When the age-requirement was subsequently changed back again in 2004
there was increased enrolment again. This is shown in this table.

Annual Report for 2013/14 Financial Year
Vote 5: Department of Education
Province of the Western Cape
50
Figures from the SNAP survey of 2014 illustrate the growth in the system “per phase”. At the
time of the survey, not all of the Grade 8 enrolments had been captured on the system.
In-migration to the province remains a significant contributor to enrolment numbers and
causes pressure on accommodation in developing areas.
The totals in Grades 1 and 9 indicate that there are numbers of learners repeating these
grades. These are matters which are receiving attention with special interventions to reduce
the failure rates. The graph and table below summarise recent progress in this regard.

Annual Report for 2013/14 Financial Year
Vote 5: Department of Education
Province of the Western Cape
51
Yr 2011 Yr 2012 Yr 2013
Overall pass rate [Gr 1-11] 86.9% 88.1% 89.1%
Grade 1 pass rate 79.80% 83.30% 84.7%
Grade 1 pass number 79 190 85 143 87 607
Grade 9 pass rate 71.1% 73.9% 77.0%
Grade 9 pass numbers 54 310 61 542 60 866
Grade 10 pass rate 73.4% 71.9% 80.8%
Grade 10 pass numbers 49 883 48 026 58 915
Grade 11 pass rate 80.3% 83.4% 87.8%
Grade 11 pass numbers 42 685 46 058 46 599
Enrolment Gr 10 - Gr 12 169 455 174 583 180 385
The enrolment totals in Grades 11 and 12 show signs of improved retention. The historical
decline in numbers in Grades 11 and 12 is being addressed through enhanced attention to
subject-selection at the end of Grade 9, better advice about career options and choices,
and strengthening of the academic support given at high school level. Schools and districts
have set specific targets to increase the numbers passing at, and returning to, each school in
the next year. The graph below illustrates the impact of this strategy.
Test Results
Primary schooling: Grades 3, 6 and 9 Language and Mathematics in the Western Cape
From 2002 to 2009, the WCED administered language and mathematics tests to Grade 3 and
6 learners in alternate years in order to track progress and diagnose problems. In 2010, the
WCED tested, for the first time, all Grade 3 and 6 learners to establish the state of language
and mathematics learning in each school in the province. In the same year, 2010, Grade 9
learners were tested for the first time. The Grade 9 tests were a pilot exercise to establish a
baseline in language and mathematics. In 2011, the WCED increased the level of cognitive
challenge in the tests, in particular the language tests, in order to set new minimum
benchmarks for the province. Specifically, longer and more complex texts were included in
the language tests.

Annual Report for 2013/14 Financial Year
Vote 5: Department of Education
Province of the Western Cape
52
In 2013 over 70 000 learners sat for the tests in each of grades 3, 6 and 9. A pass is a score of
50%. The results are provided below.
The test scores show modest but steady improvements in the Mathematics scores since 2012.
The drop in the Grade 3 and 6 Language Pass Rate will be analysed and will inform
interventions in specific schools.
The results of the 2013 tests were supplied to schools in January 2014 and these have been
used to inform the School Improvement Plans and targets for 2014.
National Senior Certificate
2013 was the sixth year of the National Senior Certificate (NSC) examination. A great deal of
support was provided to Western Cape schools offering Grade 12. The Western Cape
achieved an 85.1% pass rate. In 2013, there were 3 566 more candidates who passed than in
2012 and 3 158 more who achieved passes which allow them to enter for a Bachelor’s
degree study programme. 12 216 learners passed Mathematics with a pass rate of 73.3%. For
Physical Sciences, the 2013 pass rate was 72.6%, up from the 2012 figure of 70.9%. The
numbers passing Physical Sciences were 8 333.
WCED Grade 3, 6 & 9 Systemic Results 2013 - Public Ordinary Schools
Grade 3 Grade 6 Grade 9
Mathematics Language Mathematics Language Mathematics Language
Wrote 81 883 81 888 73 908 73 900 79 699 74 534
Passed 45 036 30 299 20 916 21 800 10 682 35 627
Pass % 55 37 28 30 14 48
Mean Scores 51 43 39 39 29 51

Annual Report for 2013/14 Financial Year
Vote 5: Department of Education
Province of the Western Cape
53
WCED Comparative NSC results 2009 – 2013
Year Wrote Passed % Pass Access
to B.
Deg.
%
Access
to B.
Deg.
Maths
Nos
passed
Maths
Pass
Rate
Phys Sc
Nos
passed
Phys Sc
Pass
Rate
Schools
with
pass
rate
<60%
2009 44 931 34 017 75.7 14 324 31.9 12 467 64.9 7 064 52.9 85
2010 45 783 35 139 76.8 14 414 31.5 11 571 66 7 524 59.6 78
2011 39 988 33 146 82.9 15 215 38.1 9 820 68.7 7 137 65.3 30
2012 44 700 36 992 82.8 16 319 36.5 11 311 73.5 7 995 70.9 26
2013 47 636 40 558 85.1 19 477 40.9 12 216 73.3 8 333 72.6 23
Annual National Assessments
In 2013, schools received assessment guidelines, as well as one set of exemplar questions per
grade and subject in order to prepare learners for the ANA. The exemplars were also placed
on the WCED website.
The 2013 Annual National Assessments were written by 615 326 Grades 1 – 6 and 9 learners.
1 455 public ordinary schools, 77 independent and 19 special needs schools in the Western
Cape participated in this national assessment. Scripts were marked by the teachers at
schools and thereafter samples of three scripts per subject and per class for Grades 3, 6 and 9
from each school were re-marked by teachers at a central venue in each district as the
provincial moderation exercise.
The DBE appointed an external evaluation agency to moderate a sample of Grades 3, 6 and
9 scripts at 244 selected schools in the WCED. 25 learner scripts per grades 3, 6 and 9 were
sampled and submitted for external marking and moderation. The moderation exercise
showed a high degree of correlation between the moderation scores and those awarded by
the teachers. This is a reassurance that the standards applied in schools were appropriate.
The 2013 results are indicated in the table below:
WCED 2013
Language
National 2013
Home
Language
WCED 2013
Maths
National 2013
Maths
Grade 1 65 60 61 60
Grade 2 62 57 62 59
Grade 3 49 42 58 49
Grade 4 54 49 42 37
Grade 5 56 46 40 33
Grade 6 63 64 47 38
Grade 9 50 50 17 13

Annual Report for 2013/14 Financial Year
Vote 5: Department of Education
Province of the Western Cape
54
Professional Development
Continuing professional teacher development in the WCED remains a key focus. Training for
the Curriculum Assessment Policy Statements (CAPS) took place for the last time in 2013,
ushering in a new period of consolidation across the system after a period of 3 years of
training and the successive phased implementation across grades, culminating in the
implementation in Grades 7-9 and 12 in 2014.
Teachers
CAPS
The National Curriculum Statement was refined and repackaged into the CAPS. The CAPS
specify for each subject the teaching time, content, skills, Learning and Teaching Support
Materials (LTSM) and the assessment weightings and prescriptions. The CAPS have the benefit
of containing all requirements in one document. The key changes brought about by the
CAPS are that there should be less administrative burden for teachers, clearer specifications
of subject content and stronger teaching and assessment methods.
In July 2013, the WCED trained teachers of Grades 7-9 for the introduction of the CAPS in
2014. This took the form of a full day’s orientation for each of the eight subjects.
Approximately 9 000 teachers attended at least one of the four days. On the fifth day, 1 816
principals / deputy principals attended orientation for managing CAPS implementation. Over
2 700 teachers of Grade 12 similarly attended CAPS training in the school holidays.
All teacher training is supplemented by a programme of classroom-based support.
Language and Mathematics
In 2009, the WCED embarked on an 8-year training and support plan to support the
development of Languages and Mathematics. This programme, provided by expert service
providers, for teachers in Grades 1 – 6 is offered as follows:
Year 1 (2009): first 250 schools Group 1 (125 schools) Numeracy Training in June holiday
Group 2 (125 schools) Literacy Training in June holiday
School-based support (250 schools)
Readers and LTSM (250 schools)
Year 2 (2010): first 250 schools
in a second year of training
Group 1 (125 schools) Literacy Training in June holiday
Group 2 (125 schools) Numeracy Training in June holiday
School-based support (250 schools)
Readers and LTSM (250 schools)
Year 3 (2011): second 250
schools – in practice this was
258 schools
Group 3 (129 schools) Numeracy Training in June holiday
Group 4 (129 schools) Literacy Training in June holiday
School-based support (258 schools)
Readers and LTSM (258 schools)
Year 4 (2012): second 258
schools in a second year of
training
Group 3 (129 schools) Literacy Training in June holiday
Group 4 (129 schools) Numeracy Training in June holiday
School-based support (258 schools)
Readers and LTSM (258 schools)

Annual Report for 2013/14 Financial Year
Vote 5: Department of Education
Province of the Western Cape
55
Year 5 (2013): third 250
schools
Group 5 (125 schools) Language Training in June holiday
Group 6 (125 schools) Mathematics Training in June holiday
Year 6 (2014): third 250
schools
Group 5 (125 schools) Mathematics Training in June holiday
Group 6 (125 schools) Language Training in June holiday
This pattern is being repeated through to 2016, so that all primary schools are trained and
are supported with reading schemes and materials, within a period of 8 years.
The Language and Mathematics Programme in 2013 provided 250 primary schools with
intensive training and site-based support for teachers from Grades 1-6.
In-service training and development was also offered through the Cape Teaching and
Leadership Institute. 37 training courses were offered to teachers in the Foundation Phase,
Intermediate Phase, Senior Phase, FET band and to members of the School Management
Team. School Management and Leadership Development (SMLD) training included training
of Institutional Management and Governance Managers. 1 491 beneficiaries attended these
one- or two- week long courses in this financial year. There were altogether 2 482
beneficiaries of CTLI courses or seminars in the financial year.
Principals
The focus in 2013 was on the development and support of school managers who are
inexperienced, or in need of extra mentoring, or keen to undertake further professional
development. Courses for school managers, focused on topics that included Roles and
Responsibilities of Deputy Principals, Roles and Responsibilities of Heads of Department,
Aspiring Principals, Aspiring School Leaders, Induction of Newly Appointed Principals, School
Management Team training and Women In and Into Management and Leadership Positions.
Workplace Skills’ Programme
The equivalent of 1% of the WCED payroll is utilised to improve the skills and competency of
all WCED employees. The skill levels of teachers and public service staff are thus additionally
addressed through various Workplace Skills’ Programme (WSP) development interventions.
Accredited qualifications
Targeted formal courses, in the form of the Advanced Certificate in Education (ACE) focusing
on School Leadership, were presented at higher education institutions. These courses are
funded by the WCED in an exercise to improve the quality of leadership and management in
schools. There were 360 beneficiaries in 2013/14.
To increase the number of qualified maths and science teachers, the WCED provided 96 pre-
service bursaries to potential teachers during 2013/14 as follows: Foundation Phase: 68;
Intermediate/Phase: 2; FET: 15; Bachelor of Science: 11.

Annual Report for 2013/14 Financial Year
Vote 5: Department of Education
Province of the Western Cape
56
Support Provided
Financial
The Norms and Standards allocations to schools are weighted so that schools in poorer
communities are allocated more funds.
The “per learner” amounts paid to public schools in National Quintiles 1, 2 and 3 have been
equalised from 2013/14; in other words, NQ 2 and 3 schools now receive the same funding as
NQ 1 schools.
National target allocations
2012/13 2013/14 2014/15
Quintile 1 R960 R1 010 R1,059
Quintile 2 R880 R1 010 R1,059
Quintile 3 R880 R1 010 R1,059
Quintile 4* R481 R 550 R 831
Quintile 5* R213 R 239 R 317
* Average cost for all schools
The cost of the equalisation of these per learner amounts in National Quintiles 2 - 3 will be
R26 million in 2014/15.
One of the most significant developments for 2014 is the expansion of the no fee school
programme. 216 schools, with 172 541 learners, who are in Quintiles 4 and 5 have accepted
an invitation to become no fee schools. The offer was extended to those schools that
charged school fees under R400 per annum.
Fee status Total number of schools
No fee 887
School fee charging 570
Grand Total 1 457
Schools that charge school fees may apply for compensation for fee exemption in cases
where parents are unable to pay fees. In 2012, the WCED compensated schools to the
amount of R31 million for the exemption of school fees awarded to parents. In 2013,
R42 million was paid to support 90 506 learners in 700 schools.
Texts, including workbooks
In 2013, the National Department of Basic Education provided workbooks as follows:
Workbooks provided Grades
Home Language (HL), English First Additional Language
(FAL), Mathematics and Life Skills
Foundation Phase (Grades R – 3)
Mathematics, Home Language and English First
Additional Language
Intermediate Phase (Grades 4 – 6)
Mathematics Senior Phase (Grades 7 – 9)

Annual Report for 2013/14 Financial Year
Vote 5: Department of Education
Province of the Western Cape
57
The use of the workbooks was supported and monitored by WCED officials.
The WCED aims to provide a CAPS aligned textbook per learner per subject to support quality
teaching and learning. Dedicated funds were thus set aside for this, in addition to the norms
and standards funds allocated annually.
In 2013/14, the WCED invested over R257 million in textbooks, teacher guides and core
readers to support the implementation of CAPS in the senior phase (Grades 7-9) and Grade
12. The WCED supplied every learner in Grades 7-9 with a textbook for each of the nine
subjects offered and seven textbooks for every Grade 12 learner.
In addition, schools were provided with an opportunity during November 2013 to order
textbooks for Grades 1-3 (Home Language, First Additional Language, Maths and Life
Orientation) and Natural Sciences and Technology for Grades 4-6. Delivery to schools was
completed by 17 January 2014.
The WCED norms and standards guidelines suggest that 50% of the total resource allocation
should be assigned to purchase LTSM, of which 10% should be reserved for library material.
The guidelines further state that each learner must have a textbook for each subject and that
the stock of school library material should be augmented annually until the total number of
items reflect the minimum international standard of 10 items per learner.
A textbook management and retrieval framework was introduced in November 2013 to
ensure that learners return their textbooks at the end of the academic year so that the
textbooks can be re-used annually. In February 2014, the WCED provided the Department of
Basic Education with detailed statistics on the retrieval rates of textbooks.
Infrastructure
The infrastructure plan identified the following areas for development:
Use of under-utilised classrooms in existing schools
Building new classrooms at existing schools to alleviate over-crowding
Building new schools, including special schools, to alleviate accommodation pressures
Replacing existing schools or classrooms that were built of inappropriate materials
Maintenance and repair
Provision of Grade R classrooms
Optimisation of the use of hostels
In addition, the provision and utilisation of mobile classrooms has remained essential to
provide accommodation for urgent and unscheduled needs.
Despite the building programme outlined above, the ongoing growth in learner numbers
places pressure on the infrastructure provisioning. Around 50 000 learners travel to and from
school daily if the nearest school is more than 5 kilometers away and assistance is needed.
Steps were taken in 2013/14 to check and improve routes and to set up other efficiencies.

Annual Report for 2013/14 Financial Year
Vote 5: Department of Education
Province of the Western Cape
58
Mathematics and Physical Sciences
The Mathematics and Physical Sciences Strategy, initiated in 2011, was extended and
strengthened in 2013 and is currently under revision. The strategy has five thrusts: Schools
(includes re-selecting schools for the national Dinaledi programme, setting up “incentive”
schools and categorizing all schools in terms of their subject enrolments to enable focused
interventions and nuanced district support); Teacher Support and Development (includes
teacher training and support, in-class monitoring and teacher recruitment and deployment);
Resources and Support ( includes all resources such as equipment, LTSM, ICT and e-learning
material and support); Learners (includes learner support, such as telematics programmes,
Olympiads, practice examination papers, tips, extra lessons, exposure to mathematics and
science in industry and the world) and Monitoring, Evaluation and Advocacy.
High School Programme
The High School Programme aims to increase the number of learners passing the National
Senior Certificate and reduce the number of under-performing schools. The High School
programme consists of a differentiated approach to all high schools in the province. There
was low intensity support for those schools where over 90% of learners passed in the
preceding year; medium intensity support and a subject-specific focus for the schools which
obtained a 60% – 89% pass rate and a high intensity, and whole school, focus for those where
fewer than 60% of the learners passed.
In January 2013, the WCED and schools analysed the National Senior Certificate results for
each school, per subject and per question paper. School-specific and subject-specific plans,
with targets, were set, based on these analyses. Targets per school, and district, were set for
pass numbers and numbers gaining admission to B degree study. Particular support is
provided for learners at risk.
In 2013 districts used a common template for the District Improvement Plans, with a focus on
reduction of the failure rate for Grades 1, 9,11 and 12 (a continuation of the focus initiated in
2012). Schools that fared poorly in subjects with large enrolments were identified for subject-
specific support.
A tutoring programme is run, using skilled teachers, from inside and outside the WCED.
Telematics lessons were beamed to 147 schools in 2013 and intensive support was provided
by Curriculum Advisers to those schools that achieved below the provincial average for high
enrolment subjects. A study tips booklet and an examination question pack were supplied to
each Grade 12 learner. The programme covers all grades at high schools and focuses on a
set of additional criteria beyond the Grade 12 pass rate. Each district is assigned a budget for
its support programme.
Support and recognition for teachers
The WCED continued with its expressed intention to give active support to teachers in areas
identified by teachers themselves. This again took the form of reducing the pressure on
teachers both administratively and in terms of attendance at workshops and meetings.
Planning Calendars, that listed key dates, such as those for the start and finish of
examinations, and other administrative deadlines, were again sent to schools in 2013 to help
schools with advance planning for 2014. There were provincial awards for top teachers,
following on a selection process. These awards give recognition for achievement and
innovation. Three Western Cape teachers went on to be recognized for the National
Teaching Awards of 2013 – one as a national winner and two as second runners up.

Annual Report for 2013/14 Financial Year
Vote 5: Department of Education
Province of the Western Cape
59
School Governing Bodies
2012 saw the 100% participation in, and conclusion of, SGB elections by all WCED schools. An
induction programme was offered in 2013 for all SGB members who were trained in financial
management, selection and recruitment of competent staff at all levels. Attention has been
paid to the variety of roles and responsibilities of SGB members. These include supporting
principals to plan and set targets for school performance improvement and addressing
discipline matters and the safety of learners and personnel. Principals are required, through
section 16A (1)(c)(ii) of the SA Schools Act, to table improvement plans at SGB meetings. SGB
Chairpersons signed off on these plans in addition to the principals. A School Governing Body
Support Tool was sent to all schools, to assist SGBs to conduct self-evaluation.
The review of the institutional management and governance function in districts against the
provisions of the South African Schools Act (SASA) has revealed the need for focussed
coordination of this function. Districts were supported by Head Office on matters of SGB
training, changes in SGB membership, and in respect of the development of members of the
Representative Council of Learners and of Teacher Liaison Officers. 81 identified schools
received training in financial management. District based IMG managers engaged
chairpersons of SGBs to ascertain the extent to which SGBs support their schools in line with
sections 20 and 21 of the SASA. This engagement is ongoing and will include preparation for
the 2015 SGB elections in schools.
Nutrition
The National School Nutrition Programme provided 438 883 (431 998 in 2013) learners with
nutritious meals on a daily basis at 1 027 (1 021 in 2013) targeted Primary, Special and
Secondary schools. Workshops were conducted for volunteer food handlers, on food and gas
safety and hygiene, meal preparation and portion sizes. Teachers, parents and learners were
offered courses on food production. Breakfast is now served before school between 7.30 and
8 am in addition to the main meal which is served not later than 12h30.
Safe Schools
The Safe Schools Programme has a three-pronged strategy (i) Crime Control with the
provision of core security mechanisms, (ii) Programmes to support behavioural and attitudinal
change, (iii) Programmes that include whole school approaches and networking with
relevant agencies that assist with the creation of safe school environments.
The WCED operates a Safe Schools Call Centre. It provides free, confidential, telephonic
communication to learners, parents and educators needing help, guidance or information
regarding education related issues. Callers are encouraged to phone the toll-free line 0800 45
46 47 with regard to the following: Emergencies/crisis, Gang Violence, Trauma, School Crime,
Abuse and General Queries.
Callers receive telephonic debriefing in crisis calls and in the case of non-crisis calls they are
directed, where necessary, to the counselling agencies of the Western Cape Education
Department, non-governmental agencies and community–based organisations. The Safe
Schools Call Centre received 14 060 calls in the calendar year of 2013. 3 434 of the calls
needed further follow up and support.

Annual Report for 2013/14 Financial Year
Vote 5: Department of Education
Province of the Western Cape
60
The Call Centre also gathers and analyses data throughout the province. The statistics are
used to provide prevention, intervention and reactive strategies where needed.
In addition to the Safe Schools Call Centre and security mechanism support, the WCED
offered educational programmes to encourage positive pursuits such as sports, arts, drama
and information about future careers. The programmes focused on attitudinal or behavioural
changes; creative and constructive approaches to conflict management; and mediation
training. Safety fieldworkers were employed to support schools with school safety committees
and school safety plans; to establish support and/or preventative programmes and to act as
positive role models and mentors at schools.
Safety Fieldworkers follow up on truant learners and assess learner problems. They provide
mentoring and coaching to learners at risk and ensure that learners access services they
need. Safety Fieldworkers facilitated the Safe Schools Youth Clubs as part of the holiday
programme. This project aims to reinforce positive attitudes and behaviour through
channelling of learners at risk to attend appropriate educational structures and to develop
skills to implement community projects.
Forty eight additional schools received core security mechanisms (motorised gates;
pedestrian monitoring gates; alarm systems linked to armed response; barbed wire and mesh
wire; burglar bars) in 2013/14 and benefited from the training of peer mediators. Fences at
high-risk schools were repaired and holiday security was provided where it was needed.
Occupational Health and Safety and Disaster Management training was offered, as well as
training in drug testing policy and drug testing. Approved drug testing devices were supplied
in high-risk cases, combined with search and seizure exercises and the supply of hand held
metal detectors at 50 selected extra schools. District crime prevention, crime control and
specific project plans (substance abuse, youth development, conflict management, safety
management) and partnerships with other government departments and NGOs are in place.
In 2013, the WCED in partnership with the City of Cape Town and the Departments of Social
Development and Community Safety joined forces to support the community of Manenberg
following a plea by teachers and parents for additional security, following on a period of
increased gang violence in the area. The WCED contributed funds to the City to assist in
funding the deployment of metro police officers in Manenberg to provide visible policing and
offer a greater sense of security to parents and teachers. The deployment has continued and
has assisted in stabilizing the situation. In addition, the schools have had new re-inforced
perimeter fencing installed to provide protection.
As part of the approach of the Western Cape Government to prevent anti-social behaviour,
and to provide alternative opportunities to the youth, the Department of Cultural Affairs and
Sport (DCAS) has introduced MOD centres (Mass participation, Opportunity and access and
Development) at 181 schools across the eight education districts. 98 of these centres operate
at primary schools. The programmes are run after school and provide learners with
opportunities to practice sport and participate in other enrichment activities. Both the Safe
Schools and School Enrichment programmes of the WCED have linked up with the MOD
centres.

Annual Report for 2013/14 Financial Year
Vote 5: Department of Education
Province of the Western Cape
61
Strategic Objectives
Programme 2
Programme
Performance Measure
Ac
tua
l
Ac
hie
ve
me
nt
2012
/2013
Pla
nn
ed
Targ
et
2013
/2014
Ac
tua
l
Ac
hie
ve
me
nt
2013
/2014
De
via
tion
from
pla
nn
ed
targ
et to
Ac
tua
l
Ac
hie
ve
me
nt fo
r
2013
/2014
Comment on deviations
►PPM201: Number of
learners enrolled in
public ordinary schools
936 534 940 000 948 595 8 595 A larger number of learners
enrolled than anticipated.
This included those returning
to repeat a grade as well as
those registering in the
Western Cape for the first
time.
►PPM202: Number of
educators employed in
public ordinary schools
28 636 28 800 28 265 -535 800 office-based educators
have been re-classified
under Programme 9 which
would make the target 28
800. The total includes
educators in excess. The
total varies on an ongoing
basis as educators leave the
system, take leave or are
appointed into other posts.
►PPM203:Number of
non-educator staff
employed in public
ordinary schools
6 556 6 900 6 007 -893 Not all vacancies are filled.
Vacant support staff posts in
the supervisory category
have been advertised and
will be filled.
►PPM204:Number of
learners in public
ordinary schools
benefiting from the “No
Fee School” policy
370 617 371 122 554 523 183 401 As a result of a policy
decision, 216 schools, in
Quintiles 4 and 5, accepted
an invitation to become no
fee schools. The offer was
extended to those schools
that charged school fees
under R400 per annum.
►PPM205:Number of
learners benefiting from
National School Nutrition
Programme (NSNP)
431 998 427 526 438 883 11 357 Additional eligible learners
enrolled in eligible schools.
PPM206:Number of
learners benefiting from
scholar transport
50 521 50 000 50 209 209 Additional eligible learners
needed to be transported
to their nearest school.
►PPM207:Number of
learners with special
education needs that
are enrolled in public
ordinary schools
6 204 7 600 6 319 1 281 The target was set prior to
the completion of the
exercise to improve the
reliability of data in this
regard. This is an ongoing
process.

Annual Report for 2013/14 Financial Year
Vote 5: Department of Education
Province of the Western Cape
62
Programme 2
Performance Measure
Ac
tua
l
Ac
hie
ve
me
nt
2012
/2013
Pla
nn
ed
Targ
et
2013
/2014
Ac
tua
l
Ac
hie
ve
me
nt
2013
/2014
De
via
tion
from
pla
nn
ed
targ
et to
Ac
tua
l
Ac
hie
ve
me
nt fo
r
2013
/2014
Comment on deviations
►PPM208:Number of full
service schools7
10 8 8
►PPM209:Number of
schools visited at least
once a quarter by a
circuit manager
1 524 1 533 1 530 -3 The total number of schools
has fluctuated over the
period concerned. Two
hospital schools were not
visited 4 times in the period
concerned. 5 other schools
were visited in one of the
quarters by other officials
but not necessarily by an
IMG manager because of
vacancies in the district
and in cases where the
schools did not need
intensive support.
Performance indicators
Programme 2
Programme
Performance Indicator
Ac
tua
l
Ac
hie
ve
me
nt
2012
/2013
Pla
nn
ed
Targ
et
2013
/2014
Ac
tua
l
Ac
hie
ve
me
nt
2013
/2014
De
via
tion
from
pla
nn
ed
targ
et to
Ac
tua
l
Ac
hie
ve
me
nt fo
r
2013
/2014
Comment on deviations
PPI 2.1. Percentage of
learners retained in the
school system from
Grades 10 – 12
61% 62% 63% 1% The intervention
programme in schools has
shown benefits.
PPI 2.2. Number of
additional schools
secured with an alarm
linked to armed
response, burglar bars
and stone guards on
windows
50 50 48 -2 The work at two schools
was carried over into the
following year because of
changes to the business
plan of one school and
because the invoices at
another were not submitted
in time.
PP1 2.3. Number of
bursaries awarded to
deserving students for
four years of formal
study at Higher
Education Institutions
168 200 96 -104 A policy decision was taken
to suspend the bursary
programme for new
students in view of the
national Funza Lushaka
programme.
7 This refers to the number of schools to be established in the given year

Annual Report for 2013/14 Financial Year
Vote 5: Department of Education
Province of the Western Cape
63
Programme 2
Programme
Performance Indicator
Ac
tua
l
Ac
hie
ve
me
nt
2012
/2013
Pla
nn
ed
Targ
et
2013
/2014
Ac
tua
l
Ac
hie
ve
me
nt
2013
/2014
De
via
tion
from
pla
nn
ed
targ
et to
Ac
tua
l
Ac
hie
ve
me
nt fo
r
2013
/2014
Comment on deviations
PPI 2.4 Educator
absenteeism in public
ordinary schools
expressed as a %
3% 4% 3% 1% Target exceeded. The
focus on attendance
continues to bear fruit.
PPI 2.5 Learner
absenteeism in public
ordinary schools
expressed as a %
5.61% 7% 5.96% 1.1% Target exceeded. The
focus on attendance
continues to bear fruit.
PPI 2.6 Numbers of
teachers in Grades R-12
attending formal
curriculum training
programmes at the
Cape Teaching and
Leadership Institute
954 1 470 1262 -208 Not all of the training
vacancies were taken up
by teachers.
PPI 2.7 Numbers of
school management
team members trained
at the Cape Teaching
and Leadership Institute
724 750 1133 383 Additional interventions
were accommodated, due
to needs, during the year.
Strategy to overcome areas of under performance
Continue with High School Programme
Continue with the provincial strategy to improve language and mathematics
Monitor the use of textbooks in class
Conduct targeted training of educators
Continue with reviewed Maths and Science Strategy
Support financial management of schools
Appointment of school corporate officers
Focus on School and District Improvement Plans with a particular emphasis on pass rates
in Grades 1, 9 and 11.
Changes to planned targets
None
Linking performance with budgets
The expenditure incurred in Programme 2 contributed to achievement of the following key
outputs for the WCED:
Expanding the educator post basket to 31 031 for 2014
Providing textbooks, teacher guides and core readers to support the implementation of
CAPS in the senior phase (Grades 7-9) and Grade 12 and foundation phase (Grades 1-
Providing Norms and Standards allocations to public ordinary schools

Annual Report for 2013/14 Financial Year
Vote 5: Department of Education
Province of the Western Cape
64
Providing nutritional meals to learners in need
Expansion of the no-fee schools programme
Maintaining the compensation for fee-exemption programme
Maintaining the safe schools programme
Sub-programme expenditure
Sub- Programme
Name
2013/2014 2012/2013
Final
Appro-
priation
Actual
Expen-
diture
(Over)/
Under
Expen-
diture
Final
Appro-
priation
Actual
Expen-
diture
(Over)/
Under
Expen-
diture
R’000 R’000 R’000 R’000 R’000 R’000
2.1 Public Primary
Schools 6,597,359 6,597,359 - 6,188,654 6,188,654 -
2.2 Public Secondary
Schools 4,400,697 4,400,697 - 3,914,964 3,914,964 -
2.3 Human Resource
Development 86,695 86,695 - 88,468 87,634 834
2.4 Conditional
grants 296,614 278,028 18,586 275,209 259,268 15,941
Total 11,381,365 11,362,779 18,586 10,467,295 10,450,520 16,775


Annual Report for 2013/14 Financial Year
Vote 5: Department of Education
Province of the Western Cape
66
4.3 Programme 3: Independent School Subsidies
Purpose
To support independent schools in accordance with the South African Schools Act, 1996
The Independent School subsidies’ programme comprises the following sub-programmes
Sub-programme 3.1: Primary Phase
to support independent schools in Grades 1 to 7
Sub-programme 3.2: Secondary Phase
to support independent schools in Grades 8 to 12
Strategic Objective
Strategic
Objective 3.1
To render support to independent schools in accordance with the relevant
legislation to ensure quality education for learners in these schools
Strategic objectives, performance indicators, planned targets and actual achievements
Enrolment
All 203 registered independent schools in the Western Cape completed the Annual School
Survey in 2012 and in 2013. Participation in CEMIS is one of the requirements for registration of
independent schools in the province.
There were 11 387 primary and 7 115 high school learners registered in subsidised
independent schools in 2013/14, an increase of 720 learners overall.
Test Results
A growing number of independent schools participated in WCED diagnostic tests in 2013.
More are expected to participate in future. In terms of Regulation 8 (b) of the Regulations
Relating to the Registration of, and Subsidies to, Independent Schools (excluding Pre-Primary
Schools), an independent school will be required to participate in, and perform well in, the
Annual National Assessments and/or the WCED systemic testing in order to qualify for a
subsidy.
Participation in, and performance on, the WCED systemic tests are shown in the tables below.

Annual Report for 2013/14 Financial Year
Vote 5: Department of Education
Province of the Western Cape
67
WCED Systemic Grade 3, 6 & 9 Independent School Results 2013
Grade
Literacy/Language
Schools Learners Pass numbers (rate in brackets)
2011 2012 2013 2011 2012 2013 2011 2012 2013
Grade 3 54 68 75 1 721 2 001 2 072 1 241 (72%) 1 335 (66.7%) 1 365 (65.9%)
Grade 6 47 63 62 1 435 1 714 1 763 1 161 (81%) 1 347 (78.6%) 1 319 (74.8%)
Grade 9 32 47 46 1 331 2 028 1 876 1 161 (87%) 1 771 (87.3%) 1 649 (87.9%)
Grade
Numeracy/Mathematics
Schools Learners Pass numbers (rate in brackets)
2011 2012 2013 2011 2012 2013 2011 2012 2013
Grade 3 54 68 75 1 722 2 002 2 072 1 386 (80%) 1 482 (74%) 1 585 (76.5%)
Grade 6 47 63 62 1 433 1 714 1 764 1 017 (71%) 1 111 (64.8%) 1 175 (66.6%)
Grade 9 32 47 46 1 327 2 024 1 878 617 (46%) 914 (45.2%) 843 (44.9%)
The results of independent schools on the National Senior Certificate in 2013 were as follows:
Western Cape NSC results for independent schools: 2013
Wrote Number Passed Percentage
passed
Number % (B degree
entry) (B. Degree entry)
2405 2 232 92.81% 1 573 65.41%
Teacher development
Teachers in independent schools attended various curriculum workshops arranged by the
WCED district offices. Independent schools’ teachers were also trained on CAPS.
Support provided
Visits were undertaken to 134 Independent Schools to provide administrative, curriculum and
institutional management support in the course of 2013/14.
In addition, in an annual exercise for this purpose, a team of 26 WCED officials visited 130
schools in March 2014 and confirmed adequate compliance in respect of:
Survey compliance - Annual School Survey (ASS) and Snap Survey (SS)
Umalusi accreditation
Financial compliance – subsidy and availability of audit reports
Sufficiency and adequacy of instruction rooms
Curriculum offerings
Sufficiency and appropriateness of Learning and Teaching Support Materials (LTSM)
SACE registration
Staff turnover
Performance Management Systems
Staff development programme
The Grade 3, 6 and 9 2012 WCED systemic test results

Annual Report for 2013/14 Financial Year
Vote 5: Department of Education
Province of the Western Cape
68
The main form of support provided to independent schools is in the form of subsidies.
Subsidies to independent schools are payable at a level of 60%, 40%, 25%, 15% or 0% of the
estimated provincial per capita expenditure for learners (PAEPL) at public ordinary schools.
The PAEPL for 2013/14 was R10 758 (Primary schools) and R12 669 (Secondary schools)
respectively. The WCED paid subsidies to 101 schools, which included five new schools.
Payments were made on time and in accordance with the relevant legislation.
The WCED has urged all subsidised independent schools to consider using their subsidised
amounts on LTSM (60%); municipal obligations (20%) and operational needs (20%).
The WCED also investigated complaints received from the public and/or parents relating to
poor academic performance, poor management, school fees and schools operating while
unregistered. A meeting with principals and owners of all subsidised independent schools in
February 2014 addressed underperformance as well as allegations of unlawful practices.
Underperforming schools were required to provide improvement plans with targets.
A meeting with DBE and Umalusi, held in March 2014, discussed the linking of the registration
and accreditation processes of independent schools. This meeting was also attended by
structures that represent the majority of independent schools in South Africa.
Strategic Objectives
Programme 3
Programme
Performance Measure
Ac
tua
l
Ac
hie
ve
me
nt
2012
/2013
Pla
nn
ed
Targ
et
2013
/2014
Ac
tua
l
Ac
hie
ve
me
nt
2013
/2014
De
via
tion
from
pla
nn
ed
targ
et to
Ac
tua
l
Ac
hie
ve
me
nt fo
r
2013
/2014
Comment on deviations
►PPM301: Number of
subsidised learners in
Independent Schools
17 782 19 300 18 502 -798 The 2013 figure is higher than the
2012 one but the numbers did
not rise to the predicted figure.
Enrolment at independent
schools is a matter of parental
decision and not one over
which the WCED has
management control.
Strategy to overcome areas of under performance
Provide dedicated and increased support to the schools that obtained less than the NSC
provincial average for Independent Schools
Support all new Independent Schools.
Monitor all queries or complaints about the implementation of regulations as a matter of
urgency.

Annual Report for 2013/14 Financial Year
Vote 5: Department of Education
Province of the Western Cape
69
Changes to planned targets
None
Linking performance with budgets
The expenditure incurred in Programme 3 contributed to achievement of the following key
output for the WCED:
Expanding and improving the subsidies provided to independent schools
Sub-programme expenditure
Sub- Programme Name 2013/2014 2012/2013
Final
Appro-
priation
Actual
Expen-
diture
(Over)/
Under
Expen-
diture
Final
Appro-
priation
Actual
Expen-
diture
(Over)/
Under
Expen-
diture
R’000 R’000 R’000 R’000 R’000 R’000
3.1 Primary Phase 47,329 47,329 - 35,406 35,406 -
3.2 Secondary Phase 37,319 37,319 - 36,915 36,915 -
Total 84,648 84,648 - 72,321 72,321 834


Annual Report for 2013/14 Financial Year
Vote 5: Department of Education
Province of the Western Cape
71
4.4 Programme 4: Public Special School Education
Purpose:
To provide compulsory public education in special schools in accordance with the South
African Schools Act, 1996, and White Paper 6 on Special Needs’ Education: Building an
Inclusive Education and Training System
The Public Special School Education programme consists of the following sub-programmes:
Sub-programme 4.1: Schools
to provide specific public special schools with resources
Sub-programme 4.2: Professional Services
to provide educators and learners in public special schools with departmentally managed
support services
Sub-programme 4.3: Human Resource Development
to provide for the professional and other development of educators and public service staff
in public special schools
Sub-programme 4.4: Conditional Grants
to provide for infrastructure at public special schools
Strategic Objective
Strategic
Objective 4.1.
To maximise successful academic and social participation of all learners
in the culture and curriculum of educational institutions and minimise
barriers to learning (Education White Paper 6)
Strategic objectives, performance indicators, planned targets and actual achievements
Enrolment
The Department had 74 special schools during 2013, accommodating 19 876 learners with
special needs. In November three schools, namely the Academy of Maths and Science; the
Sports School and COSAT, that had been classified as special schools, were reclassified as
ordinary schools,
Special School Test Results
In 2013, there were 244 candidates from ten special schools who wrote the National Senior
Certificate with an overall pass rate of 89.34%. 45.41% of those who passed qualified for
admission to Bachelor Degree study.

Annual Report for 2013/14 Financial Year
Vote 5: Department of Education
Province of the Western Cape
72
Teacher Development
Policy and guideline documents regarding Special Needs and Inclusive Education were
provided in 2013 to all Special Schools and district-based Specialised Learner and Educator
Support staff.
Training for teachers in ordinary schools to identify and address various special needs/barriers
to learning/learning backlogs was provided by the Specialised Support Services staff. This
included training for teachers in language and mathematics preventative interventions such
as those for Grade R and Grade 1 learners. Specialised interventions were identified and
training courses developed or outsourced e.g. reading recovery, trauma counselling and
suicide prevention.
Support provided
The year 2013 was designated by DBE as the Year of Inclusion. The Western Cape continuum
of support provides low support in ordinary/mainstream schools, moderate support in full-
service/Inclusive schools and high support in Special Schools. Attention was paid to the
further expansion of inclusive education and the establishment of support structures that
ensure greater accessibility to education for learners experiencing barriers to learning,
through a variety of options within public special schools and public ordinary schools.
The focus in 2013/14 was on measures being put into place for the expansion and
strengthening of Inclusive Education in ensuing years. The emphasis was on the continued
implementation of the comprehensive ten point WCED plan for strengthening specialised
education support, approved in 2011.
In 2013/14 the WCED implemented this plan through
(1) district-based and circuit-based support teams, which include psychologists, social
workers, special school and learning support advisors
(2) strengthening of 24 special schools to become resource centres
(3) supporting ELSEN-units/Resource Classes at 108 public ordinary schools.
(4) the conversion of 40 public ordinary schools into Full-service/Inclusive schools
(5) the development of school-based support teams.
Support to Special Schools
Education White Paper 6: Building an Inclusive Education and Training System calls for the
qualitative improvement of Special Schools for the learners that they serve and their phased
conversion to Special School Resource Centres that provide support to neighbouring schools
and are integrated into district-based support teams.
A graphical representation below illustrates the Western Cape support continuum:

Annual Report for 2013/14 Financial Year
Vote 5: Department of Education
Province of the Western Cape
73
In 2013/14 profiles of all Special Schools were introduced, to determine the support and
resources needed. Data was taken from the National Audit of Special Schools and
supplemented by WCED data. Budget was allocated to address backlogs according to
identified needs.
In 2013, the WCED designed a standardised waiting list template which was provided to all
Special Schools. A database was developed to capture information of all referrals per district,
per circuit, per school and per official and these referral patterns are analysed in order to
focus on preventative interventions and on appropriate placement of learners.
6 144 applications for Special School placement were processed in 2013. Special care is
being taken in the evaluation of applications to ensure that only learners with high support
needs are placed in Special Schools. Regular sifting meetings were held and there will be
annual reviews of the placement of learners to see if any learners should be placed in
mainstream schools.
All applications to Special Schools in future will be required to include the Levels of Support
document which is based on the revised Screening, Identification, Assessment and Support
(SIAS). The table below illustrates the SIAS paradigm of matching need with programme.

Annual Report for 2013/14 Financial Year
Vote 5: Department of Education
Province of the Western Cape
74
Support for, and by, Special School Resource Centres
There are 24 Special Schools that are incrementally being transformed into Special School
Resource Centres. General inclusive Education outreach teams are based at 16 of the
Special School Resource Centres and specialist teams at 5 of the Special School Resource
Centres. 3 additional Special Schools have made staff available to do outreach work.
Special Schools who do not have outreach teams assisted surrounding schools by offering
workshops, clinics at the school, etc. Mary Kihn School for the Deaf, for example, offered a
weekly afternoon clinic for learners with hearing impairments from surrounding schools.
Support for severely and profoundly disabled children
In 2013, four teams provided support on an itinerant basis to 47 registered Special Care
Centres for children with severe and profound intellectual disabilities. A protocol for support
has been developed through collaboration between the Departments of Education, Health,
Social Development, Transport and Public Works, as well as Treasury. The support includes
development of stimulation programmes, and resource materials; presentation of workshops
for centre managers, carers and parents on disabilities and techniques to address the
physical, educational and psycho-social needs of the children and also assessments and
referrals of learners who are inappropriately placed and require referral to Special Schools.
Support to Full-service/Inclusive schools
One of the key strategies in the development of a single, inclusive system of education in
which all learners have access to support will be the phased conversion of public ordinary
schools in each district/circuit/cluster to full-service/inclusive schools. The first cohort of full-
service schools will become examples of good practice and will chart the way for
schools/institutions to ultimately become inclusive institutions.

Annual Report for 2013/14 Financial Year
Vote 5: Department of Education
Province of the Western Cape
75
Forty ordinary schools were identified for incremental conversion into full-service/inclusive
schools. Districts were provided with a checklist for the identification of schools suitable for
conversion and application was made to Head Office for the registration of these schools.
Human Resource Development of staff at these schools will begin in 2014/2015.
There are also 108 schools in the province which have “unit classes”, which offer additional
specialized support. These unit classes are being incrementally converted into “resource
classes” that provide support to learners with a need for moderate level of support but also
are a resource to all teachers requiring advice and learners in the school who experience
barriers to learning.
Greater numbers of learners with low to moderate intensity support needs are being
supported in public ordinary and Full Service/ Inclusive Schools where their educational
support needs can be met at this level. Additional support is given by the specialised support
services staff which includes school psychologists, social workers and learning support
advisors and also from the Inclusive Education Outreach teams, based at designated Special
School/Resource Centres.
Support for schools for the Blind and Deaf
A special focus in 2013/14 was on Schools for the Blind and Deaf. Pioneer and Athlone
Schools for the Blind received technology to facilitate access to Braille Learning and teaching
support material. The new equipment includes e-Braille portable computers that learners can
use to read textbooks electronically in braille, among other features. Learners can also listen
to the text via computer-generated speech and browse the internet. The WCED provided
electronic versions of relevant teaching and learning materials available, including textbooks
to support the implementation of the Curriculum and Assessment Policy Statement (CAPS).
A number of Alternative and Augmentative Communication Devices (AAC) devices were
researched for learners who need assistive devices to access the curriculum. District
Therapists have identified suitable Special Schools where a unit with AAC devices can be
established. These centres will facilitate the identification of the best device for a learner’s
needs.
WCED concluded a three year pilot for the introduction of South African Sign Language
(SASL) as a subject in October 2013. De la Bat Special School Resource Centre hosted this
provincial South African Sign Language project. The expertise gained has been shared with
the other schools for the Deaf in the province using SASL as the Language of Learning and
Teaching (LoLT). Findings have also been fed into the national DBE SASL project which began
in 2013. The Learning and Teaching Support Material developed for the project is now being
used at all schools for the Deaf in the province with SASL as LOLT. WCED is piloting SASL in the
Foundation Phase and Grade 8 in 2014 in preparation for a national roll-out in 2015.
Sector support groups
In 2013/14, bi-annual Special School sector meetings were held for the different disability
groupings for co-ordination, standardisation, sharing of best practice and latest
developments in the specific special needs field. Twelve Special School sector meetings were
held for the year, two each for the Blind, Deaf, Autism Spectrum Disorder, Neurological
Disabilities, Severe Intellectual Disability and Schools of Skills sectors.

Annual Report for 2013/14 Financial Year
Vote 5: Department of Education
Province of the Western Cape
76
FET provision for learners with cerebral palsy and physical disability
Three schools were assessed for their suitability to introduce FET classes to accommodate
demand. Eros was identified as the most suitable school and preparation was made for it to
accommodate Grade 10 learners as from 2014.
Support to Schools of Skills
Officials and staff from Schools of Skills developed a standardised, accredited School of Skills
curriculum. Officials and selected Schools of Skills teachers have been invited to be part of a
national task team to develop the national Schools of Skills curricula for accreditation with
Umalusi. The curricula for 21 technical skills were finalised and teacher training took place.
Support through whole school evaluation
Whole School Evaluation was conducted at 6 Special Schools in 2013/14. In addition to the
criteria evaluated in ordinary schools, the work of the specialist support services was
evaluated. Both general and special-needs-specific recommendations were made. These
were followed up by officials and School Improvement Plans were amended as suggested.
Good practice identified at the schools was also disseminated.
Support through Inter-departmental and inter-sectoral partnerships
Inter-departmental partnerships include collaboration with the Department of Health
regarding the Integrated School Health Programme, Health Promotion and improvement of
the National School Nutrition Programme menus and collaboration with the Department of
Social Development regarding disabled children and youth who are not in schools.
The Department of Health and Department of Education also collaborated to implement the
Integrated School Health Programme. The service package includes care and support for
teaching and learning/health promotion activities, learner screening and assessments,
management of health ailments and prevention of diseases.
The WCED also assisted the Department of Health with the Human Papilloma Virus
vaccination programme, a vaccination against cervical cancer. The HPV vaccination
programme is directed at young girls in Grade 4, who are 9 years or older, in all public
schools. Vaccination in 2014 took place during the months of March and April. A second
dose at six months will be administered during the months of September and October 2014.
The vaccination was administered by school health nurses, and nurses at special schools
assist at special schools. HPV vaccination consent forms and information sheets were
distributed at schools before the vaccination.
All districts were trained in the Integrated School Health Programme which enabled
psychologists, therapists and teachers to identify or obtain information regarding health-
related barriers to learning and to provide intervention programmes to address the barriers.
Statistics of learners screened were received from the Department of Health. The WCED
follows up on referrals.
An inter-sectoral co-ordinating committee with other government departments and
stakeholders was established in terms of the national Care and Support for Teaching and
Learning (CSTL) framework. CSTL is a South African Development Community initiative with

Annual Report for 2013/14 Financial Year
Vote 5: Department of Education
Province of the Western Cape
77
the goal of realising the education rights of all children through schools becoming inclusive
centres of learning, care and support. CSTL is a comprehensive, co-ordinated, multi-sectoral
response to address barriers to teaching and learning. It is not a new programme, but
provides an overarching framework for existing support programmes. Phase 1 of the
provincial CSTL training of officials took place in 2013/2014 and the phase 2 training of schools
will take place in 2014/2015.
Regular meetings were held with the Department of Health Western Cape Rehabilitation
Centre to assist with the placement of learners who were discharged from hospitals after
accidents, etc. Case discussions were arranged with psychologists, therapists and doctors to
determine the best schooling option for these learners.
There has also been collaboration with the Department of Health staff regarding mental
health. A questionnaire was developed to determine the mental health status of Grade 8
learners. This instrument can be used when the screening process of the Integrated School
Health Programme is rolled out to Grade 8 learners. Currently the focus of the ISHP is on
screening of grade 1 learners. As the Department of Health appoints additional staff, grades
4 and 8 will be phased in as part of the incremental roll-out of the Integrated School Health
Programme. A mental health screening tool for younger learners is also to be developed.
The WCED is represented on the Communicable Diseases Committee of the province to
inform the Department of Health of any notifiable communicable disease cases in schools
and obtain information for schools and districts on the handling of these cases. Meetings are
held bi-annually and when there is a specific emergency. Tuberculosis, Hepatitis A and
bacterial meningitis cases were reported to the Department of Health in 2013/2014
Strategic Objectives
Programme 4
Programme
Performance Measure
Ac
tua
l
Ac
hie
ve
me
nt
2012
/2013
Pla
nn
ed
Targ
et
2013
/2014
Ac
tua
l
Ac
hie
ve
me
nt
2013
/2014
De
via
tion
from
pla
nn
ed
targ
et to
Ac
tua
l
Ac
hie
ve
me
nt fo
r
2013
/2014
Comment on deviations
►PPM401: Number of
learners enrolled in
public special schools
19 884 19 470 19 876 406 The target was exceeded. The
target was set prior to the final
annual school survey for special
needs schools had been
finalised and underestimated
the enrolment that has been a
consequence of the expansion
of the schools of skill and the
new facilities for those on the
autism spectrum.
►PPM402:Number of
educators employed in
public special schools
1 860 1 800 1 872 72 The total of 1872 includes 95
educator posts in Youth Care
Centres whose learners were to
have been transferred to the
Department of Social
Development from 01 April 2013.
Not all posts are filled.

Annual Report for 2013/14 Financial Year
Vote 5: Department of Education
Province of the Western Cape
78
Programme 4
Programme
Performance Measure
Ac
tua
l
Ac
hie
ve
me
nt
2012
/2013
Pla
nn
ed
Targ
et
2013
/2014
Ac
tua
l
Ac
hie
ve
me
nt
2013
/2014
De
via
tion
from
pla
nn
ed
targ
et to
Ac
tua
l
Ac
hie
ve
me
nt fo
r
2013
/2014
Comment on deviations
►PPM403: Number of
professional non-
teaching staff
employed in public
special schools
971 997 1 003 6 The number 1003 exceeds the
target due to the fact that there
are 85 public service staff who
are marked in excess at Youth
Care Centres, where learners
were to have been transferred
to the Department of Social
Development on 01 April 2013.
Not all posts are filled.
Strategy to overcome areas of under performance
Address placement needs of learners with special education needs systematically
Ensure that teachers in mainstream schools are maximally equipped to deal with the
learning needs of all learners
Training with a focus on:
- Special School staff in the various categories of disability
- Schools of Skills staff regarding the revised curriculum
- Staff at Full-service/Inclusive Schools regarding identifying and addressing barriers to
learning
- Staff at Special School Resource Centres regarding their expanded role
- District-based Specialised Support staff including Psychologists, Social Workers, Learning
Support Advisors, Medical Staff and Therapists regarding their role in support across the
Inclusive Education continuum
- School-based Learning Support teachers regarding their specialist role in language and
mathematics improvement
- School-based Support Teams regarding their role in the Screening, Identification,
Assessment and Support (SIAS) process
Changes to planned targets
None
Linking performance with budgets
The expenditure incurred in Programme 4 contributed to achievement of the following key
outputs for the WCED:
Providing educators and public service posts for public special schools
Expanding and equipping special school resource centres/classes
Providing subsidies to special schools
Promoting inclusive education with the establishment of full-service schools

Annual Report for 2013/14 Financial Year
Vote 5: Department of Education
Province of the Western Cape
79
Sub-programme expenditure
Sub-Programme Name 2013/2014 2012/2013
Final
Appro-
priation
Actual
Expen-
diture
(Over)/
Under
Expen-
diture
Final
Appro-
priation
Actual
Expen-
diture
(Over)/
Under
Expen-
diture
R’000 R’000 R’000 R’000 R’000 R’000
4.1 Schools 910,287 910,287 - 824,291 820,101 4,190
4.2 Human Resource
Development 51 51 - - - -
4.3 Conditional grant - - - - - -
Total 910,338 910,338 - 824,291 820,101 4,190


Annual Report for 2013/14 Financial Year
Vote 5: Department of Education
Province of the Western Cape
81
4.5 Programme 5: Further Education and Training
Purpose:
To provide FET at public FET colleges in accordance with the Further Education and Training
Colleges Act (2006)
The FET programme comprises the following sub-programmes:
Sub-programme 5.1: Public Institutions
to provide specific public FET colleges with resources
Sub-programme 5.2: Professional Services
to provide lecturers and students in public FET colleges with departmentally managed
support services
Sub-programme 5.3: Human Resource Development
to provide for the professional and other development of management, lecturing and
support staff in public FET colleges
Sub-programme 5.4: Conditional Grant
to provide for the re-capitalisation in public FET colleges (used till 2008/09)
Strategic Objective
Strategic
Objective 5.1
To ensure institutional and programme planning alignment in order to
deliver relevant, responsive programmes towards meeting local business,
industry, community and student needs and to maintain an enabling
environment for high quality integrated theory/practical programme
delivery through institutional governance and management and
operational support.
Strategic objectives, performance indicators, planned targets and actual achievements
Enrolment
In 2013 Western Cape colleges enrolled 16 812 NC(V) and 39 782 Report 191 students during
2013. In the same period, approximately 15 000 students were enrolled in occupational
programmes. DHET has not yet released the final Annual Survey Report figures but colleges
enrolled approximately 71 594 students during the 2013 academic year. This includes an
increase of 412 NC(V) students above the target of 16 500 set by WCED. These figures show a
growth of 43% from 2012 to 2013 and should be viewed in the light of the 51% growth already
recorded between 2011 to 2012. This growth in enrolment supports the DHET target of
expanding the vocational and continuing education and training sector. Of the 71 594
students, 56 594 were in public-funded programmes, which are funded 80% of the total
programme cost.
The colleges enrolled 40 000 students in the first quarter of 2014. In total, the colleges plan to
enrol 69 700 students for 2014 but the demand for occupational programme delivery may
result in numbers above this figure.

Annual Report for 2013/14 Financial Year
Vote 5: Department of Education
Province of the Western Cape
82
The high growth in student numbers has an impact on college infrastructure. Most campuses
have reached their maximum capacity and will not be able to increase student numbers
without expansion of infrastructure.
College Enrolment
as of 15
February 2014
Boland 6 836
Cape Town 8 784
False Bay 4 976
Northlink 10 707
South Cape 3 276
West Coast 5 424
Total 40 003
Lecturer Development
The WCED continued to support curriculum implementation through lecturer capacity
building and classroom support. Emphasis was placed on the quality of internal assessment
instruments with the result that the majority of NC(V) internal assessment instruments were
standardised and verified for compliance to national standards. Lecturer capacity was
enhanced both as a consequence of the processes used in these quality assurance exercises
and because of the technology provided to assist in presentation, such as smart boards.
180 Lecturers were placed in workplaces for continuous professional development.
Mathematics and Mathematical Literacy lecturers were trained on specific aspects of their
curricula, teaching methodology and classroom management. In the absence of final
examination results, it cannot be established whether Mathematics and Mathematical
Literacy results have improved. Absenteeism has a definite impact on Maths results in
particular, as the subject requires students to complete exercises regularly.
At this stage, no analyses of examination results can be provided due to the fact that DHET
has not yet released the results to provincial departments.
Support provided
Financial support to students was provided through the DHET FET College Bursary Scheme. In
2013, 17 264 ‘tuition only’ and 15 806 ‘comprehensive’ bursaries were allocated to NC(V) and
Report 191 students.
The increase in student numbers placed pressure on college infrastructure. WCED allocated
R52,130,000 for infrastructure development to address shortages of classroom space as well
as much needed upgrades and expansion at all six colleges.

Annual Report for 2013/14 Financial Year
Vote 5: Department of Education
Province of the Western Cape
83
The FET College Amendment Act (3/2012) was promulgated in May 2012. This legislated the
transition of FET Colleges from a provincial to a national competency. However, since not all
the legislation was in place to effect a full transfer, protocol agreements were signed for the
secondment of provincial staff to continue supporting colleges.
The Western Cape provincial unit continued to provide support to college governance and
management structures by coordinating strategic and operational planning and facilitating
new college council appointments after termination of college councils on 31 December
2013.
The unit also supported curriculum delivery and internal assessment and all external
examinations were monitored. WCED and DHET further monitored and reported on college
performance in respect of enrolments, financial management and quality assurance of
assessments. See the section on “Lecturer development” above.
From the 2013/14 financial year, DHET took over the function of transferring subsidies directly
to colleges, while WCED managed PERSAL on behalf of the colleges. PERSAL management
included payment of salaries and wages as well as social benefits to employees. In
compliance with DHET instructions, monthly and quarterly financial reports were submitted to
DHET, while detailed PERSAL reports were submitted to colleges for their reconciliation of
personnel expenditure.
WCED support for relationship-building between FET Colleges, SETAs and industry was
intensified, with the result that 3 000 students were placed in industry for workplace exposure
and 11 343 as part of their qualification.
The WCED supported colleges to provide SRC training as well as exit support to students in
preparation for the work environment. The exit support included CV writing, soft skills
development, employer open days, etc. The SRC training focussed on enhancing leadership
capacity within SRC structures.
Transitional matters
The FETC function shift did not materialise as planned for the 2013/14 financial year. The new
target date for the full function shift is 1 April 2015 for FET and AET. The previously established
transitional operational structures, have been replaced by a HEDCOM Function Shift sub-
committee.
During 2013/14 the provincial transition task team had five meetings with accompanying
reports compiled in preparation for national meetings. The reports and recommendations
mainly focussed on the transfer of staff, with the result that the senior management staff of
colleges was transferred to DHET, while staff of the provincial FET units was seconded and to
be transferred on 1 April 2015. Collective Agreements for the transfer of college lecturing and
support staff were signed in February 2013 and the transfer process is currently under way.

Annual Report for 2013/14 Financial Year
Vote 5: Department of Education
Province of the Western Cape
84
Performance indicators
Programme 5
Programme
Performance Indicator
Ac
tua
l
Ac
hie
ve
me
nt
2012
/2013
Pla
nn
ed
Targ
et
2013
/2014
Ac
tua
l
Ac
hie
ve
me
nt
2013
/2014
De
via
tion
from
pla
nn
ed
targ
et to
Ac
tua
l
Ac
hie
ve
me
nt fo
r
2013
/2014
Comment on deviations
►PPI 5.1: Number of
students enrolled in
NC(V) courses in FET
Colleges
15 150 16 400 16 812 412 Colleges exceeded target due
to demand
►PPI 5.2: Number of
FET College NC(V)
students who
completed full courses
successfully
4 603 7 380 9 400 2 020 This is an estimate since the final
results will only be released after
the resulting of the
supplementary examinations.
Strategy to overcome areas of under performance
DHET has started a process of strengthening national student attendance and performance
policies. Once these are effected, the attendance rate of students should improve and this
should result in improved academic performance. Provincially, curriculum support will be
intensified through strengthening current programme focus groups/ communities of practice
to ensure that expertise and best practices are shared amongst lecturers. Further emphasis
will be placed on strengthening colleges' ability to provide academic support to students.
Changes to planned targets
None.
Linking performance with budgets
The expenditure incurred in Programme 5 contributed to achievement of the following key
output for the WCED:
Funding of the staffing costs of Further Education and Training Colleges
Sub-programme expenditure
Sub-Programme Name 2013/2014 2012/2013
Final
Appro-
priation
Actual
Expen-
diture
(Over)/
Under
Expen-
diture
Final
Appro-
priation
Actual
Expen-
diture
(Over)/
Under
Expen-
diture
R’000 R’000 R’000 R’000 R’000 R’000
5.1 Public Institutions 353, 097 353 ,078 19 597,589 597,523 66
Total 353, 097 353 ,078 19 597,589 597,523 66


Annual Report for 2013/14 Financial Year
Vote 5: Department of Education
Province of the Western Cape
86
4.6 Programme 6: Adult Education and Training
Purpose:
To provide AET in accordance with the Adult Basic Education and Training Act, 2000
The ABET programme comprises the following sub-programmes:
Sub-programme 6.1: Subsidies to Public Adult Learning Centres
to support specific public AET sites through subsidies
Sub-programme 6.2: Subsidies to Private Adult Learning Centres
to support specific private AET sites through subsidies
Sub-programme 6.3: Professional Services
to provide educators and learners at AET Centres with departmentally managed support
services
Sub-programme 6.4: Human Resource Development
to provide for the professional and other development of management, educators and
support staff at AET Centres.
Strategic Objective
Strategic
Objective 6.1
To provide support to AET centre management and governance structures
through policy development and strategic interventions that facilitate
effective teaching in adult learning centres; to provide teachers and
students at AET sites with departmentally managed curriculum support
services; and to provide for the professional development of teachers and
non-teachers
Strategic objectives, performance indicators, planned targets and actual achievements
Enrolment
In 2013/14, there were 33 595 learners at 308 Sites of which 120 are Main Centres. 20 301 were
ABET Level 1-4 learners, 12 099 were FET learners and 1 195 participated in short skills
programmes.
Distribution of Learners according to Level/Grade - Year 2013
Education
District Level 1 Level 2 Level 3 Level 4 GR 10 GR 11 GR 12 Other Total
Cape
Winelands 853 706 609 1 865 12 0 1 652 280 5 977
Eden and
Central
Karoo
606 381 466 1 088 0 0 495 72 3 108
Metro Central 422 250 310 1005 28 93 3 604 114 5 826
Metro East 150 122 189 1,983 0 0 85 208 2 737
Metro North 282 352 447 1,921 0 0 2,131 54 5 187

Annual Report for 2013/14 Financial Year
Vote 5: Department of Education
Province of the Western Cape
87
Distribution of Learners according to Level/Grade - Year 2013
Education
District Level 1 Level 2 Level 3 Level 4 GR 10 GR 11 GR 12 Other Total
Metro South 277 240 315 1,410 0 0 3,114 70 5 426
Overberg 281 311 295 897 0 0 659 253 2 696
West Coast 476 209 282 1301 0 0 226 144 2 638
Total 3 347 2 571 2 913 11 470 40 93 11 966 1 195 33 595
SOURCE: ANNUAL SURVEY 2013
Additional accredited skills programmes were offered to 459 learners in collaboration with the
FET colleges of Boland, Northlink and Cape Town.
In 2013, the WCED continued its provision of Adult Education Programmes to employees of
Provincial and National Government Departments. Memoranda of Understanding were
signed with the Departments of Health, Social Development and Matzikama Municipality
(signed in April 2013). 531 partnership learners attended 18 centres. The MOU with the
Department of Health was updated, whilst Bredasdorp CLC signed an MOU with Floraland
and SANPARKS to provide ABET services to employees. MOUs are planned with the
Department of Transport and Public Works and Rural Development.
The Kha Ri Gude Mass Literacy campaign was launched in April 2008 with the intention of
enabling 4.7 million South Africans to become literate and numerate in one of the eleven
official languages by 2012. There were 15 521 Western Cape learners on the programme in
2013, assisted by 900 tutors and 5 provincial coordinators. Learners are taught to read and
write in their mother tongue in line with A(B)ET level 1 unit standards. Learners are required to
complete twenty assessment activities (10 for literacy and 10 for numeracy) in their Learner
Assessment Portfolios (LAPS). The LAPS are moderated and verified by SAQA.
A Youth Focus Project was continued in 2013 to respond to the learning needs of learners in
public schools who were repeating Grade 9 for the second, third or fourth time and who
were three or more years older than the Grade 9 age norm. A programme was developed
and funded to allow a number of learners to be placed in occupationally directed courses at
FET Colleges and AET Centres to complete a bridging programme that will culminate in a
General Education and Training Certificate: NQF Level 1. 449 learners were placed in FET
Colleges. 33 learners are funded by MerSETA (R3.7 million) for an artisanship programme and
20 learners are funded by the Fibre Processing and Manufacturing SETA (FP&M Seta) for a
clothing manufacturing certificate. 130 learners were placed at AET centres from June 2012,
as part of the project. The budget for this group of learners was R28 million (2013/2014).

Annual Report for 2013/14 Financial Year
Vote 5: Department of Education
Province of the Western Cape
88
Test Results
In 2013 there was an increase in the number of students registering to write the ABET Level 4
exams. A total of 4 781 candidates registered for one or more learning areas compared to
3 987 candidates in 2012. The number of learning area entries also increased. In 2013 there
were 19 600 learning area entries, compared to 16 987 in 2012, 14 149 in 2011 and 9 551 in
2010.
The Western Cape achieved many more learning area passes in 2013. The table below shows
the progress since 2011.
2011 2012 2013
Number of Learning Area passes 6 762 7 677 8 518
Adult learners obtained good results in the two new learning areas, Information and
Communication Technology (86.64%) and Early Childhood Development (92.03%).
Teacher Development
In 2013, District Readiness visits were conducted to assist AET Centres with preparation and
readiness for 2014. All Centre Managers and Site Coordinators were provided with a list of Key
Result Areas. These form part of their contract with the WCED.
It is critical to attract appropriately qualified staff to the sector at competitive salaries. The
appointment of AET staff is dependent on labour legislation being promulgated and there
are delays in this process. The implementation of the Norms and Standards Funding for Adult
Learning Centres will ensure that centres are better equipped to offer a more professional
service for their communities.
Support Provided
In 2013, two provincial Centre Managers’ Forums were held. The establishment and
operations of this structure are guided by the regulatory framework, approved in April 2012.
Norms and Standards funding for 92 main centres amounting to R32.6m was finalised in
November 2013. Norms and Standards funding makes provision for 51 full-time contract posts;
27 Centre Managers and 24 Site Coordinators.
To ensure targeted support to District Officials, reviews were held with all Districts every
quarter.

Annual Report for 2013/14 Financial Year
Vote 5: Department of Education
Province of the Western Cape
89
Performance Indicators
Programme 6
Programme
Performance Indicator
Ac
tua
l
Ac
hie
ve
me
nt
2012
/2013
Pla
nn
ed
Targ
et
2013
/2014
Ac
tua
l
Ac
hie
ve
me
nt
2013
/2014
De
via
tion
from
pla
nn
ed
targ
et to
Ac
tua
l
Ac
hie
ve
me
nt fo
r
2013
/2014
Comment on deviations
► PPI 6.1. Number of
learners enrolled in
public ABET Centres
32 688 21 000 33 595 12 595 Because the existing curriculum
and qualification were not
replaced as had been
anticipated more numbers
enrolled than projected.
► PPI 6.2. Number of
educators employed in
public ABET Centres
1 379 1 400 904 -496 Enrolment for courses was
limited to fewer centres and
larger classes meant that fewer
educators were required.
Strategy to overcome areas of under performance
Offer support on existing curriculum until the predicted changes come into effect
Provide guidance and support to prospective students
Changes to planned targets
None
Linking performance with budgets
The expenditure incurred in Programme 6 contributed to achievement of the following key
outputs for the WCED:
Providing educator posts for Adult Education and Training Institutions
Providing subsidies to Adult Education and Training Institutions
Sub-programme expenditure
Sub-Programme Name 2013/2014 2012/2013
Final
Appro-
priation
Actual
Expen-
diture
(Over)/
Under
Expen-
diture
Final
Appro-
priation
Actual
Expen-
diture
(Over)/
Under
Expen-
diture
R’000 R’000 R’000 R’000 R’000 R’000
6.1 Public Centres 5,006 5,006 - 7,106 7,106 -
6.2 Subsidies to Private
Centres 32,892 32,892 - 29,814 29,814 -
6.3 Professional Services - - - - - -
6.4 Human Resource
Development - - - - - -
Total 37,898 37,898 - 36,920 36,920 -


Annual Report for 2013/14 Financial Year
Vote 5: Department of Education
Province of the Western Cape
91
4.7 Programme 7: Early Childhood Development
Purpose:
To provide Early Childhood Development (ECD) at the Grade R level in accordance with
White Paper 5
The ECD programme comprises the following sub-programmes:
Sub-programme 7.1: Grade R in Public Schools
to provide specific public ordinary schools with resources required for Grade R and
encourage more schools to establish grade R classes where space exists
Sub-programme 7.2: Grade R in Community Schools
to support particular community centres [ECD independent schools] at the Grade R level
Sub-programme 7.3: Professional Services
To provide training and payment of stipends of Pre-Grade R Practitioners
Sub-programme 7.4: Human Resource Development
to provide for the professional and other development of educators and non-educators in
ECD sites.
Sub-programme 7.5: Conditional Grant
to provide for the infrastructure for ECD
Strategic Objective
Strategic
Objective 7.1
To provide specific public ordinary schools and identified independent
schools with resources required for Grade R and provide conditions that
encourage more schools to establish Grade R classes in existing available
classrooms or new Grade R classrooms
To co-ordinate the Level 1, 4 and 5 training of ECD practitioners
Strategic objectives, performance indicators, planned targets and actual achievements
Enrolment
The Grade R learner data captured in the Annual Surveys for public and ECD independent
schools indicates a substantial increase in enrolment of Grade R learners. The overall
enrolment in Grade R is reported at over 76 000 (SNAP survey of 2014) which shows a
substantial increase from 2012. This is ascribed to the advocacy campaigns to inform parents
of the long term benefits of Grade R for their young children, and to better, verified data.
Test Results
The Western Cape Education Department, for the third successive year, undertook to assess
all Grade R learners at selected schools in 2013. In total, 11 582 Grade R learners who were
identified as being at risk were assessed between September and October 2013 by trained
WCED officials. The aspects in which learners performed least well were visual and auditory

Annual Report for 2013/14 Financial Year
Vote 5: Department of Education
Province of the Western Cape
92
perception. The survey also found that vocabulary levels were low. The needs revealed
through this exercise confirmed the WCED decision to continue strengthening every aspect of
Grade R programmes to ensure that these are of the requisite quality. 3 566 learners are
repeating Grade R in 2014 in order to strengthen their learning foundations.
Teacher Development
The Grade R CAPS training commenced in 2011/2012 when approximately 3 000 Grade R
practitioners and teachers and HODs received training with staff at NGOs, HEIs and FET
Colleges. By the end of the 2013/14 year a further 1 600 teachers received training. Additional
training of FET College ECD facilitators also took place.
A total of 5 152 ECD practitioners were on either ECD Level 1, 4 or 5 learnership programmes
offered at Western Cape FET Colleges in the course of the year under review.
394 unemployed persons were beneficiaries of an ECD Practitioner Assistant’s programme
and 22 additional persons were contracted as administrative support staff. The 12-month
Level 1 training programme was provided by the FET Colleges. The WCED has ensured the
development of accredited Level 1 learning material.
In line with the prescripts in the Ministerial determination for the Expanded Public Works
Programme (EPWP), the minimum stipend paid to all ECD practitioners increased from R1 348
to R1 428 in November 2013. All ECD practitioners who are currently on learnership
programmes benefited from the increased stipend. This increase has had a positive influence
on the attendance of trainees at training classes.
Each college procured the services of a reputable service provider who provided First Aid
training for 5 848 ECD practitioners and assistants. All the participants attended training and
received a training manual and a first aid kit for their crèche.
Support Provided
In 2013 the Grade R learner subsidy allocation to 942 public and 396 independent schools
was increased to align it to the requirements of the National Norms and Standards for Grade
R funding. Funding was increased as follows:
Quintile Per learner
daily 2011
Per learner
daily 2013
New amount
per annum per
learner
1 R18 R20 R4,000
2 R17 R19 R3,800
3 R14 R18 R3,600
4 R12 R17 R3,400
5 R10 R16 R3,200
The subsidy allocation will be reviewed again in the 2014/2015 fiscal year.
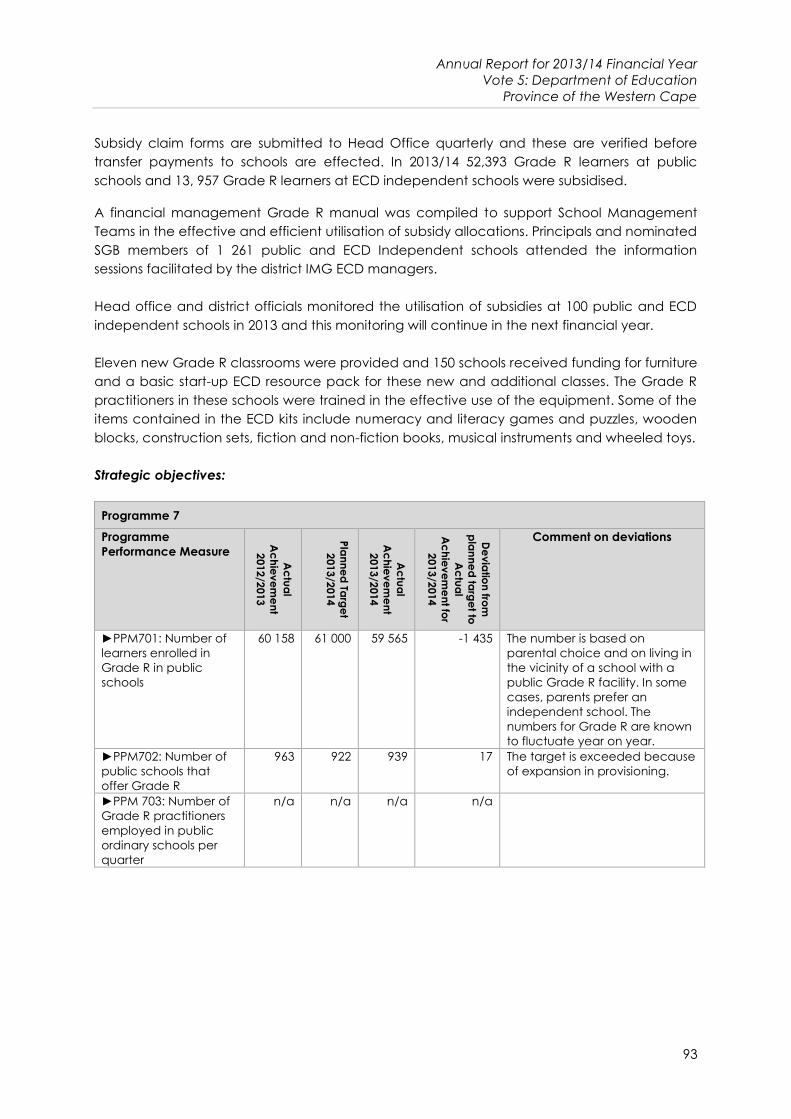
Annual Report for 2013/14 Financial Year
Vote 5: Department of Education
Province of the Western Cape
93
Subsidy claim forms are submitted to Head Office quarterly and these are verified before
transfer payments to schools are effected. In 2013/14 52,393 Grade R learners at public
schools and 13, 957 Grade R learners at ECD independent schools were subsidised.
A financial management Grade R manual was compiled to support School Management
Teams in the effective and efficient utilisation of subsidy allocations. Principals and nominated
SGB members of 1 261 public and ECD Independent schools attended the information
sessions facilitated by the district IMG ECD managers.
Head office and district officials monitored the utilisation of subsidies at 100 public and ECD
independent schools in 2013 and this monitoring will continue in the next financial year.
Eleven new Grade R classrooms were provided and 150 schools received funding for furniture
and a basic start-up ECD resource pack for these new and additional classes. The Grade R
practitioners in these schools were trained in the effective use of the equipment. Some of the
items contained in the ECD kits include numeracy and literacy games and puzzles, wooden
blocks, construction sets, fiction and non-fiction books, musical instruments and wheeled toys.
Strategic objectives:
Programme 7
Programme
Performance Measure
Ac
tua
l
Ac
hie
ve
me
nt
2012
/2013
Pla
nn
ed
Targ
et
2013
/2014
Ac
tua
l
Ac
hie
ve
me
nt
2013
/2014
De
via
tion
from
pla
nn
ed
targ
et to
Ac
tua
l
Ac
hie
ve
me
nt fo
r
2013
/2014
Comment on deviations
►PPM701: Number of
learners enrolled in
Grade R in public
schools
60 158 61 000 59 565 -1 435 The number is based on
parental choice and on living in
the vicinity of a school with a
public Grade R facility. In some
cases, parents prefer an
independent school. The
numbers for Grade R are known
to fluctuate year on year.
►PPM702: Number of
public schools that
offer Grade R
963 922 939 17 The target is exceeded because
of expansion in provisioning.
►PPM 703: Number of
Grade R practitioners
employed in public
ordinary schools per
quarter
n/a n/a n/a n/a

Annual Report for 2013/14 Financial Year
Vote 5: Department of Education
Province of the Western Cape
94
Performance indicators
Programme 7
Programme
Performance Indicator
Ac
tua
l
Ac
hie
ve
me
nt
2012
/2013
Pla
nn
ed
Targ
et
2013
/2014
Ac
tua
l
Ac
hie
ve
me
nt
2013
/2014
De
via
tion
from
pla
nn
ed
targ
et to
Ac
tua
l
Ac
hie
ve
me
nt fo
r
2013
/2014
Comment on deviations
► PPI 7.1 Number of
additional ECD kits to
Public Ordinary Schools
130 100 130 30 The target was exceeded as a
result of a decision to support
more public schools.
► PPI 7.2 Number of
additional ECD kits to
Independent Schools
20 50 20 -30 The target was not met as a
result of a decision to support
more public schools.
Strategy to overcome areas of under performance
Focus on improved teacher training
Concentrate on support programmes for Grade R learners who are ‘at risk’
Ensure that schools are in possession of all LTSM before the commencement of the Grade
R academic year.
Monitor effective utilization of Grade R subsidies at public ordinary schools and ECD
independent schools offering Grade R
Support improved quality
Changes to planned targets
None
Linking performance with budgets
The expenditure incurred in Programme 7 contributed to achievement of the following key
outputs for the WCED:
Providing educator posts for Grade R in public schools
Expanding and improving subsidies for Grade R in public schools and independent
Institutions to ensure universal enrolment
Sub-programme expenditure
Sub- Programme Name 2013/2014 2012/2013
Final
Appro-
priation
Actual
Expen-
diture
(Over)/
Under
Expen-
diture
Final
Appro-
priation
Actual
Expen-
diture
(Over)/
Under
Expen-
diture
R’000 R’000 R’000 R’000 R’000 R’000
7.1 Grade R in Public
Schools 298,673 298,673 - 222,465 222,465 -
7.2 Grade R in Community
Centres 53,760 53,760 - 43,194 43,194 -
7.3 Pre-grade R Training 105,153 105,153 - 101,250 101,250 -
7.4 Human Resource
Development - - - - - -
7.5 Conditional Grants 8,051 7,949 102 16,985 16,985 -
Total 465,637 465,535 102 383,894 383,894 -


Annual Report for 2013/14 Financial Year
Vote 5: Department of Education
Province of the Western Cape
96
4.8 Programme 8: Infrastructure Development
Purpose: To provide and maintain infrastructure facilities for the administration and schools
Sub-programmes
Sub-programme 8.1: Administration
Includes goods and services required for infrastructure development and maintenance of
office buildings
Sub-programme 8.2: Public Ordinary Schools
Includes goods and services required for infrastructure development and maintenance at
public ordinary schools
Sub-programme 8.3: Special Schools
Includes goods and services required for infrastructure development and maintenance at
public special schools
Sub-programme 8.4: Early Childhood Development
Includes goods and services required for infrastructure development and maintenance at
public ordinary schools
Strategic Objective
Strategic
Objective 8.1
To ensure prioritised, cost-effective and efficient infrastructure
maintenance and to ensure that schools are built to match priority
demographic trends
Objective
statement
1. Develop a reliable, comprehensive database of school infrastructure
maintenance requirements.
2. Prioritise interventions based on informed and objective criteria and
accurate information systems.
3. In the context of funding shortages and an aging infrastructure, apply a
hierarchy of needs approach as follows: Roof repairs, structural repairs to
the building, water supply, electricity supply, sewerage and ablution
facilities, gutters and facia boards, ceilings, perimeter fences, painting.
4. Provide emergency maintenance in the case of natural disasters,
structural problems and vandalism.
5. Support schools in day-to-day maintenance (maintenance of grounds,
cleaning, renovations, repairs and/or replacement of parts of school
buildings) by means of Norms and Standards allocations to schools.
6. Provide an infrastructure planning and implementation service which
ensures that decisions to build, renovate, close or extend schools are
based on sound evidence and that learners are accommodated.
7. Manage the building programme to include the provision of new
schools, replacement of inadequate structures, refurbishment of
classrooms and provision of new classrooms and mobile classrooms to
meet demands in the short term.

Annual Report for 2013/14 Financial Year
Vote 5: Department of Education
Province of the Western Cape
97
Strategic objectives, performance indicators, planned targets and actual achievements
Details are provided under Point 6.8. “Capital investment, maintenance and asset
management plan”. A summary is provided below.
Building projects completed during 2013/14
New schools
No new school were handed over in 2013/14;
No mobile schools were completed for use in 2013/14.
Replacement schools (replacement of schools built of inappropriate materials)
The following Replacement Schools were completed in 2013/14: Formosa Primary School,
Pacaltsdorp Primary School, St. Thomas Primary School, Kathleen Murray Primary School,
Rusthof Primary School, Fairview Primary School and Plantation Road Primary School,
One upgrade and project was completed at Bloekombos Primary School.
Additional classrooms
Expansion classrooms: 7 classrooms were built onto existing schools in order to allow for
increased enrolment.
Grade R classrooms: 11 classrooms were completed in 2013/14.
Mobile units provided: 175 classrooms.
The infrastructure that was scheduled for delivery in 2013/14 is set out below, alongside the
actual delivery figures.
Category Targeted Actual number
New Schools 4 0
Replacement schools 7 7
Grade R classrooms 65 11 classrooms
Upgrade and addition No targets set 1
Expansion Classrooms 7 classrooms
Mobile classrooms 175 classrooms

Annual Report for 2013/14 Financial Year
Vote 5: Department of Education
Province of the Western Cape
98
Strategic objectives:
Programme 8
Programme Performance
Measure
Ac
tua
l Ac
hie
ve
me
nt
2012
/2013
Pla
nn
ed
Targ
et
2013
/2014
Ac
tua
l Ac
hie
ve
me
nt
2013
/2014
De
via
tion
from
pla
nn
ed
targ
et
to A
ctu
al
Ac
hie
ve
me
nt fo
r
2013
/2014
Comment on deviations
►PPM801: Number of
public ordinary schools to
be provided with water
supply
0 0 0 0 None
►PPM802: Number of
public ordinary schools to
be provided with
electricity supply
0 0 0 0 None
►PPM803: Number of
public ordinary schools to
be supplied with sanitation
facilities
0 0 0 0 None
►PPM804: Number of
classrooms to be built in
public ordinary schools
(including the ASIDI
Programme)
293 613 265 -348 13 school projects (approximately
364 classrooms) were cancelled in
2013/14 due to non-performance
and liquidations by contractors. This
caused delays in excess of 6 months
to allow for time to re-advertise the
contracts and get new contractors
appointed. ►PPM805: Number of
specialist rooms to be built
in public ordinary schools
(all rooms except
classrooms – include:
laboratories, stock rooms,
sick bay, kitchen etc.),
including the ASIDI
Programme
95 165 62 -103 13 school projects (approximately
103 specialist classrooms) were
cancelled in 2013/14 due to non-
performance and liquidations by
contractors. This caused delays in
excess of 6 months to allow for time
to re-advertise the contracts and get
new contractors appointed.
Performance indicators
Programme 8
Programme Performance
Indicator
Ac
tua
l Ac
hie
ve
me
nt
2012
/2013
Pla
nn
ed
Targ
et
2013
/2014
Ac
tua
l Ac
hie
ve
me
nt
2013
/2014
De
via
tion
from
pla
nn
ed
targ
et to
Ac
tua
l Ac
hie
ve
me
nt
for 2
01
3/2
01
4
Comment on deviations
► PPI 8.1. Number of
maintenance projects
completed
93 1438 108 -35 Of the 35 projects not completed, 27
projects will be completed in the 1st
quarter of 2014/15. 3 projects were
re-advertised and 3 projects were
cancelled entirely.
8 The total number of projects for 2013/14 approved for the User Asset Management Plan was 141
projects and not 143.

Annual Report for 2013/14 Financial Year
Vote 5: Department of Education
Province of the Western Cape
99
Strategy to overcome areas of under performance
Put more funding into maintenance
Focussed approach on maintenance through variety of partnering options eg matched
funding
Address processes around unavailability of sites through coordination between the
WCED, the Department of Transport and Public Works (DTPW) and local government
sectors.
Facilitate resolution of zoning applications and related matters through improved
communication between WCED, DTPW (Property management) and the Department of
Environmental Affairs and Planning (DEADP).
Changes to planned targets
None
Linking performance with budgets
The expenditure incurred in Programme 8 contributed to achievement of the following key
outputs for the WCED:
Expanding, improving and maintaining infrastructure at public ordinary schools, special
schools and Grade R in public ordinary schools
Sub-programme expenditure
Sub-Programme Name 2013/2014 2012/2013
Final
Appro-
priation
Actual
Expen-
diture
(Over)/
Under
Expen-
diture
Final
Appro-
priation
Actual
Expen-
diture
(Over)/
Under
Expen-
diture
R’000 R’000 R’000 R’000 R’000 R’000
8.1 Administration 9,190 9,190 - 846 846 -
8.2 Public Ordinary Schools 1,161,856 1,023,222 138,634 738,001 697,686 40,315
8.3 Public Special Schools 6,978 6,978 - 14,683 14,683 -
8.4 Early Childhood
Development 14,922 14,922 - 37,457 37,457 -
Total 1,192,946 1,054,312 138,634 790,987 750,672 40,315


Annual Report for 2013/14 Financial Year
Vote 5: Department of Education
Province of the Western Cape
101
4.9 Programme 9: Auxiliary and associated services
Purpose:
To provide the education institutions as a whole with support
The Auxiliary and Associated Services programme comprises the following sub-programmes:
Sub-programme 9.1: Payments to SETA
to provide human resource development for employees in accordance with the Skills
Development Act
Sub-programme 9.2: Conditional Grant Projects
to provide for projects specified by the Department of Basic Education that are applicable to
more than one programme and funded from conditional grants
Sub-programme 9.3: External Examinations
to provide for departmentally managed examination services
Strategic Objective
Strategic
Objective 9.1
To provide access to all external examinations; ensure the credibility of
the examination and assessment processes; ensure that all schools
manage examinations and school-based assessment effectively; and
support learning
Strategic objectives, performance indicators, planned targets and actual achievements
Examinations
In 2013, the WCED administered five major examinations in accordance with the relevant
policies and regulations. These examinations are:
i. National Senior Certificate examinations (October/November)
ii. National Senior Certificate Supplementary examinations (February/March each year).
iii. Senior Certificate examinations (May/June each year until 2017);
iv. ABET Level 1-4 examinations (May/June)
v. ABET Level 1-4 examinations (October/November)
In addition, the Annual National Assessments were written in Grades 1-6 and 9. These papers
are set by the Department of Basic Education and supplied to provinces for administration.
The aim of the assessments is to support the national focus on improving the reading, writing
and mathematical abilities of Grades 1 – 6 and Grade 9 learners.

Annual Report for 2013/14 Financial Year
Vote 5: Department of Education
Province of the Western Cape
102
Exam Number
registered
Number
who wrote
Number of
centres
National Senior Certificate examinations
(October/November)
48 701 47 636 431
National Senior Certificate Supplementary
examinations (February/March 2014)
8 579 6 960 408
Senior Certificate examinations (May/June
2013 and each year until 2017);
24 991 13 481 172
ABET Level 4 examinations (May/June 2013) 1 109 728 58
ABET Level 4 examinations
(October/November 2013)
4 774 3 480 114
The Annual National Assessment tests were written from 10 to 13 September 2013. In the
Western Cape a total of 604 364 learners were registered to write the tests which were
conducted across 1 552 schools in the province including 1 458 public ordinary schools, 76
state aided Independent schools and 18 Special schools.
Security of examinations is a key priority. All examination processes and procedures are
managed in terms of the relevant legislation.
The WCED trained 1 328 people during 18 sessions in September 2013 to manage the National
Senior Certificate examination process at school level. The group consisted of school
principals, senior teachers and external senior invigilators. The invigilation of the conduct of
the National Senior Certificate and ABET level 4 examinations was carried by teachers and
external invigilators in a 50:50 ratio. The Senior Invigilator, who was also an external
community member, played an important supportive role to the principal who was the chief
examination officer in the school.
To improve the quality of the NSC marking, competency tests for markers were conducted in
ten subjects during April-May 2013. It is evident that the standard and quality of marking in
these subjects have improved.
To ensure that the school based assessment (SBA) marks are valid and reliable, teachers are
required to submit the assessment tasks to the subject head at school level for moderation.
Curriculum advisors perform ongoing moderation of SBA at school level. Moderation of SBA is
also done at provincial level prior to the moderation conducted by the Department of Basic
Education and Umalusi. Where SBA marks are found to be invalid, the schools are referred to
the district for support and intervention.
Schools and learners that performed exceptionally well were acknowledged at the annual
awards function held on 14 January 2014.
The Senior Certificate examinations for adult learners will continue to be offered until 2017.
The number of examination centres has decreased over the years as part of a formal
rationalisation exercise that ensures that the highest standards of access and control are
maintained.

Annual Report for 2013/14 Financial Year
Vote 5: Department of Education
Province of the Western Cape
103
Strategic objectives
Programme 9
Programme
Performance Measure
Ac
tua
l Ac
hie
ve
me
nt
2012
/2013
Pla
nn
ed
Targ
et
2013
/2014
Ac
tua
l Ac
hie
ve
me
nt
2013
/2014
De
via
tion
from
pla
nn
ed
targ
et to
Ac
tua
l
Ac
hie
ve
me
nt fo
r
2013
/2014
Comment on deviations
► PPM901: Number
of candidates for
the Grade 12 senior
certificate
examinations (matric
exams)
44 700 48 500 47 636 -864 The estimate proved to be
largely accurate. A slight
shortfall was experienced.
Enrolment is a variable that
depends on a number of
factors which fall outside the
control of the WCED.
► PPM902: Number
of candidates who
passed National
Senior Certificate
36 992 40 000 40 558 558 The extra success was pleasing
and a result of extra effort on
the part of learners, teachers
and officials. This included
classroom teaching, tutoring,
holiday programmes, the
telematics programme, past
papers, the “Tips for Success”
booklet, textbooks and general
support and monitoring.
► PPM903: Numbers
of learners who
obtained Bachelor
passes in the
National Senior
Certificate (NSC)
16 319 17 600 19 477 1 877 The extra success was pleasing
and a result of extra effort on
the part of learners, teachers
and officials. This included
classroom teaching, tutoring,
holiday programmes, the
telematics programme, past
papers, the “Tips for Success”
booklet, textbooks and general
support and monitoring.
► PPM904: Numbers
of learners who
passed Maths in the
NSC examination
11 311 11 500 12 216 716 The extra success was pleasing
and a result of extra effort on
the part of learners, teachers
and officials. This included class-
room teaching, tutoring, holiday
programmes, the telematics
programme, past papers, the
“Tips for Success” booklet,
textbooks and general support
and monitoring. The Dinaledi
programme and the WCED
Literacy and Numeracy and
Maths and Science strategies
combined with the long term
impact of the systemic testing
should continue to bear fruit.

Annual Report for 2013/14 Financial Year
Vote 5: Department of Education
Province of the Western Cape
104
Programme 9
Programme
Performance Measure
Ac
tua
l Ac
hie
ve
me
nt
2012
/2013
Pla
nn
ed
Targ
et
2013
/2014
Ac
tua
l Ac
hie
ve
me
nt
2013
/2014
De
via
tion
from
pla
nn
ed
targ
et to
Ac
tua
l
Ac
hie
ve
me
nt fo
r
2013
/2014
Comment on deviations
► PPM905: Numbers
of learners who
passed Physical
Science in the NSC
examination
7 995 8 400 8 333 -67 Although the target was not
met there were 338 more who
passed. This extra success was
pleasing and a result of extra
effort on the part of learners,
teachers and officials. This
included classroom teaching,
tutoring, holiday programmes,
the telematics programme, past
papers, the “Tips for Success”
booklet, textbooks and general
support and monitoring. The
Dinaledi programme and the
WCED Literacy and Numeracy
and Maths and Science
strategies combined with the
long term impact of the
systemic testing should continue
to bear fruit.
► PPM906: Number
of Grade 3 learners
who passed
Language in the
Annual National
Assessment (ANA)
52 531 58 614 44 660 -13 954 The ANA testing programme is
characterised by both inner
inconsistencies i.e. between
grades and the fact that
teachers and learners still need
to learn what is tested and how
it is tested. The assessment is
done by teachers and then
subject to a sample moderation
so it is not yet possible to make
reliable predictions on numbers.
Thus one cannot yet claim
either success or failure in terms
of scores. These indicators will
be studied as the testing settles
down and schools and learners
master the elements of the tests.

Annual Report for 2013/14 Financial Year
Vote 5: Department of Education
Province of the Western Cape
105
Programme 9
Programme
Performance Measure
Ac
tua
l Ac
hie
ve
me
nt
2012
/2013
Pla
nn
ed
Targ
et
2013
/2014
Ac
tua
l Ac
hie
ve
me
nt
2013
/2014
De
via
tion
from
pla
nn
ed
targ
et to
Ac
tua
l
Ac
hie
ve
me
nt fo
r
2013
/2014
Comment on deviations
► PPM907: Number
of Grade 3 learners
who passed Maths in
the Annual National
Assessment (ANA)
35 294 42 474 53 171 10 697 The ANA testing programme is
characterised by both inner
inconsistencies i.e. between
grades and the fact that
teachers and learners still need
to learn what is tested and how
it is tested. The assessment is
done by teachers and then
subject to a sample moderation
so it is not yet possible to make
reliable predictions on numbers.
Thus one cannot yet claim
either success or failure in terms
of scores. These indicators will
be studied as the testing settles
down and schools and learners
master the elements of the tests.
► PPM908: Number
of Grade 6 learners
who passed
Language in the
Annual National
Assessment (ANA)
30 252 40 903 44 549 3 646 The ANA testing programme is
characterised by both inner
inconsistencies i.e. between
grades and the fact that
teachers and learners still need
to learn what is tested and how
it is tested. The assessment is
done by teachers and then
subject to a sample moderation
so it is not yet possible to make
reliable predictions on numbers.
Thus one cannot yet claim
either success or failure in terms
of scores. These indicators will
be studied as the testing settles
down and schools and learners
master the elements of the tests.

Annual Report for 2013/14 Financial Year
Vote 5: Department of Education
Province of the Western Cape
106
Programme 9
Programme
Performance Measure
Ac
tua
l Ac
hie
ve
me
nt
2012
/2013
Pla
nn
ed
Targ
et
2013
/2014
Ac
tua
l Ac
hie
ve
me
nt
2013
/2014
De
via
tion
from
pla
nn
ed
targ
et to
Ac
tua
l
Ac
hie
ve
me
nt fo
r
2013
/2014
Comment on deviations
► PPM909: Number
of Grade 6 learners
who passed Maths in
the Annual National
Assessment (ANA)
14 406 17 140 27 396 10 256 The ANA testing programme is
characterised by both inner
inconsistencies i.e. between
grades and the fact that
teachers and learners still need
to learn what is tested and how
it is tested. The assessment is
done by teachers and then
subject to a sample moderation
so it is not yet possible to make
reliable predictions on numbers.
Thus one cannot yet claim
either success or failure in terms
of scores. These indicators will
be studied as the testing settles
down and schools and learners
master the elements of the tests.
► PPM910: Number
of Grade 9 learners
who passed
Language in the
Annual National
Assessment (ANA)
28 997 43 169 26 175 -16 994 The ANA testing programme is
characterised by both inner
inconsistencies i.e. between
grades and the fact that
teachers and learners still need
to learn what is tested and how
it is tested. The assessment is
done by teachers and then
subject to a sample moderation
so it is not yet possible to make
reliable predictions on numbers.
Thus one cannot yet claim
either success or failure in terms
of scores. These indicators will
be studied as the testing settles
down and schools and learners
master the elements of the tests.

Annual Report for 2013/14 Financial Year
Vote 5: Department of Education
Province of the Western Cape
107
Programme 9
Programme
Performance Measure
Ac
tua
l Ac
hie
ve
me
nt
2012
/2013
Pla
nn
ed
Targ
et
2013
/2014
Ac
tua
l Ac
hie
ve
me
nt
2013
/2014
De
via
tion
from
pla
nn
ed
targ
et to
Ac
tua
l
Ac
hie
ve
me
nt fo
r
2013
/2014
Comment on deviations
► PPM911: Number
of Grade 9 learners
who passed Maths in
the Annual National
Assessment (ANA)
3 751 8 721 5 291 -3 430 The ANA testing programme is
characterised by both inner
inconsistencies i.e. between
grades and the fact that
teachers and learners still need
to learn what is tested and how
it is tested. The assessment is
done by teachers and then
subject to a sample moderation
so it is not yet possible to make
reliable predictions on numbers.
Thus one cannot yet claim
either success or failure in terms
of scores. These indicators will
be studied as the testing settles
down and schools and learners
master the elements of the tests.
Performance indicators
Programme 9
Programme
Performance Indicator
Ac
tua
l Ac
hie
ve
me
nt
2012
/2013
Pla
nn
ed
Targ
et
2013
/2014
Ac
tua
l Ac
hie
ve
me
nt
2013
/2014
De
via
tion
from
pla
nn
ed
targ
et to
Ac
tua
l
Ac
hie
ve
me
nt fo
r
2013
/2014
Comment on deviations
PPI 9.1: % of learners
in Grade 3 attaining
acceptable
outcomes in
Language
38.90% 40% 37% -3% While the target was not
reached it should be noted that
schools have been asked to
prepare learners to answer
certain questions in extended
writing and learners are working
hard to master this new
demand. A number of steps
have been taken to support this
process.
PPI 9.2: % of learners
in Grade 3 attaining
acceptable
outcomes in
Mathematics
51.50% 55% 55%

Annual Report for 2013/14 Financial Year
Vote 5: Department of Education
Province of the Western Cape
108
Programme 9
Programme
Performance Indicator
Ac
tua
l Ac
hie
ve
me
nt
2012
/2013
Pla
nn
ed
Targ
et
2013
/2014
Ac
tua
l Ac
hie
ve
me
nt
2013
/2014
De
via
tion
from
pla
nn
ed
targ
et to
Ac
tua
l
Ac
hie
ve
me
nt fo
r
2013
/2014
Comment on deviations
PPI 9.3: % of learners
in Grade 6 attaining
acceptable
outcomes in
Language
36.90% 37% 30% -7% While the target was not
reached it should be noted that
schools have been asked to
prepare learners to answer
certain questions in extended
writing and learners are working
hard to master this new
demand. A number of steps
have been taken to support this
process.
PPI 9.4: % of learners
in Grade 6 attaining
acceptable
outcomes in
Mathematics
26.40% 30% 28% -2% There is some improvement on
the preceding year but the
target was not reached despite
much support. Ongoing work is
required.
PPI 9.5: % of learners
in Grade 9 attaining
acceptable
outcomes in
Languages
48.20% 50% 48% -2% Learners did not reach the
target despite much support.
Ongoing work is required.
PPI 9.6.: % of learners
in Grade 9 attaining
acceptable
outcomes in
Mathematics
13.90% 15% 14% -1% This continues to be an area of
challenge and the
improvement since the
preceding year was minimal.
PPI 9.7: Schools with
a pass rate where
<60% pass the
National Senior
Certificate
26 10 23 -13 The programme of intervention
and support did not have the
fully desired effect.
PPI 9.8: National
Senior Certificate
pass rate
82.80% 83% 85.1% 2.1% The target was exceeded as a
result of the hard work of all
parties involved in the teaching
and learning programme and
the impact of the interventions
listed above.
PPI 9.9: % of learners
who qualify for
Bachelor’s degree
study
36.50% 37% 40.9% 3.9% The target was exceeded as a
result of the hard work of all
parties involved in the teaching
and learning programme and
the impact of the interventions
listed above.

Annual Report for 2013/14 Financial Year
Vote 5: Department of Education
Province of the Western Cape
109
Strategy to overcome areas of under performance
Training of principals in new assessment requirements
Improvements to marking of scripts
Ongoing use of data to support interventions
Continue with, and expand, the administration of competency tests for markers
Changes to planned targets
None
Linking performance with budgets
The expenditure incurred in Programme 9 contributed to achievement of the following key
outputs for the WCED:
Providing contract posts for examination markers
Sourcing and equipping examination marking centres
Printing and distributing examination papers
Implementing the ANA testing programme
Sub-programme expenditure
Sub- Programme Name 2013/2014 2012/2013
Final
Appro-
priation
Actual
Expen-
diture
(Over)/
Under
Expen-
diture
Final
Appro-
priation
Actual
Expen-
diture
(Over)/
Under
Expen-
diture
R’000 R’000 R’000 R’000 R’000 R’000
9.1 Payments to SETA 5,811 5,811 - 5,524 5,524 -
9.2 Professional Services 500,958 500,958 - 480,853 480,853 -
9.3 External Examinations 137,842 137,842 - 136,242 136,242 -
9.4 Conditional Grant 18,501 17,848 653 17,416 16,552 864
Total 663,112 662,459 653 640,035 639,171 864

Annual Report for 2013/14 Financial Year
Vote 5: Department of Education
Province of the Western Cape
110
5 TRANSFER PAYMENTS
5.1. Transfer payments to public entities
Not applicable
5.2. Transfer payments to all organisations other than public entities
Transfer payments are made to educational institutions in terms of the relevant Acts of
Parliament that govern them. For example, transfer payments are made to public ordinary
schools for norms and standards funding as set out in terms of the South African Schools Act,
1996 (Act No 84 of 1996). Annexure 1B of the annual financial statements provides a more
detailed explanation for each type of entity.
The Department applies Section 38(i)(j) of the Public Finance Management Act, 1999 (PFMA),
which requires educational institutions that receive transfer payments to prove that they are
spending the funds for the intended purpose. Here the relevant educational institutions have
to declare and sign a certificate before the next transfer payments are effected. Then, in
terms of the acts pertaining to the specific educational institutions, they are also responsible
to submit their audited financial statements to the department by a due date for review and
compliance.
Transfer payments are made to various educational institutions including public ordinary
schools and FET Colleges. In the case of FET colleges, where services are being rendered to
the WCED, a Memorandum of Agreement is entered into and roles and responsibilities are
clearly spelled out. There is regular reporting to the department in respect of financial
expenditure as well as service delivery aspects e.g. Training of ECD practitioners. Institutions
are audited annually by external and independent auditors.
Financial inspection of schools and other institutions is conducted by the School Corporate
Officers, based at districts. They verify whether declarations made by schools are a true
reflection of expenditure incurred. Districts monitor schools based upon a control risk
classification index i.e. low to high risk. Schools are evaluated by the district office before
Section 21 functions are assigned. Their allocated statuses are reviewed on a regular basis.
The re-election of School governing bodies(SGB) every three years presents a particular
challenge to the department. The financial management responsibility is that of the SGB. The
requirement that school principals should also play a role in the financial management of the
school, assists the department in monitoring. Financial management is a key subject covered
in the training content for new SGBs. Capacity building at school level is key to ensure
compliance in respect of conditions around transfer payments.

Annual Report for 2013/14 Financial Year
Vote 5: Department of Education
Province of the Western Cape
111
The table below reflects the transfer payments made for the period 1 April 2013 to 31 March 2014
Name of
transferee
Type of
organisation
Purpose for which
the funds were
used
Did the
dept.
comply
with s 38
(1) (j) of
the PFMA
Amount
transferred
(R’000)
Amount
spent by
the
entity
Reasons
for the
funds
unspent
by the
entity
Public Ordinary
School
Non Profit
Institutions Infrastructure
(maintenance and
upgrades)
YES 167,690 167,690 0
N&S: Additional
growth
YES 2,017 2,017 0
Boarding subsidy YES 33,877 33,877 0
Admin support YES 9,262 9,262 0
Conditional grant:
Social Sector EPWP
YES 3,898 3,898 0
Norms and
Standards
YES 520,360 520,360 0
Conditional grant:
NSNP
YES 32,056 32,056 0
Gr 3,6 and 9
testing and ANA
YES 17,897 17,897 0
Gr 12 awards YES 1,443 1,443 0
Compensation for
fee exemption
YES 42,668 42,668 0
Youth focus YES 18,524 18,524 0
Learner transport YES 36,101 36,101 0
Litnum awards YES 8,876 8,876 0
Private transport
subsidy
YES 3,523 3,523 0
Internet
connection
YES 17,608 17,608 0
Technical subjects YES 2,112 2,112 0
Matric exam
centres
YES 243 243 0
Safe schools
security
YES 23,453 23,453 0
Conditional grant:
Dinaledi /
Technical
Recapitalisation
YES 3,820 3,820 0
SGB memberships
and training
YES 287 287 0
NTAs and NCS FET
training
YES 3,114 3,114 0
Maths and
Science
YES 6,338 6,338 0
Independent
School
Subsidies
Non Profit
Institutions Subsidy YES 84,648 84,648 0

Annual Report for 2013/14 Financial Year
Vote 5: Department of Education
Province of the Western Cape
112
Name of
transferee
Type of
organisation
Purpose for which
the funds were
used
Did the
dept.
comply
with s 38
(1) (j) of
the PFMA
Amount
transferred
(R’000)
Amount
spent by
the
entity
Reasons
for the
funds
unspent
by the
entity
Public Special
School
Education
Non Profit
Institutions Subsidy YES 122,364 122,364 0
School textbooks YES 4,210 4,210 0
Learner transport YES 1,226 1,226 0
Infrastructure
upgrades
YES 3,140 3,140 0
Further
Education and
Training
Non Profit
Institutions Infrastructure
upgrades /
maintenance
YES 52,130 52,130 0
Subsidy YES 11,031 11,031 0
Adult Basic
Education and
Training
Non Profit
Institutions Subsidy YES 32,641 32,641 0
Early
Childhood
Development
Centres
Non Profit
Institutions Subsidy YES 276,840 276,840 0
Learner transport YES 413 413 0
Conditional grant:
Social Sector EPWP
YES 5,817 5,817 0
Pre-gr R stipends YES 56,990 56,990 0
The table below reflects the transfer payments which were budgeted for in the period 1 April 2013
to 31 March 2014, but no transfer payments were made.
Name of
transferee
Purpose for which
the funds were to
be used
Amount
budgeted for
(R’000)
Amount
transferred
(R’000)
Reasons why funds
were not transferred
None n/a n/a n/a n/a
6. CONDITIONAL GRANTS
6.1. Conditional grants and earmarked funds paid
Not applicable
6.2. Conditional grants and earmarked funds received
All the requirements according to the Division of Revenue Act, 2011, in respect of the above-
mentioned Conditional Grants were met:
All transfers received were deposited into the department’s bank account;
Funds were spent according to the business plans;
Conditions of the conditional grants, as set out in the approved Business Plans, were
met.
Monitoring
Monitoring of each of the grants was undertaken through monthly reporting, checks and site
visits by the relevant officials and controls and improvements were effected on an ongoing
basis. The procurement processes for the Technical Schools Recapitalisation Grant and the
Dinaledi Grant were centralised and time taken in each to these to ensure that all conditions

Annual Report for 2013/14 Financial Year
Vote 5: Department of Education
Province of the Western Cape
113
were being met and there was no wasteful expenditure, for example in cases where items or
training that were on the programme were not required by the schools concerned. The
measures resulted in some savings on the one hand and meant that some processes took
longer than anticipated on the other because of the range of quality controls in place.
The tables below detail the conditional grants and earmarked funds received during for the period 1
April 2013 to 31 March 2014.
Conditional Grant: Technical Secondary School Recapitalisation Grant
Department who transferred
the grant
Department of Basic Education
Purpose of the grant Recapitalization of Technical High Schools.
Expected outputs of the
grant
Building of new workshops.
Refurbishing or redesigning of existing workshops.
Supplying equipment, tools and machinery to workshops.
Training teachers in subject content.
Actual outputs achieved The construction of the new workshops is in progress and is scheduled
to be completed on 31 July 2014.
Refurbishing or redesigning of existing workshops.
The Tender for the supply of the equipment has been awarded
and the delivery date is 30 June 2014.
Training teachers in subject content.
Amount per amended
DORA
R11 884 million
Amount received (R’000) R13 898 million
Conditional Grant: Technical Secondary School Recapitalisation Grant
Reasons if amount as per
DORA was not received
N/a
Amount spent by the
department (R’000)
R3 717 million
Reasons for the funds
unspent by the entity
The tenders for the provisioning of ICT equipment to the schools
have been awarded but delivery could not be done by the end of
March 2014. Funds are committed and a roll-over was requested.
The Department of Transport and Public Works who are managing
the project for the Directorate Infrastructure Planning and
Management contracted a project management company to
manage the construction of mechanical and civil technology
workshops at two technical high schools. The sites were handed
over to the builder on 5 March 2014 and the construction is set for
completion on 31 May 2014.
The tender for the provisioning of the equipment to the Technical
Schools has been awarded. Delivery will take place in May.
Reasons for deviations on
performance
Tenders were awarded but could not be delivered by end March
2014
Measures taken to improve
performance
All requisitions for 2014/15 have been submitted to SCM for
procurement
Monitoring mechanism by
the receiving department
SCM has bi-weekly meetings with the Senior Managers for Curriculum
FET to ensure that tenders are on track.

Annual Report for 2013/14 Financial Year
Vote 5: Department of Education
Province of the Western Cape
114
Conditional Grant: Education Infrastructure Grant (EIG)
Department who transferred
the grant
Infrastructure Planning and Management
Purpose of the grant To maintain, refurbish, extend or create new infrastructure
Expected outputs of the
grant
To ensure that existing infrastructure condition is maintained as
prescribed by PFMA or to create additional capacity at educational
institutions as approved
Actual outputs achieved Maintenance of facilities and refurbishment / extension / addition of
various units / facilities
Amount per amended
DORA
R960 465 million
Amount received (R’000) R960 465 million
Reasons if amount as per
DORA was not received
N/a
Amount spent by the
department (R’000)
R821 831 million
Reasons for the funds
unspent by the entity
Unspent funds are committed for delays of ASIDI capital infrastructure
projects at public ordinary schools.
Reasons for deviations on
performance
None
Measures taken to improve
performance
Monthly Inter-Departmental meetings with DTPW
Monitoring mechanism by
the receiving department
Infrastructure Reporting Model (IRM) and monthly progress reports
from DTPW
Conditional Grant: HIV/AIDS (Life Skills Education) Grant
Department who transferred
the grant
Department of Basic Education
Purpose of the grant To support South Africa's HIV and AIDS prevention strategy by
increasing sexual and reproductive health knowledge, skills and
appropriate decision making amongst learners and educators.
To mitigate the impact of HIV/AIDS by providing a caring,
supportive and enabling environment for learners and educators.
To ensure the provision of a safe, rights based environment in
schools that is free of discrimination, stigma and any form of
sexual harassment or abuse.
To reduce the vulnerability of children to HIV/AIDS, TB and STI
infection, with a particular focus on orphaned and vulnerable
children.
Expected outputs of the
grant
Increased HIV, STIs and TB knowledge and skills among learners,
educators and officials
Decrease in risky sexual behaviour among learners, educators and
officials
Decrease barriers to retention in schools, in particular for
vulnerable children.
Decrease in risky sexual behaviour among learners, educators
and officials
Schools, districts and provinces have integrated all HIV and AIDS
Life Skills Education Programme into their co-work, evaluation and
reporting systems
Management, administration and support delivered to districts and
schools

Annual Report for 2013/14 Financial Year
Vote 5: Department of Education
Province of the Western Cape
115
Conditional Grant: HIV/AIDS (Life Skills Education) Grant
Actual outputs achieved All outputs achieved as per business plan. Roll-over of R863 934 (3,5%).
Amount per amended
DORA
R17 637 million
Amount received (R’000) R18 501 million
Reasons if amount as per
DORA was not received
N/a
Amount spent by the
department (R’000)
R17 848 million
Reasons for the funds
unspent by the entity
Unspent funds are committed for services rendered by
suppliers/contractors during 2013/14, but invoices were not submitted
in time for payment and thus not paid by 31 March 2014.
Reasons for deviations on
performance
None
Measures taken to improve
performance
All requisitions for 2014/15 were submitted for procurement prior to the
start of the financial year.
Monitoring mechanism by
the receiving department
Monthly, as well as quarterly reports are submitted to WCED
management for monitoring and sign-off purposes.
Conditional Grant: National School Nutrition Programme Grant
Department who transferred
the grant
Department of Basic Education (DBE)
Purpose of the grant To provide nutritious meals to learners
Expected outputs of the
grant
Nutritious meals served to learners
Actual outputs achieved Learners fed nutritious meals
Amount per amended
DORA
R260 538 million
Amount received (R’000) R265 103 million
Reasons if amount as per
DORA was not received
N/a
Amount spent by the
department (R’000)
R258 328 million
Reasons for the funds
unspent by the entity
Unspent funds are because of a milk pilot (provision of sachets of milk
for learners) that was due to be conducted early in the financial year.
Because of delays in sourcing the packaging material, the pilot was
delayed and only took place during November 2013.
Reasons for deviations on
performance
Delays in the implementation of the milk pilot.
Measures taken to improve
performance
Improving the submission rate of outstanding claims from service
providers to facilitate payment before the end of the financial year.
Monitoring mechanism by
the receiving department
NSNP Provincial office monitors the expenditure and district officials
monitor the programme on a daily basis

Annual Report for 2013/14 Financial Year
Vote 5: Department of Education
Province of the Western Cape
116
Conditional Grant: Dinaledi Schools
Department who
transferred the grant
Department of Basic Education
Purpose of the grant To improve the quality of learner performance in Mathematics,
Physical Sciences, Life Sciences and First Additional Language
(FAL) English, in line with the Action Plan to 2014
To improve the content knowledge, pedagogies and didactic skills of
Mathematics, Physical Sciences and Life Sciences teachers
Expected outputs of the
grant
Conduct a needs analysis at each Dinaledi school, and where
lacking, provide:
apparatus and consumables to schools that lack a functional
Sciences laboratory and assist schools with the acquisition of an
appropriate, dedicated physical structure where needed.
geometry sets and calculators
information and Communications Technology (ICT) hardware,
software, internet connectivity and a dedicated physical structure
access to appropriate educational TV broadcasts
content, didactic and pedagogic programmes to improve
teacher effectiveness
management training and/or mentoring for principals and School
Management Teams
co-curricular, additional preparation of Grade 8 -12 learners for
enhanced performance and participation in Olympiads and
increased access to Science Clubs, Science Fairs and
Competitions
clearly defined incentives for learners, teachers and/or schools
that achieve or exceed agreed upon performance targets
Actual outputs achieved Outputs achieved with the exception of the Physical and Life Sciences
apparatus and chemicals. The tender had to be re-advertised and
was only awarded in April 2014.
Amount per amended
DORA
R10 096 million
Amount received (R’000) R13 366 million
Reasons if amount as per
DORA was not received
N/a
Amount spent by the
department (R’000)
R11 868 million
Reasons for the funds
unspent by the entity
Science tenders were only awarded in April 2014.
Reasons for deviations on
performance
Science Tenders were awarded only in April 2014 because they had to
be re-advertised.
Measures taken to improve
performance
All requisitions for 2014/15 have been submitted for procurement prior
to the start of the financial year.
Monitoring mechanism by
the receiving department
SCM has bi-weekly meetings with the Senior Managers for Curriculum
FET to ensure that tenders are on track.

Annual Report for 2013/14 Financial Year
Vote 5: Department of Education
Province of the Western Cape
117
Conditional Grant: Further Education and Training Grant
Department who
transferred the grant
Department of Higher Education and Training (DHET)
Purpose of the grant To ensure the successful transfer of the FET college function to the
DHET Expected outputs of the
grant
Transfer of FET Colleges Management Staff to DHET finalised
Transfer of Non-Management Staff to DHET finalised
Secondment of Provincial Department of Education Staff to DHET
finalised
Transfer of Provincial Department of Education Staff to DHET
finalised
Post Provisioning Model for FET Colleges finalised
Implementation of the Funding Norms and Standards for FET
colleges
Implementation of the New Programme Cost for Funding FET
Colleges
Monitor the support of FET Colleges by PDE’s
Implementation of 37% in lieu of benefits for FET Colleges
Actual outputs achieved Transfer of FET Colleges Management Staff to DHET finalised
Transfer of Non-Management Staff to DHET finalised
Secondment of Provincial Department of Education Staff to DHET
finalised
Implementation of the Funding Norms and Standards for FET
colleges
Implementation of 37% in lieu of benefits for FET Colleges
Amount per amended
DORA
R353 097 million
Amount received (R’000) R353 097 million
Reasons if amount as per
DORA was not received
N/a
Amount spent by the
department (R’000)
R353 078 million
Reasons for the funds
unspent by the entity
Saving on compensation
Reasons for deviations on
performance
No deviation on provincial output performance
Measures taken to improve
performance
N/a
Monitoring mechanism by
the receiving department
Monthly and quarterly reports

Annual Report for 2013/14 Financial Year
Vote 5: Department of Education
Province of the Western Cape
118
Conditional Grant: EPWP Integrated Grant for Provinces – Education
Department who
transferred the grant
Department of Transport and Public Works
Purpose of the grant To create work opportunities for youth, women and the disabled in the
ECD sector.
Expected outputs of the
grant
Train 394 ECD practitioners in the field of Early Childhood
Development.
Train 22 previously unemployed matriculants to be data capturers
Actual outputs achieved 299 ECD practitioners were declared competent after the 12
month training course. Each practitioner attended a 12 month
ECD Level 1 course at one of the six FET Colleges in the province.
Each ECD practitioner also received training in First Aid
22 data capturers completed courses in office management,
Microsoft office, human resource management and project
management.
Amount per amended
DORA
R12 298 million
Amount received (R’000) R12 298 million
Reasons if amount as per
DORA was not received
Amount spent by the
department (R’000)
R12,064 million
Reasons for the funds
unspent by the entity
Invoices not received in time to be processed.
Reasons for deviations on
performance
Measures taken to improve
performance
Colleges to be notified weekly of any outstanding invoices.
Monitoring mechanism by
the receiving department
An external service provider was contracted to conduct the
monitoring of training offered by colleges. A monitoring report is on
file.
7. DONOR FUNDS
7.1. Donor Funds Received
The Department did not receive any donor funds during the reporting period.
8. CAPITAL INVESTMENT
8.1. Capital investment, maintenance and asset management plan
Building projects completed during 2013/14
New schools
No new school were handed over in 2013/14;
No mobile schools were completed for use in 2013/14.

Annual Report for 2013/14 Financial Year
Vote 5: Department of Education
Province of the Western Cape
119
Replacement schools (replacement of schools built of inappropriate materials)
The following Replacement Schools were completed in 2013/14: Formosa Primary School,
Pacaltsdorp Primary School, St. Thomas Primary School, Kathleen Murray Primary School,
Rusthof Primary School, Fairview Primary School and Plantation Road Primary School,
One upgrade and addition project was completed namely Bloekombos Primary School.
Additional classrooms
Expansion classrooms: 7 classrooms were built onto existing schools in order to allow for
increased enrolment.
Grade R classrooms: 11 classrooms were completed in 2013/14.
Mobile units provided: 175 classrooms.
The infrastructure that was scheduled for delivery in 2012/13 is set out below, alongside the
actual delivery figures.
Category Targeted Actual number
New Schools 4 0
Replacement schools 7 7
Grade R classrooms 65 11 classrooms
Upgrade and addition No targets set 1
Expansion Classrooms 7 classrooms
Mobile classrooms 175 classrooms
Variances in respect of targets is discussed under Programme 8, in relation to the Programme
Performance Measures. Some projects were delayed and alternative arrangements had to
be made for accommodation.
Capital Projects in construction
(a) New schools
The permanent schools that had originally been scheduled for completion by 31 March 2014,
viz. Concordia Primary School, Concordia High School, Silversands High School and Vuyiseka
High School are in various stages of construction or tender adjudication.
(b) Replacement Schools
As at 31 March 2014, the following replacement schools, initially scheduled for completion
during the 2013/14 financial year, were at different stages of construction: A.C.J. Phakade
Primary School, Garden Village Primary School, Itsitsa Primary School, Pineview Primary School
and Touwsranten Primary School. Added to these are the fourteen, first phase ASIDI projects
namely: Hawston Primary School, Willemsvallei Primary School, Knysna Secondary School,
Kasselsvlei Primary School, Parkview Primary School, Wesfleur Primary School, Sophakama
Primary School, Valhalla Primary School, Delta Primary School, Die Duine Primary School,
Sophumelela Secondary School, Portia Primary School, Kensington Secondary School and
Heideveld Primary School. These school are all currently in construction.

Annual Report for 2013/14 Financial Year
Vote 5: Department of Education
Province of the Western Cape
120
Expenditure is in keeping with industry norms. The department’s Implementing Agents
(Department of Transport and Public Works and the Project Implementation Unit) handle all
tender procedures on new buildings and projects in accordance with the Public Finance
Management Act and other regulatory prescripts.
Asset Management
Immoveable assets
The WCED uses the Education Management Information System (EMIS) and the Schools’
Register of Needs Information System (SRNIS) in managing immovable assets.
Major moveable assets
In respect of moveable assets, the WCED has an asset management unit which is part of the
Supply Chain Unit.
All furniture and equipment required for Head Office and the education district offices is
purchased centrally and captured on an inventory of moveable assets according to the
requirements prescribed by the National Treasury.
The following measures were put in place to ensure an asset register is available to maintain
accounting standards and ensure an effective, efficient and accurate reconciliation of
information:
Annual stocktaking done by the department, as prescribed in the Treasury Regulations.
Signing off of inventories by the responsible officials and certification by the Responsibility
Managers.
Issuing of circulars in line with Chapter 10 of Treasury Regulations.
Procurement procedures for assets in the Accounting Officer’s System.
Monthly reconciliation of purchases on LOGIS and the expenditure on BAS.
Maintenance of an asset register containing all the information required in Treasury
Regulations.
The mechanisms implemented to ensure an efficient system of identification, safeguarding,
monitoring and record-keeping of moveable assets were as follows:
Assets were bar-coded, marked “RSA” and recorded on inventories.
Assets were recorded in the moveable asset register in all asset categories and were
allocated unique numbers (bar codes).
Responsibility managers are responsible for the safeguarding of their assets.
Moveable assets were recorded on an inventory per cost centre and location. Inventories
were certified as correct by the cost centre managers and kept at each location.

Annual Report for 2013/14 Financial Year
Vote 5: Department of Education
Province of the Western Cape
121
Schools
The WCED purchased furniture and labour saving devices for schools. These items do not,
however, form part of the WCED Asset Register. In terms of the South African Schools Act,
1996 (Act No 84 of 1996), these are considered to be inventory items of the schools. Schools
must, therefore, report on these inventory items in their annual financial statements. The
WCED Asset Register reflects the inventories for Head Office and the education districts and
their respective service points.
Plans regarding moveable assets, such as motor vehicles
The Provincial Department of Transport and Public Works (Government Motor Transport)
manages the provision, withdrawal and replacement of old and/or damaged Government
Garage (GG) motor vehicles. It also formulates provincial policy with regard to the use of GG
vehicles and maintains an asset register on the Fleetman system. The WCED is responsible for
the licensing, maintenance and re-fuelling of the vehicles.
The WCED ensures that the provincial policy is applied. It also maintains a register of vehicles
in use by the WCED and monitors vehicle use by means of log sheets. The present fleet meets
the current needs of the WCED.
Maintenance
Major maintenance projects undertaken during the period under review include:
Number of
projects
Budget for 2012/13
R’000
Estimated final cost
R’000
108 R 92 650m R 92 650m
The 2013 U-AMP indicates the following under the heading of “User Condition Rating”
Condition
Status
General Description Rating
Excellent No apparent defects. Appearance is as new. Risk index: No
effect on service capability. No risk.
C5
Good Exhibits superficial wear and tear, minor defects and minor
signs of deterioration to surface finishes. Risk index:
Intermittent, minor inconvenience to operations. Probability of
risk to health and safety or property is slight. Low cost
implication.
C4
Fair In average condition, deteriorated surfaces require attention;
services are functional, but require attention, backlog
maintenance work exists. Risk index: Constant inconvenience
to operations. Some risk to health and safety or property.
Medium cost implications.
C3
Poor Has deteriorated badly, with serious structural problems. Poor
general appearance with eroded protective coatings;
elements are broken, services not performing; significant
number of major defects. Risk index: Major disruption to
service capability, high probability of risk to health and safety
or property. High cost implication/financial loss.
C2

Annual Report for 2013/14 Financial Year
Vote 5: Department of Education
Province of the Western Cape
122
Condition
Status
General Description Rating
Very Poor Has failed; not operational and unfit for occupancy. Risk
index: unusable, immediate high risk to security, health and
safety or property. Significant cost impact.
C1
Four hundred and eighty (480) public ordinary schools in the Western Cape have been rated
as “poor”. Leased schools and inappropriate structure schools (“plankie” schools) are
disproportionately represented in this category. Over the years very little scheduled
maintenance has been done by owners of leased properties. Property owners cite the low
rental tariffs as the main reason why proper maintenance on leased schools cannot be
executed. One thousand and twenty four (1024) schools are rated as “fair”. A bigger
proportion of these schools should be rated as “good” but the maintenance backlog on
these buildings has affected ratings.
Twenty one (21) public ordinary schools are rated as “C4”.
The condition of WCED buildings is deteriorating and will continue to deteriorate unless the
maintenance budget is increased or alternative models are adopted. The annual
requirement for maintenance is 1.5% of the value of the stock. Although scheduled
maintenance projects proceed according to plan, annual increases in costs impact on the
extent of what can be addressed. Hence, concerns about aging and deteriorating stock
remain.
A summary of the figures is presented below.
Maintenance Shortfall
Financial
Year
Asset
Value
1,5% Needed for
Maintenance
Budget
Provided
Shortfall
2004 10,560,000 158,400 73,719 84,681
2005 12,000,000 180,000 76,174 103,826
2006 12,000,000 180,000 90,037 89,963
2007 15,052,800 225,792 37,192 188,600
2008 15,052,800 225,792 52,363 173,429
2009 15,052,800 225,792 73,719 152,073
2010 17,357,885 260,368 102,363 158,005
2011 18,225,779 273,387 108,413 164,974
2012 18,225,779 273,387 114,725 158,662
2013 19,683,841 295,257 168,673 126,584
Total backlog since 2004 2,298,175

Annual Report for 2013/14 Financial Year
Vote 5: Department of Education
Province of the Western Cape
123
There was some impact on the backlog in 2012/13 and again in 2013/14. Because of the slow
expenditure on capital projects, a decision was taken to execute a list of projects, which
could not originally be included into the U-AMP because of budget priorities. Attention was
also given to the planning of the 2014/15 scheduled maintenance projects in order to get a
better start on scheduled maintenance expenditure in the 2014/15 financial year. The
planning of 39 capital projects was initiated in 2013/14 in order to expedite the execution of
projects in future years.
Infrastructure Projects
2013/2014 2012/2013
Final
Appro-
priation
Actual
Expen-
diture
(Over)/
Under
Expen-
diture
Final
Appro-
priation
Actual
Expen-
diture
(Over)/
Under
Expen-
diture
R’000 R’000 R’000 R’000 R’000 R’000
New and replacement
assets 778,999 640,365 138,634 343,287 343,287 0
Existing infrastructure assets 271,012 271,012 0 357,882 317,567 40,315
Upgrades and additions 41,041 41,041 0 134,119 129,189 4,930
Rehabilitation,
renovations and
refurbishments
7,213 7,213 0 35,875 35,875 0
Maintenance and
repairs 225,758 225,758 0 187,888 152,503 35,385
Infrastructure transfer 142,935 142,935 0 89,818 89,818 0
- Current 62,250 62,250 0 42,350 42,350 0
- Capital 80,685 80,685 0 47,468 47,468 0
Total 1,192,946 1,054,312 138,634 790,987 750,672 40,315


124
1. INTRODUCTION
Commitment by the department to maintain the highest standards of governance is
fundamental to the management of public finances and resources. Users want assurance
that the department has good governance structures in place to effectively, efficiently and
economically utilize the state resources, which is funded by the tax payer.
The Department is served by the Education Audit Committee, and all members are
independent members, appointed by the Accounting Officer in consultation with the
Executive Authority. The Audit committee operates in accord with a “Terms of Reference”,
approved on 18 July 2012.
The Audit Committee meets at least on a quarterly basis to give effect to its responsibilities as
per the approved Terms of Reference. The Audit Committee further meets with the Executive
Authority and Accounting Officer to discuss matters of concern.
Internal Audit continued to be offered independently by the shared Internal Audit Activity
that was corporatised to the Corporate Services Centre in the Department of the Premier.
In line with the Public Finance Management Act, 1999 (Act No 1 of 1999) (PFMA) and KING III,
the Internal Audit Activity provides the Audit Committee and management with assurance
that the internal controls relating to governance, risk management and control processes are
adequate and effective. Consistent with the PFMA and King III, a risk-based 3-Year Rolling
Strategic and Annual Operational Internal Audit Plan was approved by the Audit Committee,
and the Audit Committee monitored the execution of the operational plan and
management’s implementation of corrective actions.
In 2013, a new directorate which reports directly to the Head of Department, was established
to provide the Internal Control Unit for the WCED. Its mandate includes providing strategic
management, guidance and advice in respect of internal control practices. Elements are:
1. Ensure proper governance – co-ordinate and maintain appropriate delegation and
governance framework, ensure implementation of corrective controls, ensure the
implementation and maintenance of an integrated Loss Control System, report, quarterly
and annually on the status of the response to the FIU-reports
2. Render an assurance service – report matters to the Audit Committee, facilitate the
External and Internal audit, manage the post-auditing process
3. Regulatory, policy, governance frameworks and tactical advice - develop tools and
techniques, provide advice on strategy, policy documents.
Internal Audit continues to recognise the role played by other assurance providers and
envisage a combined assurance approach for the next year which will ensure that internal
audit resources are applied to the most relevant risk areas.
All officials are held accountable through job descriptions and performance agreements.
Head Office officials are held responsible for timeous and expert support to districts. Schools
and districts are held accountable for support to schools and the performance of learners.
Teacher and learner attendance and optimal use of the school day were key focus areas.
Accountability at the school level was strengthened from 2011 through the Western Cape
Provincial School Education Amendment Act No 7 of 2010, which came into effect in
January 2011.

125
Accountability is extended through the oversight roles played by Provincial and National
Treasury in terms of the mandatory elements of the planning and reporting cycles and which
cover both financial and non-financial matters. Reporting intervals are monthly (e.g.
financial), quarterly or annual. All sections within the WCED have counterpart sections at the
Department of Basic Education or Department of Higher Education and Training through
which streams of reporting, performance analyses and projections are maintained. The
Department of the Premier exercises an oversight function on key WCED projects. Both
Internal and External Audit processes additionally govern controls and assist in assuring
functionality and prudent management.
Substantive accountability resides in the formal relationship between the WCED and
UMALUSI, the national quality assurance body for learning outcomes. This relationship is
predicated on internal moderation of assessment processes and the provision of an
acceptable examination process.
In common with all government departments countrywide, the WCED participated in a
monitoring innovation of the Presidency, the Management Performance Assessment Tool
(MPAT) that studied the 4 areas of governance, namely Strategic Planning, HR, Governance
and Accountability and Financial Management. The exercise was a valuable one.
Whole School Evaluation continues to give valuable insights not only into the support needs
at individual schools but also into systemic issues. Shorter visits were conducted at small
schools or those that were functioning optimally. Differentiation in the length of visits has
allowed for additional schools to be visited. Schools are coded according to the WSE ratings.
The findings were shared in trend reports in addition to the extensive reports provided to the
schools concerned.
In February 2013 and again in 2014, all schools completed online School Improvement Plans
(SIPs), with targets for 3 years, for academic performance; management efficiencies (such as
teacher and learner absenteeism and academic planning); resourcing and maintenance.
The indicators correspond with national targets under Action Plan 2014 and match the 9
focus areas of whole school evaluation. The value of an improvement plan like this is that all
schools are focused on driving key improvement interventions. The SIP also forms part of the
accountability system, since signatories to the plan include the principal, the SGB and the
WCED. In 2014, schools also provided Action Plans to specify steps they would take to meet
the targets set.
In 2013 quarterly School Improvement Monitoring, by which key aspects of resourcing and
school functionality e.g. SGB elections, preparedness for the new year was conducted.
Because the reports were captured online, the data could be drawn and used to improve
support. In particular, for example, the data enabled the WCED to keep abreast of deliveries
of workbooks.
2. RISK MANAGEMENT
The Accounting Officer (AO) for the Western Cape Education Department (WCED) takes
responsibility for implementing Enterprise Risk Management (ERM) in accordance with the
National Treasury Public Sector Risk Management Framework (NTPSRMF) and the Directorate
Enterprise Risk Management (D:ERM) in the Department of the Premier (DoTP) provides a
centralised strategic support service to the Department.

126
In compliance with the National Treasury Public Sector Risk Management Framework
(NTPSRMF) and to further embed risk management within the Department, the Western Cape
Government (WCG) has adopted an ERM Policy which sets out the WCG’s overall intention
with regard to ERM.
An Annual ERM Implementation Strategy has been developed in order to give effect to the
WCG ERM policy and to attain the Annual Enterprise Risk Management Implementation Plan
and the risk management priorities of the WCED. This enables the Department to deliver on its
Departmental goals, objectives and key performance indicators, enhance risk informed
decision making and optimise compliance with applicable legislation. It further outlines the
roles and responsibilities of managers and staff in embedding risk management in the
Department and defines the enabling legislation, standards, mechanisms, tools and resources
to be used to realise the ERM plan.
The Western Cape Education Department Risk Management Committee or the Executive
Committee provides governance oversight over the entire system of risk management of the
Department and furnishes the Accounting Officer with the requisite reports in respect of
performance of risk management. The Audit Committee provides the independent oversight
of the Department’s system of risk management. The Audit Committee is furnished with
Quarterly ERM progress reports and departmental risk profiles and registers to execute their
independent oversight role. The Audit Committee’s evaluation of the risk management
process is in relation to the progress of implementation of the Departments Annual ERM
Implementation Plan and significant/strategic risks faced by the Department and their
relevant risk response/treatment strategies.
Risk Management Committee
The Western Cape Education Department has established a Risk Management Committee to
assist the Accounting Officer in executing her respective responsibilities concerned with risk
management. The committee operates under the terms of reference approved by the
Accounting Officer. The Committee comprises of the members of the Department’s
Executive Committee. As per its terms of reference the Committee should meet five times a
year.
The Committee meetings during the financial year under review were attended as follows:
Member Position Scheduled
Meetings
Attended
Ms. P. Vinjevold SG: Education 4 3
Mr. L. Ely DDG: Finance 4 3
Ms. M. Harker DDG: Education Planning 4 3
Mr. B. Schreuder DDG: Curriculum and Assessment
Management
4 3
Mr. J. Lyners DDG: Institutional Development
and Coordination
4 3
Mr. I. Carolus CD: People Management
Practices
4 3

Annual Report for 2013/14 Financial Year
Vote 5: Department of Education
Province of the Western Cape
127
Risk management process
During the period under review, WCED assessed its risks relative to its strategic and annual
performance plan. Risk assessments are conducted on a strategic level on an annual basis
and updated quarterly. At a programme level, the risk assessments are conducted on a
quarterly basis in order to review and update the existing risks and to identify emerging risks.
Significant risks relevant to objectives were assessed in terms of its likelihood and impact; risk
treatment plans are developed and managed by allocated risk owners. Programme risk
registers are approved by the respective programme manager.
The Risk Management Committee ratifies, prioritises and further recommends to the
Accounting Officer, which significant risks are mitigated with an appropriate risk
response/treatment in order to meet the departmental strategic objectives and this process is
conducted on a quarterly basis.
Impact on institutional performance
Enterprise risk management has become an important activity of the senior management of
the department, especially at the Executive level (EXCO). The risk champion is part of EXCO.
The continued awareness of systemic risks and the focus on mitigation has contributed to
better service delivery to a varied degree. The maturity in terms of risk management has
improved over the period. Improved attention to risk management will receive the necessary
ongoing attention.
3. FRAUD AND CORRUPTION
The Western Cape Government adopted an Anti-Corruption Strategy which confirms the
Province’s zero tolerance stance towards fraud and corruption. The Department has an
approved Fraud Prevention Plan and a Fraud Prevention Implementation plan which gives
effect to the Fraud Prevention Plan.
Various channels for reporting allegations of fraud and corruption exist and these are
described in detail in the Provincial Anti-Corruption Strategy and the Departmental Fraud
Prevention Plan. Each allegation received by the Forensic Investigation Unit is recorded in a
Case Management System which is used as a management tool to report on progress made
with cases relating to the department and generating statistics for the Province and
Department. We protect employees who blow the whistle on suspicions of fraud, corruption
and theft if the disclosure is a protected disclosure (i.e. not malicious). The opportunity to
remain anonymous is afforded to any person who would like to report acts of fraud, theft and
corruption and should they do so in person, their identities are kept confidential by the person
to whom they are reporting.
Once fraud or corruption is confirmed after completion of an investigation, the relevant
employee who participated in these acts is subjected to a disciplinary hearing. In all such
instances, the WCG representative initiating the disciplinary proceedings is required to
recommend dismissal of the employee concerned. Where prima facie evidence of criminal
conduct is detected, a criminal matter is reported at the South African Police Services.

Annual Report for 2013/14 Financial Year
Vote 5: Department of Education
Province of the Western Cape
128
During this financial year, 53 investigations were completed by the Forensic Investigation Unit
whilst 21 matters were referred to the Department for an internal investigation. Twenty (20)
investigations confirmed Fraud or Corruption, 9 investigations confirmed Irregularities and/or
Non-Compliance, 1 investigation confirmed Theft, 2 investigations indicated that there was
no Fraud, Corruption or Irregularity and in 21 instances the preliminary investigation did not
confirm the allegation of Fraud, Theft or Corruption. At the end of the financial year, 28
matters remained on the case list of the Department.
4. MINIMISING CONFLICT OF INTEREST
Annually, or as circumstances change, members of the senior management service have to
complete and submit a declaration of ‘No conflict of Interest’. All Bid Committee members
and all staff in Supply Chain Management are required to declare any conflict of interest. The
Department requires all bidders to declare potential relationships with the employer or
employees. The Audit Committee members also have to submit a declaration of ‘No conflict
of Interest’
5. CODE OF CONDUCT
The department is adhering to the Public Service Code of Conduct.
The Policy on the Acceptance of Gifts by Office-based Officials of the Western Cape
Education Department was finalised on 27 March 2013. The policy deals with, among others,
general guidelines, the Gift Register, procedures for the completion of Declaration Forms,
Frequently Asked Questions and a Gift Register template Policy.
6. HEALTH SAFETY AND ENVIRONMENTAL ISSUES
Safety of learners and educators at schools is a major challenge and the Department has
formed partnerships with other relevant provincial departments to deal with the issue.
Community involvement remains a key aspect in the fight against violence that affects some
of our high-risk schools. The Department also has CCTV cameras in certain schools to enable
school principals to monitor activity.
7. PORTFOLIO COMMITTEES
Not applicable
8. SCOPA RESOLUTIONS
The Committee noted the Auditor-General’s audit opinion regarding the Department’s
Annual Financial Statements, being financially unqualified with findings of compliance with
laws and regulations relating to procurement and contract management and expenditure
management, and that this represented an improvement from the 2011/12 qualified audit
opinion with findings.
The Committee congratulated the Department on the progress it has made in this regard,
towards its commitment of achieving a clean audit in 2014 and beyond. To achieve this

Annual Report for 2013/14 Financial Year
Vote 5: Department of Education
Province of the Western Cape
129
commitment and to avoid a regression in the audit outcome, the Department should
urgently and sustainably address all matters raised by the Auditor-General, the Audit
Committee and this Committee.
The Committee took cognisance of the fact that 25% of High Risk Areas were covered by
Internal Audit, compared to 40 % last year, and further noted that of the 15 internal audits
approved for auditing during the financial year, 13 were actually completed.
The SCOPA Resolutions for the financial year as tabled are below.
Root cause of
problem
SCOPA
Resolution
Action taken on
SCOPA Resolutions
including associated
costs
Impact on future
financial years
Pages: 113
(paragraph 7) and
175 of the Annual
Report (SCOPA
Resolutions)
Description:
The Committee
noted the new
policy on Irregular,
Fruitless and
Wasteful
Expenditure which
was drafted and
implemented by
the Department
during the 2011/12
financial year, with
the aim of
decreasing future
irregular
expenditure.
The Committee agreed
that:
1. The Department
should brief the
Committee on the
content of the
Policy Circular (No 5
of 2013), the
implementation
thereof and all
successes/challeng
es experienced
during the
implementation
process.
The WCED issued the
policy in 2013 and
presented training to
all Loss Control
Officers during
February and March
2013.
None
Page: 113 of the
Annual Report
(paragraph 5)
Heading: “3.6.
Internal audit
function”
Description:
The Committee
noted with concern
that further audit
coverage was
required to cover a
significant
percentage of high
risk areas in the
Department.
2. The Department
should brief the
Committee on the
extent of the audit
coverage
(including the risk
based internal audit
plan) during the
2012/13 financial
year and the
successes/
challenges
experienced,
especially relating
to the strategic high
risk areas, such as:
Action date to be
scheduled by
SCOPA
None
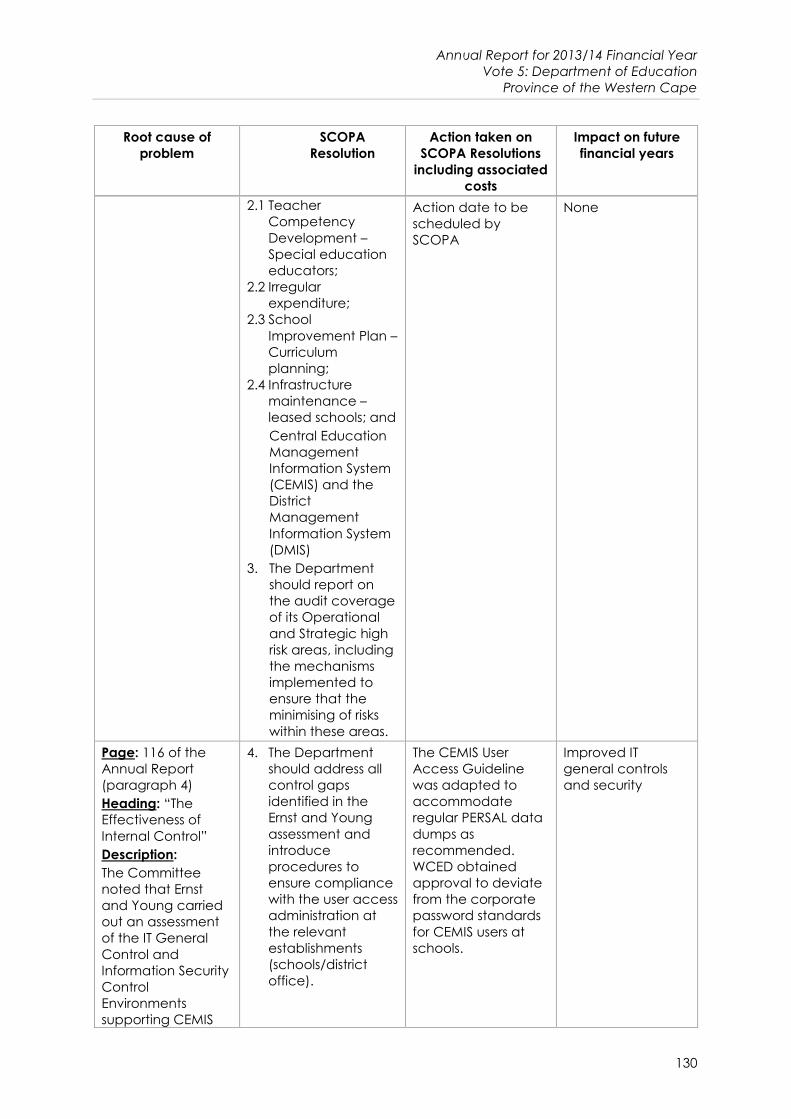
Annual Report for 2013/14 Financial Year
Vote 5: Department of Education
Province of the Western Cape
130
Root cause of
problem
SCOPA
Resolution
Action taken on
SCOPA Resolutions
including associated
costs
Impact on future
financial years
2.1 Teacher
Competency
Development –
Special education
educators;
2.2 Irregular
expenditure;
2.3 School
Improvement Plan –
Curriculum
planning;
2.4 Infrastructure
maintenance –
leased schools; and
Central Education
Management
Information System
(CEMIS) and the
District
Management
Information System
(DMIS)
3. The Department
should report on
the audit coverage
of its Operational
and Strategic high
risk areas, including
the mechanisms
implemented to
ensure that the
minimising of risks
within these areas.
Action date to be
scheduled by
SCOPA
None
Page: 116 of the
Annual Report
(paragraph 4)
Heading: “The
Effectiveness of
Internal Control”
Description:
The Committee
noted that Ernst
and Young carried
out an assessment
of the IT General
Control and
Information Security
Control
Environments
supporting CEMIS
4. The Department
should address all
control gaps
identified in the
Ernst and Young
assessment and
introduce
procedures to
ensure compliance
with the user access
administration at
the relevant
establishments
(schools/district
office).
The CEMIS User
Access Guideline
was adapted to
accommodate
regular PERSAL data
dumps as
recommended.
WCED obtained
approval to deviate
from the corporate
password standards
for CEMIS users at
schools.
Improved IT
general controls
and security

Annual Report for 2013/14 Financial Year
Vote 5: Department of Education
Province of the Western Cape
131
Root cause of
problem
SCOPA
Resolution
Action taken on
SCOPA Resolutions
including associated
costs
Impact on future
financial years
(Control Education
Management
Information System)
and DMIS (District
Information
Management
System), and that
significant control
gaps were
identified. The
Committee noted
that management
designed controls
to manage users’
access to the CEMIS
application in the
form of a
documented and
approved user
account
management
procedure.
Page: 156 of the
Annual Report
(paragraph 1)
Heading: “General
review of the state
of affairs”
Description:
The Committee
noted the Audit
Committee’s
concerns regarding
Emerging Risks, over
and above those
reported by the
Auditor-General,
and that these risks
were included in
the Risk Plan and
are part of the
Internal Audit Plan.
5. The Department
should report on the
financial
implications of the
registered PILIR
(Policy on
Incapacity Leave
and Ill Health
Retirement) cases,
detailing the
mechanisms
introduced to
ensure that these
cases are minimised
in future.
6. The Department
should ensure that it
complies with
policies and
procedures on
incapacity leave
for ill-health
retirement (PILIR).
In accordance with
the Departmental
policy, a substitute
institutional based
educator can be
appointed when the
period of absence of
the permanent
incumbent is more
than 10 working
days. This implies
that in the case of
the temporary
incapacity of an
educator for more
than 10 working
days, in accordance
with the PILIR
prescripts, a
substitute may be
appointed.
Temporary
incapacity leave is,
in accordance with
the PILIR prescripts,
approved
provisionally with full
pay. A final decision
regarding the

Annual Report for 2013/14 Financial Year
Vote 5: Department of Education
Province of the Western Cape
132
Root cause of
problem
SCOPA
Resolution
Action taken on
SCOPA Resolutions
including associated
costs
Impact on future
financial years
payment conditions
is only made when
the
recommendation
from the Health Risk
Manager is
received. The exact
financial implications
for the 2012/2013
Financial year
cannot be made
since the entire
Public Service of
South Africa was
without the services
of a Health Risk
Manager for the
period 1 January
2013 till 31 October
2013. To date the
Minister for Public
Service and
Administration has
not yet issued a
directive how these
cases received
during the afore-
mentions period
should be handled.
In order to streamline
the management of
PILIR cases, the
WCED concluded a
Collective
Agreement with the
Educator Unions in
December 2011.A
new Health Risk
Manager has been
appointed with
effect from
1 November 2013
with whom the
WCED has regular
meetings to ensure
compliance with the
policy. The People
Management Prac-
tices component of
the WCED also have
regular internal

Annual Report for 2013/14 Financial Year
Vote 5: Department of Education
Province of the Western Cape
133
Root cause of
problem
SCOPA
Resolution
Action taken on
SCOPA Resolutions
including associated
costs
Impact on future
financial years
meetings as well as
regular meetings
with Educator Unions
to ensure
compliance with the
prescripts.
The WCED ensures
that it complies with
all the prescripts in
respect of PILIR.
Page: 164 of the
Annual Report
Heading: “SCOPA
resolutions”
Description:
The Committee
thanked the
Department for
publishing its
resolutions, and
actions taken in this
regard, in its Annual
Report, but noted
that this was not an
accurate reflection
of the oversight role
exercised by the
Committee, in the
year under review.
7. The Department
should publish the
Committee’s
opening comments
specific to this
Department, this
table of resolutions
and the list of
information
requested by the
Committee, in all
future Annual
Reports.
Ongoing, and
starting with the
publishing of the
Departments
2013/14 Annual
Report
None
Page: 181 of the
Annual Report.
Heading:
“Overpayment:
Ministerial driver”
Description:
The Committee
noted that the
Department was
coordinating
investigations into
the overpayment of
the ministerial
drivers of various
Departments dating
back a number of
years, and that
these
overpayments were
deemed, by the
Department, to be
8. The Department
should brief the
Committee on
progress achieved
and/or the
outcomes of these
investigations.
The outcome of the
investigation
revealed that no
debt existed and
therefore no
potential
overpayment
occurred.
None

Annual Report for 2013/14 Financial Year
Vote 5: Department of Education
Province of the Western Cape
134
Root cause of
problem
SCOPA
Resolution
Action taken on
SCOPA Resolutions
including associated
costs
Impact on future
financial years
immaterial to the
Annual Financial
Statements.
Page: 186 of the
Annual Report
Heading:
“Achievement of
planned targets
(notes 20 and 21)”
Description:
The Committee
noted the
comments of the
Auditor-General
that of the total
number of 56
targets planned for
the year, 21 targets
were not fully
achieved during
the year under
review. This
represented 37% of
total planned
targets that were
not achieved
during the year
under review. This
was disclosed in
pages 26 - 91 of the
Annual Report.
This was mainly due
to the fact that a
number of the
indicators are
population-based
and depend on
variables that are
demand driven,
which makes it
difficult to
determine
accurate targets,
other than using
prior periods’ data
as a predictive
target. In other
instances the
measures were
directly linked to the
population growth
9. This matter should
be referred to the
relevant Standing
Committee for
further monitoring
and evaluation with
the Department.
Ongoing, and as
scheduled by the
relevant Standing
Committee
The situation is likely
to continue in the
case of the
population-based
indicators as long
as the
“achievement” is
defined as being a
100% correlation
between target
and actual in, for
example, learner
numbers etc.
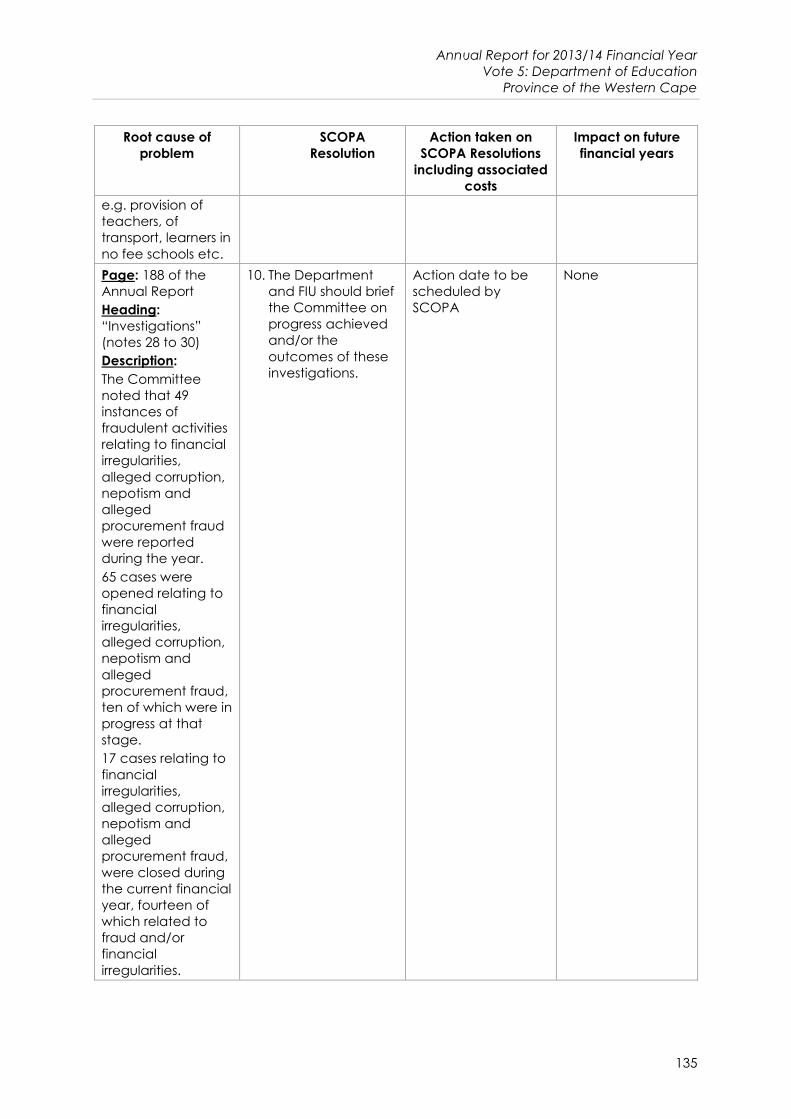
Annual Report for 2013/14 Financial Year
Vote 5: Department of Education
Province of the Western Cape
135
Root cause of
problem
SCOPA
Resolution
Action taken on
SCOPA Resolutions
including associated
costs
Impact on future
financial years
e.g. provision of
teachers, of
transport, learners in
no fee schools etc.
Page: 188 of the
Annual Report
Heading:
“Investigations”
(notes 28 to 30)
Description:
The Committee
noted that 49
instances of
fraudulent activities
relating to financial
irregularities,
alleged corruption,
nepotism and
alleged
procurement fraud
were reported
during the year.
65 cases were
opened relating to
financial
irregularities,
alleged corruption,
nepotism and
alleged
procurement fraud,
ten of which were in
progress at that
stage.
17 cases relating to
financial
irregularities,
alleged corruption,
nepotism and
alleged
procurement fraud,
were closed during
the current financial
year, fourteen of
which related to
fraud and/or
financial
irregularities.
10. The Department
and FIU should brief
the Committee on
progress achieved
and/or the
outcomes of these
investigations.
Action date to be
scheduled by
SCOPA
None

Annual Report for 2013/14 Financial Year
Vote 5: Department of Education
Province of the Western Cape
136
Root cause of
problem
SCOPA
Resolution
Action taken on
SCOPA Resolutions
including associated
costs
Impact on future
financial years
Page: 188 of the
Annual Report
(paragraph 27)
Heading: “Financial
and Performance
Management”
Description:
The Committee
noted the Auditor-
General’s finding
that goods and
services with a
transaction value
below R500 000
were procured
without obtaining
the required price
quotations, as
required by Treasury
Regulation 16A6.1.
This was a repeat
finding from the
previous year and
processes
implemented to
address
recommendations
made in this regard
in the previous
year’s
Management
Report were only
done during the
second half of the
financial year under
review.
11. The Department
should review and
monitor
compliance with
SCM laws and
regulations for the
procurement of
goods between
R10,000 and
R500,000.
12. The Department
should implement
mechanisms to
ensure that districts
are SCM compliant.
To minimize non-
compliance, the
department
implemented the
following measures:
Appointed Supply
Chain Champions in
all offices that were
trained in SCM
regulations;
Implementation of
electronic
procurement system;
The department
introduced a
payment check list
that must be
certified by the
authoriser of the
payment that
legislative and
procurement
prescripts have been
adhered to; and
Established an
Internal Control Unit
to conduct a post-
audit on all
payments.
None
Page: 213 of the
Annual Report
Heading: “5.8
Impairment”
Description:
SCOPA noted that
the Audit
Committee has
discussed the
Management
Report with the
Auditor-General
and the
Departmental
13. The Department
should brief the
Committee on the
corrective steps
taken to address
material
Impairments
relating to
Receivables.
The Debt Policy of
the WCED was
amended to provide
for the definition for
Impairments.
None

Annual Report for 2013/14 Financial Year
Vote 5: Department of Education
Province of the Western Cape
137
Root cause of
problem
SCOPA
Resolution
Action taken on
SCOPA Resolutions
including associated
costs
Impact on future
financial years
management
team.
In particular the
Audit Committee
noted the material
impairment relating
to receivables.
Steps have been
taken by the Audit
Committee to
follow up on what
Management has
committed to.
Page: 222 of the
Annual Report
Heading:
“Explanation note
1”
Description:
The Committee
noted with concern
that the
Department
incurred an over
payment
amounting to R52,
652 million to
Bonitas Medical
Scheme during
March 2013.
The refund, how-
ever, was received
on 10 April 2013.
14. The Department
should brief the
Committee on the
internal control
mechanisms
implemented to
ensure that any
erroneous/double
payments are
detected and
prevented.
The Provincial
Treasury instituted an
additional step for
the departments to
confirm the amounts
that needs to be
transferred to
institutions. This form
is signed off by the
Director or his
Deputy at the
Finance Branch.
None
Page: 224 of the
Annual Report
Heading:
“Commitments”
Description:
The Department’s
expenditure was
contained within
the approved
budget. However,
this is due mainly to
an under-spending
of voted funds in
programmes 1 and
8 rather than
savings.
15. The Department
should implement
mechanisms to
detect under
spending earlier.
The department
implemented the
following measures: -
Procurement
planning earlier in
the financial year,
monthly monitoring
of expenditure and
feedback from
responsibility
manager;
Responsibility
manager to provide
feedback mid-
financial year of
None

Annual Report for 2013/14 Financial Year
Vote 5: Department of Education
Province of the Western Cape
138
Root cause of
problem
SCOPA
Resolution
Action taken on
SCOPA Resolutions
including associated
costs
Impact on future
financial years
possible
underspending due
to various reasons;
and
Application of
virement within vote
for additional needs
somewhere else in
department.
9. PRIOR MODIFICATIONS TO AUDIT REPORTS
The department prepares a Financial Management Improvement Plan (FMIP) that focuses on
the matters of non-compliance raised by the Auditor-General. This plan is quality assured and
the Auditor-General is consulted in this regard. Regular reporting to the departmental audit
committee on progress is also done.
Nature of qualification,
disclaimer, adverse opinion
and matters of non-
compliance
Financial
year in
which it first
arose
Progress made in clearing / resolving the
matter
Goods and services with a
transaction value below
R500 000 were procured
without obtaining the required
price quotations as required by
Treasury Regulation 16A 6.1
2012/13 To minimize non-compliance, the
department implemented the following
measures
- Appointed Supply Chain Champions in all
offices that were trained in SCM regulations
- Implementation of electronic
procurement system,
- The department introduced a payment
check list that must be certified by the
authoriser of the payment to ensure
legislative and procurement prescripts have
been adhered to.
- Established an Internal Control Unit to
conduct a post-audit on all payments.
The accounting did not take
effective steps to prevent
irregular expenditure, as
required by section 38(1)(c)(ii)
of the PFMA and Treasury
Regulation 9.1.1
2012/13 The following measures were implemented
- Appointed Supply Chain Champions in all
offices that were trained in SCM regulations
- Implementation of electronic
procurement system,
- The department introduced a payment
check list that must be certified by the
authoriser of the payment to ensure
legislative and procurement prescripts have
been adhered to.

Annual Report for 2013/14 Financial Year
Vote 5: Department of Education
Province of the Western Cape
139
10. INTERNAL CONTROL UNIT
In 2013/14 the newly-formed Internal Control Unit undertook the following functions:
Ensured proper governance
Managed the Integrated Internal Control System: maintained and updated a database
of Legal Frameworks and ensured the proper implementation of delegation of
frameworks
Maintained the Forensic Investigation register: provided progress reports on FIU cases for
Head Office and Districts and reported the updated departmental FIU register to
Department of the Premier.
Developed policies, procedures and processes pertaining to the internal control unit
including: completed business processes and procedures with regards to the
performances of SCM Champions; completed business processes and procedures for
compliance detection
Monitored compliance against prescripts: managed and developed a compliance
working tool; updated the tool in line with current legislation in order to detect trends to
determine weaknesses in the internal control system
Evaluated the effectiveness and the implementation of financial prescripts: completed
inspections within the department; monitored performances of SCM Champions;
capacitated SCM Champions within the Districts and Head Office through training and
information sessions
Evaluated the departmental risks registers: maintained and kept a record of risk reports;
liaised with ERM unit and Internal Audit on the departmental risks
Rendered Assurance Services
Facilitated the Internal and External Audits: monitored progress on recommendations in
management report and internal audit reports; analysed and implemented the responses of
management; provided inputs and advice
Reported matters to the AC committee: provided comment on status of financial
management improvement plan to the Audit Committee
Ensured implementation of corrective controls: provided reports and registers on irregular,
fruitless and wasteful expenditure and unauthorized expenditure; completed the post
auditing process in respect of payment vouchers; facilitated the SCOPA resolutions for the
annual report; completed the verification of the MPAT documentation.
11. INTERNAL AUDIT AND AUDIT COMMITTEES
Internal Audit provides management with independent, objective assurance and consulting
services designed to add value and to continuously improve the operations of the
Department. It should assist the Department to accomplish its objectives by bringing a
systematic, disciplined approach to evaluate and improve the effectiveness of Governance,
Risk Management and Control processes. The following key activities are performed in this
regard:
Assess and make appropriate recommendations for improving the governance processes
in achieving the department’s objectives;
Evaluate the adequacy and effectiveness, and contribute to the improvement of the risk
management process;

Annual Report for 2013/14 Financial Year
Vote 5: Department of Education
Province of the Western Cape
140
Assist the Accounting Officer in maintaining efficient and effective controls by evaluating
those controls to determine their effectiveness and efficiency, and by developing
recommendations for enhancement or improvement.
Internal Audit work completed during the year under review for the Department included 4
assurance engagements. The Internal audit plan included 5 assurance engagements. The
details of these engagements are included in the Audit Committee report.
The Audit Committee is established as an oversight body, providing independent oversight
over governance, risk management and control processes in the Department, which includes
responsibilities relating to:
Internal audit function;
External audit function as carried out by the Auditor- General of South Africa;
Departmental accounting and reporting;
Departmental accounting policies;
Review of Auditor-General of South Africa management and audit report;
Review of departmental in-year monitoring;
Departmental risk management;
Internal control;
Pre-determined objectives;
Ethics and forensic investigations.
The table below discloses relevant information on the audit committee members:
Name
Qu
alific
atio
ns
Inte
rna
l or
ex
tern
al
If inte
rna
l,
po
sition
in th
e
de
pa
rtme
nt
Da
te a
pp
oin
ted
Da
te R
esig
ne
d
No
. of M
ee
ting
s
atte
nd
ed
Mr Ronnie Kingwill CA(SA) External N/a 01 January 2013 N/a 8
Prof Estian Calitz DCom (Economics) External N/a 01 January 2013 N/a 3
Ms Zulpha Abrams CA(SA) & FIIA SA,
CIA External N/a 07 April 2014 N/a 5
Mr Linda Nene BComm (Acc); Post
Grad Diploma in
Management –
Corporate
Governance;
MDP;
CCSA;
CRMA;
CCP;
FIIASA
External N/a 01 April 2011 N/a 8
Mr Luzuko Mdunyelwa M( Phil);
M(Public Admin);
Diploma: Project
Management
External N/a 01 Oct 2011 N/a 6

Annual Report for 2013/14 Financial Year
Vote 5: Department of Education
Province of the Western Cape
141
12. AUDIT COMMITTEE REPORT
The Audit Committee is pleased to present its report for the financial year ended 31 March
2014.
Audit Committee Responsibility
The Audit Committee reports that it has complied with its responsibilities arising from Section
38 (1) (a) (ii) of the Public Finance Management Act and Treasury Regulation 3.1.13. The
Audit Committee also reports that it has adopted appropriate formal terms of reference
(approved on the 11 September 2013), as its Audit Committee terms of reference, has
regulated its affairs in compliance with these terms and has discharged all its responsibilities
as contained therein.
The Effectiveness of Internal Control Systems
Following a risk-based approach; the following internal audit work was completed during the
year under review:
Learner and Teacher Support Material
Management and Governance
Conditional Grants
Business Stakeholder Management
The major areas for improvement noted by Internal Audit during the performance of their
work are as follows:
Learner and Teacher Support Material: Improved management oversight over
textbook usage and retention at schools
Management and Governance: Implement standard operating procedures defining
the monitoring of financial management capability at schools
Conditional Grants: Implement standard operating procedures for the management
of the HIV/Aids and TB grant
Business Stakeholder Management: put a framework in place that guides the process
to be followed for identifying, prioritising, building and improving relationships with
stakeholders
Corrective actions have been agreed by management and the implementation thereof is
being monitored by the Audit Committee on a quarterly basis.
The approved Internal audit plan was completed for the year with the exception of one
project which was completed after the end of the financial year and reported at the next
quarterly review meeting.
The Audit Committee has considered the work of internal audit, as well as the assurance
provided by the various other assurance providers including management, internal control
unit, enterprise risk management function, forensic function, provincial treasury and external
audit; and with the exception of those areas noted above as well as matters from the
forensic function that identified a breakdown in internal control, nothing has come to its
attention which would indicate a material breakdown in the internal control systems in the
department.

Annual Report for 2013/14 Financial Year
Vote 5: Department of Education
Province of the Western Cape
142
In-Year Management and Quarterly Performance Reports
The Department has reported monthly and quarterly to the Provincial Treasury as is required
by the PFMA.
The Audit Committee is satisfied with the content and quality of the quarterly financial and
performance reports prepared and issued by the Accounting Officer of the Department
during the year under review.
Evaluation of Financial Statements
The Audit Committee has:
reviewed and discussed the audited annual financial statements as presented in the
annual report, with the Auditor-General of South Africa and the Accounting Officer;
reviewed the Auditor-General of South Africa’s management report and management’s
responses thereto;
considered changes to the accounting policies and practices and where applicable
these are reported in the annual financial statements;
reviewed the Department’s processes to ensure compliance with legal and regulatory
provisions;
reviewed the information on predetermined objectives as reported in the annual report;
reviewed material adjustments resulting from the audit of the Department and
reviewed and where appropriate recommended changes to the interim financial
statements as presented by the Department for the six months ending
30 September 2013.
Internal Audit
Vacancies within the internal audit structures are receiving on-going attention and good
progress is being made to fill funded vacancies.
There were no unresolved internal audit findings and good progress has been made to
implement corrective actions arising from internal audit findings.
Risk Management
The Department has taken full responsibility and ownership for the implementation of the
Enterprise-wide Risk Management (ERM) methodology and function and this is reviewed on a
quarterly basis by the Audit Committee. The challenge remains to institutionalise ERM
throughout the Department. The Audit Committee noted a number of emerging risks and will
be monitoring these on a regular basis.
Auditor-General of South Africa’s Report
The Audit Committee concurs and accepts the Auditor-General of South Africa’s opinion
regarding the annual financial statements, and proposes that the audited annual
financial statements be accepted and read together with the report of the Auditor-
General of South Africa.
The Audit Committee has met with the Auditor-General of South Africa and the
Department to ensure that there are no unresolved issues emanating from the regulatory
audit.
The Audit Committee has reviewed the Department’s implementation plan for audit
issues raised in the previous year on a quarterly basis and is satisfied that the matters have
been adequately resolved.

Annual Report for 2013/14 Financial Year
Vote 5: Department of Education
Province of the Western Cape
143
The Audit Committee recommended that the Annual Financial Statements be approved
by the Accounting Officer on 12th August 2014
Appreciation
The Audit Committee wishes to express its appreciation to the Management of the
Department, the Auditor-General of South Africa, the Internal Audit Unit and all other
assurance providers for the co-operation and information they have provided to enable us to
compile this report.
_________________
Mr Ronnie Kingwill
Chairperson of the Education Audit Committee
Department of Education
Date: 14 August 2014


Annual Report for 2013/14 Financial Year
Vote 5: Department of Education
Province of the Western Cape
144
1. INTRODUCTION
The information contained in this part of the annual report has been prescribed by the
Minister for the Public Service and Administration for all departments in the public service.
2. OVERVIEW OF HUMAN RESOURCES
2.1 Legislation that Governs HR Management
The information provided in this part is prescribed by the Public Service Regulations (Chapter
1, Part III J.3 and J.4).
Basic Conditions of Employment Act, 1997 (Act 75 of 1997),
Labour Relations Act, 1995 (Act 66 of 1995),
Employment Equity Act, 1998 (Act 55 of 1998),
Occupational Health and Safety Act, 1993 (Act 85 of 1993),
Compensation for Occupational Injuries and Diseases Act, 1993 (Act 130 of 1993),
Government Employees Pension Law, 1996 (Proclamation 21 of 1996),
Employment of Educators Act, 1998 (Act 76 of 1998),
Public Service Act, 1994 (Proclamation 103 of 1994), and
Constitution of the Republic of South Africa, 1996,
Skills Development Act, 1998 (Act 97 of 1998)
Promotion of Equality and Prevention of Unfair Discrimination Act, 2000 (Act 4 of 2000),
Promotion of Access to Information Act, 2000 (Act 2 of 2000),
Promotion of Administrative Justice Act, 2000 (Act 3 of 2000).
The information depicts the department’s demographic composition by race, gender and
disability, as required by the Employment Equity Act and the Department of Public Service
and Administration. Positions in the post establishment require various academic
qualifications such as a Senior Certificate, technical qualification or graduate and post-
graduate degrees, as well as certain competency levels. The Employment Equity Act states
that in determining whether designated groups are equitably represented within an
occupational category and level in an employer’s workforce a number of factors must be
taken into account including the pool of suitably qualified people from designated groups
from which the employer may reasonably be expected to promote or appoint employees.
The figures presented in this section do not take these factors into account and do not reflect
the fact that the population statistics provided by the 2011 Census reveal that a very small
percentage of the Western Cape population have Matric and tertiary qualifications. This
factor defines the pool of “suitably qualified people” from which the Western Cape
Government can employ staff (as specified by the Employment Equity Act). The Department
is continuing to invest in measures to broaden the pool of suitably qualified people who can
compete for its employment opportunities to broaden its equitable representation in all
occupational categories and levels in the workforce.

Annual Report for 2013/14 Financial Year
Vote 5: Department of Education
Province of the Western Cape
145
2.2 Introduction
Overview of HR matters at the Department
The management of the post establishment of the department is critical to the educational
success of schools. The department allocated 185 more posts for the 2014 academic year.
Furthermore the department implemented an improved learner/educator ratio in the
Foundation Phase. The department has succeeded in increasing its number of permanent
teachers and therefore the system has greater stability in general. Steps were taken to ensure
a learner/educator ratio of 1: 36 in primary schools and 1:34 in high schools. The department
also embarked on a goal oriented deployment plan for excess educators and the
decreasing number is proof of the success thereof. During the reporting period, the WCED
reduced the number of excess educators by 129.
The department successfully administered four vacancy lists for educators in the 2013 school
year.
Set HR priorities for the year under review and the impact of these priorities
The department regards as a priority the recruitment of competent managers to be
appointed as principals at schools. Representatives of the department at such selection
panels were vigilant to ensure that due process was followed.
Another priority was to reduce the numbers of employees on extended periods of leave in
order to ease the financial strain on the department since this necessitates the appointment
of substitute educators.
Workforce planning framework and key strategies to attract and recruit a skilled and
capable workforce
The department took advantage of the services and availability of the graduates of the
Funza Lushaka Bursary scheme as administered by the National Department of Basic
Education. During the period 1 April 2013 to 31 December 2013, 384 (57.2%) Funza Lushaka
bursary holders (2012 bursary holders that qualified for placement in 2013) out of 671 were
successfully placed. During the period 1 January 2014 to 31 March 2014, 284 (47%) Funza
Lushaka bursary holders (2013 bursary holders that qualified for placement in 2014) out of 604
were successfully placed in educator posts.
With the filling of SMS posts, the department placed emphasis on the results of the
competency based assessment to which candidates were subjected.
Employee performance management framework
The department embraced and subscribed to the prescribed policies in respect of
performance management and ensured that all staff, educators as well as public service
staff, were well informed of the expectations of the Employer.

Annual Report for 2013/14 Financial Year
Vote 5: Department of Education
Province of the Western Cape
146
Employee wellness programmes
An external service provider rendered a service in respect of the entire provincial
government and the department ascribed to such programme.
This programme provides on-going support in respect of the psychological, emotional and
lifestyle needs of employees. It is a programme focusing on, amongst others, HIV and AIDS,
stress, financial management, relationships, legal, family matters, substance abuse and
trauma debriefing. The programme also addresses health and wellness issues of employees
through Employee Health and Wellness Awareness Days. The aim of these days is to promote
healthy lifestyles and raise awareness of services which the WCED offers to its employees. In
addition, Health Promotion Awareness takes place according to days noted in the
Department of Health’s Health Calendar. The department hosted 16 Health and Wellness
Awareness Days and also created awareness by arranging 10 advocacy sessions on the
employee wellness program offered to WCED employees during the reporting period.
Policy development
The department availed the school post establishments for all schools for 2014 before the end
of August 2013. This enabled schools to commence timeously with their planning for 2013 and
also created sufficient opportunity for schools to appeal for more posts where deemed
necessary. The decrease in learner numbers during the course of a school year has a
consequence that some schools have more educators than the learner/educator ratio
allows as the year proceeds and to this effect schools’ establishments were based on verified
learner numbers as at 31 July 2013.
An e-Recruitment system (“Recruiting the best”) was implemented with effect from
January 2013. The system enables all educators to complete their personal profile on the
system and use that platform to apply online for advertised posts. This system proofed itself in
bring about greater efficiencies in application management and survey indicated a large
degree of user satisfaction.
The department has used the Pensions e-Channeling system since 2013, which allows for the
electronic processing of pension withdrawal for beneficiaries and has reduced the turn-
around time for the actual payment of benefits remarkably.
Intensified attention has been paid to ensure that all employees who are receiving
remuneration for work outside the public service apply for approval.
With the assistance of Internal Audit, the department developed a Stakeholder document to
improve the working relationship with its external stakeholders such as unions, principals’
forum and school governing body associations.
Future HR plans/goals
The rollout of the e-Recruitment system to office based educators and also to public service
staff.
The provision of online applications for institutional based educator posts to schools in
electronic format.

Annual Report for 2013/14 Financial Year
Vote 5: Department of Education
Province of the Western Cape
147
3. HUMAN RESOURCES OVERSIGHT STATISTICS
3.1. Personnel related expenditure
The following tables summarise the final audited personnel related expenditure by
programme and by salary bands. In particular, they provide an indication of the following:
amount spent on personnel
amount spent on salaries, overtime, homeowner’s allowances and medical aid.
Programme Programme Designation
Programme 1 Administration
Programme 2 Public Ordinary School Education
Programme 3 Independent School Education
Programme 4 Public Special School Education
Programme 5 Further Education and Training Colleges
Programme 6 Adult Basic Education and Training
Programme 7 Early Childhood Development
Programme 8 Infrastructure Development
Programme 9 Auxiliary and Associated Services
Table 3.1.1 Personnel expenditure by programme for the period 1 April 2013 and
31 March 2014
Programme Total
expen-
diture
(R’000)
Personnel
expenditure
(R’000)
Training
expenditure
(R’000)
Professional
and special
services
expenditure
(R’000)
Personnel
expenditure
as a % of total
expenditure
Average
personnel
cost per
employee
(R’000)
Number
of Em-
ployees
Programme 1 571 137 297 851 867 0 1.92 339.24 878
Programme 2 11 362
779 9 625 960 30 825 0 62.09 279.50 34 440
Programme 3 84 660 0 0 0 0.00 0 0
Programme 4 910 338 761 299 0 0 4.91 263.52 2 889
Programme 5 353 078 289 657 0 0 1.87 309.13 937
Programme 6 37 898 *963 0 0 0.01 120.38 8
**3 148 0 0 0.02 0 0
Programme 7 465 535 63 142 0 0 0.41 337.66 187
Programme 8 1 054 312 5 446 0 0 0.04 302.56 18
Programme 9 662 459 ***453 266 0 0 2.92 384.12 1 180
****66 201 0 0 0.43 0 0
Total 15 502
196 11 566 933 31 692 0 74.61 285.34 40 537
Note:
* The personnel expenditure in respect of Programme 6 (Adult Basic Education and Training) amounting to
R0.963m is in respect of the 8 full-time permanently employed employees. The indicated average personnel
cost is therefore only in respect of the fulltime employees
** The amount of R3.148 m reflects the amount in respect of the expenditure pertaining to 39 educators
appointed on a per-hourly basis for tuition at ABET-centres.
*** The personnel expenditure in respect of Programme 9 (Auxiliary and Associated Services) amounting to
R453.266m, is in respect of the permanently employed employees. The indicated average personnel cost is
therefore only in respect of the fulltime employees.
**** The amount of R66.201m reflects the amount in respect of the expenditure of Examiners/ Moderators/Markers
and temporary administrative support staff (for the 2013-Matric examinations).

Annual Report for 2013/14 Financial Year
Vote 5: Department of Education
Province of the Western Cape
148
Table 3.1.2 Personnel costs by salary band for the period 1 April 2013 and 31 March 2014
Salary band Personnel
expenditure
(R’000)
% of total
personnel cost
Average
personnel cost
per employee
(R’000)
No. of
employees
Lower skilled (Levels 1-2) 319 846 2.76 98.63 3 243
Skilled (level 3-5) 709 168 6.11 149.68 4 738
Highly skilled production (levels 6-8) 6 583 747 56.75 281.04 23 426
Highly skilled supervision (levels 9-12) 3 940 305 33.96 434.05 9 078
Senior and Top management (levels 13-16) 48 484 0.42 932.38 ##52
Total #11 601 550 100.00 286.20 40 537
Note:
# The total personnel expenditure in tables 3.1.1 and 3.1.2 differs because some transactions are made directly
on BAS
## The total number of employees indicated in tables 3.1.1 and 3.1.2 above includes both public service staff
and educators. The number of employees in the salary band 13 – 16 includes the 6 Chief Executive Officers
attached to the Further Education and Training Colleges
The following tables provide a summary per programme (Table 3.1.3) and salary bands
(Table 3.1.4), of expenditure incurred as a result of salaries, overtime, housing allowance and
medical assistance. In each case, the table provides an indication of the percentage of the
personnel budget that was used for these items.
Table 3.1.3 Salaries, Overtime, Home Owners Allowance and Medical Aid by programme for
the period 1 April 2013 and 31 March 2014
Programme
Salaries Overtime Home Owners
Allowance
Medical Aid
Amount
(R’000
Salaries
as a % of
personnel
costs
Amount
(R’000)
Overtime
as a % of
personnel
costs
Amount
(R’000)
HOA as a
% of
personnel
costs
Amount
(R’000)
Medical
aid as a
% of
personnel
costs
Programme 1 237 572 2.00 3 453 0.03 8 371 0.10 13 899 0.10
Programme 2 7 214 260 62.20 113 0.00 217 408 1.90 402 903 3.50
Programme 4 553 087 4.80 105 0.00 17 783 0.20 30 875 0.30
Programme 5 218 780 1.90 0 0.00 6 267 0.10 11 838 0.10
Programme 6 11 700 0.10 0 0.00 412 0.00 679 0.00
Programme 7 48 462 0.40 0 0.00 1 085 0.00 2 477 0.00
Programme 8 3 885 0.00 0 0.00 30 0.00 7 0.00
Programme 9 357 900 3.10 1 840 0.02 8 606 0.10 16 329 0.10
Total 8 645 646 74.52 5 511 0.05 259 962 2.24 479 007 4.13

Annual Report for 2013/14 Financial Year
Vote 5: Department of Education
Province of the Western Cape
149
Table 3.1.4 Salaries, Overtime, Home Owners Allowance and Medical Aid by salary band for
the period 1 April 20YY and 31 March 20ZZ
Salary band
Salaries Overtime
Home Owners
Allowance
Medical Aid
Amount
(R’000
Salaries
as a % of
personnel
costs
Amount
(R’000)
Overtime
as a % of
personnel
costs
Amount
(R’000)
HOA as a
% of
personnel
costs
Amount
(R’000)
Medical
aid as a
% of
person-
nel costs
Skilled (level 1-2) 224 623 1.90 125 0.00 16 010 0.10 17 025 0.10
Skilled (level 3-5) 504 825 4.40 1 821 0.02 29 738 0.30 41 328 0.0
Highly skilled
production
(levels 6-8)
4 908 153 42.30 2 873 0.02 145 727 1.30 283 337 2.40
Highly skilled
supervision
(levels 9-12
2 975 891 25.70 692 0.01 68 231 0.60 136 705 1.20
Senior
management
(level 13-16)
32 154 0.30 0.00 256 0.00 612 0.00
Total 8 645 646 74.52 5 511 0.05 259 962 2.24 479 007 4.13
3.2. Employment and Vacancies
The tables in this section summarise the position with regard to employment and vacancies.
The following tables summarise the number of posts on the establishment, the number of
employees, the percentage of posts vacant, and whether there are any staff that are
additional to the establishment.
This information is presented in terms of two key variables:
programme (Table 3.2.1) and
salary band (Table 3.2.2).
Table 3.2.1 Employment and vacancies by programme as on 31 March 2014
Pe
rso
nn
el
Gro
up
Programme Number
of
funded
posts
Unfunded
posts
Number of
Posts Filled
Vacancy
Rate %
Number of
persons
additional to
the
establishment
Total number
of
employees
All P
ers
on
ne
l
Programme 1 901 57 861 4.00 17 878
Programme 2 34 131 85 34 169 0.00 271 34 440
Programme 4 3 078 11 2 863 7.00 26 2 889
Programme 5 1 312 153 937 2.00 0 937
Programme 6 12 0 8 33.00 0 8
Programme 7 15 0 187 0.00 0 187
Programme 8 0 0 18 0.00 0 18
Programme 9 1 309 79 1 154 12.00 26 1180
Total 40 758 385 40 197 1.00 340 40 537

Annual Report for 2013/14 Financial Year
Vote 5: Department of Education
Province of the Western Cape
150
Pe
rso
nn
el
Gro
up
Programme Number
of
funded
posts
Unfunded
posts
Number of
Posts Filled
Vacancy
Rate %
Number of
persons
additional to
the
establishment
Total number
of
employees
Ed
uc
ato
rs
Programme 1 118 6 117 1.00 6 123
Programme 2 27 994 1 28 188 0.00 130 28 318
Programme 4 1 922 0 1 871 3.00 15 1 886
Programme 5 885 0 773 13.00 0 773
Programme 6 4 0 2 50.00 0 2
Programme 7 15 0 187** 0.00 0 187
Programme 8 0 0 1 0.00 0 1
Programme 9 702 8 630 10.00 16 646
Total 31 640 15 31 769 0.00 167* 31 936
Pu
blic
Se
rvic
e P
ers
on
ne
l
Programme 1 783 51 744 5.00 11 755
Programme 2 6 137 84 5 981 3.00 141 6 122
Programme 4 1 156 11 992 14.00 11 1 003
Programme 5 427 153 164 62.00 0 164
Programme 6 8 0 6 25.00 0 6
Programme 7 0 0 0 0.00 0 0
Programme 8 0 0 17 0.00 0 17
Programme 9 607 71 524 14.00 10 534
Total 9 118 370 8 428 8.00 173 8 601
Note:
* In the case of educators additional to the establishment, the figures of only those educators who were duly
identified as additional in terms of collective agreements are indicated.
** Programme 7: Posts of educator: pre-primary are abolished as they become vacant. The WCED adopted a
policy according to which the funds attached to vacated posts are replaced by a subsidy payment in an
effort to create more learning sites for pre-primary learners (Early Childhood Development). 187 Educators in
Programme 7 are Pre-Primary Personnel. These personnel are carried in additional posts.
As for educational institutions, the number of vacancies in respect of educators does not
mean that the institution has fewer educators than the number of educators to which they
are entitled. It merely indicates that the educator posts are not filled in a permanent
capacity. In each case where the post is not permanently filled, a contract appointment is
made to ensure that all educational institutions are sufficiently capacitated.
Table 3.2.2 Employment and vacancies by salary band as on 31 March 2014
Pe
rso
nn
el
Gro
up
Salary Band Number
of funded
posts
Unfunded
Posts
Number
of Posts
Filled
Vacancy
Rate %
Number of
persons
additional to
the
establishment
Total
number of
employees
All P
ers
on
ne
l
Lower Skilled
(Levels 1-2) 3 373 194 3 265 3.00 50 3 315
Skilled (Levels 3-5) 4 257 78 3 795 11.00 66 4 646
Highly skilled
production (Levels 6-8) 28 875 75 29 264 0.00 172 28 651
Highly skilled
supervision
(Levels 9-12)
4 203 38 3 823 9.00 50 3 873
Senior Management
(Levels 13-16) 50 0 50 0.00 2 52
Total 40 758 385 40 197 1.00 340 40 537

Annual Report for 2013/14 Financial Year
Vote 5: Department of Education
Province of the Western Cape
151
Pe
rso
nn
el
Gro
up
Salary Band Number
of funded
posts
Unfunded
Posts
Number
of Posts
Filled
Vacancy
Rate %
Number of
persons
additional to
the
establishment
Total
number of
employees
Ed
uc
ato
rs
Lower Skilled (Levels 1-
2) 0 0 0 0.00 0 0
Skilled (Levels 3-5) 0 0 0 0.00 0 *785
Highly skilled
production (Levels 6-8) 27 671 0 28 145 0.00 122 27 482
Highly skilled
supervision
(Levels 9-12)
3 969 15 3 624 9.00 45 3 669
Senior Management
(Levels 13-16) 0 0 0 0.00 0 0
Total 31 640 15 31 769 0.00 167 31 936
Pu
blic
Se
rvic
e P
ers
on
ne
l
Lower Skilled
(Levels 1-2) 3 373 194 3 265 3.00 50 3 315
Skilled (Levels 3-5) 4 257 78 3 795 11.00 66 3 861
Highly skilled
production (Levels 6-8) 1 204 75 1 119 7.00 50 1 169
Highly skilled
supervision
(Levels 9-12)
234 23 200 15.00 5 205
Senior Management
(Levels 13-16) 50 0 49 0.00 2 51
Total 9 118 370 8 428 8.00 173 8 601
Note:
As for educational institutions, the number of vacancies in respect of educators does not mean that the
institution has fewer educators than the number of educators to which they are entitled. It merely indicates
that the educator posts are not filled in a permanent capacity. In each case where the post is not
permanently filled, a contract appointment is made to ensure that all educational institutions have the
number of educators to which they are entitled.
All educator posts are created for the appointment of professionally fully qualified educators (at least Matric
plus 3 years training) at the minimum of salary levels 6-7. The WCED does have some under-qualified
educators in the system. These are the 785 educators who are remunerated at salary levels 3-5 because they
do not meet the minimum post requirements to be paid at salary levels 6-7. These educators are all appointed
against approved posts indicated in the salary band 6-8 in this table.
Table 3.2.3 Employment and vacancies by critical occupations as on 31 March 2014
Critical occupation Number of
posts on
approved
establishment
Number of posts
filled
Vacancy Rate Number of employees
additional to the
establishment
n/a n/a n/a n/a n/a
Total n/a n/a n/a n/a
Notes:
The CORE classification, as prescribed by the DPSA, should be used for completion of this table.
Critical occupations are defined as occupations or sub-categories within an occupation
(a) in which there is a scarcity of qualified and experienced persons currently or anticipated in the future,
either because such skilled persons are not available or they are available but do not meet the
applicable employment criteria;
(b) for which persons require advanced knowledge in a specified subject area or science or learning field
and such knowledge is acquired by a prolonged course or study and/or specialised instruction;
(c) where the inherent nature of the occupation requires consistent exercise of discretion and is
predominantly intellectual in nature; and in respect of which a department experiences a high degree
of difficulty to recruit or retain the services of employees.

Annual Report for 2013/14 Financial Year
Vote 5: Department of Education
Province of the Western Cape
152
3.3 Filling of SMS Posts
The tables in this section provide information on employment and vacancies as it relates to
members of the Senior Management Service by salary level. It also provides information on
advertising and filling of SMS posts, reasons for not complying with prescribed timeframes and
disciplinary steps taken.
Table 3.3.1 SMS post information as on 31 March 2014
SMS Level
Number of SMS posts
per level
Number of
SMS posts
filled per
level
% of SMS
posts filled
per level
Number of
SMS posts
vacant per
level
% of SMS
posts vacant
per level Funded Unfunded
Director-General/ Head of
Department 1 0 1 100.00 0 0.00
Salary level 16, but not
HOD 0 0 0 0.00 0 0.00
Salary Level 15 4 0 4 100.00 0 0.00
Salary Level 14 9 0 8 100.00 1 0.00
Salary Level 13 36 0 40 108.00 0 13.89
Total 50 0 53 106.00 1 100.00
Note:
Two (2) SMS members carried above the WCED establishment plus one (1) SMS member in the Office of the Minister
of Education in the Western Cape and one (1) SMS member is carried against the Internal Control posts.
Table 3.3.2 SMS post information as on 30 September 2013
SMS Level
Number of SMS posts per
level
Number of
SMS posts
filled per
level
% of SMS
posts filled
per level
Number of
SMS posts
vacant per
level
% of SMS
posts
vacant per
level Funded Unfunded
Director-General/
Head of Department 1 0
1 2.08 0 0.00
Salary level 16, but
not HOD 0 0
0 0.00 0 0.00
Salary Level 15 4 0 4 8.33 0 0.00
Salary Level 14 9 0 7 14.58 2 33.33
Salary Level 13 36 0 36 75.00 4 66.67
Total 50 0 48 100.00 6 100.00
Note:
Two (2) SMS members carried above the WCED establishment plus one (1) SMS member in the Office of the
Minister of Education in the Western Cape and one (1) SMS member is carried against the Internal Control
post.

Annual Report for 2013/14 Financial Year
Vote 5: Department of Education
Province of the Western Cape
153
Table 3.3.3 Advertising and filling of SMS posts for the period 1 April 2013 and 31 March 2014
SMS Level
Number of SMS posts per
level
Number of
SMS posts
filled per
level
% of SMS
posts filled
per level
Number of
SMS posts
vacant per
level
% of SMS
posts
vacant per
level Funded Unfunded
Director-General/ Head
of Department 1 0 1 2.08 0 0.00
Salary level 16, but not
HOD 0 0 0 0.00 0 0.00
Salary Level 15 4 0 4 8.33 0 0.00
Salary Level 14 9 0 7 14.58 2 33.33
Salary Level 13 36 0 36 75.00 4 66.67
Total 50 0 48 100.00 6 100.00
Two (2) SMS members carried above the WCED establishment plus one (1) SMS member in
the Office of the Minister of Education in the Western Cape and one (1) SMS member is
carried against the Internal Control posts.
Table 3.3.4 Reasons for not having complied with the filling of funded vacant SMS - Advertised
within 6 months and filled within 12 months after becoming vacant for the period 1 April 2013
and 31 March 2014
Reasons for vacancies not advertised within six months
N/A
Reasons for vacancies not filled within six months
N/A
Notes
In terms of the Public Service Regulations Chapter 1, Part VII C.1A.3, departments must indicate
good cause or reason for not having complied with the filling of SMS posts within the prescribed
timeframes.
Table 3.3.5 Disciplinary steps taken for not complying with the prescribed timeframes for filling
SMS posts within 12 months for the period 1 April 2013 and 31 March 2014
Disciplinary steps taken for not complying with the prescribed timeframes for filling SMS
posts within 12 months
N/A
Notes
In terms of the Public Service Regulations Chapter 1, Part VII C.1A.2, departments must indicate
good cause or reason for not having complied with the filling of SMS posts within the prescribed
timeframes. In the event of non-compliance with this regulation, the relevant executive authority or
head of department must take appropriate disciplinary steps in terms of section 16A(1) or (2) of the
Public Service Act.
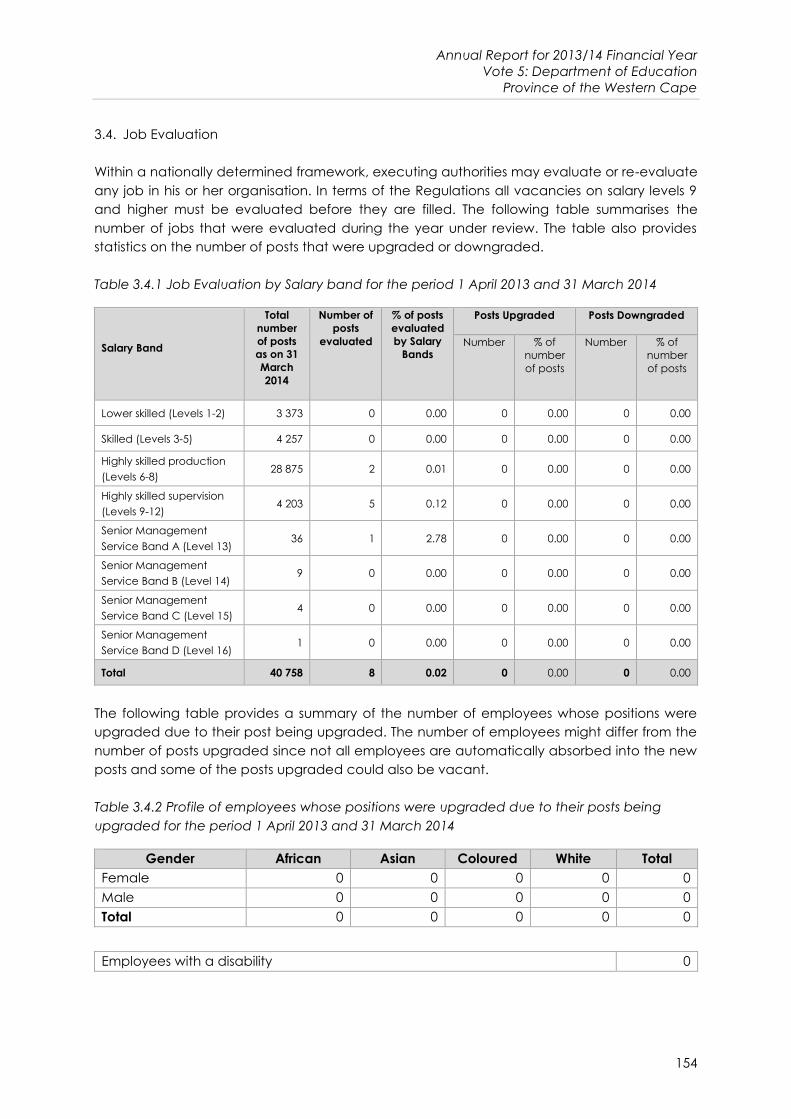
Annual Report for 2013/14 Financial Year
Vote 5: Department of Education
Province of the Western Cape
154
3.4. Job Evaluation
Within a nationally determined framework, executing authorities may evaluate or re-evaluate
any job in his or her organisation. In terms of the Regulations all vacancies on salary levels 9
and higher must be evaluated before they are filled. The following table summarises the
number of jobs that were evaluated during the year under review. The table also provides
statistics on the number of posts that were upgraded or downgraded.
Table 3.4.1 Job Evaluation by Salary band for the period 1 April 2013 and 31 March 2014
Salary Band
Total
number
of posts
as on 31
March
2014
Number of
posts
evaluated
% of posts
evaluated
by Salary
Bands
Posts Upgraded Posts Downgraded
Number % of
number
of posts
Number % of
number
of posts
Lower skilled (Levels 1-2) 3 373 0 0.00 0 0.00 0 0.00
Skilled (Levels 3-5) 4 257 0 0.00 0 0.00 0 0.00
Highly skilled production
(Levels 6-8) 28 875 2 0.01 0 0.00 0 0.00
Highly skilled supervision
(Levels 9-12) 4 203 5 0.12 0 0.00 0 0.00
Senior Management
Service Band A (Level 13) 36 1 2.78 0 0.00 0 0.00
Senior Management
Service Band B (Level 14) 9 0 0.00 0 0.00 0 0.00
Senior Management
Service Band C (Level 15) 4 0 0.00 0 0.00 0 0.00
Senior Management
Service Band D (Level 16) 1 0 0.00 0 0.00 0 0.00
Total 40 758 8 0.02 0 0.00 0 0.00
The following table provides a summary of the number of employees whose positions were
upgraded due to their post being upgraded. The number of employees might differ from the
number of posts upgraded since not all employees are automatically absorbed into the new
posts and some of the posts upgraded could also be vacant.
Table 3.4.2 Profile of employees whose positions were upgraded due to their posts being
upgraded for the period 1 April 2013 and 31 March 2014
Gender African Asian Coloured White Total
Female 0 0 0 0 0
Male 0 0 0 0 0
Total 0 0 0 0 0
Employees with a disability 0

Annual Report for 2013/14 Financial Year
Vote 5: Department of Education
Province of the Western Cape
155
The following table summarises the number of cases where remuneration bands exceeded
the grade determined by job evaluation. Reasons for the deviation are provided in each
case.
Table 3.4.3 Employees with salary levels higher than those determined by job evaluation by
occupation for the period 1 April 2013 and 31 March 2014
Total number of Employees whose salaries exceeded the grades
determine by job evaluation
None
The following table summarises the beneficiaries of the above in terms of race, gender, and
disability.
Table 3.4.4 Profile of employees who have salary levels higher than those determined by job
evaluation for the period 1 April 2013 and 31 March 2014
Total number of Employees whose salaries exceeded the grades
determine by job evaluation
None
3.5. Employment Changes
This section provides information on changes in employment over the financial year. Turnover
rates provide an indication of trends in the employment profile of the department. The
following tables provide a summary of turnover rates by salary band and critical occupations
(see definition in notes below).
Table 3.5.1 Annual turnover rates by salary band for the period 1 April 2013 and
31 March 2014
Pe
rso
nn
el
Gro
up
Salary Band Number of
Employees
per band
as on 31
March
2013
Appoint-
ments
Transfers
into the
depart-
ment
Appoint-
ments and
transfers
into the
depart-
ment
Termi-
nations
Transfers
out of the
depart-
ment
Terminatio
ns and
transfers
out of the
depart-
ment
Turnover
rate %
All P
ers
on
ne
l
Lower skilled
(Levels 1-2) 3 087 3 036 1 3 037 2 806 1 2 807 7.00
Skilled (Levels 3-5) 4 778 4 995 5 5 000 3 832 6 3 838 24.00
Highly skilled pro-
duction (Levels 6-8) 23 390 11 762 23 11 785 11 739 31 11 770 0.00
Highly skilled super-
vision (Levels 9-12) 8 820 576 3 579 1 117 12 1 129 0.00
Senior Manage-
ment Service Band
A (Level 13)
37 3 0 3 1 0 1 8.00
Senior Manage-
ment Service Band
B (Level 14)
7 0 0 0 1 0 1 0.00
Senior Manage-
ment Service Band
C (Level 15)
4 0 0 0 0 0 0 0.00
Senior Manage-
ment Service Band
D (Level 16)
1 0 0 0 0 0 0 0.00
Total 40 124 20 372 32 20 404 19 496 50 19 546 2.00

Annual Report for 2013/14 Financial Year
Vote 5: Department of Education
Province of the Western Cape
156
Pe
rso
nn
el
Gro
up
Salary Band Number of
Employees
per band
as on 31
March
2013
Appoint-
ments
Transfers
into the
depar-
tment
Appoint-
ments and
transfers
into the
depart-
ment
Termi-
nations
Transfers
out of the
depart-
ment
Termina-
tions and
transfers
out of the
depart-
ment
Turnover
rate %
Ed
uc
ato
rs
Lower skilled
(Levels 1-2) 0 0 0 0 0 0 0 0.00
Skilled (Levels 3-5) 896 3796 0 3 796 2 562 1 2 563 138.00
Highly skilled pro-
duction (Levels 6-8) 22 109 11 520 14 11 534 11 493 28 11 521 0.00
Highly skilled super-
vision (Levels 9-12) 8 623 542 3 545 1 089 7 1 096 0.00
Senior Manage-
ment Service Band
A (Level 13)
0 0 0 0 0 0 0 0.00
Senior Manage-
ment Service Band
B (Level 14)
0 0 0 0 0 0 0 0.00
Senior Manage-
ment Service Band
C (Level 15)
0 0 0 0 0 0 0 0.00
Senior Manage-
ment Service Band
D (Level 16)
0 0 0 0 0 0 0 0.00
Total 31 628 15 858 17 15 875 15 144 36 15 180 2.00
Pu
blic
Se
rvic
e
Lower skilled
(Levels 1-2) 3 087 3 036 1 3 037 2 806 1 2 807 7.00
Skilled (Levels 3-5) 3 882 1 199 5 1 204 1 270 5 1 275 0.00
Highly skilled pro-
duction (Levels 6-8) 1 281 242 9 251 246 3 249 0.00
Highly skilled super-
vision (Levels 9-12) 197 34 0 34 28 5 33 0.00
Senior Manage-
ment Service Band
A (Level 13)
37 3 0 3 1 0 1 8.00
Senior Manage-
ment Service Band
B (Level 14)
7 0 0 0 1 0 1 0.00
Senior Manage-
ment Service Band
C (Level 15)
4 0 0 0 0 0 0 0.00
Senior Manage-
ment Service Band
D (Level 16)
1 0 0 0 0 0 0 0.00
Total 8 496 4 514 15 4 529 4 352 14 4 366 2.00
Note:
Column 3 (number of employees) includes all Nature of Appointments and Excess Personnel and excludes the
Minister.
Public Servants and Educators who do not occupy permanent positions are appointed on contract for closed
periods. This includes employees appointed to substantive vacancies which arise as a result of natural attrition,
deaths, promotions, etc., and employees (educators) appointed as substitutes in the place of those absent from
duty because of sick leave, maternity leave, etc. This implies that the same employee can be appointed up to
four times in a particular reporting year because each contract is regarded as a new appointment. The expiry of
the contract is regarded as a termination of service for reporting purposes and this is the reason for the
exceptionally high number of terminations.

Annual Report for 2013/14 Financial Year
Vote 5: Department of Education
Province of the Western Cape
157
Table 3.5.2 Annual turnover rates by critical occupation for the period 1 April 2013 and
31 March 2014
Critical
occupation
Number of employees at
beginning of period-
April 2013
Appointments and
transfers into the
department
Terminations and
transfers out of the
department
Turnover rate
TOTAL n/a n/a n/a n/a
The table below identifies the major reasons why staff left the department.
Table 3.5.3.1 Reasons why staff left the department for the period 1 April 2013 and
31 March 2014
Gro
up
Termination type Number
of
Personnel
% of
Total
Exits
Number of exits as a % of the
total number of employees as at
31 March 2014
All P
ers
on
ne
l
Death / Demise 131 0.7.0 0.30
Resignation 779 4.00 1.90
Expiry of contract 17 671 90.40 44.00
Dismissal - operational changes 15 0.10 0.00
Dismissal - misconduct 44 0.20 0.10
Discharged due to ill-health 35 0.20 0.10
Retirement 821 4.20 2.00
Employee initiated severance package 11 0.10 0.00
Transfer to other Public Service Departments 50 0.30 0.10
Grand Total 19 557 100.00 48.70
Ed
uc
ato
rs
Death / Demise 76 0.50 0.20
Resignation 629 4.10 2.00
Expiry of contract 13 794 90.80 43.60
Dismissal - operational changes 15 0.10 0.00
Dismissal - misconduct 21 0.10 0.10
Discharged due to ill-health 21 0.10 0.10
Retirement 588 3.90 1.90
Employee initiated severance package 11 0.10 0.00
Transfer to other Public Service Departments 36 0.20 0.10
Grand Total 15191 100.00 48.00
Pu
blic
Se
rvic
e S
taff
Death / Demise 55 1.30 0.60
Resignation 150 3.40 1.80
Expiry of contract 3877 88.80 45.60
Dismissal - operational changes 0 0.00 0.00
Dismissal – misconduct 23 0.50 0.30
Discharged due to ill-health 14 0.30 0.20
Retirement 233 5.30 2.70
Employee initiated severance package 0 0.00 0.00
Transfer to other Public Service Departments 14 0.30 0.20
Grand Total 4366 100.00 51.40
Note:
The "Expiry of Contract" number may seem to be high in comparison to other state departments and employers.
The high figure is because the WCED has a policy by which employees are appointed on contract for short
periods. These posts are regularly advertised within the framework of applicable collective agreements with a
view to the permanent filling thereof at the earliest opportunity. Furthermore, substitute educators are appointed
in the place of educators who utilise leave or are seconded. The shortest period for contract appointment in
respect of an educator is two weeks.

Annual Report for 2013/14 Financial Year
Vote 5: Department of Education
Province of the Western Cape
158
Table 3.5.3.2 Reasons why staff resigned, 1 April 2013 to 31 March 2014
Gro
up
Termination type All Personnel
Number
% of Total Exits
All P
ers
on
ne
l
Age 3 0.02
Bad health 14 0.07
Better remuneration 42 0.22
Domestic problems 2 0.01
Emigration 18 0.09
Further studies 8 0.04
Marriage 7 0.04
Nature of work 35 0.18
No reason (predominantly “expiry of contract”) 18 725 96.60
Other education departments 1 0.01
Other occupation 53 0.27
Own business 1 0.01
Personal grievances 13 0.07
Reorganization 1 0.01
Resigning of position 556 2.85
Pregnancy 2 0.01
Misconduct 4 0.02
Mutually Agreed Severance Package 1 0.01
Reduction of posts 9 0.05
Prev/charge/misdemeanor 1 0.01
Grand Total 19 496 100.00
Ed
uc
ato
rs
Age 2 0.01
Bad health 12 0.08
Better remuneration 33 0.22
Domestic problems 2 0.01
Emigration 18 0.12
Further Studies 8 0.05
Marriage 7 0.05
Nature of work 24 0.16
No reason (predominantly “expiry of contract”) 14 515 95.85
Other education department 1 0.01
Other occupation 38 0.25
Own business 1 0.01
Personal grievance 12 0.08
Reorganization 1 0.01
Resigning of position 456 3.01
Pregnancy 1 0.01
Misconduct 3 0.02
Mutually Agreed Severance Package 1 0.01
Reduction in posts 9 0.01
Prev/charge/misdemeanor 0 0.00
Grand Total 15 144 100.00

Annual Report for 2013/14 Financial Year
Vote 5: Department of Education
Province of the Western Cape
159
Gro
up
Termination type All Personnel
Number
% of Total Exits
Pu
blic
Se
rvic
e S
taff
Age 1 0.02
Bad health 2 0.05
Better remuneration 9 0.21
Domestic Problems 0 0.00
Emigration 0 0.00
Further studies 0 0.00
Marriage 0 0.00
Nature of work 11 0.25
No reason (predominantly “expiry of contract”) 4 210 96.73
Other education department 0 0.00
Personal grievances 1 0.02
Other occupation 15 0.34
Own business 0 0.00
Reorganization 0 0.00
Redesigning of position 100 2.30
Pregnancy 1 0.02
Misconduct 1 0.02
Mutually Agreed Severance Package 0 0.00
Reduction of posts 0 0.00
Prev/charge/misdemeanor 1 0.02
Grand Total 4 352 100.00
Table 3.5.3.3 Reasons why permanent staff resigned, 1 April 2013 to 31 March 2014
Gro
up
Termination type All Personnel
Number
% of Total Exits
All P
ers
on
ne
l
Age 3 0.41
Bad Health 12 1.63
Better Remuneration 36 4.88
Domestic problems 2 0.27
Emigration 18 2.44
Further studies 8 1.08
Marriage 7 0.95
Nature of work 32 4.34
No reason 9 1.22
Other Education Department 1 0.14
Other Occupation 48 6.50
Own Business 1 0.14
Personal Grievances 12 1.63
Resigning from position 543 73.58
Pregnancy 1 0.14
Misconduct 4 0.54
Prev/charge/misdemeanour 1 0.14
Grand Total 738 100.00

Annual Report for 2013/14 Financial Year
Vote 5: Department of Education
Province of the Western Cape
160
Gro
up
Termination type All Personnel
Number
% of Total Exits
Ed
uc
ato
rs
Age 2 0.33
Bad Health 10 1.66
Better Remuneration 30 4.99
Domestic 2 0.33
Emigration 18 3.00
Further studies 8 1.33
Marriage 7 1.16
Nature of work 21 3.49
No reason 8 1.33
Other Education Department 1 0.17
Other Occupation 35 5.82
Own Business 1 0.17
Personal Grievances 11 1.83
Resigning of position 443 73.71
Pregnancy 1 0.17
Misconduct 3 0.50
Prev/charge/misdemeanour 0 0.00
Grand Total 601 100.00
Pu
blic
Se
rvic
e S
taff
Age 1 0.73
Bad Health 2 1.46
Better Remuneration 6 4.38
Domestic problems 0 0.00
Emigration 0 0.00
Further studies 0 0.00
Marriage 0 0.00
Nature of work 11 8.03
No reason 1 0.73
Other Education Department 0 0.00
Other Occupation 13 9.49
Own Business 0 0.00
Personal Grievances 1 0.73
Resigning of position 100 72.99
Pregnancy 0 0.00
Misconduct 1 0.73
Prev/charge/misdemeanour 1 0.73
Grand Total 137 100.00

Annual Report for 2013/14 Financial Year
Vote 5: Department of Education
Province of the Western Cape
161
Table 3.5.3.3 Age groups of permanent staff who resigned, 1 April 2013 to 31 March 2014
Ages Resignations
all Staff
All Staff -
%
Resignations
educators
Educators -
%
Resignations
Public
Service staff
Public
Service
staff - %
Ages 20> 1 0.14 0 0.00 1 0.73
Ages 20 to 24 21 2.85 21 3.49 0 0.00
Ages 25 to 29 97 13.14 95 15.81 2 1.46
Ages 30 to 34 77 10.43 59 9.82 18 13.14
Ages 35 to 39 63 8.54 53 8.82 10 7.30
Ages 40 to 44 143 19.38 123 20.47 20 14.60
Ages 45 to 49 160 21.68 121 20.13 39 28.47
Ages 50 to 54 96 13.01 71 11.81 25 18.25
Ages 55 to 59 54 7.32 41 6.82 13 9.49
Ages 60 to 64 26 3.52 17 2.83 9 6.57
Ages 65> 0 0.00 0 0.00 0 0.00
Grand Total 738 100 601 100.00 137 100.00
Table 3.5.3.4 Granting of employee initiated severance packages by salary band,
1 April 2013 to 31 March 2014
Personnel
Group Salary Band
Number of
Packages
Instated
All P
ers
on
ne
l
Lower Skilled (Levels 1-2) 0
Skilled (Levels 3-5) 0
Highly skilled production (Levels 6-8) 4
Highly skilled supervision (Levels 9-12) 7
Senior Management Service Band A 0
Senior Management Service Band B 0
Senior Management Service Band C 0
Senior Management Service Band D 0
Total 11
Ed
uc
ato
rs
Lower Skilled (Levels 1-2) 0
Skilled (Levels 3-5) 0
Highly skilled production (Levels 6-8) 4
Highly skilled supervision (Levels 9-12) 7
Senior Management Service Band A 0
Senior Management Service Band B 0
Senior Management Service Band C 0
Senior Management Service Band D 0
Total 11
Pu
blic
Se
rvic
e
Lower Skilled (Levels 1-2) 0
Skilled (Levels 3-5) 0
Highly skilled production (Levels 6-8) 0
Highly skilled supervision (Levels 9-12) 0
Senior Management Service Band A 0
Senior Management Service Band B 0
Senior Management Service Band C 0
Senior Management Service Band D 0
Total 0

Annual Report for 2013/14 Financial Year
Vote 5: Department of Education
Province of the Western Cape
162
Table 3.5.4 Promotions by critical occupation for the period 1 April 2013 and 31 March 2014
Occupation Employees 1
April 20YY
Promotions to
another
salary level
Salary level
promotions as a
% of employees
by occupation
Progressions to
another notch
within a salary
level
Notch progression
as a % of
employees by
occupation
TOTAL n/a n/a n/a n/a n/a
Table 3.5.5 Promotions by salary band for the period 1 April 2013 and 31 March 2014
Pe
rso
nn
el
Gro
up
Salary Band Employees
as at
31 March
2013
Promotion to
another
salary level
Salary Level
promotions as a %
of employees by
salary band
Progressions
to another
notch within
a salary level
Notch
progressions
as a % of
employees
by salary
band
All p
ers
on
ne
l
Lower Skilled (Levels 1-2) 3 087 235 7.61 2 243 72.66
Skilled (Levels 3-5) 4 778 130 2.72 3 562 74.55
Highly skilled production
(Levels 6-8) 23 390 852 3.64 18 936 80.96
Highly skilled supervision
(Levels 9-12) 8 820 1 135 12.87 7 978 90.45
Senior Management
(Levels 13-16) 49 5 10.20 33 57.14
Total 40 124 2 357 5.87 32 747 81. 61
Ed
uc
ato
rs
Lower Skilled (Levels 1-2) 0 0 0.00 0 0.00
Skilled (Levels 3-5) 896 4 0.45 231 25. 78
Highly skilled production
(Levels 6-8) 22 109 807 3.65 18 183 82. 24
Highly skilled supervision
(Levels 9-12) 8 623 1126 13.06 7 832 90. 83
Senior Management (Levels
13-16) 0 0 0.00 0 0.00
Total 31 628 1 973 6.12 26 246 82. 98
Pu
blic
se
rvic
e
Lower Skilled (Levels 1-2) 3 087 235 7.61 2 243 72. 66
Skilled (Levels 3-5) 3 882 126 3.25 3 328 85. 81
Highly skilled production
(Levels 6-8) 1 281 45 3.51 753 58. 78
Highly skilled supervision
(Levels 9-12) 197 9 4.57 146 74. 11
Senior Management
(Levels 13-16) 49 5 10.20 33 57. 14
Total 8 496 420 4.94 6 501 76. 52

Annual Report for 2013/14 Financial Year
Vote 5: Department of Education
Province of the Western Cape
163
3.6. Employment Equity
Table 3.6.1 Total number of employees (including employees with disabilities) in each of the
following occupational categories as on 31 March 2014
Occupational
Levels Male Female
Foreign
Nationals Total
A C I W A C I W Male Female
Top management
(Levels 14-16) 1 5 1 3 1 1 1 0 0 0 14
Senior management
(Level 13) 3 11 1 7 5 7 0 4 0 0 38
Professionally quali-
fied and experienced
specialists and mid-
management
(Levels 11-12)
134 657 10 308 82 175 7 101 0 1 1 475
Skilled technical and
academically
qualified workers,
junior management,
supervisors, foremen,
and superintendents
(Levels 8-10)
596 3 753 34 981 1431 5121 48 2 302 3 9 14 278
Semi-skilled and
discretionary decision
making
(Levels 4-7)
1 223 2 631 16 632 3 986 7 746 52 3 045 74 35 19 440
Unskilled and defined
decision making
(Levels 1-3)
612 2 026 3 111 400 1 929 1 163 31 16 5 292
Total 2 569 9 083 65 2 042 5 905 14 979 109 5 616 108 61 40 537
Table 3.6.2 Total number of employees (with disabilities) in each of the following occupational
bands as on 31 March 2014
Occupational Levels
Male Female Foreign
Nationals Total
A C I W A C I W M F
Top management
(Levels 14-16) 0 0 0 0 0 0 0 0 0 0 0
Senior management
(Level 13) 0 0 0 0 0 0 0 0 0 0
Professionally
qualified and
experienced
specialists and mid-
management (Levels
11-12)
0 0 0 0 0 0 0 0 0 0 0
Skilled technical and
academically
qualified workers,
junior management,
supervisors, foremen,
and superintendents
(Levels 8-10)
2 1 0 2 0 1 0 4 0 0 10
Semi-skilled and
discretionary decision
making (Levels 4-7)
2 2 0 1 1 2 0 1 0 0 9
Unskilled and defined
decision making
(Levels 1-3)
2 3 0 1 1 3 0 0 0 0 10
Total 6 6 0 4 2 6 0 5 0 0 29

Annual Report for 2013/14 Financial Year
Vote 5: Department of Education
Province of the Western Cape
164
Table 3.6.3 Recruitment for the period 1 April 2013 to 31 March 2014
Occupational Levels
Male Female Foreign
Nationals Total
A C I W A C I W Male Female
Top management
(Levels 14-16) 0 0 0 0 0 0 0 0 0 0 0
Senior management
(Level 13) 0 2 0 0 0 0 0 1 0 0 3
Professionally quali-
fied and experienced
specialists and mid-
management
(Levels 11-12)
11 39 0 27 11 16 0 16 0 0 120
Skilled technical and
academically quali-
fied workers, junior
management, super-
visors, foremen, and
superintendents
(Levels 8-10)
47 742 5 110 233 1 031 2 238 0 0 2 408
Semi-skilled and
discretionary decision
making (Levels 4-7)
757 1 659 6 312 2 380 4 949 53 1 833 240 94 12 283
Unskilled and defined
decision making
(Levels 1-3)
462 1 661 6 149 571 2 130 2 375 139 63 5 558
Total 1 277 4 103 17 598 3 195 8 126 57 2 463 379 157 20 372
Table 3.6.4 Promotions for the period 1 April 2013 to 31 March 2014
Occupational Levels
Male Female Foreign
Nationals Total
A C I W A C I W Male Female
Top management
(Levels 14-16) 0 2 0 1 0 0 0 0 0 0 3
Senior management
(Level 13) 0 0 0 1 0 0 0 1 0 0 2
Professionally
qualified and
experienced
specialists and mid-
management (Levels
11-12)
13 89 1 39 13 25 0 21 0 0 201
Skilled technical and
aca-demically
qualified workers,
junior management,
super-visors, foremen,
and superintendents
(Levels 8-10)
77 419 3 80 239 605 8 200 0 0 1 631
Semi-skilled and
discretionary decision
making (Levels 4-7)
21 54 0 1 31 112 0 38 1 0 258
Unskilled and defined
decision making
(Levels 1-3)
46 96 0 2 33 83 0 2 0 0 262
Total 157 660 4 124 316 825 8 262 1 0 2 357

Annual Report for 2013/14 Financial Year
Vote 5: Department of Education
Province of the Western Cape
165
Table 3.6.5 Terminations for the period 1 April 2013 to 31 March 2014
Occupational Levels Male Female
Foreign
Nationals Total
A C I W A C I W Male Female
Top management
(Levels 14-16) 0 0 0 0 0 1 0 0 0 0 1
Senior management
(Level 13) 0 1 0 0 0 0 0 0 0 0 1
Professionally quali-
fied and experienced
specialists and mid-
management
(Levels 11-12)
18 89 0 40 17 28 0 25 0 0 217
Skilled technical and
academically quali-
fied workers, junior
management, super-
visors, foremen, and
superintendents
(Levels 8-10)
66 920 8 160 307 1 300 6 378 0 0 3 145
Semi-skilled and
discretionary decision
making (Levels 4-7)
733 1 666 4 301 2 316 4 804 43 1 715 261 101 11 944
Unskilled and defined
decision making
(Levels 1-3)
376 1 421 6 97 329 1 602 2 190 113 52 4 188
Total 1 193 4 097 18 598 2 969 7 735 51 2 308 374 153 19 496
Table 3.6.6 Disciplinary action for the period 1 April 2013 to 31 March 2014
Disciplinary
action
Male Female Total
African Coloured Indian White African Coloured Indian White
All types 62 180 0 12 51 93 0 11 409
Table 3.6.7 Skills development for the period 1 April 2013 to 31 March 2014
Occupational Levels Male Female
Total A C I W A C I W
Top management
(Levels 14-16) 0 0 0 0 0 0 0 0 0
Senior management
(Level 13) 3 0 0 0 0 0 0 0 3
Professionally qualified and
experienced specialists and
mid-management
(Levels 11-12)
2 028 3 015 48 988 1 873 5 445 90 1 514 15 001
Skilled technical and academi-
cally qualified workers, junior
management, supervisors,
foremen, and superintendents
(Levels 8-10)
25 161 0 151 159 485 0 0 981
Semi-skilled and discretionary
decision making (Levels 4-7) 10 27 0 2 50 127 0 61 277
Unskilled and defined decision
making (Levels 1-3) 5 11 0 8 14 50 0 25 113
Grand Total 2 071 3 214 48 1 149 2 096 6 107 90 1 600 16 375
Note:
There is no alignment between the Organising Framework for Occupations (OFO) reported to the SETAs and the
occupation categories listed under the Code of Remuneration (CORE). The Department has aligned the CORE
occupation categories with the OFO occupation categories for reporting purposes in respect of the number of
employees.

Annual Report for 2013/14 Financial Year
Vote 5: Department of Education
Province of the Western Cape
166
3.7. Signing of Performance Agreements by SMS Members
All members of the SMS must conclude and sign performance agreements within specific
timeframes. Information regarding the signing of performance agreements by SMS members,
the reasons for not complying within the prescribed timeframes and disciplinary steps taken is
presented here.
Table 3.7.1 Signing of Performance Agreements by SMS members as on 31 May 2013
SMS Level
Number of funded
SMS posts per level
Number of SMS
members per level
Number of signed
Performance
Agreements per
level
Signed
Performance
Agreements as %
of SMS members
per level
Director- General/ Head
of Department 1 1 1 2.12
Salary level 16, but not
HOD 0 0 0 0.00
Salary Level 15 4 4 4 8.52
Salary Level 14 9 8 8 17.02
Salary Level 13 36 34 34 72.34
Total 50 47 47 100
Table 3.7.2 Reasons for not having concluded Performance agreements for all SMS members
as on 31 May 2013
Reasons
n/a
Table 3.7.3 Disciplinary steps taken against SMS members for not having concluded
Performance agreements as on 31 May 2013
Reasons
n/a

Annual Report for 2013/14 Financial Year
Vote 5: Department of Education
Province of the Western Cape
167
3.8. Performance Rewards
To encourage good performance, the department has granted the following performance
rewards, allocated to personnel for the performance period 2012/13, but paid during the year
under review. The information is presented in terms of race, gender and disability (Table 3.8.1.) and
salary bands (Table 3.8.2.).
Table 3.8.1 Performance Rewards by race, gender and disability for the period 1 April 2013 to
31 March 2014
Race and Gender
Beneficiary Profile Cost
Number of
beneficiaries
Total number of
employees in group
% of total
within group
Cost
(R’000)
Average cost
(R’000) per
beneficiary
African 204 1 608 12.69 1 189 5.82
Male 75 764 9.82 376 5.01
Female 129 844 15.28 813 6.30
Coloured 1 065 6 016 17.70 7 333 6.89
Male 366 2 594 14.11 2 464 6.73
Female 699 3 422 20.43 4 869 6.97
Indian 9 27 33.33 98 10.81
Male 3 11 27.27 49 16.40
Female 6 16 37.50 48 8.07
White 262 826 31.72 2 331 8.90
Male 40 170 23.53 355 8.87
Female 222 656 33.84 1 977 8.90
Employees with a
disability 3 19 15.79 22 7.20
Total 1 545 40 124 3.85 10 981 7.11
Table 3.8.2 Performance Rewards by salary band for personnel below Senior Management
Service for the period 1 April 2013 to 31 March 2014
Salary Bands Beneficiary Profile Cost
Number of
beneficiaries
Total number of
employees in
group
% of total
within salary
bands
Cost
(R’000)
Average cost
(R’000) per
beneficiary
Cost as a %
of the total
personnel
expenditure
Public Service Personnel
Lower skilled (Levels 1-2) 269 3 087 9.00 1 030 3.83 0.32
Skilled (Levels 3-5) 800 3 882 21.00 4 714 5.89 0.66
Highly skilled production
(Levels 6-8) 418 1 281 33.00 3 977 9.51 0.06
Highly skilled supervision
(Levels 9-12) 49 197 25.00 951 19.41 0.02
Total 1 536 8 447 18.00 10 671 6.95 1.06

Annual Report for 2013/14 Financial Year
Vote 5: Department of Education
Province of the Western Cape
168
Table 3.8.3 Performance Rewards by critical occupation for the period 1 April 2013 to
31 March 2014
Critical occupation
Beneficiary Profile Cost
Number of
beneficiaries
Number of
employees
% of total within
occupation
Total Cost
(R’000)
Average cost per
employee
Total n/a n/a n/a n/a n/a
Table 3.8.4 Performance related rewards (cash bonus), by salary band for Senior
Management Service for the period 1 April 2013 to 31 March 2014
Salary Bands
Beneficiary Profile Cost
Number of
beneficiaries
Total number of
employees in
group
% of total
within salary
bands
Cost
(R’000)
Average cost
(R’000) per
beneficiary
Cost as a %
of the total
personnel
expenditure
Senior Management
Service Band A (Level 13) 6 37 16.00 240 40.06 0.50
Senior Management
Service Band B (Level 14) 0 7 0.00 0 0.00 0.00
Senior Management
Service Band C (Level 15) 1 4 25.00 61 60.64 0.13
Senior Management
Service Band D (Level 16) 0 1 0.00 0 0.00 0.00
Total 7 49 14.00 301 43.00 0.63
Foreign Workers
The tables below summarise the employment of foreign nationals in the department in terms of
salary band and major occupation.
Table 3.9.1 Foreign workers by salary band for the period 1 April 2013 and 31 March 2014
Pe
rso
nn
el
Gro
up
Salary Band 1 April 2013 31 March 2014 Change
Number % of total Number % of total Number % in
Salary
Band
All P
ers
on
ne
l
Lower skilled (Levels 1-2) 2 1.00 3 2.00 1 0.00
Skilled (Levels 3-5) 57 34.00 58 34.00 1 0.00
Highly skilled production
(Levels 6-8) 104 61.00 100 59.00 -4 400.00
Highly skilled supervision
(Levels 9-12) 7 4.00 8 5.00 1 0.00
Senior Management
(Levels 13-16) 0 0.00 0 0.00 0 0.00
Total 170 100.00 169 100.00 -1 100.00
Ed
uc
ato
rs
Lower skilled (Levels 1-2) 0 0.00 0 0.00 0 0.00
Skilled (Levels 3-5) 55 33.00 55 34.00 0 0.00
Highly skilled production
(Levels 6-8) 103 62.00 99 61.00 -4 133.00
Highly skilled supervision
(Levels 9-12) 7 4.00 8 5.00 1 0.00
Senior Management
(Levels 13-16) 0 0.00 0 0.00 0 0.00
Total 165 100.00 162 100.00 -3 100.00
Pu
blic
Se
rvic
e
Lower skilled (Levels 1-2) 2 40.00 3 43.00 1 50.00
Skilled (Levels 3-5) 2 40.00 3 43.00 1 50.00
Highly skilled production
(Levels 6-8) 1 20.00 1 14.00 0 0.00
Highly skilled supervision
(Levels 9-12) 0 0.00 0 0.00 0 0.00
Senior Management
(Levels 13-16) 0 0.00 0 0.00 0 0.00
Total 5 100.00 7 100.00 2 100.00

Annual Report for 2013/14 Financial Year
Vote 5: Department of Education
Province of the Western Cape
169
Table 3.9.2 Foreign workers by major occupation for the period 1 April 2013 and 31 March 2014
Major occupation 01 April 2013 31 March 2014 Change
Number % of total Number % of total Number % Change
Professionals 13 7.65 14 8.28 1 -100.00
Technicians and Associate
Professionals 1 0.59 1 0.59 0 0.00
Clerks 1 0.59 1 0.59 0 0.00
Labourers and related
workers 155 91.18 153 90.53 -2 200.00
Total 170 100.00 169 100.00 -1 100.00
3.9. Leave utilisation
The Public Service Commission identified the need for careful monitoring of sick leave within
the public service. The following tables provide an indication of the use of sick leave and
disability leave. In both cases, the estimated cost of the leave is also provided.
Table 3.10.1 Sick leave for the period 1 January 2013 to 31 December 2013
Gro
up
Salary Band Total Days Days with
medical
certification
% days with
medical
certification
Number of
Employees
using sick
leave
% of total
employees
using sick
leave
Average
days per
(sick)
employee
Average
days per
(all)
employee
Estimated
Cost
(R'000) on
261 days
All p
ers
on
ne
l
Lower skilled
(Levels 1-2) 18 255 15 779 86.44 2 038 7.18 9 6 5 045
Skilled (Levels 3-5) 29 292 24 778 84.59 3 159 11.12 9 6 12 053
Highly skilled
production
(Levels 6-8)
144 552 115 210 79.70 16 936 59.64 9 6 116 020
Highly skilled
supervision (Levels
9-12)
54 400 44 643 82.06 6 235 21.95 9 6 65 150
Senior
Management
(Levels 13-16)
154 115 74.68 31 0.11 5 3 367
Total 246 653 200 525 81.30 28 399 100.00 9 6 198 635
Ed
uc
ato
rs
Lower skilled
(Levels 1-2) 0 0 0 0 0.00 0 0 0
Skilled (Levels 3-5) 3 012 2 410 80.01 431 1.92 7 3 1 498
Highly skilled
production
(Levels 6-8)
134 654 107 133 79.56 15 919 71.03 8 6 109 246
Highly skilled
supervision (Levels
9-12)
53 054 43 574 82.13 6 061 27.04 9 6 63 487
Senior
Management
(Levels 13-16)
0 0 0.00 0 0.00 0 0 0
Total 190 720 153 117 80.28 22 411 100.00 8 6 174 231
Pu
blic
se
rvic
e
Lower skilled
(Levels 1-2) 18 255 15 779 86.44 2 038 34.03 9 6 5 045
Skilled (Levels 3-5) 26 280 22 368 85.11 2 728 45.56 10 7 10 555
Highly skilled
production
(Levels 6-8)
9 898 8 077 81.60 1 017 16.98 10 8 6 774
Highly skilled
supervision (Levels
9-12)
1 346 1 069 79.42 174 2.91 8 7 1 663
Senior
Management
(Levels 13-16)
154 115 74.68 31 0.52 5 3 367
Total 55 933 47 408 84.76 5 988 100.00 9 6 24 404

Annual Report for 2013/14 Financial Year
Vote 5: Department of Education
Province of the Western Cape
170
Table 3.10.2 Disability leave (temporary and permanent) for the period 1 January 2013 to
31 December 2013
Gro
up
Salary Band Total Days Days with
medical
certification
% days with
medical
certification
Number of
Employees
using sick
leave
% of total
employees
using sick
leave
Average
days per
(sick)
employee
Average
days per
(all)
employee
Estimated
Cost
(R'000) on
261 days
All p
ers
on
ne
l
Lower skilled
(Levels 1-2) 748 741 99.00 22 9.00 34 0 208
Skilled (Levels 3-5) 956 955 100.00 30 12.00 32 0 383
Highly skilled
production
(Levels 6-8)
3 960 3 945 100.00 133 53.00 30 0 3 168
Highly skilled
supervision (Levels
9-12) 2 297 2 291 100.00 65 26.00 35 0 2 702
Senior
Management
(Levels 13-16) 0 0 100.00 0 0.00 0 0 0
Total 7 961 7 932 100.00 250 100.00 32 0 6 462
Ed
uc
ato
rs
Lower skilled
(Levels 1-2) 0 0 0.00 0 0.00 0 0 0
Skilled (Levels 3-5) 28 28 100.00 3 2.00 9 0 15
Highly skilled
production
(Levels 6-8) 3 395 3 381 100.00 121 64.00 28 0 2 728
Highly skilled
supervision (Levels
9-12) 2 286 2 280 100.00 64 34.00 36 0 2 697
Senior
Management
(Levels 13-16) 0 0 0.00 0 0.00 0 0 0
Total 5 709 5 689 100.00 188 100.00 30 0 5 429
Pu
blic
se
rvic
e
Lower skilled
(Levels 1-2) 748 741 99.00 22 35.00 34 0 208
Skilled (Levels 3-5) 928 927 100.00 27 44.00 34 0 368
Highly skilled
production
(Levels 6-8) 565 565 100.00 12 19.00 47 0 440
Highly skilled
supervision (Levels
9-12) 11 11
100.00 1 2.00 11 0 16
Senior
Management
(Levels 13-16) 0 0 0.00 0 0.00 0 0 0
Total 2 252 2 243 100.00 62 100.00 36 0 1 033
The table below summarises the utilisation of annual leave. The wage agreement concluded
with trade unions in the PSCBC in 2000 requires management of annual leave to prevent high
levels of accrued leave being paid at the time of termination of service.

Annual Report for 2013/14 Financial Year
Vote 5: Department of Education
Province of the Western Cape
171
Table 3.10.3 Annual Leave for the period 1 January 2013 to 31 December 2013
Gro
up
Salary Band Total Days
taken
Average number of
days taken per
employee
Number of
employees with
annual leave
All p
ers
on
ne
l
Lower skilled (Levels 1-2) 23 422 12 2 015
Skilled (Levels 3-5) 36 126 13 2 745
Highly skilled production (Levels 6-8) 24 218 9 2 652
Highly skilled supervision (Levels 9-12) 30 131 12 2 496
Senior Management (Levels 13-16) 1 192 24 50
Total 115 089 12 9 958
Ed
uc
ato
rs
Lower skilled (Levels 1-2) 0 0 0
Skilled (Levels 3-5) 27 2 12
Highly skilled production (Levels 6-8) 3 888 2 1 580
Highly skilled supervision (Levels 9-12) 25 030 11 2 287
Senior Management (Levels 13-16) 0 0 0
Total 28 945 7 3 879
Pu
blic
se
rvic
e
Lower skilled (Levels 1-2) 23 422 12 2 015
Skilled (Levels 3-5) 36 099 13 2 733
Highly skilled production (Levels 6-8) 20 330 19 1 072
Highly skilled supervision (Levels 9-12) 5 101 24 209
Senior Management (Levels 13-16) 1 192 24 50
Total 86 144 14 6 079
Note:
The annual leave entitlements and measures in respect of office-based educators make provision for office-
based educators to qualify for annual leave of between 22 and 30 days per annum, based on the number of
years of service. All institution-based educators are regarded as being on annual leave during institution
closure periods.
Table 3.10.4 Capped leave for the period 1 January 2013 to 31 December 2013
Gro
up
Salary Band Total capped
leave
available as
at 24 Dec 2012
Total days of
capped
leave taken
Number of
employees
using capped
leave
Average
number of
days taken
per
employee
Number of
employees
with capped
leave as at
24 Dec 2013
Total capped
leave
available
as at
24 Dec 2013
All p
ers
on
ne
l
Lower skilled (Levels 1-2) 24 933 1 807 49 37 641 24 933
Skilled (Levels 3-5) 93 585 8 236 143 58 1 545 93 585
Highly skilled production
(Levels 6-8) 389 553 19 030 1 804 11 7 534 389 618
Highly skilled supervision
(Levels 9-12) 512 727 31 440 1 830 17 7 373 512 785
Senior Management
(Levels 13-16) 3 878 43 2 22 31 3 878
Total 1 024 677 60 556 3 828 16 17 124 1 024 799

Annual Report for 2013/14 Financial Year
Vote 5: Department of Education
Province of the Western Cape
172
Gro
up
Salary Band Total capped
leave
available as
at 24 Dec
2012
Total days of
capped
leave taken
Number of
employees
using capped
leave
Average
number of
days taken
per
employee
Number of
employees
with capped
leave as at
24 Dec 2013
Total capped
leave available
as at
24 Dec 2013
Ed
uc
ato
rs
Lower skilled (Levels 1-2) 0 0 0 0 0 0
Skilled (Levels 3-5) 1 647 611 17 36 27 1 647
Highly skilled production
(Levels 6-8) 335 522 16 957 1 724 10 6 614 335 587
Highly skilled supervision
(Levels 9-12) 505 204 31 106 1 821 17 7 265 505 262
Senior Management
(Levels 13-16) 0 0 0 0 0 0
Total 842 373 48 674 3 562 14 13 906 842 496
Pu
blic
se
rvic
e
Lower skilled (Levels 1-2) 24 933 1 807 49 37 641 24 933
Skilled (Levels 3-5) 91 938 7 625 126 61 1 518 91 938
Highly skilled production
(Levels 6-8) 54 031 2 073 80 26 920 54 031
Highly skilled supervision
(Levels 9-12) 7 523 334 9 37 108 7 523
Senior Management
(Levels 13-16) 3 878 43 2 22 31 3 878
Total 182 303 11 882 266 45 3 218 182 303
The following table summarise payments made to employees as a result of leave that was
not taken.
Table 3.10.5 Leave payouts for the period 1 April 2013 and 31 March 2014
Reason Total Amount
(R’000)
Number of
Employees
Average payment
per employee
Leave pay-outs for 2013/14 due to non-utilisation of leave
for the previous cycle 0 0 0
Capped leave pay-outs on termination of service for
2013/14 37 954 476 79 735
Current leave pay-outs on termination of service 2013/14 721 109 6 615
Total 38 675 *585 66 111
A nett total of 487 employees received leave pay-outs - 98 employees received both capped and current leave
pay-outs.
3.11 HIV/AIDS & Health Promotion Programmes
Table 3.11.1 Steps taken to reduce the risk of occupational exposure
Units/categories of employees identified to be at high risk of
contracting HIV & related diseases (if any) Key steps taken to reduce the risk
Educators and Support Staff (school nurses, cleaning staff,
educators in laboratories, engineering and school
secretaries)
Brochure with procedures to follow in respect of
occupational exposure. Each education
institution has a health and safety committee.

Annual Report for 2013/14 Financial Year
Vote 5: Department of Education
Province of the Western Cape
173
Table 3.11.2 Details of Health Promotion and HIV/AIDS Programmes
Question Yes No Details, if yes
1. Has the department designated
a member of the SMS to
implement the provisions
contained in Part VI E of Chapter 1
of the Public Service Regulations,
2001? If so, provide her/his name
and position.
Director: Strategic People Management
2. Does the department have a
dedicated unit or has it
designated specific staff members
to promote the health and well-
being of your employees? If so,
indicate the number of employees
who are involved in this task and
the annual budget that is
available for this purpose.
X
The WCED has two specific programmes that it focuses
on i.e. the HIV/AIDS Life Skills Orientation Programme
(LSOP) and the HIV and AIDS in the Workplace (HWP).
These two programmes support each other in terms of
training and advocacy. The WCED Employee Health &
Wellness Programme has three officials responsible for
this programme at the level of Assistant Director,
Human Resource Practitioner and Human Resource
Clerk, respectively.
Budget = R 1 794 580
3. Has the department introduced
an Employee Assistance or Health
Promotion Programme for your
employees? If so, indicate the key
elements/services of this
Programme.
X
This programme provides on-going support in respect of
the psychological, emotional and lifestyle needs of our
employees. It is an Employee Health and Wellness
Management Programme focusing on, amongst others,
HIV and AIDS, stress, financial management,
relationships, legal, family matters, substance abuse
and trauma debriefing. These services are provided by
private service providers to ensure confidentiality. This
programme also addresses health and wellness issues
of employees through Employee Health and Wellness
Awareness Days. The aim of these days is to promote
healthy lifestyles and raise awareness around services
which the WCED offers to its employees. In addition,
Health Promotion Awareness takes place according to
days noted in the Department of Health’s Health
Calendar. The Department hosted 16 Health and
Wellness Awareness Days and also created awareness
by arranging 10 advocacy sessions on the employee
wellness program offered to WCED employees during
the reporting period.
4. Has the department established
(a) committee(s) as contemplated
in Part VI E.5 (e) of Chapter 1 of the
Public Service Regulations, 2001. If
so, please provide the names of
the members of the committee
and the stakeholder(s) that they
represent.
X The Director: Strategic People Management,
responsible Deputy Director and responsible Assistant
Director manage the programme and provide
quarterly reports to employee parties who also provide
inputs to the programme.
5. Has the department reviewed its
employment policies and
practices to ensure that these do
not unfairly discriminate against
employees on the basis of their HIV
status? If so, list the employment
policies/practices so reviewed.
X
The WCED adopted its own HIV and AIDS Policy in the
Workplace, based on the Framework provided by the
Provincial Government, which is supported by the
HIV&AIDS Transversal policy and Employee Health &
Wellness Transversal framework.

Annual Report for 2013/14 Financial Year
Vote 5: Department of Education
Province of the Western Cape
174
Question Yes No Details, if yes
6. Has the department introduced
measures to protect HIV-positive
employees or those perceived to
be HIV-positive from
discrimination? If so, list the key
elements of these measures.
X
The WCED provides regular awareness-raising of the
proper context in which HIV and AIDS should be
perceived. Unique matters regarding HIV and AIDS, e.g.
Confidentiality, disclosure, VCT, etc. are in the WCED’s
HIV and AIDS Policy and adherence to these are part
of line management’s responsibility.
7. Does the department
encourage its employees to
undergo Voluntary Counselling
and Testing? If so, list the results
that you have you achieved.
x
HIV Counselling Testing (HCT) is integrally part of broad
health assessments conducted during Health and
Wellness Awareness Days. The participation of HCT is on
average 40% of those who attend the Awareness Days.
The Department also communicated through Human
Resource Minute 6 of 2012 the National HIV Counselling
campaign with the view of encouraging all WCED staff
to undergo voluntary HIV counselling and testing. The
HCT service provider lists, as well as the Transversal HCT
Screening Calendar were attached to the minute. All
senior managers and Heads of Education institution
were requested to encourage staff to participate in the
National HIV Counselling campaign.
8. Has the department developed
measures/indicators to monitor
and evaluate the impact of its
health promotion programme? If
so, list these measures/indicators.
x
Monthly and quarterly reports are received from the
Employee Health and Wellness service provider
indicating the utilisation of the services offered.
Note:
The Department of Health co-ordinates the Provincial Employee Aids Programme of which the WCED is part. It
gives constructive direction regarding the following key elements / services:
Education and awareness in the workplace
Conducting of an HIV/AIDS audit in the workplace to determine infra-structural needs e.g. First Aid kits
Preventative programmes e.g. distribution of condoms
Promoting universal precautions e.g. safety measures to be observed when dealing with blood and body fluids of
injured persons
Voluntary Counselling and Testing
Promotion of support to HIV/AIDS-infected employees
DPSA: Employee Health and Wellness Strategic Framework emphasises compliance in regard to HIV/AIDS and TB
Management which recommends that core functions of EH&W in the workplace are to:
Mitigate the impact of HIV and AIDS and create an enabling social environment for Care, Treatment and Support.
Implement Employee Health and Wellness Day programme for HIV infected and affected work community
Implementation of Peer Educator programme for employees, targeting behavioural risks
Medical Assistance for the treatment and care of employees living with HIV/AIDS is provided by GEMS, other
medical aids and primary healthcare facilities.

Annual Report for 2013/14 Financial Year
Vote 5: Department of Education
Province of the Western Cape
175
3.12 Labour Relations
Table 3.12.1 Collective agreements for the period 1 April 2013 and 31 March 2014
Total number of Collective agreements None
The following table summarises the outcome of disciplinary hearings conducted within the
department for the year under review.
Table 3.12.2 Misconduct and disciplinary hearings finalised for the period 1 April 2013 and
31 March 2014
Outcomes of disciplinary hearings Number % of total
Correctional counselling 7 1.00
Verbal warning 1 0.15
Written warning 7 1.00
Final written warning 314 45.30
Suspension without pay 51 7.50
Fine 229 33.00
Demotion 1 0.15
Dismissal/ desertion 46 6.60
Not guilty 23 3.30
Case withdrawn 14 2.00
Total 693 100.00
Table 3.12.3 Types of misconduct addressed at disciplinary hearings for the period 1 April 2013
and 31 March 2014
Type of misconduct Number % of total
Theft, bribery, fraud or act of corruption in regard to examinations 1 0.20
Sexual assault on learner 9 2.20
Fails to comply with or contravenes an Act or any other statute, regulation or
legal obligation 3 0.70
Wilfully or negligently mismanages the finances of the State 13 3.10
Unjustifiably prejudices the administration, discipline or efficiency of the
Department 2 0.40
Accepts second employment and / or compensation without written
approval from the Employer 1 0.20
Fails to carry out a lawful order and / or routine instruction 20 4.80
Absenteeism 49 11.90
Discrimination 2 0.40
Poor performance, for reasons other than incapacity 7 1.70
While on duty, is under the influence of intoxicating substance 5 1.20
Improper, disgraceful and unacceptable conduct 70 17.10
Assaults, or attempt to or threatens to assault 160 39.10
Unlawful industrial action 19 4.60
Common law or statutory offence (theft, fraud and corruption) 22 5.30
Dishonesty 13 3.10
Abscondment 13 3.10
TOTAL 409 100.00

Annual Report for 2013/14 Financial Year
Vote 5: Department of Education
Province of the Western Cape
176
Table 3.12.4 Grievances logged for the period 1 April 2013 and 31 March 2014
Grievances lodged Number % of Total
Number of grievances resolved 302 69.30
Number of grievances not resolved 134 30.70
Total number of grievances lodged 436 100.00
Table 3.12.5 Disputes logged with Councils for the period 1 April 2013 and 31 March 2014
Disputes lodged with Councils Number % of Total
Number of disputes upheld 45 36.00
Number of disputes dismissed 80 64.00
Total number of disputes lodged 125 100.00
Table 3.12.6 Strike actions for the period 1 April 2013 and 31 March 2014
Strike actions Number
Total number of person working days lost 1 599
Total cost (R’000) of working days lost 703
Amount (R’000) recovered as a result of no work no pay 703
Table 3.12.7 Precautionary suspensions for the period 1 April 2013 and 31 March 2014
Precautionary suspensions Number
Number of Public Servants suspended 8
Number of Educators suspended 7
Number of public servants whose suspension exceeded 30 days 7
Number of educators whose suspension exceeded 90 days 3
Average number of days suspended 131
Cost (R’000) of suspensions 878
3.13 Skills development
This section highlights the efforts of the department with regard to skills development.
Table 3.13.1 Training needs identified for the period 1 April 2013 and 31 March 2014
Occupational
Categories Gender
Number of
employees as
at 1 April 2013
Training needs identified at start of reporting period
Learnerships Skills Programmes &
other short courses
Other
forms of
training
Total
Legislators, senior
officials and managers
Female 1 572 0 1 553 0 1 553
Male 2 414 0 2 075 0 2 075
Professionals Female 20 037 0 10 048 0 10 048
Male 8 204 0 5 836 0 5 836
Technicians and
associate professionals
Female 321 0 1 0 1
Male 238 0 0 0 0
Clerks Female 1 922 0 1 812 0 1 812
Male 267 0 941 0 941
Service and sales
workers
Female 5 0 347 0 347
Male 18 0 833 0 833

Annual Report for 2013/14 Financial Year
Vote 5: Department of Education
Province of the Western Cape
177
Occupational
Categories Gender
Number of
employees as
at 1 April 2013
Training needs identified at start of reporting period
Learnerships Skills Programmes &
other short courses
Other
forms of
training
Total
Skilled agriculture and
fishery workers
Female 0 0 0 0 0
Male 0 0 0 0 0
Craft and related
trades workers
Female 0 0 0 0 0
Male 0 0 0 0 0
Plant and machine
operators and
assemblers
Female 0 0 0 0 0
Male 21 0
1 0 1
Labourers and related
workers
Female 2 368 0 373 0 373
Male 2 737 0 482 0 482
Elementary
occupations
Female 0 0 0 0 0
Male 0 0 0 0 0
Sub Total Female 26 225 0 14 134 0 14 134
Male 13 899 0 10 168 0 10 168
Total 40 124 0 24 302 0 24 302
Employees with
disabilities
Female 14 0 0 0 0
Male 18 0 0 0 0
Note:
There is no alignment between the Organising Framework for Occupations (OFO) reported to the SETAs and the
occupation categories listed under the Code of Remuneration (CORE). The Department has aligned the CORE
occupation categories with the OFO occupation categories for reporting purposes in respect of the number of
employees.
Table 3.13.2 Training provided for the period 1 April 2013 and 31 March 2014
Occupational
Categories Gender
Number of
employees
as at
31 March 2013
Training provided within the reporting period
Learnerships Skills Programmes
& other short
courses
Other
forms of
training
Total
Legislators, senior
officials and
managers
Female 1 572 0 1 663 0 1 663
Male 2 414 0 1 122 0 1 122
Professionals Female 20 037 0 7 047 0 7 047
Male 8 204 0 4 392 0 4 392
Technicians and
associate
professionals
Female 321 0 1 0 1
Male 238 0 0 0 0
Clerks Female 1 922 0 730 0 730
Male 267 0 384 0 384
Service and sales
workers
Female 5 0 0 0 0
Male 18 0 0 0 0
Skilled agriculture and
fishery workers
Female 0 0 0 0 0
Male 0 0 0 0 0
Craft and related
trades workers
Female 0 0 0 0 0
Male 0 0 0 0 0
Plant and machine
operators and
assemblers
Female 0 0 0 0 0
Male 21 0 1 0 1
Labourers and related
workers
Female 2 368 0 102 0 102
Male 2 737 0 118 0 118

Annual Report for 2013/14 Financial Year
Vote 5: Department of Education
Province of the Western Cape
178
3.14 Injury on duty
The following tables provide basic information on injury on duty.
Table 3.14.1 Injury on duty for the period 1 April 2013 and 31 March 2014
Personnel
Group Nature of Injury on Duty Number % of total
ALL
PER
SO
NN
EL
Required basic medical attention only 101 80.00
Back Injury 13 12.87
Foot/Ankle 16 15.84
Wrist/Shoulder/arm/Finger 31 30.69
Nose /Eye 3 2.97
Neck/Head 5 4.95
Knee /Leg Injury 25 24.75
Pain in Ribcage /Physical Assault /Coma 6 5.94
Burn wounds/Skin 2 1.98
Temporary Total Disablement 25 20.00
Back Injury 1 0.99
Foot 6 5.94
Wrist/Shoulder/Arm/Finger 4 3.96
Nose/Eye 5 4.95
Neck/Head 4 3.96
Knee/Leg Injury 4 3.96
Depression 1 0.99
Singed Hair 0 0.00
Permanent Disablement 0 0.00
Fatal 0 0.00
Total 126 100.00
Percentage of total employment 0.31
Ed
uc
ato
rs
Required basic medical attention only 56 84.00
Back Injury 5 8.93
Foot 14 25.00
Wrist/Shoulder/arm/Finger 13 23.21
Nose /Eye 2 3.57
Neck/Head 2 3.57
Knee /Leg Injury 13 23.21
Occupational
Categories Gender
Number of
employees
as at
31 March 2013
Training provided within the reporting period
Learnerships Skills Programmes
& other short
courses
Other
forms of
training
Total
Elementary
occupations
Female 0 0 0 0 0
Male 0 0 0 0 0
Sub Total Female 26 225 0 9 543 0 9 543
Male 13 899 0 6 017 0 6 017
Total 40 124 0 15 560 0 15 560
Employees with
disabilities
Female 14 0 0 0 0
Male 18 0 0 0 0

Annual Report for 2013/14 Financial Year
Vote 5: Department of Education
Province of the Western Cape
179
Personnel
Group Nature of Injury on Duty Number % of total
Pain in Ribcage /Physical Assault /Coma 5 8.93
Burn wounds/Skin 2 3.57
Temporary Total Disablement 11 16.00
Back Injury 0 0.00
Foot 3 27.27
Wrist/Shoulder/Arm/Finger 3 27.27
Nose/Eye 0 0.00
Neck/Head 2 18.18
Knee/Leg Injury 3 27.27
Total 67 100.00
Percentage of total employment 0.17
Pu
blic
Se
rvic
e P
ers
on
ne
l
Required basic medical attention only 45 75.00
Back Injury 8 17.78
Foot 2 4.44
Wrist/Shoulder/arm/Finger 18 40.00
Nose /Eye 1 2.22
Neck/Head 3 6.67
Knee /Leg Injury 12 26.67
Pain in Ribcage /Physical Assault /Coma 1 2.22
Temporary Total Disablement 14 25.00
Back Injury 1 7.14
Foot 3 21.43
Wrist/Shoulder/Arm/Finger 1 7.14
Eye 5 35.71
Neck/Head 2 14.29
Knee/Leg Injury 1 7.14
Depression 1 7.14
Total 59 100.00
Percentage of total employment 0.15
3.15 Utilisation of Consultants
The following tables relate information on the utilisation of consultants in the department. In terms
of the Public Service Regulations “consultant’ means a natural or juristic person or a partnership
who or which provides in terms of a specific contract on an ad hoc basis any of the following
professional services to a department against remuneration received from any source:
(a) The rendering of expert advice;
(b) The drafting of proposals for the execution of specific tasks; and
(c) The execution of a specific task which is of a technical or intellectual nature, but excludes
an employee of a department.

Annual Report for 2013/14 Financial Year
Vote 5: Department of Education
Province of the Western Cape
180
Table 3.15.1 Report on consultant appointments using appropriated funds for the period
1 April 2013 and 31 March 2014
Project title Total number of consultants
that worked on project
Duration
(work days)
Contract value in
Rand
n/a 0 0 0
Total number of projects Total individual consultants Total
duration
Work days
Total contract value in
Rand
n/a 0 0 0
Table 3.15.2 Analysis of consultant appointments using appropriated funds, in terms of
Historically Disadvantaged Individuals (HDIs) for the period 1 April 2013 and 31 March 2014
Project title Percentage ownership by
HDI groups
Percentage
management by HDI
groups
Number of consultants
from HDI groups that work
on the project
n/a 0 0 0
Table 3.15.3 Report on consultant appointments using Donor funds for the period 1 April 2013
and 31 March 2014
Project title Total Number of consultants
that worked on project
Duration
(Work days)
Donor and contract value
in Rand
n/a 0 0 0
Total number of projects Total individual consultants Total
duration
Work days
Total contract value in
Rand
n/a 0 0 0
Table 3.15.4 Analysis of consultant appointments using Donor funds, in terms of Historically
Disadvantaged Individuals (HDIs) for the period 1 April 2013 and 31 March 2014
Project title Percentage ownership by
HDI groups
Percentage
management by HDI
groups
Number of consultants
from HDI groups that work
on the project
n/a 0 0 0

Annual Report for 2013/14 Financial Year
Vote 5: Department of Education
Province of the Western Cape
181
3.16 Severance Packages
Table 3.16.1 Granting of employee initiated severance packages for the period
1 April 2013 and 31 March 2014
Pe
rso
nn
el
Gro
up
Salary Band Number of
Packages Instated
All P
ers
on
ne
l
Lower Skilled (Levels 1-2) 0
Skilled (Levels 3-5) 0
Highly skilled production (Levels 6-8) 4
Highly skilled supervision (Levels 9-12) 7
Senior Management Service Band A 0
Senior Management Service Band B 0
Senior Management Service Band C 0
Senior Management Service Band D 0
Total 11
Ed
uc
ato
rs
Lower Skilled (Levels 1-2) 0
Skilled (Levels 3-5) 0
Highly skilled production (Levels 6-8) 4
Highly skilled supervision (Levels 9-12) 7
Senior Management Service Band A 0
Senior Management Service Band B 0
Senior Management Service Band C 0
Senior Management Service Band D 0
Total 11
Pu
blic
Se
rvic
e
Lower Skilled (Levels 1-2) 0
Skilled (Levels 3-5) 0
Highly skilled production (Levels 6-8) 0
Highly skilled supervision (Levels 9-12) 0
Senior Management Service Band A 0
Senior Management Service Band B 0
Senior Management Service Band C 0
Senior Management Service Band D 0
Total 0


WESTERN CAPE PROVINCE
DEPARTMENT OF EDUCATION
VOTE 5
REPORT OF THE AUDITOR-GENERAL
for the year ended 31 March 2014
182
REPORT OF THE AUDITOR-GENERAL TO THE WESTERN CAPE PROVINCIAL PARLIAMENT ON VOTE
NO. 5: WESTERN CAPE EDUCATION DEPARTMENT
REPORT ON THE FINANCIAL STATEMENTS
Introduction
1. I have audited the financial statements of the Western Cape Education Department
(WCED) set out on pages 188 to 231, which comprise the appropriation statement, the
statement of financial position as at 31 March 2014, the statement of financial
performance, statement of changes in net assets and statement of cash flows for the
year then ended, as well as the notes, comprising a summary of significant accounting
policies and other explanatory information.
Accounting officer’s responsibility for the financial statements
2. The accounting officer is responsible for the preparation and fair presentation of these
financial statements in accordance with the Modified Cash Standard (MCS) prescribed
by the National Treasury and the requirements of the Public Finance Management Act of
South Africa, 1999 (Act No. 1 of 1999) (PFMA) and Division of Revenue Act of South
Africa, 2013 (Act No. 2 of 2013) (DoRA) and for such internal control as the accounting
officer determines is necessary to enable the preparation of financial statements that are
free from material misstatement, whether due to fraud or error.
Auditor-general’s responsibility
3. My responsibility is to express an opinion on these financial statements based on my
audit. I conducted my audit in accordance with the Public Audit Act of South Africa,
2004 (Act No. 25 of 2004) (PAA), the general notice issued in terms thereof and
International Standards on Auditing. Those standards require that I comply with ethical
requirements, and plan and perform the audit to obtain reasonable assurance about
whether the financial statements are free from material misstatement.
4. An audit involves performing procedures to obtain audit evidence about the amounts
and disclosures in the financial statements. The procedures selected depend on the
auditor’s judgement, including the assessment of the risks of material misstatement of the
financial statements, whether due to fraud or error. In making those risk assessments, the
auditor considers internal control relevant to the entity’s preparation and fair
presentation of the financial statements in order to design audit procedures that are
appropriate in the circumstances, but not for the purpose of expressing an opinion on
the effectiveness of the entity’s internal control. An audit also includes evaluating the
appropriateness of accounting policies used and the reasonableness of accounting
estimates made by management, as well as evaluating the overall presentation of the
financial statements.

WESTERN CAPE PROVINCE
DEPARTMENT OF EDUCATION
VOTE 5
REPORT OF THE AUDITOR-GENERAL
for the year ended 31 March 2014
183
5. I believe that the audit evidence I have obtained is sufficient and appropriate to provide
a basis for my audit opinion.
Opinion
6. In my opinion, the financial statements presents fairly, in all material respects, the
financial position of the WCED as at 31 March 2014 and its financial performance and
cash flows for the year then ended, in accordance with the MCS prescribed by the
National Treasury and the requirements of the PFMA and DoRA.
Emphasis of matters
7. I draw attention to the matters below. My opinion is not modified in respect of these
matters.
Restatement of corresponding figures
8. As disclosed in note 31 to the financial statements, the corresponding figures for
31 March 2013 have been restated as a result of the National Treasury’s change in
method of ageing of debtors, reclassification of disallowance accounts and an error
discovered during 2013-14 in the financial statements of the WCED for the year ended,
31 March 2013.
9. As disclosed in note 19 to the financial statements, the corresponding figures for
31 March 2013 have been restated as a result of amendments to the accounting manual
for departments during 2013-14 relating to commitments.
Material impairments
10. As disclosed in note 10 to the financial statements, the WCED had receivables totalling
R84,1 million at 31 March 2014, for which the recoverability of R71,8 million is doubtful and
has been provided for.
Additional matter
11. I draw attention to the matter below. My opinion is not modified in respect of this matter:
Unaudited supplementary schedules
12. The supplementary information set out on pages 232 to 239 does not form part of the
financial statements and is presented as additional information. I have not audited these
schedules and, accordingly, I do not express an opinion thereon.

WESTERN CAPE PROVINCE
DEPARTMENT OF EDUCATION
VOTE 5
REPORT OF THE AUDITOR-GENERAL
for the year ended 31 March 2014
184
REPORT ON OTHER LEGAL AND REGULATORY REQUIREMENTS
13. In accordance with the PAA and the general notice issued in terms thereof, I report the
following findings on the reported performance information against predetermined
objectives for selected programmes presented in the annual performance report, non-
compliance with legislation as well as internal control. The objective of my tests was to
identify reportable findings as described under each subheading but not to gather
evidence to express assurance on these matters. Accordingly, I do not express an
opinion or conclusion on these matters.
Predetermined objectives
14. I performed procedures to obtain evidence about the usefulness and reliability of the
reported performance information for the following selected programme presented in
the annual performance report of the WCED for the year ended 31 March 2014:
Programme 2: public school education on pages 48 to 64.
15. I evaluated the reported performance information against the overall criteria of
usefulness and reliability.
16. I evaluated the usefulness of the reported performance information to determine
whether it was presented in accordance with the National Treasury’s annual reporting
principles and whether the reported performance was consistent with the planned
programme. I further performed tests to determine whether indicators and targets were
well defined, verifiable, specific, measurable, time bound and relevant, as required by
the National Treasury’s Framework for managing programme performance information.
17. I assessed the reliability of the reported performance information to determine whether it
was valid, accurate and complete.
18. I did not raise any material findings on the usefulness and reliability of the reported
performance information for the selected programme.
Additional matter
19. Although I raised no material findings on the usefulness and reliability of the reported
performance information for the selected programme, I draw attention to the following
matter:
Achievement of planned targets
20. Refer to the annual performance report on pages 44, 61 – 63, 68, 77 – 78 and 84 for
information on the achievement of the planned targets for the year.

WESTERN CAPE PROVINCE
DEPARTMENT OF EDUCATION
VOTE 5
REPORT OF THE AUDITOR-GENERAL
for the year ended 31 March 2014
185
Compliance with legislation
21. I performed procedures to obtain evidence that the WCED had complied with
applicable legislation regarding financial matters, financial management and other
related matters. My findings on material non-compliance with specific matters in key
legislation, as set out in the general notice issued in terms of the PAA, are as follows:
Annual financial statements
22. The financial statements submitted for auditing were not prepared in accordance with
the MCS prescribed by the National Treasury as required by section 40(1)(b) of the PFMA.
Material misstatements of disclosure items identified by the auditors in the submitted
financial statements were subsequently corrected, resulting in the financial statements
receiving an unqualified audit opinion.
Service delivery – education national school nutrition programme (NSNP)
23. Some meals were not prepared according to the recommended food specifications
and approved menu, in contravention of the Division of revenue grant framework,
published in Gazette No. 36581 dated 24 June 2013.
Internal control
24. I considered internal control relevant to my audit of the financial statements, annual
performance report and compliance with legislation. The matters reported below are
limited to the significant internal control deficiencies that resulted in the findings on the
annual performance report and the findings on non-compliance with legislation
included in this report.
Financial and performance management
25. The WCED did not review the annual financial statements adequately to ensure the
accuracy and completeness thereof and that financial statement disclosures were fairly
presented, supported and evidenced by reliable information. I noted material
misstatements for various disclosure notes.
26. School management and NSNP district coordinators at district offices did not adhere to
policies and procedures to support the understanding and execution of internal control
objectives, processes and responsibilities. The WCED did not implement processes to
monitor whether nutritious meals were always provided to all learners in terms of the
NSNP framework.

WESTERN CAPE PROVINCE
DEPARTMENT OF EDUCATION
VOTE 5
REPORT OF THE AUDITOR-GENERAL
for the year ended 31 March 2014
186
OTHER REPORTS
Performance audits
27. The following performance audits were conducted during the year under review and
their status is as indicated below:
Performance audit of the readiness of government to report on its performance
28. The report of the Auditor-General of South Africa on the readiness of government to
report on its performance will be tabled during 2014. The WCED was one of the 61
institutions audited during this audit. The performance audit focused on the following:
The systems and processes that government departments have put in place to
report on their performance.
The performance reporting guidance and oversight that government departments
have received.
Performance audit on early childhood development (ECD) programme (grade R)
29. The outcomes of a performance audit on the ECD programme will be included in the
education sector report, which will be tabled towards the end of 2014. The audit focused
on the economical, efficient and effective use of resources within the ECD programme.
Performance audit on the adult education and training (AET) programme
30. The outcomes of a performance audit on the AET programme will be included in the
education sector report, which will be tabled towards the end of 2014. The audit focused
on the economical, efficient and effective use of resources within the AET programme.
Investigations
31. The following investigations are in progress:
Description Reason
Thirty six new cases of fraudulent activities
were reported during the financial year.
Financial irregularities, alleged corruption,
nepotism and alleged procurement fraud.
Twenty eight cases are currently open
and in progress at the date of this report
Financial irregularities, alleged corruption,
nepotism and alleged procurement fraud

WESTERN CAPE PROVINCE
DEPARTMENT OF EDUCATION
VOTE 5
REPORT OF THE AUDITOR-GENERAL
for the year ended 31 March 2014
187
The following investigations were completed during the financial year:
Description Reason
Fifty-three cases were closed during the
financial year, 33 of which related to
fraud and other irregularities
Financial irregularities, alleged corruption,
nepotism and alleged procurement fraud
Cape Town
30 July 2014

WESTERN CAPE PROVINCE
DEPARTMENT OF EDUCATION
VOTE 5
APPROPRIATION STATEMENT
for the year ended 31 March 2014
188
Appropriation per programme
Programmes 2013/14 2012/13
Adjusted
Appro-
priation
Shifting of
Funds
Vire-
ment
Final
Appro-
priation
Actual
Expenditure
Vari-
ance
Expen-
diture as %
of final
appro-
priation
Final
Appro-
priation
Actual
Expenditure
R'000 R'000 R'000 R'000 R'000 R'000 % R'000 R'000
1. Administration
Current payment 463 324 (14 126) (21 615) 427 583 425 088 2 495 99.4 394 870 392 708
Transfers and subsidies 72 949 20 303 - 93 252 93 252 - 100.0 99 123 99 123
Payment for capital assets 58 931 (252) (12 036) 46 643 40 543 6 100 86.9 34 682 26 921
Payment for financial assets 18 191 (5 925) - 12 266 12 266 - 100.0 18 236 18 236
613 395 - (33 651) 579 744 571 149 8 595 - 546 911 536 988
2. Public Ordinary School
Education
Current payment 10 712 861 (102 675) (24 196) 10 585 990 10 577 066 8 924 99.9 9 812 838 9 798 650
Transfers and subsidies 675 184 95 242 - 770 426 770 426 - 100.0 650 209 648 456
Payment for capital assets 17 516 7 433 - 24 949 15 287 9 662 61.3 4 248 3 414
11 405 561 - (24 196) 11 381 365 11 362 779 18 586 - 10 467 295 10 450 520
3. Independent School
Subsidies
Transfers and subsidies 84 932 - (284) 84 648 84 648 - 100.0 72 321 72 321
Payment for financial assets - - - - - - - - -
84 932 - (284) 84 648 84 648 - - 72 321 72 321
4. Public Special School
Education
Current payment 757 589 5 422 12 024 775 035 775 035 - 100.0 681 631 677 441
Transfers and subsidies 147 508 (5 779) (9 755) 131 974 131 974 - 100.0 131 428 131 428
Payment for capital assets 2 972 357 - 3 329 3 329 - 100.0 11 232 11 232
908 069 - 2 269 910 338 910 338 - - 824 291 820 101
5. Further Education and
Training
Current payment 304 065 (14 389) - 289 676 289 657 19 100.0 273 885 273 819
Transfers and subsidies 49 032 14 389 - 63 421 63 421 - 100.0 323 704 323 704
353 097 - - 353 097 353 078 19 - 597 589 597 523
6. Adult Basic Education and
Training
Current payment 10 363 (5 318) (14) 5 031 5 031 - 100.0 7 106 7 106
Transfers and subsidies 27 549 5 318 - 32 867 32 867 - 100.0 29 814 29 814
37 912 - (14) 37 898 37 898 - - 36 920 36 920
7. Early Childhood
Development
Current payment 135 811 (10 405) - 125 406 125 304 102 99.9 100 000 100 000
Transfers and subsidies 320 901 10 405 8 925 340 231 340 231 - 100.0 283 894 283 894
456 712 - 8 925 465 637 465 535 102 - 383 894 383 894
8. Infrastructure Development
Current payment 183 728 (4 694) 21 369 200 403 200 403 - 100.0 188 413 153 028
Transfers and subsidies 95 750 23 002 24 183 142 935 142 935 - 100.0 89 818 89 818
Payment for capital assets 867 916 (18 308) - 849 608 710 974 138 634 83.7 512 756 507 826
1 147 394 - 45 552 1 192 946 1 054 312 138 634 - 790 987 750 672
9. Auxiliary and Associated
Services
Current payment 633 196 (8 160) - 625 036 624 383 653 99.9 608 010 607 146
Transfers and subsidies 14 723 7 475 297 22 495 22 495 - 100.0 9 937 9 937
Payment for capital assets 13 794 685 1 102 15 581 15 581 - 100.0 22 088 22 088
661 713 - 1 399 663 112 662 459 653 - 640 035 639 171
Subtotal
15 668 785 - - 15 668 785 15 502 196 166 589 98.9 14 360 243 14 288 110
Total 15 668 785 - - 15 668 785 15 502 196 166 589 98.9 14 360 243 14 288 110
Add: Departmental receipts -
17 348
Actual amounts per Statement of Financial Performance (Total Revenue) 15 668 785 14 377 591
Actual amounts per Statement of Financial Performance Expenditure 15 502 196
14 288 110

WESTERN CAPE PROVINCE
DEPARTMENT OF EDUCATION
VOTE 5
APPROPRIATION STATEMENT
for the year ended 31 March 2014
189
Appropriation per Economic classification
Economic
classification
2013/14 2012/13
Adjusted
Appro-
priation
Shifting
of Funds
Vire-
ment
Final
Appropriat
ion
Actual
Expen-
diture
Vari-
ance
Expen-
diture as %
of final
appro-
priation
Final
Appro-
priation
Actual
Expen-
diture
R'000 R'000 R'000 R'000 R'000 R'000 % R'000 R'000
Current payments
Compensation of
employees 11 640 672 (75 951) 2 231 11 566 952 11 566 933 19 100.0 10 747 047 10 742 371
Goods and services 1 560 265 (78 394) (14 663) 1 467 208 1 455 034 12 174 99.2 1 319 706 1 267 527
Transfers & subsidies
Departmental agencies
& accounts 5 821 6 - 5 827 5 827 - 100.0 5 534 5 534
Non-profit institutions 1 452 161 128 798 23 366 1 604 325 1 604 325 - 100.0 1 605 054 1 603 326
Households 30 546 41 538 - 72 084 72 084 - 100.0 79 648 79 623
Gifts and donations - 13 - 13 13 - 100.0 12 12
Payment for capital
assets
Buildings & other fixed
structures 877 056 (53 669) - 823 387 679 706 143 681 82.6 440 415 435 485
Machinery &
equipment 82 717 43 826 (9 832) 116 711 105 996 10 715 90.8 143 735 135 140
Intangible assets 1 356 (242) (1 102) 12 12 - 100.0 856 856
Payment for financial
assets 18 191 (5 925) - 12 266 12 266 - 100.0 18 236 18 236
Total 15 668 785 - - 15 668 785 15 502 196 166 589 98.9 14 360 243 14 288 110

WESTERN CAPE PROVINCE
DEPARTMENT OF EDUCATION
VOTE 5
APPROPRIATION STATEMENT
for the year ended 31 March 2014
190
Detail per Programme 1 – Administration
for the year ended 31 March 2014
Details per
Sub-Programme
2013/14 2012/13
Adjusted
Appro-
priation
Shifting of
Funds Virement
Final
Appro-
priation
Actual
Expen-
diture
Vari-
ance
Expen-
diture as
% of final
appro-
priation
Final
Appro-
priation
Actual
Expen-
diture
R'000 R'000 R'000 R'000 R'000 R'000 % R'000 R'000
1.1 Office of the MEC
Current payment 7 025 (1 113) - 5 912 5 912 - 100.0 5 942 5 942
Transfers and subsidies - 25 - 25 25 - 100.0 24 24
Payment for capital
assets 192 (12) - 180 180 - 100.0 374 374
1.2 Corporate Services
Current payment 230 038 (323) (9 893) 219 822 219 822 - 100.0 207 763 207 763
Transfers and subsidies 2 650 323 - 2 973 2 973 - 100.0 5 257 5 257
Payment for capital
assets 3 288 2 - 3 290 3 290 - 100.0 4 561 4 561
Payment for financial
assets 18 191 (5 925) - 12 266 12 266 - 100.0 18 217 18 217
1.3 Education
Management
Current payment 207 506 (12 435) (9 464) 185 607 183 112 2 495 98.7 163 147 160 985
Transfers and subsidies 28 209 30 976 - 59 185 59 185 - 100.0 82 107 82 107
Payment for capital
assets 51 815 - (10 934) 40 881 34 781 6 100 85.1 28 345 20 584
Payment for financial
assets - - - - - - - 19 19
1.4 Human Resource
Development
Current payment 9 496 - (2 258) 7 238 7 238 - 100.0 8 997 8 997
Transfers and subsidies 22 705 (9 244) - 13 461 13 461 - 100.0 - -
Payment for capital
assets - - - - - - - 19 19
1.5 Education Manage-
ment Information
System (EMIS)
Current payment 9 259 (255) - 9 004 9 004 - 100.0 9 021 9 021
Transfers and subsidies 19 385 (1 777) - 17 608 17 608 - 100.0 11 735 11 735
Payment for capital
assets 3 636 (242) (1 102) 2 292 2 292 - 100.0 1 383 1 383
Total 613 395 - (33 651) 579 744 571 149 8 595 98.5 546 911 536 988
Programme 1
Per Economic classification
2013/14 2012/13
Adjusted
Appro-
priation
Shifting of
Funds Virement
Final
Appro-
priation
Actual
Expen-
diture
Vari-
ance
Expen-
diture as
% of final
appropria
tion
Final
Appro-
priation
Actual
Expen-
diture
R'000 R'000 R'000 R'000 R'000 R'000 % R'000 R'000
Current payments
Compensation of employees 318 020 (11 168) (9 001) 297 851 297 851 - 100.0 247 596 247 596
Goods and services 145 304 (2 958) (12 614) 129 732 127 237 2 495 98.1 147 274 145 112
Transfers & subsidies
Departmental agencies &
accounts 2 14 - 16 16 - 100.0 1 1
Non-profit institutions 69 609 20 042 - 89 651 89 651 - 100.0 93 191 93 191
Households 3 338 234 - 3 572 3 572 - 100.0 5 919 5 919
Gifts and donations - 13 - 13 13 - 100.0 12 12
Payment for capital assets
Machinery & equipment 57 575 (10) (10 934) 46 631 40 531 6 100 86.9 33 826 26 065
Software & other intangible
assets 1 356 (242) (1 102) 12 12 - 100.0 856 856
Payment for financial assets 18 191 (5 925) - 12 266 12 266 - 100.0 18 236 18 236
Total 613 395 - (33 651) 579 744 571 149 8 595 98.5 546 911 536 988

WESTERN CAPE PROVINCE
DEPARTMENT OF EDUCATION
VOTE 5
APPROPRIATION STATEMENT
for the year ended 31 March 2014
191
Detail per Programme 2 – Public Ordinary School Education
for the year ended 31 March 2014
Details per
sub-programme
2013/14 2012/13
Adjusted
Appro-
priation
Shifting of
Funds Virement
Final
Appro-
priation
Actual
Expen-
diture
Vari-
ance
Expen-
diture
as % of
final
appro-
priation
Final
Appro-
priation
Actual
Expen-
diture
R'000 R'000 R'000 R'000 R'000 R'000 % R'000 R'000
2.1 Public Primary
School
Current payment 6 141 906 33 330 - 6 175 236 6 175 236 - 100.0 5 804 783 5 804 783
Transfers and
subsidies 410 012 10 274 - 420 286 420 286 - 100.0 383 871 383 871
Payment for capital
assets 40 1 797 - 1 837 1 837 - 100.0 - -
2.2 Public Secondary
Schools
Current payment 4 250 481 (130 782) (24 196) 4 095 503 4 095 503 - 100.0 3 686 495 3 686 495
Transfers and
subsidies 216 617 86 804 - 303 421 303 421 - 100.0 227 819 227 819
Payment for capital
assets - 1 773 - 1 773 1 773 - 100.0 650 650
2.3 Human Resource
Development
Current payment 76 768 1 379 - 78 147 78 147 - 100.0 75 781 75 781
Transfers and
subsidies 12 828 (5 883) - 6 945 6 945 - 100.0 9 545 9 545
Payment for capital
assets 295 1 308 - 1 603 1 603 - 100.0 3 142 2 308
2.4 Conditional Grants
Current payment 243 706 (6 602) - 237 104 228 180 8 924 96.2 245 779 231 591
Transfers and
subsidies 35 727 4 047 - 39 774 39 774 - 100.0 28 974 27 221
Payment for capital
assets 17 181 2 555 - 19 736 10 074 9 662 51.0 456 456
Total 11 405 561 - (24 196) 11 381 365 11 362 779 18 586 99.8 10 467 295 10 450 520
Programme 2
Per Economic classification
2013/14 2012/13
Adjusted
Appro-
priation
Shifting of
Funds Virement
Final
Appro-
priation
Actual
Expen-
diture
Vari-
ance
Expen-
diture
as % of
final
appro-
priation
Final
Appro-
priation
Actual
Expen-
diture
R'000 R'000 R'000 R'000 R'000 R'000 % R'000 R'000
Current payments
Compensation of
employees 9 659 733 (33 773) - 9 625 960 9 625 960 - 100.0 8 987 865 8 987 445
Goods and services 1 053 128 (68 902) (24 196) 960 030 951 106 8 924 99.1 824 973 811 205
Transfers & subsidies
Departmental agencies &
accounts 2 (2) - - - - - 2 2
Non-profit institutions 656 661 59 099 - 715 760 715 760 - 100.0 583 598 581 870
Households 18 521 36 145 - 54 666 54 666 - 100.0 66 609 66 584
Payment for capital assets
Buildings & other fixed
structures 9 319 (3 726) - 5 593 546 5 047 9.8 414 414
Machinery & equipment 8 197 11 159 - 19 356 14 741 4 615 76.2 3 834 3 000
Total 11 405 561 - (24 196) 11 381 365 11 362 779 18 586 99.8 10 467 295 10 450 520

WESTERN CAPE PROVINCE
DEPARTMENT OF EDUCATION
VOTE 5
APPROPRIATION STATEMENT
for the year ended 31 March 2014
192
Detail per Programme 3 – Independent School Subsidies
for the year ended 31 March 2014
Details per
sub-programme
2013/14 2012/13
Adjusted
Appro-
priation
Shifting of
Funds Virement
Final
Appro-
priation
Actual
Expen-
diture
Vari-
ance
Expen-
diture as %
of final
appro-
priation
Final
Appro-
priation
Actual
Expen-
diture
R'000 R'000 R'000 R'000 R'000 R'000 % R'000 R'000
3.1 Primary Phase
Transfers and
subsidies 46 533 796 - 47 329 47 329 - 100.0 35 406 35 406
3.2 Secondary Phase
Transfers and
subsidies 38 399 (796) (284) 37 319 37 319 - 100.0 36 915 36 915
Total 84 932 - (284) 84 648 84 648 - 100.0 72 321 72 321
Programme 3
Per Economic classification
2013/14 2012/13
Adjusted
Appro-
priation
Shifting of
Funds Virement
Final
Appro-
priation
Actual
Expen-
diture
Vari-
ance
Expen-
diture as %
of final
appro-
priation
Final
Appro-
priation
Actual
Expen-
diture
R'000 R'000 R'000 R'000 R'000 R'000 % R'000 R'000
Transfers & subsidies
Non-profit institutions 84 932 - (284) 84 648 84 648 - 100.0 72 321 72 321
Total 84 932 - (284) 84 648 84 648 - 100.0 72 321 72 321

WESTERN CAPE PROVINCE
DEPARTMENT OF EDUCATION
VOTE 5
APPROPRIATION STATEMENT
for the year ended 31 March 2014
193
Detail per Programme 4 – Public Special School Education
for the year ended 31 March 2014
Details per
sub-programme
2013/14 2012/13
Adjusted
Appro-
priation
Shifting
of Funds Virement
Final
Appro-
priation
Actual
Expen-
diture
Vari-
ance
Expen-
diture as %
of final
appro-
priation
Final
Appro-
priation
Actual
Expen-
diture
R'000 R'000 R'000 R'000 R'000 R'000 % R'000 R'000
4.1 Schools
Current payment 757 589 5 371 12 024 774 984 774 984 - 100.0 681 631 677 441
Transfers and subsidies 147 507 (5 778) (9 755) 131 974 131 974 - 100.0 131 428 131 428
Payment for capital
assets 2 972 357 - 3 329 3 329 - 100.0 11 232 11 232
4.2 Human Resource
Development
Current payment - 51 - 51 51 - 100.0 - -
Transfers and subsidies 1 (1) - - - - - - -
Total 908 069 - 2 269 910 338 910 338 - 100.0 824 291 820 101
Programme 4
Per Economic classification
2013/14 2012/13
Adjusted
Appro-
priation
Shifting
of Funds Virement
Final
Appro-
priation
Actual
Expen-
diture
Vari-
ance
Expen-
diture as %
of final
appro-
priation
Final
Appro-
priation
Actual
Expen-
diture
R'000 R'000 R'000 R'000 R'000 R'000 % R'000 R'000
Current payments
Compensation of employees 750 067 - 11 232 761 299 761 299 - 100.0 673 069 668 879
Goods and services 7 522 5 422 792 13 736 13 736 - 100.0 8 562 8 562
Transfers & subsidies
Non-profit institutions 146 118 (7 823) (9 755) 128 540 128 540 - 100.0 129 161 129 161
Households 1 390 2 044 - 3 434 3 434 - 100.0 2 267 2 267
Payment for capital assets
Buildings & other fixed
structures - - - - - - - 6 454 6 454
Machinery & equipment 2 972 357 - 3 329 3 329 - 100.0 4 778 4 778
Total 908 069 - 2 269 910 338 910 338 - 100.0 824 291 820 101

WESTERN CAPE PROVINCE
DEPARTMENT OF EDUCATION
VOTE 5
APPROPRIATION STATEMENT
for the year ended 31 March 2014
194
Detail per Programme 5 – Further Education and Training
for the year ended 31 March 2014
Details per
sub-programme
2013/14 2012/13
Adjusted
Appro-
priation
Shifting of
Funds Virement
Final
Appro-
priation
Actual
Expen-
diture
Vari-
ance
Expen-
diture as %
of final
appro-
priation
Final
Appro-
priation
Actual
Expen-
diture
R'000 R'000 R'000 R'000 R'000 R'000 % R'000 R'000
5.1 Public Institutions
Current payment 304 065 (14 389) - 289 676 289 657 19 100.0 273 885 273 819
Transfers and
subsidies 49 032 14 389 - 63 421 63 421 - 100.0 323 704 323 704
Total 353 097 - - 353 097 353 078 19 100.0 597 589 597 523
Programme 5
Per Economic classification
2013/14 2012/13
Adjusted
Appro-
priation
Shifting of
Funds Virement
Final
Appro-
priation
Actual
Expen-
diture
Vari-
ance
Expen-
diture as %
of final
appro-
priation
Final
Appro-
priation
Actual
Expen-
diture
R'000 R'000 R'000 R'000 R'000 R'000 % R'000 R'000
Current payments
Compensation of
employees 304 065 (14 389) - 289 676 289 657 19 100.0 273 885 273 819
Transfers & subsidies
Non-profit institutions 48 798 14 363 - 63 161 63 161 - 100.0 323 285 323 285
Households 234 26 - 260 260 - 100.0 419 419
Total 353 097 - - 353 097 353 078 19 100.0 597 589 597 523

WESTERN CAPE PROVINCE
DEPARTMENT OF EDUCATION
VOTE 5
APPROPRIATION STATEMENT
for the year ended 31 March 2014
195
Detail per Programme 6 – Adult Basic Education and Training
for the year ended 31 March 2014
Details per
sub-programme
2013/14 2012/13
Adjusted
Appro-
priation
Shifting
of Funds Virement
Final
Appro-
priation
Actual
Expen-
diture
Vari-
ance
Expen-
diture as %
of final
appro-
priation
Final
Appro-
priation
Actual
Expen-
diture
R'000 R'000 R'000 R'000 R'000 R'000 % R'000 R'000
6.1 Public Centres
Current payment 10 363 (5 434) (14) 4 915 4 915 - 100.0 7 106 7 106
Transfers and subsidies - 91 - 91 91 - 100.0 - -
6.2 Subsidies to Private
Centres
Current payment - 116 - 116 116 - 100.0 - -
Transfers and subsidies 27 547 5 229 - 32 776 32 776 - 100.0 29 814 29 814
6.3 Professional Services
Transfers and subsidies 1 (1) - - - - - - -
6.4 Human Resource
Development
Transfers and subsidies 1 (1) - - - - - - -
Total 37 912 - (14) 37 898 37 898 - 100.0 36 920 36 920
Programme 6
Per Economic classification
2013/14 2012/13
Adjusted
Appro-
priation
Shifting
of Funds Virement
Final
Appro-
priation
Actual
Expen-
diture
Vari-
ance
Expen-
diture as %
of final
appro-
priation
Final
Appro-
priation
Actual
Expen-
diture
R'000 R'000 R'000 R'000 R'000 R'000 % R'000 R'000
Current payments
Compensation of employees 8 921 (4 810) - 4 111 4 111 - 100.0 5 853 5 853
Goods and services 1 442 (508) (14) 920 920 - 100.0 1 253 1 253
Transfers & subsidies
Non-profit institutions 27 549 5 092 - 32 641 32 641 - 100.0 29 814 29 814
Households - 226 - 226 226 - 100.0 - -
Total 37 912 - (14) 37 898 37 898 - 100.0 36 920 36 920

WESTERN CAPE PROVINCE
DEPARTMENT OF EDUCATION
VOTE 5
APPROPRIATION STATEMENT
for the year ended 31 March 2014
196
Detail per Programme 7 – Early Childhood Development
for the year ended 31 March 2014
Details per
sub-programme
2013/14 2012/13
Adjusted
Appro-
priation
Shifting of
Funds Virement
Final
Appro-
priation
Actual
Expen-
diture
Vari-
ance
Expen-
diture as
% of final
appro-
priation
Final
Appro-
priation
Actual
Expen-
diture
R'000 R'000 R'000 R'000 R'000 R'000 % R'000 R'000
7.1 Grade R in Public
Schools
Current payment 92 824 (17 815) - 75 009 75 009 - 100.0 71 757 71 757
Transfers and subsidies 208 743 8 126 6 795 223 664 223 664 - 100.0 150 708 150 708
7.2 Grade R in Community
Centres
Transfers and subsidies 52 161 1 599 - 53 760 53 760 - 100.0 43 194 43 194
7.3 Pre-grade R Training
Current payment 40 072 8 091 - 48 163 48 163 - 100.0 28 243 28 243
Transfers and subsidies 54 860 - 2 130 56 990 56 990 - 100.0 73 007 73 007
7.4 Human Resource
Development
Transfers and subsidies 1 (1) - - - - - - -
7.5 Conditional Grant –
ECD
Current payment 2 915 (681) - 2 234 2 132 102 95.4 - -
Transfers and subsidies 5 136 681 - 5 817 5 817 - 100.0 16 985 16 985
Total 456 712 - 8 925 465 637 465 535 102 100.0 383 894 383 894
Programme 7
Per Economic classification
2013/14 2012/13
Adjusted
Appro-
priation
Shifting of
Funds Virement
Final
Appro-
priation
Actual
Expen-
diture
Vari-
ance
Expen-
diture as
% of final
appro-
priation
Final
Appro-
priation
Actual
Expen-
diture
R'000 R'000 R'000 R'000 R'000 R'000 % R'000 R'000
Current payments
Compensation of
employees 75 478 (12 336) - 63 142 63 142 - 100.0 64 203 64 203
Goods and services 60 333 1 931 - 62 264 62 162 102 99.8 35 797 35 797
Transfers & subsidies
Non-profit institutions 317 586 13 550 8 925 340 061 340 061 - 100.0 283 593 283 593
Households 3 315 (3 145) - 170 170 - 100.0 301 301
Total 456 712 - 8 925 465 637 465 535 102 100.00 383 894 383 894

WESTERN CAPE PROVINCE
DEPARTMENT OF EDUCATION
VOTE 5
APPROPRIATION STATEMENT
for the year ended 31 March 2014
197
Detail per Programme 8 – Infrastructure Development
for the year ended 31 March 2014
Details per
sub-programme
2013/14 2012/13
Adjusted
Appro-
priation
Shifting of
Funds Virement
Final
Appro-
priation
Actual
Expen-
diture
Vari-
ance
Expen-
diture as
% of final
appro-
priation
Final
Appro-
priation
Actual
Expen-
diture
R'000 R'000 R'000 R'000 R'000 R'000 % R'000 R'000
8.1 Administration
Current payment 5 321 1 663 - 6 984 6 984 - 100.0 526 526
Payment for capital
assets 5 179 (2 973) - 2 206 2 206 - 100.0 320 320
8.2 Public Ordinary
Schools
Current payment 178 407 (6 891) 21 369 192 885 192 885 - 100.0 187 779 152 394
Transfers and subsidies 95 750 20 602 24 183 140 535 140 535 - 100.0 89 818 89 818
Payment for capital
assets 845 737 (17 301) - 828 436 689 802 138 634 83.3 460 404 455 474
8.3 Public Special School
Education
Current payment - 487 - 487 487 - 100.0 108 108
Transfers and subsidies - 2 400 - 2 400 2 400 - 100.0 - -
Payment for capital
assets 7 000 (2 909) - 4 091 4 091 - 100.0 14 575 14 575
8.4 Early Childhood
Development
Current payment - 47 - 47 47 - 100.0 - -
Payment for capital
assets 10 000 4 875 - 14 875 14 875 - 100.0 37 457 37 457
Total 1 147 394 - 45 552 1 192 946 1 054 312 138 634 88.4 790 987 750 672
Programme 8
Per Economic classification
2013/14 2012/13
Adjusted
Appro-
priation
Shifting of
Funds Virement
Final
Appro-
priation
Actual
Expen-
diture
Vari-
ance
Expen-
diture as
% of final
appro-
priation
Final
Appro-
priation
Actual
Expen-
diture
R'000 R'000 R'000 R'000 R'000 R'000 % R'000 R'000
Current payments
Compensation of employees 4 471 975 - 5 446 5 446 - 100.0 456 456
Goods and services 179 257 (5 669) 21 369 194 957 194 957 - 100.0 187 957 152 572
Transfers & subsidies
Non-profit institutions 95 750 23 002 24 183 142 935 142 935 - 100.0 89 818 89 818
Payment for capital assets
Buildings and other fixed
structures 867 737 (49 943) - 817 794 679 160 138 634 83.0 425 133 420 203
Machinery & equipment 179 31 635 - 31 814 31 814 - 100.0 87 623 87 623
Total 1 147 394 - 45 552 1 192 946 1 054 312 138 634 88.4 790 987 750 672

WESTERN CAPE PROVINCE
DEPARTMENT OF EDUCATION
VOTE 5
APPROPRIATION STATEMENT
for the year ended 31 March 2014
198
Detail per Programme 9 – Auxiliary and Associated Services
for the year ended 31 March 2014
Details per
sub-programme
2013/14 2012/13
Adjusted
Appro-
priation
Shifting of
Funds Virement
Final
Appro-
priation
Actual
Expen-
diture
Vari-
ance
Expen-
diture as
% of final
appro-
priation
Final
Appro-
priation
Actual
Expen-
diture
R'000 R'000 R'000 R'000 R'000 R'000 % R'000 R'000
9.1 Payments to SETA
Transfers and subsidies 5 811 - - 5 811 5 811 - 100.0 5 524 5 524
9.2 Professional Services
Current payment 477 878 (6 339) - 471 539 471 539 - 100.0 455 082 455 082
Transfers and subsidies 8 707 5 668 - 14 375 14 375 - 100.0 3 982 3 982
Payment for capital
assets 13 599 671 774 15 044 15 044 - 100.0 21 789 21 789
9.3 External Examinations
Current payment 136 817 (307) - 136 510 136 510 - 100.0 135 676 135 676
Transfers and subsidies 205 307 297 809 809 - 100.0 421 421
Payment for capital
assets 195 - 328 523 523 - 100.0 145 145
9.4 Conditional Grants
Current payment 18 501 (1 514) - 16 987 16 334 653 96.2 17 252 16 388
Transfers and subsidies - 1 500 - 1 500 1 500 - 100.0 10 10
Payment for capital
assets - 14 - 14 14 - 100.0 154 154
Total 661 713 - 1 399 663 112 662 459 653 99.9 640 035 639 171
Programme 9
Per Economic classification
2013/14 2012/13
Adjusted
Appro-
priation
Shifting of
Funds Virement
Final
Appro-
priation
Actual
Expen-
diture
Vari-
ance
Expen-
diture as
% of final
appro-
priation
Final
Appro-
priation
Actual
Expen-
diture
R'000 R'000 R'000 R'000 R'000 R'000 % R'000 R'000
Current payments
Compensation of
employees 519 917 (450) - 519 467 519 467 - 100.0 494 120 494 120
Goods and services 113 279 (7 710) - 105 569 104 916 653 99.4 113 890 113 026
Transfers & subsidies
Departmental
agencies & accounts 5 817 (6) - 5 811 5 811 - 100.0 5 531 5 531
Non-profit institutions 5 158 1 473 297 6 928 6 928 - 100.0 273 273
Households 3 748 6 008 - 9 756 9 756 - 100.0 4 133 4 133
Payment for capital
assets
Buildings and other
fixed structures - - - - - - 0.0 8 414 8 414
Machinery &
equipment 13 794 685 1 102 15 581 15 581 - 100.0 13 674 13 674
Total 661 713 - 1 399 663 112 662 459 653 99.9 640 035 639 171

WESTERN CAPE PROVINCE
DEPARTMENT OF EDUCATION
VOTE 5
NOTES TO THE APPROPRIATION STATEMENT
for the year ended 31 March 2014
199
1. Detail of transfers and subsidies as per Appropriation Act (after Virement):
Detail of these transactions can be viewed in the note on Transfers and subsidies,
disclosure notes and Annexure 1 (A-C) to the Annual Financial Statements.
2. Detail of specifically and exclusively appropriated amounts voted (after Virement):
Detail of these transactions can be viewed in note 1 (Annual Appropriation) to the
Annual Financial Statements.
3. Detail on payments for financial assets
Detail of these transactions per programme can be viewed in the note to Payments for
financial assets to the Annual Financial Statements.
4. Explanations of material variances from Amounts Voted (after virement):
4.1 Per programme
Final
Appropriation
Actual
Expenditure Variance
Variance as
a % of Final
Appro-
priation
R'000 R'000 R'000 %
Programme name
Administration 579 744 571 149 8 595 1%
Public ordinary school education 11 381 365 11 362 779 18 586 0%
Independent school subsidies 84 648 84 648 - 0%
Public special school education 910 338 910 338 - 0%
Further education and training 353 097 353 078 19 0%
Adult basic education and training 37 898 37 898 - 0%
Early childhood development 465 637 465 535 102 0%
Infrastructure development 1 192 946 1 054 312 138 634 12%
Auxiliary and associated services 663 112 662 459 653 0%
The under-expenditure on Administration is due to delays in the delivery of a wrapping
machine procured for examination administration and under-expenditure on Infrastructure
development is due to construction of capital projects at public schools that could not be
completed before the end of the financial year.

WESTERN CAPE PROVINCE
DEPARTMENT OF EDUCATION
VOTE 5
NOTES TO THE APPROPRIATION STATEMENT
for the year ended 31 March 2014
200
4.2 Per economic classification
Final
Appropriation
Actual
Expenditure Variance
Variance as
a % of Final
Appropriatio
n
R’000 R’000 R’000 %
Current expenditure
Compensation of employees 11 566 952 11 566 933 19 0%
Goods and services 1 467 208 1 455 034 12 174 1%
Transfers and subsidies
Departmental agencies and
accounts 5 827 5 827 - 0%
Non-profit institutions 1 604 325 1 604 325 - 0%
Households 72 084 72 084 - 0%
Gifts and donations 13 13 - 0%
Payments for capital assets
Buildings and other fixed structures 823 387 679 706 143 681 17%
Machinery and equipment 116 711 105 996 10 715 9%
Intangible assets 12 12 - 0%
Payments for financial assets 12 266 12 266 - 0%
Explanation of variance: The under-expenditure on machinery and equipment and buildings
and other fixed structures is due to delays in the delivery of a wrapping machine procured for
examination administration and construction of capital projects at public schools that could
not be completed before the end of the financial year.
4.3 Per conditional grant
Final
Appro-
priation
Actual
Expen-
diture
Variance Variance as
a %
of Final
Approp.
R’000 R’000 R’000 %
Basic Education
HIV/AIDS (Life Skills Education) Grant 18 501 17 848 653 4%
National School Nutrition Programme Grant 265 103 258 328 6 775 3%
Technical Secondary School Recapitalisation
Grant 13 898 3 717 10 181 73%
Dinaledi Schools Grant 13 366 11 868 1 498 11%
Education Infrastructure Grant 960 465 821 830 138 635 14%
Higher Education & Training
Further Education and Training Colleges Grant 125 406 125 304 102 0%
EPWP Integrated Grant for Provinces 3 000 3 000 - 0%
Social Sector EPWP Incentive Grant to
Provinces 12 298 12 064 234 2%

WESTERN CAPE PROVINCE
DEPARTMENT OF EDUCATION
VOTE 5
NOTES TO THE APPROPRIATION STATEMENT
for the year ended 31 March 2014
201
Explanation of variance: The under spending on HIV/AIDS (Life Skills Education) Grant is due to
suppliers who could not submit the outstanding invoices for payment by the financial year-
end for expenditure committed. The saving on National School Nutrition Programme Grant is
due to a milk pilot to have been conducted early in the 2013/14 financial year to test the
possibilities of providing learners with a sachet of milk once a week. Delays in sourcing a
supply for the packaging material were responsible for the pilot only taking place in
November 2013. The under-expenditure on Technical Secondary School Recapitalisation
Grant is due to delays with the construction of mechanical and civil technology workshops as
well as delays with the delivery of ICT hardware and mechanical, electrical and civil
technology toolkits at technical secondary schools. The saving on Dinaledi Schools Grant is
mainly due to delays in the tender procedures for the purchasing of ICT equipment and
infrastructure at focus schools for which tenders were only awarded in April 2014. The under-
expenditure on Education Infrastructure Grant is due to delays of ASIDI capital infrastructure
projects at public ordinary schools. The saving on Social sector EPWP incentive grant to
provinces is mainly due to fewer claims received from FET colleges for capacity building of
data capturers and first aid training of ECD practitioner assistants.

WESTERN CAPE PROVINCE
DEPARTMENT OF EDUCATION
VOTE 5
STATEMENT OF FINANCIAL PERFORMANCE
for the year ended 31 March 2014
202
2013/14
2012/13
Note
R'000
R'000
REVENUE
Annual appropriation
1
15 668 785
14 360 243
Departmental revenue
2
-
17 348
TOTAL REVENUE
15 668 785
14 377 591
EXPENDITURE
Current expenditure
Compensation of employees
3
11 566 933
10 742 371
Goods and services
4
1 455 034
1 267 527
Total current expenditure
13 021 967
12 009 898
Transfers and subsidies
Transfers and subsidies
6
1 682 249
1 688 495
Total transfers and subsidies
1 682 249 1 688 495
Expenditure for capital assets
Tangible assets
7
785 702
570 625
Intangible assets
7
12
856
Total expenditure for capital assets
785 714
571 481
Payments for financial assets
5
12 266
18 236
TOTAL EXPENDITURE
15 502 196 14 288 110
SURPLUS FOR THE YEAR
166 589
89 481
Reconciliation of Net Surplus for the year
Voted Funds
166 589
72 133
Annual appropriation
166 589
72 133
Departmental revenue and NRF Receipts
13
-
17 348
SURPLUS FOR THE YEAR
166 589
89 481

WESTERN CAPE PROVINCE
DEPARTMENT OF EDUCATION
VOTE 5
STATEMENT OF FINANCIAL POSITION
as at 31 March 2014
203
2013/14
2012/13
Note
R'000
R'000
ASSETS
Current Assets
219 977
156 545
Cash and cash equivalents
8
135 869 10
Prepayments and advances
9
- 47
Receivables
10
84 108 156 488
Non-Current Assets
15 752 15 489
Investments
11
15 752 15 489
TOTAL ASSETS
235 729 172 034
LIABILITIES
Current Liabilities
170 732 102 555
Voted funds to be surrendered to the Revenue Fund
12
166 589 72 133
Departmental revenue and NRF Receipts to be
surrendered to the Revenue Fund 13
2 111 10 991
Bank overdraft
14
- 17 142
Payables
15
2 032 2 289
TOTAL LIABILITIES 170 732
102 555
NET ASSETS 64 997
69 479
Represented by:
Capitalisation reserve 15 752 15 489
Recoverable revenue 49 245 53 990
TOTAL 64 997
69 479

WESTERN CAPE PROVINCE
DEPARTMENT OF EDUCATION
VOTE 5
STATEMENT OF CHANGES IN NET ASSETS
for the year ended 31 March 2014
204
2013/14
2012/13
Note
R'000
R'000
NET ASSETS
Capitalisation Reserves
Opening balance
15 489 14 872
Transfers:
Movement in Operational Funds
263 617
Closing balance
15 752 15 489
Recoverable revenue
Opening balance 53 990 70 584
Transfers: (4 745) (16 594)
Irrecoverable amounts written off 5.2 (4 745) (16 594)
Closing balance
49 245 53 990
Total 64 997 69 479

WESTERN CAPE PROVINCE
DEPARTMENT OF EDUCATION
VOTE 5
CASH FLOW STATEMENT
for the year ended 31 March 2014
205
2013/14
2012/13
Note
R'000
R'000
CASH FLOWS FROM OPERATING ACTIVITIES
Receipts
15 702 339 14 402 124
Annual appropriated funds received
1.1
15 668 785 14 360 243
Departmental revenue received
2
31 736 38 351
Interest received 2.3 1 818 3 530
Net decrease in working capital 72 170 (39 119)
Surrendered to Revenue Fund (114 567) (49 028)
Current payments (13 021 967) (12 009 898)
Payments for financial assets 5 (12 266) (18 236)
Transfers and subsidies paid (1 682 249) (1 688 495)
Net cash flow available from operating activities 943 460 597 348
CASH FLOWS FROM INVESTING ACTIVITIES
Payments for capital assets (785 714) (571 481)
(Increase) in investments (263) (617)
Net cash flows from investing activities (785 977) (572 098)
CASH FLOWS FROM FINANCING ACTIVITIES
(Decrease) in net assets (4 482) (15 977)
Net cash flows from financing activities (4 482) (15 977)
Net increase in cash and cash equivalents 153 001 9 273
Cash and cash equivalents at beginning of period 17 (17 132) (26 405)
Cash and cash equivalents at end of period 135 869 (17 132)

WESTERN CAPE PROVINCE
DEPARTMENT OF EDUCATION
VOTE 5
ACCOUNTING POLICIES
for the year ended 31 March 2014
206
Summary of significant accounting policies
The financial statements have been prepared in accordance with the following policies,
which have been applied consistently in all material aspects, unless otherwise indicated.
The historical cost convention has been used, except where otherwise indicated.
Management has used assessments and estimates in preparing the annual financial
statements. These are based on the best information available at the time of preparation.
Where appropriate and meaningful, additional information has been disclosed to enhance
the usefulness of the financial statements and to comply with the statutory requirements of
the Public Finance Management Act (PFMA), Act 1 of 1999 (as amended by Act 29 of 1999),
and the Treasury Regulations issued in terms of the PFMA and the annual Division of Revenue
Act.
1. Basis of preparation
The financial statements have been prepared in accordance with the Modified Cash
Standard.
2. Going concern
The financial statements have been prepared on a going concern basis.
3. Presentation currency
Amounts have been presented in the currency of the South African Rand (R) which is
also the functional currency of the department.
4. Rounding
Unless otherwise stated financial figures have been rounded to the nearest one
thousand Rand (R’000).
5. Foreign currency translation
Cash flows arising from foreign currency transactions are translated into South African
Rands using the exchange rates prevailing at the date of payment/receipt.
6. Current year comparison with budget
A comparison between the approved, final budget and actual amounts for each
programme and economic classification is included in the appropriation statement.
7. Revenue
7.1 Appropriated funds
Appropriated funds comprises of departmental allocations as well as direct charges
against the revenue fund (i.e. statutory appropriation).
Appropriated funds are recognised in the statement of financial performance on the
date the appropriation becomes effective. Adjustments made in terms of the
adjustments budget process are recognised in the statement of financial
performance on the date the adjustments become effective.
The net amount of any appropriated funds due to/from the relevant revenue fund at
the reporting date is recognised as a payable/receivable in the statement of
financial position.

WESTERN CAPE PROVINCE
DEPARTMENT OF EDUCATION
VOTE 5
ACCOUNTING POLICIES
for the year ended 31 March 2014
207
7.2 Departmental revenue
Departmental revenue is recognised in the statement of financial performance when
received and is subsequently paid into the relevant revenue fund, unless stated
otherwise.
Any amount owing to the relevant revenue fund at the reporting date is recognised
as a payable in the statement of financial position.
7.3 Accrued departmental revenue
Accruals in respect of departmental revenue (excluding tax revenue) are recorded
in the notes to the financial statements when:
it is probable that the economic benefits or service potential associated with the
transaction will flow to the department; and
the amount of revenue can be measured reliably.
The accrued revenue is measured at the fair value of the consideration receivable.
Accrued tax revenue (and related interest and/penalties) is measured at amounts
receivable from collecting agents.
8. Expenditure
8.1 Compensation of employees
8.1.1 Salaries and wages
Salaries and wages are recognised in the statement of financial performance on the
date of payment.
8.1.2 Social contributions
Social contributions made by the department in respect of current employees are
recognised in the statement of financial performance on the date of payment.
Social contributions made by the department in respect of ex-employees are
classified as transfers to households in the statement of financial performance on the
date of payment.
8.2 Other expenditure
Other expenditure (such as goods and services, transfers and subsidies and
payments for capital assets) is recognised in the statement of financial performance
on the date of payment. The expense is classified as a capital expense if the total
consideration paid is more than the capitalisation threshold.
8.3 Accrued expenditure payable
Accrued expenditure payable is recorded in the notes to the financial statements
when the goods are received or, in the case of services, when they are rendered to
the department.
Accrued expenditure payable is measured at cost.

WESTERN CAPE PROVINCE
DEPARTMENT OF EDUCATION
VOTE 5
ACCOUNTING POLICIES
for the year ended 31 March 2014
208
8.4 Leases
8.4.1 Operating leases
Operating lease payments made during the reporting period are recognised as
current expenditure in the statement of financial performance on the date of
payment.
The operating lease commitments are recorded in the notes to the financial
statements.
8.4.2 Finance leases
Finance lease payments made during the reporting period are recognised as capital
expenditure in the statement of financial performance on the date of payment.
The finance lease commitments are recorded in the notes to the financial statements
and are not apportioned between the capital and interest portions.
Finance lease assets acquired at the end of the lease term are recorded and
measured at the lower of:
cost, being the fair value of the asset; or
the sum of the minimum lease payments made, including any payments made to
acquire ownership at the end of the lease term, excluding interest.
9. Cash and cash equivalents
Cash and cash equivalents are stated at cost in the statement of financial position.
Bank overdrafts are shown separately on the face of the statement of financial
position.
For the purposes of the cash flow statement, cash and cash equivalents comprise
cash on hand, deposits held, other short-term highly liquid investments and bank
overdrafts.
10. Prepayments and advances
Prepayments and advances are recognised in the statement of financial position
when the department receives or disburses the cash.
Prepayments and advances are initially and subsequently measured at cost.
11. Loans and receivables
Loans and receivables are recognised in the statement of financial position at cost
plus accrued interest, where interest is charged, less amounts already settled or
written-off.
12. Investments
Investments are recognised in the statement of financial position at cost.
13. Impairment of financial assets
Where there is an indication of impairment of a financial asset, an estimation of the
reduction in the recorded carrying value, to reflect the best estimate of the amount
of the future economic benefits expected to be received from that asset, is recorded
in the notes to the financial statements.
14. Payables
Loans and payables are recognised in the statement of financial position at cost.

WESTERN CAPE PROVINCE
DEPARTMENT OF EDUCATION
VOTE 5
ACCOUNTING POLICIES
for the year ended 31 March 2014
209
15. Net Assets
15.1 Capitalisation reserve
The capitalisation reserve comprises of financial assets and/or liabilities originating in
a prior reporting period but which are recognised in the statement of financial
position for the first time in the current reporting period. Amounts are recognised in
the capitalisation reserves when identified in the current period and are transferred
to the Provincial Revenue Fund when the underlying asset is disposed and the
related funds are received.
15.2 Recoverable revenue
Amounts are recognised as recoverable revenue when a payment made in a
previous financial year becomes recoverable from a debtor in the current financial
year. Amounts are either transferred to the Provincial Revenue Fund when recovered
or are transferred to the statement of financial performance when written-off.
16. Capital Assets
16.1 Immovable capital assets
Immovable capital assets are initially recorded in the notes to the financial
statements at cost. Immovable capital assets acquired through a non-exchange
transaction is measured at fair value as at the date of acquisition.
Where the cost of immovable capital assets cannot be determined accurately, the
immovable capital assets are measured at R1 unless the fair value of the asset has
been reliably estimated, in which case the fair value is used.
All assets acquired prior to 1 April 2002 (or a later date as approved by the OAG) are
recorded at R1.
Immovable capital assets are subsequently carried at cost and are not subject to
depreciation or impairment.
Subsequent expenditure that is of a capital nature is added to the cost of the asset
at the end of the capital project unless the immovable asset is recorded by another
department in which case the completed project costs are transferred to that
department.
16.2 Movable capital assets
Movable capital assets are initially recorded in the notes to the financial statements
at cost. Movable capital assets acquired through a non-exchange transaction is
measured at fair value as at the date of acquisition.
Where the cost of movable capital assets cannot be determined accurately, the
movable capital assets are measured at fair value and where fair value cannot be
determined; the movable assets are measured at R1.
All assets acquired prior to 1 April 2002 (or a later date as approved by the OAG) are
recorded at R1.
Movable capital assets are subsequently carried at cost and are not subject to
depreciation or impairment.
Subsequent expenditure that is of a capital nature is added to the cost of the asset
at the end of the capital project unless the movable asset is recorded by another
department/entity in which case the completed project costs are transferred to that
department.

WESTERN CAPE PROVINCE
DEPARTMENT OF EDUCATION
VOTE 5
ACCOUNTING POLICIES
for the year ended 31 March 2014
210
16.3 Intangible assets
Intangible assets are initially recorded in the notes to the financial statements at cost.
Intangible assets acquired through a non-exchange transaction are measured at fair
value as at the date of acquisition.
Internally generated intangible assets are recorded in the notes to the financial
statements when the department commences the development phase of the
project.
Where the cost of intangible assets cannot be determined accurately, the intangible
capital assets are measured at fair value and where fair value cannot be
determined; the intangible assets are measured at R1.
All assets acquired prior to 1 April 2002 (or a later date as approved by the OAG) are
recorded at R1.
Intangible assets are subsequently carried at cost and are not subject to
depreciation or impairment.
Subsequent expenditure that is of a capital nature is added to the cost of the asset
at the end of the capital project unless the intangible asset is recorded by another
department/entity in which case the completed project costs are transferred to that
department.
17. Provisions and Contingents
17.1 Provisions
Provisions are recorded in the notes to the financial statements when there is a
present legal or constructive obligation to forfeit economic benefits as a result of
events in the past and it is probable that an outflow of resources embodying
economic benefits or service potential will be required to settle the obligation and a
reliable estimate of the obligation can be made. The provision is measured as the
best estimate of the funds required to settle the present obligation at the reporting
date.
17.2 Contingent liabilities
Contingent liabilities are recorded in the notes to the financial statements when there
is a possible obligation that arises from past events, and whose existence will be
confirmed only by the occurrence or non-occurrence of one or more uncertain
future events not within the control of the department or when there is a present
obligation that is not recognised because it is not probable that an outflow of
resources will be required to settle the obligation or the amount of the obligation
cannot be measured reliably
17.3 Contingent assets
Contingent assets are recorded in the notes to the financial statements when a
possible asset arises from past events, and whose existence will be confirmed by the
occurrence or non-occurrence of one or more uncertain future events not within the
control of the department

WESTERN CAPE PROVINCE
DEPARTMENT OF EDUCATION
VOTE 5
ACCOUNTING POLICIES
for the year ended 31 March 2014
211
17.4 Commitments
Commitments are recorded at cost in the notes to the financial statements when
there is a contractual arrangement or an approval by management in a manner
that raises a valid expectation that the department will discharge its responsibilities
thereby incurring future expenditure that will result in the outflow of cash.
18. Unauthorised expenditure
Unauthorised expenditure is recognised in the statement of financial position until
such time as the expenditure is either:
approved by Parliament or the Provincial Legislature with funding and the related
funds are received; or
approved by Parliament or the Provincial Legislature without funding and is written
off against the appropriation in the statement of financial performance; or
transferred to receivables for recovery.
Unauthorised expenditure is measured at the amount of the confirmed unauthorised
expenditure.
19. Fruitless and wasteful expenditure
Fruitless and wasteful expenditure is recorded in the notes to the financial statements
when confirmed. The amount recorded is equal to the total value of the fruitless and
or wasteful expenditure incurred.
Fruitless and wasteful expenditure is removed from the notes to the financial
statements when it is resolved or transferred to receivables for recovery.
Fruitless and wasteful expenditure receivables are measured at the amount that is
expected to be recoverable and are de-recognised when settled or subsequently
written-off as irrecoverable.
20. Irregular expenditure
Irregular expenditure is recorded in the notes to the financial statements when
confirmed. The amount recorded is equal to the value of the irregular expenditure
incurred unless it is impracticable to determine, in which case reasons therefor are
provided in the note.
Irregular expenditure is removed from the note when it is either condoned by the
relevant authority, transferred to receivables for recovery or not condoned and is not
recoverable.
Irregular expenditure receivables are measured at the amount that is expected to
be recoverable and are de-recognised when settled or subsequently written-off as
irrecoverable.
21. Key management personnel
Compensation paid to key management personnel including their family members
where relevant, is included in the disclosure notes.

WESTERN CAPE PROVINCE
DEPARTMENT OF EDUCATION
VOTE 5
NOTES TO THE ANNUAL FINANCIAL STATEMENTS
for the year ended 31 March 2014
212
1. Annual Appropriation
1.1 Annual Appropriation
Final
Appropriation
Actual Funds
Received
Funds not
requested/
not received
Appropriation
received
2013/14 2013/14 2013/14 2012/13
R'000 R'000 R'000
R'000
Programmes
Administration 579 744 613 395 (33 651) 549 872
Public ordinary school
education 11 381 365 11 405 561 (24 196) 11 614 865
Independent school subsidies 84 648 84 932 (284) 72 697
Public special school
education 910 338 908 069 2 269 892 675
Further education and training 353 097 353 097 - 597 589
Adult basic education and
training 37 898 37 912 (14) 35 818
Early childhood development 465 637 456 712 8 925 429 572
Infrastructure development 1 192 946 1 147 394 45 552 167 155
Auxiliary and associated
services 663 112 661 713 1 399 -
Total 15 688 785 15 668 785 - 14 360 243
Note 2013/14 2012/13
R'000 R'000
1.2 Conditional grants**
Total grants received 32 1 639 728 1 337 749
** It should be noted that the conditional grants are included in the amounts per the Final
Appropriation in Note 1.1
2. Departmental Revenue
Sales of goods and services other than capital assets 2.1 11 959 13 172
Fines, penalties and forfeits 2.2 774 761
Interest, dividends and rent on land 2.3 1 818 3 530
Transactions in financial assets and liabilities 2.4 19 003 24 418
Total revenue collected 33 554 41 881
Less: Own revenue included in appropriation 13 33 554 24 533
Departmental revenue collected - 17 348
2.1 Sales of goods and services other than capital assets 2
Sales of goods and services produced by the
department 11 701 13 032
Sales by market establishment 11 701 13 032
Sales of scrap, waste and other used current goods 258 140
Total 11 959 13 172

WESTERN CAPE PROVINCE
DEPARTMENT OF EDUCATION
VOTE 5
NOTES TO THE ANNUAL FINANCIAL STATEMENTS
for the year ended 31 March 2014
213
Note 2013/14 2012/13
R'000 R'000
2.2 Fines, penalties and forfeits 2
Fines 774 761
Total 774 761
2.3 Interest, dividends and rent on land 2
Interest 1 818 3 530
Total 1 818 3 530
2.4 Transactions in financial assets and liabilities 2
Receivables 13 356 14 354
Other Receipts including Recoverable Revenue 5 647 10 064
Total 19 003 24 418
3. Compensation of employees
3.1 Salaries and wages
Basic salary 8 642 942 7 997 746
Performance award 23 409 22 210
Service Based 26 133 17 655
Compensative/circumstantial 131 647 115 374
Periodic payments 9 046 9 672
Other non-pensionable allowances 1 229 333 1 149 943
Total 10 062 510 9 312 600
3.2 Social contributions
Employer contributions
Pension 1 023 142 953 398
Medical 478 431 473 759
UIF 6 9
Bargaining council 895 662
Official unions and associations 1 949 1 943
Total 1 504 423 1 429 771
Total compensation of employees 11 566 933 10 742 371
Average number of employees 40 537 40 124
Sub-note 3.1 i.r.o Compensative/circumstantial comparatives for 2012/13 increased by R6 486
million as a results of a re-classification of expenditure i.r.o. learnerships previously listed under
Goods & services.

WESTERN CAPE PROVINCE
DEPARTMENT OF EDUCATION
VOTE 5
NOTES TO THE ANNUAL FINANCIAL STATEMENTS
for the year ended 31 March 2014
214
Note 2013/14 2012/13
R'000 R'000
4. Goods and services
Administrative fees 611 8 803
Advertising 5 697 8 393
Minor assets 4.1 50 739 37 175
Bursaries (employees) 4 669 4 286
Catering 14 265 10 552
Communication 11 669 12 043
Computer services 4.2 15 844 16 339
Consultants, contractors and agency/ outsourced
services 4.3 342 315 306 468
Entertainment 389 258
Audit cost – external 4.4 11 892 10 499
Inventory 4.5 417 486 293 327
Operating leases 5 130 14 684
Property payments 4.6 260 786 249 803
Rental and hiring 12 841 3 918
Transport provided as part of the departmental
activities 211 418 193 782
Travel and subsistence 4.7 56 336 47 572
Venues and facilities 5 983 17 500
Training and development 11 995 27 024
Other operating expenditure 4.8 14 969 13 101
Total 1 455 034 1 267 527
Sub-note 4.8 i.r.o. Other operating expenditure comparatives for 2012/13 decreased by
R6 486 million as a result of a re-classification of expenditure i.r.o. Learnerships previously listed
under Goods & services, now included under Compensation of Employees.
4.1 Minor assets 4
Tangible assets 46 214 34 175
Machinery and equipment 46 214 34 175
Intangible assets 4 525 3 000
Total 50 739 37 175
4.2 Computer services 4
SITA computer services 11 321 8 9 423
External computer service providers 4 523 6 916
Total 15 844 16 339

WESTERN CAPE PROVINCE
DEPARTMENT OF EDUCATION
VOTE 5
NOTES TO THE ANNUAL FINANCIAL STATEMENTS
for the year ended 31 March 2014
215
Note 2013/14 2012/13
R'000 R'000
4.3 Consultants, contractors and agency/ outsourced
services 4
Business and advisory services 34 769 36 839
Legal costs 6 235 3 344
Contractors 5 798 6 759
Agency and support/outsourced services 295 513 259 526
Total 342 315 306 468
4.4 Audit cost - external 4
Regularity audits 10 990 9 249
Performance audits 219 666
Computer audits 683 584
Total 11 892 10 499
4.5 Inventory (Western Cape ONLY) 4
Learning and teaching support material 385 242 252 722
Food and food supplies 989 852
Other consumables 1 961 1 250
Materials and supplies 235 201
Stationery and printing 28 757 37 942
Medical supplies 302 360
Total 417 486 2 293 327
4.6 Property payments 4
Municipal services 51 194 8 62 934
Property maintenance and repairs 196 932 175 846
Other 12 660 11 023
Total 260 786 249 803
4.7 Travel and subsistence 4
Local 55 964 47 559
Foreign 372 13
Total 56 336 47 572
4.8 Other operating expenditure 4
Professional bodies, membership and subscription
fees 1 463 8 1 315
Resettlement costs 2 507 1 805
Other 10 999 9 981
Total 14 969 13 101

WESTERN CAPE PROVINCE
DEPARTMENT OF EDUCATION
VOTE 5
NOTES TO THE ANNUAL FINANCIAL STATEMENTS
for the year ended 31 March 2014
216
Note 2013/14 2012/13
R'000 R'000
5. Payments for financial assets
Other material losses written off 5.1 52 2 126
Debts written off 5.2 12 214 16 110
Total 12 266 18 236
5.1 Other material losses written off 5
Nature of losses
Claims against the state - 2
Irregular expenditure - 1 883
Government Garage accidents 30 241
Fruitless and wasteful expenditure 22 -
Total 52 2 126
5.2 Debts written off
Nature of debts written off 5
Other debt written off
Employee tax 349 335
Compensation 9 365 10 083
Bursaries 831 2 039
Other 273 569
Interest on debts 1 396 3 084
Total 12 214 16 110
6. Transfers and Subsidies
Departmental agencies and accounts Annexure 1A 5 827 5 534
Non-profit institutions Annexure 1B 1 604 325 1 603 326
Households Annexure 1C 72 084 79 623
Gifts, donations and sponsorships made Annexure 1D 13 12
Total 1 682 249 1 688 495
7. Expenditure for capital assets
Tangible assets 785 702 570 625
Buildings and other fixed structures 30 679 706 435 485
Machinery and equipment 28 105 996 135 140
Intangible assets 12 856
Software 29 12 856
Total 785 714 571 481

WESTERN CAPE PROVINCE
DEPARTMENT OF EDUCATION
VOTE 5
NOTES TO THE ANNUAL FINANCIAL STATEMENTS
for the year ended 31 March 2014
217
7.1 Analysis of funds utilised to acquire capital assets –
2013/14
Voted
funds
Aid
assistance Total
R’000 R’000 R’000
Tangible assets 785 702 - 785 702
Buildings and other fixed structures 679 706 - 679 706
Machinery and equipment 105 996 - 105 996
Intangible assets 12 - 12
Software 12 - 12
Total 785 714 - 785 714
7.2 Analysis of funds utilised to acquire capital assets –
2012/13
Voted
funds
Aid
assistance Total
R’000 R’000 R’000
Tangible assets 570 625 - 570 625
Buildings and other fixed structures 435 485 - 435 485
Machinery and equipment 135 140 - 135 140
Intangible assets 856 - 856
Software 856 - 856
Total 571 481 - 571 481
Note 2013/14 2012/13
R'000 R'000
8. Cash and Cash Equivalents
Consolidated Paymaster General Account 135 869 -
Cash on hand - 10
Total 135 869 10
9. Prepayments and advances
Travel and subsistence - 47
Total - 47

WESTERN CAPE PROVINCE
DEPARTMENT OF EDUCATION
VOTE 5
NOTES TO THE ANNUAL FINANCIAL STATEMENTS
for the year ended 31 March 2014
218
2013/14 2012/13
Less than
one year
One to
three
years
Older
than
three
years
Total
Note R’000 R’000 R’000 R’000 R’000
10. Receivables
Claims recoverable 10.1 6 034 - 455 6 489 18 087
Annexure 3
Recoverable expenditure 10.2 4 199 - - 4 199 58 863
Staff debt 10.3 1 959 7 549 19 216 28 724 25 739
Other debtors 10.4 3 250 7 644 33 802 44 696 53 799
Total 15 442 15 193 53 473 84 108 156 488
Note 2013/14 2012/13
R'000 R'000
10.1 Claims recoverable 10
National departments 4 641 17 242
Provincial departments 1 007 242
Private enterprises 447 332
Household and non-profit institutions 394 271
Total 6 489 18 087
10.2 Recoverable expenditure (disallowance accounts) 10
Disallowance accounts 1 532 53 404
Salary: Reversal Control 1 688 4 012
Salary: Tax Debt 959 1 447
Salary: Garnishee order 20 -
Total 4 199 58 863
The comparatives for receivables i.r.o. the 2012/13 financial year have been re-stated.
Disallowance accounts (R53 404) was previously included under the sub-note 10.4 for Other
Debtors. This is in line with the National Treasury’s classification as these amounts have not yet
been taken up as debts.
The same applies to the comparatives i.r.o. the Salary: Reversal, Tax Debt & Garnishee Order
accounts, which were previously included under the sub-note 10.3 for Staff Debt. This is also
consistent with the National Treasury’s classification as these amounts are also recoverable
and not yet taken up as debts.
10.3 Staff debt 10
Debt account 28 724 25 739
Total 28 724 25 739
The comparative for this sub-note has been restated. See footnote to sub-note 10.2

WESTERN CAPE PROVINCE
DEPARTMENT OF EDUCATION
VOTE 5
NOTES TO THE ANNUAL FINANCIAL STATEMENTS
for the year ended 31 March 2014
219
Note 2013/14 2012/13
R'000 R'000
10.4 Other debtors 10
Breach of contract 7 864 9 530
Ex employees 33 563 40 680
State guarantees 488 565
Criminal acts 506 1 074
Miscellaneous 2 240 1 915
Clearing accounts 35 35
Total 44 696 53 799
The comparative for this sub-note has been restated. See footnote to sub-note 10.2
10.5 Impairment of receivables 10
Estimate of impairment receivables 71 786 79 365
Total 71 786 79 365
The impairment of receivables for 2012/13 (Disclosure Note 28) amounting to R58 842, was
restated. This was due to the late change in the method of ageing of debtors.
11. Investments
Non-current
Shares and other equity
JL Bisset Fund - 450
Graham Civil Service Bursary Fund - 40
Royal Reception Fund - 27
School Building Fund 15 752 14 972
Total 15 752 15 489
Analysis of non-current investments
Opening balance 15 489 14 872
Additions in cash 263 617
Closing balance 15 752 15 489
12. Voted Funds to be Surrendered to the Revenue Fund
Opening balance 72 133 15 999
As restated 72 133 15 999
Transfer from Statement of Financial Performance (as
restated) 166 589 72 133
Paid during the year (72 133) (15 999)
Closing balance 166 589 72 133

WESTERN CAPE PROVINCE
DEPARTMENT OF EDUCATION
VOTE 5
NOTES TO THE ANNUAL FINANCIAL STATEMENTS
for the year ended 31 March 2014
220
Note 2013/14 2012/13
R'000 R'000
13. Departmental revenue and NRF Receipts to be
surrendered to the Revenue Fund
Opening balance 10 991 2 139
As restated 10 991 2 139
Transfer from Statement of Financial
Performance (as restated) - 17 348
Own revenue included in appropriation 33 554 24 533
Paid during the year (42 434) (33 029)
Closing balance 2 111 10 991
14. Bank Overdraft
Consolidated Paymaster General Account - 17 142
Total - 17 142
15. Payables - current
Clearing accounts 15.1 1 008 1 255
Other payables 15.2 1 024 1 034
Total 2 032 2 289
15.1 Clearing accounts 15
Sal: ACB recalls 377 617
Sal: income tax 303 32
Sal: pension fund 159 120
Salary reversal control - 320
Salary: medical aid 53 69
Other deduction accounts 41 41
Sal: tax debt 75 56
Total 1 008 1 255
15.2 Other payables 15
Miscellaneous 1 024 1 034
Total 1 024 1 034

WESTERN CAPE PROVINCE
DEPARTMENT OF EDUCATION
VOTE 5
NOTES TO THE ANNUAL FINANCIAL STATEMENTS
for the year ended 31 March 2014
221
Note 2013/14 2012/13
R'000 R'000
16. Net cash flow available from operating activities
Net surplus as per Statement of Financial
Performance 166 589 89 481
Add back non cash/cash movements not
deemed operating activities 776 871 507 867
Decrease in receivables – current 72 380 (34 228)
Decrease in pre-payments and advances 47 (28)
(Decrease) in payables – current (257) (4 863)
Expenditure on capital assets 785 714 571 481
Surrenders to Revenue Fund (114 567) (49 028)
Own revenue included in appropriation 33 554 24 533
Net cash flow generated by operating activities 943 460 597 348
17. Reconciliation of cash and cash equivalents for
cash flow purposes
Consolidated Paymaster General Account 135 869 (17 142)
Cash on hand - 10
Total 135 869 (17 132)
18. Contingent liabilities and contingent assets
Contingent liabilities
Liable to Nature
Housing loan guarantees Employees Annexure 2A 573 573
Claims against the department Annexure 2B 317 071 316 439
Intergovernmental payables
(unconfirmed balances) Annexure 4 23 87
Other Annexure 2B 32 114 4 765
Total 349 781 321 864
18.1 Contingent assets
Nature of contingent assets
Overpayment of ministerial driver (resolved) - 135
Total - 135
The implementation of the policy and procedure on Incapacity Leave & Ill-health
Retirement (PILIR) was suspended for part of the financial year. PILIR makes provision for the
appointment of a panel of accredited Health Risk Managers by the Department of Public
Service and Administration (DPSA), to act as service providers for departments to
investigate and assess applications made by employees. Their appointment was delayed
due to a legal challenge brought before the High Court against the appointment process.
Decisions could therefore not be timeously made during the first half of the financial year
about the validity of the incapacity and/or ill-health retirement applications submitted by
employees. The panel was formally established on 1 November 2013. Amounts paid to
employees may therefore become recoverable if the panel do not approve applications
submitted for incapacity and/or ill-health retirement that was submitted before the panel
was established.

WESTERN CAPE PROVINCE
DEPARTMENT OF EDUCATION
VOTE 5
NOTES TO THE ANNUAL FINANCIAL STATEMENTS
for the year ended 31 March 2014
222
Note 2013/14 2012/13
R'000 R'000
19. Commitments
Current expenditure
Approved and contracted 958 224 751 737
Approved but not yet contracted - -
958 224 751 737
Capital expenditure
Approved and contracted 795 450 791 378
Approved but not yet contracted - -
795 450 791 378
Total 1 753 674 1 543 115
The comparatives for Commitments have been restated as a result of amendments to the
Accounting Manual for Departments.
Current commitments represent contracts for learner transport that were concluded for a five
year period. Capital commitments represent contracts for building of schools which are for
longer than a year.
20. Accruals and payables not
recognised
Listed by economic classification 30 Days 30+ Days Total Total
Goods and services 16 122 1 823 17 945 25 358
Transfers and subsidies 288 31 319 1 396
Capital assets 19 725 767 20 492 20 800
Total 36 135 2 621 38 756 47 554
Note 2013/14 2012/13
R'000 R'000
Listed by programme level
Programme 1 17 796 13 671
Programme 2 - 28 275
Programme 4 - 583
Programme 5 270 -
Programme 6 - 1
Programme 7 - 2 986
Programme 8 20 524 2 038
Programme 9 166 -
38 756 47 554
Confirmed balances with departments Annexure 4 384 1 018
Total 384 1 018

WESTERN CAPE PROVINCE
DEPARTMENT OF EDUCATION
VOTE 5
NOTES TO THE ANNUAL FINANCIAL STATEMENTS
for the year ended 31 March 2014
223
Note 2013/14 2012/13
R'000 R'000
21. Employee benefits
Leave entitlement 122 630 123 161
Service bonus (Thirteenth cheque) 344 890 324 492
Performance awards 14 320 13 395
Capped leave commitments 1 009 718 1 009 995
Other 66 734 139 286
Total 1 558 292 1 610 329
22. Lease Commitments
22.1 Operating leases expenditure
Specialised
military
assets
Land Buildings &
other fixed
structures
Machinery
and
equipment
Total
2013/14 R’000 R’000 R’000 R’000 R’000
Not later than 1 year - - - 5 346 5 346
Later than 1 year and not
later than 5 years - - - 1 335 1 335
Total lease commitments - - - 6 681 6 681
Specialised
military
assets
Land Buildings &
other fixed
structures
Machinery
and
equipment
Total
2012/13 R’000 R’000 R’000 R’000 R’000
Not later than 1 year - - - 2 260 2 260
Later than 1 year and not
later than 5 years - - - 1 581 1 581
Total lease commitments - - - 3 841 3 841
22.2 Finance leases expenditure
Specialised
military
assets
Land Buildings &
other fixed
structures
Machinery
and
equipment
Total
2013/14 R’000 R’000 R’000 R’000 R’000
Not later than 1 year - - - 22 629 22 629
Later than 1 year and not
later than 5 years 85 635 85 635
Later than 5 years - - - 14 132 14 132
Total lease commitments - - - 122 396 122 396
Specialised
military
assets
Land Buildings &
other fixed
structures
Machinery
and
equipment
Total
2012/13 R’000 R’000 R’000 R’000 R’000
Not later than 1 year - - - 20 244 20 244
Later than 1 year and not
later than 5 years 73 976 73 976
Later than 5 years - - - 16 469 16 469
Total lease commitments - - - 110 689 110 689
The Department of Education leased 513 vehicles from GMT during 2013/14. Daily tariffs are
payable on a monthly basis, covering the operational costs and capital costs towards the
replacement of vehicles, and the implicit financial costs in this type of arrangement.

WESTERN CAPE PROVINCE
DEPARTMENT OF EDUCATION
VOTE 5
NOTES TO THE ANNUAL FINANCIAL STATEMENTS
for the year ended 31 March 2014
224
Note 2013/14 2012/13
R'000 R'000
23. Accrued departmental revenue
Transactions in financial assets and liabilities 9 1 712
Total 9 1 712
23.1 Analyses of accrued departmental revenue
Opening balance 1 712 6 968
Less: Amounts received (3 350) (16 526)
Add: Amounts recognised 1 647 11 270
Closing balance 9 1 712
24. Irregular expenditure
24.1 Reconciliation of irregular expenditure
Opening balance 32 592 29 809
Add: Irregular expenditure – relating to prior year 739 -
Add: Irregular expenditure – relating to current year 4 593 6 924
Less: Prior year amounts condoned (27 825) -
Less: Current year amounts condoned (2 459) (2 258)
Less: Amounts not recoverable (not condoned) - (1 883)
Irregular expenditure awaiting condonation 7 640 32 592
Analysis of waiting condonation per age classification
Current year 2 134 4 744
Prior years 5 506 27 848
Total 7 640 32 592
2013/14
R'000
24.2 Details of irregular expenditure – current year
Incident
Other – Incorrect tariffs used 7
Insufficient quotes 3 046
Additional payment 23
Company suspended 1 517
Total 4 593

WESTERN CAPE PROVINCE
DEPARTMENT OF EDUCATION
VOTE 5
NOTES TO THE ANNUAL FINANCIAL STATEMENTS
for the year ended 31 March 2014
225
2013/14
R'000
24.3 Details of irregular expenditure condoned
Incident Condoned by
(condoning authority)
Suppliers paid on behalf of Accounting Officer
13 Non-section 21 Schools 971
Deviation from procure- Accounting Officer
ment procedures 9 036
Alleged tender irregularities Accounting Officer 12 145
Insufficient quotes Accounting Officer 2 723
No declaration of interest Accounting Officer 3 910
Other – incorrect tariffs Accounting Officer
used 715
Company suspended Accounting Officer 761
Additional payments Accounting Officer 23
Total 30 284
24.4 Details of irregular expenditure under investigation
Incident
Insufficient quotes 5 370
Acting allowance 61
No declaration of interest 428
Other – Incorrect tariffs used 14
Alleged fraudulent activities 433
Alleged tender irregularities 1 334
Total 7 640
Note 2013/14 2012/13
R'000 R'000
25. Fruitless and wasteful expenditure
25.1 Reconciliation of fruitless and wasteful expenditure
Opening balance 140 103
Fruitless and wasteful expenditure – relating to prior year 67 -
Fruitless and wasteful expenditure – relating to current
year 687 39
Less: Amounts resolved (642) (2)
Fruitless and wasteful expenditure awaiting resolution 252 140
25.2 Analysis of awaiting resolution per economic
classification
Current 55 39
Capital 197 101
Total 252 140

WESTERN CAPE PROVINCE
DEPARTMENT OF EDUCATION
VOTE 5
NOTES TO THE ANNUAL FINANCIAL STATEMENTS
for the year ended 31 March 2014
226
2013/14
R'000
25.3 Analysis of Current Year’s Fruitless and wasteful
expenditure
Incident
Catering over-expenditure 48
Interest on late pension pay-over 632
Interest on late municipal payments 7
Total 687
26. Related party relationships
1. The transactions relating to public ordinary schools are disclosed under Annexure 1B.
2. During the year the department received services from the Western Cape Department of
Transport & Public Works (DTPW) as follows:
- The department occupies a building managed by the DTPW, free of charge. Parking
space is also provided to government officials at an approved fee which is not market
related.
- The department makes use of government motor vehicles managed by the
Government Motor Transport (GMT) Section of the DTPW in terms of an arm’s length
transaction at tariffs approved by the Provincial Treasury.
3. The department received corporate services from the Department of the Premier (DOTP)
Western Cape as follows:
- Information and Communication Technology
- Organisation Development
- Provincial Training (transversal)
- Enterprise Risk Management
- Internal Audit
- Forensic Investigations
- Legal Services
- Corporate Communication
4. The department received security advisory services and security operations from the
Department of Community Safety Western Cape.
No of
individuals 2013/14 2012/13
R’000 R’000
27. Key management personnel
Political office bearers (provide detail below) 1 1 652 1 652
Officials:
Level 15 to 16 5 6 722 6 316
Level 14 (incl. CFO if at a lower level) 10 8 625 7 071
Family members of key management personnel 10 4 035 3 846
Total 21 034 18 885

WESTERN CAPE PROVINCE
DEPARTMENT OF EDUCATION
VOTE 5
NOTES TO THE ANNUAL FINANCIAL STATEMENTS
for the year ended 31 March 2014
227
28. Movable tangible capital assets
Movement in movable tangible capital assets per asset register for the year ended
31 March 2014
Opening
balance
Current year
adjustments
to prior year
balances Additions Disposals
Closing
balance
R’000 R’000 R’000 R’000 R’000
Machinery and Equipment 395 080 1 701 103 137 (62 760) 437 158
Transport assets 330 710 1 659 50 721 (12 556) 370 534
Computer equipment 39 991 28 42 898 (41 204) 41 713
Furniture and office equipment 19 380 - 9 518 (9 000) 19 898
Other machinery and equipment 4 999 14 - - 5 013
Total movable tangible capital
assets 395 080 1 701 103 137 (62 760) 437 158
28.1 Additions
Additions to movable tangible capital assets per asset register for the year ended
31 March 2014
Cash Non-cash
(Capital
work-in-
progress
current
costs and
finance
lease
payments
Received
current, not
paid (Paid
current
year,
received
prior year) Total
R’000 R’000 R’000 R’000 R’000
Machinery and Equipment 105 996 21 985 (24 844) - 103 137
Transport assets 53 935 21 630 (24 844) - 50 721
Computer equipment 42 543 355 - - 42 898
Furniture and office equipment 9 518 - - - 9 518
Total additions to movable
tangible capital assets 105 996 21 985 (28 844) - 103 137
28.2 Disposals
Disposals of movable tangible capital assets per asset register for the year ended
31 March 2014
Sold for
cash
Transfer out
or
destroyed
or scrapped
Total
disposals
Cash
received
actual
R’000 R’000 R’000 R’000
Machinery and Equipment - 62 760 62 760 -
Transport assets - 12 556 12 556 -
Computer equipment - 41 204 41 204 -
Furniture and office equipment - 9 000 9 000 -
- -
Total disposals of movable tangible capital
assets - 62 760 62 760 -

WESTERN CAPE PROVINCE
DEPARTMENT OF EDUCATION
VOTE 5
NOTES TO THE ANNUAL FINANCIAL STATEMENTS
for the year ended 31 March 2014
228
28.3 Movement for 2012/13
Movement in movable tangible capital assets per asset register for the year ended
31 March 2013
Opening
balance
Current year
adjustments
to prior year
balances Additions Disposals
Closing
balance
R’000 R’000 R’000 R’000 R’000
Machinery and Equipment 174 436 125 627 124 844 (29 827) 395 080
Transport assets 116 127 124 447 99 270 (9 134) 330 710
Computer equipment 38 171 399 17 635 (16 214) 39 991
Furniture and office equipment 16 153 - 7 706 (4 479) 19 380
Other machinery and equipment 3 985 781 233 - 4 999
Total movable tangible capital assets 174 436 125 627 124 844 (29 827) 395 080
28.4 Minor assets
Movement in minor assets per the asset register for the year ended 31 March 2014
Specialised
Military
assets
Intangible
assets
Heritage
assets
Machinery
and
equipment
Biological
assets Total
R’000 R’000 R’000 R’000 R’000 R’000
Opening balance - 1 372 - 33 238 - 34 610
Current year adjustments
to prior year balances - - - 76 - 76
Additions - 4 525 - 49 078 - 53 603
Disposals - (4 525) - (45 727) - (50 252)
Total Minor Assets - 1 372 - 36 665 - 38 037
Specialised
Military
assets
Intangible
assets
Heritage
assets
Machinery
and
equipment
Biological
assets Total
Number of R1 minor assets - - - 146 169 - 146 169
Number of minor assets at
cost - 315 - 81 330 - 81 645
Total Number of Minor
Assets - 315 - 227 499 - 227 814
Movement in minor assets per the asset register for the year ended 31 March 2013
Specialised
Military
assets
Intangible
assets
Heritage
assets
Machinery
and
equipment
Biological
assets Total
R’000 R’000 R’000 R’000 R’000 R’000
Opening balance - 1 352 - 21 352 - 22 704
Current year adjustments
to prior year balances - - - 7 911 - 7 911
Additions - 3 000 - 36 969 - 39 969
Disposals - (2 980) - (32 994) - (35 974)
Total minor assets - 1 372 - 33 238 - 34 610
Specialised
Military
assets
Intangible
assets
Heritage
assets
Machinery
and
equipment
Biological
assets Total
Number of minor assets at
cost - 315 - 38 844 - 39 159
Total number of minor
assets - 315 - 38 844 - 39 159

WESTERN CAPE PROVINCE
DEPARTMENT OF EDUCATION
VOTE 5
NOTES TO THE ANNUAL FINANCIAL STATEMENTS
for the year ended 31 March 2014
229
28.5 Movable assets written off
Moveable assets written off for the year ended 31 March 2014
Specialised
Military
assets
Intangible
assets
Heritage
assets
Machinery
and
equipment
Biological
assets Total
R’000 R’000 R’000 R’000 R’000 R’000
Assets written off - - - 5 159 - 5 159
Total movable assets
written off - - - 5 159 - 5 159
Moveable assets written off for the year ended 31 March 2013
Specialised
Military
assets
Intangible
assets
Heritage
assets
Machinery
and
equipment
Biological
assets Total
R’000 R’000 R’000 R’000 R’000 R’000
Assets written off - - - 4 828 - 4 828
Total movable assets
written off - - - 4 828 - 4 828
29. Intangible capital assets
Movement in intangible capital assets per asset register for the year ended 31 March 2014
Opening
balance
Current year
adjustments
to prior year
balances Additions Disposals
Closing
balance
R’000 R’000 R’000 R’000 R’000
Software 19 690 - 12 - 19 702
Total intangible capital assets 19 690 - 12 - 19 702
29.1 Additions
Additions to intangible capital assets per asset register for the year ended 31 March 2014
Cash Non-cash
(Develop-
ment work-
in-progress
current)
Received
current, not
paid (Paid
current) Total
R’000 R’000 R’000 R’000 R’000
Software 12 - - - 12
Total additions to intangible
capital assets 12 - - - 12
29.2 Movement for 2012/13
Movement in intangible capital assets per asset register for the year ended 31 March 2013
Opening
balance
Current year
adjustments
to prior year
balances Additions Disposals
Closing
balance
R’000 R’000 R’000 R’000 R’000
Software 18 834 - 856 - 19 690
Total intangible capital assets 18 834 - 856 - 19 690

WESTERN CAPE PROVINCE
DEPARTMENT OF EDUCATION
VOTE 5
NOTES TO THE ANNUAL FINANCIAL STATEMENTS
for the year ended 31 March 2014
230
30. Immovable tangible capital assets
Additions
30.1 Additions to immovable tangible capital assets per asset register for the year ended 31 march 2014
Cash Non-cash
(Capital work-
in-progress
current costs
and finance
lease
payments)
Received
current,
not paid
(Paid
current
year,
received
prior year) Total
R’000 R’000 R’000 R’000 R’000
Buildings and other fixed structures 679 706 - (679 706) - -
Non-residential buildings 679 706 - (679 706) - -
-
Total additions to immovable tangible
capital assets 679 706 - (679 706) -
Note 2012/13
R’000
31. Correction of prior period error for secondary information
The comparative amounts in Note 26 were restated as
follows:
Current expenditure R751 737, previously R1 408 465 and
751 737
Capital expenditure R791 378, previously R2 489 351.
791 378
Net effect on the note
1 543 115
The comparative amounts in Note 29.1 were restated as
follows:
Not later than 1 year R2 260, previously R2 201. 2 260
Later than 1 year & not later than 5 years R1 581,
previously R1 447. This change was as a result of
Government Garage-vehicles operating leases omitted
previously.
1 581
-
Net effect on the note 3 841

WESTERN CAPE PROVINCE
DEPARTMENT OF EDUCATION
VOTE 5
NOTES TO THE ANNUAL FINANCIAL STATEMENTS
for the year ended 31 March 2014
231
32. Statement of Conditional Grants Received
Name of Grant
Grant Allocation Spent 2012/13
Division of
Revenue
Act/
Provincial
Grants
Roll
Overs
DORA
Adjust-
ments
Other
Adjust-
ments
Total
Available
Amount
received
by
depart-
ment
Amount
spent by
depart-
ment
Under/
(over-
spen-
ding)
%
available
funds
spent by
depart-
ment
Division of
Revenue
Act
Amount
spent by
depart-
ment
R’000 R’000 R’000 R’000 R’000 R’000 R’000 R’000 % R’000 R’000
Dinaledi Schools
Grant 10 096 3 270 - - 13 366 13 366 11 868 1 498 89 9 571 4 585
Education
Infrastructure Grant 960 465 - - - 960 465 960 465 821 831 138 634 86 431 397 431 397
EPWP Integrated
Grant for Provinces 3 000 - - - 3 000 3 000 3 000 - 100 1 000 1 000
Further Education
and Training 351 437 - 1 660 - 353 097 353 097 353 078 19 100 597 589 597 523
HIV/AIDS (Life-skills
Education) Grant 17 637 864 - - 18 501 18 501 17 848 653 96 17 416 16 552
National school
nutrition programme
Grant
260 538 4 565 - - 265 103 265 103 258 328 6 775 97 245 588 236 669
Social Sector EPWP
Incentive Grant to
Provinces
12 298 - - - 12 298 12 298 12 064 234 98 23 924 23 903
Technical secondary
school
recapitalisation grant
11 884 2 014 - - 13 898 13 898 3 717 10 181 27 11 264 9 250
Total 1 627 355 10 713 1 660 - 1 639 728 1 639 728 1 481 734 157 994 - 1 337 749 1 320 879

WESTERN CAPE PROVINCE
DEPARTMENT OF EDUCATION
VOTE 5
ANNEXURES TO THE ANNUAL FINANCIAL STATEMENTS
for the year ended 31 March 2014
232
Annexure 1A
Statement of Transfers to Departmental Agencies and Accounts
Department/
Agency/
Account
Transfer Allocation Spent 2012/13
Adjusted
Appropriation
Roll
Overs Adjustments
Total
Available
Actual
Transfer
% of
Available
funds
transferred
Actual
Expenditure
R’000 R’000 R’000 R’000 R’000 % R’000
SETA 5 811 - - 5 811 5 811 100 5 524
SABC TV Licence 10 - 6 16 16 100 10
Total 5 821 - 6 5 827 5 827 5 534
Annexure 1B
Statement of Transfers to Non-Profit Institutions
Non-Profit Institutions
Transfer Allocation Spent 2012/13
Adjusted
Appropriation
Act
Roll
Overs Adjustments Total Available Actual Transfer
% of
Available
funds
transferred
Actual
Expenditure
R’000 R’000 R’000 R’000 R’000 % R’000
Transfers
Public Ordinary schools 827 179 - 125 695 952 874 952 874 100 764 652
Independent schools 84 932 - (284) 84 648 84 648 100 72 321
Schools for learners with
special education
needs
146 119 - (15 179) 130 940 130 940 100 129 661
Further education and
training colleges 48 798 - 14 363 63 161 63 161 100 323 285
ABET: Private centres 27 549 - 5 092 32 641 32 641 100 29 814
ECD: Gr R Public Schools 207 288 - 16 206 223 494 223 494 100 167 392
ECD: Gr R Community 52 161 - 1 599 53 760 53 760 100 43 194
ECD: Learnerships 58 136 - 4 671 62 807 62 807 100 73 007
Total 1 452 162 - 152 163 1 604 325 1 604 325 1 603 326

WESTERN CAPE PROVINCE
DEPARTMENT OF EDUCATION
VOTE 5
ANNEXURES TO THE ANNUAL FINANCIAL STATEMENTS
for the year ended 31 March 2014
233
Annexure 1C
Statement of Transfers to Households (H/H)
Type of Transfer
TRANSFER ALLOCATION SPENT 2012/13
Adjusted
Appropriation
Act
Roll
Overs Adjustments Total Actual
% of
Available
funds
transferred
Actual
Expenditure
R’000 R’000 R’000 R’000 R’000 % R’000
Transfers
H/H employee service
benefit: injury on duty 1 184 - (1 078) 106 106 100 -
H/H employee service
benefit: leave gratuity 12 375 - 46 825 59 200 59 200 100 55 366
H/H employee service
benefit: PST retirement
benefit
4 913 - (4 850) 63 63 100 9
H/H employee service
benefit: Severance - - 6 569 6 569 6 569 100 1 930
H/H employee service
benefit: Bursaries (non-
employees)
10 624 - (6 711) 3 913 3 913 100 17 918
H/H claims against the
state (cash) 1 450 - 773 2 223 2 223 100 4 400
H/H: PMT/refund and
remact/grace - - 10 10 10 100 -
Total 30 546 - 41 538 72 084 72 084 79 623

WESTERN CAPE PROVINCE
DEPARTMENT OF EDUCATION
VOTE 5
ANNEXURES TO THE ANNUAL FINANCIAL STATEMENTS
for the year ended 31 March 2014
234
Annexure 1D
Statement of Gifts, Donations and Sponsorships made and Remissions, Refunds and Payments
made as an Act of Grace
Nature of Gift, Donation or Sponsorship 2013/14
R’000
2012/13
R’000
Paid in cash
WCED Soccer Club: Sponsorship for expenses 13 12
Subtotal 13 12
Remissions, refunds and payments made as an act of grace
New Eisleben High School – contribution towards funeral costs of learner,
A Mhlawuli 10 -
Subtotal 10 -
Total 23 12

WESTERN CAPE PROVINCE
DEPARTMENT OF EDUCATION
VOTE 5
ANNEXURES TO THE ANNUAL FINANCIAL STATEMENTS
for the year ended 31 March 2014
235
ANNEXURE 2A
STATEMENT OF FINANCIAL GUARANTEES ISSUED AS AT 31 MARCH 2014 – LOCAL
Guarantor
Institutions
Gu
ara
nte
e in
resp
ec
t of
Orig
ina
l Gu
ara
nte
ed
ca
pita
l am
ou
nt
Op
en
ing
ba
lan
ce
1 A
pril 2
01
3
Gu
ara
nte
es D
raw
do
wn
s du
ring
the
ye
ar
Gu
ara
nte
ed
rep
ay
me
nts/
ca
nc
elle
d/ re
du
ce
d/
rele
ase
d d
urin
g th
e
ye
ar
Re
va
lua
tion
s
Clo
sing
ba
lan
ce
31 M
arc
h 2
014
Gu
ara
nte
ed
inte
rest
for y
ea
r en
de
d
31 M
arc
h 2
014
Re
alise
d lo
sses n
ot
Re
co
ve
rab
le i.e
.
cla
ims p
aid
ou
t
R’000 R’000 R’000 R’000 R’000 R’000 R’000 R’000
Housing
0001 – Standard
Bank of S.A. Limited - 154 83 38 - 199 - -
0004 – Firstrand Bank
Limited: First National - 100 119 21 - 198 - -
0017 – ABSA - 254 - 143 - 111 - -
0516 – Green Start
Home Loans (Pty)
Ltd
- 65 - - - 65 - -
Total - 573 202 202 - 573 - -

WESTERN CAPE PROVINCE
DEPARTMENT OF EDUCATION
VOTE 5
ANNEXURES TO THE ANNUAL FINANCIAL STATEMENTS
for the year ended 31 March 2014
236
ANNEXURE 2B
STATEMENT OF CONTINGENT LIABILITIES AS AT 31 MARCH 2014
Nature of liability
Opening
balance
1 April 2013
Liabilities
incurred
during the
year
Liabilities
paid/
cancelled/
reduced
during the
year
Liabilities
recover-
able
(Provide
details
hereunder)
Closing
balance
31 March 2014
R’000 R’000 R’000 R’000 R’000
Claims against the department
Various claims 316 439 15 429 (14 797) - 317 071
Subtotal 316 439 15 429 (14 797) - 317 071
Other
Municipal accounts 4 765 62 321 (34 972) - 32 114
Subtotal 4 765 62 321 (34 972) - 32 114
Total 321 204 77 750 (49 769) - 349 185

WESTERN CAPE PROVINCE
DEPARTMENT OF EDUCATION
VOTE 5
ANNEXURES TO THE ANNUAL FINANCIAL STATEMENTS
for the year ended 31 March 2014
237
Annexure 3
Claims Recoverable
Government entity
Confirmed balance
outstanding
Unconfirmed balance
outstanding Total
31/03/2014 31/03/2013 31/03/2014 31/03/2013 31/03/2014 31/03/2013
R’000 R’000 R’000 R’000 R’000 R’000
Department
Department of Education – Eastern
Cape (EED) - - 594 74 594 74
Department of Education – Gauteng
(JED) - - 98 19 98 19
Department of Education – North
West (NWE) - - 42 - 42 -
Department of Cultural Affairs &
Sport (WAC) - - - 61 - 61
Department of the Premier (WAM) - 46 7 - 7 46
Department of Health (WHW) - 14 (65) - (65) 14
Department of Education – KwaZulu
Natal (ZED) - - 66 - 66 -
Department of Community Safety
(WSL) - - - 9 - 9
Palama - - - 16 - 16
Department of Basic Education (DBE) - - 4 622 17 226 4 622 17 226
Department of Correctional Services
(DCS) - - - 19 - 19
Department of Education - Free
State (FED) - - 43 - 43 -
Department of Social Development
(WSS) - - 200 - 200 -
Department of Justice and
Constitutional Development - - 22 - 22 -
SA Police Services (SAPS) - - 19 - 19 -
- 60 5 648 17 424 5 648 17 484
Other government entities
Cape Teachers’ Professional
Association (CTPA) - - 332 332 332 332
Government Employees Pension
Fund (GEPF) - - 394 271 394 271
Die Burger - - 115 - 115 -
- - 841 603 841 603
Total - 60 6 489 18 027 6 489 18 087

WESTERN CAPE PROVINCE
DEPARTMENT OF EDUCATION
VOTE 5
ANNEXURES TO THE ANNUAL FINANCIAL STATEMENTS
for the year ended 31 March 2014
238
Annexure 4
Inter-Government Payables
Government entity
Confirmed balance Unconfirmed balance Total
31/03/2014 31/03/2013 31/03/2014 31/03/2013 31/03/2014 31/03/2013
R’000 R’000 R’000 R’000 R’000 R’000
Departments
Current
Northern Cape Education
Department - 54 - - - 54
Department of Justice and
Constitutional Development 91 868 - - 91 868
Free State Education Department - 81 - - - 81
Gauteng Education Department - - - 74 - 74
National Department of Labour - - 22 11 22 11
Department of Basic Education - - - 2 - 2
Government Motor Transport 251 15 - - 251 15
Department of Health – Western
Cape 42 - 1 - 43 -
Total Departments 384 1 018 23 87 407 1 105
Total Inter-governmental 384 1 018 23 87 407 1 105

Annual Report for 2013/14 Financial Year
Vote 5: Department of Education
Province of the Western Cape
239
Annexure 5
Movement in Capital Work-in-Progress for the Year ended 31 March 2014
Opening
balance
Current Year
Capital WIP
Completed
Assets
Closing
balance
R’000 R’000 R’000 R’000
Machinery and Equipment 4 225 3 123 2 708 4 640
Transport assets 4 225 3 123 2708 4 640
Total 4 225 3 123 2 708 4 640

Appendices


Annual Report for 2013/14 Financial Year
Vote 5: Department of Education
Province of the Western Cape
240
Appendix A: Action Plan to 2014 and Delivery Agreement Indicators (National)
The Department of Basic Education will provide provinces with information on this section.
The provision of information on indicators 16.1 to 27.2 is dependent on the availability of
findings from a school monitoring survey conducted by the Department of Basic Education.
The Department will update information on these indicators as information becomes
available.
Ind
ica
tor
nu
mb
er Indicator title Source of
data
Provincial
Performance
(most recent)
1.1 Percentage of Grade 3 learners performing at the required literacy
level according to the country’s Annual National Assessments. ANA 49
1.2 Percentage of Grade 3 learners performing at the required
numeracy level according to the country’s Annual National
Assessments.
ANA 58
2.1 Percentage of Grade 6 learners performing at the required
language level according to the country’s Annual National
Assessments.
ANA 63
2.2 Percentage of Grade 6 learners performing at the required
mathematics level according to the country’s Annual National
Assessments.
ANA 33
3.1 Percentage of Grade 9 learners performing at the required
language level according to the country’s Annual National
Assessments.
ANA 43
3.2 Percentage of Grade 9 learners performing at the required
mathematics level according to the country’s Annual National
Assessments.
ANA 17
4 Number of Grade 12 learners who become eligible for a Bachelors
programme in the public national examinations.
NSC
database 19 477
5 Number of Grade 12 learners passing mathematics. NSC
database 12 216
6 Number of Grade 12 learners passing physical science. NSC
database 8 333
7 Average score obtained in Grade 6 in language in the SACMEQ
assessment.
SACMEQ
database 583 (2007)
8 Average score obtained in Grade 6 in mathematics in the
SACMEQ assessment.
SACMEQ
database 566 (2007)
9 Average Grade 8 mathematics score obtained in TIMSS. SA score
348.
TIMSS
database 404 (2011)
10 Percentage of 7 to 15 year olds attending education institutions. GHS 91.9%
11.1 The percentage of Grade 1 learners who have received formal
Grade R. ASS 65.8%
11.2 The enrolment ratio of children aged 3 to 5. (This is an indicator of
concern to DBE and DSD.) GHS 62.4
12.1 The percentage of children aged 9 at the start of the year who are
in Grade 4 or above. ASS/GHS 11.6%
12.2 The percentage of children aged 12 at the start of the year who
are in Grade 7 or above. ASS/GHS 14.5%
13.1 The percentage of youths who obtain a National Senior Certificate
from a school. GHS 46.1%
13.2 The percentage of youths who obtain any FET qualification. (This is
an indicator of concern to DBE and DHET.) GHS
Not
available

Annual Report for 2013/14 Financial Year
Vote 5: Department of Education
Province of the Western Cape
241
Ind
ica
tor
nu
mb
er Indicator title Source of
data
Provincial
Performance
(most recent)
14 The number of qualified teachers aged 30 and below entering the
public service as teachers for first time during the past year. PERSAL 576
15.1 The percentage of classes with no more than 45 learners. ASS 96.6%
Baseline data on the indicators below is provided through a national sample survey conducted by the
Department of Basic Education. There is not information on all of the indicators.
WC National
15.2 The percentage of schools where allocated teaching posts are all
filled. 95% 90%
16.1 The average hours per year spent by teachers on professional
development activities. 55 39
16.2 The percentage of teachers who are able to attain minimum
standards in anonymous and sample-based assessments of their
subject knowledge.
Not
available
Not
available
17 The percentage of teachers absent from school on an average
day. 4% 8%
18 The percentage of learners who cover everything in the curriculum
for their current year on the basis of sample-based evaluations of
records kept by teachers and evidence of practical exercises done
by learners.
Not
available
Not
available
19 The percentage of learners having access to the required
textbooks and workbooks for the entire school year.
Not
available
Not
available
20 The percentage of learners in schools with a library or media centre
fulfilling certain minimum standards. 72 40
21 The percentage of schools producing the minimum set of
management documents at a required standard, for instance a
school budget, a school development plan, an annual report,
attendance rosters and learner mark schedules.
67 53
22 The percentage of schools where the School Governing Body
meets minimum criteria in terms of effectiveness.
Not
available
Not
available
23.1 The percentage of learners in schools that are funded at the
minimum level. 82 79
23.2 The percentage of schools which have acquired the full set of
financial management responsibilities on the basis of an assessment
of their financial management capacity.
86 76
24.1 The percentage of schools which comply with nationally
determined minimum physical infrastructure standards.
Not
available
Not
available
24.2 The percentage of schools which comply with nationally
determined optimum physical infrastructure standards.
Not
available
Not
available
25 The percentage of children who enjoy a publicly funded school
lunch every school day. 45 70
26 The percentage of schools with at least one educator who has
received specialised training in the identification and support of
special needs.
Not
available
Not
available
27.1 The percentage of schools visited at least twice a year by district
officials for monitoring and support purposes.
100 (own
data)
Not
available
27.2 The percentage of school principals rating the support services of
districts as being satisfactory.
90 (own
data)
Not
available

An
nu
al R
ep
ort
fo
r 2013/1
4 F
ina
nc
ial Y
ea
r
Vo
te 5
: D
ep
art
me
nt
of
Ed
uc
ati
on
Pro
vin
ce
of
the
We
ste
rn C
ap
e
24
2
AN
NEX
UR
E B
: Su
mm
ary
of N
atio
na
lly
De
term
ine
d P
rog
ram
me
Pe
rfo
rma
nc
e M
ea
sure
s Th
is a
pp
en
dix
lis
ts t
he
Na
tio
na
l P
rog
ram
me
Pe
rfo
rma
nc
e
Me
asu
res
as
ag
ree
d u
po
n b
etw
ee
n t
he
De
pa
rtm
en
t o
f B
asi
c E
du
ca
tio
n, Tr
ea
sury
an
d t
he
We
ste
rn C
ap
e p
rovin
cia
l e
du
ca
tio
n d
ep
art
me
nt.
No
. P
PM
Nu
mb
er
Me
asu
re
De
fin
itio
ns
an
d D
eta
ils
So
urc
es
of
Da
ta
Fre
qu
en
cy
of
Re
po
rtin
g
Ke
y P
erf
orm
an
ce
Are
a:
Pro
gra
mm
e 1
1.
PP
M1
01
Nu
mb
er
of
pu
blic
sch
oo
ls t
ha
t u
se S
A
SA
MS t
o p
rovid
e d
ata
to
the
na
tio
na
l le
arn
er
tra
ckin
g s
yst
em
Pu
blic
Sc
ho
ol: R
efe
rs t
o o
rdin
ary
an
d s
pe
cia
l sc
ho
ols
. It
exc
lud
es
ind
ep
en
de
nt
sch
oo
ls
Sta
tus
Qu
o:
Re
co
rd t
he
nu
mb
er
of
pu
blic
sc
ho
ols
th
at
(as
pe
r th
e la
test
ava
ilab
le d
ate
) u
se S
A S
AM
S t
o p
rovid
e d
ata
to
LU
RIT
S
Targ
et:
Re
co
rd t
he
nu
mb
er
of
pu
blic
sc
ho
ols
th
at
will
be
ta
rge
ted
to
be
tra
ine
d in
th
e u
se o
f SA
SA
MS f
or
the
re
leva
nt
qu
art
er.
Pro
vin
cia
l EM
IS:
Op
era
tio
na
l
Da
ta
Qu
art
erly
2.
PP
M1
02
Nu
mb
er
of
pu
blic
sch
oo
ls t
ha
t c
an
be
co
nta
cte
d e
lec
tro
nic
ally
(e-m
ail)
Pu
blic
Sc
ho
ol: R
efe
rs t
o o
rdin
ary
an
d s
pe
cia
l sc
ho
ols
. It
exc
lud
es
ind
ep
en
de
nt
sch
oo
ls
Sta
tus
Qu
o:
Re
co
rd t
he
nu
mb
er
of
pu
blic
sc
ho
ols
th
at
ca
n b
e c
on
tac
ted
by
em
ail
as
pe
r th
e la
test
ava
ilab
le d
ata
.
Targ
et:
Re
co
rd t
he
nu
mb
er
of
pu
blic
sc
ho
ols
ta
rge
ted
to
be
pro
vid
ed
with
e-
ma
il c
on
ne
ctivity in
th
e p
lan
ne
d f
ina
nc
ial y
ea
r.
Pro
vin
cia
l EM
IS
– S
NA
P S
urv
ey
An
nu
al
3.
PP
M1
03
Pe
rce
nta
ge
of
ed
uc
atio
n c
urr
en
t
exp
en
ditu
re g
oin
g
tow
ard
s n
on
-pe
rso
nn
el
ite
ms
Ed
uc
atio
n C
urr
en
t Ex
pe
nd
itu
re:
Re
fers
to
all
go
ve
rnm
en
t n
on
-ca
pita
l
ed
uc
atio
n e
xp
en
ditu
re (
inc
lusi
ve
of
all
sub
-se
cto
rs o
f e
du
ca
tio
n in
clu
din
g
spe
cia
l sc
ho
ols
an
d in
de
pe
nd
en
t sc
ho
ols
)
No
n-P
ers
on
ne
l It
em
s: R
efe
rs t
o a
ll g
ove
rnm
en
t n
on
-pe
rso
nn
el,
no
n-c
ap
ita
l
exp
en
ditu
re in
ed
uc
atio
n (
inc
lusi
ve
of
all
sub
-se
cto
rs o
f e
du
ca
tio
n in
clu
din
g
spe
cia
l sc
ho
ols
an
d in
de
pe
nd
en
t sc
ho
ols
)
Ca
lcu
latio
n:
Div
ide
cu
rre
nt
exp
en
ditu
re d
evo
ted
to
no
n-p
ers
on
ne
l ite
ms
in a
giv
en
fin
an
cia
l ye
ar
by t
he
to
tal p
ub
lic c
urr
en
t e
xp
en
ditu
re o
n e
du
ca
tio
n f
or
the
sa
me
fin
an
cia
l ye
ar
an
d m
ultip
ly b
y 1
00
.
Sta
tus
Qu
o:
Re
co
rd t
he
late
st a
va
ilab
le in
form
atio
n
Targ
et:
Re
co
rd t
he
pro
jec
ted
exp
en
ditu
re f
or
the
pla
nn
ed
fin
an
cia
l ye
ar
Pro
vin
cia
l CFO
An
nu
al
4.
PP
M2
01
Nu
mb
er
of
lea
rne
rs
en
rolle
d in
pu
blic
ord
ina
ry s
ch
oo
ls
NB
: Th
is m
ea
sure
exc
lud
es
en
rolm
en
t in
sp
ec
ial s
ch
oo
ls a
nd
Gra
de
R
en
rolm
en
t in
pu
blic
ord
ina
ry s
ch
oo
ls.
Sta
tus
Qu
o: R
ec
ord
to
tal l
ea
rne
r e
nro
lme
nt
in p
ub
lic o
rdin
ary
sc
ho
ols
as
pe
r
the
late
st S
NA
P d
ata
(e
xc
lud
ing
Gra
de
R e
nro
lme
nt)
Targ
et:
Re
co
rd t
he
nu
mb
er
of
lea
rne
rs e
xp
ec
ted
to
be
en
rolle
d in
pu
blic
ord
ina
ry s
ch
oo
ls in
th
e p
lan
ne
d f
ina
nc
ial y
ea
r (e
xc
lud
ing
Gra
de
R e
nro
lme
nt)
.
Pro
vin
cia
l EM
IS:
SN
AP
Su
rve
y
An
nu
al

An
nu
al R
ep
ort
fo
r 2013/1
4 F
ina
nc
ial Y
ea
r
Vo
te 5
: D
ep
art
me
nt
of
Ed
uc
ati
on
Pro
vin
ce
of
the
We
ste
rn C
ap
e
24
3
No
. P
PM
Nu
mb
er
Me
asu
re
De
fin
itio
ns
an
d D
eta
ils
So
urc
es
of
Da
ta
Fre
qu
en
cy
of
Re
po
rtin
g
Ke
y P
erf
orm
an
ce
Are
a:
Pro
gra
mm
e 2
5.
PP
M2
02
Nu
mb
er
of
ed
uc
ato
rs
em
plo
ye
d in
pu
blic
ord
ina
ry s
ch
oo
ls
Ed
uc
ato
r: r
efe
rs t
o a
ny p
ers
on
, w
ho
te
ac
he
s, e
du
ca
tes
or
tra
ins
oth
er
pe
rso
ns
or
wh
o p
rovid
es
pro
fess
ion
al e
du
ca
tio
na
l se
rvic
es.
It
exc
lud
es
no
n-e
du
ca
tor
sta
ff a
nd
inc
lud
es
all
ed
uc
ato
rs (
tem
po
rary
, su
bst
itu
te
etc
.)
Sta
tus
Qu
o: R
ec
ord
th
e t
ota
l nu
mb
er
of
ed
uc
ato
rs e
mp
loye
d in
pu
blic
ord
ina
ry s
ch
oo
ls a
s p
er
late
st a
va
ilab
le d
ata
.
Targ
et:
Th
e n
um
be
r o
f e
du
ca
tors
exp
ec
ted
to
be
em
plo
ye
d in
th
e p
lan
ne
d
fin
an
cia
l ye
ar.
Pro
vin
cia
l
PER
SA
L
Qu
art
erly
6.
PP
M2
03
Nu
mb
er
of
no
n-
ed
uc
ato
r st
aff
em
plo
ye
d in
pu
blic
ord
ina
ry s
ch
oo
ls
Ed
uc
ato
r: r
efe
rs t
o a
ny p
ers
on
, w
ho
te
ac
he
s, e
du
ca
tes
or
tra
ins
oth
er
pe
rso
ns
or
wh
o p
rovid
es
pro
fess
ion
al e
du
ca
tio
na
l se
rvic
es.
No
n-e
du
ca
tor
sta
ff: a
ll sc
ho
ol-b
ase
d s
taff
th
at
are
no
t e
du
ca
tors
. Th
ese
inc
lud
e s
up
po
rt s
taff
, a
dm
inis
tra
tive
sta
ff, h
ost
el s
taff
an
d p
rofe
ssio
na
l no
n-
tea
ch
ing
sta
ff.
Sta
tus
Qu
o: R
ec
ord
th
e t
ota
l nu
mb
er
of
no
n-e
du
ca
tor
sta
ff e
mp
loye
d in
pu
blic
ord
ina
ry s
ch
oo
ls a
s p
er
the
late
st a
va
ilab
le d
ata
.
Targ
et:
R
ec
ord
th
e n
um
be
r o
f n
on
-te
ac
hin
g s
taff
exp
ec
ted
to
be
em
plo
ye
d
in t
he
pla
nn
ed
fin
an
cia
l ye
ar.
Pro
vin
cia
l
PER
SA
L
Qu
art
erly
7.
PP
M2
04
Nu
mb
er
of
lea
rne
rs in
pu
blic
ord
ina
ry s
ch
oo
ls
be
ne
fitin
g f
rom
th
e “
No
Fe
e S
ch
oo
l” p
olic
y
Sta
tus
Qu
o:
Re
co
rd t
he
nu
mb
er
of
lea
rne
rs t
ha
t b
en
efitt
ed
fro
m t
he
“N
o F
ee
Sc
ho
ol P
olic
y”
in t
he
pa
st f
ina
nc
ial y
ea
r.
Targ
et:
Re
co
rd t
he
nu
mb
er
of
lea
rne
rs e
xp
ec
ted
to
be
ne
fit
fro
m t
he
“N
o F
ee
Sc
ho
ol P
olic
y”
in t
he
pla
nn
ed
fin
an
cia
l ye
ar.
Pro
vin
cia
l
Pro
gra
mm
e
Ma
na
ge
r
An
nu
al
8.
PP
M2
05
Nu
mb
er
of
lea
rne
rs
be
ne
fitin
g f
rom
Na
tio
na
l
Sc
ho
ol N
utr
itio
n
Pro
gra
mm
e (
NSN
P)
(qu
art
erly).
Sta
tus
Qu
o: R
ec
ord
th
e n
um
be
r o
f le
arn
ers
be
ne
fitin
g f
rom
th
e S
ch
oo
l
Nu
tritio
n P
rog
ram
me
pe
r q
ua
rte
r.
Targ
et:
Re
co
rd t
he
nu
mb
er
of
lea
rne
rs t
arg
ete
d t
o b
e p
rovid
ed
with
me
als
fo
r
the
re
leva
nt
qu
art
er
Pro
vin
cia
l
Pro
gra
mm
e
Ma
na
ge
r
Qu
art
erly
9.
PP
M
20
6
Nu
mb
er
of
lea
rne
rs
be
ne
fitin
g f
rom
sc
ho
lar
tra
nsp
ort
Sta
tus
Qu
o: R
ec
ord
th
e n
um
be
r o
f le
arn
ers
be
ne
fitin
g f
rom
th
e g
ove
rnm
en
t
pro
vid
ed
sc
ho
lar
tra
nsp
ort
in a
qu
art
er.
Targ
et:
Re
co
rd t
he
nu
mb
er
of
lea
rne
rs t
arg
ete
d t
o b
e p
rovid
ed
with
sc
ho
lar
tra
nsp
ort
fo
r th
e r
ele
va
nt
qu
art
er
Pro
vin
cia
l Pro
-
gra
mm
e
Ma
na
ge
r o
r
De
pa
rtm
en
t o
f
Tra
nsp
ort
Pro
-
gra
mm
e
Ma
na
ge
r
Qu
art
erly

An
nu
al R
ep
ort
fo
r 2013/1
4 F
ina
nc
ial Y
ea
r
Vo
te 5
: D
ep
art
me
nt
of
Ed
uc
ati
on
Pro
vin
ce
of
the
We
ste
rn C
ap
e
24
4
No
. P
PM
Nu
mb
er
Me
asu
re
De
fin
itio
ns
an
d D
eta
ils
So
urc
es
of
Da
ta
Fre
qu
en
cy
of
Re
po
rtin
g
Ke
y P
erf
orm
an
ce
Are
a:
Pro
gra
mm
e 2
10
. P
PM
20
7
Nu
mb
er
of
lea
rne
rs w
ith
spe
cia
l ed
uc
atio
n n
ee
ds
tha
t a
re e
nro
lled
in
pu
blic
ord
ina
ry s
ch
oo
ls
Sp
ec
ial e
du
ca
tio
n n
ee
ds:
Ed
uc
atio
n t
ha
t is
sp
ec
ialis
ed
in it
s n
atu
re a
nd
ad
dre
sse
s b
arr
iers
to
lea
rnin
g a
nd
de
ve
lop
me
nt
exp
erie
nc
ed
by le
arn
ers
with
spe
cia
l ed
uc
atio
n n
ee
ds
(in
clu
din
g t
ho
se w
ith
dis
ab
ilitie
s) in
pu
blic
ord
ina
ry
sch
oo
ls.
Sta
tus
Qu
o: R
ec
ord
th
e t
ota
l nu
mb
er
of
lea
rne
rs w
ith
sp
ec
ial e
du
ca
tio
n n
ee
ds
en
rolle
d in
pu
blic
ord
ina
ry s
ch
oo
ls in
th
e p
ast
fin
an
cia
l ye
ar
Targ
et:
Re
co
rd t
he
nu
mb
er
of
lea
rne
rs w
ith
sp
ec
ial n
ee
ds
exp
ec
ted
to
be
en
rolle
d in
pu
blic
ord
ina
ry s
ch
oo
ls in
th
e p
lan
ne
d f
ina
nc
ial y
ea
r.
NB
.: T
his
me
asu
re e
xc
lud
es
nu
mb
er
of le
arn
ers
with
sp
ec
ial n
ee
ds
en
rolle
d in
spe
cia
l sc
ho
ols
.
EM
IS:
An
nu
al
Sc
ho
ol S
urv
ey
An
nu
al
11
. P
PM
20
8
Nu
mb
er
of
full
serv
ice
sch
oo
ls
Fu
ll-s
erv
ice
sc
ho
ols
: O
rdin
ary
sc
ho
ols
th
at
are
sp
ec
ially
re
sou
rce
d a
nd
orie
nta
ted
to
ad
dre
ss a
ra
ng
e o
f b
arr
iers
to
lea
rnin
g in
an
in
clu
sive
ed
uc
atio
n
sett
ing
.
Sta
tus
Qu
o:
Re
co
rd t
he
nu
mb
er
of
full
serv
ice
sc
ho
ols
(p
ub
lic o
rdin
ary
) th
at
exis
ted
in
th
e p
ast
fin
an
cia
l ye
ar
Targ
et:
Re
co
rd t
he
nu
mb
er
of
full
serv
ice
sc
ho
ols
exp
ec
ted
to
be
est
ab
lish
ed
in t
he
pla
nn
ed
fin
an
cia
l ye
ar
Pro
vin
cia
l
Pro
gra
mm
e
Ma
na
ge
r
An
nu
al
12
. P
PM
20
9
Nu
mb
er
of
sch
oo
ls
vis
ite
d a
t le
ast
on
ce
a
qu
art
er
by a
circ
uit
ma
na
ge
r
Cir
cu
it M
an
ag
er:
PED
s h
ave
diffe
ren
t n
am
es
for
this
po
rtfo
lio. Fo
r e
xa
mp
le, in
Ga
ute
ng
it
is ID
SO
s.
Sta
tus
Qu
o:
Tota
l nu
mb
er
of
sch
oo
ls (
spe
cia
l sc
ho
ols
, in
de
pe
nd
en
t sc
ho
ols
an
d p
ub
lic o
rdin
ary
sc
ho
ols
) th
at
we
re v
isite
d b
y c
irc
uit m
an
ag
ers
pe
r q
ua
rte
r
for
sup
po
rt, m
on
ito
rin
g a
nd
lia
iso
n in
th
e p
ast
fin
an
cia
l ye
ar.
Targ
et:
To
tal n
um
be
r o
f sc
ho
ols
pla
nn
ed
to
be
vis
ite
d b
y c
irc
uit m
an
ge
rs p
er
qu
art
er
in t
he
pla
nn
ed
fin
an
cia
l ye
ar.
Pro
vin
cia
l
Pro
gra
mm
e
Ma
na
ge
r:
Dis
tric
ts
Qu
art
erly
Ke
y P
erf
orm
an
ce
Are
a:
Pro
gra
mm
e 3
(In
de
pe
nd
en
t Sc
ho
ol)
13
. P
PM
30
1
Nu
mb
er
of
sub
sid
ise
d
lea
rne
rs in
ind
ep
en
de
nt
sch
oo
ls
Ind
ep
en
de
nt
Sc
ho
ols
: sc
ho
ols
re
gis
tere
d o
r d
ee
me
d t
o b
e in
de
pe
nd
en
t in
term
s o
f th
e S
ou
th A
fric
an
Sc
ho
ols
Ac
t (S
ASA
)
Sta
tus
Qu
o: R
ec
ord
th
e t
ota
l nu
mb
er
of
lea
rne
rs in
su
bsi
dis
ed
ind
ep
en
de
nt
sch
oo
ls in
th
e p
ast
fin
an
cia
l ye
ar.
Targ
et:
Re
co
rd t
he
to
tal n
um
be
r o
f le
arn
ers
in in
de
pe
nd
en
t sc
ho
ols
exp
ec
ted
to b
e s
ub
sid
ise
d in
th
e p
lan
ne
d f
ina
nc
ial y
ea
r.
Pro
vin
cia
l
Pro
gra
mm
e
Ma
na
ge
r/C
FO
An
nu
al

An
nu
al R
ep
ort
fo
r 2013/1
4 F
ina
nc
ial Y
ea
r
Vo
te 5
: D
ep
art
me
nt
of
Ed
uc
ati
on
Pro
vin
ce
of
the
We
ste
rn C
ap
e
24
5
No
. P
PM
Nu
mb
er
Me
asu
re
De
fin
itio
ns
an
d D
eta
ils
So
urc
es
of
Da
ta
Fre
qu
en
cy
of
Re
po
rtin
g
Ke
y P
erf
orm
an
ce
Are
a:
Pro
gra
mm
e 4
(Sp
ec
ial Sc
ho
ols
)
14
. P
PM
40
1
Nu
mb
er
of
lea
rne
rs
en
rolle
d in
pu
blic
sp
ec
ial
sch
oo
ls
Sp
ec
ial Sc
ho
ol: S
ch
oo
ls r
eso
urc
ed
to
de
live
r e
du
ca
tio
n t
o le
arn
ers
re
qu
irin
g
hig
h-in
ten
sity
ed
uc
atio
na
l an
d o
the
r su
pp
ort
on
eith
er
a f
ull-
tim
e o
r a
pa
rt-
tim
e b
asi
s. T
he
lea
rne
rs w
ho
att
en
d t
he
se s
ch
oo
ls in
clu
de
th
ose
wh
o h
ave
ph
ysi
ca
l, in
telle
ctu
al o
r se
nso
ry d
isa
bili
tie
s o
r se
rio
us
be
ha
vio
ur
an
d/o
r
em
otio
na
l pro
ble
ms,
an
d t
ho
se w
ho
are
in c
on
flic
t w
ith
th
e la
w o
r w
ho
se
he
alth
-ca
re n
ee
ds
are
co
mp
lex.
Sta
tus
Qu
o: R
ec
ord
th
e t
ota
l nu
mb
er
of
lea
rne
rs e
nro
lled
in
pu
blic
Sp
ec
ial
Sc
ho
ols
in
th
e p
ast
fin
an
cia
l ye
ar.
Targ
et:
Re
co
rd t
he
to
tal n
um
be
r o
f le
arn
ers
exp
ec
ted
to
be
en
rolle
d in
pu
blic
spe
cia
l sc
ho
ols
in t
he
pla
nn
ed
fin
an
cia
l ye
ar.
NB
.: T
his
me
asu
re e
xc
lud
es
lea
rne
rs w
ith
sp
ec
ial n
ee
ds
en
rolle
d in
pu
blic
ord
ina
ry s
ch
oo
ls.
Pro
vin
cia
l EM
IS:
SN
E S
NA
P
An
nu
al
15
. P
PM
40
2
Nu
mb
er
of
ed
uc
ato
rs
em
plo
ye
d in
pu
blic
spe
cia
l sc
ho
ols
Ed
uc
ato
r re
fers
to
an
y p
ers
on
, w
ho
te
ac
he
s, e
du
ca
tes
or
tra
ins
oth
er
pe
rso
ns
or
wh
o p
rovid
es
pro
fess
ion
al e
du
ca
tio
na
l se
rvic
es.
Sta
tus
Qu
o: R
ec
ord
th
e t
ota
l nu
mb
er
of
ed
uc
ato
rs e
mp
loye
d in
pu
blic
Sp
ec
ial
Sc
ho
ols
in
th
e p
ast
fin
an
cia
l ye
ar.
Targ
et:
Re
co
rd t
he
nu
mb
er
of
ed
uc
ato
rs e
xp
ec
ted
to
be
em
plo
ye
d in
pu
blic
spe
cia
l sc
ho
ols
in t
he
pla
nn
ed
fin
an
cia
l ye
ar.
Pro
vin
cia
l
PER
SA
L
Qu
art
erly
16
. P
PM
40
3
Nu
mb
er
of
pro
fess
ion
al
no
n-e
du
ca
tor
sta
ff
em
plo
ye
d in
pu
blic
spe
cia
l sc
ho
ols
Pro
fess
ion
al n
on
-ed
uc
ato
r st
aff
th
is a
re p
ers
on
ne
l wh
o a
re c
lass
ifie
d a
s
pa
ram
ed
ics,
so
cia
l wo
rke
rs, c
are
giv
ers
, th
era
pis
ts a
nd
psy
ch
olo
gis
ts e
tc.
Sta
tus
Qu
o: R
ec
ord
th
e t
ota
l nu
mb
er
of
no
n-e
du
ca
tor
spe
cia
lists
em
plo
ye
d in
pu
blic
Sp
ec
ial S
ch
oo
ls in
th
e p
ast
fin
an
cia
l ye
ar.
Targ
et:
Re
co
rd t
he
nu
mb
er
of
no
n-e
du
ca
tor
spe
cia
lists
exp
ec
ted
to
be
em
plo
ye
d in
pu
blic
Sp
ec
ial S
ch
oo
ls in
th
e p
lan
ne
d f
ina
nc
ial y
ea
r.
PER
SA
L
Qu
art
erly
17
. P
PM
70
2
Nu
mb
er
of
pu
blic
sch
oo
ls t
ha
t o
ffe
r G
rad
e
R
Sta
tus
Qu
o: R
ec
ord
th
e t
ota
l nu
mb
er
of
pu
blic
sc
ho
ols
(o
rdin
ary
an
d s
pe
cia
l)
tha
t o
ffe
red
Gra
de
R in
th
e p
ast
fin
an
cia
l ye
ar
Targ
et:
Re
co
rd t
he
nu
mb
er
of
pu
blic
sc
ho
ols
(o
rdin
ary
an
d s
pe
cia
l) e
xp
ec
ted
to o
ffe
r G
rad
e R
in t
he
pla
nn
ed
fin
an
cia
l ye
ar
Pro
vin
cia
l
EM
IS:S
NA
P
Su
rve
ys
An
nu
al
18
. P
PM
70
3
Nu
mb
er
of
Gra
de
R
pra
ctitio
ne
rs e
mp
loye
d
in p
ub
lic o
rdin
ary
sch
oo
ls p
er
qu
art
er.
Sta
tus
Qu
o: R
ec
ord
th
e n
um
be
r o
f G
rad
e R
em
plo
ye
d in
pu
blic
ord
ina
ry
sch
oo
ls p
er
qu
art
er.
Targ
et:
Re
co
rd t
he
nu
mb
er
of
EC
D t
ea
ch
ers
exp
ec
ted
to
be
em
plo
ye
d f
or
the
rele
va
nt
qu
art
er.
Pro
vin
cia
l
Pro
gra
mm
e
Ma
na
ge
r
Qu
art
erly

An
nu
al R
ep
ort
fo
r 2013/1
4 F
ina
nc
ial Y
ea
r
Vo
te 5
: D
ep
art
me
nt
of
Ed
uc
ati
on
Pro
vin
ce
of
the
We
ste
rn C
ap
e
24
6
No
. P
PM
Nu
mb
er
Me
asu
re
De
fin
itio
ns
an
d D
eta
ils
So
urc
es
of
Da
ta
Fre
qu
en
cy
of
Re
po
rtin
g
Ke
y P
erf
orm
an
ce
Are
a:
Pro
gra
mm
e 8
19
. P
PM
80
1
Nu
mb
er
of
pu
blic
ord
ina
ry s
ch
oo
ls t
o b
e
pro
vid
ed
with
wa
ter
sup
ply
Sta
tus
Qu
o: R
ec
ord
th
e n
um
be
r o
f p
ub
lic o
rdin
ary
sc
ho
ols
th
at
ha
ve
wa
ter
sup
ply
as
pe
r th
e la
test
ava
ilab
le in
form
atio
n
Targ
et:
Re
co
rd t
he
nu
mb
er
of
pu
blic
sc
ho
ols
ta
rge
ted
to
be
su
pp
lied
with
wa
ter
in t
he
pla
nn
ed
fin
an
cia
l ye
ar.
Pro
vin
cia
l
NEIM
S
Pro
gra
mm
e
Ma
na
ge
r
An
nu
al
20
. P
PM
80
2
Nu
mb
er
of
pu
blic
ord
ina
ry s
ch
oo
ls t
o b
e
pro
vid
ed
with
ele
ctr
icity
sup
ply
De
fin
itio
n:
Sc
ho
ol w
ith
ele
ctr
icity r
efe
rs t
o s
ch
oo
ls t
ha
t h
ave
an
y s
ou
rce
of
ele
ctr
icity in
clu
din
g s
ola
r p
an
els
an
d g
en
era
tors
.
Sta
tus
Qu
o: R
ec
ord
th
e n
um
be
r o
f p
ub
lic o
rdin
ary
sc
ho
ols
th
at
ha
ve
ele
ctr
icity
as
pe
r th
e la
test
ava
ilab
le in
form
atio
n
Targ
et:
Re
co
rd t
he
nu
mb
er
of
pu
blic
ord
ina
ry s
ch
oo
ls t
arg
ete
d t
o b
e
ele
ctr
ifie
d in
th
e p
lan
ne
d f
ina
nc
ial y
ea
r.
Pro
vin
cia
l
NEIM
S
Pro
gra
mm
e
Ma
na
ge
r
An
nu
al
21
. P
PM
80
3
Nu
mb
er
of
pu
blic
ord
ina
ry s
ch
oo
ls t
o b
e
sup
plie
d w
ith
sa
nita
tio
n
fac
ilitie
s
Sa
nita
tio
n fa
cility
: R
efe
rs t
o a
ll kin
ds
of
toile
ts
Sta
tus
Qu
o: R
ec
ord
th
e n
um
be
r o
f p
ub
lic o
rdin
ary
sc
ho
ols
th
at
ha
ve
sa
nita
tio
n
fac
ilitie
s (t
oile
ts)
as
pe
r th
e la
test
ava
ilab
le in
form
atio
n
Targ
et:
Re
co
rd t
he
nu
mb
er
of
pu
blic
ord
ina
ry s
ch
oo
ls t
arg
ete
d t
o b
e s
up
plie
d
with
sa
nita
tio
n f
ac
ilitie
s in
th
e p
lan
ne
d f
ina
nc
ial y
ea
r.
Pro
vin
cia
l
NEIM
S
Pro
gra
mm
e
Ma
na
ge
r
An
nu
al
22
. P
PM
80
4
Nu
mb
er
of
cla
ssro
om
s to
be
bu
ilt in
pu
blic
ord
ina
ry s
ch
oo
ls
Cla
ssro
om
s: R
oo
ms
wh
ere
te
ac
hin
g a
nd
lea
rnin
g o
cc
urs
, b
ut
wh
ich
is n
ot
de
sig
ne
d f
or
spe
cia
l in
stru
ctio
na
l ac
tivitie
s. It
exc
lud
es
spe
cia
list
roo
ms.
Sta
tus
Qu
o:
Re
co
rd t
he
to
tal n
um
be
r o
f c
lass
roo
ms
tha
t e
xis
t in
pu
blic
ord
ina
ry
sch
oo
ls a
s p
er
the
late
st a
va
ilab
le in
form
atio
n
Targ
et:
Re
co
rd t
he
nu
mb
er
of
cla
ssro
om
s ta
rge
ted
to
be
bu
ilt in
pu
blic
ord
ina
ry t
he
pla
nn
ed
fin
an
cia
l ye
ar.
Th
is m
ea
sure
exc
lud
es
spe
cia
list
roo
ms.
Pro
vin
cia
l
NEIM
S
Pro
gra
mm
e
Ma
na
ge
r
An
nu
al
23
. P
PM
80
5
Nu
mb
er
of
spe
cia
list
roo
ms
to b
e b
uilt
in
pu
blic
ord
ina
ry s
ch
oo
ls
(all
roo
ms
exc
ep
t
cla
ssro
om
s-IN
CLU
DE;
lab
ora
torie
s, s
toc
k
roo
ms,
sic
k b
ay, kitc
he
n,
etc
)
Sp
ec
ialist
Ro
om
s: R
oo
ms
de
sig
ne
d f
or
spe
cia
l in
stru
ctio
na
l an
d n
on
-
inst
ruc
tio
na
l ac
tivitie
s. It
EX
CLU
DES a
dm
inis
tra
tive
off
ice
s a
nd
cla
ssro
om
s (a
s
de
fin
ed
in
PP
M 8
04
) a
nd
inc
lud
es
roo
ms
suc
h a
s la
bo
rato
rie
s, s
toc
k r
oo
ms,
sic
k
ba
ys,
kitc
he
n, lib
rary
, re
sou
rce
ce
ntr
e e
tc.
Sta
tus
Qu
o:
Re
co
rd t
he
to
tal n
um
be
r o
f sp
ec
ialis
t ro
om
s th
at
exis
t in
pu
blic
ord
ina
ry s
ch
oo
ls a
s p
er
the
late
st a
va
ilab
le in
form
atio
n
Targ
et:
Re
co
rd t
he
nu
mb
er
of
spe
cia
list
roo
ms
pla
nn
ed
to
be
bu
ilt in
pu
blic
ord
ina
ry s
ch
oo
ls t
he
pla
nn
ed
fin
an
cia
l ye
ar.
Pro
vin
cia
l
NEIM
S
Pro
gra
mm
e
Ma
na
ge
r
An
nu
al

An
nu
al R
ep
ort
fo
r 2013/1
4 F
ina
nc
ial Y
ea
r
Vo
te 5
: D
ep
art
me
nt
of
Ed
uc
ati
on
Pro
vin
ce
of
the
We
ste
rn C
ap
e
24
7
No
. P
PM
Nu
mb
er
Me
asu
re
De
fin
itio
ns
an
d D
eta
ils
So
urc
es
of
Da
ta
Fre
qu
en
cy
of
Re
po
rtin
g
Ke
y P
erf
orm
an
ce
Are
a:
Pro
gra
mm
e 9
24
. P
PM
90
1
Nu
mb
er
of
ca
nd
ida
tes
for
the
Gra
de
12
se
nio
r
ce
rtific
ate
exa
min
atio
ns
(ma
tric
exa
ms)
Sta
tus
Qu
o: R
ec
ord
to
tal n
um
be
r o
f c
an
did
ate
s th
at
wro
te t
he
se
nio
r
ce
rtific
ate
exa
min
ati
on
in
th
e p
ast
fin
an
cia
l ye
ar.
Targ
et:
Re
co
rd t
he
nu
mb
er
of
ca
nd
ida
tes
exp
ec
ted
to
be
re
gis
tere
d f
or
the
na
tio
na
l se
nio
r c
ert
ific
ate
exa
min
atio
ns
in t
he
pla
nn
ed
fin
an
cia
l ye
ar.
Pro
vin
cia
l Pro
-
gra
mm
e
Ma
na
ge
r:
Exa
min
atio
ns
Da
tab
ase
An
nu
al
25
. P
PM
90
2
Nu
mb
er
of
ca
nd
ida
tes
wh
o p
ass
ed
Na
tio
na
l
Se
nio
r C
ert
ific
ate
Sta
tus
Qu
o: R
ec
ord
th
e n
um
be
r o
f N
SC
ca
nd
ida
tes
wh
o p
ass
ed
in
th
e
Na
tio
na
l Se
nio
r C
ert
ific
ate
(N
SC
)
Targ
et:
Re
co
rd t
he
nu
mb
er
of
lea
rne
rs e
xp
ec
ted
to
pa
ss t
he
ne
xt
NSC
exa
min
atio
ns.
Pro
vin
cia
l Pro
-
gra
mm
e
Ma
na
ge
r: N
SC
Exa
min
a-t
ion
s
Da
tab
ase
An
nu
al
26
. P
PM
90
3
Nu
mb
er
of
lea
rne
rs w
ho
ob
tain
ed
Ba
ch
elo
r
pa
sse
s in
th
e N
atio
na
l
Se
nio
r C
ert
ific
ate
(N
SC
)
Sta
tus
Qu
o: R
ec
ord
th
e n
um
be
r o
f le
arn
ers
wh
o o
bta
ine
d B
ac
he
lor
pa
sse
s
in t
he
Na
tio
na
l Se
nio
r C
ert
ific
ate
(N
SC
)
Targ
et:
Re
co
rd t
he
nu
mb
er
of
lea
rne
rs e
xp
ec
ted
to
ac
hie
ve
Ba
ch
elo
r
pa
sse
s in
th
e n
ext
NSC
exa
min
atio
ns.
Pro
vin
cia
l Pro
-
gra
mm
e
Ma
na
ge
r: N
SC
Exa
min
a-t
ion
s
Da
tab
ase
An
nu
al
27
. P
PM
90
4
Nu
mb
er
of
lea
rne
rs w
ho
pa
sse
d M
ath
s in
th
e N
SC
exa
min
atio
ns
Sta
tus
Qu
o: R
ec
ord
th
e n
um
be
r o
f le
arn
ers
wh
o p
ass
ed
Ma
ths
in
th
e
Na
tio
na
l Se
nio
r C
ert
ific
ate
(N
SC
)
Targ
et:
Re
co
rd t
he
nu
mb
er
of
lea
rne
rs e
xp
ec
ted
to
pa
ss M
ath
s in
th
e n
ext
NSC
exa
min
atio
ns.
Pro
vin
cia
l Pro
-
gra
mm
e
Ma
na
ge
r: N
SC
Exa
min
a-t
ion
s
Da
tab
ase
An
nu
al
28
. P
PM
90
5
Nu
mb
er
of
lea
rne
rs w
ho
pa
sse
d P
hysi
ca
l Sc
ien
ce
in t
he
NSC
exa
min
atio
ns
Sta
tus
Qu
o: R
ec
ord
th
e n
um
be
r o
f le
arn
ers
wh
o p
ass
ed
Ph
ysi
ca
l Sc
ien
ce
in
the
Na
tio
na
l Se
nio
r C
ert
ific
ate
(N
SC
)
Targ
et:
Re
co
rd t
he
nu
mb
er
of
lea
rne
rs e
xp
ec
ted
to
pa
ss P
hysi
ca
l Sc
ien
ce
in t
he
ne
xt
NSC
exa
min
atio
ns.
Pro
vin
cia
l Pro
-
gra
mm
e
Ma
na
ge
r: N
SC
Exa
min
a-t
ion
s
Da
tab
ase
An
nu
al
29
. P
PM
90
6
Nu
mb
er
of
Gra
de
3
lea
rne
rs w
ho
pa
sse
d
Lan
gu
ag
e in
th
e A
nn
ua
l
Na
tio
na
l A
sse
ssm
en
t
(AN
A)
Sta
tus
Qu
o: R
ec
ord
th
e n
um
be
r o
f G
rad
e 3
lea
rne
rs w
ho
pa
sse
d L
an
gu
ag
e
in t
he
AN
A.
Targ
et:
Re
co
rd t
he
nu
mb
er
of
Gra
de
3 e
xp
ec
ted
to
pa
ss L
an
gu
ag
e in
th
e
ne
xt
AN
A
Pro
vin
cia
l Pro
-
gra
mm
e
Ma
na
ge
r: A
NA
Da
tab
ase
An
nu
al
30
. P
PM
90
7
Nu
mb
er
of
Gra
de
3
lea
rne
rs w
ho
pa
sse
d
Ma
ths
in t
he
An
nu
al
Na
tio
na
l A
sse
ssm
en
t
(AN
A)
Sta
tus
Qu
o: R
ec
ord
th
e n
um
be
r o
f G
rad
e 3
lea
rne
rs w
ho
pa
sse
d M
ath
s in
the
AN
A.
Targ
et:
Re
co
rd t
he
nu
mb
er
of
Gra
de
3 le
arn
ers
exp
ec
ted
to
pa
ss M
ath
s in
the
ne
xt
AN
A.
Pro
vin
cia
l Pro
-
gra
mm
e
Ma
na
ge
r: A
NA
Da
tab
ase
An
nu
al

An
nu
al R
ep
ort
fo
r 2013/1
4 F
ina
nc
ial Y
ea
r
Vo
te 5
: D
ep
art
me
nt
of
Ed
uc
ati
on
Pro
vin
ce
of
the
We
ste
rn C
ap
e
24
8
No
. P
PM
Nu
mb
er
Me
asu
re
De
fin
itio
ns
an
d D
eta
ils
So
urc
es
of
Da
ta
Fre
qu
en
cy
of
Re
po
rtin
g
Ke
y P
erf
orm
an
ce
Are
a:
Pro
gra
mm
e 9
31
. P
PM
90
8
Nu
mb
er
of
Gra
de
6
lea
rne
rs w
ho
pa
sse
d
Lan
gu
ag
e in
th
e A
nn
ua
l
Na
tio
na
l A
sse
ssm
en
t
(AN
A)
Sta
tus
Qu
o: R
ec
ord
th
e n
um
be
r o
f G
rad
e 6
lea
rne
rs w
ho
pa
sse
d L
an
gu
ag
e
in t
he
AN
A.
Targ
et:
Re
co
rd t
he
nu
mb
er
of
Gra
de
6 e
xp
ec
ted
to
pa
ss L
an
gu
ag
e in
th
e
ne
xt
AN
A.
Pro
vin
cia
l
Pro
gra
mm
e
Ma
na
ge
r: A
NA
Da
tab
ase
An
nu
al
32
. P
PM
90
9
Nu
mb
er
of
Gra
de
6
lea
rne
rs w
ho
pa
sse
d
Ma
ths
in t
he
An
nu
al
Na
tio
na
l A
sse
ssm
en
t
(AN
A)
Sta
tus
Qu
o: R
ec
ord
th
e n
um
be
r o
f G
rad
e 6
lea
rne
rs w
ho
pa
sse
d M
ath
s in
the
AN
A.
Targ
et:
Re
co
rd t
he
nu
mb
er
of
Gra
de
6 e
xp
ec
ted
to
pa
ss M
ath
s in
th
e n
ext
AN
A.
Pro
vin
cia
l
Pro
gra
mm
e
Ma
na
ge
r: A
NA
Da
tab
ase
An
nu
al
33
. P
PM
91
0
Nu
mb
er
of
Gra
de
9
lea
rne
rs w
ho
pa
sse
d
Lan
gu
ag
e in
th
e A
nn
ua
l
Na
tio
na
l A
sse
ssm
en
t
(AN
A)
Sta
tus
Qu
o: R
ec
ord
th
e n
um
be
r o
f G
rad
e 9
lea
rne
rs w
ho
pa
sse
d L
an
gu
ag
e
in t
he
AN
A.
Targ
et:
Re
co
rd t
he
nu
mb
er
of
Gra
de
9 e
xp
ec
ted
to
pa
ss L
an
gu
ag
e in
th
e
ne
xt
AN
A.
Pro
vin
cia
l
Pro
gra
mm
e
Ma
na
ge
r: A
NA
Da
tab
ase
An
nu
al
34
. P
PM
91
1
Nu
mb
er
of
Gra
de
9
lea
rne
rs w
ho
pa
sse
d
Ma
ths
in t
he
An
nu
al
Na
tio
na
l A
sse
ssm
en
t
(AN
A)
Sta
tus
Qu
o: R
ec
ord
th
e n
um
be
r o
f G
rad
e 9
lea
rne
rs w
ho
pa
sse
d M
ath
s in
the
AN
A.
Targ
et:
Re
co
rd t
he
nu
mb
er
of
Gra
de
9 e
xp
ec
ted
to
pa
ss M
ath
s in
th
e n
ext
AN
A.
Pro
vin
cia
l
Pro
gra
mm
e
Ma
na
ge
r: A
NA
Da
tab
ase
An
nu
al

An
nu
al R
ep
ort
fo
r 2013/1
4 F
ina
nc
ial Y
ea
r
Vo
te 5
: D
ep
art
me
nt
of
Ed
uc
ati
on
Pro
vin
ce
of
the
We
ste
rn C
ap
e
24
9
AN
NEX
UR
E C
: PR
OG
RA
MM
E P
ER
FO
RM
AN
CE I
ND
ICA
TOR
S –
TEC
HN
ICA
L IN
DIC
ATO
RS
The
re a
re n
o n
ew
in
dic
ato
rs in
2013
/14
PP
I. 1
.1
No
Te
ch
nic
al I
nd
ica
tor
De
scrip
tio
n
Re
spo
nse
1
Ind
ica
tor
Title
En
sure
fin
an
cia
l ma
na
ge
me
nt
2
Sh
ort
De
fin
itio
n
To
pro
vid
e o
ve
rall
ma
na
ge
me
nt
of
an
d s
up
po
rt t
o t
he
ed
uc
atio
n s
yst
em
in
ac
co
rda
nc
e w
ith
th
e N
atio
na
l Ed
uc
atio
n P
olic
y A
ct,
Pu
blic
Fin
an
ce
Ma
na
ge
me
nt
Ac
t a
nd
oth
er
rele
va
nt
po
licie
s
3
Pu
rpo
se/
Imp
ort
an
ce
Exp
lain
wh
at
the
in
dic
ato
r is
in
ten
de
d t
o s
ho
w a
nd
wh
y it
is im
po
rta
nt
3.1
Wh
at
do
es
ind
ica
tor
sho
w?
C
om
plia
nc
e w
ith
laid
do
wn
po
licie
s a
nd
fin
an
cia
l sta
tem
en
ts w
ith
no
ma
teria
l
mis
sta
tem
en
ts
3.2
Wh
y is
it im
po
rta
nt?
G
oo
d g
ove
rna
nc
e
4
So
urc
e/
Co
llec
tio
n
of
da
ta
De
scrib
e w
he
re t
he
info
rma
tio
n c
om
es
fro
m a
nd
ho
w it
is c
olle
cte
d:
4.1
Wh
ere
do
es
da
ta c
om
e f
rom
?
Au
dito
r-g
en
era
l ma
na
ge
me
nt
rep
ort
4.2
Da
ta c
olle
cto
r/st
ore
r (s
ec
tio
n/m
an
ag
er
na
me
)
Dire
cto
r Fi
na
nc
ial A
cc
ou
ntin
g
4.3
Ho
w is
da
ta c
olle
cte
d?
R
ep
ort
s is
sue
d b
y A
ud
ito
r-g
en
era
l
5
Me
tho
d o
f
Ca
lcu
latio
n
De
scrib
e c
lea
rly a
nd
sp
ec
ific
ally
ho
w t
he
ind
ica
tor
is c
alc
ula
ted
No
t c
alc
ula
ted
6
Da
ta L
imita
tio
ns
Ide
ntify
an
y li
mita
tio
n w
ith
th
e in
dic
ato
r
da
ta, in
clu
din
g f
ac
tors
th
at
mig
ht
be
be
yo
nd
th
e d
ep
art
me
nt’
s c
on
tro
l
No
ne
7
Typ
e o
f In
dic
ato
r
Ou
tco
me
s
8
Ca
lcu
latio
n t
yp
e
No
n-c
um
ula
tive
X
9
Re
po
rtin
g c
yc
le
An
nu
ally
X
10
De
sire
d
pe
rfo
rma
nc
e
Ide
ntify
wh
eth
er
ac
tua
l pe
rfo
rma
nc
e t
ha
t is
hig
he
r o
r lo
we
r th
an
ta
rge
ted
pe
rfo
rma
nc
e
is d
esi
rab
le
On
ta
rge
t d
esi
rab
le
12
Ind
ica
tor
resp
on
sib
ility
Ide
ntify
wh
o is
re
spo
nsi
ble
fo
r m
an
ag
ing
an
d
rep
ort
ing
th
e in
dic
ato
r
Dire
cto
r Fi
na
nc
ial A
cc
ou
ntin
g

An
nu
al R
ep
ort
fo
r 2013/1
4 F
ina
nc
ial Y
ea
r
Vo
te 5
: D
ep
art
me
nt
of
Ed
uc
ati
on
Pro
vin
ce
of
the
We
ste
rn C
ap
e
25
0
PP
I 1
.2
No
Te
ch
nic
al I
nd
ica
tor
De
scrip
tio
n
Re
spo
nse
1
De
via
tio
ns
in r
esp
ec
t o
f te
nd
ers
ab
ove
R5
00
00
0
2
Sh
ort
De
fin
itio
n
It
is a
n in
dic
atio
n w
he
re e
xc
ep
tio
ns
we
re m
ad
e, w
ith
in a
llow
ed
ru
les
an
d
reg
ula
tio
ns,
with
in S
up
ply
Ch
ain
Ma
na
ge
me
nt
3
Pu
rpo
se/
Imp
ort
an
ce
Exp
lain
wh
at
the
in
dic
ato
r is
in
ten
de
d t
o s
ho
w a
nd
wh
y it
is im
po
rta
nt
3.1
Wh
at
do
es
ind
ica
tor
sho
w?
N
o o
f d
evia
tio
ns
3.2
Wh
y is
it im
po
rta
nt?
In
dic
atio
n o
f e
ith
er
un
pla
nn
ed
eve
nt
or
un
fore
see
n c
irc
um
sta
nc
es
4
So
urc
e/
Co
llec
tio
n
of
da
ta
De
scrib
e w
he
re t
he
info
rma
tio
n c
om
es
fro
m a
nd
ho
w it
is c
olle
cte
d:
4.1
Wh
ere
do
es
da
ta c
om
e f
rom
?
Su
pp
ly C
ha
in m
an
ag
em
en
t re
co
rds
4.2
Da
ta c
olle
cto
r/st
ore
r (s
ec
tio
n/m
an
ag
er
na
me
)
Dire
cto
r P
roc
ure
me
nt
Ma
na
ge
me
nt
4.3
Ho
w is
da
ta c
olle
cte
d?
M
an
ua
l syst
em
of
rec
ord
ke
ep
ing
5
Me
tho
d o
f
Ca
lcu
latio
n
De
scrib
e c
lea
rly a
nd
sp
ec
ific
ally
ho
w t
he
ind
ica
tor
is c
alc
ula
ted
Nu
mb
er
of
ca
ses
of
de
via
tio
ns
6
Da
ta L
imita
tio
ns
Ide
ntify
an
y li
mita
tio
n w
ith
th
e in
dic
ato
r
da
ta, in
clu
din
g f
ac
tors
th
at
mig
ht
be
be
yo
nd
th
e d
ep
art
me
nt’
s c
on
tro
l
No
ne
7
Typ
e o
f In
dic
ato
r
Ac
tivitie
s
8
Ca
lcu
latio
n t
yp
e
Cu
mu
lative
X
9
Re
po
rtin
g c
yc
le
An
nu
ally
X
10
De
sire
d
pe
rfo
rma
nc
e
Ide
ntify
wh
eth
er
ac
tua
l pe
rfo
rma
nc
e t
ha
t is
hig
he
r o
r lo
we
r th
an
ta
rge
ted
pe
rfo
rma
nc
e
is d
esi
rab
le
Low
er
pe
rfo
rma
nc
e d
esi
rab
le
11
Ind
ica
tor
resp
on
sib
ility
Ide
ntify
wh
o is
re
spo
nsi
ble
fo
r m
an
ag
ing
an
d
rep
ort
ing
th
e in
dic
ato
r
Dire
cto
r P
roc
ure
me
nt
Ma
na
ge
me
nt

An
nu
al R
ep
ort
fo
r 2013/1
4 F
ina
nc
ial Y
ea
r
Vo
te 5
: D
ep
art
me
nt
of
Ed
uc
ati
on
Pro
vin
ce
of
the
We
ste
rn C
ap
e
25
1
PP
I 2
.1
No
Te
ch
nic
al I
nd
ica
tor
De
scrip
tio
n
Re
spo
nse
1
Pe
rce
nta
ge
of
lea
rne
rs r
eta
ine
d in
th
e s
ch
oo
l syst
em
fro
m G
rad
es
10
– 1
2
2
Sh
ort
De
fin
itio
n
M
ea
sure
of
the
de
gre
e (
%)
to w
hic
h le
arn
ers
th
at
en
ter
gra
de
10
co
ntin
ue
to
gra
de
12
in P
ub
lic O
rdin
ary
Sc
ho
ols
fo
r th
e s
am
e c
oh
ort
.
3
Pu
rpo
se/
Imp
ort
an
ce
Exp
lain
wh
at
the
in
dic
ato
r is
in
ten
de
d t
o s
ho
w a
nd
wh
y it
is im
po
rta
nt
3.1
Wh
at
do
es
ind
ica
tor
sho
w?
A
hig
he
r %
of
lea
rne
rs r
em
ain
in t
he
syst
em
un
til g
rad
e 1
2
3.2
Wh
y is
it im
po
rta
nt?
A
ca
de
mic
ally
be
tte
r p
rep
are
d w
ork
fo
rce
; b
ett
er
op
po
rtu
nity f
or
lea
rne
rs; a
cc
ess
to t
ert
iary
ed
uc
atio
n e
nh
an
ce
d; re
du
ce
th
e v
uln
era
bili
ty r
ate
am
on
gst
lea
rne
rs;
mo
re e
ffic
ien
t d
ep
loym
en
t o
f su
pp
ort
(so
cia
l)
4
So
urc
e/
Co
llec
tio
n
of
da
ta
De
scrib
e w
he
re t
he
info
rma
tio
n c
om
es
fro
m a
nd
ho
w it
is c
olle
cte
d:
4.1
Wh
ere
do
es
da
ta c
om
e f
rom
?
An
nu
al S
ch
oo
l Su
rve
y
4.2
Da
ta c
olle
cto
r/st
ore
r (s
ec
tio
n/m
an
ag
er
na
me
)
Mr
S. H
an
sra
j
4.3
Ho
w is
da
ta c
olle
cte
d?
Extr
ac
ted
fro
m C
EM
IS f
or
ASS.
5
Me
tho
d o
f
Ca
lcu
latio
n
De
scrib
e c
lea
rly a
nd
sp
ec
ific
ally
ho
w t
he
ind
ica
tor
is c
alc
ula
ted
The
nu
mb
er
of
Gr1
2 le
arn
ers
div
ide
d b
y t
he
nu
mb
er
of
Gr1
0 le
arn
ers
fo
r th
e s
am
e
co
ho
rt (
2 y
ea
rs e
arlie
r) a
s a
pe
rce
nta
ge
.
6
Da
ta L
imita
tio
ns
Ide
ntify
an
y li
mita
tio
n w
ith
th
e in
dic
ato
r
da
ta, in
clu
din
g f
ac
tors
th
at
mig
ht
be
be
yo
nd
th
e d
ep
art
me
nt’
s c
on
tro
l
The
ca
lcu
latio
n is
fo
r P
ub
lic O
rdin
ary
sc
ho
ols
on
ly a
nd
is d
ep
en
de
nt
on
th
e u
nit
rec
ord
ad
min
istr
atio
n a
t sc
ho
ols
. It
do
es
no
t re
fle
ct
all
lea
rne
rs in
all
ed
uc
atio
n
sec
tors
. T
his
exc
lud
es
in a
nd
ou
t m
igra
tio
n o
f le
arn
ers
, d
ea
ths,
an
d o
the
r fa
cto
rs.
7
Typ
e o
f In
dic
ato
r
Ou
tpu
t;
Eff
icie
nc
y; Ec
on
om
y; Eq
uity
8
Ca
lcu
latio
n t
yp
e
No
n-c
um
ula
tive
X
9
Re
po
rtin
g c
yc
le
An
nu
ally
A
nn
ua
lly, o
n t
he
pre
vio
us
ac
ad
em
ic y
ea
r, in
first
qu
art
er
of
follo
win
g y
ea
r
10
De
sire
d
pe
rfo
rma
nc
e
Ide
ntify
wh
eth
er
ac
tua
l pe
rfo
rma
nc
e t
ha
t is
hig
he
r o
r lo
we
r th
an
ta
rge
ted
pe
rfo
rma
nc
e
is d
esi
rab
le
Hig
he
r th
an
ta
rge
t d
esi
rab
le.
11
Ind
ica
tor
resp
on
sib
ility
Ide
ntify
wh
o is
re
spo
nsi
ble
fo
r m
an
ag
ing
an
d
rep
ort
ing
th
e in
dic
ato
r
Co
-ord
ina
ted
by C
D E
D’s
; d
ata
co
llec
ted
an
d r
ep
ort
ed
by K
M; C
olla
bo
rative
eff
ort
inc
lud
ing
ma
ny r
ole
pla
ye
rs

An
nu
al R
ep
ort
fo
r 2013/1
4 F
ina
nc
ial Y
ea
r
Vo
te 5
: D
ep
art
me
nt
of
Ed
uc
ati
on
Pro
vin
ce
of
the
We
ste
rn C
ap
e
25
2
PP
I 2
.2
No
Te
ch
nic
al I
nd
ica
tor
De
scrip
tio
n
Re
spo
nse
1
Ind
ica
tor
Title
Nu
mb
er
of
ad
ditio
na
l sc
ho
ols
se
cu
red
with
an
ala
rm li
nke
d t
o a
rme
d r
esp
on
se, b
urg
lar
ba
rs, a
nd
sto
ne
gu
ard
s o
n w
ind
ow
s.
2
Sh
ort
De
fin
itio
n
Th
e in
dic
ato
r w
ou
ld d
em
on
stra
te t
he
pro
gra
mm
e’s
syst
em
ic in
jec
tio
n [
inp
ut]
in r
ais
ing
the
sa
fety
leve
ls a
t sc
ho
ols
an
d t
he
dire
ct
resu
lts
ove
r a
de
fin
ed
pe
rio
d.
3
Pu
rpo
se/
Imp
ort
an
ce
Exp
lain
wh
at
the
in
dic
ato
r is
in
ten
de
d t
o s
ho
w a
nd
wh
y it
is im
po
rta
nt
3.1
Wh
at
do
es
ind
ica
tor
sho
w?
It
sh
ow
s th
e m
ea
sure
s in
stitu
ted
by a
sc
ho
ol t
o r
ais
e its
sa
fety
pro
file
.
3.2
Wh
y is
it im
po
rta
nt?
Th
is w
ou
ld a
cc
ou
nt
for
min
imu
m m
ea
sure
s th
at
sho
uld
be
in p
lac
e a
t a
sc
ho
ol.
4
So
urc
e/
Co
llec
tio
n
of
da
ta
De
scrib
e w
he
re t
he
info
rma
tio
n c
om
es
fro
m a
nd
ho
w it
is c
olle
cte
d:
4.1
Wh
ere
do
es
da
ta c
om
e f
rom
?
Fin
an
cia
l re
po
rts
ind
ica
tin
g t
he
pu
rch
ase
of
go
od
s a
nd
se
rvic
es
for
pa
rtic
ula
r sc
ho
ols
.
4.2
Da
ta c
olle
cto
r/st
ore
r
(se
ctio
n/m
an
ag
er
na
me
)
Osc
ar
Ap
olli
s
4.3
Ho
w is
da
ta c
olle
cte
d?
In
tern
ally
5
Me
tho
d o
f
Ca
lcu
latio
n
De
scrib
e c
lea
rly a
nd
sp
ec
ific
ally
ho
w
the
ind
ica
tor
is c
alc
ula
ted
Nu
mb
er
of
sch
oo
ls c
ou
nte
d
6
Da
ta L
imita
tio
ns
Ide
ntify
an
y li
mita
tio
n w
ith
th
e
ind
ica
tor
da
ta, in
clu
din
g f
ac
tors
th
at
mig
ht
be
be
yo
nd
th
e d
ep
art
me
nt’
s
co
ntr
ol
No
ne
7
Typ
e o
f In
dic
ato
r
In
pu
ts
8
Ca
lcu
latio
n t
yp
e
No
n-c
um
ula
tive
X
9
Re
po
rtin
g c
yc
le
An
nu
ally
X
11
De
sire
d
pe
rfo
rma
nc
e
Ide
ntify
wh
eth
er
ac
tua
l pe
rfo
rma
nc
e
tha
t is
hig
he
r o
r lo
we
r th
an
ta
rge
ted
pe
rfo
rma
nc
e is
de
sira
ble
Mo
re s
ch
oo
ls e
qu
ipp
ed
; b
ut
less
in
cid
en
ts o
cc
urr
ing
. Sh
ou
ld b
e a
s p
er
targ
et.
12
Ind
ica
tor
resp
on
sib
ility
Ide
ntify
wh
o is
re
spo
nsi
ble
fo
r
ma
na
gin
g a
nd
re
po
rtin
g t
he
ind
ica
tor
Sa
fe s
ch
oo
ls c
o-o
rdin
ato
r a
t d
istr
icts
; sa
fe s
ch
oo
ls m
an
ag
er
at
He
ad
Off
ice

An
nu
al R
ep
ort
fo
r 2013/1
4 F
ina
nc
ial Y
ea
r
Vo
te 5
: D
ep
art
me
nt
of
Ed
uc
ati
on
Pro
vin
ce
of
the
We
ste
rn C
ap
e
25
3
PP
I 2
.3
No
Te
ch
nic
al I
nd
ica
tor
De
scrip
tio
n
Re
spo
nse
1
Ind
ica
tor
Title
Nu
mb
er
of
bu
rsa
rie
s a
wa
rde
d t
o d
ese
rvin
g s
tud
en
ts, fo
r fo
ur
ye
ars
of
form
al s
tud
y a
t
Hig
he
r Ed
uc
atio
n In
stitu
tio
ns.
2
Sh
ort
De
fin
itio
n
Th
e n
um
be
r o
f b
urs
arie
s a
wa
rde
d t
o e
na
ble
asp
irin
g t
ea
ch
ers
to
qu
alif
y in
sc
arc
e s
ub
jec
t
are
as
- b
oth
ne
w a
nd
co
ntin
uin
g b
urs
arie
s.
3
Pu
rpo
se/
Imp
ort
an
ce
Exp
lain
wh
at
the
in
dic
ato
r is
in
ten
de
d t
o s
ho
w a
nd
wh
y it
is im
po
rta
nt
3.1
Wh
at
do
es
ind
ica
tor
sho
w?
T
he
nu
mb
er
of
bu
rsa
ry r
ec
ipie
nts
.
3.2
Wh
y is
it im
po
rta
nt?
T
o in
dic
ate
ho
w m
an
y n
ew
ly q
ua
lifie
d t
ea
ch
ers
in s
ca
rce
su
bje
ct
are
as
are
ca
pa
cita
ted
pe
r a
nn
um
to
alle
via
te t
he
de
ma
nd
. E
nsu
rin
g a
co
nst
an
t p
oo
l of
ed
uc
ato
rs.
4
So
urc
e/
Co
llec
tio
n
of
da
ta
De
scrib
e w
he
re t
he
info
rma
tio
n c
om
es
fro
m a
nd
ho
w it
is c
olle
cte
d:
4.1
Wh
ere
do
es
da
ta c
om
e f
rom
?
Fro
m in
div
idu
al b
urs
ary
file
s a
nd
bu
rsa
ry c
on
tra
cts
.
4.2
Da
ta c
olle
cto
r/st
ore
r
(se
ctio
n/m
an
ag
er
na
me
)
Dire
cto
r: H
um
an
Re
sou
rce
Ma
na
ge
me
nt
4.3
Ho
w is
da
ta c
olle
cte
d?
B
y m
ain
tain
ing
eff
ec
tive
re
co
rd k
ee
pin
g a
nd
co
mm
un
ica
tio
n w
ith
bu
rsa
ry h
old
ers
.
5
Me
tho
d o
f
Ca
lcu
latio
n
De
scrib
e c
lea
rly a
nd
sp
ec
ific
ally
ho
w
the
ind
ica
tor
is c
alc
ula
ted
Th
e n
um
be
r o
f a
ctive
bu
rsa
ry c
on
tra
cts
as
at
31 M
arc
h a
t th
e e
nd
of
the
fin
an
cia
l ye
ar
co
nc
ern
ed
.
6
Da
ta L
imita
tio
ns
Ide
ntify
an
y li
mita
tio
n w
ith
th
e
ind
ica
tor
da
ta, in
clu
din
g f
ac
tors
th
at
mig
ht
be
be
yo
nd
th
e d
ep
art
me
nt’
s
co
ntr
ol
Un
exp
ec
ted
dro
p o
ut
/fa
lure
of
stu
de
nts
.
7
Typ
e o
f In
dic
ato
r
In
pu
t
8
Ca
lcu
latio
n t
yp
e
No
n-c
um
ula
tive
X
9
Re
po
rtin
g c
yc
le
An
nu
ally
X
11
De
sire
d
pe
rfo
rma
nc
e
Ide
ntify
wh
eth
er
ac
tua
l pe
rfo
rma
nc
e
tha
t is
hig
he
r o
r lo
we
r th
an
ta
rge
ted
pe
rfo
rma
nc
e is
de
sira
ble
Ac
tua
l pe
rfo
rma
nc
e s
ho
uld
ma
tch
ta
rge
t.
12
Ind
ica
tor
resp
on
sib
ility
Ide
ntify
wh
o is
re
spo
nsi
ble
fo
r
ma
na
gin
g a
nd
re
po
rtin
g t
he
ind
ica
tor
Hu
ma
n R
eso
urc
e M
an
ag
em
en
t

An
nu
al R
ep
ort
fo
r 2013/1
4 F
ina
nc
ial Y
ea
r
Vo
te 5
: D
ep
art
me
nt
of
Ed
uc
ati
on
Pro
vin
ce
of
the
We
ste
rn C
ap
e
25
4
PP
I 2
.4
No
Te
ch
nic
al I
nd
ica
tor
De
scrip
tio
n
Re
spo
nse
1
Ind
ica
tor
Title
Ed
uc
ato
r a
bse
nte
eis
m in
pu
blic
ord
ina
ry s
ch
oo
ls e
xp
ress
ed
as
a %
2
Sh
ort
De
fin
itio
n
Th
e p
erc
en
tag
e o
f w
ork
ing
da
ys
lost
du
e t
o e
du
ca
tor
ab
sen
tee
ism
in
pu
blic
ord
ina
ry
sch
oo
ls. [r
esu
lt t
o b
e e
xp
ress
ed
as
a %
of
the
to
tal n
um
be
r o
f a
ctu
al w
ork
ing
da
ys
in t
he
sch
oo
l ye
ar/
qu
art
er]
3
Pu
rpo
se/
Imp
ort
an
ce
Exp
lain
wh
at
the
in
dic
ato
r is
in
ten
de
d t
o s
ho
w a
nd
wh
y it
is im
po
rta
nt
3.1
Wh
at
do
es
ind
ica
tor
sho
w?
T
he
% o
f p
oss
ible
wo
rkin
g d
ays
lost
du
e t
o e
du
ca
tor
ab
sen
tee
ism
du
rin
g a
sp
ec
ific
sch
oo
l ye
ar/
qu
art
er.
3.2
Wh
y is
it im
po
rta
nt?
Th
e s
tatu
s in
form
s p
lan
nin
g a
nd
in
terv
en
tio
n s
tra
teg
ies
to b
e d
eve
lop
ed
to
im
pro
ve
ed
uc
atio
n p
olic
y a
nd
su
pp
ort
/dis
cip
line
.
4
So
urc
e/
Co
llec
tio
n
of
da
ta
De
scrib
e w
he
re t
he
info
rma
tio
n c
om
es
fro
m a
nd
ho
w it
is c
olle
cte
d:
4.1
Wh
ere
do
es
da
ta c
om
e f
rom
?
PER
SA
L
4.2
Da
ta c
olle
cto
r/st
ore
r
(se
ctio
n/m
an
ag
er
na
me
)
Dire
cto
rate
: H
um
an
Re
sou
rce
Ma
na
ge
me
nt
4.3
Ho
w is
da
ta c
olle
cte
d?
D
ata
extr
ac
ted
fro
m P
ers
al a
t a
pa
rtic
ula
r p
oin
t in
tim
e t
o r
efle
ct
ed
uc
ato
r a
bse
nte
eis
m
du
rin
g a
qu
art
er
or
an
nu
ally
.
5
Me
tho
d o
f
Ca
lcu
latio
n
De
scrib
e c
lea
rly a
nd
sp
ec
ific
ally
ho
w
the
ind
ica
tor
is c
alc
ula
ted
The
da
ta is
co
llec
ted
by u
sin
g t
he
sta
rt d
ate
of
the
lea
ve
in o
rde
r to
de
term
ine
in w
hic
h
qu
art
er
the
lea
ve
fa
lls
Sh
ou
ld t
he
lea
ve
pe
rio
d (
lea
ve
ap
pro
ve
d o
ve
r tw
o q
ua
rte
rs o
r lo
ng
er)
fa
ll o
uts
ide
th
e
rep
ort
ing
pe
rio
d, th
e le
ave
ta
ke
n w
ill b
e in
clu
de
d in
th
e r
ep
ort
ing
pe
rio
d t
ha
t
co
rre
spo
nd
s w
ith
th
e e
nd
of
the
lea
ve
.
The
nu
mb
er
of
da
ys
of
lea
ve
ta
ke
n is
ca
lcu
late
d a
s a
% o
f th
e t
ota
l nu
mb
er
of
po
ssib
le
wo
rkin
g d
ays
in a
qu
art
er.
6
Da
ta L
imita
tio
ns
Ide
ntify
an
y li
mita
tio
n w
ith
th
e
ind
ica
tor
da
ta, in
clu
din
g f
ac
tors
th
at
mig
ht
be
be
yo
nd
th
e d
ep
art
me
nt’
s
co
ntr
ol
The
re is
a t
ime
lag
be
twe
en
th
e d
ays
take
n a
nd
th
e p
roc
ess
ing
of
the
do
cu
me
nta
tio
n.
The
re is
a f
urt
he
r la
g in
th
e c
om
pu
tatio
n o
f th
e c
ate
go
rie
s a
s c
ert
ain
lea
ve
typ
es
are
exe
mp
t a
nd
th
e le
ave
re
gu
latio
ns
by w
hic
h le
ave
is
ca
lcu
late
d in
3 y
ea
r c
yc
les
7
Typ
e o
f In
dic
ato
r
Ou
tpu
ts/e
ffic
ien
cy
8
Ca
lcu
latio
n t
yp
e
No
n-c
um
ula
tive
X
9
Re
po
rtin
g c
yc
le
Qu
art
erly
X
10
De
sire
d
pe
rfo
rma
nc
e
Ide
ntify
wh
eth
er
ac
tua
l pe
rfo
rma
nc
e
tha
t is
hig
he
r o
r lo
we
r th
an
ta
rge
ted
pe
rfo
rma
nc
e is
de
sira
ble
Low
er
11
Ind
ica
tor
resp
on
sib
ility
Ide
ntify
wh
o is
re
spo
nsi
ble
fo
r
ma
na
gin
g a
nd
re
po
rtin
g t
he
ind
ica
tor
Th
e C
hie
f-D
ire
cto
r: H
um
an
Re
sou
rce
Ma
na
ge
me
nt

An
nu
al R
ep
ort
fo
r 2013/1
4 F
ina
nc
ial Y
ea
r
Vo
te 5
: D
ep
art
me
nt
of
Ed
uc
ati
on
Pro
vin
ce
of
the
We
ste
rn C
ap
e
25
5
PP
I 2
.5
No
Te
ch
nic
al I
nd
ica
tor
De
scrip
tio
n
Re
spo
nse
1
Ind
ica
tor
Title
Lea
rne
r a
bse
nte
eis
m in
pu
blic
ord
ina
ry s
ch
oo
ls e
xp
ress
ed
as
a %
2
Sh
ort
De
fin
itio
n
Th
e n
um
be
r o
f w
ork
ing
da
ys
lost
du
e t
o le
arn
er
ab
sen
tee
ism
in
pu
blic
ord
ina
ry s
ch
oo
ls.
[re
sult t
o b
e e
xp
ress
ed
as
a %
of
the
to
tal n
um
be
r o
f a
ctu
al w
ork
ing
da
ys
in t
he
sc
ho
ol
ye
ar/
qu
art
er]
3
Pu
rpo
se/
Imp
ort
an
ce
Exp
lain
wh
at
the
in
dic
ato
r is
in
ten
de
d t
o s
ho
w a
nd
wh
y it
is im
po
rta
nt
3.1
Wh
at
do
es
ind
ica
tor
sho
w?
%
of
po
ssib
le w
ork
ing
da
ys
lost
du
e t
o le
arn
er
ab
sen
tee
ism
du
rin
g a
sp
ec
ific
sc
ho
ol y
ea
r.
3.2
Wh
y is
it im
po
rta
nt?
Th
e s
tatu
s in
form
s p
lan
nin
g a
nd
in
terv
en
tio
n s
tra
teg
ies
to b
e d
eve
lop
ed
to
im
pro
ve
ed
uc
atio
n p
olic
y a
nd
su
pp
ort
/dis
cip
line
.
4
So
urc
e/
Co
llec
tio
n
of
da
ta
De
scrib
e w
he
re t
he
info
rma
tio
n c
om
es
fro
m a
nd
ho
w it
is c
olle
cte
d:
4.1
Wh
ere
do
es
da
ta c
om
e f
rom
?
CEM
IS
4.2
Da
ta c
olle
cto
r/st
ore
r
(se
ctio
n/m
an
ag
er
na
me
)
Pro
jec
t m
an
ag
er:
CEM
IS– D
ire
cto
rate
: K
no
wle
dg
e a
nd
In
form
atio
n M
an
ag
em
en
t
4.3
Ho
w is
da
ta c
olle
cte
d?
A
t e
ac
h s
ch
oo
l le
arn
er
att
en
da
nc
e is
re
qu
ire
d t
o b
e c
ap
ture
d q
ua
rte
rly o
n t
he
CEM
IS
syst
em
at
the
en
d o
f e
ac
h t
erm
an
d n
o la
ter
tha
n t
he
first
we
ek o
f th
e n
ext
term
.
CTM
pe
r D
istr
ict
ca
n m
on
ito
r th
e d
ata
on
Ed
uin
fose
arc
h.
The
ad
min
istr
ato
r a
t H
/O d
raw
s re
po
rts
up
on
re
qu
est
, b
ut
mo
re s
pe
cific
fo
r
qu
art
erly/a
nn
ua
l re
po
rtin
g o
n t
he
Le
arn
er
Att
en
da
nc
e.
The
att
en
da
nc
e f
igu
res
are
th
en
pre
sen
ted
as
a p
erc
en
tag
e o
f d
ays
lost
du
e t
o L
ea
rne
r
ab
sen
ce
fro
m s
ch
oo
l.
5
Me
tho
d o
f
Ca
lcu
latio
n
De
scrib
e c
lea
rly a
nd
sp
ec
ific
ally
ho
w
the
ind
ica
tor
is c
alc
ula
ted
The
ag
gre
ga
ted
nu
mb
er
of
lea
rne
rs a
bse
nt
at
all
co
mp
lian
t p
ub
lic o
rdin
ary
sc
ho
ols
is
exp
ress
ed
as
a p
erc
en
tag
e o
f th
e t
ota
l po
ssib
le a
tte
nd
an
ce
da
ys.
6
Da
ta L
imita
tio
ns
Ide
ntify
an
y li
mita
tio
n w
ith
th
e in
dic
a-
tor
da
ta, in
clu
din
g f
ac
tors
th
at
mig
ht
be
be
yo
nd
th
e d
ep
art
me
nt’
s c
on
tro
l
In 2
01
2 7
5%
of
sch
oo
ls c
om
plie
d w
ith
th
e d
ata
re
qu
est
. Th
e c
om
plia
nc
e c
ha
llen
ge
will
be
att
en
de
d t
o d
urin
g 2
01
3 a
s th
is is
no
w a
n in
dic
ato
r in
th
e S
ch
oo
l Im
pro
ve
me
nt
Pla
ns.
Sc
ho
ols
th
at
rep
ea
ted
ly r
etu
rn e
rro
ne
ou
s d
ata
will
be
ide
ntifie
d a
nd
will
re
ce
ive
tra
inin
g.
7
Typ
e o
f In
dic
ato
r
Ou
tpu
ts/e
ffic
ien
cy
8
Ca
lcu
latio
n t
yp
e
No
n-c
um
ula
tive
X
9
Re
po
rtin
g c
yc
le
Qu
art
erly
X
10
De
sire
d
pe
rfo
rma
nc
e
Ide
ntify
wh
eth
er
ac
tua
l pe
rfo
rma
nc
e
tha
t is
hig
he
r o
r lo
we
r th
an
ta
rge
ted
pe
rfo
rma
nc
e is
de
sira
ble
Low
er
11
Ind
ica
tor
resp
on
sib
ility
Ide
ntify
wh
o is
re
spo
nsi
ble
fo
r
ma
na
gin
g a
nd
re
po
rtin
g t
he
ind
ica
tor
Th
e C
hie
f-D
ire
cto
r: B
usi
ne
ss In
telli
ge
nc
e M
an
ag
em
en
t

An
nu
al R
ep
ort
fo
r 2013/1
4 F
ina
nc
ial Y
ea
r
Vo
te 5
: D
ep
art
me
nt
of
Ed
uc
ati
on
Pro
vin
ce
of
the
We
ste
rn C
ap
e
25
6
PP
I 2
.6
No
Te
ch
nic
al I
nd
ica
tor
De
scrip
tio
n
Re
spo
nse
1
N
um
be
rs o
f te
ac
he
rs in
Gra
de
s R
-12 a
tte
nd
ing
fo
rma
l cu
rric
ulu
m t
rain
ing
pro
gra
mm
es
at
the
Ca
pe
Te
ac
hin
g a
nd
Le
ad
ers
hip
In
stitu
te
2
Sh
ort
De
fin
itio
n
N
um
be
r o
f e
du
ca
tors
att
en
din
g in
-se
rvic
e c
ou
rse
s in
su
bje
ct
co
nte
nt
an
d t
ea
ch
ing
me
tho
do
log
y p
rese
nte
d b
y t
he
CTL
I, in
clu
din
g M
ath
em
atic
s, S
cie
nc
es
an
d L
an
gu
ag
es.
(To
pro
vid
e o
ve
rall
ma
na
ge
me
nt
of
an
d s
up
po
rt t
o t
he
ed
uc
atio
n s
yst
em
in
ac
co
rda
nc
e
with
th
e N
atio
na
l Ed
uc
atio
n P
olic
y A
ct,
an
d o
the
r re
leva
nt
po
licie
s). Th
e c
ou
rse
s c
ou
ld
be
tw
o w
ee
ks
in d
ura
tio
n O
R o
ne
or
two
da
y s
ho
rt in
terv
en
tio
ns.
3
Pu
rpo
se/
Imp
ort
an
ce
Exp
lain
wh
at
the
in
dic
ato
r is
in
ten
de
d t
o s
ho
w a
nd
wh
y it
is im
po
rta
nt
3.1
Wh
at
do
es
ind
ica
tor
sho
w?
T
he
nu
mb
er
of
ed
uc
ato
rs t
rain
ed
in t
he
va
rio
us
ca
teg
orie
s
3.2
Wh
y is
it im
po
rta
nt?
To
str
en
gth
en
co
nte
nt
kn
ow
led
ge
an
d p
rac
tic
al t
ea
ch
ing
me
tho
do
log
y,
tow
ard
s
imp
rove
d le
arn
ing
an
d t
ea
ch
ing
in t
he
cla
ssro
om
.
4
So
urc
e/
Co
llec
tio
n
of
da
ta
De
scrib
e w
he
re t
he
info
rma
tio
n c
om
es
fro
m a
nd
ho
w it
is c
olle
cte
d:
4.1
Wh
ere
do
es
da
ta c
om
e f
rom
?
Att
en
da
nc
e r
eg
iste
rs
4.2
Da
ta c
olle
cto
r/st
ore
r
(se
ctio
n/m
an
ag
er
na
me
)
N P
asi
ya
(H
ea
d: C
ap
e T
ea
ch
ing
an
d L
ea
de
rsh
ip In
stitu
te)
4.3
Ho
w is
da
ta c
olle
cte
d?
C
ou
nt
ca
ptu
red
na
me
s
5
Me
tho
d o
f
Ca
lcu
latio
n
De
scrib
e c
lea
rly a
nd
sp
ec
ific
ally
ho
w
the
ind
ica
tor
is c
alc
ula
ted
Nu
mb
er
of
tea
ch
ers
su
cc
ess
fully
co
mp
letin
g c
ou
rse
s.
6
Da
ta L
imita
tio
ns
Ide
ntify
an
y li
mita
tio
n w
ith
th
e
ind
ica
tor
da
ta, in
clu
din
g f
ac
tors
th
at
mig
ht
be
be
yo
nd
th
e d
ep
art
me
nt’
s
co
ntr
ol
No
ne
7
Typ
e o
f In
dic
ato
r
Ou
tpu
t
8
Ca
lcu
latio
n t
yp
e
No
n-c
um
ula
tive
N
on
-cu
mu
lative
9
Re
po
rtin
g c
yc
le
Qu
art
erly?
Q
ua
rte
rly
10
De
sire
d
pe
rfo
rma
nc
e
Ide
ntify
wh
eth
er
ac
tua
l pe
rfo
rma
nc
e
tha
t is
hig
he
r o
r lo
we
r th
an
ta
rge
ted
pe
rfo
rma
nc
e is
de
sira
ble
Extr
as
are
ac
co
mm
od
ate
d if
po
ssib
le.
11
Ind
ica
tor
resp
on
sib
ility
Ide
ntify
wh
o is
re
spo
nsi
ble
fo
r
ma
na
gin
g a
nd
re
po
rtin
g t
he
ind
ica
tor
The
Dire
cto
r: C
TLI

An
nu
al R
ep
ort
fo
r 2013/1
4 F
ina
nc
ial Y
ea
r
Vo
te 5
: D
ep
art
me
nt
of
Ed
uc
ati
on
Pro
vin
ce
of
the
We
ste
rn C
ap
e
25
7
PP
I 2
.7
No
Te
ch
nic
al I
nd
ica
tor
De
scrip
tio
n
Re
spo
nse
1
Ind
ica
tor
Title
Nu
mb
ers
of
sch
oo
l ma
na
ge
me
nt
tea
m m
em
be
rs t
rain
ed
at
the
CTL
I
2
Sh
ort
De
fin
itio
n
R
ec
ord
s th
e n
um
be
r o
f m
em
be
rs o
f sc
ho
ol m
an
ag
em
en
t te
am
s w
ho
un
de
rgo
fo
rma
l
tra
inin
g o
ve
r a
pe
rio
d o
f w
ee
ks
an
d a
re c
ert
ific
ate
d b
y t
he
CTL
I. S
ho
rt c
ou
rse
s (o
ne
or
two
da
ys)
are
als
o in
clu
de
d.
3
Pu
rpo
se/
Imp
ort
an
ce
Exp
lain
wh
at
the
in
dic
ato
r is
in
ten
de
d t
o s
ho
w a
nd
wh
y it
is im
po
rta
nt
3.1
Wh
at
do
es
ind
ica
tor
sho
w?
N
um
be
rs o
f SM
T m
em
be
rs w
ho
ha
ve
be
en
exp
ose
d t
o e
lem
en
ts o
f b
est
pra
ctic
e.
3.2
Wh
y is
it im
po
rta
nt?
Sc
ho
ols
th
at
suff
er
fro
m p
oo
r m
an
ag
em
en
t c
an
ha
ve
th
eir s
uc
ce
ss o
ptio
ns
imp
rove
d if
the
ir m
an
ag
ers
de
ve
lop
ne
w s
kill
s.
4
So
urc
e/
Co
llec
tio
n
of
da
ta
De
scrib
e w
he
re t
he
info
rma
tio
n c
om
es
fro
m a
nd
ho
w it
is c
olle
cte
d:
4.1
Wh
ere
do
es
da
ta c
om
e f
rom
?
Att
en
da
nc
e R
eg
iste
rs
4.2
Da
ta c
olle
cto
r/st
ore
r
(se
ctio
n/m
an
ag
er
na
me
)
Pro
gra
mm
e m
an
ag
er.
Re
co
rds
of
att
en
da
nc
e.
4.3
Ho
w is
da
ta c
olle
cte
d?
C
ou
nt
of
rec
ord
s.
5
Me
tho
d o
f
Ca
lcu
latio
n
De
scrib
e c
lea
rly a
nd
sp
ec
ific
ally
ho
w
the
ind
ica
tor
is c
alc
ula
ted
Nu
mb
er
of
ca
nd
ida
tes
suc
ce
ssfu
lly c
om
ple
tin
g t
he
co
urs
es
6
Da
ta L
imita
tio
ns
Ide
ntify
an
y li
mita
tio
n w
ith
th
e
ind
ica
tor
da
ta, in
clu
din
g f
ac
tors
th
at
mig
ht
be
be
yo
nd
th
e d
ep
art
me
nt’
s
co
ntr
ol
No
ne
7
Typ
e o
f In
dic
ato
r
Ou
tpu
t
8
Ca
lcu
latio
n t
yp
e
8.2
No
n-c
um
ula
tive
N
on
- c
um
ula
tive
9
Re
po
rtin
g c
yc
le
Ide
ntify
if a
n in
dic
ato
r is
re
po
rte
d q
ua
rte
rly, a
nn
ua
lly o
r a
t lo
ng
er
tim
e in
terv
als
9.1
Qu
art
erly?
Q
ua
rte
rly
9.2
An
nu
ally
?
9.3
Oth
er?
Ple
ase
sta
te
10
De
sire
d
pe
rfo
rma
nc
e
Ide
ntify
wh
eth
er
ac
tua
l pe
rfo
rma
nc
e
tha
t is
hig
he
r o
r lo
we
r th
an
ta
rge
ted
pe
rfo
rma
nc
e is
de
sira
ble
On
ta
rge
t
11
Ind
ica
tor
resp
on
sib
ility
Ide
ntify
wh
o is
re
spo
nsi
ble
fo
r
ma
na
gin
g a
nd
re
po
rtin
g t
he
ind
ica
tor
Dire
cto
r C
TLI

An
nu
al R
ep
ort
fo
r 2013/1
4 F
ina
nc
ial Y
ea
r
Vo
te 5
: D
ep
art
me
nt
of
Ed
uc
ati
on
Pro
vin
ce
of
the
We
ste
rn C
ap
e
25
8
PP
I 5
.1.
No
Te
ch
nic
al I
nd
ica
tor
De
scrip
tio
n
Re
spo
nse
1
Nu
mb
er
of
stu
de
nts
en
rolle
d in
NC
(V)
co
urs
es
in F
ET
Co
lleg
es
2
Sh
ort
De
fin
itio
n
Th
e N
C(V
) is
a 3
ye
ar
stu
dy p
rog
ram
me
. Th
e r
ec
ord
s w
ill s
ho
w w
ho
ha
s e
nro
lled
fo
r th
e
co
urs
e o
f st
ud
y le
ad
ing
to
th
e c
ert
ific
ate
.
3
Pu
rpo
se
Imp
ort
an
ce
Exp
lain
wh
at
the
in
dic
ato
r is
in
ten
de
d t
o s
ho
w a
nd
wh
y it
is im
po
rta
nt
3.1
Wh
at
do
es
ind
ica
tor
sho
w?
N
um
be
r o
f st
ud
en
ts e
nro
lled
in
NC
(V)
co
urs
es
in F
ET
Co
lleg
es
in t
he
We
ste
rn C
ap
e.
3.2
Wh
y is
it im
po
rta
nt?
Th
e q
ua
lific
atio
n o
pe
ns
do
ors
to
fu
rth
er
stu
dy a
nd
to
em
plo
ym
en
t o
pp
ort
un
itie
s.
4
So
urc
e/.
Co
llec
tio
n
of
Da
ta
De
scrib
e w
he
re t
he
info
rma
tio
n c
om
es
fro
m a
nd
ho
w it
is c
olle
cte
d:
4.1
Wh
ere
do
es
da
ta c
om
e f
rom
?
FET
Co
lleg
es
en
rolm
en
t d
ata
4.2
Da
ta c
olle
cto
r/st
ore
r
(se
ctio
n/m
an
ag
er
na
me
)
FET
Co
lleg
es
sub
mit t
he
da
ta t
o t
he
De
pa
rtm
en
t o
f H
igh
er
Ed
uc
atio
n a
nd
Tra
inin
g.
4.3
Ho
w is
da
ta c
olle
cte
d?
C
ou
nt
of
lea
rne
r re
co
rds
5
Me
tho
d o
f
Ca
lcu
latio
n
De
scrib
e c
lea
rly a
nd
sp
ec
ific
ally
ho
w
the
ind
ica
tor
is c
alc
ula
ted
Co
un
t o
f th
ose
en
rolle
d f
or
co
urs
es
exp
ress
ed
in h
ea
d c
ou
nt
an
d F
TE
6
Da
ta L
imita
tio
ns
Ide
ntify
an
y li
mita
tio
n w
ith
th
e
ind
ica
tor
da
ta, in
clu
din
g f
ac
tors
th
at
mig
ht
be
be
yo
nd
th
e d
ep
art
me
nt’
s
co
ntr
ol
Re
co
rds
are
ke
pt
at
co
lleg
es
an
d s
up
plie
d t
o t
he
DH
ET.
7
Typ
e o
f In
dic
ato
r
In
pu
t
8
Ca
lcu
latio
n t
yp
e
Cu
mu
lative
X
9
Re
po
rtin
g c
yc
le
An
nu
ally
X
10
Ind
ica
tor
His
tory
Sa
me
as
pre
vio
us
ye
ar
Sa
me
as
pre
vio
us
ye
ar:
it
wa
s p
revio
usl
y a
na
tio
na
l Pro
gra
mm
e P
erf
orm
an
ce
Me
asu
re
11
De
sire
d
pe
rfo
rma
nc
e
Ide
ntify
wh
eth
er
ac
tua
l pe
rfo
rma
nc
e
tha
t is
hig
he
r o
r lo
we
r th
an
ta
rge
ted
pe
rfo
rma
nc
e is
de
sira
ble
Hig
he
r
12
Ind
ica
tor
resp
on
sib
ility
Ide
ntify
wh
o is
re
spo
nsi
ble
fo
r
ma
na
gin
g a
nd
re
po
rtin
g t
he
ind
ica
tor
De
pa
rtm
en
t o
f H
igh
er
Ed
uc
atio
n a
nd
Tra
inin
g; FET
Co
lleg
e s
ec
tor
in W
est
ern
Ca
pe
.

An
nu
al R
ep
ort
fo
r 2013/1
4 F
ina
nc
ial Y
ea
r
Vo
te 5
: D
ep
art
me
nt
of
Ed
uc
ati
on
Pro
vin
ce
of
the
We
ste
rn C
ap
e
25
9
PP
I 5
.2.
No
Te
ch
nic
al I
nd
ica
tor
De
scrip
tio
n
Re
spo
nse
1
Nu
mb
er
of
FET
Co
lleg
e N
C(V
) st
ud
en
ts w
ho
co
mp
lete
d f
ull
co
urs
es
suc
ce
ssfu
lly
2
Sh
ort
De
fin
itio
n
Th
e N
C(V
) is
a 3
ye
ar
stu
dy p
rog
ram
me
. Th
e s
tud
en
ts a
re r
eq
uire
d t
o w
rite
exa
min
atio
ns
at
the
en
d o
f e
ac
h y
ea
r. T
he
re
co
rds
will
sh
ow
wh
o q
ua
lifie
s fo
r th
e c
ert
ific
ate
aft
er
co
mp
letin
g a
ll th
e r
eq
uire
me
nts
.
3
Pu
rpo
se
Imp
ort
an
ce
Exp
lain
wh
at
the
in
dic
ato
r is
in
ten
de
d t
o s
ho
w a
nd
wh
y it
is im
po
rta
nt
3.1
Wh
at
do
es
ind
ica
tor
sho
w?
It
is a
co
un
t o
f n
um
be
rs o
f w
ho
ha
d s
uc
ce
ssfu
lly c
om
ple
ted
th
e p
rog
ram
me
of
stu
dy t
ha
t
lea
ds
to t
he
NC
(V)
qu
alif
ica
tio
n.
3.2
Wh
y is
it im
po
rta
nt?
Th
is is
the
pro
gra
mm
e o
f st
ud
y t
ha
t is
ce
ntr
al t
o t
he
pro
gra
mm
e o
ffe
rin
gs
at
co
lleg
es.
4
So
urc
e/
Co
llec
tio
n
of
da
ta
De
scrib
e w
he
re t
he
info
rma
tio
n c
om
es
fro
m a
nd
ho
w it
is c
olle
cte
d:
4.1
Wh
ere
do
es
da
ta c
om
e f
rom
?
Lea
rne
r re
co
rds
on
th
e n
atio
na
l exa
min
atio
ns
da
tab
ase
4.2
Da
ta c
olle
cto
r/st
ore
r
(se
ctio
n/m
an
ag
er
na
me
)
De
pa
rtm
en
t o
f H
igh
er
Ed
uc
atio
n a
nd
Tra
inin
g
4.3
Ho
w is
da
ta c
olle
cte
d?
Le
arn
er
rec
ord
s
5
Me
tho
d o
f
Ca
lcu
latio
n
De
scrib
e c
lea
rly a
nd
sp
ec
ific
ally
ho
w t
he
ind
ica
tor
is c
alc
ula
ted
Ind
ivid
ua
l re
co
rds
are
pre
sen
ted
on
a s
um
ma
ry li
st: it is
a C
OU
NT
of
suc
ce
ssfu
l ca
nd
ida
tes.
6
Da
ta L
imita
tio
ns
Ide
ntify
an
y li
mita
tio
n w
ith
th
e
ind
ica
tor
da
ta, in
clu
din
g f
ac
tors
th
at
mig
ht
be
be
yo
nd
th
e d
ep
art
me
nt’
s
co
ntr
ol
No
ne
7
Typ
e o
f In
dic
ato
r
Ou
tco
me
s
8
Ca
lcu
latio
n t
yp
e
Cu
mu
lative
X
9
Re
po
rtin
g c
yc
le
An
nu
ally
X
10
Ind
ica
tor
His
tory
Sa
me
as
pre
vio
us
ye
ar
Sa
me
as
pre
vio
us
ye
ar:
it
wa
s p
revio
usl
y a
na
tio
na
l Pro
gra
mm
e P
erf
orm
an
ce
Me
asu
re
11
De
sire
d
pe
rfo
rma
nc
e
Ide
ntify
wh
eth
er
ac
tua
l
pe
rfo
rma
nc
e t
ha
t is
hig
he
r o
r lo
we
r
tha
n t
arg
ete
d p
erf
orm
an
ce
is
de
sira
ble
Hig
he
r
12
Ind
ica
tor
resp
on
sib
ility
Ide
ntify
wh
o is
re
spo
nsi
ble
fo
r
ma
na
gin
g a
nd
re
po
rtin
g t
he
ind
ica
tor
De
pa
rtm
en
t o
f H
igh
er
Ed
uc
atio
n a
nd
Tra
inin
g; FET
Co
lleg
e s
ec
tor
in W
est
ern
Ca
pe
.

An
nu
al R
ep
ort
fo
r 2013/1
4 F
ina
nc
ial Y
ea
r
Vo
te 5
: D
ep
art
me
nt
of
Ed
uc
ati
on
Pro
vin
ce
of
the
We
ste
rn C
ap
e
26
0
PP
I 6
.1.
No
Te
ch
nic
al I
nd
ica
tor
De
scrip
tio
n
Re
spo
nse
1
Ind
ica
tor
Title
Nu
mb
er
of
lea
rne
rs e
nro
lled
in
pu
blic
AB
ET
Ce
ntr
es.
[D
efin
itio
n o
f A
BET:
All
lea
rnin
g a
nd
tra
inin
g p
rog
ram
me
s fo
r a
du
lts
fro
m L
eve
l 1 t
o 4
, w
he
re A
BET
Leve
l 4 is
eq
uiv
ale
nt
to
Gra
de
9 in
pu
blic
sc
ho
ols
or
a N
atio
na
l Qu
alif
ica
tio
ns
Fra
me
wo
rk le
ve
l 1, a
s
co
nte
mp
late
d in
th
e S
ou
th A
fric
an
Qu
alif
ica
tio
ns
Au
tho
rity
Ac
t, N
um
be
r 5
8 o
f 19
95
.]
2
Sh
ort
De
fin
itio
n
R
ec
ord
of
the
to
tal n
um
be
r o
f le
arn
ers
(e
xp
ec
ted
to
be
) e
nro
lled
in p
ub
lic A
BET
Ce
ntr
es
in t
he
pla
nn
ed
fin
an
cia
l ye
ar.
3
Pu
rpo
se/
Imp
ort
an
ce
Exp
lain
wh
at
the
in
dic
ato
r is
in
ten
de
d t
o s
ho
w a
nd
wh
y it
is im
po
rta
nt
3.1
Wh
at
do
es
ind
ica
tor
sho
w?
R
ec
ord
of
the
to
tal n
um
be
r o
f le
arn
ers
(e
xp
ec
ted
to
be
) e
nro
lled
in p
ub
lic A
BET
Ce
ntr
es
in t
he
pla
nn
ed
fin
an
cia
l ye
ar.
3.2
Wh
y is
it im
po
rta
nt?
A
ET
is a
ke
y s
ec
tor
for
skill
s a
nd
ec
on
om
ic d
eve
lop
me
nt
an
d e
nsu
rin
g r
ed
ress
an
d
op
po
rtu
nity.
4
So
urc
e/
Co
llec
tio
n
of
da
ta
De
scrib
e w
he
re t
he
info
rma
tio
n c
om
es
fro
m a
nd
ho
w it
is c
olle
cte
d:
4.1
Wh
ere
do
es
da
ta c
om
e f
rom
?
Sn
ap
an
d A
nn
ua
l Su
rve
y
4.2
Da
ta c
olle
cto
r/st
ore
r
(se
ctio
n/m
an
ag
er
na
me
)
Sn
ap
an
d A
nn
ua
l Su
rve
y d
ata
are
re
co
rde
d a
nd
ca
ptu
red
on
CEM
IS.
4.3
Ho
w is
da
ta c
olle
cte
d?
Sn
ap
an
d A
nn
ua
l Su
rve
y a
re r
ec
ord
ed
an
d c
ap
ture
d –
th
is is
a C
OU
NT
5
Me
tho
d o
f
Ca
lcu
latio
n
De
scrib
e c
lea
rly a
nd
sp
ec
ific
ally
ho
w
the
ind
ica
tor
is c
alc
ula
ted
Sn
ap
an
d A
nn
ua
l Su
rve
y a
re r
ec
ord
ed
an
d c
ap
ture
d –
th
is is
a C
OU
NT.
6
Da
ta L
imita
tio
ns
Ide
ntify
an
y li
mita
tio
n w
ith
th
e
ind
ica
tor
da
ta, in
clu
din
g f
ac
tors
th
at
mig
ht
be
be
yo
nd
th
e d
ep
art
me
nt’
s
co
ntr
ol
Re
co
rds
are
ma
inta
ine
d a
t c
en
tre
s a
nd
da
ta c
ap
ture
d o
n C
EM
IS.
7
Typ
e o
f In
dic
ato
r
Eff
icie
nc
y
8
Ca
lcu
latio
n t
yp
e
No
n-c
um
ula
tive
X
9
Re
po
rtin
g c
yc
le
An
nu
ally
X
10
Ind
ica
tor
His
tory
Sa
me
as
pre
vio
us
ye
ar
Sa
me
as
pre
vio
us
ye
ar:
it
wa
s p
revio
usl
y a
na
tio
na
l Pro
gra
mm
e P
erf
orm
an
ce
Me
asu
re
11
De
sire
d
pe
rfo
rma
nc
e
Ide
ntify
wh
eth
er
ac
tua
l pe
rfo
rma
nc
e
tha
t is
hig
he
r o
r lo
we
r th
an
ta
rge
ted
pe
rfo
rma
nc
e is
de
sira
ble
Hig
he
r
12
Ind
ica
tor
resp
on
sib
ility
Ide
ntify
wh
o is
re
spo
nsi
ble
fo
r
ma
na
gin
g a
nd
re
po
rtin
g t
he
ind
ica
tor
De
pa
rtm
en
t o
f H
igh
er
Ed
uc
atio
n a
nd
Tra
inin
g;
AET
sub
-dire
cto
rate
in t
he
We
ste
rn
Ca
pe
.

An
nu
al R
ep
ort
fo
r 2013/1
4 F
ina
nc
ial Y
ea
r
Vo
te 5
: D
ep
art
me
nt
of
Ed
uc
ati
on
Pro
vin
ce
of
the
We
ste
rn C
ap
e
26
1
PP
I 6
.2.
No
Te
ch
nic
al I
nd
ica
tor
De
scrip
tio
n
Re
spo
nse
1
Ind
ica
tor
Title
Nu
mb
er
of
ed
uc
ato
rs e
mp
loye
d in
pu
blic
AB
ET
Ce
ntr
es.
[D
efin
itio
n o
f A
BET:
All
lea
rnin
g
an
d t
rain
ing
pro
gra
mm
es
for
ad
ults
fro
m L
eve
l 1 t
o 4
, w
he
re A
BET
Leve
l 4 is
eq
uiv
ale
nt
to
Gra
de
9 in
pu
blic
sc
ho
ols
or
a N
atio
na
l Qu
alif
ica
tio
ns
Fra
me
wo
rk le
ve
l 1, a
s
co
nte
mp
late
d in
th
e S
ou
th A
fric
an
Qu
alif
ica
tio
ns
Au
tho
rity
Ac
t, N
um
be
r 5
8 o
f 19
95
.]
2
Sh
ort
De
fin
itio
n
C
ou
nt
of
the
nu
mb
er
of
ed
uc
ato
rs e
mp
loye
d in
pu
blic
AB
ET
Ce
ntr
es.
NB
.: T
his
me
asu
re
inc
lud
es
bo
th p
art
-tim
e a
nd
fu
ll tim
e (
He
ad
co
un
t) A
BET
ed
uc
ato
rs.
3
Pu
rpo
se/
Imp
ort
an
ce
Exp
lain
wh
at
the
in
dic
ato
r is
in
ten
de
d t
o s
ho
w a
nd
wh
y it
is im
po
rta
nt
3.1
Wh
at
do
es
ind
ica
tor
sho
w?
H
ow
ma
ny e
du
ca
tors
are
em
plo
ye
d in
pu
blic
AB
ET
Ce
ntr
es
3.2
Wh
y is
it im
po
rta
nt?
Th
ere
ne
ed
s to
be
a b
ala
nc
e b
etw
ee
n s
tud
en
ts a
nd
sta
ff
4
So
urc
e/
Co
llec
tio
n
of
da
ta
De
scrib
e w
he
re t
he
info
rma
tio
n c
om
es
fro
m a
nd
ho
w it
is c
olle
cte
d:
4.1
Wh
ere
do
es
da
ta c
om
e f
rom
?
Pu
blic
AB
ET
Ce
ntr
es
sup
ply
da
ta t
o C
EM
IS.t
hro
ug
h t
he
A
nn
ua
l Su
rve
y
4.2
Da
ta c
olle
cto
r/st
ore
r
(se
ctio
n/m
an
ag
er
na
me
)
Dire
cto
rate
Kn
ow
led
ge
Ma
na
ge
me
nt
4.3
Ho
w is
da
ta c
olle
cte
d?
Th
e
An
nu
al S
urv
ey d
ata
co
lec
tio
n
5
Me
tho
d o
f
Ca
lcu
latio
n
De
scrib
e c
lea
rly a
nd
sp
ec
ific
ally
ho
w t
he
ind
ica
tor
is c
alc
ula
ted
Co
un
t o
f th
e n
um
be
r o
f e
du
ca
tors
em
plo
ye
d in
pu
blic
AB
ET
Ce
ntr
es.
NB
.: T
his
me
asu
re
inc
lud
es
bo
th p
art
-tim
e a
nd
fu
ll tim
e (
He
ad
co
un
t) A
BET
ed
uc
ato
rs
6
Da
ta L
imita
tio
ns
Ide
ntify
an
y li
mita
tio
n w
ith
th
e
ind
ica
tor
da
ta, in
clu
din
g f
ac
tors
th
at
mig
ht
be
be
yo
nd
th
e d
ep
art
me
nt’
s
co
ntr
ol
Re
co
rds
are
ma
inta
ine
d a
t c
en
tre
s a
nd
da
ta c
ap
ture
d o
n C
EM
IS
7
Typ
e o
f In
dic
ato
r
In
pu
t
8
Ca
lcu
latio
n t
yp
e
Cu
mu
lative
X
9
Re
po
rtin
g c
yc
le
An
nu
ally
X
10
Ind
ica
tor
His
tory
Sa
me
as
pre
vio
us
ye
ar:
it
wa
s p
revio
usl
y a
na
tio
na
l Pro
gra
mm
e P
erf
orm
an
ce
Me
asu
re
10
De
sire
d
pe
rfo
rma
nc
e
Ide
ntify
wh
eth
er
ac
tua
l
pe
rfo
rma
nc
e t
ha
t is
hig
he
r o
r lo
we
r
tha
n t
arg
ete
d p
erf
orm
an
ce
is
de
sira
ble
Hig
he
r
11
Ind
ica
tor
resp
on
sib
ility
Ide
ntify
wh
o is
re
spo
nsi
ble
fo
r
ma
na
gin
g a
nd
re
po
rtin
g t
he
ind
ica
tor
De
pa
rtm
en
t o
f H
igh
er
Ed
uc
atio
n a
nd
Tra
inin
g;
AET
sub
-dire
cto
rate
in W
est
ern
Ca
pe
.

An
nu
al R
ep
ort
fo
r 2013/1
4 F
ina
nc
ial Y
ea
r
Vo
te 5
: D
ep
art
me
nt
of
Ed
uc
ati
on
Pro
vin
ce
of
the
We
ste
rn C
ap
e
26
2
PP
I 7
.1
No
Te
ch
nic
al I
nd
ica
tor
De
scrip
tio
n
Re
spo
nse
1
Ind
ica
tor
Title
Ad
dit
ion
al E
CD
kits
to P
ub
lic O
rdin
ary
Sc
ho
ols
2
Sh
ort
De
fin
itio
n
1
00 s
ele
cte
d P
rim
ary
Sc
ho
ols
th
at
ha
ve
Gra
de
R c
lass
es
are
pro
vid
ed
with
EC
D in
do
or
an
d o
utd
oo
r e
qu
ipm
en
t to
ass
ist
with
in
ter-
ac
tive
a
nd
eff
ec
tive
lea
rnin
g a
nd
te
ac
hin
g
3
Pu
rpo
se/
Imp
ort
an
ce
Exp
lain
wh
at
the
in
dic
ato
r is
in
ten
de
d t
o s
ho
w a
nd
wh
y it
is im
po
rta
nt
3.1
Wh
at
do
es
ind
ica
tor
sho
w?
N
um
be
r a
nd
na
me
s o
f sc
ho
ols
th
at
rec
eiv
ed
EC
D k
its
3.2
Wh
y is
it im
po
rta
nt?
To
up
da
te t
he
da
tab
ase
of
sch
oo
ls t
ha
t re
ce
ive
d E
CD
Kits
an
d t
o a
vo
id t
he
du
plic
atio
n
of
serv
ice
s.
4
So
urc
e/
Co
llec
tio
n
of
da
ta
De
scrib
e w
he
re t
he
info
rma
tio
n c
om
es
fro
m a
nd
ho
w it
is c
olle
cte
d:
4.1
Wh
ere
do
es
da
ta c
om
e f
rom
?
Dis
tric
t lis
ts
4.2
Da
ta c
olle
cto
r/st
ore
r
(se
ctio
n/m
an
ag
er
na
me
)
Dis
tric
t In
stitu
tio
na
l MG
EC
D m
an
ag
er
4.3
Ho
w is
da
ta c
olle
cte
d?
S
urv
ey –
dis
tric
t d
ata
ba
se
5
Me
tho
d o
f
Ca
lcu
latio
n
De
scrib
e c
lea
rly a
nd
sp
ec
ific
ally
ho
w t
he
ind
ica
tor
is c
alc
ula
ted
Sc
ho
ol c
ou
nt
6
Da
ta L
imita
tio
ns
Ide
ntify
an
y li
mita
tio
n w
ith
th
e
ind
ica
tor
da
ta, in
clu
din
g f
ac
tors
th
at
mig
ht
be
be
yo
nd
th
e d
ep
art
me
nt’
s
co
ntr
ol
Va
nd
alis
m a
nd
bu
rgla
rie
s th
at
oc
cu
r a
t sc
ho
ols
co
uld
be
th
e r
ea
son
fo
r th
e
dis
ap
pe
ara
nc
e o
f EC
D k
its.
Sc
ho
ols
th
at
ha
ve
be
en
aff
ec
ted
by b
urg
larie
s w
ou
ld t
he
n
req
uire
an
ad
ditio
na
l EC
D K
it a
nd
th
e n
um
be
r o
f sc
ho
ols
th
at
wo
uld
still
req
uire
EC
D k
its
wo
uld
be
in
cre
ase
d.
7
Typ
e o
f In
dic
ato
r
Eff
icie
nc
y, e
co
no
my a
nd
eq
uity
8
Ca
lcu
latio
n t
yp
e
No
n-c
um
ula
tive
X
9
Re
po
rtin
g c
yc
le
An
nu
ally
X
10
De
sire
d
pe
rfo
rma
nc
e
Ide
ntify
wh
eth
er
ac
tua
l
pe
rfo
rma
nc
e t
ha
t is
hig
he
r o
r lo
we
r
tha
n t
arg
ete
d p
erf
orm
an
ce
is
de
sira
ble
On
ta
rge
t
11
Ind
ica
tor
resp
on
sib
ility
Ide
ntify
wh
o is
re
spo
nsi
ble
fo
r
ma
na
gin
g a
nd
re
po
rtin
g t
he
ind
ica
tor
Dire
cto
rate
In
stitu
tio
na
l Ma
na
ge
me
nt

An
nu
al R
ep
ort
fo
r 2013/1
4 F
ina
nc
ial Y
ea
r
Vo
te 5
: D
ep
art
me
nt
of
Ed
uc
ati
on
Pro
vin
ce
of
the
We
ste
rn C
ap
e
26
3
PP
I 7
.2
No
Te
ch
nic
al I
nd
ica
tor
De
scrip
tio
n
Re
spo
nse
1
Ind
ica
tor
Title
Ad
dit
ion
al E
CD
kits
to In
de
pe
nd
en
t Sc
ho
ols
2
Sh
ort
De
fin
itio
n
5
0 s
ele
cte
d In
de
pe
nd
en
t s
ch
oo
ls t
ha
t h
ave
Gra
de
R c
lass
es
are
pro
vid
ed
with
EC
D
ind
oo
r a
nd
ou
tdo
or
eq
uip
me
nt
to a
ssis
t w
ith
in
ter-
ac
tive
a
nd
eff
ec
tive
lea
rnin
g a
nd
tea
ch
ing
3
Pu
rpo
se/
Imp
ort
an
ce
Exp
lain
wh
at
the
in
dic
ato
r is
in
ten
de
d t
o s
ho
w a
nd
wh
y it
is im
po
rta
nt
3.1
Wh
at
do
es
ind
ica
tor
sho
w?
N
um
be
r a
nd
na
me
s o
f sc
ho
ols
th
at
rec
eiv
ed
EC
D k
its
3.2
Wh
y is
it im
po
rta
nt?
T
o u
pd
ate
th
e d
ata
ba
se o
f sc
ho
ols
th
at
rec
eiv
ed
EC
D K
its
an
d t
o a
vo
id t
he
du
plic
atio
n
of
serv
ice
s.
4
So
urc
e/C
olle
ctio
n
of
da
ta
De
scrib
e w
he
re t
he
info
rma
tio
n c
om
es
fro
m a
nd
ho
w it
is c
olle
cte
d:
4.1
Wh
ere
do
es
da
ta c
om
e f
rom
?
Dis
tric
t lis
ts
4.2
Da
ta c
olle
cto
r/st
ore
r
(se
ctio
n/m
an
ag
er
na
me
)
Dis
tric
t IM
G E
CD
ma
na
ge
r
4.3
Ho
w is
da
ta c
olle
cte
d?
S
urv
ey –
dis
tric
t d
ata
ba
se
5
Me
tho
d o
f
Ca
lcu
latio
n
De
scrib
e c
lea
rly a
nd
sp
ec
ific
ally
ho
w t
he
ind
ica
tor
is c
alc
ula
ted
Sc
ho
ol c
ou
nt
6
Da
ta L
imita
tio
ns
Ide
ntify
an
y li
mita
tio
n w
ith
th
e
ind
ica
tor
da
ta, in
clu
din
g f
ac
tors
th
at
mig
ht
be
be
yo
nd
th
e d
ep
art
me
nt’
s
co
ntr
ol
Va
nd
alis
m a
nd
bu
rgla
rie
s th
at
oc
cu
r a
t sc
ho
ols
co
uld
be
th
e r
ea
son
fo
r th
e
dis
ap
pe
ara
nc
e o
f EC
D k
its.
Sc
ho
ols
th
at
ha
ve
be
en
aff
ec
ted
by b
urg
larie
s w
ou
ld t
he
n
req
uire
an
ad
ditio
na
l EC
D K
it a
nd
th
e n
um
be
r o
f sc
ho
ols
th
at
wo
uld
still
req
uire
EC
D k
its
wo
uld
be
in
cre
ase
d.
7
Typ
e o
f In
dic
ato
r
Eff
icie
nc
y, e
co
no
my &
eq
uity
8
Ca
lcu
latio
n t
yp
e
No
n-c
um
ula
tive
X
9
Re
po
rtin
g c
yc
le
An
nu
ally
X
10
De
sire
d
pe
rfo
rma
nc
e
Ide
ntify
wh
eth
er
ac
tua
l
pe
rfo
rma
nc
e t
ha
t is
hig
he
r o
r lo
we
r
tha
n t
arg
ete
d p
erf
orm
an
ce
is
de
sira
ble
On
ta
rge
t
11
Ind
ica
tor
resp
on
sib
ility
Ide
ntify
wh
o is
re
spo
nsi
ble
fo
r
ma
na
gin
g a
nd
re
po
rtin
g t
he
ind
ica
tor
DIM
EC
D C
ES S
Fo
rtu
in

An
nu
al R
ep
ort
fo
r 2013/1
4 F
ina
nc
ial Y
ea
r
Vo
te 5
: D
ep
art
me
nt
of
Ed
uc
ati
on
Pro
vin
ce
of
the
We
ste
rn C
ap
e
26
4
PP
I 8
.1
No
Te
ch
nic
al I
nd
ica
tor
De
scrip
tio
n
Re
spo
nse
1
Ind
ica
tor
Title
Nu
mb
er
of
ma
inte
na
nc
e p
roje
cts
co
mp
lete
d.
2
Sh
ort
De
fin
itio
n
Th
e n
um
be
r o
f c
om
ple
ted
sc
he
du
led
ma
inte
na
nc
e p
roje
cts
is c
ou
nte
d a
nd
re
co
rde
d.
3
Pu
rpo
se/
Imp
ort
an
ce
Exp
lain
wh
at
the
in
dic
ato
r is
in
ten
de
d t
o s
ho
w a
nd
wh
y it
is im
po
rta
nt
3.1
Wh
at
do
es
ind
ica
tor
sho
w?
It
sh
ow
s th
e n
um
be
r o
f sc
ho
ols
th
at
rec
eiv
e s
ch
ed
ule
d m
ain
ten
an
ce
fo
r th
e p
erio
d
3.2
Wh
y is
it im
po
rta
nt?
It
ke
ep
s tr
ac
k o
f th
e W
CED
’s e
ffo
rts
to k
ee
p s
ch
oo
ls f
un
ctio
na
l fo
r le
arn
ing
an
d t
ea
ch
ing
pu
rpo
ses.
4
So
urc
e/
Co
llec
tio
n
of
da
ta
De
scrib
e w
he
re t
he
info
rma
tio
n c
om
es
fro
m a
nd
ho
w it
is c
olle
cte
d:
4.1
Wh
ere
do
es
da
ta c
om
e f
rom
?
DTP
W,
an
d im
ple
me
ntin
g a
ge
nts
of
the
WC
ED
pro
vid
e t
he
“P
rac
tic
al C
om
ple
tio
n
Ce
rtific
ate
s” t
ha
t in
dic
ate
th
at
a p
roje
ct
ha
s b
ee
n s
ign
ed
off
.
4.2
Da
ta c
olle
cto
r/st
ore
r
(se
ctio
n/m
an
ag
er
na
me
)
DD
: In
fra
stru
ctu
re M
ain
ten
an
ce
.
4.3
Ho
w is
da
ta c
olle
cte
d?
R
ec
ord
th
e n
um
be
r o
f p
rac
tic
al c
om
ple
tio
n c
ert
ific
ate
s.
5
Me
tho
d o
f
Ca
lcu
latio
n
De
scrib
e c
lea
rly a
nd
sp
ec
ific
ally
ho
w t
he
ind
ica
tor
is c
alc
ula
ted
Co
un
t o
f sc
ho
ols
6
Da
ta L
imita
tio
ns
Ide
ntify
an
y li
mita
tio
n w
ith
th
e
ind
ica
tor
da
ta, in
clu
din
g f
ac
tors
tha
t m
igh
t b
e b
eyo
nd
th
e
de
pa
rtm
en
t’s
co
ntr
ol
Sin
ce
imp
lem
en
tin
g a
ge
nts
are
exte
rna
l ag
en
ts, th
e W
CED
do
es
no
t a
lwa
ys
ha
ve
co
ntr
ol
of
nu
mb
ers
re
co
rde
d.
Als
o, th
e w
ork
re
qu
est
ed
ma
y n
ot
ne
ce
ssa
rily
be
th
e w
ork
th
at
is
de
live
red
.
7
Typ
e o
f In
dic
ato
r
Ou
tpu
t; im
pa
ct
8
Ca
lcu
latio
n t
yp
e
No
n-c
um
ula
tive
X
9
Re
po
rtin
g c
yc
le
Qu
art
erly?
X
10
De
sire
d
pe
rfo
rma
nc
e
Ide
ntify
wh
eth
er
ac
tua
l
pe
rfo
rma
nc
e t
ha
t is
hig
he
r o
r lo
we
r
tha
n t
arg
ete
d p
erf
orm
an
ce
is
de
sira
ble
On
ta
rge
t
11
Ind
ica
tor
resp
on
sib
ility
Ide
ntify
wh
o is
re
spo
nsi
ble
fo
r
ma
na
gin
g a
nd
re
po
rtin
g t
he
ind
ica
tor
DD
: In
fra
stru
ctu
re p
rop
ert
y a
nd
ma
inte
na
nc
e

An
nu
al R
ep
ort
fo
r 2013/1
4 F
ina
nc
ial Y
ea
r
Vo
te 5
: D
ep
art
me
nt
of
Ed
uc
ati
on
Pro
vin
ce
of
the
We
ste
rn C
ap
e
26
5
PP
I 9
.1
No
Te
ch
nic
al I
nd
ica
tor
De
scrip
tio
n
Re
spo
nse
1
Ind
ica
tor
Title
% o
f le
arn
ers
in G
rad
e 3
att
ain
ing
ac
ce
pta
ble
ou
tco
me
s in
La
mg
ua
ge
2
Sh
ort
De
fin
itio
n
Th
is m
ea
sure
s th
e p
rop
ort
ion
of
lea
rne
rs p
art
icip
atin
g in
th
e G
rad
e 3
syst
em
ic t
est
s
(La
ng
ua
ge
),w
ho
are
ab
le t
o p
ass
th
e t
est
s. T
he
pa
ss m
ark
fo
r th
e t
est
s is
se
t a
t 5
0%
3
Pu
rpo
se/
Imp
ort
an
ce
Exp
lain
wh
at
the
in
dic
ato
r is
in
ten
de
d t
o s
ho
w a
nd
wh
y it
is im
po
rta
nt
3.1
Wh
at
do
es
ind
ica
tor
sho
w?
Th
e in
dic
ato
r sh
ow
s th
e g
en
era
l le
ve
l of
pro
fic
ien
cy o
f le
arn
ers
wh
o a
re a
tte
nd
ing
sc
ho
ol
at
the
fo
un
da
tio
n p
ha
se.
3.2
Wh
y is
it im
po
rta
nt?
Th
is in
dic
ato
r is
imp
ort
an
t a
s it m
ea
sure
s th
e e
ffe
ctive
ne
ss o
f th
e e
du
ca
tio
n s
yst
em
at
the
fou
nd
atio
n p
ha
se
4
So
urc
e/C
olle
ctio
n
of
da
ta
De
scrib
e w
he
re t
he
info
rma
tio
n c
om
es
fro
m a
nd
ho
w it
is c
olle
cte
d:
4.1
Wh
ere
do
es
da
ta c
om
e f
rom
?
The
re
po
rt o
f th
e s
yst
em
ic t
est
s is
th
e b
asi
c d
ata
so
urc
e. Th
e r
ep
ort
co
nta
ins
the
to
tal
nu
mb
er
of
lea
rne
rs w
ho
write
th
e t
est
s w
ith
a d
isa
gg
reg
atio
n o
f th
e p
rop
ort
ion
th
at
pa
sse
s a
nd
th
e p
rop
ort
ion
th
at
do
no
t p
ass
th
e t
est
.
4.2
Da
ta c
olle
cto
r/st
ore
r
(se
ctio
n/m
an
ag
er
na
me
)
Dire
cto
rate
: R
ese
arc
h
4.3
Ho
w is
da
ta c
olle
cte
d?
It
is e
xtr
ac
ted
fro
m t
he
fin
al r
ep
ort
th
at
is s
ub
mitte
d b
y t
he
exte
rna
l se
rvic
e p
rovid
ers
ap
po
inte
d t
o a
dm
inis
ter
the
syst
em
ic t
est
s.
5
Me
tho
d o
f
Ca
lcu
latio
n
De
scrib
e c
lea
rly a
nd
sp
ec
ific
ally
ho
w
the
ind
ica
tor
is c
alc
ula
ted
The
nu
mb
er
of
lea
rne
rs w
ho
pa
ss t
he
te
st (
50
% a
nd
ab
ove
) is
exp
ress
ed
as
a p
erc
en
tag
e
of
the
to
tal n
um
be
r o
f le
arn
ers
wh
o w
rote
th
e t
est
.
6
Da
ta L
imita
tio
ns
Ide
ntify
an
y li
mita
tio
n w
ith
th
e
ind
ica
tor
da
ta, in
clu
din
g f
ac
tors
th
at
mig
ht
be
be
yo
nd
th
e d
ep
art
me
nt’
s
co
ntr
ol
Sc
ho
ols
th
at
ha
ve
less
th
an
5 le
arn
ers
in G
rad
e 3
do
no
t ta
ke
pa
rt in
th
e s
yst
em
ic t
est
s.
7
Typ
e o
f In
dic
ato
r
Ou
tco
me
s
8
Ca
lcu
latio
n t
yp
e
No
n-c
um
ula
tive
X
9
Re
po
rtin
g c
yc
le
An
nu
ally
X
10
De
sire
d
pe
rfo
rma
nc
e
Ide
ntify
wh
eth
er
ac
tua
l pe
rfo
rma
nc
e
tha
t is
hig
he
r o
r lo
we
r th
an
ta
rge
ted
pe
rfo
rma
nc
e is
de
sira
ble
The
ac
tua
l pe
rfo
rma
nc
e is
hig
he
r th
an
th
e t
arg
ete
d p
erf
orm
an
ce
11
Ind
ica
tor
resp
on
sib
ility
Ide
ntify
wh
o is
re
spo
nsi
ble
fo
r
ma
na
gin
g a
nd
re
po
rtin
g t
he
ind
ica
tor
Ma
na
ge
me
nt
of
the
ind
ica
tor
is a
fu
nc
tio
n o
f th
e C
urr
icu
lum
Bra
nc
h w
hile
re
po
rtin
g o
n
the
ind
ica
tor
is a
fu
nc
tio
n o
f th
e D
ire
cto
rate
: R
ese
arc
h.

An
nu
al R
ep
ort
fo
r 2013/1
4 F
ina
nc
ial Y
ea
r
Vo
te 5
: D
ep
art
me
nt
of
Ed
uc
ati
on
Pro
vin
ce
of
the
We
ste
rn C
ap
e
26
6
PP
I 9
.2
No
Te
ch
nic
al I
nd
ica
tor
De
scrip
tio
n
Re
spo
nse
1
Ind
ica
tor
Title
%
of
lea
rne
rs in
Gra
de
3 a
tta
inin
g a
cc
ep
tab
le o
utc
om
es
in M
ath
em
atic
s
2
Sh
ort
De
fin
itio
n
Th
is m
ea
sure
s th
e p
rop
ort
ion
of
lea
rne
rs p
art
icip
atin
g in
th
e G
rad
e 3
syst
em
ic t
est
s
(Ma
the
ma
tic
s),w
ho
are
ab
le t
o p
ass
th
e t
est
s. T
he
pa
ss m
ark
fo
r th
e t
est
s is
se
t a
t 50%
3
Pu
rpo
se/
Imp
ort
an
ce
Exp
lain
wh
at
the
in
dic
ato
r is
in
ten
de
d t
o s
ho
w a
nd
wh
y it
is im
po
rta
nt
3.1
Wh
at
do
es
ind
ica
tor
sho
w?
Th
e in
dic
ato
r sh
ow
s th
e g
en
era
l le
ve
l of
pro
fic
ien
cy o
f le
arn
ers
wh
o a
re a
tte
nd
ing
sc
ho
ol
at
the
fo
un
da
tio
n p
ha
se.
3.2
Wh
y is
it im
po
rta
nt?
Th
is in
dic
ato
r is
imp
ort
an
t a
s it m
ea
sure
s th
e e
ffe
ctive
ne
ss o
f th
e e
du
ca
tio
n s
yst
em
at
the
fou
nd
atio
n p
ha
se
4
So
urc
e/
Co
llec
tio
n
of
da
ta
De
scrib
e w
he
re t
he
info
rma
tio
n c
om
es
fro
m a
nd
ho
w it
is c
olle
cte
d:
4.1
Wh
ere
do
es
da
ta c
om
e f
rom
?
The
re
po
rt o
f th
e s
yst
em
ic t
est
s is
th
e b
asi
c d
ata
so
urc
e. Th
e r
ep
ort
co
nta
ins
the
to
tal
nu
mb
er
of
lea
rne
rs w
ho
write
th
e t
est
s w
ith
a d
isa
gg
reg
atio
n o
f th
e p
rop
ort
ion
th
at
pa
sse
s a
nd
th
e p
rop
ort
ion
th
at
do
no
t p
ass
th
e t
est
.
4.2
Da
ta c
olle
cto
r/st
ore
r
(se
ctio
n/m
an
ag
er
na
me
)
Dire
cto
rate
: R
ese
arc
h
4.3
Ho
w is
da
ta c
olle
cte
d?
It
is e
xtr
ac
ted
fro
m t
he
fin
al r
ep
ort
th
at
is s
ub
mitte
d b
y t
he
exte
rna
l se
rvic
e p
rovid
ers
ap
po
inte
d t
o a
dm
inis
ter
the
syst
em
ic t
est
s.
5
Me
tho
d o
f
Ca
lcu
latio
n
De
scrib
e c
lea
rly a
nd
sp
ec
ific
ally
ho
w
the
ind
ica
tor
is c
alc
ula
ted
The
nu
mb
er
of
lea
rne
rs w
ho
pa
ss t
he
te
st (
50
% a
nd
ab
ove
) is
exp
ress
ed
as
a p
erc
en
tag
e
of
the
to
tal n
um
be
r o
f le
arn
ers
wh
o w
rote
th
e t
est
.
6
Da
ta L
imita
tio
ns
Ide
ntify
an
y li
mita
tio
n w
ith
th
e
ind
ica
tor
da
ta, in
clu
din
g f
ac
tors
th
at
mig
ht
be
be
yo
nd
th
e d
ep
art
me
nt’
s
co
ntr
ol
Sc
ho
ols
th
at
ha
ve
less
th
an
5 le
arn
ers
in G
rad
e 3
do
no
t ta
ke
pa
rt in
th
e s
yst
em
ic t
est
s.
7
Typ
e o
f In
dic
ato
r
Ou
tco
me
s
8
Ca
lcu
latio
n t
yp
e
No
n-c
um
ula
tive
X
9
Re
po
rtin
g c
yc
le
An
nu
ally
X
10
De
sire
d
pe
rfo
rma
nc
e
Ide
ntify
wh
eth
er
ac
tua
l pe
rfo
rma
nc
e
tha
t is
hig
he
r o
r lo
we
r th
an
ta
rge
ted
pe
rfo
rma
nc
e is
de
sira
ble
Th
e a
ctu
al p
erf
orm
an
ce
th
at
is h
igh
er
tha
n t
he
ta
rge
ted
pe
rfo
rma
nc
e
11
Ind
ica
tor
resp
on
sib
ility
Ide
ntify
wh
o is
re
spo
nsi
ble
fo
r
ma
na
gin
g a
nd
re
po
rtin
g t
he
ind
ica
tor
Ma
na
ge
me
nt
of
the
ind
ica
tor
is a
fu
nc
tio
n o
f th
e C
urr
icu
lum
Bra
nc
h w
hile
re
po
rtin
g o
n
the
ind
ica
tor
is a
fu
nc
tio
n o
f th
e D
ire
cto
rate
: R
ese
arc
h

An
nu
al R
ep
ort
fo
r 2013/1
4 F
ina
nc
ial Y
ea
r
Vo
te 5
: D
ep
art
me
nt
of
Ed
uc
ati
on
Pro
vin
ce
of
the
We
ste
rn C
ap
e
26
7
PP
I 9
.3
No
Te
ch
nic
al I
nd
ica
tor
De
scrip
tio
n
Re
spo
nse
1
Ind
ica
tor
Title
% o
f le
arn
ers
in G
rad
e 6
att
ain
ing
ac
ce
pta
ble
ou
tco
me
s in
La
ng
ua
ge
2
Sh
ort
De
fin
itio
n
Th
is m
ea
sure
s th
e p
rop
ort
ion
of
lea
rne
rs p
art
icip
atin
g in
th
e G
rad
e 6
syst
em
ic t
est
s
(La
ng
ua
ge
),w
ho
are
ab
le t
o p
ass
th
e t
est
s. T
he
pa
ss m
ark
fo
r th
e t
est
s is
se
t a
t 5
0%
3
Pu
rpo
se/
Imp
ort
an
ce
Exp
lain
wh
at
the
ind
ica
tor
is in
ten
de
d t
o s
ho
w a
nd
wh
y it
is im
po
rta
nt
3.1
Wh
at
do
es
ind
ica
tor
sho
w?
Th
e in
dic
ato
r sh
ow
s th
e g
en
era
l le
ve
l of
pro
fic
ien
cy o
f le
arn
ers
wh
o a
re a
tte
nd
ing
sc
ho
ol
at
the
In
term
ed
iate
ph
ase
.
3.2
Wh
y is
it im
po
rta
nt?
Th
is in
dic
ato
r is
imp
ort
an
t a
s it m
ea
sure
s th
e e
ffe
ctive
ne
ss o
f th
e e
du
ca
tio
n s
yst
em
at
the
fou
nd
atio
n p
ha
se
4
So
urc
e/
Co
llec
tio
n
of
da
ta
De
scrib
e w
he
re t
he
info
rma
tio
n c
om
es
fro
m a
nd
ho
w it
is c
olle
cte
d:
4.1
Wh
ere
do
es
da
ta c
om
e f
rom
?
The
re
po
rt o
f th
e s
yst
em
ic t
est
s is
th
e b
asi
c d
ata
so
urc
e. Th
e r
ep
ort
co
nta
ins
the
to
tal
nu
mb
er
of
lea
rne
rs w
ho
write
th
e t
est
s w
ith
a d
isa
gg
reg
atio
n o
f th
e p
rop
ort
ion
th
at
pa
sse
s a
nd
th
e p
rop
ort
ion
th
at
do
no
t p
ass
th
e t
est
.
4.2
Da
ta c
olle
cto
r/st
ore
r
(se
ctio
n/m
an
ag
er
na
me
)
Dire
cto
rate
: R
ese
arc
h
4.3
Ho
w is
da
ta c
olle
cte
d?
It
is e
xtr
ac
ted
fro
m t
he
fin
al r
ep
ort
th
at
is s
ub
mitte
d b
y t
he
exte
rna
l se
rvic
e p
rovid
ers
ap
po
inte
d t
o a
dm
inis
ter
the
syst
em
ic t
est
s.
5
Me
tho
d o
f
Ca
lcu
latio
n
De
scrib
e c
lea
rly a
nd
sp
ec
ific
ally
ho
w
the
ind
ica
tor
is c
alc
ula
ted
The
nu
mb
er
of
lea
rne
rs w
ho
pa
ss t
he
te
st (
50
% a
nd
ab
ove
) is
exp
ress
ed
as
a p
erc
en
tag
e
of
the
to
tal n
um
be
r o
f le
arn
ers
wh
o w
rote
th
e t
est
.
6
Da
ta L
imita
tio
ns
Ide
ntify
an
y li
mita
tio
n w
ith
th
e
ind
ica
tor
da
ta, in
clu
din
g f
ac
tors
th
at
mig
ht
be
be
yo
nd
th
e d
ep
art
me
nt’
s
co
ntr
ol
Sc
ho
ols
th
at
ha
ve
less
th
an
5 le
arn
ers
in G
rad
e 6
do
no
t ta
ke
pa
rt in
th
e s
yst
em
ic t
est
s.
7
Typ
e o
f In
dic
ato
r
Ou
tco
me
s
8
Ca
lcu
latio
n t
yp
e
No
n-c
um
ula
tive
X
9
Re
po
rtin
g c
yc
le
An
nu
ally
X
11
De
sire
d
pe
rfo
rma
nc
e
Ide
ntify
wh
eth
er
ac
tua
l pe
rfo
rma
nc
e
tha
t is
hig
he
r o
r lo
we
r th
an
ta
rge
ted
pe
rfo
rma
nc
e is
de
sira
ble
Ac
tua
l pe
rfo
rma
nc
e t
ha
t is
hig
he
r th
an
th
e t
arg
ete
d p
erf
orm
an
ce
12
Ind
ica
tor
resp
on
sib
ility
Ide
ntify
wh
o is
re
spo
nsi
ble
fo
r
ma
na
gin
g a
nd
re
po
rtin
g t
he
ind
ica
tor
Ma
na
ge
me
nt
of
the
ind
ica
tor
is a
fu
nc
tio
n o
f th
e C
urr
icu
lum
Bra
nc
h w
hile
re
po
rtin
g o
n
the
ind
ica
tor
is a
fu
nc
tio
n o
f th
e D
ire
cto
rate
: R
ese
arc
h.

An
nu
al R
ep
ort
fo
r 2013/1
4 F
ina
nc
ial Y
ea
r
Vo
te 5
: D
ep
art
me
nt
of
Ed
uc
ati
on
Pro
vin
ce
of
the
We
ste
rn C
ap
e
26
8
PP
I 9
.4
No
Te
ch
nic
al I
nd
ica
tor
De
scrip
tio
n
Re
spo
nse
1
Ind
ica
tor
Title
% o
f le
arn
ers
in G
rad
e 6
att
ain
ing
ac
ce
pta
ble
ou
tco
me
s in
Ma
the
ma
tic
s
2
Sh
ort
De
fin
itio
n
Th
is m
ea
sure
s th
e p
rop
ort
ion
of
lea
rne
rs p
art
icip
atin
g in
th
e G
rad
e 3
syst
em
ic t
est
s
(Ma
the
ma
tic
s),w
ho
are
ab
le t
o p
ass
th
e t
est
s. T
he
pa
ss m
ark
fo
r th
e t
est
s is
se
t a
t 50%
3
Pu
rpo
se/
Imp
ort
an
ce
Exp
lain
wh
at
the
ind
ica
tor
is in
ten
de
d t
o s
ho
w a
nd
wh
y it
is im
po
rta
nt
3.1
Wh
at
do
es
ind
ica
tor
sho
w?
The
ind
ica
tor
sho
ws
the
ge
ne
ral l
eve
l of
pro
fic
ien
cy o
f le
arn
ers
wh
o a
re a
tte
nd
ing
sch
oo
l at
the
In
term
ed
iate
ph
ase
.
3.2
Wh
y is
it im
po
rta
nt?
T
his
ind
ica
tor
is im
po
rta
nt
as
it m
ea
sure
s th
e e
ffe
ctive
ne
ss o
f th
e e
du
ca
tio
n s
yst
em
at
the
fou
nd
atio
n p
ha
se
4
So
urc
e/C
olle
ctio
n
of
da
ta
De
scrib
e w
he
re t
he
info
rma
tio
n c
om
es
fro
m a
nd
ho
w it
is c
olle
cte
d:
4.1
Wh
ere
do
es
da
ta c
om
e f
rom
?
The
re
po
rt o
f th
e s
yst
em
ic t
est
s is
th
e b
asi
c d
ata
so
urc
e. Th
e r
ep
ort
co
nta
ins
the
to
tal
nu
mb
er
of
lea
rne
rs w
ho
write
th
e t
est
s w
ith
a d
isa
gg
reg
atio
n o
f th
e p
rop
ort
ion
th
at
pa
sse
s a
nd
th
e p
rop
ort
ion
th
at
do
no
t p
ass
th
e t
est
.
4.2
Da
ta c
olle
cto
r/st
ore
r
(se
ctio
n/m
an
ag
er
na
me
)
Dire
cto
rate
: R
ese
arc
h
4.3
Ho
w is
da
ta c
olle
cte
d?
It
is e
xtr
ac
ted
fro
m t
he
fin
al r
ep
ort
th
at
is s
ub
mitte
d b
y t
he
exte
rna
l se
rvic
e p
rovid
ers
ap
po
inte
d t
o a
dm
inis
ter
the
syst
em
ic t
est
s.
5
Me
tho
d o
f
Ca
lcu
latio
n
De
scrib
e c
lea
rly a
nd
sp
ec
ific
ally
ho
w
the
ind
ica
tor
is c
alc
ula
ted
The
nu
mb
er
of
lea
rne
rs w
ho
pa
ss t
he
te
st (
50
% a
nd
ab
ove
) is
exp
ress
ed
as
a p
erc
en
tag
e
of
the
to
tal n
um
be
r o
f le
arn
ers
wh
o w
rote
th
e t
est
.
6
Da
ta L
imita
tio
ns
Ide
ntify
an
y li
mita
tio
n w
ith
th
e
ind
ica
tor
da
ta, in
clu
din
g f
ac
tors
th
at
mig
ht
be
be
yo
nd
th
e d
ep
art
me
nt’
s
co
ntr
ol
Sc
ho
ols
th
at
ha
ve
less
th
an
5 le
arn
ers
in G
rad
e 6
do
no
t ta
ke
pa
rt in
th
e s
yst
em
ic t
est
s.
7
Typ
e o
f In
dic
ato
r Id
en
tify
wh
eth
er
the
ind
ica
tor
is m
ea
surin
g (
i) in
pu
ts,
(ii)
ac
tivitie
s, (
iii)
ou
tpu
ts,
(iv
) o
utc
om
es,
(v
) im
pa
ct,
or
som
e o
the
r d
ime
nsi
on
of
pe
rfo
rma
nc
e s
uc
h a
s (v
i) e
ffic
ien
cy,
(vii)
ec
on
om
y o
r (v
iii)
eq
uity
8
Ca
lcu
latio
n t
yp
e
No
n-c
um
ula
tive
X
9
Re
po
rtin
g c
yc
le
An
nu
ally
X
10
De
sire
d
pe
rfo
rma
nc
e
Ide
ntify
wh
eth
er
ac
tua
l pe
rfo
rma
nc
e
tha
t is
hig
he
r o
r lo
we
r th
an
ta
rge
ted
pe
rfo
rma
nc
e is
de
sira
ble
Th
e a
ctu
al p
erf
orm
an
ce
is
hig
he
r th
an
th
e t
arg
ete
d p
erf
orm
an
ce
11
Ind
ica
tor
resp
on
sib
ility
Ide
ntify
wh
o is
re
spo
nsi
ble
fo
r
ma
na
gin
g a
nd
re
po
rtin
g t
he
ind
ica
tor
Ma
na
ge
me
nt
of
the
ind
ica
tor
is a
fu
nc
tio
n o
f th
e C
urr
icu
lum
Bra
nc
h w
hile
re
po
rtin
g o
n
the
ind
ica
tor
is a
fu
nc
tio
n o
f th
e D
ire
cto
rate
: R
ese
arc
h

An
nu
al R
ep
ort
fo
r 2013/1
4 F
ina
nc
ial Y
ea
r
Vo
te 5
: D
ep
art
me
nt
of
Ed
uc
ati
on
Pro
vin
ce
of
the
We
ste
rn C
ap
e
26
9
PP
I 9
.5
No
Te
ch
nic
al I
nd
ica
tor
De
scrip
tio
n
Re
spo
nse
1
Ind
ica
tor
Title
% o
f le
arn
ers
in G
rad
e 9
att
ain
ing
ac
ce
pta
ble
ou
tco
me
s in
La
ng
ua
ge
s
2
Sh
ort
De
fin
itio
n
Th
is m
ea
sure
s th
e p
rop
ort
ion
of
lea
rne
rs p
art
icip
atin
g in
th
e G
rad
e 9
syst
em
ic t
est
s
(La
ng
ua
ge
), w
ho
are
ab
le t
o p
ass
th
e t
est
s. T
he
pa
ss m
ark
fo
r th
e t
est
s is
se
t a
t 5
0%
3
Pu
rpo
se/
Imp
ort
an
ce
Exp
lain
wh
at
the
in
dic
ato
r is
in
ten
de
d t
o s
ho
w a
nd
wh
y it
is im
po
rta
nt
3.1
Wh
at
do
es
ind
ica
tor
sho
w?
Th
e in
dic
ato
r sh
ow
s th
e g
en
era
l le
ve
l of
pro
fic
ien
cy o
f le
arn
ers
wh
o a
re a
tte
nd
ing
sc
ho
ol
at
the
Se
nio
r P
ha
se o
f G
ET.
3.2
Wh
y is
it im
po
rta
nt?
Th
is in
dic
ato
r is
imp
ort
an
t a
s it m
ea
sure
s th
e e
ffe
ctive
ne
ss o
f th
e e
du
ca
tio
n s
yst
em
at
the
Se
nio
r P
ha
se o
f G
ET.
4
So
urc
e/C
olle
ctio
n
of
da
ta
De
scrib
e w
he
re t
he
info
rma
tio
n c
om
es
fro
m a
nd
ho
w it
is c
olle
cte
d:
4.1
Wh
ere
do
es
da
ta c
om
e f
rom
?
The
re
po
rt o
f th
e s
yst
em
ic t
est
s is
th
e b
asi
c d
ata
so
urc
e. Th
e r
ep
ort
co
nta
ins
the
to
tal
nu
mb
er
of
lea
rne
rs w
ho
write
th
e t
est
s w
ith
a d
isa
gg
reg
atio
n o
f th
e p
rop
ort
ion
th
at
pa
sse
s a
nd
th
e p
rop
ort
ion
th
at
do
no
t p
ass
th
e t
est
.
4.2
Da
ta c
olle
cto
r/st
ore
r
(se
ctio
n/m
an
ag
er
na
me
)
Dire
cto
rate
: R
ese
arc
h
4.3
Ho
w is
da
ta c
olle
cte
d?
It
is e
xtr
ac
ted
fro
m t
he
fin
al r
ep
ort
th
at
is s
ub
mitte
d b
y t
he
exte
rna
l se
rvic
e p
rovid
ers
ap
po
inte
d t
o a
dm
inis
ter
the
syst
em
ic t
est
s.
5
Me
tho
d o
f
Ca
lcu
latio
n
De
scrib
e c
lea
rly a
nd
sp
ec
ific
ally
ho
w
the
ind
ica
tor
is c
alc
ula
ted
The
nu
mb
er
of
lea
rne
rs w
ho
pa
ss t
he
te
st (
50
% a
nd
ab
ove
) is
exp
ress
ed
as
a p
erc
en
tag
e
of
the
to
tal n
um
be
r o
f le
arn
ers
wh
o w
rote
th
e t
est
.
6
Da
ta L
imita
tio
ns
Ide
ntify
an
y li
mita
tio
n w
ith
th
e
ind
ica
tor
da
ta, in
clu
din
g f
ac
tors
th
at
mig
ht
be
be
yo
nd
th
e d
ep
art
me
nt’
s
co
ntr
ol
Sc
ho
ols
th
at
ha
ve
less
th
an
5 le
arn
ers
in G
rad
e 9
do
no
t ta
ke
pa
rt in
th
e s
yst
em
ic t
est
s.
7
Typ
e o
f In
dic
ato
r
Ou
tco
me
s
8
Ca
lcu
latio
n t
yp
e
Cu
mu
lative
X
9
Re
po
rtin
g c
yc
le
An
nu
ally
X
10
De
sire
d
pe
rfo
rma
nc
e
Ide
ntify
wh
eth
er
ac
tua
l pe
rfo
rma
nc
e
tha
t is
hig
he
r o
r lo
we
r th
an
ta
rge
ted
pe
rfo
rma
nc
e is
de
sira
ble
Th
e a
ctu
al p
erf
orm
an
ce
is
low
er
tha
n t
he
ta
rge
ted
pe
rfo
rma
nc
e
11
Ind
ica
tor
resp
on
sib
ility
Ide
ntify
wh
o is
re
spo
nsi
ble
fo
r
ma
na
gin
g a
nd
re
po
rtin
g t
he
ind
ica
tor
Ma
na
ge
me
nt
of
the
ind
ica
tor
is a
fu
nc
tio
n o
f th
e C
urr
icu
lum
Bra
nc
h w
hile
re
po
rtin
g o
n
the
ind
ica
tor
is a
fu
nc
tio
n o
f th
e D
ire
cto
rate
: R
ese
arc
h

An
nu
al R
ep
ort
fo
r 2013/1
4 F
ina
nc
ial Y
ea
r
Vo
te 5
: D
ep
art
me
nt
of
Ed
uc
ati
on
Pro
vin
ce
of
the
We
ste
rn C
ap
e
27
0
PP
I 9
.6
No
Te
ch
nic
al I
nd
ica
tor
De
scrip
tio
n
Re
spo
nse
1
Ind
ica
tor
Title
% o
f le
arn
ers
in G
rad
e 9
att
ain
ing
ac
ce
pta
ble
ou
tco
me
s in
Ma
the
ma
tic
s
2
Sh
ort
De
fin
itio
n
Th
is m
ea
sure
s th
e p
rop
ort
ion
of
lea
rne
rs p
art
icip
atin
g in
th
e G
rad
e 9
syst
em
ic t
est
s
(Ma
the
ma
tic
s),
wh
o a
re a
ble
to
pa
ss t
he
te
sts.
Th
e p
ass
ma
rk f
or
the
te
sts
is s
et
at
50%
3
Pu
rpo
se/
Imp
ort
an
ce
Exp
lain
wh
at
the
in
dic
ato
r is
in
ten
de
d t
o s
ho
w a
nd
wh
y it
is im
po
rta
nt
3.1
Wh
at
do
es
ind
ica
tor
sho
w?
Th
e in
dic
ato
r sh
ow
s th
e g
en
era
l le
ve
l of
pro
fic
ien
cy o
f le
arn
ers
wh
o a
re a
tte
nd
ing
sc
ho
ol
at
the
In
term
ed
iate
ph
ase
.
3.2
Wh
y is
it im
po
rta
nt?
Th
is in
dic
ato
r is
imp
ort
an
t a
s it m
ea
sure
s th
e e
ffe
ctive
ne
ss o
f th
e e
du
ca
tio
n s
yst
em
at
the
fou
nd
atio
n p
ha
se
4
So
urc
e/
Co
llec
tio
n
of
da
ta
De
scrib
e w
he
re t
he
info
rma
tio
n c
om
es
fro
m a
nd
ho
w it
is c
olle
cte
d:
4.1
Wh
ere
do
es
da
ta c
om
e f
rom
?
The
re
po
rt o
f th
e s
yst
em
ic t
est
s is
th
e b
asi
c d
ata
so
urc
e. Th
e r
ep
ort
co
nta
ins
the
to
tal
nu
mb
er
of
lea
rne
rs w
ho
write
th
e t
est
s w
ith
a d
isa
gg
reg
atio
n o
f th
e p
rop
ort
ion
th
at
pa
sse
s a
nd
th
e p
rop
ort
ion
th
at
do
no
t p
ass
th
e t
est
.
4.2
Da
ta c
olle
cto
r/st
ore
r
(se
ctio
n/m
an
ag
er
na
me
)
Dire
cto
rate
: R
ese
arc
h
4.3
Ho
w is
da
ta c
olle
cte
d?
It
is e
xtr
ac
ted
fro
m t
he
fin
al r
ep
ort
th
at
is s
ub
mitte
d b
y t
he
exte
rna
l se
rvic
e p
rovid
ers
ap
po
inte
d t
o a
dm
inis
ter
the
syst
em
ic t
est
s.
5
Me
tho
d o
f
Ca
lcu
latio
n
De
scrib
e c
lea
rly a
nd
sp
ec
ific
ally
ho
w
the
ind
ica
tor
is c
alc
ula
ted
The
nu
mb
er
of
lea
rne
rs w
ho
pa
ss t
he
te
st (
50
% a
nd
ab
ove
) is
exp
ress
ed
as
a p
erc
en
tag
e
of
the
to
tal n
um
be
r o
f le
arn
ers
wh
o w
rote
th
e t
est
.
6
Da
ta L
imita
tio
ns
Ide
ntify
an
y li
mita
tio
n w
ith
th
e
ind
ica
tor
da
ta, in
clu
din
g f
ac
tors
th
at
mig
ht
be
be
yo
nd
th
e d
ep
art
me
nt’
s
co
ntr
ol
Sc
ho
ols
th
at
ha
ve
less
th
an
5 le
arn
ers
in G
rad
e 9
do
no
t ta
ke
pa
rt in
th
e s
yst
em
ic t
est
s.
7
Typ
e o
f In
dic
ato
r
Ou
tco
me
s
8
Ca
lcu
latio
n t
yp
e
Cu
mu
lative
X
9
Re
po
rtin
g c
yc
le
An
nu
ally
X
10
De
sire
d
pe
rfo
rma
nc
e
Ide
ntify
wh
eth
er
ac
tua
l pe
rfo
rma
nc
e
tha
t is
hig
he
r o
r lo
we
r th
an
ta
rge
ted
pe
rfo
rma
nc
e is
de
sira
ble
The
ac
tua
l pe
rfo
rma
nc
e is
hig
he
r th
an
th
e t
arg
ete
d p
erf
orm
an
ce
11
Ind
ica
tor
resp
on
sib
ility
Ide
ntify
wh
o is
re
spo
nsi
ble
fo
r
ma
na
gin
g a
nd
re
po
rtin
g t
he
ind
ica
tor
Ma
na
ge
me
nt
of
the
ind
ica
tor
is a
fu
nc
tio
n o
f th
e C
urr
icu
lum
Bra
nc
h w
hile
re
po
rtin
g o
n
the
ind
ica
tor
is a
fu
nc
tio
n o
f th
e D
ire
cto
rate
: R
ese
arc
h.

An
nu
al R
ep
ort
fo
r 2013/1
4 F
ina
nc
ial Y
ea
r
Vo
te 5
: D
ep
art
me
nt
of
Ed
uc
ati
on
Pro
vin
ce
of
the
We
ste
rn C
ap
e
27
1
PP
I 9
.7
No
Te
ch
nic
al I
nd
ica
tor
De
scrip
tio
n
Re
spo
nse
1
Ind
ica
tor
Title
Sc
ho
ols
with
a p
ass
ra
te w
he
re <
60
% p
ass
th
e N
atio
na
l Se
nio
r C
ert
ific
ate
2
Sh
ort
De
fin
itio
n
In
dic
atio
n o
f th
e n
um
be
r o
f u
nd
er
pe
rfo
rmin
g s
ch
oo
ls
3
Pu
rpo
se/
Imp
ort
an
ce
Exp
lain
wh
at
the
in
dic
ato
r is
in
ten
de
d t
o s
ho
w a
nd
wh
y it
is im
po
rta
nt
3.1
Wh
at
do
es
ind
ica
tor
sho
w?
O
utp
ut
of
un
de
r p
erf
orm
ing
sc
ho
ols
3.2
Wh
y is
it im
po
rta
nt?
To
de
term
ine
if in
terv
en
tio
ns
are
ass
istin
g in
re
du
cin
g t
he
lo
we
r p
ass
ra
tes,
esp
ec
ially
in
dis
ad
va
nta
ge
d a
rea
s.
4
So
urc
e/
Co
llec
tio
n
of
da
ta
De
scrib
e w
he
re t
he
info
rma
tio
n c
om
es
fro
m a
nd
ho
w it
is c
olle
cte
d:
4.1
Wh
ere
do
es
da
ta c
om
e f
rom
?
IEC
S
4.2
Da
ta c
olle
cto
r/st
ore
r
(se
ctio
n/m
an
ag
er
na
me
)
DA
M
4.3
Ho
w is
da
ta c
olle
cte
d?
P
ass
ra
tes
for
sch
oo
ls
5
Me
tho
d o
f
Ca
lcu
latio
n
De
scrib
e c
lea
rly a
nd
sp
ec
ific
ally
ho
w
the
ind
ica
tor
is c
alc
ula
ted
Z /
W X
10
0 d
ete
rmin
es
the
pa
ss r
ate
fo
r a
sc
ho
ol.
Wh
ere
Z is
the
nu
mb
er
of
ca
nd
ida
tes
tha
t p
ass
ed
ac
co
rdin
g t
o t
he
crite
ria
fro
m t
he
NSC
po
licy.
Wh
ere
W is
the
nu
mb
er
of
ca
nd
ida
tes
in a
sc
ho
ol t
ha
t w
rote
7 s
ub
jec
ts t
ow
ard
th
e N
SC
.
Pa
ss r
ate
s o
f a
ll sc
ho
ols
are
filt
ere
d t
o d
ete
rmin
e t
he
sc
ho
ols
th
at
ha
ve
ac
hie
ve
d a
pa
ss
rate
of
be
low
60
%.
6
Da
ta L
imita
tio
ns
Ide
ntify
an
y li
mita
tio
n w
ith
th
e
ind
ica
tor
da
ta, in
clu
din
g f
ac
tors
th
at
mig
ht
be
be
yo
nd
th
e d
ep
art
me
nt’
s
co
ntr
ol
No
ne
7
Typ
e o
f In
dic
ato
r
Ou
tpu
t
8
Ca
lcu
latio
n t
yp
e
No
n-c
um
ula
tive
X
9
Re
po
rtin
g c
yc
le
An
nu
ally
X
10
De
sire
d
pe
rfo
rma
nc
e
Ide
ntify
wh
eth
er
ac
tua
l pe
rfo
rma
nc
e
tha
t is
hig
he
r o
r lo
we
r th
an
ta
rge
ted
pe
rfo
rma
nc
e is
de
sira
ble
Lo
we
r d
esi
rab
le
11
Ind
ica
tor
resp
on
sib
ility
Ide
ntify
wh
o is
re
spo
nsi
ble
fo
r
ma
na
gin
g a
nd
re
po
rtin
g t
he
ind
ica
tor
Dire
cto
rate
Ass
ess
me
nt
Ma
na
ge
me
nt

An
nu
al R
ep
ort
fo
r 2013/1
4 F
ina
nc
ial Y
ea
r
Vo
te 5
: D
ep
art
me
nt
of
Ed
uc
ati
on
Pro
vin
ce
of
the
We
ste
rn C
ap
e
27
2
PP
I 9
.8
No
Te
ch
nic
al I
nd
ica
tor
De
scrip
tio
n
Re
spo
nse
1
Ind
ica
tor
Title
Na
tio
na
l Se
nio
r C
ert
ific
ate
pa
ss r
ate
2
Sh
ort
De
fin
itio
n
Th
e p
erc
en
tag
e o
f le
arn
ers
th
at
pa
ss t
he
Na
tio
na
l Se
nio
r C
ert
ific
ate
exa
min
atio
ns
by
ob
tain
ing
a p
ass
in
Ho
me
La
ng
ua
ge
at
40
% o
r m
ore
an
d o
bta
in a
pa
ss in
tw
o o
the
r
sub
jec
ts w
ith
40
% o
r m
ore
an
d p
ass
th
ree
oth
er
sub
jec
ts a
t 3
0%
or
mo
re.
3
Pu
rpo
se/
Imp
ort
an
ce
Exp
lain
wh
at
the
in
dic
ato
r is
in
ten
de
d t
o s
ho
w a
nd
wh
y it
is im
po
rta
nt
3.1
Wh
at
do
es
ind
ica
tor
sho
w?
In
dic
ato
r sh
ow
s %
of
lea
rne
rs t
ha
t h
ave
ob
tain
ed
th
e N
atio
na
l Se
nio
r C
ert
ific
ate
qu
alif
ica
tio
n.
3.2
Wh
y is
it im
po
rta
nt?
Im
po
rta
nt
to d
ete
rmin
e t
he
ac
hie
ve
me
nt
of
the
ed
uc
atio
n s
yst
em
an
d t
he
exte
nt
to
wh
ich
th
e e
du
ca
tio
na
l ou
tpu
t h
as
be
en
ac
hie
ve
d.
4
So
urc
e/C
olle
ctio
n
of
da
ta
De
scrib
e w
he
re t
he
info
rma
tio
n c
om
es
fro
m a
nd
ho
w it
is c
olle
cte
d:
4.1
Wh
ere
do
es
da
ta c
om
e f
rom
?
Th
e d
ata
co
me
s fr
om
th
e In
teg
rate
d E
xa
min
atio
ns
Co
mp
ute
r Syst
em
, w
hic
h is
a n
atio
na
l
syst
em
.
4.2
Da
ta c
olle
cto
r/st
ore
r
(se
ctio
n/m
an
ag
er
na
me
)
Mr
A C
lau
sen
4.3
Ho
w is
da
ta c
olle
cte
d?
P
roc
ess
ed
by t
he
DB
E.
5
Me
tho
d o
f
Ca
lcu
latio
n
De
scrib
e c
lea
rly a
nd
sp
ec
ific
ally
ho
w
the
ind
ica
tor
is c
alc
ula
ted
Nu
mb
er
of
lea
rne
rs t
ha
t p
ass
ed
th
e N
atio
na
l Se
nio
r C
ert
ific
ate
exa
min
atio
ns
by
ob
tain
ing
a p
ass
in
Ho
me
La
ng
ua
ge
at
40
% o
r m
ore
an
d o
bta
in a
pa
ss in
tw
o o
the
r
sub
jec
ts w
ith
40
% o
r m
ore
an
d p
ass
th
ree
oth
er
sub
jec
ts a
t 3
0%
or
mo
re d
ivid
ed
by t
he
nu
mb
er
of
lea
rne
rs t
ha
t w
rote
th
e e
xa
min
atio
ns.
6
Da
ta L
imita
tio
ns
Ide
ntify
an
y li
mita
tio
n w
ith
th
e
ind
ica
tor
da
ta, in
clu
din
g f
ac
tors
th
at
mig
ht
be
be
yo
nd
th
e d
ep
art
me
nt’
s
co
ntr
ol
The
da
ta is
extr
ac
ted
fro
m t
he
IEC
S; a
ny p
rob
lem
s w
ith
th
e IEC
S w
ill b
e b
eyo
nd
th
e
WC
ED
’s c
on
tro
l as
th
e IEC
S is
a N
atio
na
l syst
em
7
Typ
e o
f In
dic
ato
r
Ou
tpu
ts
8
Ca
lcu
latio
n t
yp
e
No
n-c
um
ula
tive
X
9
Re
po
rtin
g c
yc
le
An
nu
ally
X
10
De
sire
d
pe
rfo
rma
nc
e
Ide
ntify
wh
eth
er
ac
tua
l pe
rfo
rma
nc
e
tha
t is
hig
he
r o
r lo
we
r th
an
ta
rge
ted
pe
rfo
rma
nc
e is
de
sira
ble
Hig
he
r p
erf
orm
an
ce
is
de
sira
ble
11
Ind
ica
tor
resp
on
sib
ility
Ide
ntify
wh
o is
re
spo
nsi
ble
fo
r
ma
na
gin
g a
nd
re
po
rtin
g t
he
ind
ica
tor
DB
E (
Mr
A C
lau
sen
)

An
nu
al R
ep
ort
fo
r 2013/1
4 F
ina
nc
ial Y
ea
r
Vo
te 5
: D
ep
art
me
nt
of
Ed
uc
ati
on
Pro
vin
ce
of
the
We
ste
rn C
ap
e
27
3
PP
I 9
.9
No
Te
ch
nic
al I
nd
ica
tor
De
scrip
tio
n
Re
spo
nse
1
Ind
ica
tor
Title
% o
f le
arn
ers
wh
o q
ua
lify f
or
Ba
ch
elo
r’s
de
gre
e s
tud
y
2
Sh
ort
De
fin
itio
n
A
pe
rce
nta
ge
of
lea
rne
rs t
ha
t p
ass
th
e N
SC
with
an
ac
hie
ve
me
nt
of
50
-59
% o
r m
ore
in
fou
r su
bje
cts
ch
ose
n f
rom
th
e li
st o
f d
esi
gn
ate
d s
ub
jec
ts a
nd
a m
inim
um
of
30
% in
th
e
Lan
gu
ag
e o
f Te
ac
hin
g a
nd
Le
arn
ing
of
the
inst
itu
tio
n.
3
Pu
rpo
se/
Imp
ort
an
ce
Exp
lain
wh
at
the
in
dic
ato
r is
in
ten
de
d t
o s
ho
w a
nd
wh
y it
is im
po
rta
nt
3.1
Wh
at
do
es
ind
ica
tor
sho
w?
P
erc
en
tag
e o
f le
arn
ers
th
at
ca
n g
ain
ac
ce
ss t
o a
B.D
eg
ree
3.2
Wh
y is
it im
po
rta
nt?
Im
po
rta
nt
in d
ete
rmin
ing
th
e q
ua
lity o
f p
ass
es
an
d e
nsu
rin
g p
rog
ress
ion
fro
m F
ET
to H
E
4
So
urc
e/C
olle
ctio
n
of
da
ta
De
scrib
e w
he
re t
he
info
rma
tio
n c
om
es
fro
m a
nd
ho
w it
is c
olle
cte
d:
4.1
Wh
ere
do
es
da
ta c
om
e f
rom
?
Th
e d
ata
co
me
s fr
om
th
e In
teg
rate
d E
xa
min
atio
ns
Co
mp
ute
r Syst
em
, w
hic
h is
a n
atio
na
l
syst
em
.
4.2
Da
ta c
olle
cto
r/st
ore
r
(se
ctio
n/m
an
ag
er
na
me
)
Mr
A C
lau
sen
4.3
Ho
w is
da
ta c
olle
cte
d?
P
roc
ess
ed
by t
he
Do
E.
5
Me
tho
d o
f
Ca
lcu
latio
n
De
scrib
e c
lea
rly a
nd
sp
ec
ific
ally
ho
w
the
ind
ica
tor
is c
alc
ula
ted
Nu
mb
er
of
lea
rne
rs t
ha
t p
ass
ed
th
e N
atio
na
l Se
nio
r C
ert
ific
ate
exa
min
atio
ns
by
ob
tain
ing
an
ac
hie
ve
me
nt
of
50
-59
% o
r m
ore
in f
ou
r su
bje
cts
ch
ose
n f
rom
th
e
de
sig
na
ted
su
bje
cts
ch
ose
n f
rom
th
e li
st o
f d
esi
gn
ate
d s
ub
jec
ts a
nd
a m
inim
um
of
30
% in
the
La
ng
ua
ge
of
Tea
ch
ing
an
d L
ea
rnin
g o
f th
e in
stitu
tio
n d
ivid
ed
by t
he
nu
mb
er
of
lea
rne
rs t
ha
t w
rote
th
e e
xa
min
atio
ns.
6
Da
ta L
imita
tio
ns
Ide
ntify
an
y li
mita
tio
n w
ith
th
e
ind
ica
tor
da
ta, in
clu
din
g f
ac
tors
th
at
mig
ht
be
be
yo
nd
th
e d
ep
art
me
nt’
s
co
ntr
ol
The
da
ta is
extr
ac
ted
fro
m t
he
IEC
S, a
ny p
rob
lem
s w
ith
th
e IEC
S w
ill b
e b
eyo
nd
th
e
WC
ED
’s c
on
tro
l as
th
e IEC
S is
a N
atio
na
l syst
em
7
Typ
e o
f In
dic
ato
r
Ou
tco
me
s
8
Ca
lcu
latio
n t
yp
e
No
n-c
um
ula
tive
X
9
Re
po
rtin
g c
yc
le
An
nu
ally
X
10
De
sire
d
pe
rfo
rma
nc
e
Ide
ntify
wh
eth
er
ac
tua
l pe
rfo
rma
nc
e
tha
t is
hig
he
r o
r lo
we
r th
an
ta
rge
ted
pe
rfo
rma
nc
e is
de
sira
ble
Hig
he
r p
erf
orm
an
ce
de
sira
ble
11
Ind
ica
tor
resp
on
sib
ility
Ide
ntify
wh
o is
re
spo
nsi
ble
fo
r
ma
na
gin
g a
nd
re
po
rtin
g t
he
ind
ica
tor
Mr
A C
lau
sen
