report version 1 - chalmers publication library...
TRANSCRIPT

REPORT
Version 1.0
Development and validation
of a Renault Mégane finite element model
for full-scale pedestrian impact simulations
Authors:
Ruth Paas, Johan Davidsson
Gothenburg, Sweden, in March 2015

CONTENTS
1 Summary ............................................................................................................................................... 3
2 Vehicle Geometry ................................................................................................................................. 3
2.1 Vehicle information ...................................................................................................................... 3
2.2 Vehicle scans ................................................................................................................................. 4
2.3 Additional geometry data ............................................................................................................. 4
2.4 From geometry to mesh ............................................................................................................... 4
3 Final Model ........................................................................................................................................... 5
3.1 Parts, numbering and materials .................................................................................................... 5
3.2 Part connections and contacts ...................................................................................................... 7
3.3 Comparison with geometry scans ................................................................................................. 8
4 Experiments ........................................................................................................................................ 10
4.1 Torso impactor to bonnet ........................................................................................................... 10
4.2 Leg impactor to soft nose and bumper ....................................................................................... 11
5 Validation Process ............................................................................................................................... 12
5.1 Torso impactor validation ........................................................................................................... 13
5.2 Leg impactor validation............................................................................................................... 14
6 Applications and Limitations ............................................................................................................... 17
7 References .......................................................................................................................................... 17

3
1 SUMMARY
In this report, the development and validation of a Finite Element (FE) vehicle model is presented which
is intended for simulation of past full-scale pedestrian experiments with Post Mortem Human Subjects
(PMHS). The model is primarily intended for evaluation of the pedestrian Human Body Model (HBM)
“Total HUman Model for Safety” (THUMS) version 4.0 [1] but can also be used for evaluation of other FE-
HBM models.
2 VEHICLE GEOMETRY
2.1 Vehicle information
The vehicle model was a 2004 Renault Mégane II Hatchback, classified as a recent model small sedan.
The 1.9 dCi version of this car has been used in previous pedestrian full-scale experiments [2]; this
version will be called test vehicle hereafter. For FE model development, a 1.6 petrol version of the same
model was bought, scanned and tested; this version will be called vehicle hereafter. In none of the tests
(full-scale pedestrian PMHS and vehicle impactor component tests) or simulations, contact was made
with any of the structures underneath the bonnet that differed between the test vehicle and the vehicle.
Thus, differences with respect to these structures between the 1.9 dCi and the 1.6 petrol versions were
not considered.
The vehicle centreline is shown in Fig. 1, including the Bonnet Leading Edge (BLE) as defined by Euro
NCAP [3].
Fig. 1: Vehicle centreline measurements with datum lines
-z
y A
B
C
D
BLE
F
G
E

4
2.2 Vehicle scans
Two types of scans of the vehicle geometry were done:
1) FARO arm scans were done before and after each PMHS test of the outside geometry of the test
vehicle, with a density of 10 mm x 10 mm. This scan included the bumper region, soft nose,
bonnet, and windshield. Measurement error was below 2 mm.
2) A detailed laser scan was done of the vehicle at Cascade Mölndal, Sweden. This scan included
the outside geometry of the front, the inside structure of the bonnet and, to a certain extent,
the parts underneath the bonnet. It did not include the windshield. Measurement error was
below 1 mm.
The geometries resulting from these two scans were compared with each other. Both vehicle scans
provided the same outside geometry within the measurement error range (estimated below 2 mm).
Both scans were initially stored as point clouds in STL format. For development of the FE vehicle
geometry, the detailed laser scan was used. The point cloud was first modified (separation of
components and mesh clean-up) using Geomagic Studio and thereafter imported into CATIA Digitized
Shape Editor, then imported to CATIA Quick Surface Reconstruction. The final surfaces generated in
CATIA deviated around half a millimeter or less for most parts from the original scan. Then the surfaces
were imported into HyperMesh 11 [4] or LS-PrePost 4.2 [5] for mesh generation (the latter for soft nose
and bumper mesh generation). This was done for the bonnet, soft nose and bumper, battery cover,
engine cover, important chassis components, upper engine compartments structures and fenders.
A first version of the bonnet FE model was developed as a Master thesis [6] whereas a first version of the
soft nose and bumper FE models were developed by a project assistant. These models were further
developed as described below.
2.3 Additional geometry data
Several additional parts were measured manually: the windshield, a damping honeycomb-like plastic
structure behind the bumper (hereafter referred to as tibia absorber), an aluminium beam behind that
structure, and a T-shaped plastic part behind the upper part of the soft nose (hereafter referred to as
femur absorber). These measurements were used to model the geometries, adapted to fit together with
each other and the remaining parts, and then exported in iges format. Finally, a plastic sheet behind the
lowest part of the vehicle front was measured and modelled with LS-PrePost 4.2.
2.4 From geometry to mesh
The first versions of the bonnet and soft nose FE models were re-meshed for four main reasons:

5
1. The first version of the vehicle model mesh was dense and as such would have determined the
time step in a simulation with THUMS version 4.0. This level of detail was not deemed
necessary. The aim for the new mesh size was 10 mm.
2. There were a number of holes in the mesh and a number of elements were skewed.
3. The tibia absorber should share nodes with the soft nose which it did not in the first version.
4. The mesh was not symmetric to the centreline of the vehicle.
For the final bonnet FE model mesh generation, LS-PrePost 4.2 [5] was used. The first version FE bonnet
was used to define the geometry. The surfaces of this geometry were then merged and cut at the
centreline of the vehicle. To optimise mesh size, the remaining surface was cut into stripes parallel to
the centreline, yielding reference lines for meshing. These surfaces were then mirrored at the centreline
to form the complete bonnet geometry. Using automatic meshing with slight manual adjustments, the
desired mesh could be achieved. The bonnet then consisted of two parts, the outer and the inner part,
which were both modelled with shell elements. These were connected by a third part, consisting of one
layer of shells mimicking the folding connection between the outer and inner bonnet.
The soft nose was modelled from the laser scan since several features (front lights, ventilation, light
washers) were not included in the first version. After importing the scan data into HyperMesh 11, CAD
drawings of the tibia absorber and the aluminium beam were added and the geometry as a whole was
cut at the centreline of the vehicle. This geometry was then exported as iges-files and imported into LS-
PrePost 4.2, where the remaining surfaces were merged, a number of holes, skewed or double surfaces
and other errors were fixed, and surface connections were refined. After mirroring the surfaces on the
centreline and using automatic meshing, an acceptable mesh could be achieved although several
manual adjustments had to be made in order to refine skewed elements and to remove additional holes
in the mesh.
3 FINAL MODEL
3.1 Parts, numbering and materials
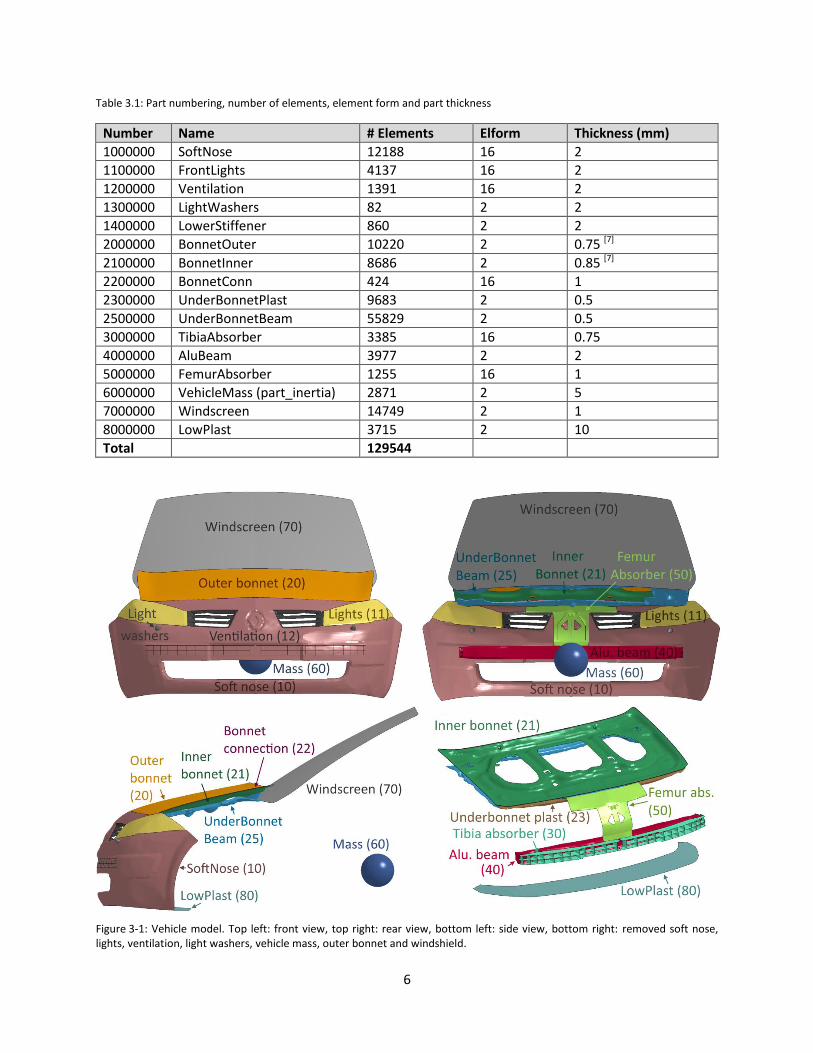
The FE model of the vehicle consists of 16 parts, all of them modelled with shell elements (Table 3.1,
Figure 3-1). Material models and properties are presented in Table 3.2.
6
Table 3.1: Part numbering, number of elements, element form and part thickness
Number Name # Elements Elform Thickness (mm)
1000000 SoftNose 12188 16 2
1100000 FrontLights 4137 16 2
1200000 Ventilation 1391 16 2
1300000 LightWashers 82 2 2
1400000 LowerStiffener 860 2 2
2000000 BonnetOuter 10220 2 0.75 [7]
2100000 BonnetInner 8686 2 0.85 [7]
2200000 BonnetConn 424 16 1
2300000 UnderBonnetPlast 9683 2 0.5
2500000 UnderBonnetBeam 55829 2 0.5
3000000 TibiaAbsorber 3385 16 0.75
4000000 AluBeam 3977 2 2
5000000 FemurAbsorber 1255 16 1
6000000 VehicleMass (part_inertia) 2871 2 5
7000000 Windscreen 14749 2 1
8000000 LowPlast 3715 2 10
Total 129544
Figure 3-1: Vehicle model. Top left: front view, top right: rear view, bottom left: side view, bottom right: removed soft nose, lights, ventilation, light washers, vehicle mass, outer bonnet and windshield.
7
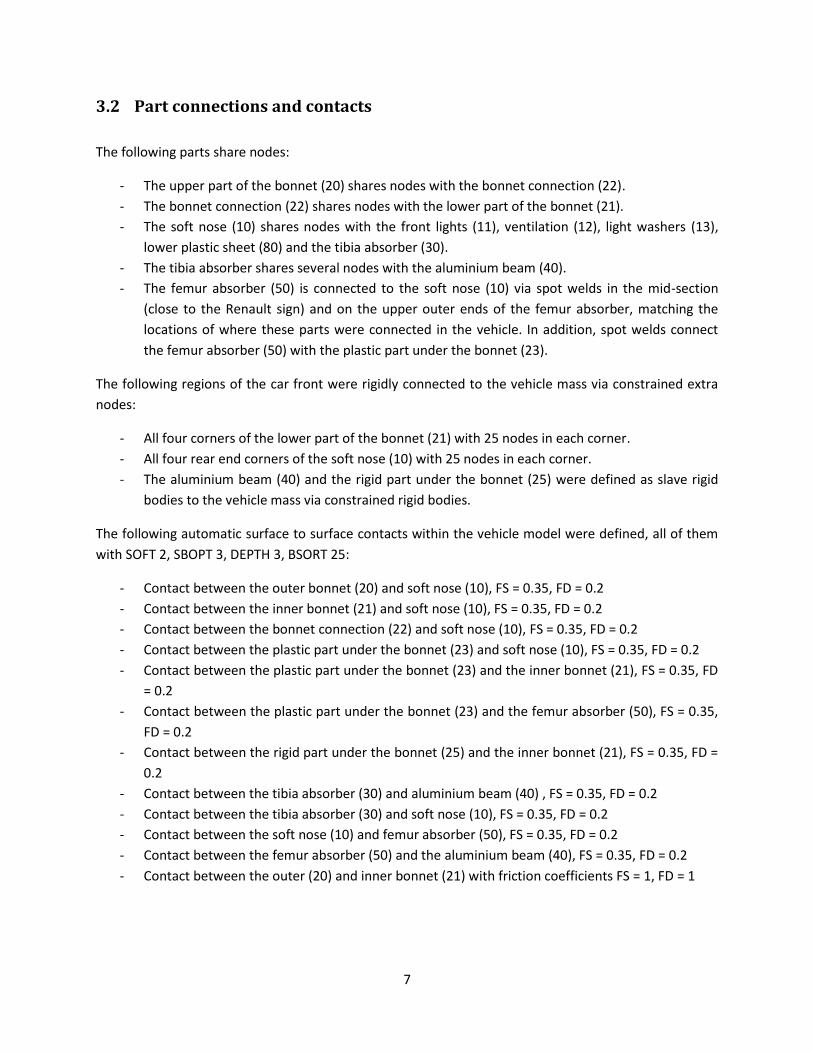
3.2 Part connections and contacts
The following parts share nodes:
- The upper part of the bonnet (20) shares nodes with the bonnet connection (22).
- The bonnet connection (22) shares nodes with the lower part of the bonnet (21).
- The soft nose (10) shares nodes with the front lights (11), ventilation (12), light washers (13),
lower plastic sheet (80) and the tibia absorber (30).
- The tibia absorber shares several nodes with the aluminium beam (40).
- The femur absorber (50) is connected to the soft nose (10) via spot welds in the mid-section
(close to the Renault sign) and on the upper outer ends of the femur absorber, matching the
locations of where these parts were connected in the vehicle. In addition, spot welds connect
the femur absorber (50) with the plastic part under the bonnet (23).
The following regions of the car front were rigidly connected to the vehicle mass via constrained extra
nodes:
- All four corners of the lower part of the bonnet (21) with 25 nodes in each corner.
- All four rear end corners of the soft nose (10) with 25 nodes in each corner.
- The aluminium beam (40) and the rigid part under the bonnet (25) were defined as slave rigid
bodies to the vehicle mass via constrained rigid bodies.
The following automatic surface to surface contacts within the vehicle model were defined, all of them
with SOFT 2, SBOPT 3, DEPTH 3, BSORT 25:
- Contact between the outer bonnet (20) and soft nose (10), FS = 0.35, FD = 0.2
- Contact between the inner bonnet (21) and soft nose (10), FS = 0.35, FD = 0.2
- Contact between the bonnet connection (22) and soft nose (10), FS = 0.35, FD = 0.2
- Contact between the plastic part under the bonnet (23) and soft nose (10), FS = 0.35, FD = 0.2
- Contact between the plastic part under the bonnet (23) and the inner bonnet (21), FS = 0.35, FD
= 0.2
- Contact between the plastic part under the bonnet (23) and the femur absorber (50), FS = 0.35,
FD = 0.2
- Contact between the rigid part under the bonnet (25) and the inner bonnet (21), FS = 0.35, FD =
0.2
- Contact between the tibia absorber (30) and aluminium beam (40) , FS = 0.35, FD = 0.2
- Contact between the tibia absorber (30) and soft nose (10), FS = 0.35, FD = 0.2
- Contact between the soft nose (10) and femur absorber (50), FS = 0.35, FD = 0.2
- Contact between the femur absorber (50) and the aluminium beam (40), FS = 0.35, FD = 0.2
- Contact between the outer (20) and inner bonnet (21) with friction coefficients FS = 1, FD = 1

8
In addition, a node set from the inner bonnet (21) was defined for a tiebreak-nodes-to-surface contact
with the outer bonnet (20) to simulate these two parts being glued together. The node set included
nodes around the three large holes in the inner bonnet part.
Table 3.2: Material models and properties
Number Material model Density (ton/mm3)
Young’s mod. (MPa)
Poiss. ratio
Sigy (MPa) Etan
1000000 Piecewise linear plasticity
2.6 E-9 1 000 [7] 0.46 25 [7] 300
1100000 Piecewise linear plasticity
2.6 E-9 3 000 [7] 0.46 60 [7] 1000
1200000 Piecewise linear plasticity
2.6 E-9 1 000 0.46 25 300
1300000 Piecewise linear plasticity
2.6 E-9 1 000 0.46 25 300
2000000 Piecewise linear plasticity
7.89 E-9 21 000 [8] 0.3 240 [7] 630
2100000 Piecewise linear plasticity
7.89 E-9 21 000 0.3 240 630
2200000 Piecewise linear plasticity
7.89 E-9 21 000 0.3 240 630
2300000 Piecewise linear plasticity
2.6 E-9 1 000 0.46 25 300
2500000 Rigid 1 E-10 10 000 0.3 NA NA
3000000 Piecewise linear plasticity
2.6 E-9 1 000 0.46 25 3000
4000000 Rigid 1 E-10 10 000 0.3 NA NA
5000000 Piecewise linear plasticity
2.6 E-9 3 000 0.46 25 300
7000000 Rigid 2.6 E-9 3 000 0.3 NA NA
8000000 Piecewise linear plasticity
2.6 E-9 1 000 0.46 25 300
Number Material model
Mass (tons)
Young’s mod. (MPa)
Poiss. ratio
Ixx (t*m2) Iyy (t*m2) Izz (t*m2)
6000000 Rigid 1.225 10 000 0.3 6.263e+5 1.220e+4 1.054e+6
3.3 Comparison with geometry scans
The vehicle model was subsequently compared with the geometry scans. Figure 3-2 shows the
comparison of the model with the FARO arm scans. The largest difference was approximately 3 mm.
Figure 3-3 shows the comparison of the model with the Cascade laser scan. The largest difference was
approximately 4 mm.

9
Figure 3-2: Comparison between the FE model (blue) and the FARO arm scan (red dots).
Figure 3-3: Comparison between the FE model (blue) and the laser scan (red).

10
4 EXPERIMENTS
In order to establish FE model evaluation data, impactor tests were undertaken with the vehicle. These
tests were torso impactor and leg impactor tests that were conducted at Autoliv, Vårgårda, Sweden.
1. Torso impactor to bonnet
a. T-rear
b. T-front
2. Leg impactor to soft nose and bumper
a. L1-2200-13305580
b. L2-0000-13305582
c. L3-0030-13305575
d. L4-2230-13305579
e. L5-0060-13305576/77
The experiments will be presented in short hereafter. Details of the experiments can be found in [9].
4.1 Torso impactor to bonnet
For this test series, the bonnet was removed from the rest of the physical vehicle. An aluminium
impactor resembling a hollow, elliptic half-cylinder, representing a torso impactor, was dropped onto
the rear and the front end of the bonnet (Figure 4-1). The mass of the impactor was 12 kg and the
impact speed was 6.1 m/s. Displacements were measured with two string pots and by video analysis of
two targets, one attached to the bonnet, one attached to the impactor. The mounting and guiding of the
impactor was aimed at inhibiting rotation of the impactor. However, the videos of the experiments
showed that there was some rotation present during impact in the experiments. In the impact against
the rear end of the bonnet, the impactor rotation influenced the results as follows: Both experimental
photo targets showed more displacement than they would have without the rotation. The experimental
rear string pot displayed slightly more displacement than it would have without rotation, and the
experimental front string pot displayed slightly less displacement. In the impact against the front end of
the bonnet, both experimental photo targets displaced less displacement than they would have without
impactor rotation. The experimental rear string pot showed slightly more and the experimental front
string pot showed slightly less displacement than they would have without the rotation.
Experimental test results are presented together with the simulation test results in Chapter 5.

11
Torso impact, rear end of the bonnet Torso impact, front end of the bonnet
Figure 4-1: Torso impactor against bonnet. Left: impact against the bonnet rear end, Right: impact
against the bonnet front end. Top: test set-up, middle: photos from the experiments with arrows
showing the direction of rotation, bottom: experimental and simulation results for test series A).
4.2 Leg impactor to soft nose and bumper
In this test series, a hollow aluminium half-cylinder representing an upper leg was fired against the
centre line of the vehicle front end at different angles and heights and at an impact speed of 11.1 m/s
(Table A-1). The mass of the impactor was varied between 5 kg, 7.5 kg and 12 kg. The impactor was
mounted on a sled which limited rotation and movement perpendicular to the impact direction.
However, in experiments L3-L5, some unwanted vertical impactor movement was observed. In
experiment L4, the vehicle additionally moved downwards due to engagement of the front suspension.
Experimental results were impactor displacements in impact direction (y) and in vertical direction (z).
Experimental test results are presented together with the simulation test results in Chapter 5.
String pot front String pot rear
String pot front String pot rear

12
Table 4.1: Validation simulation matrix, leg impact tests. Impactor velocity was 11.1 m/s in all tests.
Test number Car
angle Imp. angle
Impactor mass (kg)
Remarks
L1-2200-13305580
22 0 5
Best quality experiment engaging most components
L2-0000-13305582
0 0 5
Good quality experiment. Used parts from previous test 81, but number plate carrier was removed
L3-0030-13305575
0 30 7.5
Some unwanted z motion of the impactor observed in the experiments (before, during and after impact)
L4-2230-13305579
22 30 12
Some unwanted z motion of the impactor observed in the experiments (before, during and after impact). Additionally, the vehicle was pushed downwards in the experiments, which was not simulated.
L5-0060-13305576/77
0 60 7.5
Impactor mounting expected to strongly influence impactor deceleration, could not be simulated properly (not used as validation simulation). Tests 76 and 77 displayed varying amounts of displacement.
5 VALIDATION PROCESS
This section describes the validation process. All simulations were carried out with LS-Dyna R7.1.1 [10].
The material properties given in Chapter 0 were collected from literature and thicknesses were
measured on the vehicle.
13
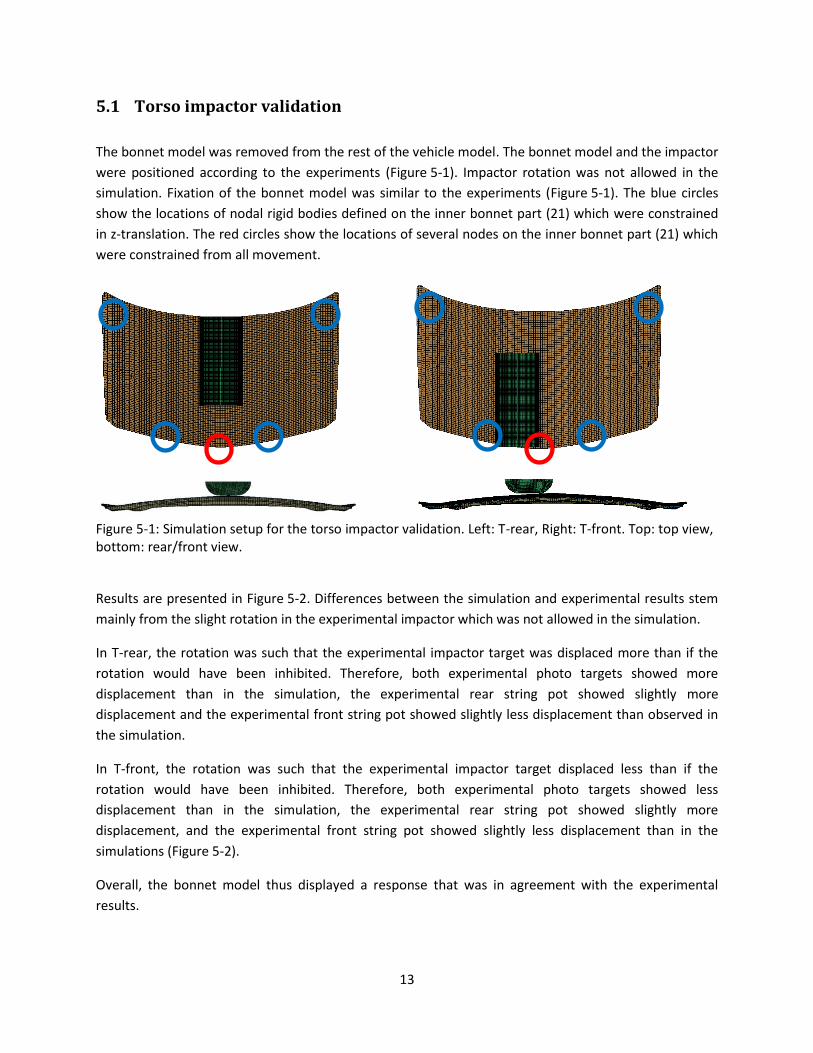
5.1 Torso impactor validation
The bonnet model was removed from the rest of the vehicle model. The bonnet model and the impactor
were positioned according to the experiments (Figure 5-1). Impactor rotation was not allowed in the
simulation. Fixation of the bonnet model was similar to the experiments (Figure 5-1). The blue circles
show the locations of nodal rigid bodies defined on the inner bonnet part (21) which were constrained
in z-translation. The red circles show the locations of several nodes on the inner bonnet part (21) which
were constrained from all movement.
Figure 5-1: Simulation setup for the torso impactor validation. Left: T-rear, Right: T-front. Top: top view, bottom: rear/front view.
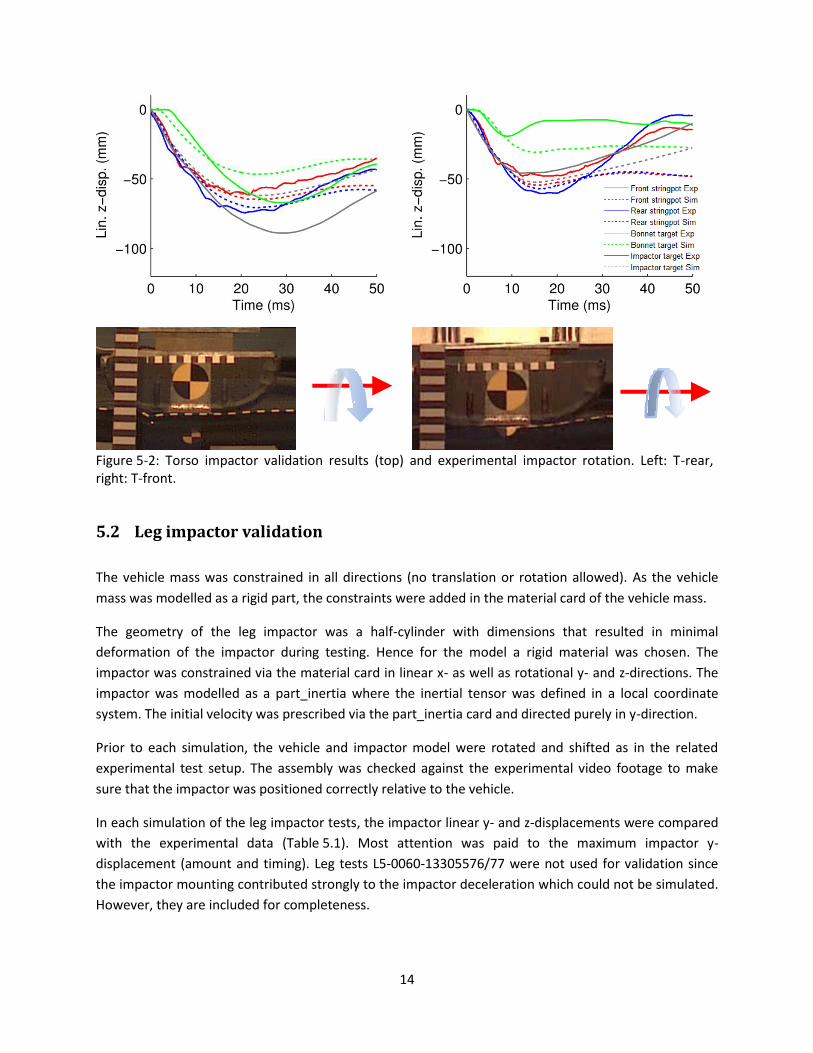
Results are presented in Figure 5-2. Differences between the simulation and experimental results stem
mainly from the slight rotation in the experimental impactor which was not allowed in the simulation.
In T-rear, the rotation was such that the experimental impactor target was displaced more than if the
rotation would have been inhibited. Therefore, both experimental photo targets showed more
displacement than in the simulation, the experimental rear string pot showed slightly more
displacement and the experimental front string pot showed slightly less displacement than observed in
the simulation.
In T-front, the rotation was such that the experimental impactor target displaced less than if the
rotation would have been inhibited. Therefore, both experimental photo targets showed less
displacement than in the simulation, the experimental rear string pot showed slightly more
displacement, and the experimental front string pot showed slightly less displacement than in the
simulations (Figure 5-2).
Overall, the bonnet model thus displayed a response that was in agreement with the experimental
results.
14
Figure 5-2: Torso impactor validation results (top) and experimental impactor rotation. Left: T-rear, right: T-front.
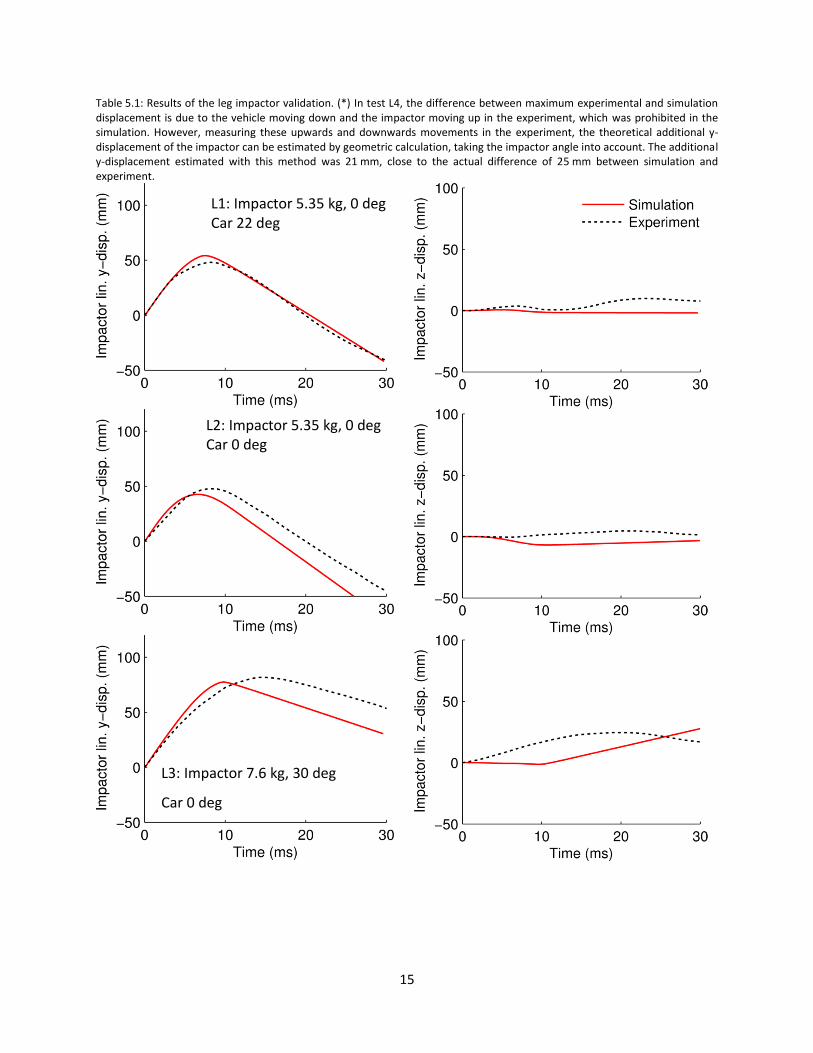
5.2 Leg impactor validation
The vehicle mass was constrained in all directions (no translation or rotation allowed). As the vehicle
mass was modelled as a rigid part, the constraints were added in the material card of the vehicle mass.
The geometry of the leg impactor was a half-cylinder with dimensions that resulted in minimal
deformation of the impactor during testing. Hence for the model a rigid material was chosen. The
impactor was constrained via the material card in linear x- as well as rotational y- and z-directions. The
impactor was modelled as a part_inertia where the inertial tensor was defined in a local coordinate
system. The initial velocity was prescribed via the part_inertia card and directed purely in y-direction.
Prior to each simulation, the vehicle and impactor model were rotated and shifted as in the related
experimental test setup. The assembly was checked against the experimental video footage to make
sure that the impactor was positioned correctly relative to the vehicle.
In each simulation of the leg impactor tests, the impactor linear y- and z-displacements were compared
with the experimental data (Table 5.1). Most attention was paid to the maximum impactor y-
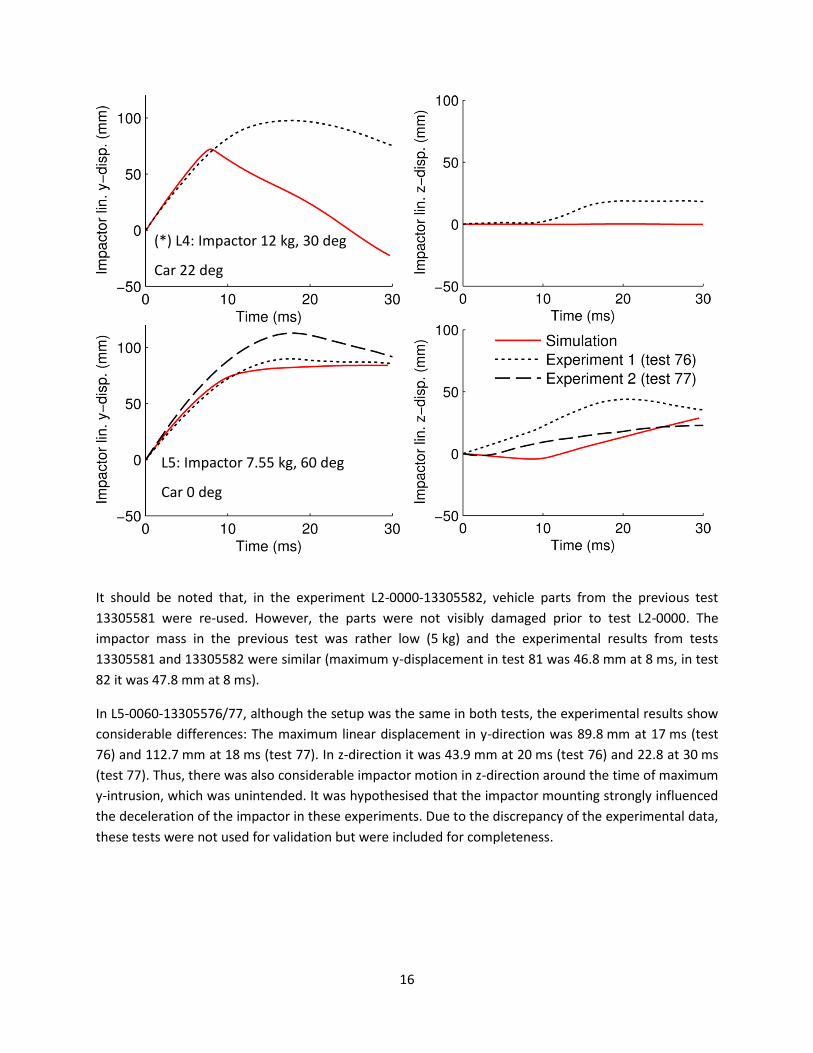
displacement (amount and timing). Leg tests L5-0060-13305576/77 were not used for validation since
the impactor mounting contributed strongly to the impactor deceleration which could not be simulated.
However, they are included for completeness.
15
Table 5.1: Results of the leg impactor validation. (*) In test L4, the difference between maximum experimental and simulation displacement is due to the vehicle moving down and the impactor moving up in the experiment, which was prohibited in the simulation. However, measuring these upwards and downwards movements in the experiment, the theoretical additional y-displacement of the impactor can be estimated by geometric calculation, taking the impactor angle into account. The additional y-displacement estimated with this method was 21 mm, close to the actual difference of 25 mm between simulation and experiment.
L1: Impactor 5.35 kg, 0 deg
Car 22 deg
L2: Impactor 5.35 kg, 0 deg
Car 0 deg
L3: Impactor 7.6 kg, 30 deg
Car 0 deg
16
It should be noted that, in the experiment L2-0000-13305582, vehicle parts from the previous test
13305581 were re-used. However, the parts were not visibly damaged prior to test L2-0000. The
impactor mass in the previous test was rather low (5 kg) and the experimental results from tests
13305581 and 13305582 were similar (maximum y-displacement in test 81 was 46.8 mm at 8 ms, in test
82 it was 47.8 mm at 8 ms).
In L5-0060-13305576/77, although the setup was the same in both tests, the experimental results show
considerable differences: The maximum linear displacement in y-direction was 89.8 mm at 17 ms (test
76) and 112.7 mm at 18 ms (test 77). In z-direction it was 43.9 mm at 20 ms (test 76) and 22.8 at 30 ms
(test 77). Thus, there was also considerable impactor motion in z-direction around the time of maximum
y-intrusion, which was unintended. It was hypothesised that the impactor mounting strongly influenced
the deceleration of the impactor in these experiments. Due to the discrepancy of the experimental data,
these tests were not used for validation but were included for completeness.
(*) L4: Impactor 12 kg, 30 deg
Car 22 deg
L5: Impactor 7.55 kg, 60 deg
Car 0 deg

17
6 APPLICATIONS AND LIMITATIONS
The final vehicle model is validated for pedestrian-to-vehicle crashes close to the centerline of the
vehicle. The model has the following limitations:
- The vehicle model has been validated with a focus on pedestrian kinematics. Pedestrian injuries
may, in some cases, not be properly predicted by human body models with this vehicle model.
Further validation should be carried out before attempting to predict injuries, assessing forces
and accelerations during impactor tests.
- The windscreen is rigid in the current version. Any impact to the windscreen is therefore not
properly simulated. The model can be updated with a proper windscreen material model. In this
case, the windscreen should be placed in a proper frame.
- Apart from the parts mentioned above, no parts under the bonnet were modeled. A first round
of simulations was conducted with the average male THUMS, academic version 4 pedestrian, at
a vehicle speed of 40 km/h. The vehicle deformation was small such that parts under the bonnet
would not have been involved in the crash. However, for substantially higher speeds or
substantially heavier human models, the missing parts should be added.
- The front structure below the bumper lacks a plastic part where there is currently a hole, and
support beams behind the lowest area below the hole. To mimic the effect of this part, the
thickness of a plastic part (LowPlast, part 80) was tuned such that both the effect of the missing
plastic part and the actual support in the LowPlast region were merged into the LowPlast part.
For tuning, test simulations were carried out with THUMS in which the full-scale PMHS tests
were replicated. The tuning was aimed at matching the lower leg kinematics of THUMS with
those of the PMHSs and it was found that the upper body kinematics were not notably affected
by the LowPlast part. However, knee and lower leg injuries should not be assessed with the
current version of the vehicle model.
- The model cannot be used for impacts close to the front corners of the vehicle. The structures in
this area are not properly modeled and the model is not validated in this area. In addition, the
model lacks front fenders, doors, A-pillars and other parts which may be contact by a pedestrian
that is struck near the front corners.
7 REFERENCES
[1] TMC, THUMS User Manual, AM50 Pedestrian/Occupant Model, Academic Version 4.0_20111003.
[2] R. Paas, C. Masson, and J. Davidsson, Head Boundary Conditions in Pedestrian Crashes with Passenger Cars: 6 Degrees of Freedom Post Mortem Human Subject Responses, Int J Crashworthiness (submitted in Jan. 2015).
[3] Euro NCAP, Pedestrian Testing Protocol, European New Car Assessment Programme (Euro NCAP), 2014.
[4] Altair, HyperWorks 11.0.
18
[5] LSTC Inc., LS-Prepost 4.2. [6] H. Mahmoudi, Modeling of Bonnet for Pedestrian Research in LS-DYNA, Master thesis, Chalmers
University of Technology, 2013. [7] Bosch, Automotive Handbook, 5 ed, Society of Automotive Engineers (SAE), Warrendale, PA,
2000. [8] B. Pipkorn, C. Forsberg, Y. Takahashi et al., Development and Component Validation of a Generic
Vehicle Front Buck for Pedestrian Impact Evaluation, in IRCOBI Conference, Berlin, Germany, 2014.
[9] R. Paas, S. Andersson, and J. Davidsson, Impactor Testing of a Renault Mégane II for validation of a finite element vehicle model for full-scale pedestrian impact simulations, Chalmers University of Technology, Gothenburg, Sweden, 2015.
[10] LSTC Inc., LS-Dyna R7.1.1.