report to the joint legislative appropriations committee
TRANSCRIPT
Report to the Joint Legislative Appropriations Committee
July 2020
Report compiled by North Carolina Office of State Human Resources
2 019 C O M P E N S AT I O N A N D B E N E F I T S R E P O RT
BA R BA R A G I B S O N State Human Resources Director
A N D R E A C L I N K S CA L E STotal Rewards Division Director

Table of Contents
I . E x e c u t i v e S u m m a r y . . . . . . . . . . . . . . . . . . . 1
I I . I n t r o d u c t i o n . . . . . . . . . . . . . . . . . . . . . . . . 3 N C T o t a l C o m p e n s a t i o n P h i l o s o p h y
I I I . T o t a l C o m p e n s a t i o n . . . . . . . . . . . . . . . . . . 4 T o t a l C o m p e n s a t i o n M o d e l S a l a r y a n d B e n e f i t s a s a P e r c e n t a g e o f T o t a l C o m p e n s a t i o n
I V . E c o n o m i c R e v i e w . . . . . . . . . . . . . . . . . . . . 6 G e n e r a l S a l a r y a n d B u d g e t T r e n d s C o n s u m e r P r i c e a n d E m p l o y m e n t C o s t I n d i c e s
V . B a s e P a y a n d L a b o r M a r k e t A n a l y s i s . . . . . . . 7 M a r k e t P r i c i n g M e t h o d o l o g y M a r k e t P r i c i n g F i n d i n g s
V I . A d d i t i o n a l A n a l y s i s . . . . . . . . . . . . . . . . . . 1 2 U s e o f S a l a r y A d j u s t m e n t F u n d i n g R e c r u i t m e n t a n d R e t e n t i o n N e w H i r e D e m o g r a p h i c s a n d S t r a t e g i e s T u r n o v e r R a t e s a n d C o s t L o n g e v i t y
V I I . B e n e f i t s A n a l y s i s . . . . . . . . . . . . . . . . . . . . 1 5 P a i d P a r e n t a l L e a v e P a i d T i m e O f f A n a l y s i s H e a l t h I n s u r a n c e S t a t e w i d e F l e x i b l e B e n e f i t s P r o g r a m ( N C F l e x ) R e t i r e m e n t
A p p e n d i x . . . . . . . . . . . . . . . . . . . . . . . . . . . . . 1 8 A . H i s t o r y o f L e g i s l a t i v e I n c r e a s e s f o r N C E m p l o y e e s 1 9 9 2 - 2 0 1 9 B . N C P a y C o m p a r i s o n t o C P I a n d A v e r a g e M a r k e t M o v e m e n t C . W o r k f o r c e T u r n o v e r a n d A g i n g T r e n d s D . M a r k e t S u r v e y L i b r a r y E . L i s t o f B e n c h m a r k C l a s s e s a n d L a b o r M a r k e t A n a l y s i s
1
Executive SummaryThis report responds to the requirements expressed in NCGS 126-7.3 (State Human Resources Act) to guide the Governor and the General Assembly in making funding appropriations for State employees’ salary increases and salary structure adjustments. The report is presented to the Appropriations Committee of the House and Senate no later than two weeks after the convening of the legislature in odd-numbered years, and May 1 of even-numbered years. The reporting deadline was extended to July 15 per Senate Bill 704 / Session Law 2020-13. The report identifies gaps between existing compensation specific programs and market best practices that may impact internal equity, market competitiveness and the retention/attraction of talent, and sets the stage for strategic planning to address current economic and labor market conditions.
Key to the discussion of state employee compensation is the Office of State Human Resources’ (“OSHR”) ongoing Statewide Compensation System Project. The NC General Assembly mandated OSHR to develop a modern streamlined Statewide Compensation System (Senate Bill 402, the Appropriations Act of 2013) to address the many challenges and inconsistencies of having two outdated systems. The project was expected to be implemented in June 2016 but was delayed by legislative action; the system was implemented effective June 1, 2018. The new statewide system is designed to provide market responsiveness and equitable and affordable compensation. Thus, in fall 2018, OSHR issued an open market solicitation to seek consulting services to evaluate the external competitiveness of the State’s Total Rewards programs, policies and practices, and provide turn-key implementation of the major components of the Statewide Classification and Compensation System.
The contract was awarded to Mercer (US), Inc. (“Mercer”) based on the “Best Value” evaluation method. Mercer’s major strength is their labor market data repository and data analytics capability, reinforced by their current and broad survey library and sister organizations of Marsh & McLennan and Oliver Wyman. The contractual partnership with Mercer runs from February 1, 2019 through January 31, 2021.
Mercer is undertaking this review as part of a more holistic compensation review and assessment project – gathering market pay data to update the State’s salary structures and complement the salary administration policies based on industry best practices. Mercer is leveraging their resources to significantly increase the number of benchmark jobs and surveys that the State will use moving forward with a broader and deeper analysis of our competitive posture throughout Agency job families and the University System.
[Note: The COVID-19 Pandemic has impacted progress on the labor market project. In addition, the full impact of COVID-19 on the mid- to long-term economy and labor market is unknown at this time and will continue to be assessed throughout 2020 as we partner with Mercer in this study.]
Summary of Funding Recommendations:
1. When state revenues stabilize, a recurring source of funding will be required to sustain the State’s competitive market position through regular salary structure adjustments. Provide resources to strategically identify and address competitive labor market pay and structural gaps to support the dynamic career needs of the State’s workforce from recruitment to development and retention.

2
2. Salary increases in the market have stabilized to around 3% annually over the last several years. The State was slightly behind the market with the recent 2.5% Legislative Increase in 2019. It is unclear how the 2.5% increase in 2020 will compare with labor market changes during the Pandemic. The State’s history of Legislative Increases (see Appendix A) has failed to keep pace with market salary increases.
3. When state revenues stabilize and labor markets are clearer, consider apportioning future legislative increases using a multi-pronged approach to include an across-the-board increase, market-based increase, performance-based increase and/or lump sum payment.
4. Provide recurring resources to support the Salary Administration Policy, which will ensure a fair, equitable and consistently funded mechanism that is needed to progress State employees within their pay grade. Employees need a “line of sight” for career growth and salary advancement.
5. To ensure market - related competitiveness, state leaders should continue to charge the Office of State Human Resources (in consultation with the Office of State Budget and Management) with establishing a process to set priorities and
request funding for labor market increases and salary adjustment funds based on criticality, turnover, retention, recruitment difficulties and market position. OSHR and state agencies should evaluate job-specific turnover in order to identify critical needs.
6. Research coordination of post-tax supplemental benefits and consolidate all supplemental benefit plan offerings in a consumer-driven menu approach for portability and cost savings. A consolidation would allow employees to see all benefits offerings in one place and select plan products that meet their needs.
7. Support the ongoing funding of the Office of State Human Resources’ Human Capital Management System, Learning Management System (LMS) and Performance Management components; and the Statewide Compensation System’s Market Analysis and Modeling tool (MarketPay) and Position Description Writing and Workflow tool (PeopleAdmin).
Executive Summary

3
This report conveys economic and pay trends. Findings and data are derived from compensation and benefits surveys that OSHR regularly analyzes to determine whether or not salary ranges, rates and average salaries for State classifications and benefits for employees are competitive in the labor market. The report summarizes key findings and comparative data showing the relationship of the State’s wages and compensation programs to those of competitors in both the private and public sectors, as well as in relation to talent management trends nationally, regionally and locally.
North Carolina’s Total Compensation Philosophy
The following vision for state government was established with the new Statewide Compensation System:
The State of North Carolina is committed to attracting and retaining a diverse workforce of high performing employees with the competencies, skills, knowledge, and dedication needed to consistently meet continually evolving strategic goals. The state’s compensation system should be reflective of occupational trends and best practices. It should be meaningful and easily understood by employees and managers, and administered by Human Resources professionals in a consistent manner.
Market Responsiveness • Position total compensation competitively with relevant labor markets • Recognize that labor market factors differ for specific occupations
Equitable and Affordable Compensation • Align internal pay within occupational groups while avoiding adverse impacts • Maintain internal classification structure alignment • Maintain fiscal responsibilityTraditionally, statewide salary adjustments have come in the form of an across-the-board increase granted by the legislature. Until recently, the State Human Resources Act prohibited such modern-day pay programs as monetary incentive awards. Business critical areas within the State’s workforce – such as Information Technology, Medical and Health, Engineering, and Corrections jobs – should be considered when determining pay increases. Organizations continue to look to flexible compensation systems that include broad classifications that are driven by market-related pay structures and variable pay plans as they struggle to afford and sustain compensation levels. Additional flexibility in this area will help the state to remain competitive.
In the future it is recommended that a continuing allocation be provided to reward employees based on performance. Pay as a performance reward — even lump sum payments for milestone achievements — is widely utilized in the modern workplace and is considered more effective than across-the-board base pay increases. However, it is important to note that pay for performance is only effective for those being paid according to market.
Introduction
4
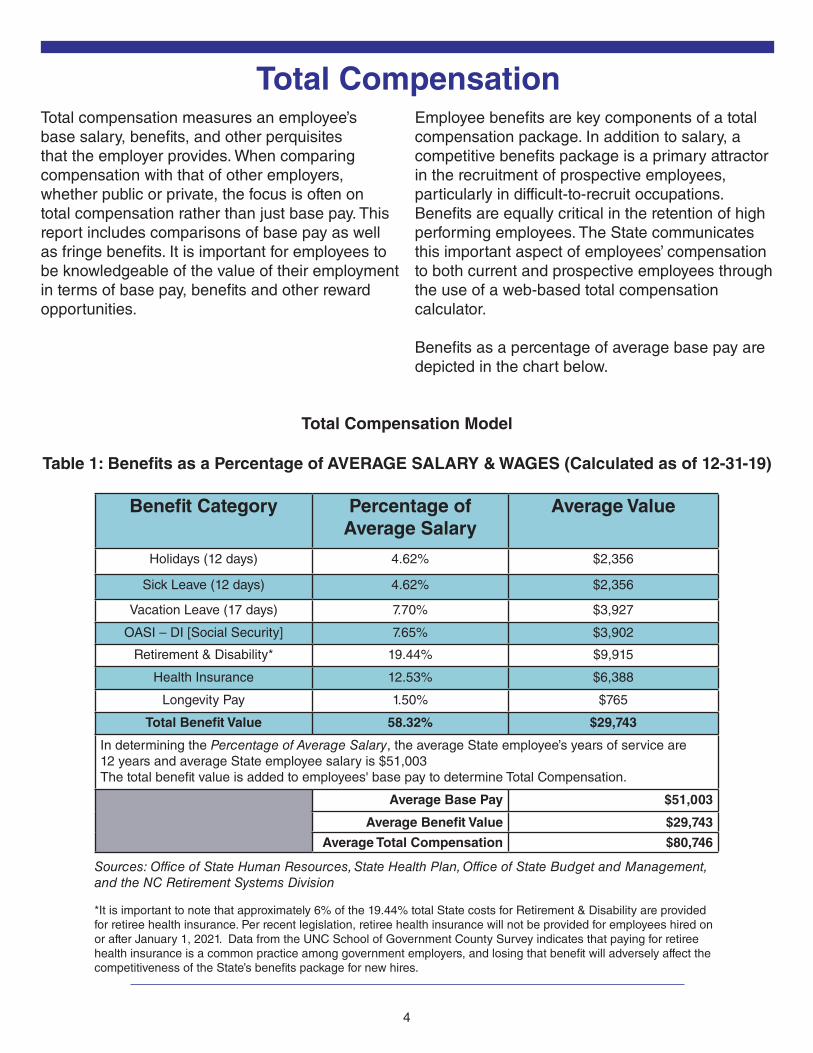
Total compensation measures an employee’s base salary, benefits, and other perquisites that the employer provides. When comparing compensation with that of other employers, whether public or private, the focus is often on total compensation rather than just base pay. This report includes comparisons of base pay as well as fringe benefits. It is important for employees to be knowledgeable of the value of their employment in terms of base pay, benefits and other reward opportunities.
Employee benefits are key components of a total compensation package. In addition to salary, a competitive benefits package is a primary attractor in the recruitment of prospective employees, particularly in difficult-to-recruit occupations. Benefits are equally critical in the retention of high performing employees. The State communicates this important aspect of employees’ compensation to both current and prospective employees through the use of a web-based total compensation calculator.
Benefits as a percentage of average base pay are depicted in the chart below.
Total Compensation
Total Compensation Model
Table 1: Benefits as a Percentage of AVERAGE SALARY & WAGES (Calculated as of 12-31-19)
Benefit Category Percentage of Average Salary
Average Value
Holidays (12 days) 4.62% $2,356
Sick Leave (12 days) 4.62% $2,356
Vacation Leave (17 days) 7.70% $3,927
OASI – DI [Social Security] 7.65% $3,902
Retirement & Disability* 19.44% $9,915
Health Insurance 12.53% $6,388
Longevity Pay 1.50% $765
Total Benefit Value 58.32% $29,743
In determining the Percentage of Average Salary, the average State employee’s years of service are 12 years and average State employee salary is $51,003 The total benefit value is added to employees' base pay to determine Total Compensation.
Average Base Pay $51,003
Average Benefit Value $29,743
Average Total Compensation $80,746
Sources: Office of State Human Resources, State Health Plan, Office of State Budget and Management, and the NC Retirement Systems Division
*It is important to note that approximately 6% of the 19.44% total State costs for Retirement & Disability are provided for retiree health insurance. Per recent legislation, retiree health insurance will not be provided for employees hired on or after January 1, 2021. Data from the UNC School of Government County Survey indicates that paying for retiree health insurance is a common practice among government employers, and losing that benefit will adversely affect the competitiveness of the State’s benefits package for new hires.

5
Once Average Total Compensation is derived, Salary and Benefits can in turn be calculated as a Percentage of Total Compensation. This allows for comparisons to be made between the State’s Average Percentage of Total Compensation and national trends, as seen in Table 2.
This analysis indicates that North Carolina’s salary and wages generally do not make up quite as large a portion of total compensation as is seen nationally, while North Carolina’s paid time off and retirement benefits generally appear to be favorable compared to national averages when expressed as a percentage of total compensation.
North Carolina’s portion of total compensation dedicated to health insurance and Social Security lags the national average. Note that this analysis generally includes only annually budgeted compensation items; other variable compensation and benefits such as overtime pay, workers’ compensation and unemployment are not included in the State or market data.
Table 2: Salary and Benefits as a Percentage of TOTAL COMPENSATION
Benefit CategoryBLS
Percentage of Total Compensation
N.C. Average Percentage of
Total Compensation2019
N.C.Change
From 2018
Salary & Wages 68.7% 63.9% -1.42%
Paid Time Off 7.2% 10.8% -0.28%
Health Insurance 8.3% 8.0% —
Retirement 5.3% 12.4% 1.82%
OASI-DI (Social Security) 7.3% 4.9% -0.11%
Sources: Office of State Human Resources, Office of State Budget and Management and the NC Retirement Systems Division, U.S. DOL Bureau of Labor Statistics “Employer Costs for Employee Compensation – September 2019”
Total Compensation
6
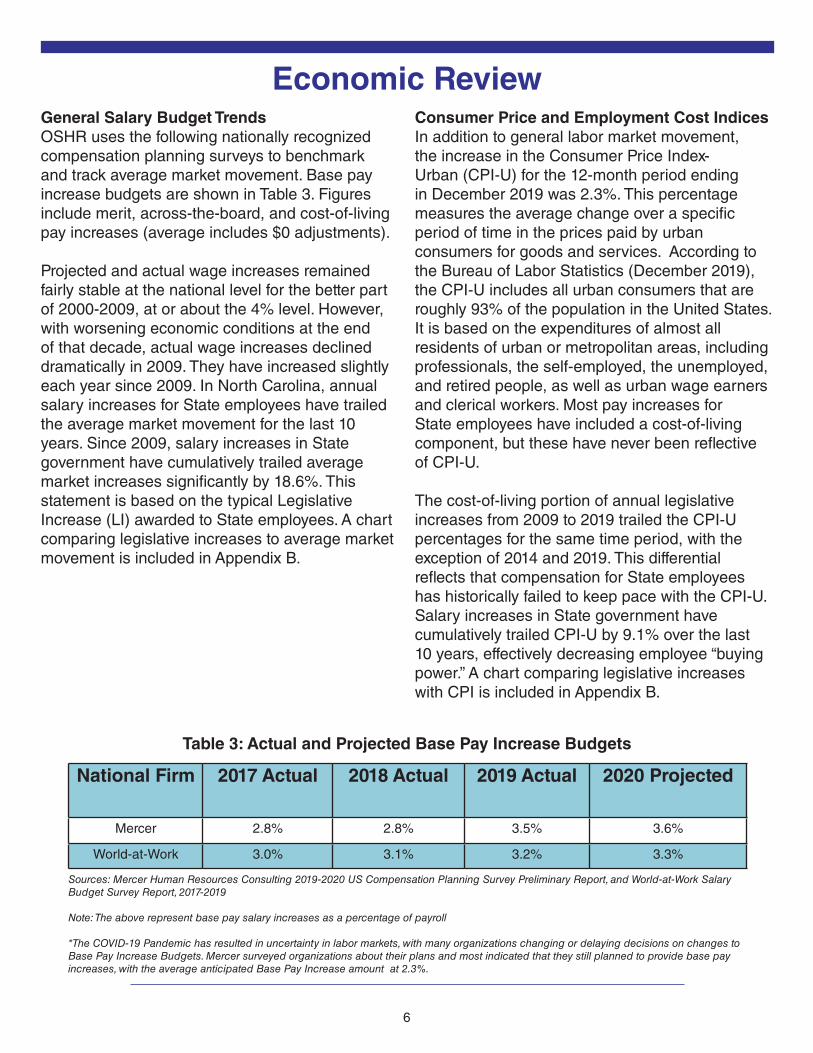
General Salary Budget TrendsOSHR uses the following nationally recognized compensation planning surveys to benchmark and track average market movement. Base pay increase budgets are shown in Table 3. Figures include merit, across-the-board, and cost-of-living pay increases (average includes $0 adjustments).
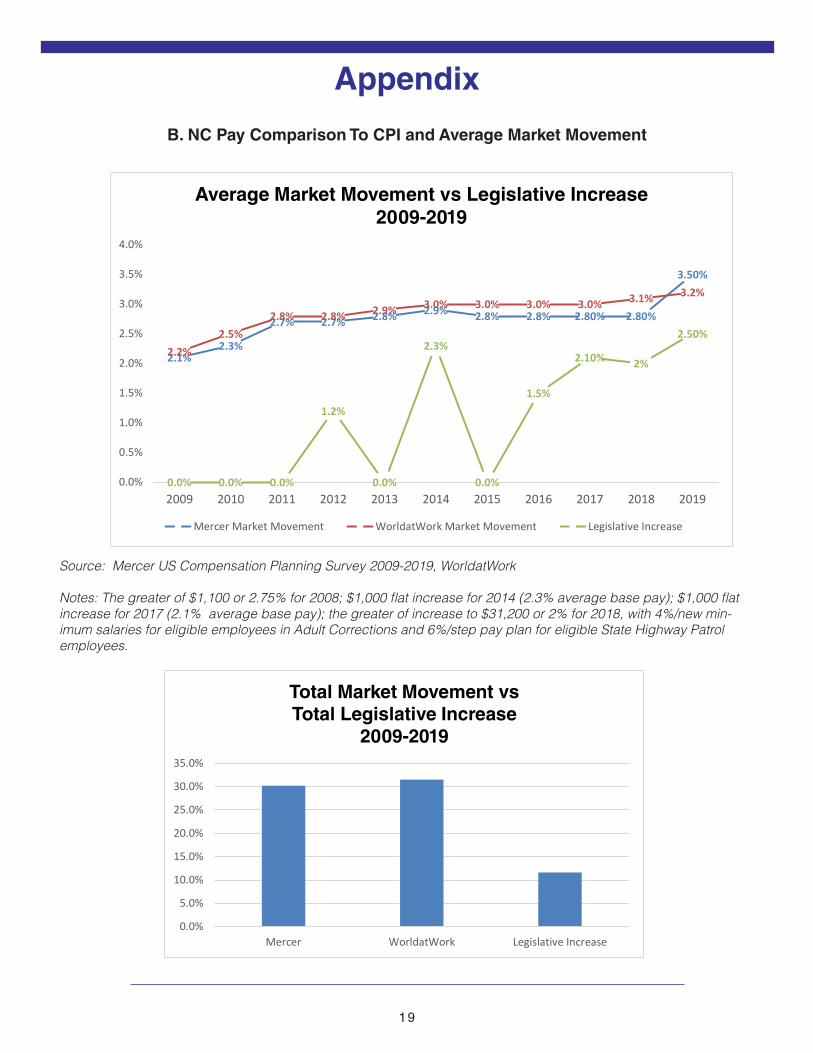
Projected and actual wage increases remained fairly stable at the national level for the better part of 2000-2009, at or about the 4% level. However, with worsening economic conditions at the end of that decade, actual wage increases declined dramatically in 2009. They have increased slightly each year since 2009. In North Carolina, annual salary increases for State employees have trailed the average market movement for the last 10 years. Since 2009, salary increases in State government have cumulatively trailed average market increases significantly by 18.6%. This statement is based on the typical Legislative Increase (LI) awarded to State employees. A chart comparing legislative increases to average market movement is included in Appendix B.
Consumer Price and Employment Cost IndicesIn addition to general labor market movement, the increase in the Consumer Price Index-Urban (CPI-U) for the 12-month period ending in December 2019 was 2.3%. This percentage measures the average change over a specific period of time in the prices paid by urban consumers for goods and services. According to the Bureau of Labor Statistics (December 2019), the CPI-U includes all urban consumers that are roughly 93% of the population in the United States. It is based on the expenditures of almost all residents of urban or metropolitan areas, including professionals, the self-employed, the unemployed, and retired people, as well as urban wage earners and clerical workers. Most pay increases for State employees have included a cost-of-living component, but these have never been reflective of CPI-U.
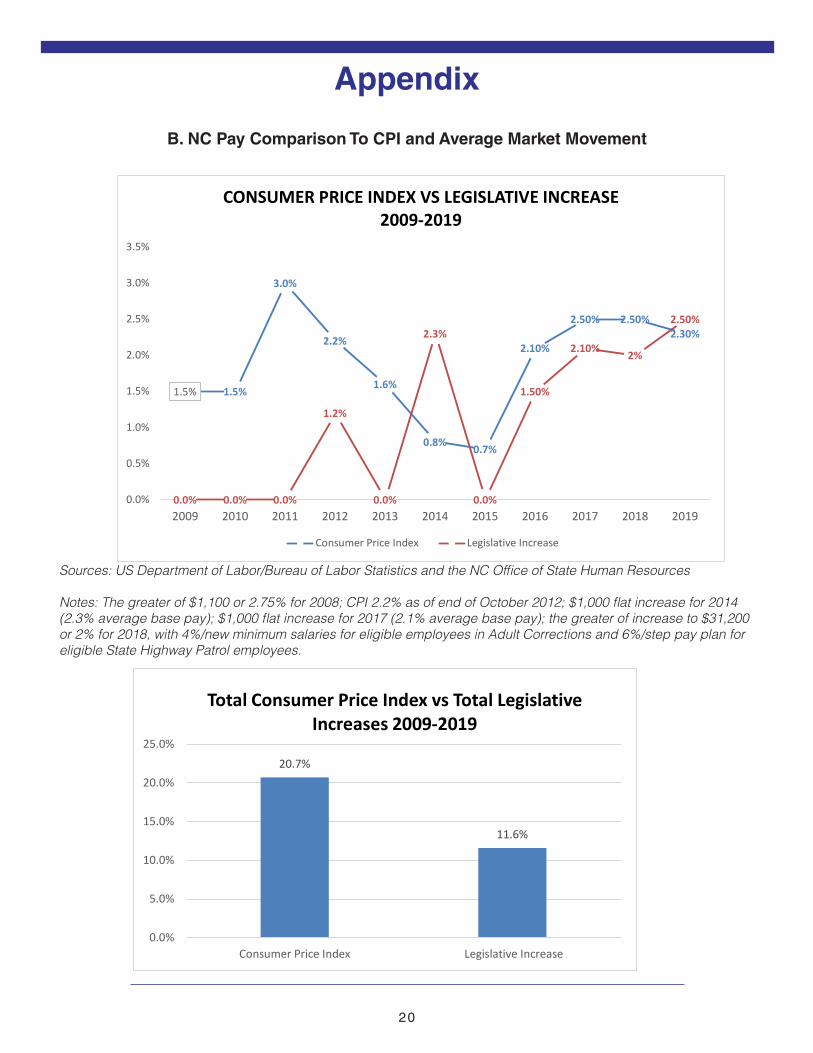
The cost-of-living portion of annual legislative increases from 2009 to 2019 trailed the CPI-U percentages for the same time period, with the exception of 2014 and 2019. This differential reflects that compensation for State employees has historically failed to keep pace with the CPI-U. Salary increases in State government have cumulatively trailed CPI-U by 9.1% over the last 10 years, effectively decreasing employee “buying power.” A chart comparing legislative increases with CPI is included in Appendix B.
Economic Review
Table 3: Actual and Projected Base Pay Increase Budgets
National Firm 2017 Actual 2018 Actual 2019 Actual 2020 Projected
Mercer 2.8% 2.8% 3.5% 3.6%
World-at-Work 3.0% 3.1% 3.2% 3.3%
Sources: Mercer Human Resources Consulting 2019-2020 US Compensation Planning Survey Preliminary Report, and World-at-Work Salary Budget Survey Report, 2017-2019
Note: The above represent base pay salary increases as a percentage of payroll *The COVID-19 Pandemic has resulted in uncertainty in labor markets, with many organizations changing or delaying decisions on changes to Base Pay Increase Budgets. Mercer surveyed organizations about their plans and most indicated that they still planned to provide base pay increases, with the average anticipated Base Pay Increase amount at 2.3%.

7
Market Pricing MethodologyPublic and private sector organizations rely upon salary and benefits surveys to ensure that they are making informed, data-driven decisions about employee total compensation in terms of cost-effectiveness, recruitment, and retention. Sound total compensation practices ultimately result in a workforce comprised of competent, skilled employees across occupational areas. Their collective knowledge, skills, and abilities directly relate to the accomplishment of the organization’s mission and vision. Salary surveys are therefore critical in pricing jobs, determining wage parity with market competitors, and monitoring internal pay equity. Survey data is also essential to organizations in terms of analyzing pay trends, identifying effective pay practices, and establishing a systematic method for setting competitive pay ranges for jobs. A list of surveys to which OSHR subscribes is located in Appendix D.
Professional survey methodology standards are used to collect and analyze available salary survey data or to conduct surveys to gather pertinent market information. Survey methodology recognizes the following concepts that have been defined for informational purposes:
• Market Base Salary 50th percentile is the overall composite rate of pay that competitors have reported through surveying a job similar to that found in State government; i.e., to align with best practice, OSHR is defining market as the overall 50th percentile. The State seeks to be competitive in pay at the 50th percentile as measured against peer public sector organizations (states, counties and local governments) and private industry. • Labor Market Pay Gap is the relationship expressed in percentage terms between the State’s average salary for a benchmark class and the median salary reported for a relevant labor market for that class.
• Relevant Labor Markets: The State competes in the national labor market for executive/senior leadership and key management and professional positions. The State competes in a multi-state regional market for professional and supervisory positions. The multi-state regional market includes Florida, Georgia, Kentucky, North Carolina, South Carolina, Tennessee, West Virginia, and Virginia. The State competes with both government and business organizations at the local, regional and national levels. • Turnover Rate is a percentage reflecting all separations from employment for both voluntary and involuntary reasons compared to the total number of employees over a span of one year.
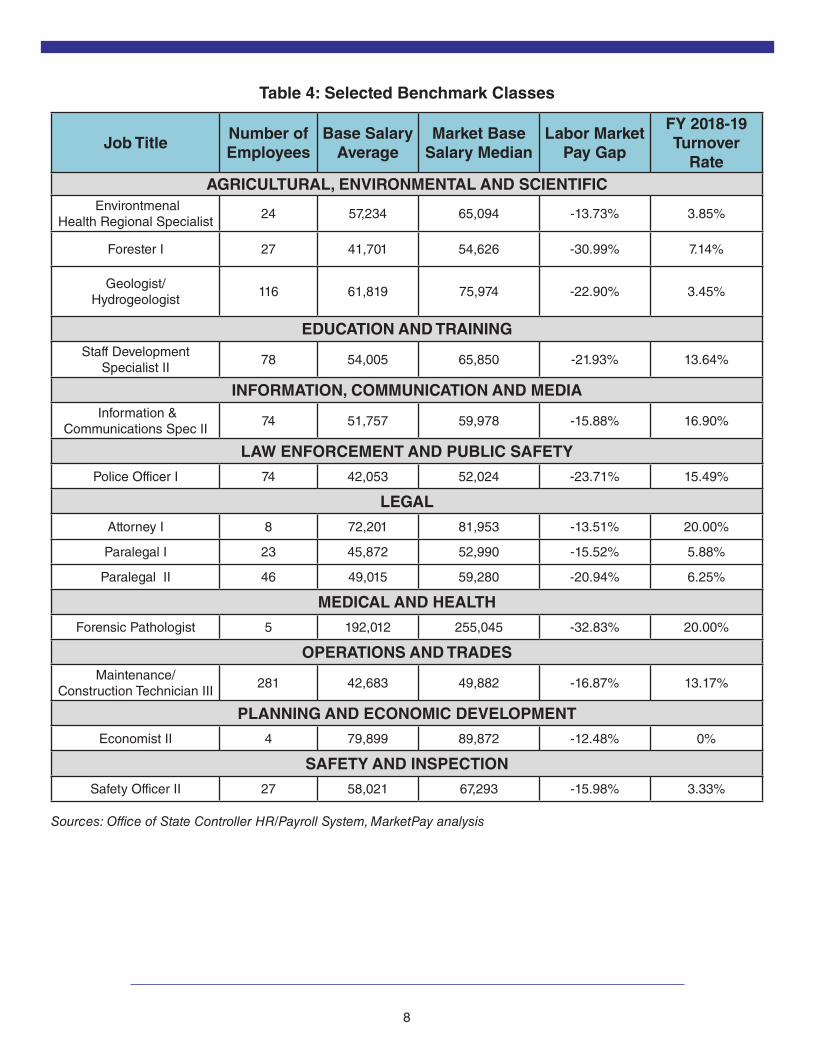
Market Pricing FindingsMarket data was collected for 30 benchmark classes representing approximately 19% of the State’s workforce (agencies only, universities not included) with jobs from each of 19 major Job Families. This report indicates that the 2019 average salary for 13 of the 30 classes (43%) trailed their composite market rates by at least 10%.
Table 4 lists the benchmark classes that trail the market by greater than 10% as shown under “Labor Market Pay Gap.” Additional data regarding all benchmark classes can be found in Appendix E. Several classifications in business critical areas such as Corrections, Engineering, Information Technology, and Medical and Health were selected as benchmarks and are included in Appendix E, but are not included in Table 4 because they now lag the market by less than 10%.
Base Pay and Labor Market Analysis
8
Table 4: Selected Benchmark Classes
Job TitleNumber of Employees
Base Salary Average
Market Base Salary Median
Labor Market Pay Gap
FY 2018-19Turnover
RateAGRICULTURAL, ENVIRONMENTAL AND SCIENTIFIC
EnvirontmenalHealth Regional Specialist
24 57,234 65,094 -13.73% 3.85%
Forester I 27 41,701 54,626 -30.99% 7.14%
Geologist/Hydrogeologist
116 61,819 75,974 -22.90% 3.45%
EDUCATION AND TRAININGStaff Development
Specialist II78 54,005 65,850 -21.93% 13.64%
INFORMATION, COMMUNICATION AND MEDIA Information &
Communications Spec II74 51,757 59,978 -15.88% 16.90%
LAW ENFORCEMENT AND PUBLIC SAFETY
Police Officer I 74 42,053 52,024 -23.71% 15.49%
LEGAL
Attorney I 8 72,201 81,953 -13.51% 20.00%
Paralegal I 23 45,872 52,990 -15.52% 5.88%
Paralegal II 46 49,015 59,280 -20.94% 6.25%
MEDICAL AND HEALTH
Forensic Pathologist 5 192,012 255,045 -32.83% 20.00%
OPERATIONS AND TRADESMaintenance/
Construction Technician III281 42,683 49,882 -16.87% 13.17%
PLANNING AND ECONOMIC DEVELOPMENT
Economist II 4 79,899 89,872 -12.48% 0%
SAFETY AND INSPECTION
Safety Officer II 27 58,021 67,293 -15.98% 3.33%
Sources: Office of State Controller HR/Payroll System, MarketPay analysis
9
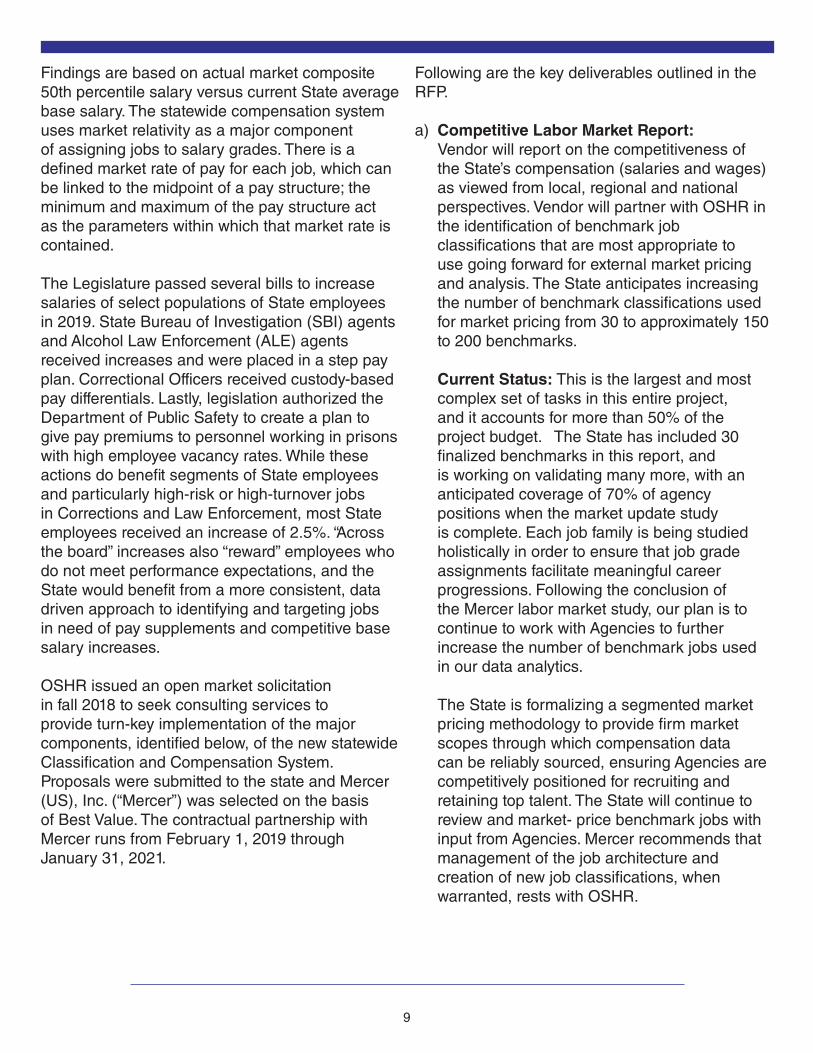
Findings are based on actual market composite 50th percentile salary versus current State average base salary. The statewide compensation system uses market relativity as a major component of assigning jobs to salary grades. There is a defined market rate of pay for each job, which can be linked to the midpoint of a pay structure; the minimum and maximum of the pay structure act as the parameters within which that market rate is contained.
The Legislature passed several bills to increase salaries of select populations of State employees in 2019. State Bureau of Investigation (SBI) agents and Alcohol Law Enforcement (ALE) agents received increases and were placed in a step pay plan. Correctional Officers received custody-based pay differentials. Lastly, legislation authorized the Department of Public Safety to create a plan to give pay premiums to personnel working in prisons with high employee vacancy rates. While these actions do benefit segments of State employees and particularly high-risk or high-turnover jobs in Corrections and Law Enforcement, most State employees received an increase of 2.5%. “Across the board” increases also “reward” employees who do not meet performance expectations, and the State would benefit from a more consistent, data driven approach to identifying and targeting jobs in need of pay supplements and competitive base salary increases.
OSHR issued an open market solicitation in fall 2018 to seek consulting services to provide turn-key implementation of the major components, identified below, of the new statewide Classification and Compensation System. Proposals were submitted to the state and Mercer (US), Inc. (“Mercer”) was selected on the basis of Best Value. The contractual partnership with Mercer runs from February 1, 2019 through January 31, 2021.
Following are the key deliverables outlined in the RFP.
a) Competitive Labor Market Report: Vendor will report on the competitiveness of the State’s compensation (salaries and wages) as viewed from local, regional and national perspectives. Vendor will partner with OSHR in the identification of benchmark job classifications that are most appropriate to use going forward for external market pricing and analysis. The State anticipates increasing the number of benchmark classifications used for market pricing from 30 to approximately 150 to 200 benchmarks. Current Status: This is the largest and most complex set of tasks in this entire project, and it accounts for more than 50% of the project budget. The State has included 30 finalized benchmarks in this report, and is working on validating many more, with an anticipated coverage of 70% of agency positions when the market update study is complete. Each job family is being studied holistically in order to ensure that job grade assignments facilitate meaningful career progressions. Following the conclusion of the Mercer labor market study, our plan is to continue to work with Agencies to further increase the number of benchmark jobs used in our data analytics. The State is formalizing a segmented market pricing methodology to provide firm market scopes through which compensation data can be reliably sourced, ensuring Agencies are competitively positioned for recruiting and retaining top talent. The State will continue to review and market- price benchmark jobs with input from Agencies. Mercer recommends that management of the job architecture and creation of new job classifications, when warranted, rests with OSHR.

10
b) Pay Plan Analysis: Vendor will examine each of the State’s multiple pay plans (salary structures) and recommend adjustments that support the state’s Total Compensation Philosophy. Current Status: Mercer is using three ”levers” to design each of the salary structures: midpoint progression, salary range width, and number of grades. I. Historically, the State’s midpoint progressions in the general salary structure move from 9% at lower pay grades, to 7% at the highest pay grades. This is contrary to conventional pay plan design. Changes in midpoint progressions typically occur at natural breaks in job levels, e.g., shifts from support/paraprofessional, to professional/supervisory, and to management/ executive levels. II. Mercer is taking a similar approach for the salary range widths of each pay grade. It is common to increase range widths at higher grades to account for the increased complexity at these levels. Wider ranges allow room for more differentiation based on experience and performance.
III. The number of grades in each salary structure will vary depending on what jobs are included in each structure.
The State’s plan for the short-term is to utilize market-driven salary structure increase amounts to ensure that ranges continue to be aligned with market structure movement. OSHR will complete an annual market pricing exercise and monitor salary structure budget survey results to ensure the State’s salary structures remain aligned to market.
c) Sworn Law Enforcement Pay Plan: Vendor will assess and develop a pay plan (salary structure), separate from the State Highway Patrol Pay Plan, that accounts for
Agency sworn law enforcement classifications such as but not limited to: DMV Law Enforcement, Forestry Law Enforcement, Marine Fisheries Law Enforcement, Police Officers, and Wildlife Law Enforcement.
Current Status: The State identified a comprehensive list of sworn law enforcement classifications within Agencies and the University System. Mercer researched law enforcement in targeted public sector peers.
Those peers included the ten largest North Carolina municipalities, as well as six large North Carolina county governments. Mercer is successfully benchmarking 84% of the sworn law enforcement and public safety jobs included in the project benchmark list. A total of 94% of all sworn employees are included in these benchmarks, and 86% of all non- sworn employees are included in these benchmarks. Mercer and OSHR are continuing to analyze the Law Enforcement/Public Safety Job Family, as well as finalize a new sworn law enforcement salary structure. d) University System Classifications: Vendor will assess and recommend whether or not the competency-based Career Banding system should continue to be used, or if University System classifications should transition into the State’s new classification system, or if a separate pay plan should be developed specific to the University System.
Current Status: The UNC System utilizes a banded class structure, called Career Banding, with three competency levels within each class: Contributing, Journey and Advanced. These banded classes allow for multiple career levels for a given job series to be included in a single class, while agency jobs have separate levels (e.g., Accountant I, Accountant II, etc.). Mercer noted that the primary challenge with

11
the Career Banding structure is that the flexibility can lead to inequity. Many banded classes include a wide variety of unique positions, making it difficult to understand the true responsibilities and manage changes in the market for positions within a class. In addition to being harder to stay aligned to the market, banding is also prone to a high degree of subjectivity and no guaranteed career progressions. The Agencies use classifications that adhere to typical job architecture principles. Foundational elements for effective class specifications are in place, and the number of responsibilities is aligned to market (8- 10 responsibilities per job). The State has class specifications for all existing job titles. This type of job architecture aligns midpoints to market, provides a framework to acknowledge performance, and helps define meaningful career paths. In Mercer’s experience with clients in which parts of the organization (Agencies, UNC) have autonomy to manage their human resources with a central governance (OSHR), it is best practice to have a consistent, central set of salary structures. When these salary structures are well-aligned to market, they provide parameters that maintain both internal consistency and competitiveness with the external market. e) Policies and Practices: Vendor will analyze the State’s compensation and salary administration policies and practices with best practice recommendations, ensuring sound fiscal stewardship and adherence to legal and regulatory compliance audit and reporting requirements. Current Status: Salary actions are currently determined by use of pay factors including experience and education, internal equity, specialized skills/training, budget/funding,
performance, market relativity, recruitment/ retention issues, and/or increase in responsibilities. Some or all actions may apply to each salary action across the employee life cycle. Agencies have significant accountability and flexibility in such decision-making.
The State has been limited in its ability to effect change in order to attract, motivate and retain talent given funding has been more reactive than proactive. According to Mercer, market leading organizations have an annual budget to make pay changes for updating the salary structure to market median or to ensure critical hard-to-fill jobs are funded to be market competitive. OSHR is similar to corporate HR and the Agencies utilize an HR system managed by OSHR. Best in class organizations with a similar structure have a governance model for delegation of authority. It includes actions for decision-making collaboration, compensation administration and organizational alignment.
According to Mercer, adjustments in pay are most typically based on employee performance (94% of organizations); relationship between pay level and grade midpoint or market value (73%); and, internal equity (58%). Adjustments are typically set as a percentage of payroll for each organization, with an annual adjustment of ~3% being most prevalent in recent years; this would be applied across all employees but at different levels. As an example, for more critical jobs or high performing employees, a larger percentage may be applied. It is not best practice to provide the same increase to all employees each year.

12
Use of Salary Adjustment FundingOne tool, when available, that has helped keep salaries competitive in the past is the Salary Adjustment Fund (SAF). The SAF is used to increase salaries in certain occupational groups, such as those listed in Table 4, where some salaries are significantly below the market and turnover is trending up. Metrics such as compa-ratio (salary related to market average), turnover, vacancy rates and time-to-fill (how long it takes to fill a vacancy) are considered when making SAF distribution recommendations. Also used in this analysis is hard-to-recruit positions. The primary funding mechanism, transferring legislative increase funds remaining after employees receive their legislative increase, is often inadequate to address occupational areas where salaries are below the market. No SAF was allocated for FY 2018-2019. In 2017, the SAF for FY 2017-18 allocated $5,000,000 for salary increases in the University System and the executive, judicial and legislative branches. No SAF was allocated for FY 2016-2017.
*Given the uncertainty of labor markets in the wake of COVID 19, it is unclear what competitive labor rates will be in the coming fiscal year. It is anticipated that there may be an increased demand for many front line employees across a broad range of types of positions, while other groups of employees have found much higher than anticipated levels of unemployment. It is unclear if these changes are temporary or permanent.
Recruitment and RetentionMany factors affect the capacity of an organization to recruit and retain a competent and high performing workforce. Given the organizational and occupational diversity of North Carolina’s State government, there is no “one size fits all” solution to the myriad recruitment and retention issues facing its managers.
It is worth noting that more than 50% of State physicians, more than 30% of State psychiatrists and psychologists, more than 25% of the employees in the Engineering and IT job families,
and more than 30% of the State employees in the executive/program management job families are eligible to retire in the next five years with unreduced retirement.
There is an increasing gap between the number of State job openings and the number of job seekers applying to fill those position. The State is exploring enhancements in technology that will improve the candidate experience, streamline the hiring process, provide meaningful data analytics, and leverage the efficiencies of a Statewide e-recruiting system while providing recruiting flexibility at the Agency level.
New Hire Demographics/Recruitment StrategiesIt is critical that the State attract and retain high quality, multi-generational employees to create a diverse workforce and talent pipeline that allows for organizational stability, career growth and succession planning. Recruitment of a new generation of workers to create a talent pipeline remained strong for FY 2018-19, with 40% of new hires aged 30 or below.
One way to address this critical issue is through establishment and maintenance of an intern and co-operative education program. The Office of State Human Resources and the state agencies are working to support this as part of the NC Job Ready initiative.
OSHR has formed a strategic partnership with North Carolina College and University career advisors and career placement professionals to broaden and enhance information sharing and communication among State government recruiters and University-based career advisors and job placement professionals. This partnership was formed to address the challenges of attracting needed talent for employment opportunities with the State from the pool of graduates from North Carolina Colleges and Universities striving to find and pursue State government employment opportunities.
Additional Analysis

13
Younger workers and recent graduates only comprise one part of the State’s talent pipeline. It is also important to consider other demographics when considering if the State is meeting its goals of attracting and retaining talent. When it comes to hiring, innovative employers seek talented people, period. In a tight labor market, more employers proactively reach out to potential job candidates with decades of hard-wired knowledge. Recruiting experienced workers provides the State with a depth of knowledge and experience, saving time on training needs, bringing valued skills to the table and allowing employees to contribute at a high level immediately.
In addition to recruiting a diverse, multigenerational workforce, a key factor in the State’s talent pipeline is retention, ensuring that employees progress through their careers in the State and continue to invest their knowledge and talent. Retaining current state employees is also fiscally-prudent since it costs more to hire new staff than it does to retain and develop employees. Failure to retain, as demonstrated in the following section on turnover, costs the State and results in valuable knowledge and skills walking out of the door. The compensation and benefits recommendations outlined in this report will assist with recruitment, retention, and keeping the State’s talent pipeline flowing.
Charts on new hires by age and recruitment of 18-25-year-olds are available in Appendix C.
Turnover Rates and CostTurnover rates vary among industries, organizations, geographic locations, departments, occupations, and by employee characteristics such as age, education, and organizational tenure. For example, younger, newer, unskilled, and blue-collar employees tend to be more mobile and have higher turnover rates. For this reason, turnover should be calculated for various categories of interest, as well as for the organization as a whole. For example, an organization may not have a
severe organization-wide turnover rate, but may have a severe departmental turnover rate or a high professional employee turnover rate, which requires appropriate action to alleviate (Source: Society for Human Resources Management).
The cost to an organization for each position turnover has been estimated by experts at anywhere from 50% to 250% of the departing employee’s annual salary depending on the type of position being filled and the performance level of the departing employee. The Human Capital Institute (HCI) places the average value of turnover at 150%. Turnover of top performers may be valued at an exponentially higher rate. There are many factors included in estimating the cost of turnover. Some obvious costs include: advertising the vacancy; salaries of employment screening panels; and, managers’ time spent interviewing candidates. Other costs are not so easily quantified, such as lost productivity – particularly during the time that a position is left vacant during recruitment – or lost knowledge from the organization. Other costs include required onboarding, training, and potentially higher rates of mistakes made by new hires. The high cost of turnover presents a clear argument for Agencies to engage in rigorous workforce development and succession planning. Market-based pay for critical business areas is needed to support employee retention.
Turnover is a measure of employee separations from an Agency or University, most often expressed as turnover rate. Two types of turnover are tracked: total turnover and voluntary turnover. Total turnover includes all separations for any reason. The total turnover rate is calculated by dividing the number of separations by the total number of employees at the beginning of a fiscal year. Voluntary turnover includes separations for reasons that the employee has control of, such as resigning to take a job with another employer. Voluntary turnover rate is calculated by dividing the number of voluntary separations by the total
Additional Analysis
14
number of employees at the beginning of the fiscal year.
Statewide turnover is simply a marker by which to compare job-specific turnover. OSHR works with Agencies and Universities to evaluate job-specific turnover and the reasons behind it, which may or may not relate to pay.
According to The Retention Report published by the Society for Human Resources Management (SHRM), the three top specific reasons for employees to leave their jobs are: career development (21%), work-life balance (13%), and manager behavior (11%). According to a World-at-Work (WaW) article published in February 2020, more workers are planning to change jobs in 2020 than in 2019. WaW cites “lack of recognition” (19%) as one of the top-three reasons why employees are looking for or considering leaving their jobs, after compensation (52%) and career growth (43%). WaW also points to a decline in leadership’s commitment to culture and employee experience, as well as employers not seeking or acting on employee feedback as factors influencing turnover.
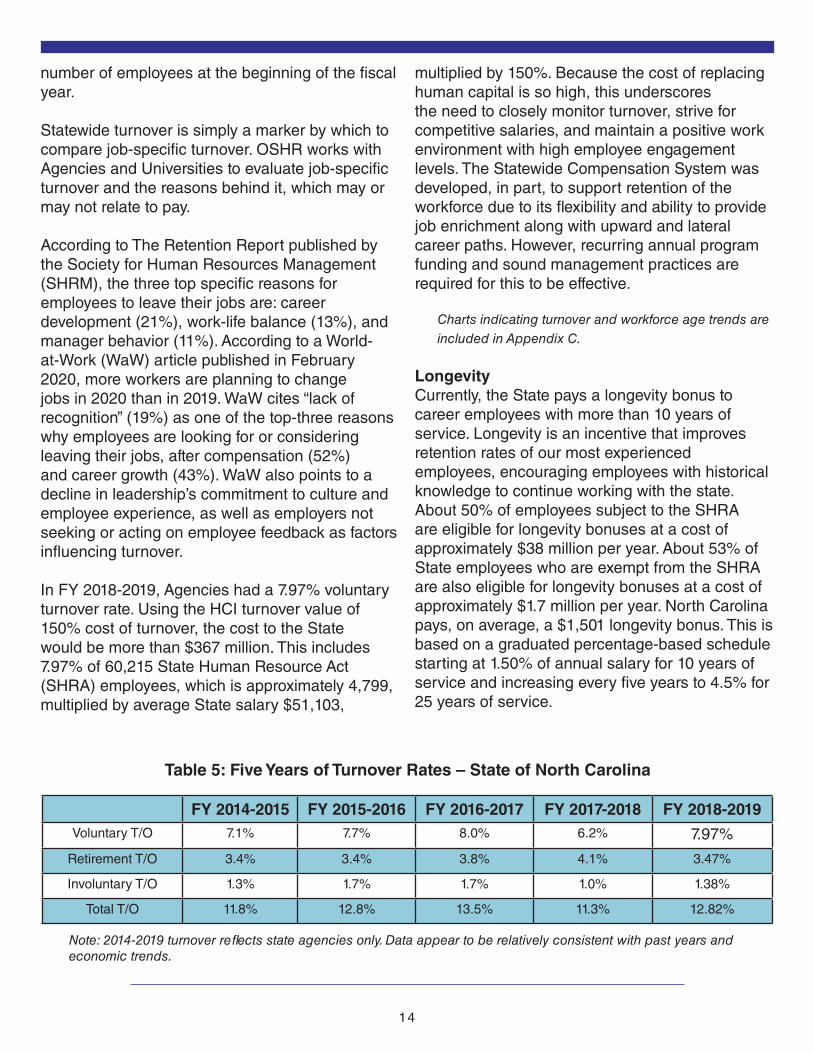
In FY 2018-2019, Agencies had a 7.97% voluntary turnover rate. Using the HCI turnover value of 150% cost of turnover, the cost to the State would be more than $367 million. This includes 7.97% of 60,215 State Human Resource Act (SHRA) employees, which is approximately 4,799, multiplied by average State salary $51,103,
multiplied by 150%. Because the cost of replacing human capital is so high, this underscores the need to closely monitor turnover, strive for competitive salaries, and maintain a positive work environment with high employee engagement levels. The Statewide Compensation System was developed, in part, to support retention of the workforce due to its flexibility and ability to provide job enrichment along with upward and lateral career paths. However, recurring annual program funding and sound management practices are required for this to be effective.
Charts indicating turnover and workforce age trends are included in Appendix C.
LongevityCurrently, the State pays a longevity bonus to career employees with more than 10 years of service. Longevity is an incentive that improves retention rates of our most experienced employees, encouraging employees with historical knowledge to continue working with the state. About 50% of employees subject to the SHRA are eligible for longevity bonuses at a cost of approximately $38 million per year. About 53% of State employees who are exempt from the SHRA are also eligible for longevity bonuses at a cost of approximately $1.7 million per year. North Carolina pays, on average, a $1,501 longevity bonus. This is based on a graduated percentage-based schedule starting at 1.50% of annual salary for 10 years of service and increasing every five years to 4.5% for 25 years of service.
Table 5: Five Years of Turnover Rates – State of North Carolina
FY 2014-2015 FY 2015-2016 FY 2016-2017 FY 2017-2018 FY 2018-2019Voluntary T/O 7.1% 7.7% 8.0% 6.2% 7.97%
Retirement T/O 3.4% 3.4% 3.8% 4.1% 3.47%
Involuntary T/O 1.3% 1.7% 1.7% 1.0% 1.38%
Total T/O 11.8% 12.8% 13.5% 11.3% 12.82%
Note: 2014-2019 turnover reflects state agencies only. Data appear to be relatively consistent with past years and economic trends.

15
Paid Parental LeaveOn May 23, 2019, Governor Roy Cooper issued an Executive Order to extend Paid Parental Leave to employees in Cabinet agencies. Several non-Cabinet agencies have opted in to provide the benefit to their employees as well. The Paid Parental Leave benefit is triggered for eligible employees by the qualifying event of becoming a parent by birth, adoption, foster care, or other legal placement of a child. Eligible State employees who give birth will receive eight weeks of paid leave to recover from the birth and to bond with and care for their newborn. Other eligible State employees will receive four weeks of paid leave to bond with and care for the child. Paid Parental Leave will be paid at 100% of the eligible employee’s regular pay.
World-at-Work’s “Paid Time Off/Paid Parental Leave Programs and Practices” survey found that 52% of organizations offer some form of paid parental leave, regardless of their short-term disability offerings. And three in five organizations tout their paid parental leave programs to attract new employees. “The rise in parental leave programs may be a result of state-led mandates, in addition to employers striving for differentiated benefits in a strained labor market — or possibly both,” said Scott Cawood, president and CEO of World-at-Work. “These programs have quickly become an important and expected part of the total rewards equation and are critical in maintaining an engaged and productive workforce.”
Paid Time Off AnalysisPaid Time Off (PTO) referred to here is employees’ time off for which they continue to receive pay. Categories of PTO include Vacation Leave, Sick Leave, and Holiday pay. Below is an analysis of the various types of PTO we offer and our competitiveness with our peer Southeastern states.
VacationBased on comparison to Southeastern states, North Carolina’s vacation accrual rates are competitive.
Sick LeaveSoutheastern states grant an average of 14.25 days per year sick leave for employees with up to three years of service. North Carolina’s sick leave accrual is below the average for all Southeastern states at 12 days per year of employee sick leave.
Benefits Analysis
Table 6: Vacation Leave (in days)
Years of State
Service
North Carolina
SE States
Differential in Days
< 5 14.00 13.5 +0.5
5-10 17.00 16.5 +0.5
10-15 20.00 19.53 +0.47
15-20 23.00 22.44 +0.56
20-25 26.00 25.19 +0.81
25+ 26.00 25.5 +0.5
Source: 2019 NCASG Benefits Survey
Table 7: Sick Leave (in days)
Sick LeaveNorth
CarolinaSE
StatesDifferential
in DaysAccrual 12.0 14.25 -2.25
Source: 2019 NCASG Benefits Survey
16
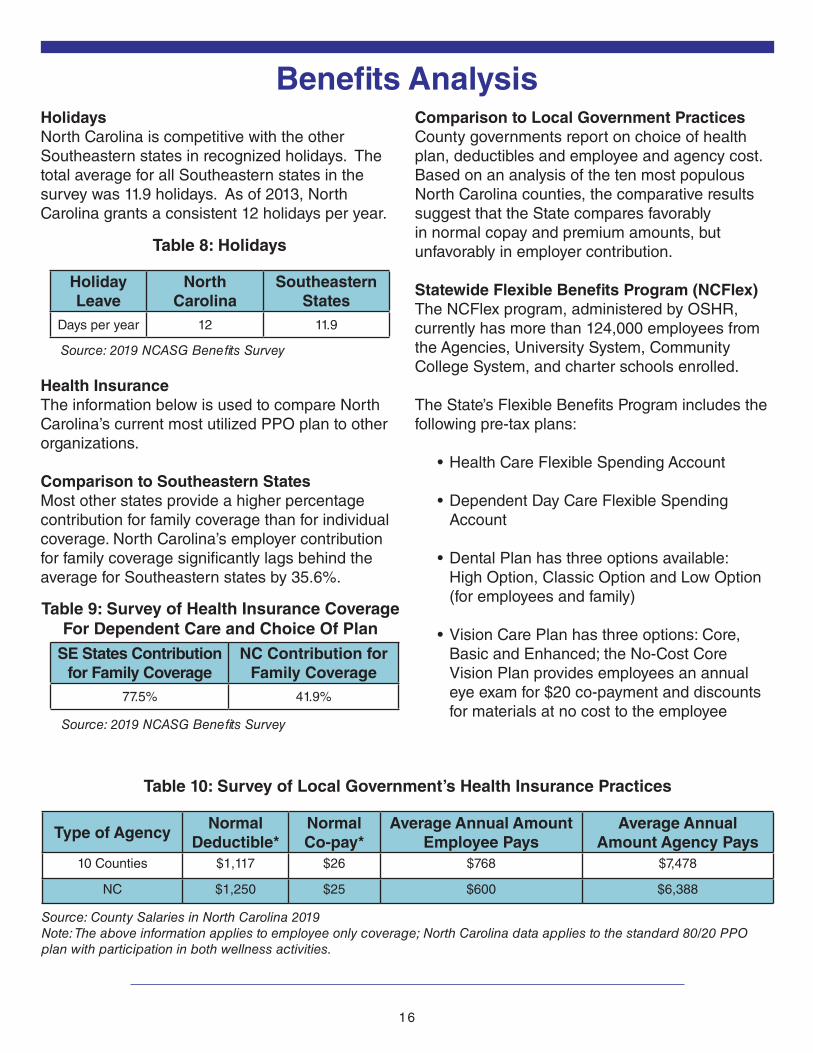
Holidays North Carolina is competitive with the other Southeastern states in recognized holidays. The total average for all Southeastern states in the survey was 11.9 holidays. As of 2013, North Carolina grants a consistent 12 holidays per year.
Health InsuranceThe information below is used to compare North Carolina’s current most utilized PPO plan to other organizations.
Comparison to Southeastern StatesMost other states provide a higher percentage contribution for family coverage than for individual coverage. North Carolina’s employer contribution for family coverage significantly lags behind the average for Southeastern states by 35.6%.
Comparison to Local Government PracticesCounty governments report on choice of health plan, deductibles and employee and agency cost. Based on an analysis of the ten most populous North Carolina counties, the comparative results suggest that the State compares favorably in normal copay and premium amounts, but unfavorably in employer contribution.
Statewide Flexible Benefits Program (NCFlex)The NCFlex program, administered by OSHR, currently has more than 124,000 employees from the Agencies, University System, Community College System, and charter schools enrolled.
The State’s Flexible Benefits Program includes the following pre-tax plans:
• Health Care Flexible Spending Account
• Dependent Day Care Flexible Spending Account
• Dental Plan has three options available: High Option, Classic Option and Low Option (for employees and family)
• Vision Care Plan has three options: Core, Basic and Enhanced; the No-Cost Core Vision Plan provides employees an annual eye exam for $20 co-payment and discounts for materials at no cost to the employee
Benefits Analysis
Table 8: Holidays
Holiday Leave
North Carolina
Southeastern States
Days per year 12 11.9
Source: 2019 NCASG Benefits Survey
Table 9: Survey of Health Insurance Coverage For Dependent Care and Choice Of Plan
SE States Contribution for Family Coverage
NC Contribution for Family Coverage
77.5% 41.9%
Source: 2019 NCASG Benefits Survey
Table 10: Survey of Local Government’s Health Insurance Practices
Type of AgencyNormal
Deductible*Normal Co-pay*
Average Annual Amount Employee Pays
Average Annual Amount Agency Pays
10 Counties $1,117 $26 $768 $7,478
NC $1,250 $25 $600 $6,388
Source: County Salaries in North Carolina 2019Note: The above information applies to employee only coverage; North Carolina data applies to the standard 80/20 PPO plan with participation in both wellness activities.

17
• Voluntary Accidental Death & Dismemberment Insurance (for employees and family)
• Core Voluntary Accidental Death & Dismemberment Insurance (employees only); provides $10,000 of AD&D coverage at no cost to enrolled employees
• Voluntary Group Term Life Insurance (for employee and family); provides new employees up to $200,000 of guaranteed coverage and employees may be eligible for coverage up to $500,000
• TRICARE Supplemental Insurance provides a supplemental insurance plan to military retirees and qualified National Guard and Reserve Members • Cancer Insurance offers three options: Premium, High and Low Option
• Critical Illness Insurance with $15,000 and $25,000 Option • Accident Insurance • Disability Insurance (new offering for 2019, with approximately 11,200 employees enrolled)
Diversity of benefits will continue to be a major factor in the State’s ability to compete for talent. The 2019 Employee Benefits Survey, administered by SHRM in April 2019, assessed the prevalence of more than 250 benefits. SHRM reported that employers were more likely to increase offerings in all benefits categories than to decrease offerings. No more than 3% of organizations decreased benefits in any category since 2018. Health-related benefits and wellness benefits saw the greatest increases across employers surveyed, with 20% of employers indicating they increased offerings in those areas.
RetirementIn North Carolina, the 2018 employer contribution on behalf of employees in the Teachers & State Employees Retirement System (TSERS) was 19.7%. This includes contributions to the retirement systems pension fund, death benefit trust fund, retiree health plan reserve and disability income plan. The state’s contribution to the pension fund only is currently 12.97%.
Supplemental Retirement ProgramsBesides the traditional retirement program, the State offers voluntary supplemental retirement programs: a 401(k) plan, a 457(b) plan and a 403(b) plan. North Carolina does not match employee contributions.
A review of the past three years reveals that more than half of North Carolina’s 100 counties have consistently made matching 401(k) contributions in addition to a defined contribution plan. In 2019, 91 of 94 reporting counties offered an employer match or contribution. North Carolina State Government provides no contribution to 401(k) except for law enforcement employees. By not offering a match, the State of North Carolina is not considered competitive in this area.
Benefits Analysis
18
Appendix
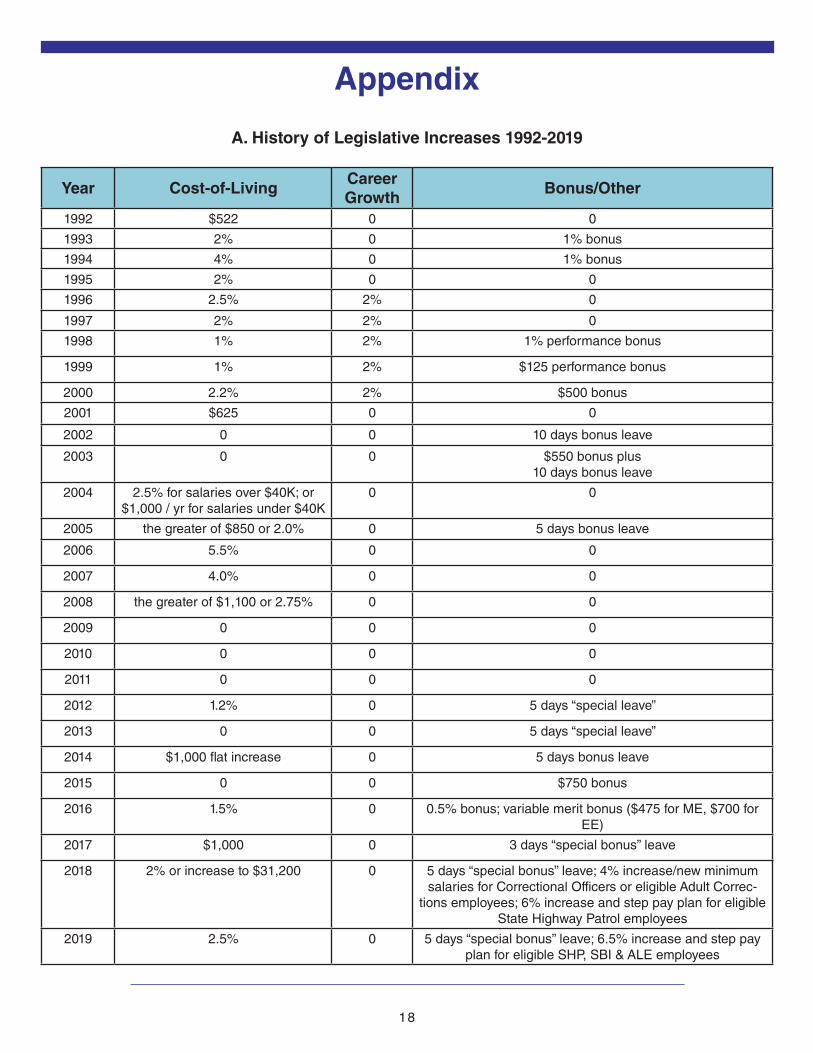
A. History of Legislative Increases 1992-2019
Year Cost-of-LivingCareer Growth
Bonus/Other
1992 $522 0 0
1993 2% 0 1% bonus
1994 4% 0 1% bonus
1995 2% 0 0
1996 2.5% 2% 0
1997 2% 2% 0
1998 1% 2% 1% performance bonus
1999 1% 2% $125 performance bonus
2000 2.2% 2% $500 bonus
2001 $625 0 0
2002 0 0 10 days bonus leave
2003 0 0 $550 bonus plus10 days bonus leave
2004 2.5% for salaries over $40K; or $1,000 / yr for salaries under $40K
0 0
2005 the greater of $850 or 2.0% 0 5 days bonus leave
2006 5.5% 0 0
2007 4.0% 0 0
2008 the greater of $1,100 or 2.75% 0 0
2009 0 0 0
2010 0 0 0
2011 0 0 0
2012 1.2% 0 5 days “special leave”
2013 0 0 5 days “special leave”
2014 $1,000 flat increase 0 5 days bonus leave
2015 0 0 $750 bonus
2016 1.5% 0 0.5% bonus; variable merit bonus ($475 for ME, $700 for EE)
2017 $1,000 0 3 days “special bonus” leave
2018 2% or increase to $31,200 0 5 days “special bonus” leave; 4% increase/new minimum salaries for Correctional Officers or eligible Adult Correc-
tions employees; 6% increase and step pay plan for eligible State Highway Patrol employees
2019 2.5% 0 5 days “special bonus” leave; 6.5% increase and step pay plan for eligible SHP, SBI & ALE employees
19
Appendix
B. NC Pay Comparison To CPI and Average Market Movement
Source: Mercer US Compensation Planning Survey 2009-2019, WorldatWork
Notes: The greater of $1,100 or 2.75% for 2008; $1,000 flat increase for 2014 (2.3% average base pay); $1,000 flat increase for 2017 (2.1% average base pay); the greater of increase to $31,200 or 2% for 2018, with 4%/new min-imum salaries for eligible employees in Adult Corrections and 6%/step pay plan for eligible State Highway Patrol employees.
22
2.1%2.3%
2.7% 2.7% 2.8% 2.9% 2.8% 2.8% 2.80% 2.80%
3.50%
2.2%2.5%
2.8% 2.8% 2.9% 3.0% 3.0% 3.0% 3.0% 3.1% 3.2%
0.0% 0.0% 0.0%
1.2%
0.0%
2.3%
0.0%
1.5%
2.10% 2%
2.50%
0.0%
0.5%
1.0%
1.5%
2.0%
2.5%
3.0%
3.5%
4.0%
2009 2010 2011 2012 2013 2014 2015 2016 2017 2018 2019
Mercer Market Movement WorldatWork Market Movement Legislative Increase
0.0%
5.0%
10.0%
15.0%
20.0%
25.0%
30.0%
35.0%
Mercer WorldatWork Legislative Increase
20
Appendix
Sources: US Department of Labor/Bureau of Labor Statistics and the NC Office of State Human Resources
Notes: The greater of $1,100 or 2.75% for 2008; CPI 2.2% as of end of October 2012; $1,000 flat increase for 2014 (2.3% average base pay); $1,000 flat increase for 2017 (2.1% average base pay); the greater of increase to $31,200 or 2% for 2018, with 4%/new minimum salaries for eligible employees in Adult Corrections and 6%/step pay plan for eligible State Highway Patrol employees.
22
Comparison of CPI with Legislative Increases (COLA Only)
Sources: US Department of Labor/Bureau of Labor Statistics and the NC Office of State Human Resources Notes: The greater of $1,100 or 2.75% for 2008; CPI 2.2% as of end of October 2012; $1,000 flat increase for 2014 (2.3% average base pay); $1,000 flat increase for 2017 (2.1% average base pay); the greater of increase to $31,200 or 2% for 2018, with 4%/new minimum salaries for eligible employees in Adult Corrections and 6%/step pay plan for eligible State Highway Patrol employees.
1.5% 1.5%
3.0%
2.2%
1.6%
0.8% 0.7%
2.10%
2.50% 2.50%2.30%
0.0% 0.0% 0.0%
1.2%
0.0%
2.3%
0.0%
1.50%
2.10% 2%
2.50%
0.0%
0.5%
1.0%
1.5%
2.0%
2.5%
3.0%
3.5%
2009 2010 2011 2012 2013 2014 2015 2016 2017 2018 2019
CONSUMER PRICE INDEX VS LEGISLATIVE INCREASE 2009-2019
Consumer Price Index Legislative Increase
20.7%
11.6%
0.0%
5.0%
10.0%
15.0%
20.0%
25.0%
Consumer Price Index Legislative Increase
Total Consumer Price Index vs Total Legislative Increases 2009-2019
B. NC Pay Comparison To CPI and Average Market Movement

21
Appendix
C. Workforce Turnover and Aging Trends
24
C. Workforce Turnover and Aging Trends
0.00%
2.00%
4.00%
6.00%
8.00%
10.00%
12.00%
14.00%
16.00%
FY 14-15 FY 15-16 FY 16-17 FY 17-18 Fy18-19
Five Years of Turnover Rates
voluntary retirement involuntary total
9931616
22461379
879
4928
82128734
5158 5253
0
2000
4000
6000
8000
10000
FY 14-15 FY 15-16 FY 16-17 FY 17-18 FY18-19
18-25 Year Olds vs Total New Hires State Government
18-25 YO Total New Hires

22
Appendix
C. Workforce Turnover and Aging Trends
25
0
50
100
150
200
250
300
350
19 21 23 25 27 29 31 33 35 37 39 41 43 45 47 49 51 53 55 57 59 61 63 65 67 69 71 73
Count of New Hires by Age FY 18-19
New Hires
38 38 38 38 39 39 39 39 40 40 41 42 43 44 45 46 4845 46 45 46 46 46 46 46 46 47 46 46
0
10
20
30
40
50
60
1991
1992
1993
1994
1995
1996
1997
1998
1999
2000
2001
2002
2003
2004
2005
2006
2007
2008
2009
2010
2011
2012
2013
2014
2015
2016
2017
2018
2019
AVER
AGE
AGE
YEAR
AVERAGE AGE OF N.C. STATE EMPLOYEES 1991-2019

23
Appendix
D. Market Survey Library
OSHR Survey Library 2019*Capital Associated Industries Capital Associated Industries NC Wage, 2018
CompData Surveys CompData Accounting Service Suite, 2018
CompData Surveys CompData Engineering Service Suite, 2018
CompData Surveys CompData Health Care - National, 2018
CompData Surveys CompData Legal Service Suite, 2018
CompData Surveys CompData Not-For-Profit - National, 2018
CompData Surveys CompData Physicians 2018
Mercer Mercer Finance, Accounting & Legal, 2018
Mercer Mercer FSS Insurance, 2018
Mercer Mercer Human Resources, 2018
Mercer Mercer Information Technology, 2018
Mercer Mercer Logistics & Supply Chain, 2018
Mercer Mercer Metro Benchmark - National, 2018
Mercer Mercer Sales, Mktg & Comm, 2018
Mercer Mercer IHN - Physician Practices/Clinics, 2018
Mercer Mercer IHN - Skilled Nursing/Assisted Living Facilities, 2018
Mercer Mercer IHN - Home Health/Hospice, 2018
Mercer Mercer IHN COMBO Healthcare Sys & Hosp Execs, 2018
Mercer Mercer IHN Hospital Executives, 2018
Mercer Mercer IHN Healthcare System Executives, 2018
Mercer Mercer IHN - Healthcare Provider Individual Contributors, 2018
Mercer Mercer IHN - Healthcare Management & Supervisory, 2018
Mercer Mercer IHN - Healthcare Informatics & Technology, 2018
National Compensation Association of State Governments
NCASG State Governments, 2018
PayScale Company Sourced PayScale Beta Company Sourced National Survey - September, 2017
PayScale Company Sourced PayScale Company Sourced National - April, 2018
PayScale Company Sourced PayScale Company Sourced National - July, 2018
PayScale Company Sourced PayScale Company Sourced National Survey - January, 2018
Western Management Group Western Management Group CompBase - Winter, 2018
Willis Towers Watson WTW CSR Submission Report (PARTICIPATION ONLY), 2018
Willis Towers Watson WTW General Industry Executive, 2018
Willis Towers Watson WTW Health Care Admin and Support, 2018
Willis Towers Watson WTW Health Care Clinical and Professional, 2018
Willis Towers Watson WTW Health Care Executive & Mgmt, 2018
NC County Survey NC County Salary Survey 2017-2018
*The market update project started in pricing year 2018 and is ongoing, so OSHR is maintaining its current survey inventory.

24
Appendix
E. Benchmark Classes and Labor Market Analysis
BENCHMARK CLASSESLabor Market Data Summary (State Agencies Only, Does Not Include Universities)
Job TitleNumber of Employees
Base Salary Average
Market Base Salary
Median*
Labor Market Pay Gap
FY 2018-19Turnover
Rate**ADMINISTRATIVE SUPPORT
Administrative Associate I 131 33,398 31,038 7.07% 13.14%
AGRICULTURAL, ENVIRONMENTAL AND SCIENTIFICEnvironmental Health Regional Specialist
24 57,234 65,094 -13.73% 3.85%
Forester I 27 41,701 54,626 -30.99% 7.14%
Geologist/Hydrogeologist 116 61,819 75,974 -22.90% 3.45%
CORRECTIONSCorrectional Officer II 3338 36,050 39,386 -9.25% 26.13%
EDUCATION AND TRAININGStaff Development
Specialist II78 54,005 65,850 -21.93% 13.64%
ENGINEERING
Architect I 3 64,171 62,138 3.17% 16.67%
Engineering Technician III 274 59,955 56,104 6.42% 7.45%
FINANCIAL & BUSINESS MANAGEMENT
Accountant II 86 64,333 60,709 5.63% 5.21%
Auditor II 48 71,688 61,539 14.16% 7.32%
HUMAN RESOURCESAgency HR Consultant II 60 65,482 67,242 -2.69% 10.91%
HUMAN SERVICES
Social Worker 169 49,644 52,497 -5.75% 10.37%
INFORMATION, COMMUNICATION AND MEDIAInformation &
Communications Spec II74 51,757 59,978 -15.88% 16.90%
INFORMATION TECHNOLOGYApplications Systems
Analyst I279 78,834 66,835 15.22% 10.80%

25
Appendix
Job TitleNumber of Employees
Base Salary Average
Market Base Salary
Median*
Labor Market Pay Gap
FY 2018-19Turnover
Rate**INSTITUTIONAL SUPPORT
Cook 161 32,156 28,403 11.67% 12.03%
Housekeeper 487 31,871 25,956 18.56% 13.31%
LAW ENFORCEMENT AND PUBLIC SAFETY
Police Officer I 74 42,053 52,024 -23.71% 15.49%
LEGAL
Attorney I 8 72,201 81,953 -13.51% 20.00%
Paralegal I 23 45,872 52,990 -15.52% 5.88%
Paralegal II 46 49,015 59,280 -20.94% 6.25%
MEDICAL AND HEALTHForensic Pathologist 5 192,012 255,045 -32.83% 20.00%
Health Care Technician I 3443 32,036 31,569 1.46% 19.54%
Registered Nurse 914 62,254 66,875 -7.42% 23.00%
NATURAL, HISTORIC AND CULTURAL RESOURCES
Library Technician 16 38,215 37,655 1.47% 6.67%
OPERATIONS AND TRADESMaintenance/
Construction Technician III281 42,683 49,882 -16.87% 13.17%
Vehicle/Equipment Repair Technician II
382 48,188 46,818 2.84% 10.77%
PLANNING AND ECONOMIC DEVELOPMENT
Economist II 4 79,899 89,872 -12.48% 0%
PROGRAM MANAGEMENTDriver License Examiner I 427 39,435 34,556 12.37% 13.72%
Volunteer Services Coordinator
14 39,407 42,358 -7.49% 23.08%
SAFETY AND INSPECTION
Safety Officer II 27 58,021 67,293 -15.98% 3.33%
*Based on preliminary findings of the Market Update Study**Certain jobs with a small number of incumbents may report a very high turnover rate due to one or two departures , or a zero turnover rate due to no departures

This online document was produced by the Office of State Human Resources in July 2020.
2 0 2 0 C O M P E N S AT I O N A N D B E N E F I T S R E P O RT
BA R BA R A G I B S O N State Human Resources Director
A N D R E A C L I N K S CA L E STotal Rewards Division Director