report to the east williston school district board of
TRANSCRIPT
Report to the East Williston School District Board of Trustees and Administration from The East Williston Financial Advisory Committee
Delivered to the East Williston School District Board of Trustees
Dated April 11, 2018

Introduction
2
Introduce the Financial Advisory Committee
Discuss the the Tax Cap, Tax Levy and property taxes
Provide background context of the budget cost drivers
Assess the current environment for schools
Review growth trends & benchmarking
Review Student data
Discuss Capital needs & funding
Review a forecast & implications for long-term planning
Provide recommendations to the Board
3
Presentation Agenda

Advise the Board on strategies for delivering a high quality
education to students in a fiscally responsible manner
Maintain professional and absolute objectivity
Provide feedback, insight and analysis
Increase and facilitate transparency
Foster open lines of communication
4
Financial Advisory Committee
Role of the FAC
Ashish Chabria 20+ years banking, finance, accounting and strategy
Gaddy Cohen 20+ years accounting & finance, MBA/CPA
Alan Goldstein 30+ years finance & operations management, CPA
Larry Posner 25+ years financial & mgmt experience, MBA/CPA
Alvin Sarabanchong 20+ years finance, trading & operations management
5
FAC Committee Members
Comprised of volunteers with financial backgrounds
Recommended 2018-19 budget
Budget cost drivers and recent trends
Tax Cap and implications for future funding
Funding mechanisms for capital projects
Budget forecast
6
Focus of the FAC
Our current review focused on:

Background & Tax Cap
7
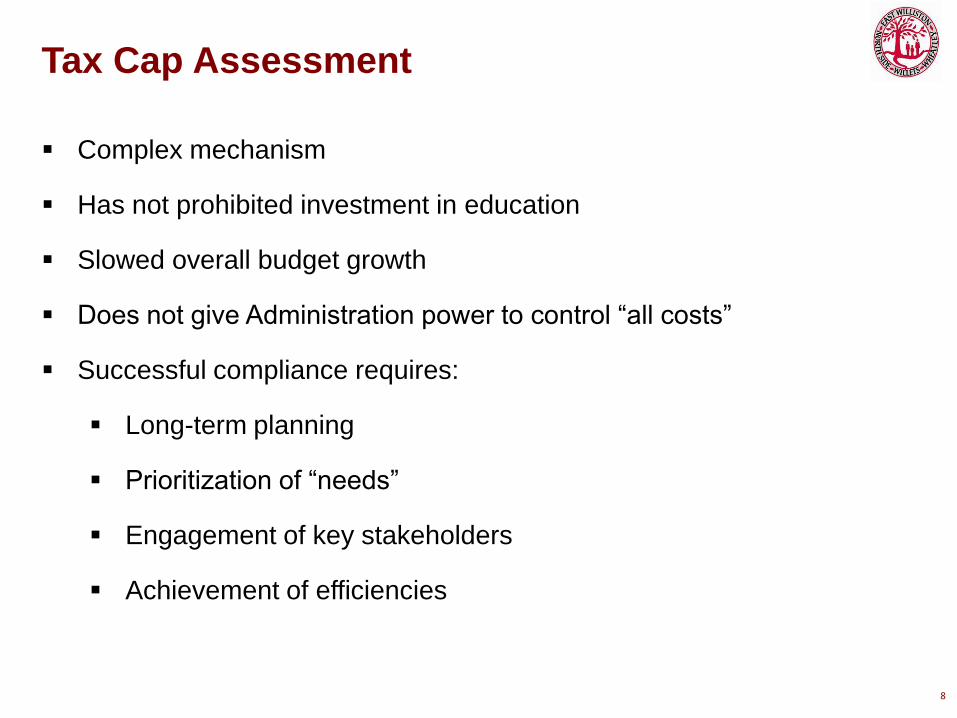
Complex mechanism
Has not prohibited investment in education
Slowed overall budget growth
Does not give Administration power to control “all costs”
Successful compliance requires:
Long-term planning
Prioritization of “needs”
Engagement of key stakeholders
Achievement of efficiencies
8
Tax Cap Assessment
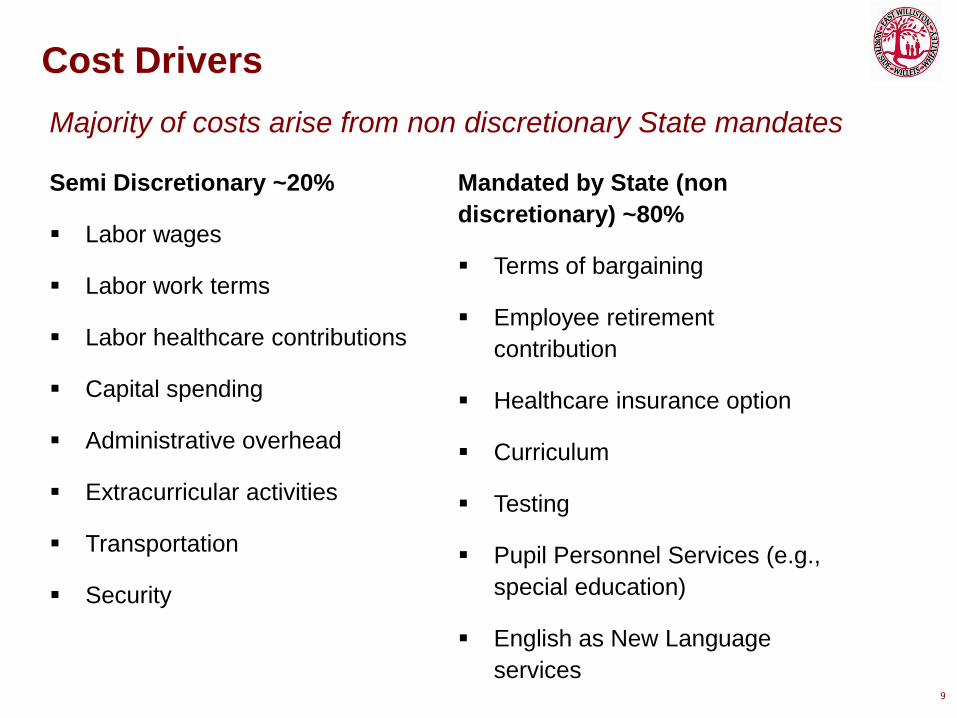
Semi Discretionary ~20%
Labor wages
Labor work terms
Labor healthcare contributions
Capital spending
Administrative overhead
Extracurricular activities
Transportation
Security
9
Cost Drivers
Mandated by State (non
discretionary) ~80%
Terms of bargaining
Employee retirement
contribution
Healthcare insurance option
Curriculum
Testing
Pupil Personnel Services (e.g.,
special education)
English as New Language
services
Majority of costs arise from non discretionary State mandates

School Environment
10
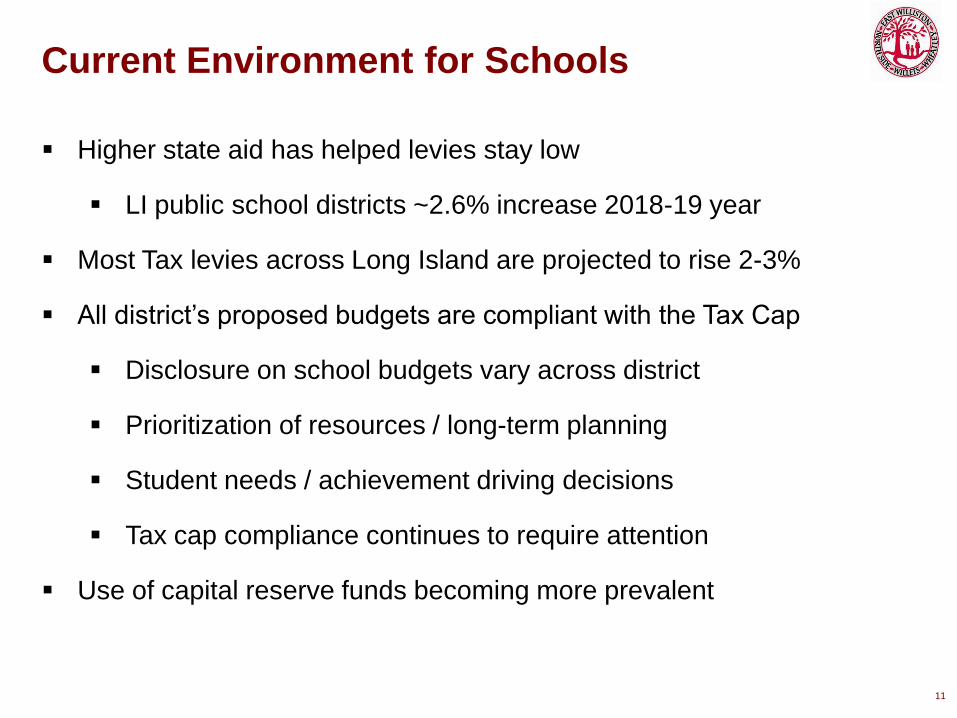
Higher state aid has helped levies stay low
LI public school districts ~2.6% increase 2018-19 year
Most Tax levies across Long Island are projected to rise 2-3%
All district’s proposed budgets are compliant with the Tax Cap
Disclosure on school budgets vary across district
Prioritization of resources / long-term planning
Student needs / achievement driving decisions
Tax cap compliance continues to require attention
Use of capital reserve funds becoming more prevalent
11
Current Environment for Schools
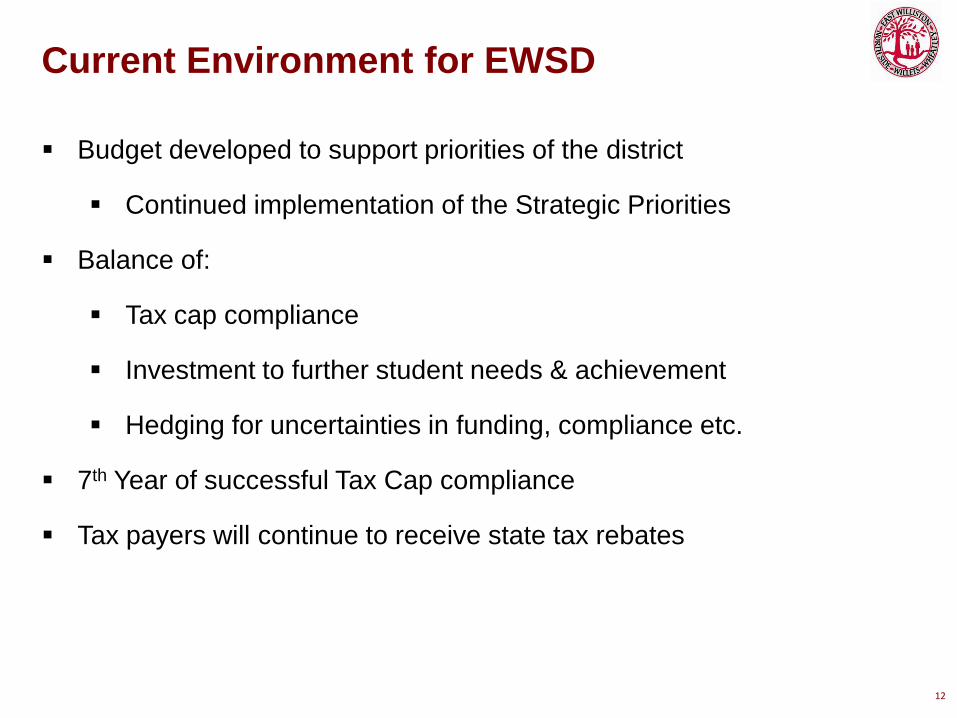
Budget developed to support priorities of the district
Continued implementation of the Strategic Priorities
Balance of:
Tax cap compliance
Investment to further student needs & achievement
Hedging for uncertainties in funding, compliance etc.
7th Year of successful Tax Cap compliance
Tax payers will continue to receive state tax rebates
12
Current Environment for EWSD

Tax Levy
13
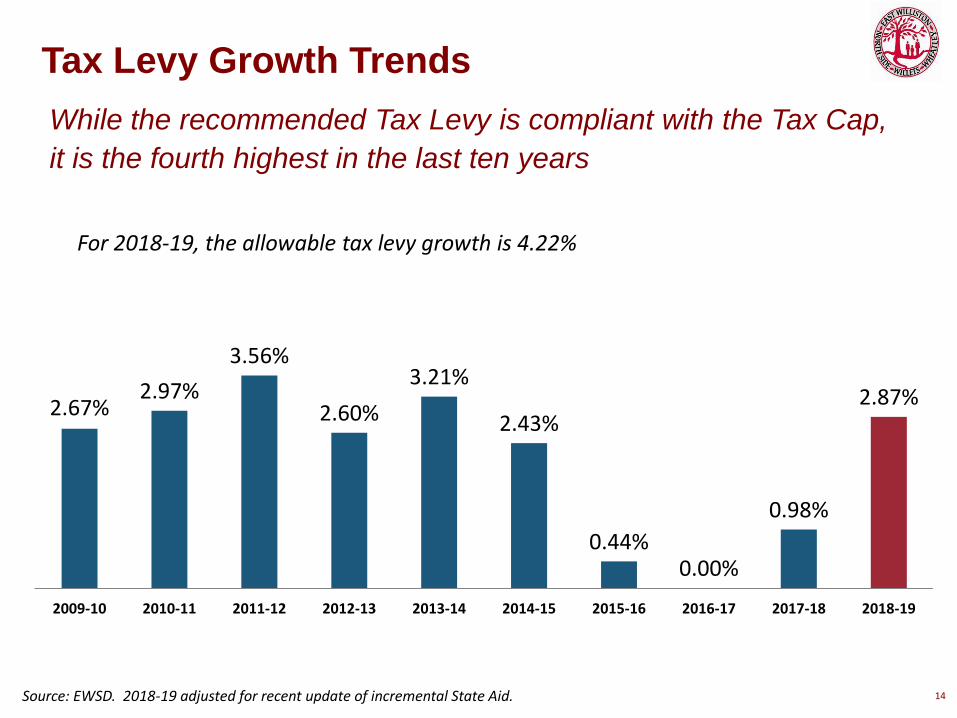
2.67% 2.97%
3.56%
2.60%
3.21%
2.43%
0.44% 0.00%
0.98%
2.87%
2009-10 2010-11 2011-12 2012-13 2013-14 2014-15 2015-16 2016-17 2017-18 2018-19
14
Tax Levy Growth Trends
While the recommended Tax Levy is compliant with the Tax Cap,
it is the fourth highest in the last ten years
Source: EWSD. 2018-19 adjusted for recent update of incremental State Aid.
For 2018-19, the allowable tax levy growth is 4.22%
15
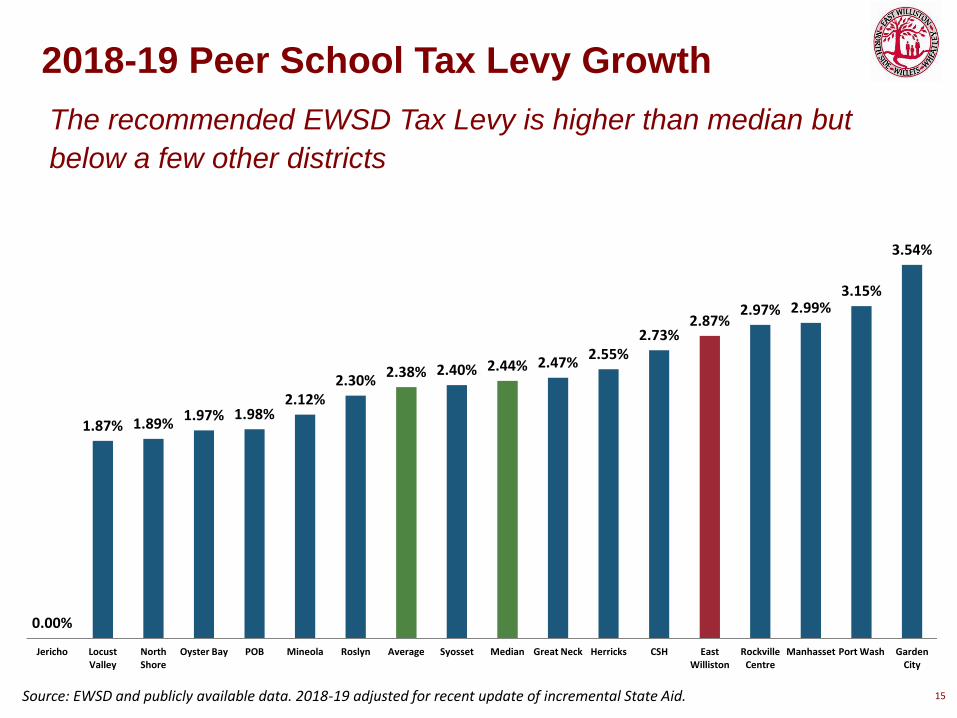
2018-19 Peer School Tax Levy Growth
The recommended EWSD Tax Levy is higher than median but
below a few other districts
0.00%
1.87% 1.89% 1.97% 1.98%
2.12% 2.30%
2.38% 2.40% 2.44% 2.47% 2.55%
2.73% 2.87%
2.97% 2.99% 3.15%
3.54%
Jericho Locust Valley
North Shore
Oyster Bay POB Mineola Roslyn Average Syosset Median Great Neck Herricks CSH East Williston
Rockville Centre
Manhasset Port Wash Garden City
Source: EWSD and publicly available data. 2018-19 adjusted for recent update of incremental State Aid.

16
Source of Funds for School Budget
Source: EWSD. $ in thousands. 2018-19 adjusted for recent update of incremental State Aid.
Tax Levy accounts for substantial majority of funds for budget
Growth Rate
2017-18 2018-19 5-Year 1-Year
Property Tax Levy 52,956 54,473 1.3% 2.9%
Non-tax Revenue 4,791 4,816 10.9% 0.5%
Appropriated Fund Balance 544 544 0.0% 0.0%
Total Funds Avail for Budget 58,290 59,833 1.9% 2.6%
% of Total Budget
Property Tax Levy 90.8% 91.0%
Non-tax Revenue 8.2% 8.0%
Appropriated Fund Balance 0.9% 0.9%
17
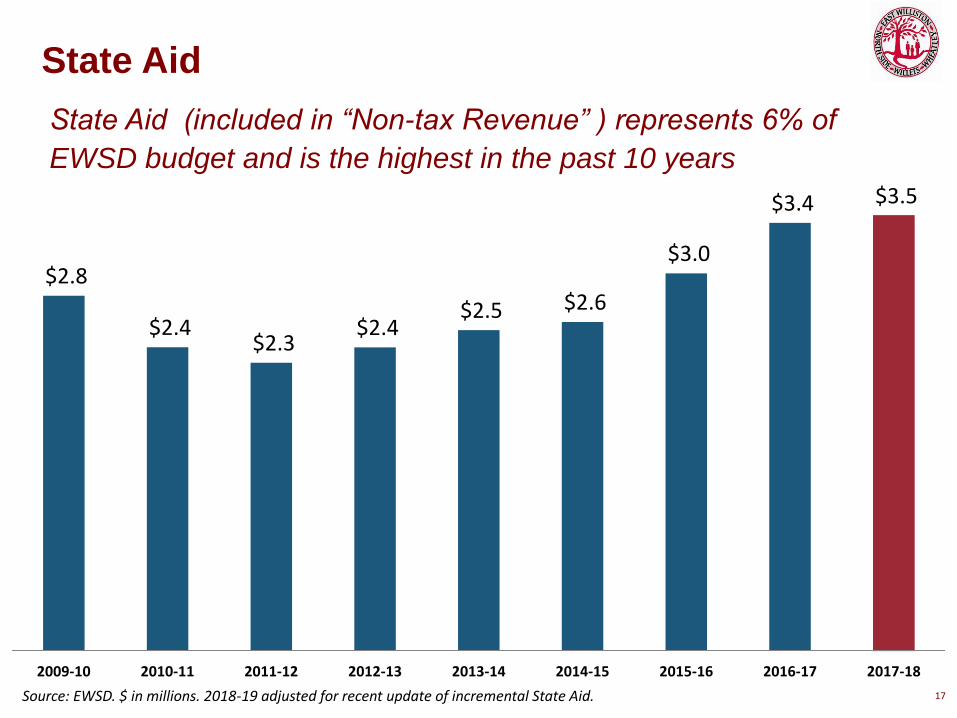
State Aid
State Aid (included in “Non-tax Revenue” ) represents 6% of
EWSD budget and is the highest in the past 10 years
$2.8
$2.4 $2.3
$2.4 $2.5 $2.6
$3.0
$3.4 $3.5
2009-10 2010-11 2011-12 2012-13 2013-14 2014-15 2015-16 2016-17 2017-18
Source: EWSD. $ in millions. 2018-19 adjusted for recent update of incremental State Aid.

18
Tax Levy Growth & Your Taxes
EWSD sets tax levy, Nassau County determines how to get it
Source: Per Nassau County tax assessment bills. Assessed value is a number correlated to the property values in EWSD; it is not the FMV of properties.
Last year, 0.98% EWSD tax levy increase and assessed value
decrease resulted in 2.36% actual tax rate increase
Tax Year
Nassau
County
Assessed
Value
Nassau
County Tax
Rate/$100
YoY Nassu
County Tax
Rate
Change
EWSD Levy
Change
2011/2012 8,033,194 661.636
2012/2013 7,156,120 769.984 16.38% 2.60%
2013/2014 6,934,485 822.905 6.87% 3.21%
2014/2015 6,793,492 863.471 4.93% 2.43%
2015/2016 6,552,808 897.035 3.89% 1.85%
2016/2017 6,240,460 930.999 3.79% 0.00%
2017/2018 6,138,412 952.962 2.36% 0.98%
Change 2017-18/2011-12 -23.6% 44.0%

Budget
19

20
Budget Growth
The recommended budget will increase 2.65% to $59.8
$49.3 $50.5 $51.4 $52.7 $54.4 $55.7 $56.7 $57.5 $58.3 $59.8
2009-10 2010-11 2011-12 2012-13 2013-14 2014-15 2015-16 2016-17 2017-18 2018-19
Source: EWSD. $ in millions. 2018-19 excludes potential one-time spending for additional security measures.
21
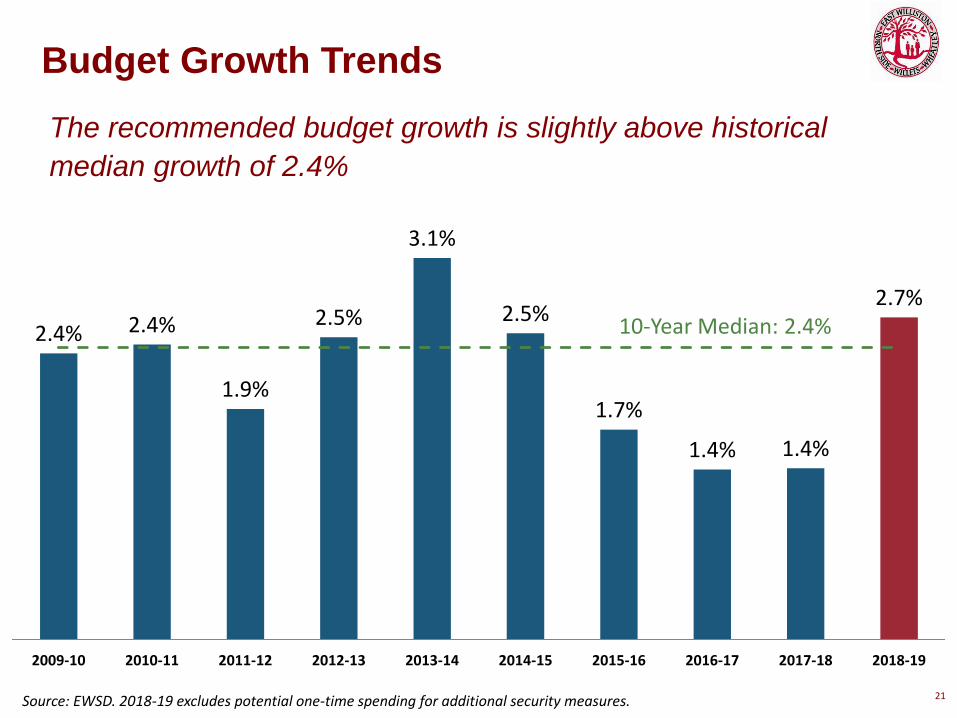
Budget Growth Trends
The recommended budget growth is slightly above historical
median growth of 2.4%
2.4% 2.4%
1.9%
2.5%
3.1%
2.5%
1.7%
1.4% 1.4%
2.7%
2009-10 2010-11 2011-12 2012-13 2013-14 2014-15 2015-16 2016-17 2017-18 2018-19
Source: EWSD. 2018-19 excludes potential one-time spending for additional security measures.
10-Year Median: 2.4%

22
Proposed 2018-19 Peer Group Budget
The recommended EWSD budget increase is in line with peers,
and only slightly above Median
0.00%
1.70% 1.82%
2.00% 2.01%
2.33% 2.35%
2.59% 2.59% 2.65% 2.65% 2.80% 2.85% 2.90%
3.95%
Jericho Garden City Locust Valley North Shore Great Neck Average Oyster Bay Median Manhasset Herricks East Williston Roslyn Port Wash Syosset Rockville Centre
Source: EWSD and publicly available data. No data available yet for CSH, Mineola and POB school districts. East Williston excludes potential one-time spending for additional security measures.
23
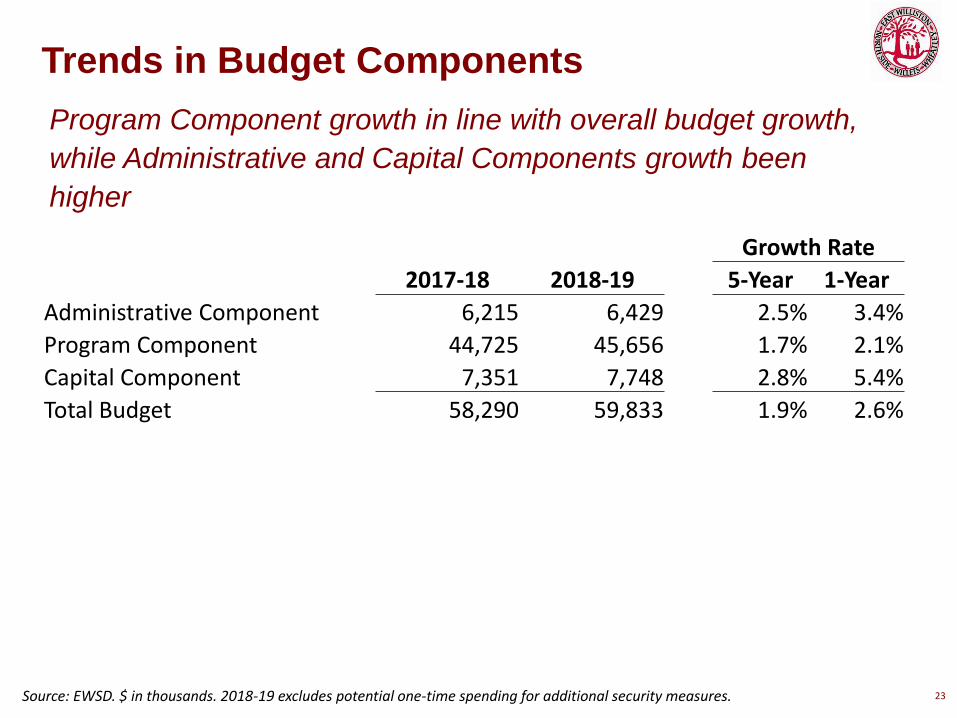
Trends in Budget Components
Source: EWSD. $ in thousands. 2018-19 excludes potential one-time spending for additional security measures.
Program Component growth in line with overall budget growth,
while Administrative and Capital Components growth been
higher
Growth Rate
2017-18 2018-19 5-Year 1-Year
Administrative Component 6,215 6,429 2.5% 3.4%
Program Component 44,725 45,656 1.7% 2.1%
Capital Component 7,351 7,748 2.8% 5.4%
Total Budget 58,290 59,833 1.9% 2.6%

24
Budget vs Actual Spending
Current year Budget vs Actual (expensed and encumbered)
spending is relatively tight with only $1,170 difference (or 98% of
budget)
Source: EWSD. $ in thousands. 2018-19 excludes potential one-time spending for additional security measures..
Expensed & Growth Rate
Budget Encumbered Budget Budget to Budget to
2017-18 2017-18 Difference 2018-19 Budget Exp. & Enc.
58,290 57,120 1,170 59,833 2.65% 4.75%
25
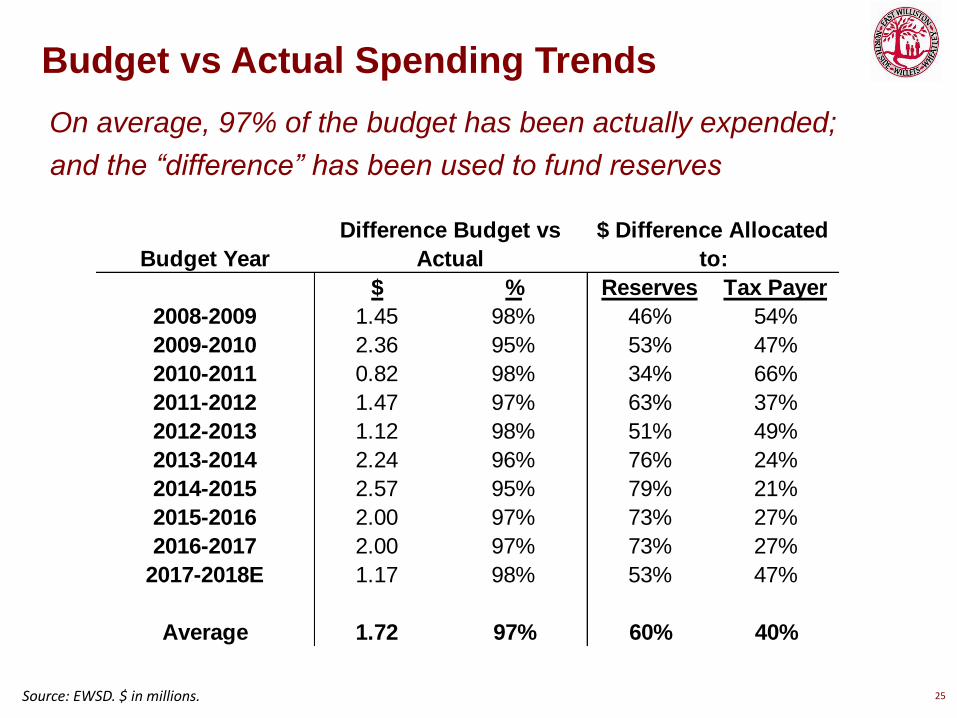
Budget vs Actual Spending Trends
On average, 97% of the budget has been actually expended;
and the “difference” has been used to fund reserves
Source: EWSD. $ in millions.
Budget Year
$ % Reserves Tax Payer
2008-2009 1.45 98% 46% 54%
2009-2010 2.36 95% 53% 47%
2010-2011 0.82 98% 34% 66%
2011-2012 1.47 97% 63% 37%
2012-2013 1.12 98% 51% 49%
2013-2014 2.24 96% 76% 24%
2014-2015 2.57 95% 79% 21%
2015-2016 2.00 97% 73% 27%
2016-2017 2.00 97% 73% 27%
2017-2018E 1.17 98% 53% 47%
Average 1.72 97% 60% 40%
Difference Budget vs
Actual
$ Difference Allocated
to:

Budget Cost Drivers
26

27
Budget Growth Drivers
Employee Benefits and Transportation have increased
substantially
Source: EWSD. $ in thousands. 2018-19 excludes potential one-time spending for additional security measures.
Growth Rate
2017-18 2018-19 5-Year 1-Year
Salaries & Salary Related Taxes 34,452 35,352 2.5% 2.6%
All Employee Benefits 10,724 11,309 0.9% 5.5%
Contract Transportation (incl. BOCES) 1,756 1,986 1.9% 13.1%
Special Education (non salary) 2,649 2,396 -0.7% -9.6%
Debt Service (Bonds, TANs, EPC) 1,859 1,868 -4.0% 0.5%
Technology Equipment & Support 1,116 1,076 5.2% -3.6%
All Other 5,734 5,848 3.3% 2.0%
Total Budget 58,290 59,833 1.9% 2.6%

28
Budget Growth, Total Salaries Growth and
Contract Wage Growth
While Contract Wage Growth has hovered around 1%, Budget
Growth and Total Salaries Growth have been higher
2.5%
3.1%
2.5%
1.7% 1.4% 1.4%
2.6%
2.2%
-1.2%
0.6%
2.9%
4.0%
2.7%
2.1%
1.3% 1.6% 1.7%
1.0% 0.6% 0.7%
2012-13 2013-14 2014-15 2015-16 2016-17 2017-18 2018-19
Budget Total Salaries Contract Wage
Source: EWSD.
No contract yet for 2018-19 period
29
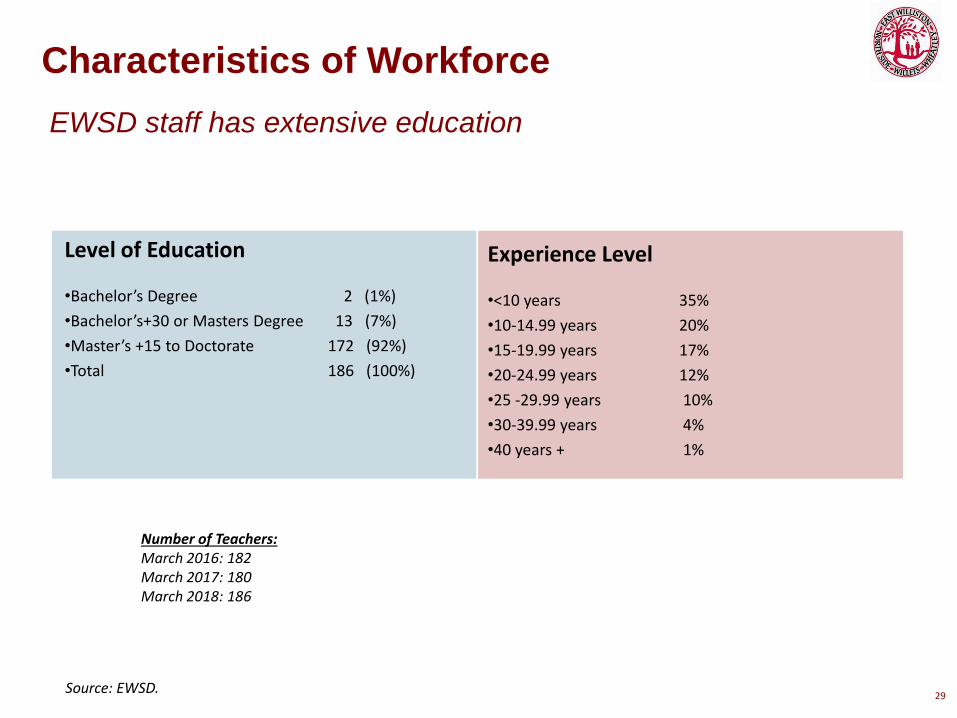
Characteristics of Workforce
EWSD staff has extensive education
Source: EWSD.
Level of Education
•Bachelor’s Degree 2 (1%)
•Bachelor’s+30 or Masters Degree 13 (7%)
•Master’s +15 to Doctorate 172 (92%)
•Total 186 (100%)
Experience Level
•<10 years 35%
•10-14.99 years 20%
•15-19.99 years 17%
•20-24.99 years 12%
•25 -29.99 years 10%
•30-39.99 years 4%
•40 years + 1%
Number of Teachers: March 2016: 182 March 2017: 180 March 2018: 186
30
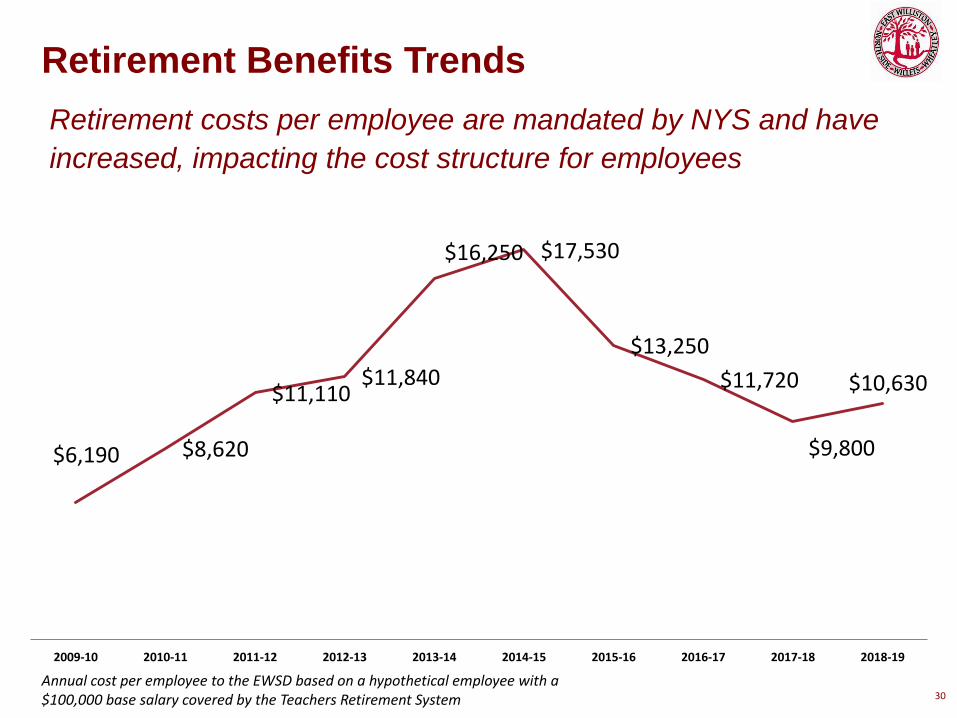
Retirement Benefits Trends
Retirement costs per employee are mandated by NYS and have
increased, impacting the cost structure for employees
Annual cost per employee to the EWSD based on a hypothetical employee with a $100,000 base salary covered by the Teachers Retirement System
$6,190 $8,620
$11,110 $11,840
$16,250 $17,530
$13,250
$11,720
$9,800
$10,630
2009-10 2010-11 2011-12 2012-13 2013-14 2014-15 2015-16 2016-17 2017-18 2018-19
31
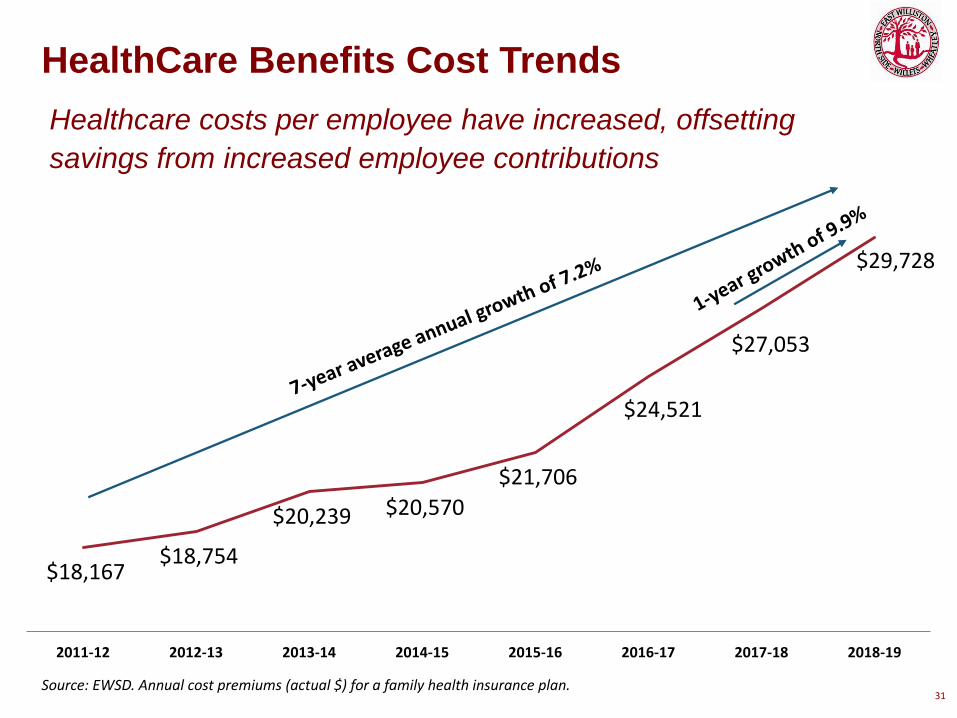
HealthCare Benefits Cost Trends
Healthcare costs per employee have increased, offsetting
savings from increased employee contributions
Source: EWSD. Annual cost premiums (actual $) for a family health insurance plan.
$18,167 $18,754
$20,239 $20,570
$21,706
$24,521
$27,053
$29,728
2011-12 2012-13 2013-14 2014-15 2015-16 2016-17 2017-18 2018-19
32
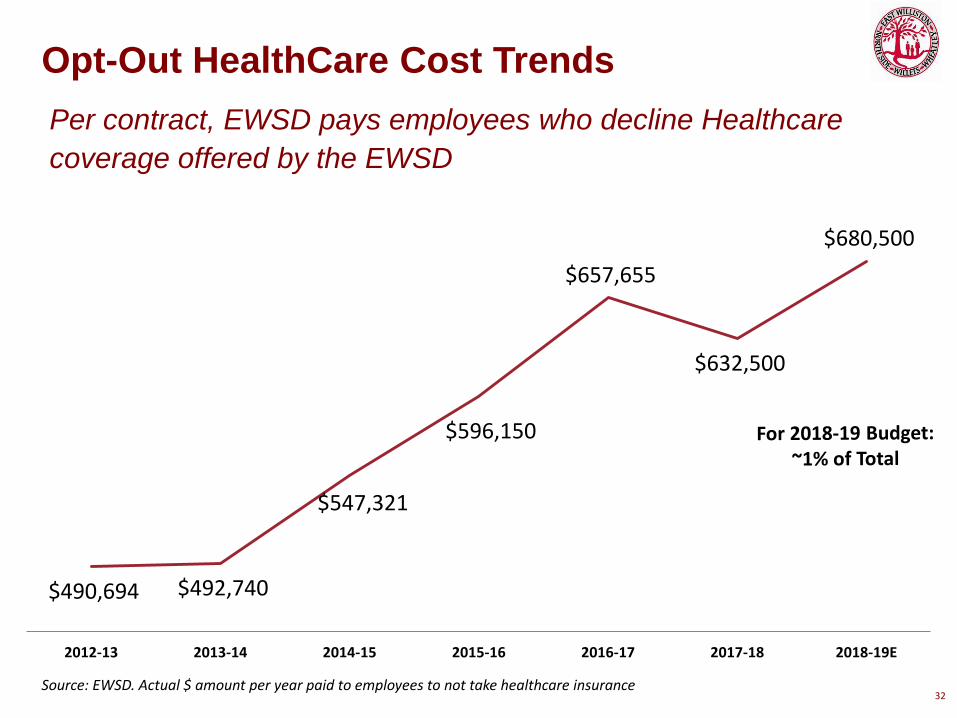
Opt-Out HealthCare Cost Trends
Per contract, EWSD pays employees who decline Healthcare
coverage offered by the EWSD
Source: EWSD. Actual $ amount per year paid to employees to not take healthcare insurance
$490,694 $492,740
$547,321
$596,150
$657,655
$632,500
$680,500
2012-13 2013-14 2014-15 2015-16 2016-17 2017-18 2018-19E
33
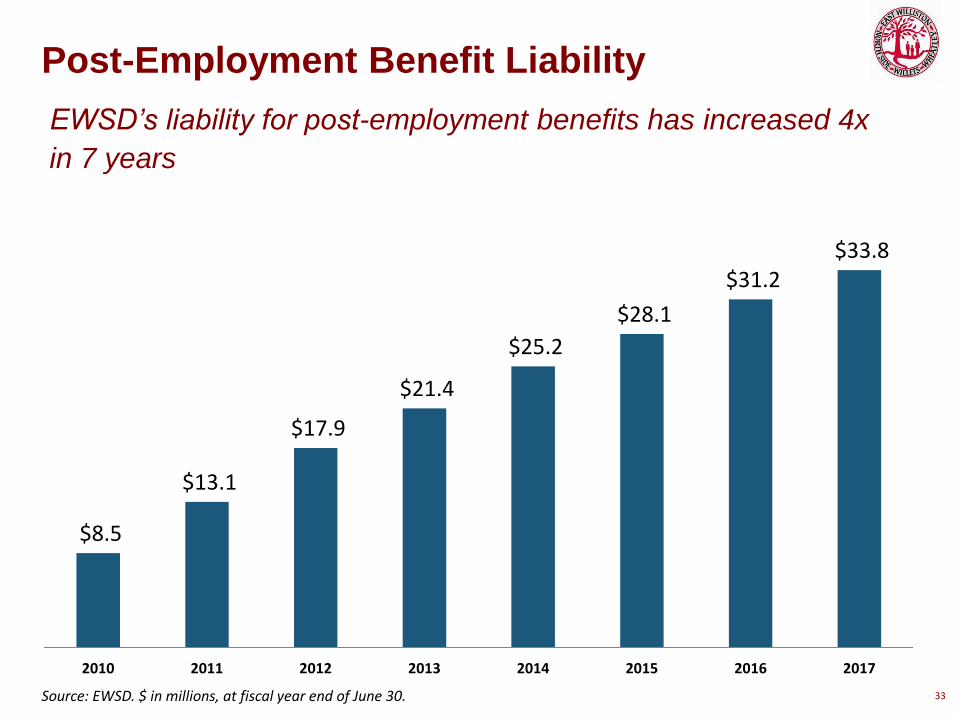
Post-Employment Benefit Liability
EWSD’s liability for post-employment benefits has increased 4x
in 7 years
Source: EWSD. $ in millions, at fiscal year end of June 30.
$8.5
$13.1
$17.9
$21.4
$25.2
$28.1
$31.2 $33.8
2010 2011 2012 2013 2014 2015 2016 2017
34
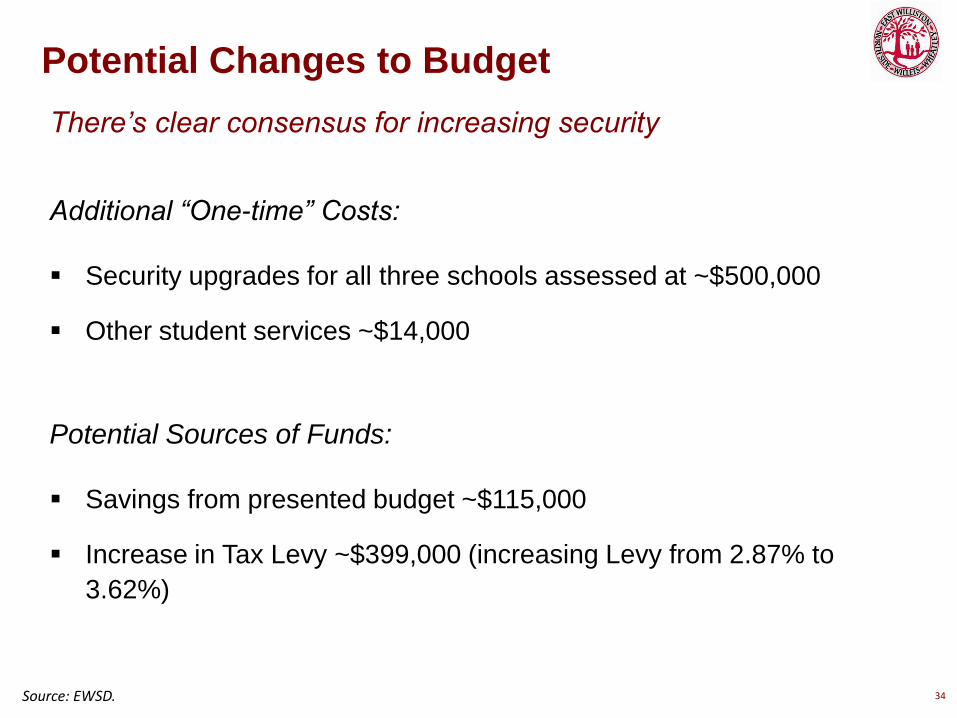
Potential Changes to Budget
There’s clear consensus for increasing security
Source: EWSD.
Additional “One-time” Costs:
Security upgrades for all three schools assessed at ~$500,000
Other student services ~$14,000
Potential Sources of Funds:
Savings from presented budget ~$115,000
Increase in Tax Levy ~$399,000 (increasing Levy from 2.87% to
3.62%)

Student Data
35

36
Student Enrollment
After multiple years of decline, enrollment has been growing
1,810
1,807
1,767
1,736 1,753 1,731
1,716 1,683
1,734
1,722
2009-10 2010-11 2011-12 2012-13 2013-14 2014-15 2015-16 2016-17 2017-18 2018-19
2017-18 and Prior Periods is Actual # 2018-19 is Projected #
Source: EWSD.
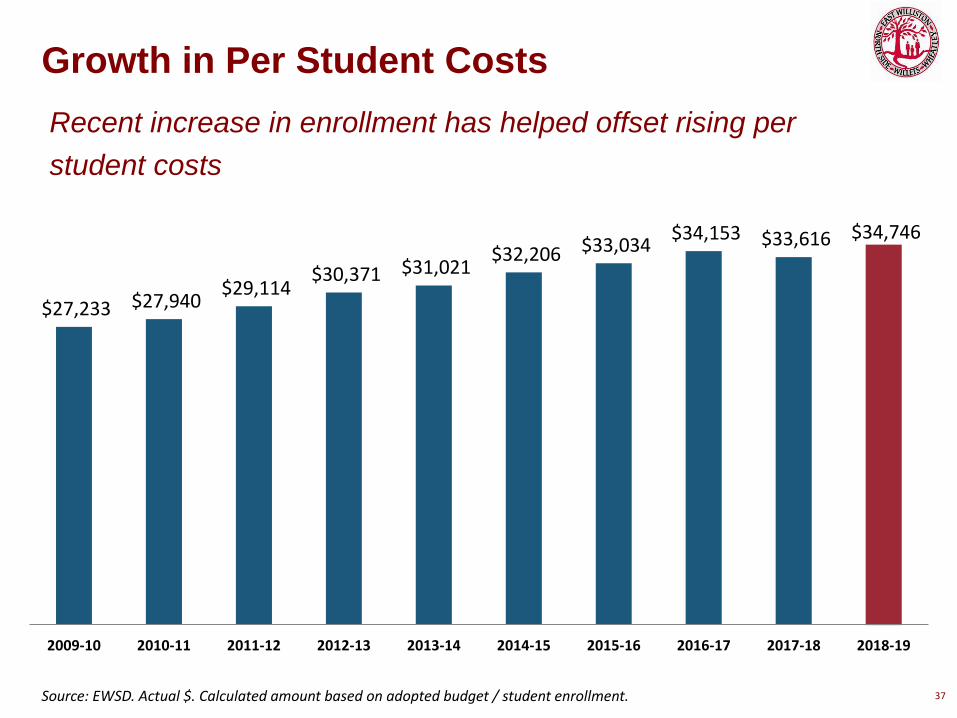
37
Growth in Per Student Costs
Recent increase in enrollment has helped offset rising per
student costs
$27,233 $27,940 $29,114
$30,371 $31,021 $32,206 $33,034
$34,153 $33,616 $34,746
2009-10 2010-11 2011-12 2012-13 2013-14 2014-15 2015-16 2016-17 2017-18 2018-19
Source: EWSD. Actual $. Calculated amount based on adopted budget / student enrollment.

Capital
38

Budget
Capital Reserve Fund
Bonds/Debt
39
Capital Projects
EWSD has funded capital projects in the following three ways:

40
Budgeted Capital Projects
EWSD has continued to increase funding for capital projects in
the budget
$170,000 $150,000 $150,000
$225,510
$525,510 $525,510 $573,550
$626,000
$800,040 $800,040
2009-10 2010-11 2011-12 2012-13 2013-14 2014-15 2015-16 2016-17 2017-18 2018-19 Source: EWSD.
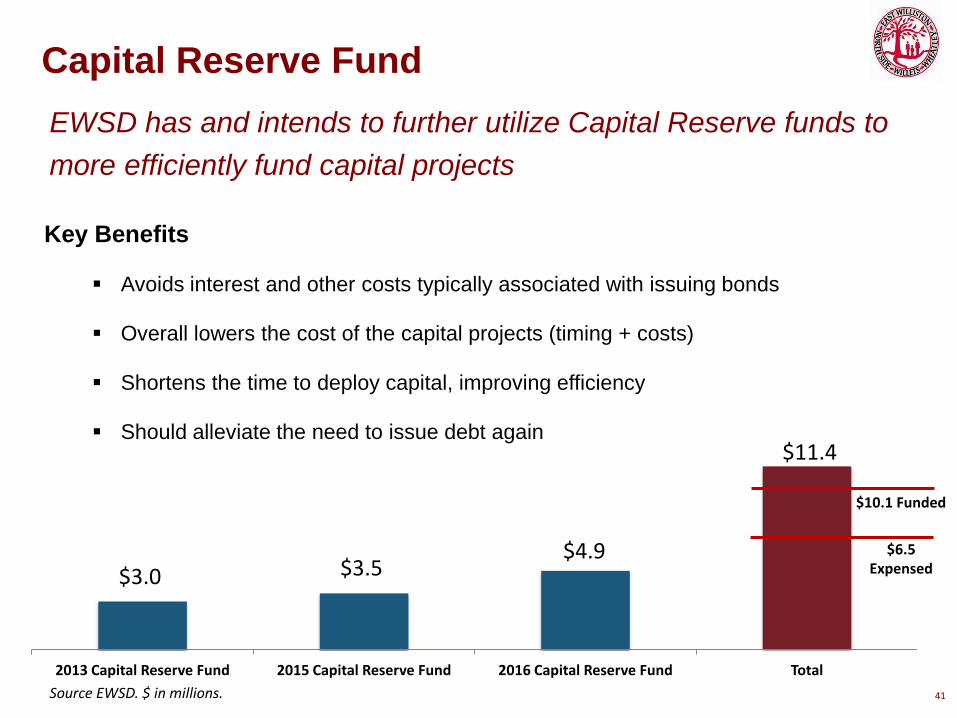
Key Benefits
Avoids interest and other costs typically associated with issuing bonds
Overall lowers the cost of the capital projects (timing + costs)
Shortens the time to deploy capital, improving efficiency
Should alleviate the need to issue debt again
41
Capital Reserve Fund
EWSD has and intends to further utilize Capital Reserve funds to
more efficiently fund capital projects
$3.0 $3.5 $4.9
$11.4
2013 Capital Reserve Fund 2015 Capital Reserve Fund 2016 Capital Reserve Fund Total
Source EWSD. $ in millions.
$10.1 Funded
$6.5 Expensed

42
Trend in Debt
EWSD’s debt burden has decreased
$13.8 $14.4 $15.5
$17.9
$16.4
$14.7
$13.0
$11.3
$9.4 $8.9
2009 2010 2011 2012 2013 2014 2015 2016 2017 2018E
Source EWSD. $ in millions, at fiscal year end of June 30. Includes bonds payable plus energy performance contract payable.
FAC Recommendations
43
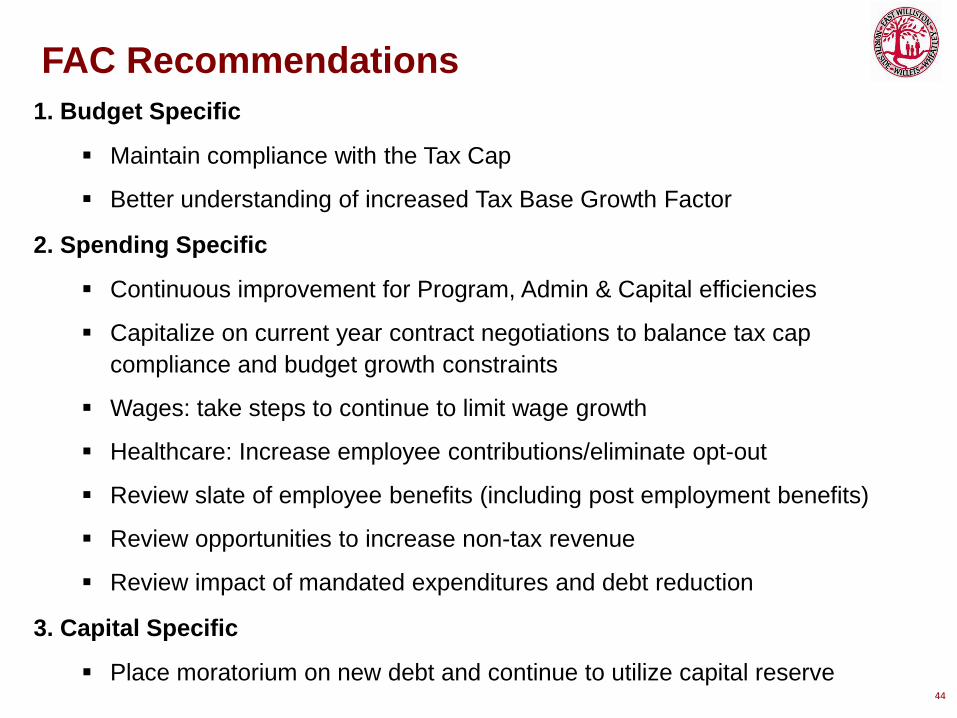
1. Budget Specific
Maintain compliance with the Tax Cap
Better understanding of increased Tax Base Growth Factor
2. Spending Specific
Continuous improvement for Program, Admin & Capital efficiencies
Capitalize on current year contract negotiations to balance tax cap
compliance and budget growth constraints
Wages: take steps to continue to limit wage growth
Healthcare: Increase employee contributions/eliminate opt-out
Review slate of employee benefits (including post employment benefits)
Review opportunities to increase non-tax revenue
Review impact of mandated expenditures and debt reduction
3. Capital Specific
Place moratorium on new debt and continue to utilize capital reserve 44
FAC Recommendations

45
Thank You
The FAC wishes to thank the Administration, members of the
Board, interested parties and members of the community for
their input and efforts.