report to the alcohol education research...
TRANSCRIPT

1/50
Report to the Alcohol Education Research Council
Two –year follow-up of a randomised trial of Early Warning Signs Relapse
Prevention Training in the treatment of alcohol dependence
Gerald A Bennett1, Peter W Thomas
2, James Bailey
1, Katherine Graham
1, Eleanor
Davies1, Jacqueline Withers
1, David S Higgins
1, and
Lorraine Parry1
1Addiction Service, Dorset HealthCare NHS Trust, Bournemouth, Dorset, United
Kingdom
2 Dorset Research and Development Support Unit and Institute of Health and Community
Studies, Bournemouth University, Dorset, United Kingdom
This study was financially supported by a grant from the Alcohol Education
Research Council
2/50
Two –year follow-up of a randomised trial of Early Warning Signs Relapse Prevention
Training in the treatment of alcohol dependence
Abstract
Aims Does Early Warning Signs Relapse Prevention Training (EWSRPT) prevent
relapse in alcohol dependent persons with history of relapse?
Design: Pragmatic randomised trial comparing (1) Aftercare as Usual (AU) with (2) AU
plus 15 individual sessions of EWSRPT . Assessment at entry, and 4, 8, 12 and 24
months later. This study reports the results at final follow-up.
Setting: UK day treatment programme.
Participants: 124 abstinent alcohol dependent patients just completing a 6-week day
treatment programme (63% male) who had previously stopped drinking and relapsed at
least twice (median 5 relapses): 62 in each condition.
Interventions: AU; eligibility to attend aftercare groups, supportive milieu, and alcohol-
free social club. EWSRPT; as AU plus 15 individual sessions of EWSRPT using Gorski’s
protocol
Measures: Any drinking (primary outcome), any heavy drinking (3 consecutive days
consuming >8 units on each day), percent days drinking, percent days heavy drinking,
units per drinking day, GGT, and ALT. Measures of non drinking outcomes such as
problems resulting from drinking (APQ), quality of life (EQ5D, SF36), mental health
(BSI), and cost of health and rehabilitation services used.
3/50
Findings: Of the 124 participants, four had died prior to their follow-up date and one had
moved abroad. Of the 119 available participants, 102 (86%) were seen face-to-face for a
final follow-up interview (51 AU, 51 EWSRPT). Intention to treat analysis found no
significant differences between groups on drinking measures in the four months prior to
final follow-up or on non-drinking measures. No characteristic of participants on joining
the trial were consistently correlated with drinking outcome.
Conclusions: The significant effects of EWSRPT at 12-month follow-up had ‘washed
out’ at final follow-up, but still suggest that its use could be worthwhile.
4/50
INTRODUCTION
Many interventions have been shown to help alcohol dependent people cease drinking
and begin to live without alcohol (Miller and Wilborne 2002). These changes are often
temporary. Many people return to drinking, especially during first few months after
stopping. There is a need for effective ways of helping dependent drinkers who have
completed treatment to remain abstinent once treatment contact ends. Effective relapse
prevention treatments should be capable of being provided by currently available
specialist services. Pharmacological treatments with some promise include the opiate
antagonist naltrexone (Srisurapanont and Jarusuraisin 2002) and the GABA agonist
acamprosate (Garbutt et al 1999). The most influential psychological treatment approach,
based on the cognitive-behavioural model of Marlatt (Marlatt and Gordon 1985), focuses
on helping patients develop skills to cope with putative ‘high risk situations’.
Replications and extensions of Marlatt’s original work provide only partial support for
key assumptions of this model, calling its rationale into question (Lowman et al 1996). It
is unclear to what extent the evidence from treatment studies supports treatments derived
from Marlatt’s approach. One recent review of the experimental literature (Irvin et al
1999) concluded that the approach was effective; another judged that there was little
evidence of effectiveness (Miller and Wilborne 2002). There is no clear evidence that any
pharmacological or psychological approach is consistently effective in preventing
relapse.
A very different psychological relapse prevention approach is the Early Warning Signs
Approach developed by Gorski (1989, 1990) for dependent drinkers who had stopped
5/50
drinking and relapsed a number of times. This approach suggests that in the period before
resuming drinking people undergo a pattern of changes in their thoughts, feelings, and
behaviour, which is characteristic for them. This is said to develop progressively from
small changes in feeling and attitude, through increasingly overt changes in behaviour
and social functioning, to a state in which drinking becomes very likely. Starting drinking
is seen as the end of a process which has occurred for days or weeks, and which may not
be apparent to the drinker. Gorski argues that it is much easier to interrupt this
unravelling process earlier rather than later - when it may be almost impossible to prevent
a resumption of drinking. The treatment involves a series of procedures to help the person
(1) become aware of their own habitual warning signs, and associated changes (2)
develop and implement plans for managing or coping with each sign or change, so as to
interrupt the relapse process and (3) to develop a lifestyle which will help prevent the
occurrence of this sequence of changes. There is a clear protocol of about 20 sessions,
each of which can be carried out individually in one hour; most involve completing
written tasks between sessions. Gorski’s approach is widely used in the USA and is
supported by published materials including books, patient workbooks (Gorski 1995),
videos, and packages for therapists to use in presenting this approach to patients. There is
an intensive 6-day training programme for professionals and an accreditation system for
graduates of the training: several thousand people have completed this. Thus the
approach could be easily disseminated.
This approach was developed for use only with patients who have a history of stopping
drinking and subsequently returning to drinking, but has never been subjected to a

6/50
randomised controlled trial. In the current state of knowledge the most appropriate
evaluation is a simple pragmatic trial designed to answer the question of whether adding
this approach to treatment improves the long-term outcome of patients.
The present investigation is a continuation of a study that examined whether providing
this type of intervention to alcohol dependent people when they complete a day treatment
programme affects their consumption of alcohol during the following year. The initial
analysis compared drinking outcomes in participants who received Early Warning Signs
Relapse Prevention Therapy (EWSRPT) with those that attended Aftercare as Usual
(AU) (Bennett et al submitted for publication). Compared to those in the AU group, the
EWSRPT participants were significantly less likely to drink heavily during the follow-up
year (74% of AU, 55% of EWSRPT; P= 0.04), and had significantly lower frequencies of
drinking (P = 0.05) and drinking heavily (P = 0.04) during that year. They were not,
however, significantly more likely to completely abstain from alcohol during this year
(17% of AU, 31% of EWSRPT, P= 0.08), The difference between the patterns of
drinking and heavy drinking of the two condition increased as the follow-up year
progressed (Figures 1 and 2), raising the possibility that this might continue to increase
thereafter. A longer-term follow-up would be of interest.
The present study carries out such a follow-up by interviewing the participants 24 months
after they entered the trial. It aims to establish whether the significant treatment effects
that were identified at one year were maintained over the next year. It also offered the
7/50
opportunity to examine whether any of the characteristics of participants as they entered
the trial were correlated with drinking outcomes.
METHOD
Design
A randomised trial comparing (1) Aftercare as Usual (AU) with (2) Aftercare as Usual
plus Early Warning Signs Relapse Prevention Training (EWSRPT) with assessment at
entry to the trial, and 24 months later. The present study is a continuation of assessments
that had already been carried out 4, 8 and 12 months after entry (described above)
Participants
Admission criteria The criteria for inclusion in the study were: (i) dependence on
alcohol (DSMIV criteria American Psychiatric Association 1994); (ii) having just
completed the 6 week day treatment programme; (iii) being abstinent from alcohol; (iv)
having experienced at least two relapses (being defined as a return to drinking after at
least 3 weeks of voluntary abstinence, achieved with or without professional help, whilst
not involuntarily in an institution, e.g. prison); and (iv) having a goal of abstinence from
alcohol and other drugs.
The criteria for exclusion from the study were: (v) having a reading age of less than 10
years; (vi) currently suffering from a serious mental illness; (vii) having suffered
significant brain damage; (viii) having plans to move away from the study area during the
8/50
following year; (ix) being in a major life crisis which required extensive practical help
(e.g. becoming homeless); (x) dependence on other drugs.
The study recruited 124 participants and 62 were allocated to each condition.
Sample size The initial 12-month study aimed to recruit sufficient participants to
detect a reduction in relapse rate over a 12-month period from 50% to 25% (comparing
the 2 arms of the study using the χ2 test for association with a 5% significance level) with
80% power. This requires 116 participants (58 per group).
Recruitment During the recruitment period the programme produced 210 graduates:
76 were ineligible to take part in the project and 5 were not screened for practical reasons
(e.g. the researcher’s holidays), leaving 129 potential participants of whom 124 (96%)
agreed to participate in the trial. The reasons for ineligibility were (a) insufficient relapse
history, 35; (b) already in the project (but had relapsed and returned to treatment), 16; (c)
not dependent on alcohol, 11; (d) no abstinence goal, 1; (e) serious mental illness, 3; (f)
dependence on other drugs, 4; (g) unavailable for treatment due to practical reasons, 6.
The Dorset NHS Local Research and Ethics Committee approved the study. Potential
participants were provided with written information explaining about the nature of the
study, their rights to withdraw at any time and confidentiality.
Setting The trial was carried out in a 20-place 6-week day treatment programme (the
Sedman Unit) provided by a United Kingdom National Health Service NHS Trust

9/50
(Dorset HealthCare) for dependent drinkers who have stopped drinking and wish to
remain abstinent. ‘Graduates’ are encouraged to join the aftercare programme. The unit
systematically monitors patient outcomes and welcomes clinical research – such as a
recent trial of providing patients with a motivational intervention on their first treatment
day (Dench and Bennett, 2000).
Interventions In AU participants were eligible to attend the unit for informal contact
in a safe milieu; they were welcome to use the same cafeteria and recreational and social
facilities as patients in treatment, as well as organized social events, such as barbeques,
bowling, fishing trips, and parties. They were encouraged to attend up to three aftercare
support groups a week, in which they could discuss their progress and issues that were
important to them. They were able to apply to attend structured groups of the 6-week
programme, and could also attend an alcohol-free social club in evenings and weekends.
All participants were strongly encouraged to use the aftercare services. AU did not offer
individual counselling. No programme treatment or aftercare groups offered any
elements of EWSRPT listed below; staff agreed not to include any during the course of
the study.
EWSRPT was offered in weekly individual sessions based on the sessions in Gorski’s
(1995) workbook. Participants were led to carry out procedures, using worksheets from
the book, during sessions and completed many of the procedures for homework. The
intervention was carried out by one of three research addiction therapists (GB, JW, LP)
each of whom had more than 10 years experience in treating dependent drinkers. These

10/50
had trained in this approach with its originator (Terence Gorski), and had been formally
certified by his organization (CENAPS) as being competent in it following written
examinations, submission of a case report using the approach etc. The intervention
covered the following procedures, none of which formed part of the 6-week day
treatment programme or Aftercare as Usual: (i) life and addiction history (process 5 in
Gorski's (1995) Treatment Workbook); (ii) recovery and relapse history; relapse calendar;
examination of three most recent attempts at recovery (process 6); (iii) examination of
standard warning sign list (process 7); (iv) examination of three outstanding personal
warning signs (process 8); (v) sentence completion tasks to examine threats to recovery
(process 9); (vi) developing final warning sign list (process10); (vii) cognitive,
behavioural, and emotional management of critical warning signs (processes 11 to 14);
and (viii) recovery planning related to warning signs (process 15). The intervention did
not include the first phase of Gorski’s programme, concerned with stabilisation of the
dependent drinker, because the treatment programme had achieved this. This omitted
phase consisted of screening, scheduling recovering activities, and carrying out an
immediate relapse prevention plan, and an early intervention plan (processes 1 to 4).
At the intake assessment the research assistant invited participants to have their therapy
sessions audiotaped and listened to by the three therapists in group mutual supervision. If
participants agreed (and all but one did) they signed an informed consent form at their
first counselling session and sessions were audio taped. Some audiotapes were
transcribed. Weekly peer supervision took place in 60-minute groups as part of quality
control to ensure that each patient was receiving treatment according to the protocol.
11/50
This involved listening to sections of audiotapes of sessions, reading typed transcripts of
sessions, reviewing worksheets completed by patients, and finding solutions to problems
and difficulties encountered.
Outcome Measures
Drinking outcome measures (a) Whether the person ever drank alcohol during the 4
months leading up to final 24-month follow-up interview. (b) Whether the person drank
alcohol during the second follow-up year (months 12 to 24). (c) Whether the person
drank alcohol in the 2 follow-up years (months 1 to 24) (d) Whether the person ever
drank alcohol heavily during the 4 months leading up to final follow-up interview, heavy
drinking being taken as drinking 9 or more UK units of alcohol (Miller et al 1991) a day
for 3 consecutive days. These and measures (e) to (g) below are derived from Time Line
Follow Back structured interview, using an adapted version of Form 90 as used in Project
MATCH (Project MATCH Research Group (1997). (e) Percentage days drinking in
each of the 4 months leading up to final follow-up interview. (f) Percentage days heavy
drinking (drinking 9 or more UK units of alcohol a day) in each of the 4 months leading
up to final interview. (g) Mean units of alcohol per drinking day in each of the 4 months
leading up to final follow-up interview. (h) Blood levels of GGT (gamma glutamyl
transferase) and ALT (serum alanine aminotransferase) in samples of capillary blood,
measured using a tabletop analyser Reflotron (Boehringer Mannheim) in the final follow-
up interview (Conigrave et al 2003).
Non drinking outcome measures (i) Health-related quality of life was assessed using
two self-completion questionnaires, the SF36 (using the Physical and Mental summary

12/50
scores: Ware et al 1994), and the EQ5D which produced a single index of health status
(The EuroQol Group, 1990). (j) Problems caused by drinking was assessed using the
Alcohol Problems Questionnaire (APQ) (Williams and Drummond, 1994): the study used
the total of the scores of the first 23 items, excluding those related to work and marriage,
so as to be applicable to all participants. (k) Mental Health was assessed using the Brief
Symptom Inventory (BSI) (Derogatis and Melisaratos, 1983), a questionnaire which
produces an overall score, the Global Severity Index (GSI). (l) Occurrence of warning
signs of relapse was assessed by the Assessment of Warning-signs of Relapse (AWARE)
questionnaire measuring the occurrence of proposed common warning signs of relapse
(Miller and Harris 2000). Items were scored as to whether they had or had not occurred
during the previous 4 weeks. (m) Use of Health Care and Rehabilitation Services was
monitored from structured follow-up interviews based on the relevant component of
Form 90 (Project MATCH Research Group 1997). Information was collected about use
of services during the 4 months leading up to final follow-up interview. All non-drinking
outcomes were assessed at the final follow-up interview. (n) The costs of Health and
Rehabilitation services used by participants were assessed (in 2002 pounds sterling) by
combining information about service utilisation and the costs of service utilised. The
agencies, which treated participants (NHS hospital trusts and primary care trusts) or
purchased rehabilitation services for them (local authority social service departments)
provided costs for each type of service used (in the form of Department of Health
reference costs or similarly calculated costs for items where reference costs were not
produced).
13/50
Measures to describe sample (o) The degree of dependence on alcohol was assessed
using the Severity of Alcohol Dependence Questionnaire (SADQ) (Stockwell et al 1983),
which was taken at intake. (p) Social Stability was assessed using the Straus Bacon
Index (Straus and Bacon, 1951), derived for each participant based on information taken
at intake regarding employment, occupation, stability of residence, and marital status.
Higher scores indicate greater social stability.
Procedures
Recruitment and intake assessment Patients starting their final treatment week were
screened by a research assistant: those eligible were informed about the trial, invited to
join, and offered a meeting later in the week for them to tell the researcher of their
decision. Participants choosing to join signed an informed consent form and then
underwent intake assessment.
Randomisation Following intake assessment participants were randomly allocated
to an arm of the study by means of a telephone based randomisation service set up and
administered by PWT from a different NHS Trust. The method ensured that group
allocation was concealed both from patients and from the researchers until after the
researcher had logged the patient into the study by means of a telephone call to the
randomisation office. Randomisation was done in variable length blocks to help ensure
equal group sizes, using the random number generator in PEPI (Abramson and Gahliner,
1999).
14/50
Follow-up
Follow-up - 12 months In the initial study, the research assistants attempted to reassess
all participants 4, 8 and 12 months after entering the trial (Bennett et al submitted for
publication)
Follow-up -24 Months In the present study research assistants attempted to reassess all
participants 24 months after they entered the trial. Great efforts were made to interview
participants at the due date or in the following three months. If, despite these
concentrated efforts, it was not possible to make contact with the client within that time
the researchers continued to try to do this until the end of the project. Follow-ups were
carried out in the research centre, the patient’s home, or some other appropriate location
(e.g. GP’s surgery). Patients were breathalysed at the start of each interview: if the level
exceeded 0.05mg% the interview was rescheduled, but the fact of drinking was noted.
Every effort was made to collect outcome data. This included us of the on-line NHS
strategic tracing service, letters, telephone calls, visiting last known address, contacting
any relative nominated by the client for this purpose at intake, and contacting the
patient’s GP. If the patient had moved away from the area but was still in the UK then the
research assistant visited them in their new area. Participants were offered £25 for
completing a final follow-up interview and were paid on completion. The Dorset NHS
Local Research and Ethics Committee approved this payment.
Plan of Statistical Analysis
Patients were analysed in the group to which they were originally randomised (intention-
to-treat analysis). Data were analysed using SPSS for Windows Version 11.0. A 5%

15/50
significance level was used throughout: 2-tailed tests were used for comparisons. The
person’s drinking status (categorised as ‘any drinking’ or ‘no drinking’) in the 4 months
leading up to final interview, during the second follow-up year and during the entire two
years of the study was compared at each point across conditions using the χ2 test for
association. Whether or not the person drank heavily was dealt with in the same way. The
score distributions for percent days drinking, percent days heavy drinking and units
consumed per drinking day were strongly skewed, with many scores having values of 0.
Therefore for each of these variables, participants were divided into 4 approximately
equally sized groups and these were compared between the experimental conditions using
the χ2 test for linear trend (since the large number with scores of 0 could cause difficulties
with the comparison of medians). The categories used for percent days drinking and
heavy drinking variables were 0%, 1-13%, 14-47 and 47+%. The categories used for
units consumed per drinking day were 0 units, 1-10 units, 11-20 units and 20+ units.
GGT, ALT, APQ and the cost of services used during the follow-up year were
summarised using medians and inter quartile ranges, and compared between the groups
using the Mann-Whitney U test. Scores of EQ5D, SF36, AWARE and BSI at final
follow-up were approximately normally distributed and were compared between groups
using the independent samples t-test and summarised using means and standard
deviations. In order to compare drinking status at 12 months follow up and final follow
up the categorical variables (drank, drank heavily in the four months prior to interview)
were compared across the two occasions using the McNemar test for the significance of
changes, whilst the skewed continuous variables (percent days drinking, percent days
heavy drinking) were compared using the Wilcoxon matched pairs signed-ranks test.
16/50
Each comparison was performed on the Total follow-up sample and also on the sub
samples of that composed of the two treatment conditions.
The pre-trial characteristics of participants who drank during the four months prior to
their final interview were compared with those of participants who did not drink then, in
order to identify significant correlates of outcome. Similar analyses were carried out
examining drinking in the four months prior to the 12 month follow-up. Analyses
included the use of Pearson’s r, Spearman’s p, Chi2, Mann Whitney U tests, or t-tests,
depending on the nature of the variable and its distribution. These analyses were carried
out on the Total follow-up sample.
RESULTS
Follow-up
Of the 124 participants, four had died prior to their follow-up date and one had moved
abroad. Of the 119 available participants, 102 (86%) were seen face-to-face for a final
follow-up interview (51 AU, 51 EWSRPT). It was not possible to interview 17 (14% of
available participants): 12 could not be located and 5 were located but refused to
participate. The recruitment and follow-up of participants is summarised in Figure 3.
Of the 102 participants that were seen face-to-face, 71 (39 AU, 32 EWSRPT) were
interviewed within the 6 months following their 2-year follow-up due date (these
constitute the ‘on-time follow-up’ sample). The remaining 31 (12 AU, 19 EWSRPT)
were seen more than 6 months after they were due to be interviewed (these constitute the

17/50
‘late follow-up’ sample). A summary of when final follow-up interviews were completed
is provided in Table 1.
The ‘on-time’ and ‘late’ follow-up samples were combined to create a ‘total’ follow-up
sample i.e. all those 102 participants that had a final follow-up interview. The 18
participants that were not followed-up (excluding those participants that were deceased)
constitute the ‘not seen’ sample.
Comparison of Pre-treatment characteristics
The pre-treatment characteristics of participants in each sample were compared using
Chi2, Mann Whitney U tests, or t-tests dependent on the nature of the variable and its
distribution. The data and results are summarised in Table 2, 3. There were only two
significant differences. between samples. The intake AWARE scores for those that were
not seen were significantly higher than for those who were seen: one of 17 comparisons
was significant at the 0.05 level. The intake ALT measures were significantly lower in
participants who were followed up on time compared with all others (seen late or not
seen): one of 17 comparisons was significant at the 0.05 level.
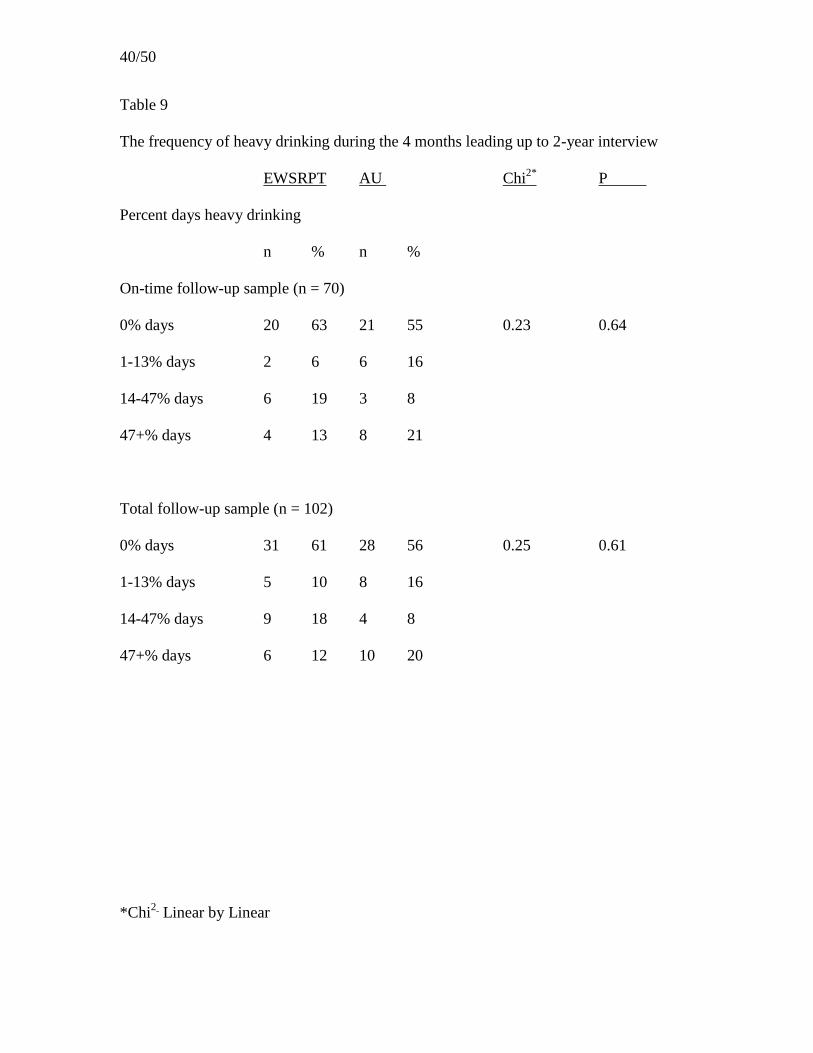
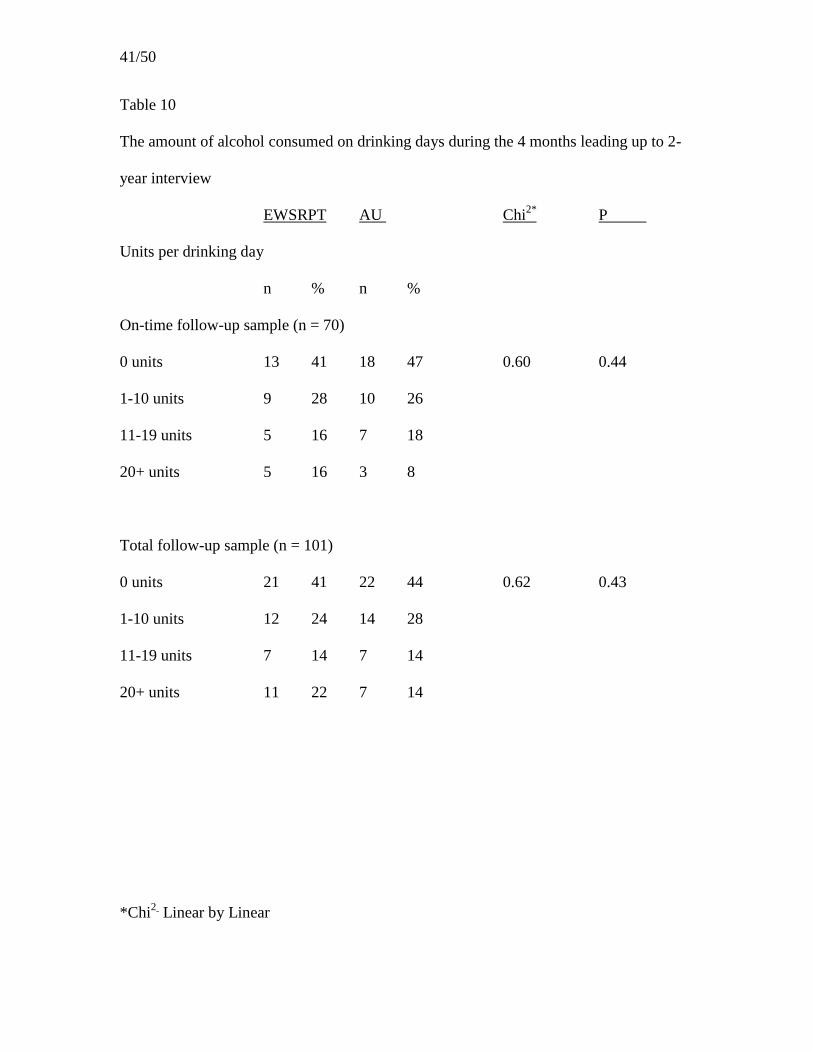
The effect of treatment on drinking variables
There was no significant difference between EWSRPT and AU for either the On-time
sample or the Total sample on any of the five indices of drinking (any drinking, any
heavy drinking, percent days drinking, percent days heavy drinking, units of alcohol
consumed per drinking day) for any of the three time periods (during the 4 months
18/50
leading up to the final interview, during the second follow-up year, or during the 2
follow-up years). The data and tests are summarised in Tables 4 to 10 and depicted in
Figures 4 to 7.
Comparison of drinking status at 12 months and final follow up
There were no significant differences between the occurrence of any drinking in the 4
months prior to the 12 month follow-up and that prior to the final follow-up for the whole
sample (Chi2 = 13.7, df = 1, P = 0.27), nor within either of the two treatment conditions.
There was a significantly lower proportion of heavy drinking in the whole sample at final
follow up (29%) than at 12 months (45%; Chi2 = 12.0, df = 1, P = 0.02). In AU a
significantly higher proportion (52%) drank heavily at final follow-up than at 12 months
(31%; Chi2 = 4.8,df = 1, P = 0.01) ; there was no significant difference for EWSRPT
(Chi2 = 7.6, df = 1, P = 0.77). There were no differences in the frequency of drinking (z
for total sample -0.57, P=0.57) or heavy drinking (z for total sample -0.12, P=0.91)
between the 4 months prior to the 12 month follow-up and that for the final follow-up, for
either the whole sample or within either of the two treatment conditions.
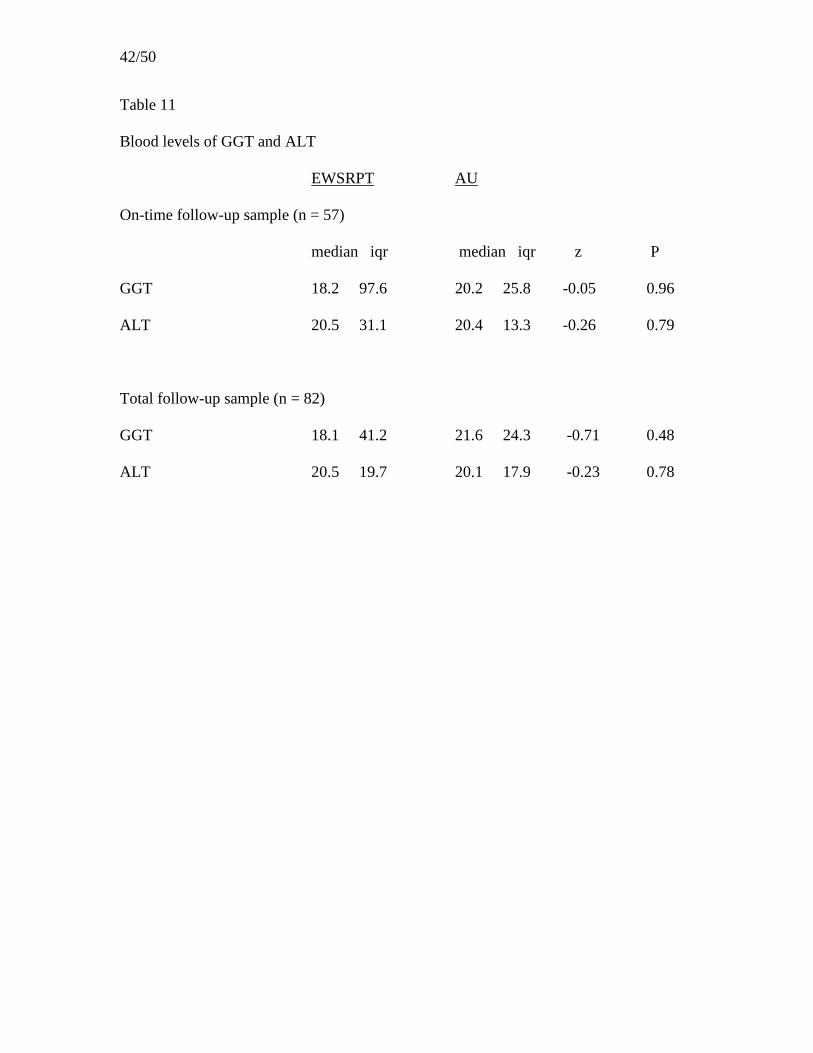
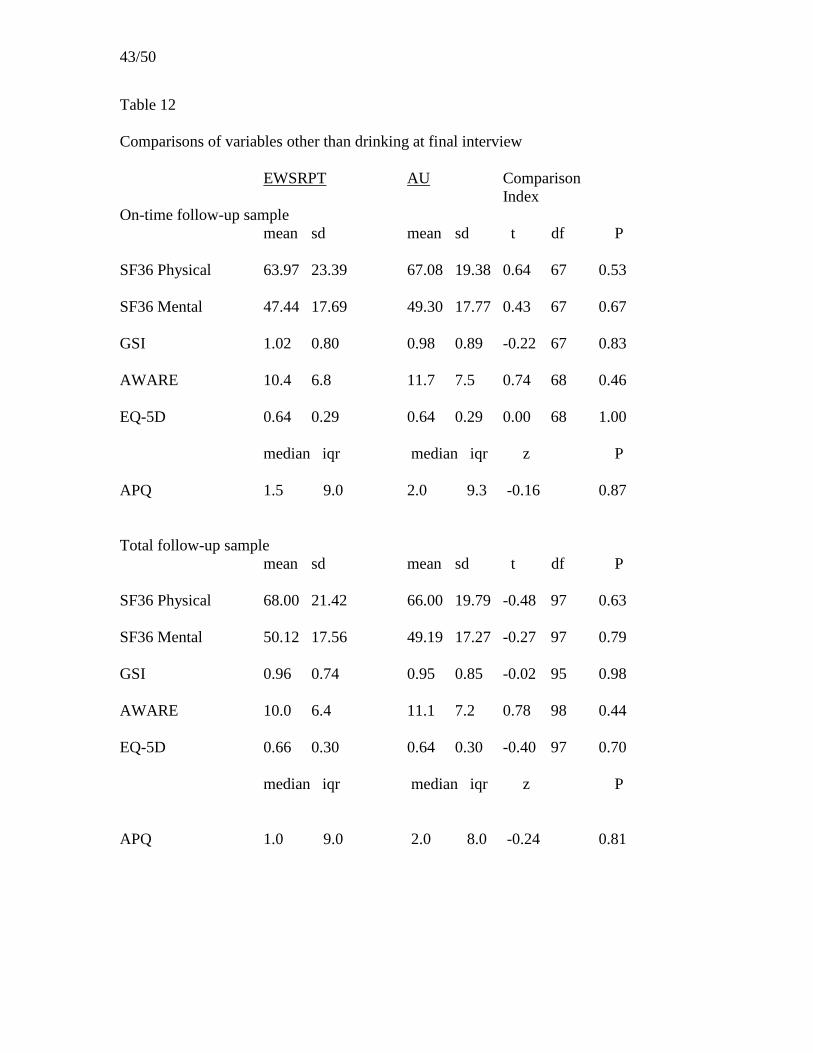
The effect of treatment on variables other than drinking
There was no significant indication of a treatment effect for either samples on any of the
following variables: GGT, ALT, SF36, EQ5D, APQ, AWARE, and BSI. Values and data
are summarised in Table 12. The data for the APQ and GSI are depicted in Figures 8 and
9.

19/50
The effect of treatment on the cost of the use made of health and rehabilitation
services
On-time follow-up sample The median cost (in £2002) for the services used in the 4
months leading up to 2-year follow-up interview was £203.75 (iqr 408.94) for the
EWSRPT group and £182.68 (iqr 735.25) for the AU group. The difference was not
significant. Values and data are summarised in Table 13
Total follow-up sample The median cost (in £2002) for the services used in the 4
months leading up to final follow-up interview was £165.59 (iqr 444.94) for the
EWSRPT group and £165.59 (iqr 725.92) for the AU group. The difference was not
significant. Values and data are summarised in Table 13
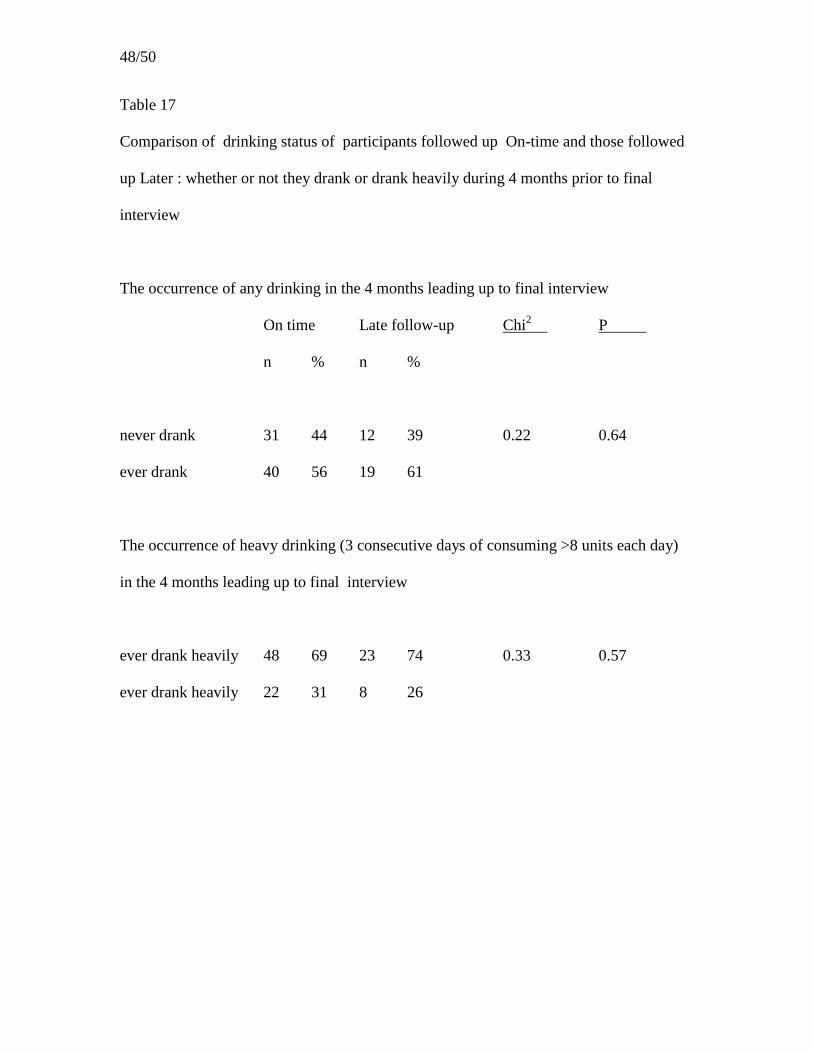
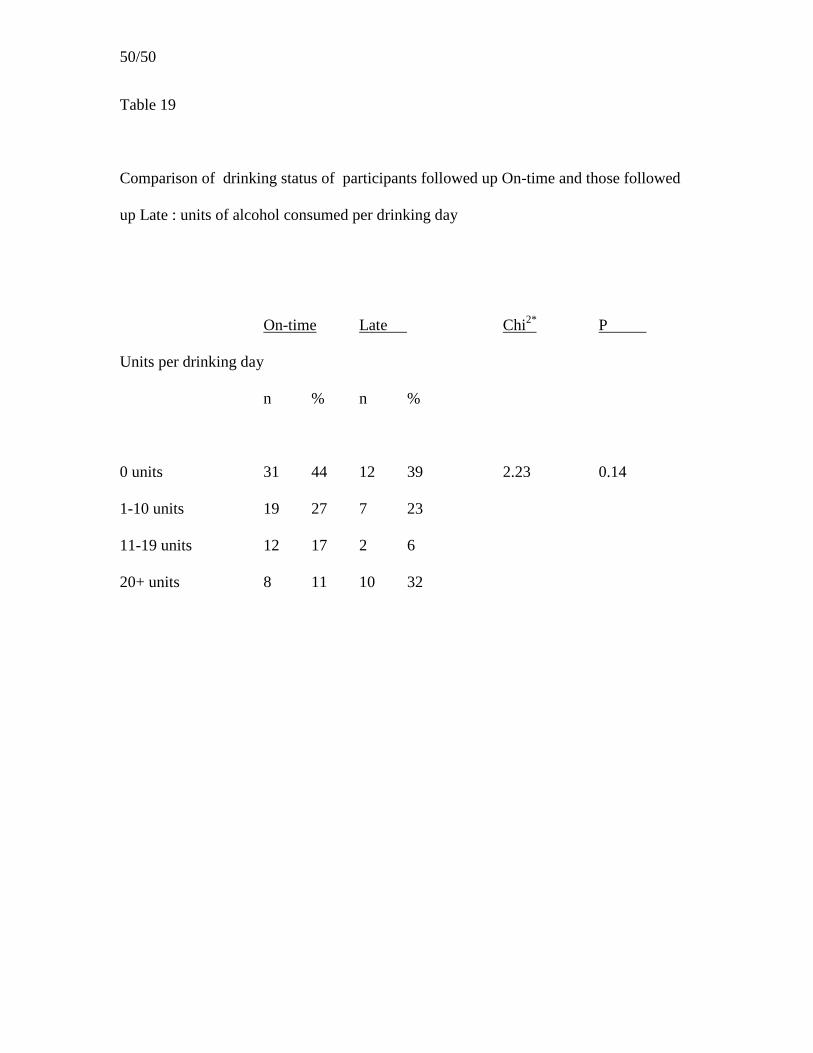
Comparison between drinking outcomes of On-time follow-up sample and Late
follow-up sample
There was no significant difference between the On-time and Late follow-up samples on
any of the five indices of drinking (any drinking, any heavy drinking, percent days
drinking, percent days heavy drinking and units of alcohol consumed per drinking day)
during the 4 months leading up to the final interview. Values and data are summarised
in Tables 17, 18 and 19.
Correlates of outcome
The correlates of outcomes were explored for all participants who were followed up, both
separately for participants in each of the two treatment conditions and also together as
one group. The results for the latter (Total sample) are presented, as there was virtually
20/50
no difference between the two subgroups. Each analysis considered the 24 variables
listed in Table 14.
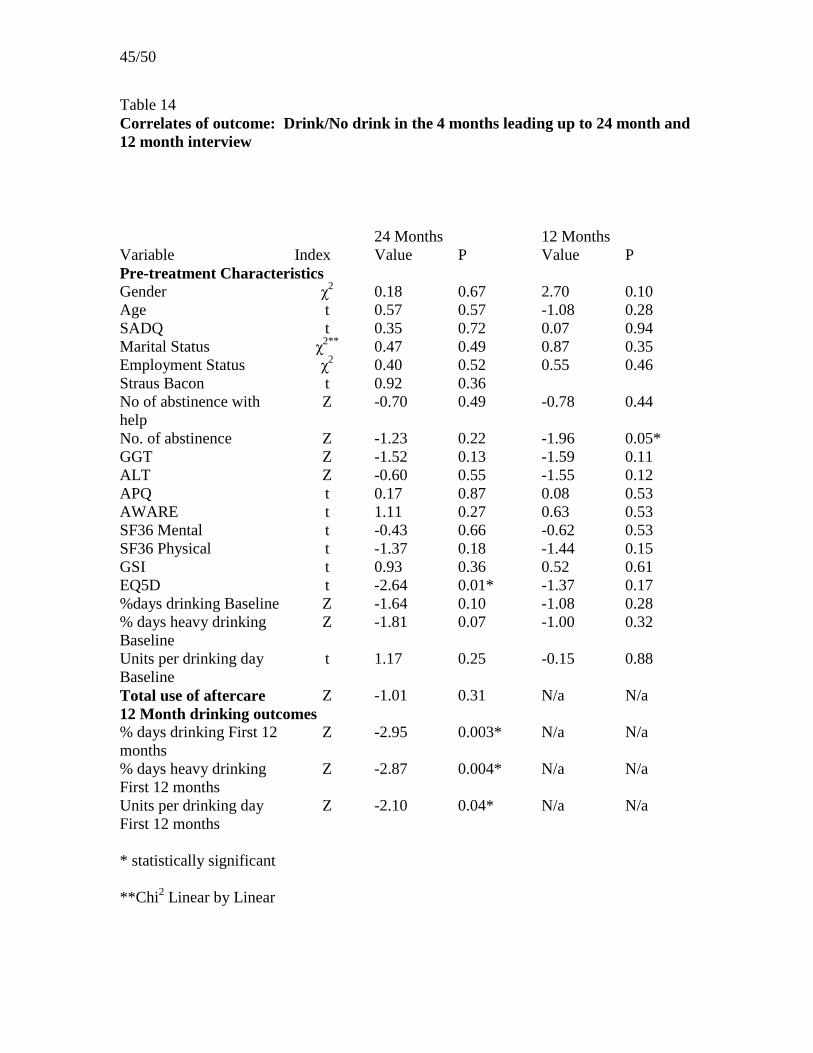
Correlates of drinking status: 24 month follow-up interview
Participants who drank during the 4 months leading up to final follow-up had drank more
frequently (z = -2.95, p=0.003), had drank heavily more frequently (z =-2.87, p = 0.004)
and had drank more units per drinking day (z = -2.10, p = 0.04) in the first 12 months of
the study than participants who were abstinent at final follow-up. Values and tests are
summarised in Table 14. Similarly, frequency of drinking, frequency of drinking heavily
and units consumed per drinking day in the first 12 months of the study are positively
correlated with the frequency of drinking in the 4 months leading up to final interview.
Values are summarised in Table 16. Participants drinking at final follow-up scored
significantly higher on the EQ5D at intake than those who were abstinent at final follow-
up (t =-2.64, p = 0.01). Higher scores indicate higher quality of life. Four of the 48
statistics were significant at the 0.05 level.
Correlates of drinking status: 12 month follow-up interview
Participants drinking in the 4 months leading up to the 12-month interview had
significantly more episodes of abstinence before entering the trial than those that did not
drink (z =-1.96, p = 0.05). Values are summarised in Table 14. Men drank significantly
more frequently than women in this period (z = -2.66, p = 0.008). Values are summarised
in Table 16. Two of the 40 statistics computed were significant at the 0.05 level.
21/50
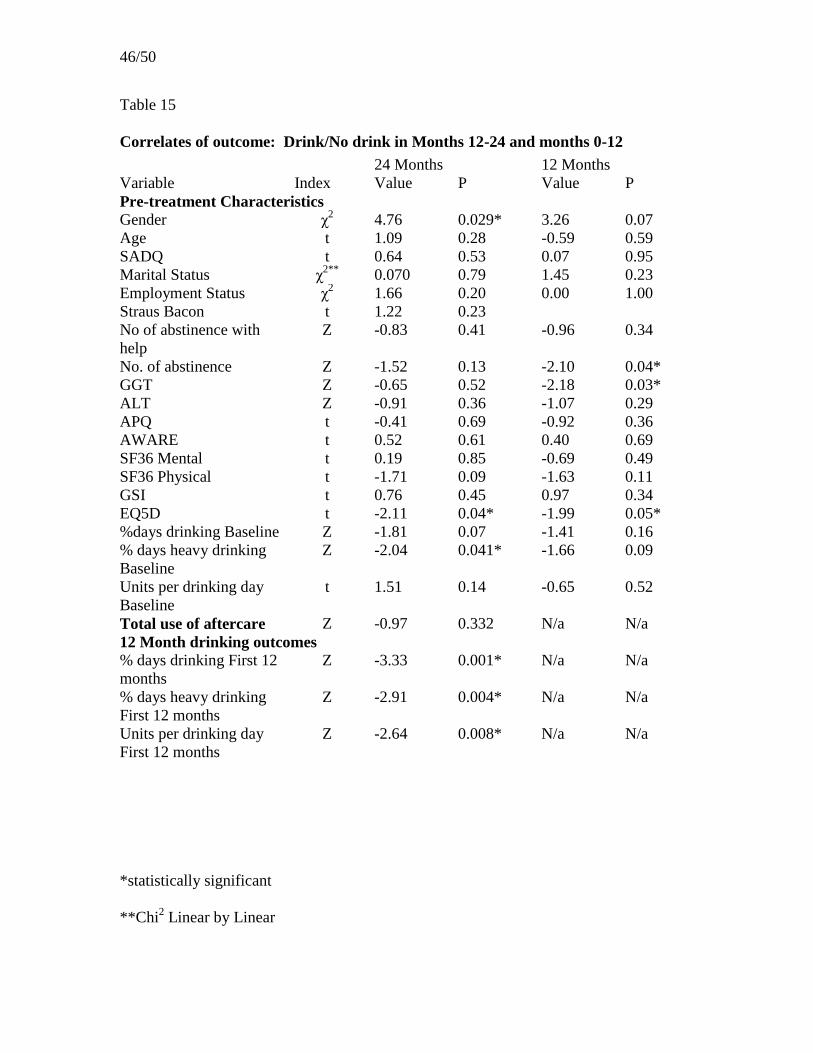
Correlates of drinking status: Months 12 to 24
Participants that drank at all in the second follow-up year had drank more frequently (Z=
--3.33, p=0.001), had drank heavily more frequently (z = -2.87, p = 0.004) and had drank
more units per drinking day (z = -2.64, p = 0.008) during the first 12 months of the study
than participants that were abstinent in the second follow-up year. Furthermore,
participants who drank during this period had drank heavily less frequently at baseline (z
= -2.04, p = 0.041) and scored significantly better on the EQ5D at the beginning of the
trial (t = -2.11, p = 0.04) than those that were abstinent. Values are summarised in Table
15. Five of the 48 statistics computed were significant at the 0.05 level.
Correlates of drinking status: Months 0 to 12
Participants that drank at all in the first follow-up year had significantly more episodes of
abstinence before entering the trial than those that were abstinent (z=-2.10, p=0.04).
Values are summarised in Table 15 Furthermore, participants who drank during this
period scored significantly better on the EQ5D (indicating higher quality of life) (t = -
1.99, p=0.05) and had higher GGT blood levels (z=-2.18, p=0.03) at the beginning of the
trial than those who abstained. Three of the 40 statistics computed were significant at the
0.05 level.
DISCUSSION
The main aim of the study was to establish whether the significant treatment effects
identified at one year were maintained over the next year: it failed to find evidence that
22/50
this was the case. The significant effects observed over the first follow-up year were
based on a larger sample, with greater potential to observe a moderate treatment effect:
the smaller follow-up sample had less power to detect a similar effect if it occurred. In
the event the levels of drinking in the two groups at final follow-up were almost identical.
Such treatment effects as had occurred at 12 months no longer existed.
The secondary aim was to examine potential correlates of drinking outcome. Given that
so few pre-treatment characteristics among so many were significantly related to outcome
it is difficult to attribute these to anything but chance. No strong or consistent
relationships between pre-treatment characteristics and outcome were observed.
When the sample as a whole is considered it is striking how little patterns of drinking
changed from 12 months to final follow-up. The drinking status of the total sample
during the final four months was reasonable good, with 40% of participants abstinent and
30% drinking but not heavily. The contrast between this picture and the fact that only
17% never drank at all during the whole follow-up period shows that drinking on one
occasion did not lead to continued drinking over the remainder of the follow-up period.
The information on the utilisation of services by participants illustrates that many
drinkers who returned to regular drinking soon attempt to stop again.
Carrying out long-term follow-ups is a difficult and time-consuming task, even when
solid preparations have been made for this venture, as happened in this study. Despite
making considerable efforts to do so, only half of those followed up were interviewed
23/50
within three months of their 24-month ‘anniversary’. There is the possibility that those
who were interviewed later differed systematically in some way from those followed up
on time, for example that they only chose to be interviewed when they had stopped
drinking or were drinking little. The observation that the drinking outcomes of groups of
people followed up at different times were so similar might imply that follow-up studies
need not take such pains as were taken here to track down and interview hard-to-find
participants (who were interviewed last).
The 12 months result of the trial failed to detect the hypothesised relapse prevention
effect of the novel intervention: this failed to produce a significant reduction in the
recurrence of any drinking (the primary outcome variable). Nevertheless it did detect
clinically worthwhile improvements. The EWSRPT produced significant reductions in
the occurrence of any heavy drinking during the first follow-up year, in the frequency of
drinking and heavy drinking. No significant treatment effect was detected on non-
drinking variables. The effects on drinking are particularly important for a population
selected for its history of repeatedly failing to make lasting change and also for the
context, of having ready access to a range of aftercare support. Producing clinically
significant improvements in outcome beyond those of “treatment as usual” is noteworthy,
given the severity of the population investigated and the quality of “treatment as usual”.
The results provide an affirmative answer to the pragmatic question posed in the
Introduction - as to whether adding this approach to treatment improves the long-term
outcome of treatment. Therefore the results justify the use of EWSRPT with similar
patients being treated in similar services, when the aim is to minimise drinking. They
24/50
possibly justify adoption where the only acceptable outcome is achieving total
abstinence, which is the aim of the approach. The results also suggest that the approach
is worthy of further clinical research.
The design of the study precludes the possibility of identifying the mechanism by which
the experimental treatment achieved its effects at twelve months. It cannot differentiate
between, for example, features that are specific to this approach (e.g. identifying warning
signs), and others which may be common to many approaches (e.g. seeing a helper
weekly on an individual basis). Since this study has established that this approach is
efficacious, there would be value in further controlled research to test the hypothesis that
there is specific value in helping people identify and act on their early warning signs of
relapse. Finding differential change between the two groups in the measure of warning
signs (AWARE) would have lent some support for the hypothesized mode of action of
the relapse prevention programme. The logic of the early warning signs approach is that
people become better able to identify small warning signs that arise early when things
start to go wrong. As a result of this they can act to interrupt the process, and thus avoid
experiencing further, possibly more intense warning signs. The lack of differential effect
on AWARE scores may result from there being no effect to detect, but it may be due to
the fact that this standard list of putative warning signs is not a sensitive index of the
occurrence of participants’ idiosyncratic patterns of changes. This omnibus measure of
37 experiences is probably too coarse to capture the dozen or so individual signs typically
discovered by each patient undergoing EWSRPT. There might be value in constructing
more individualised measures.
25/50
The significant treatment effects observed at twelve months were confined to measures of
drinking. The lack of effects on nondrinking variables (e.g. the APQ) is probably due to
the fact that changes in such variables are only moderately linked to changes in drinking.
Therefore a fairly strong treatment effect, in reducing the recurrence of drinking, would
have been necessary to cause an impact of the experiment on these measures.
The internal validity of the study is strengthened by the high quality of treatment
provided (delivered by experienced trained therapists in conditions that ensured
adherence to the treatment protocol), the robust independent nature of randomisation, and
the high degree of follow-up. The external validity is strengthened by the high level of
participation in the study by eligible patients, and the fact that the participants had a range
of serious problems in their close relationships and employment status, as well as a high
degree of dependence on alcohol, and a history of repeated treatment episodes without
sustained benefit. The willingness of patients to participate in the trial and the fairly high
engagement of those receiving the relapse prevention treatment suggest that this type of
intervention is acceptable and makes sense to service users. EWSRPT seems to be
capable of being provided by currently available specialist services, such as the day
programme in this case. The therapists in this study were very experienced and had
systems to ensure supervision and adherence to the approach. Questions remain about
how experienced and skilled therapists need to be in order for them to acquire the skills to
carry out this therapy, and about what intensity of training and supervision may be
required.
26/50
The study could have been strengthened by having independent monitoring of what went
on during individual EWSRPT sessions, to demonstrate the extent that therapists
followed the protocol. Audiotapes and transcripts of these were only used for this purpose
in supervision. Although research assistants who performed the follow-ups were not
informed about the condition to which participants had been allocated, it was not possible
to blind them to the comments made to them by participants which informed them of this
fact.
That the effects on drinking exerted by this hitherto unevaluated approach which were
evident at 12 months could not be detected a year or so later does not detract from its
potential value. Alcohol dependent people whose attempts to stop drinking last only a
few months do not all continue to drink steadily: many stop again, and some of these
resume drinking and stop again during a period of two years. They exist in a world with
many factors simultaneously stimulate their desires to drink or not to drink, to stay as
they are or to use the various sources of formal or informal help available to them. This
complex pattern of change may be one reason why the effects of interventions which are
not extremely strong are not discernable two years on.
27/50
REFERENCES
Abramson, J.H., & Gahliner, P.M. (1999) Computer programs for epidemiologists:
PEPI Version 3. Brixton Books: London,
American Psychiatric Association (1994) Diagnostic and Statistical Manual of
Mental Disorders DSM-IV American Psychiatric Press: New York
Bennett, G.A., Withers, J., Thomas, P.W., Higgins, D.S., Bailey, J., Parry, L. and Davies,
E. (submitted for publication). A randomised trial of Early Warning Signs
Relapse Prevention Training in the treatment of alcohol dependence
Conigrave, K.M., Davies, P., Haber, P., & Whitfield, J.,B. (2003) Traditional markers
of excessive alcohol use. Addiction, 98, 31-43
Dench, S., & Bennett, G.A.. (2000) The impact of brief motivational intervention at
the start of an outpatient day programme for alcohol dependence.
Behavioural and Cognitive Psychotherapy, 28, 121-130.
Derogatis, L.R., & Melisaratos, N. (1983) The brief symptoms inventory: An
introductory report. Acta Psychiatrica Scandinavica, 13, 595-605.
Garbutt, J.C., West, S. L., Carey, T. S., Lohr, K. N., & Crews, F.T. (1999)
Pharmacological treatment of alcohol dependence: a review of the evidence.
Journal of the American Medical Association, 281, 1318-1325.
Gorski, T. (1989) The CENAPS model of relapse prevention planning. Journal of
Chemical Dependency Treatment, 2, 153-169.
Gorski, T. (1990)The CENAPS model of relapse prevention: basic principles and
procedures. Journal of Psychoactive Drugs. 22, 125-133.
Gorski, T. (1995) Relapse Prevention Therapy Workbook: Managing Core

28/50
Personality and Lifestyle Issues. Herald House, Independence MO.
Irvin, J.E., Bowers, C.A., Dunn, M.E., & Wang, M.C. (1999) Efficacy of relapse
prevention: a meta-analytic review. Journal of Consulting and Clinical
Psychology, 67, 563-70,
Lowman, C., Allen, J., Stout, R.L., & The Relapse Research Group (1996)
Replication and extension of Marlatt’s taxonomy of relapse precipitants:
overview of procedure and results. Addiction. 91: (Supplement), S51- -S71.
Marlatt, G.A., & Gordon, J. (1985) Relapse Prevention. New York, Guilford Press.
Miller, WR, and Wilborne, PL. (2002) Mesa Grande: a methodological analysis of
clinical trials of treatments for alcohol use disorders. Addiction, 97, 265-277.
Miller, W.R., Heather, N., & Hall, W.. (1991) Calculating standard drink units:
international comparisons. British Journal of Addiction, 86, 43-47.
Miller, W.R., & Harris, R.J. (2000) A simple scale of Gorski’s warning signs for
relapse. Journal of Studies on Alcohol, 61, 759-763.
Project MATCH Research Group. (1997) Matching alcoholism treatments to client
heterogeneity: Project MATCH Post treatment drinking outcomes. Journal
of Studies on Alcohol, 58, 7-29.
Srisurapanont, M., & Jarusuraisin, N. (2002) Opioid antagonists for alcohol
dependence (Cochrane Review). In: The Cochrane Library, Issue 4, Oxford:
Update Software.
Stockwell, T., Murphy, D., & Hodgson, R. (1983) The Severity Of Alcohol
Dependence Questionnaire: Its use, reliability and validity. British Journal of
Addiction, 78, 45-156.
29/50
Straus, R., & Bacon, S.D. (1951) A Study of occupational integration of 2023 male
clinic patients. Quarterly Journal of Studies of Alcoholism, 12, 231-260.
The EuroQol Group (1990) EuroQol--a new facility for the measurement of health-
related quality of life. Health Policy, 16, 199-208.
Ware J.E., Kosinski, M., & Keller, S.D. (1994). SF 36 Physical and Mental Health
Summary Scales: A User's Manual. MA: The Health Institute, New England
Medical Center.
Williams, B.T., & Drummond, D.C. (1994) The Alcohol Problems Questionnaire:
reliability and validity. Drug and Alcohol Dependence, 35, 239-243.

30/50
Table 1
Number of final follow-up interviews completed in each follow-up month
Follow-up Month Frequency Percent Cumulative Percent
=<25 25 24.5 24.5
26 14 13.7 38.2
27 10 9.8 48.0
28 7 6.9 54.9
29 9 8.8 63.7
30 6 5.9 69.6
31 3 2.9 72.5
32 4 3.9 76.5
33 4 3.9 80.4
34 5 4.9 85.3
35 2 2.0 87.3
37 4 3.9 91.2
40 2 2.0 93.1
41 3 2.9 96.1
43 1 1.0 97.1
48 1 1.0 98.0
52 1 1.0 99.0
54 1 1.0 100.0

31/50
Table 2
Comparisons of pre-treatment characteristics of participants in the ‘not seen’ follow-up
sample and ‘total’ follow-up sample
Total Seen Not seen Comparison
n = 102 n = 18 Index P
a) n % n % Chi2 df
gender
male 64 63% 11 61% 0.02 1 0.90
marital status
single 44 43% 6 33% 0.41* 1 0.52
married/separated 28 28% 6 33%
divorced 30 29% 6 33%
employment status
employed 14 14% 3 17% 0.11 1 0.74
b) median iqr median iqr z P
alcohol treatments 2 4 2.5 5.3 -0.43 0.67
episodes abstinence 5 9 8 6.8 -0.31 0.76
% days drinking 77.5 47.7 82.5 34.6 -0.34 0.74
GGT (U/L) 21.8 23.5 22.0 49.0 -0.19 0.85
ALT (U/L) 24.4 14.2 24.1 17.0 -0.79 0.43
c) mean sd mean sd F df P
age 43.3 10.4 40.0 11.8 1.46 1 0.23
SADQ 34.5 12.4 39.0 11.3 2.04 1 0.16
Strauss Bacon index 1.8 1.4 1.3 1.2 1.9 1 0.17
units /drinking day 30.1 14.2 28.8 25.4 0.11 1 0.74
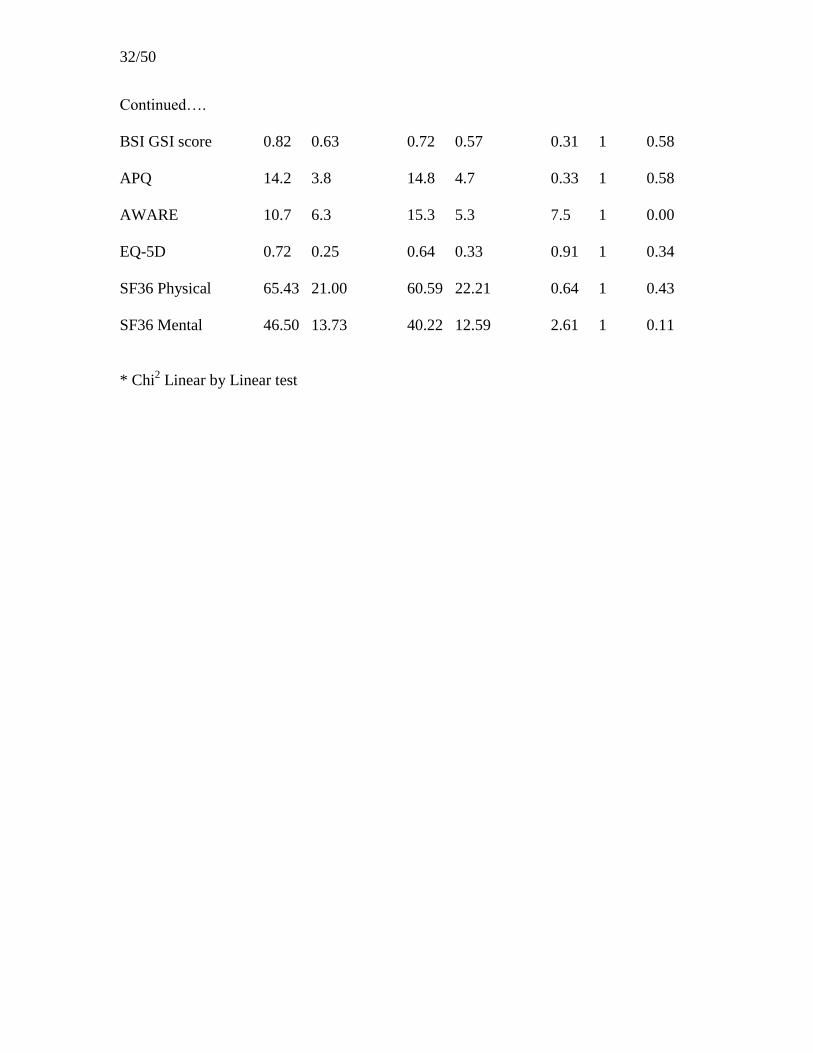
32/50
Continued….
BSI GSI score 0.82 0.63 0.72 0.57 0.31 1 0.58
APQ 14.2 3.8 14.8 4.7 0.33 1 0.58
AWARE 10.7 6.3 15.3 5.3 7.5 1 0.00
EQ-5D 0.72 0.25 0.64 0.33 0.91 1 0.34
SF36 Physical 65.43 21.00 60.59 22.21 0.64 1 0.43
SF36 Mental 46.50 13.73 40.22 12.59 2.61 1 0.11
* Chi2 Linear by Linear test
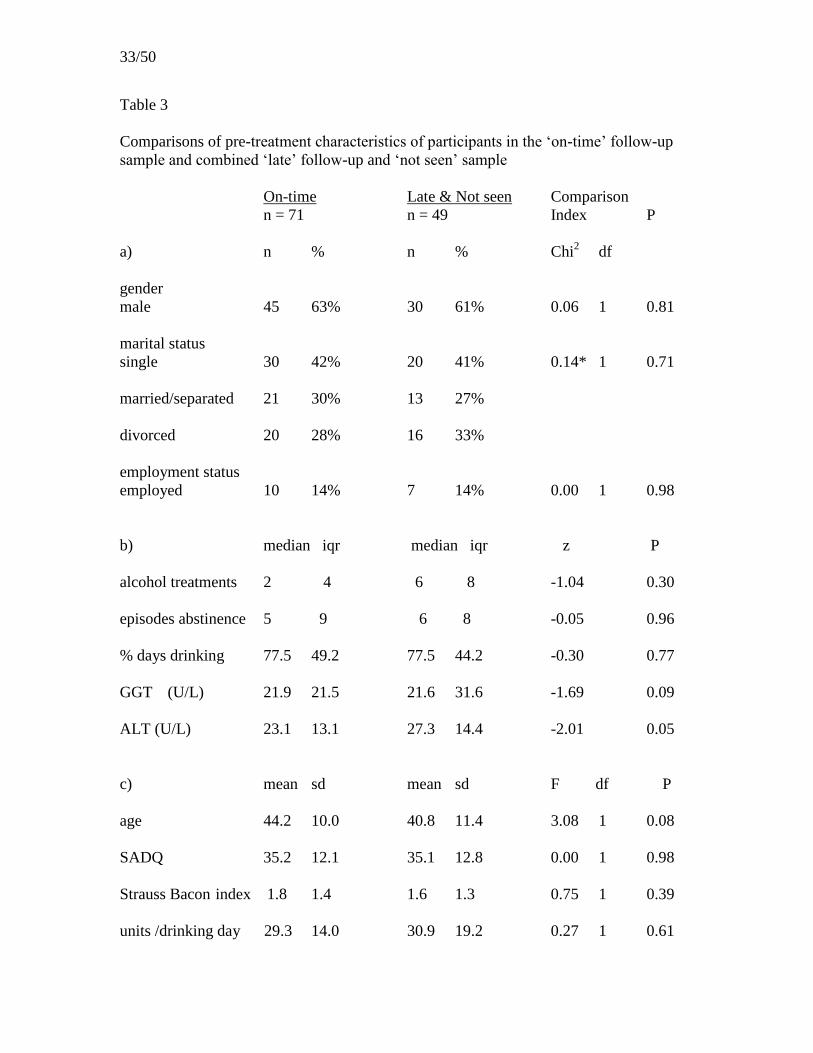
33/50
Table 3
Comparisons of pre-treatment characteristics of participants in the ‘on-time’ follow-up
sample and combined ‘late’ follow-up and ‘not seen’ sample
On-time Late & Not seen Comparison
n = 71 n = 49 Index P
a) n % n % Chi2 df
gender
male 45 63% 30 61% 0.06 1 0.81
marital status
single 30 42% 20 41% 0.14* 1 0.71
married/separated 21 30% 13 27%
divorced 20 28% 16 33%
employment status
employed 10 14% 7 14% 0.00 1 0.98
b) median iqr median iqr z P
alcohol treatments 2 4 6 8 -1.04 0.30
episodes abstinence 5 9 6 8 -0.05 0.96
% days drinking 77.5 49.2 77.5 44.2 -0.30 0.77
GGT (U/L) 21.9 21.5 21.6 31.6 -1.69 0.09
ALT (U/L) 23.1 13.1 27.3 14.4 -2.01 0.05
c) mean sd mean sd F df P
age 44.2 10.0 40.8 11.4 3.08 1 0.08
SADQ 35.2 12.1 35.1 12.8 0.00 1 0.98
Strauss Bacon index 1.8 1.4 1.6 1.3 0.75 1 0.39
units /drinking day 29.3 14.0 30.9 19.2 0.27 1 0.61
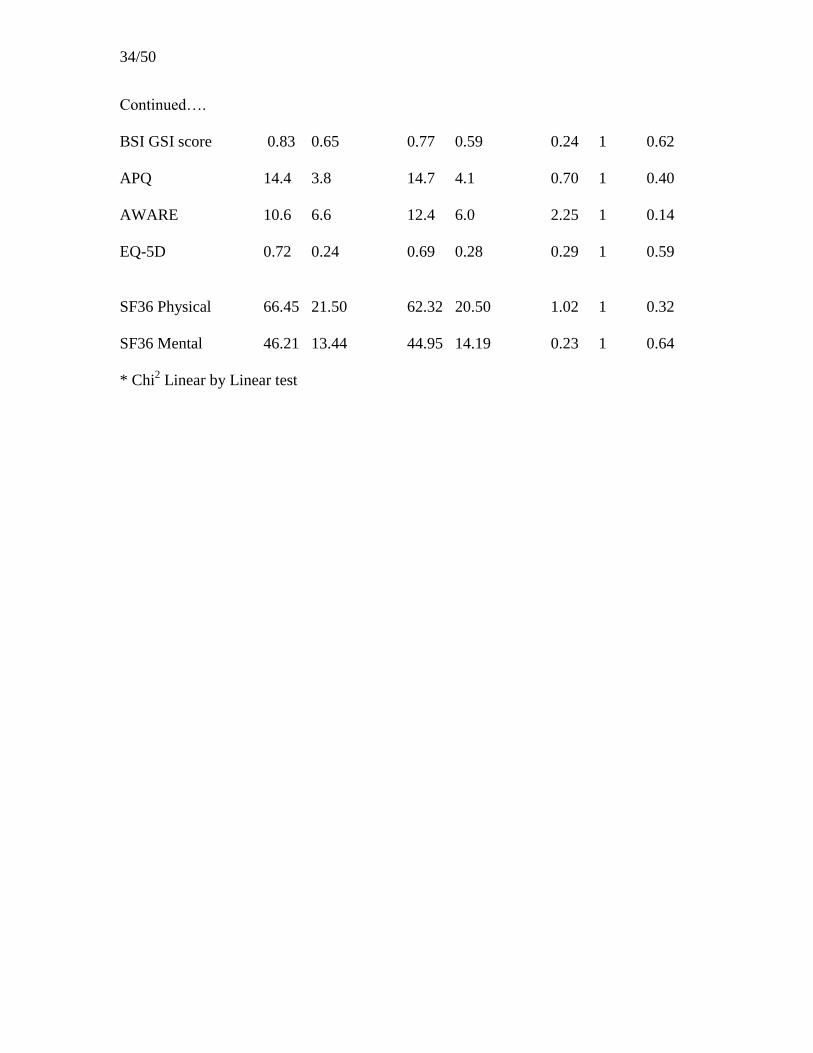
34/50
Continued….
BSI GSI score 0.83 0.65 0.77 0.59 0.24 1 0.62
APQ 14.4 3.8 14.7 4.1 0.70 1 0.40
AWARE 10.6 6.6 12.4 6.0 2.25 1 0.14
EQ-5D 0.72 0.24 0.69 0.28 0.29 1 0.59
SF36 Physical 66.45 21.50 62.32 20.50 1.02 1 0.32
SF36 Mental 46.21 13.44 44.95 14.19 0.23 1 0.64
* Chi2 Linear by Linear test

35/50
Table 4
The occurrence of drinking in the 4 months leading up to final interview
EWSRPT AU Chi2 P
n % n %
On-time follow-up sample (n = 71)
never drank 13 41 18 46 0.22 0.64
ever drank 19 59 21 54
Total follow-up sample (n = 102)
never drank 21 41 22 43 0.04 0.84
ever drank 30 59 29 57

36/50
Table 5
The occurrence of heavy drinking (3 consecutive days of consuming >8 units each day)
in the 4 months leading up to interview
EWSRPT AU Chi2 P
n % n %
On-time follow-up sample (n = 70)
never drank heavily 22 69 26 69 0.00 0.98
ever drank heavily 10 31 12 31
Total follow-up sample (n = 101)
never drank heavily 36 71 35 70 0.00 0.95
ever drank heavily 15 29 15 30
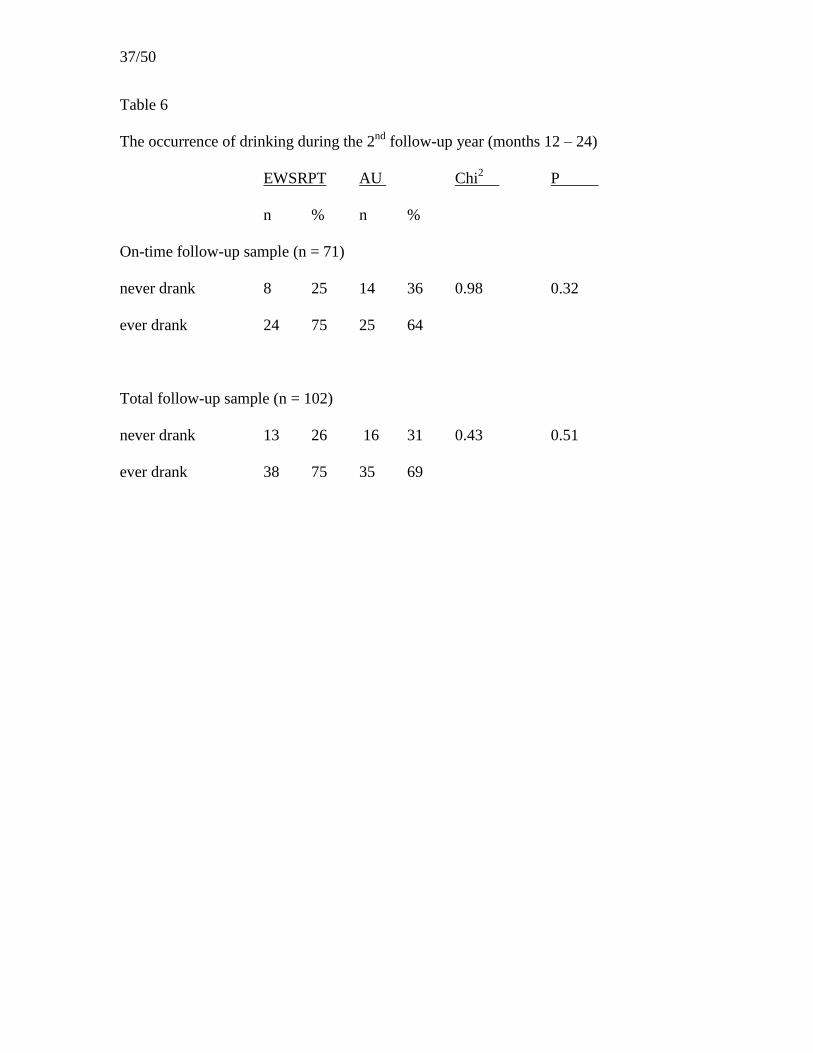
37/50
Table 6
The occurrence of drinking during the 2nd
follow-up year (months 12 – 24)
EWSRPT AU Chi2 P
n % n %
On-time follow-up sample (n = 71)
never drank 8 25 14 36 0.98 0.32
ever drank 24 75 25 64
Total follow-up sample (n = 102)
never drank 13 26 16 31 0.43 0.51
ever drank 38 75 35 69

38/50
Table 7
The occurrence of drinking during the entire 2-year follow-up period (months 1 – 24)
EWSRPT AU Chi2 P
n % n %
On-time follow-up sample (n = 71)
never drank 5 16 7 18 0.07 0.80
ever drank 27 84 32 82
Total follow-up sample (n = 102)
never drank 10 20 8 16 0.27 0.60
ever drank 41 80 43 84

39/50
Table 8
The frequency of drinking during the 4 months leading up to 2-year interview
EWSRPT AU Chi2* P
Percent days drinking
n % n %
On-time follow-up sample (n = 70)
0% days 13 41 18 47 0.08 0.78
1-13% days 6 19 7 18
14-47% days 7 22 4 11
47+% days 6 19 9 24
Total follow-up sample (n = 102)
0% days 21 41 22 44 0.12 0.73
1-13% days 10 20 8 16
14-47% days 12 24 7 14
47+% days 8 16 13 26
*Chi2
Linear by Linear
40/50
Table 9
The frequency of heavy drinking during the 4 months leading up to 2-year interview
EWSRPT AU Chi2*
P
Percent days heavy drinking
n % n %
On-time follow-up sample (n = 70)
0% days 20 63 21 55 0.23 0.64
1-13% days 2 6 6 16
14-47% days 6 19 3 8
47+% days 4 13 8 21
Total follow-up sample (n = 102)
0% days 31 61 28 56 0.25 0.61
1-13% days 5 10 8 16
14-47% days 9 18 4 8
47+% days 6 12 10 20
*Chi2
Linear by Linear
41/50
Table 10
The amount of alcohol consumed on drinking days during the 4 months leading up to 2-
year interview
EWSRPT AU Chi2*
P
Units per drinking day
n % n %
On-time follow-up sample (n = 70)
0 units 13 41 18 47 0.60 0.44
1-10 units 9 28 10 26
11-19 units 5 16 7 18
20+ units 5 16 3 8
Total follow-up sample (n = 101)
0 units 21 41 22 44 0.62 0.43
1-10 units 12 24 14 28
11-19 units 7 14 7 14
20+ units 11 22 7 14
*Chi2
Linear by Linear
42/50
Table 11
Blood levels of GGT and ALT
EWSRPT AU
On-time follow-up sample (n = 57)
median iqr median iqr z P
GGT 18.2 97.6 20.2 25.8 -0.05 0.96
ALT 20.5 31.1 20.4 13.3 -0.26 0.79
Total follow-up sample (n = 82)
GGT 18.1 41.2 21.6 24.3 -0.71 0.48
ALT 20.5 19.7 20.1 17.9 -0.23 0.78
43/50
Table 12
Comparisons of variables other than drinking at final interview
EWSRPT AU Comparison
Index
On-time follow-up sample
mean sd mean sd t df P
SF36 Physical 63.97 23.39 67.08 19.38 0.64 67 0.53
SF36 Mental 47.44 17.69 49.30 17.77 0.43 67 0.67
GSI 1.02 0.80 0.98 0.89 -0.22 67 0.83
AWARE 10.4 6.8 11.7 7.5 0.74 68 0.46
EQ-5D 0.64 0.29 0.64 0.29 0.00 68 1.00
median iqr median iqr z P
APQ 1.5 9.0 2.0 9.3 -0.16 0.87
Total follow-up sample
mean sd mean sd t df P
SF36 Physical 68.00 21.42 66.00 19.79 -0.48 97 0.63
SF36 Mental 50.12 17.56 49.19 17.27 -0.27 97 0.79
GSI 0.96 0.74 0.95 0.85 -0.02 95 0.98
AWARE 10.0 6.4 11.1 7.2 0.78 98 0.44
EQ-5D 0.66 0.30 0.64 0.30 -0.40 97 0.70
median iqr median iqr z P
APQ 1.0 9.0 2.0 8.0 -0.24 0.81

44/50
Table 13
Comparisons of cost of the use made of health and rehabilitation services
EWSRPT AU
median iqr median iqr z P
On-time follow-up sample
Total Cost £ 209.17 559.52 174.14 891.83 -0.45 0.65
Total follow-up sample
Total Cost £ 165.59 444.94 165.59 725.92 -0.45 0.96
45/50
Table 14
Correlates of outcome: Drink/No drink in the 4 months leading up to 24 month and
12 month interview
* statistically significant
**Chi2 Linear by Linear
24 Months 12 Months
Variable Index Value P Value P
Pre-treatment Characteristics Gender χ
2 0.18 0.67 2.70 0.10
Age t 0.57 0.57 -1.08 0.28
SADQ t 0.35 0.72 0.07 0.94
Marital Status χ2**
0.47 0.49 0.87 0.35
Employment Status χ2 0.40 0.52 0.55 0.46
Straus Bacon t 0.92 0.36
No of abstinence with
help
Z -0.70 0.49 -0.78 0.44
No. of abstinence Z -1.23 0.22 -1.96 0.05*
GGT Z -1.52 0.13 -1.59 0.11
ALT Z -0.60 0.55 -1.55 0.12
APQ t 0.17 0.87 0.08 0.53
AWARE t 1.11 0.27 0.63 0.53
SF36 Mental t -0.43 0.66 -0.62 0.53
SF36 Physical t -1.37 0.18 -1.44 0.15
GSI t 0.93 0.36 0.52 0.61
EQ5D t -2.64 0.01* -1.37 0.17
%days drinking Baseline Z -1.64 0.10 -1.08 0.28
% days heavy drinking
Baseline
Z -1.81 0.07 -1.00 0.32
Units per drinking day
Baseline
t 1.17 0.25 -0.15 0.88
Total use of aftercare Z -1.01 0.31 N/a N/a
12 Month drinking outcomes % days drinking First 12
months
Z -2.95 0.003* N/a N/a
% days heavy drinking
First 12 months
Z -2.87 0.004* N/a N/a
Units per drinking day
First 12 months
Z -2.10 0.04* N/a N/a
46/50
Table 15
Correlates of outcome: Drink/No drink in Months 12-24 and months 0-12
*statistically significant
**Chi2 Linear by Linear
24 Months 12 Months
Variable Index Value P Value P
Pre-treatment Characteristics Gender χ
2 4.76 0.029* 3.26 0.07
Age t 1.09 0.28 -0.59 0.59
SADQ t 0.64 0.53 0.07 0.95
Marital Status χ2**
0.070 0.79 1.45 0.23
Employment Status χ2 1.66 0.20 0.00 1.00
Straus Bacon t 1.22 0.23
No of abstinence with
help
Z -0.83 0.41 -0.96 0.34
No. of abstinence Z -1.52 0.13 -2.10 0.04*
GGT Z -0.65 0.52 -2.18 0.03*
ALT Z -0.91 0.36 -1.07 0.29
APQ t -0.41 0.69 -0.92 0.36
AWARE t 0.52 0.61 0.40 0.69
SF36 Mental t 0.19 0.85 -0.69 0.49
SF36 Physical t -1.71 0.09 -1.63 0.11
GSI t 0.76 0.45 0.97 0.34
EQ5D t -2.11 0.04* -1.99 0.05*
%days drinking Baseline Z -1.81 0.07 -1.41 0.16
% days heavy drinking
Baseline
Z -2.04 0.041* -1.66 0.09
Units per drinking day
Baseline
t 1.51 0.14 -0.65 0.52
Total use of aftercare Z -0.97 0.332 N/a N/a
12 Month drinking outcomes % days drinking First 12
months
Z -3.33 0.001* N/a N/a
% days heavy drinking
First 12 months
Z -2.91 0.004* N/a N/a
Units per drinking day
First 12 months
Z -2.64 0.008* N/a N/a

47/50
Table 16
Correlates of outcome: Percentage days drinking in the 4 months leading up to final
interview
*statistically significant
**Chi2 Kruskal wallis
1 Pearsons r
2
Spearmans p
24 Months 12 Months
Variable Index Value P Value P
Pre-treatment Characteristics
Gender Z -1.08 0.28 -2.66 0.008*
Age r1 -0.09 0.38 0.04 0.66
SADQ r1 0.04 0.71 0.07 0.53
Marital Status χ2 **
4.17 0.13 1.55 0.46
Employment Status Z -0.59 0.55 -0.64 0.52
Straus Bacon r1 -0.15 0.15 0.01 0.91
No of abstinence with
help
p2 0.17 0.09 0.13 0.19
No. of abstinence p2 0.17 0.08 0.20 0.04*
GGT p2 0.14 0.18 0.11 0.29
ALT p2 0.00 0.96 0.06 0.59
APQ r1 0.14 0.18 0.13 0.19
AWARE r1 0.03 0.74 0.01 0.94
SF36 Mental r1 0.03 0.81 0.07 0.49
SF36 Physical r1 0.09 0.41 0.19 0.07
GSI r1 -0.01 0.96 -0.41 0.70
EQ5D r1 0.14 0.18 0.03 0.77
%days drinking
Baseline
p2 -0.07 0.47 0.03 0.78
% days heavy drinking
Baseline
p2 -0.06 0.52 -0.00 0.99
Units per drinking day
Baseline
r1 0.05 0.65 0.01 0.96
Total use of aftercare p2 -0.17 0.08 N/a N/a
12 Month drinking outcomes
% days drinking First 12
months
p2 0.40 0.000* N/a N/a
% days heavy drinking
First 12 months
p2 0.41 0.000* N/a N/a
Units per drinking day
First 12 months
p2 0.28 0.006* N/a N/a
48/50
Table 17
Comparison of drinking status of participants followed up On-time and those followed
up Later : whether or not they drank or drank heavily during 4 months prior to final
interview
The occurrence of any drinking in the 4 months leading up to final interview
On time Late follow-up Chi2 P
n % n %
never drank 31 44 12 39 0.22 0.64
ever drank 40 56 19 61
The occurrence of heavy drinking (3 consecutive days of consuming >8 units each day)
in the 4 months leading up to final interview
ever drank heavily 48 69 23 74 0.33 0.57
ever drank heavily 22 31 8 26

49/50
Table 18
Comparison of drinking status of participants followed up On-time and those followed
up Late : frequency of drinking and heavy drinking
On time Late Chi2* P
Percent days drinking
n % n %
0% days 31 44 12 39 0.20 0.66
1-13% days 13 19 5 16
14-47% days 11 16 8 26
47+% days 15 21 6 19
Percent days heavy drinking
0% days 41 59 18 58 0.10 0.75
1-13% days 8 11 5 16
14-47% days 9 13 4 13
47+% days 12 17 4 13
50/50
Table 19
Comparison of drinking status of participants followed up On-time and those followed
up Late : units of alcohol consumed per drinking day
On-time Late Chi2*
P
Units per drinking day
n % n %
0 units 31 44 12 39 2.23 0.14
1-10 units 19 27 7 23
11-19 units 12 17 2 6
20+ units 8 11 10 32