report - publications.gov.sk.capublications.gov.sk.ca/documents/66/89481-2015-003eisannexi.pdf ·...
TRANSCRIPT
March 2015
ANNEX I ATMOSPHERIC AND ACOUSTIC ENVIRONMENT BASELINE REPORT
Yancoal Southey Project
REPO
RT
Report Number: 12-1362-0197.DCN-042A
Submitted to: Jiqiu Han, President Yancoal Canada Resources Company Limited Unit 300, 211 - 4th Avenue Saskatoon, Saskatchewan S7K 1N1

ANNEX I ATMOSPHERIC ENVIRONMENT BASELINE REPORT
List of Abbreviations
Abbreviation Term
a.m. ante meridiem or before noon AER Alberta Energy Regulator ASL ambient sound level AQMG Air Quality Modelling Guideline CAAQS Canadian Ambient Air Quality Standards CO carbon monoxide CN Canadian National CP Canadian Pacific Directive 038 Alberta Energy Regulator (AER) Directive 038: Noise Control Directive EIS Environmental Impact Statement EUB Alberta Energy and Utilities Board IDF Intensity-duration-frequency GPAZ Great Plains Air Zone Leq,1hr sound level over a one-hour time period Leq,1min sound level over a one-minute time period Leq,day equivalent energy sound levels for the daytime period Leq,night equivalent energy sound levels for the nighttime period LFN low frequency noise LSA local study area LST local standard time MOE Ministry of Environment NaCl sodium chloride NO2 nitrogen dioxide NOx oxides of nitrogen PM particulate matter PM10 particulate matter nominally less than or equal to 10 micrometres in aerodynamic diameter PM2.5 particulate matter nominally less than or equal to 2.5 micrometres in aerodynamic diameter p.m. post meridiem or after noon PFRA Prairie Farm Rehabilitation Administration Project Yancoal Southey Project PMP probable maximum precipitation R.M. Rural Municipality RSA regional study area SAAQS Saskatchewan Ambient Air Quality Standards SLM sound level meter SO2 sulphur dioxide TMA tailings management area TOR Terms of Reference TSP total suspended particulate matter
March 2015 Report No. 12-1362-0197.DCN-042A i

ANNEX I ATMOSPHERIC ENVIRONMENT BASELINE REPORT
List of Abbreviations (continued)
Abbreviation Term
UTM Universal Transverse Mercator W2M West of the Second Meridian Yancoal Yancoal Canada Resources Company Limited
List of Units
Abbreviation Term
% percent °C degrees Celsius µg/m3 micrograms per cubic metre cm centimetre dB decibel dBA A-weighted noise level dBC C-weighted noise level dBZ sound levels that have no weight applied h hour ha hectare Hz hertz km kilometre km2 square kilometre km/h kilometres per hour kPa kilopascal LAeq A-weighted Equivalent Sound level LA90 90th Percentile sound level (the sound level that is exceeded 90% of the time) m metre m/s metres per second min minute mm millimetre mm/h millimetres per hour Mtpa million tonnes of potash per year ppm parts per million
March 2015 Report No. 12-1362-0197.DCN-042A ii

ANNEX I ATMOSPHERIC ENVIRONMENT BASELINE REPORT
Table of Contents
1.0 INTRODUCTION ............................................................................................................................................................... 1
1.1 Project Overview .................................................................................................................................................. 1
1.2 Objective of the Baseline Report ......................................................................................................................... 1
2.0 CLIMATE .......................................................................................................................................................................... 1
2.1 Introduction .......................................................................................................................................................... 1
2.2 Study Area ........................................................................................................................................................... 2
2.3 Methods ............................................................................................................................................................... 2
2.4 Results ................................................................................................................................................................. 2
2.4.1 Regional Climate Classification ...................................................................................................................... 2
2.4.2 Precipitation ................................................................................................................................................... 3
2.4.2.1 Rainfall, Snowfall, and Total Precipitation ................................................................................................... 3
2.4.2.2 Rainfall Intensity, Duration, and Frequency ................................................................................................ 5
2.4.2.3 Probable Maximum Precipitation ................................................................................................................ 5
2.4.3 Temperature .................................................................................................................................................. 6
2.4.4 Wind ............................................................................................................................................................... 6
2.4.5 Gross Evaporation, Blowing Snow, and Sublimation ..................................................................................... 9
2.4.6 Sunshine, Humidity, and Pressure ................................................................................................................. 9
2.5 Summary ........................................................................................................................................................... 10
3.0 AIR QUALITY ................................................................................................................................................................. 11
3.1 Introduction ........................................................................................................................................................ 11
3.2 Study Area ......................................................................................................................................................... 11
3.3 Methods ............................................................................................................................................................. 11
3.4 Results ............................................................................................................................................................... 12
3.5 Summary ........................................................................................................................................................... 13
4.0 ACOUSTIC ENVIRONMENT .......................................................................................................................................... 14
4.1 Introduction ........................................................................................................................................................ 14
4.2 Study Areas and Receptors ............................................................................................................................... 14
4.3 Methods ............................................................................................................................................................. 16
4.3.1 Noise Regulations ........................................................................................................................................ 16
March 2015 Report No. 12-1362-0197.DCN-042A i

ANNEX I ATMOSPHERIC ENVIRONMENT BASELINE REPORT
Table of Contents (continued)
4.3.2 Monitoring Methods...................................................................................................................................... 17
4.3.3 Data Analysis Approach ............................................................................................................................... 17
4.3.3.1 Broadband Noise Analysis Approach ....................................................................................................... 18
4.3.3.2 Low Frequency Noise Analysis Approach ................................................................................................ 19
4.4 Results ............................................................................................................................................................... 19
4.4.1 Monitoring Location R1 ................................................................................................................................ 19
4.4.1.1 Broadband Noise Results ......................................................................................................................... 20
4.4.1.2 Low Frequency Noise Results .................................................................................................................. 22
4.4.2 Monitoring Location R2 ................................................................................................................................ 23
4.4.2.1 Broadband Noise Results ......................................................................................................................... 24
4.4.2.2 Low Frequency Noise Results .................................................................................................................. 25
4.4.3 Monitoring Location R8 ................................................................................................................................ 26
4.4.3.1 Broadband Noise Results ......................................................................................................................... 27
4.4.3.2 Low Frequency Noise Results .................................................................................................................. 28
4.4.4 Monitoring Location R15 .............................................................................................................................. 29
4.4.4.1 Broadband Noise Results ......................................................................................................................... 30
4.4.4.2 Low Frequency Noise Results .................................................................................................................. 31
4.5 Summary ........................................................................................................................................................... 32
5.0 GLOSSARY .................................................................................................................................................................... 33
6.0 REFERENCES ................................................................................................................................................................ 36
March 2015 Report No. 12-1362-0197.DCN-042A ii

ANNEX I ATMOSPHERIC ENVIRONMENT BASELINE REPORT
Table of Contents (continued)
TABLES Table 2.4-1: Average Monthly and Annual Observed and Adjusted Precipitation at the Regina International
Airport Weather Station ................................................................................................................................. 3
Table 2.4-2: Extreme Maximum Precipitation Data for Meteorological Stations near the Project ...................................... 4
Table 2.4-3: Intensity, Duration, and Frequency Rainfall Statistics for the Regina International Airport Weather Station ........................................................................................................................................................... 5
Table 2.4-4: Monthly Temperature Variation at the Regina International Airport Weather Station ..................................... 8
Table 2.4-5: Monthly Average Wind and Maximum Hourly Speed at the Regina International Airport Weather Station ........................................................................................................................................................... 8
Table 2.4-6: Monthly Gross Evaporation at the Regina International Airport Weather Station ........................................... 9
Table 2.4-7: Sunshine, Humidity, and Pressure at the Regina International Airport Weather Station .............................. 10
Table 3.4-1: Air Quality Baseline for the Project............................................................................................................... 13
Table 4.2-1: Coordinates for Selected Sound Monitoring Locations ................................................................................ 16
Table 4.4-1: Hourly Baseline Noise Levels at R1 Calculated from Valid One-Minute Noise Levels ................................. 22
Table 4.4-2: Low Frequency Analysis for R1 ................................................................................................................... 22
Table 4.4-3: Hourly Baseline Noise Levels at R2 Calculated from Valid One-Minute Noise Levels ................................. 25
Table 4.4-4: Low Frequency Analysis for R2 ................................................................................................................... 25
Table 4.4-5: Hourly Baseline Noise Levels at R8 Calculated from Valid One-Minute Noise Levels ................................. 28
Table 4.4-6: Low Frequency Analysis for R8 ................................................................................................................... 28
Table 4.4-7: Hourly Baseline Noise Levels at R15 Calculated from Valid One-Minute Noise Levels ............................... 31
Table 4.4-8: Low Frequency Analysis for R15.................................................................................................................. 31
Table 4.4-9: Baseline Sound Level Survey Results at Monitoring Locations ................................................................... 32
March 2015 Report No. 12-1362-0197.DCN-042A iii

ANNEX I ATMOSPHERIC ENVIRONMENT BASELINE REPORT
Table of Contents (continued)
FIGURES Figure 1.1-1: Core Facilities and Mine Field Areas ................................................................................................................. 1
Figure 2.4-1: Observed and Adjusted Precipitations Values from Environment Canada for the Regina International Airport Station (ID 4016560) .............................................................................................................................. 4
Figure 2.4-2: IDF Curve for the Regina International Airport Station (ID 4016560) ................................................................ 6
Figure 2.4-3: Regional Wind Speed and Direction at Regina International Airport Station, 1953 to 2010 .............................. 7
Figure 4.2-1: Noise Monitoring Receptor Locations .............................................................................................................. 15
Figure 4.4-1: Sound Level Meter Deployed at R1 ................................................................................................................. 20
Figure 4.4-2: One-Minute Noise Data for R1 ........................................................................................................................ 21
Figure 4.4-3: Sound Level Meter Deployed at R2 ................................................................................................................. 23
Figure 4.4-4: One-Minute Noise Data for R2 ........................................................................................................................ 24
Figure 4.4-5: Sound Level Meter Deployed at R8 ................................................................................................................. 26
Figure 4.4-6: One-Minute Noise Data for R8 ........................................................................................................................ 27
Figure 4.4-7: Sound Level Meter Deployed at R1 ................................................................................................................. 29
Figure 4.4-8: One-Minute Noise Data for R15 ...................................................................................................................... 30
APPENDICES APPENDIX I.1
List of Invalid Noise Samples
APPENDIX I.2Weather Data
March 2015 Report No. 12-1362-0197.DCN-042A iv

ANNEX I ATMOSPHERIC ENVIRONMENT BASELINE REPORT
1.0 INTRODUCTION Yancoal Canada Resources Company Limited (Yancoal) is engaged in the evaluation and development of the Yancoal Southey Project (the Project). Yancoal is a wholly owned subsidiary of Yanzhou Coal Mining Company Limited (Yanzhou Coal). Yanzhou Coal is an international, diversified mining corporation listed on the stock exchanges of New York, Shanghai, Sydney, and Hong Kong. Yanzhou Coal’s main business is coal mining, coal chemical and fertilizer production, power generation, and equipment manufacturing. Yancoal has defined a world-class potash deposit and intends to develop the resource in an ecologically sustainable, economically efficient, and socially responsible manner.
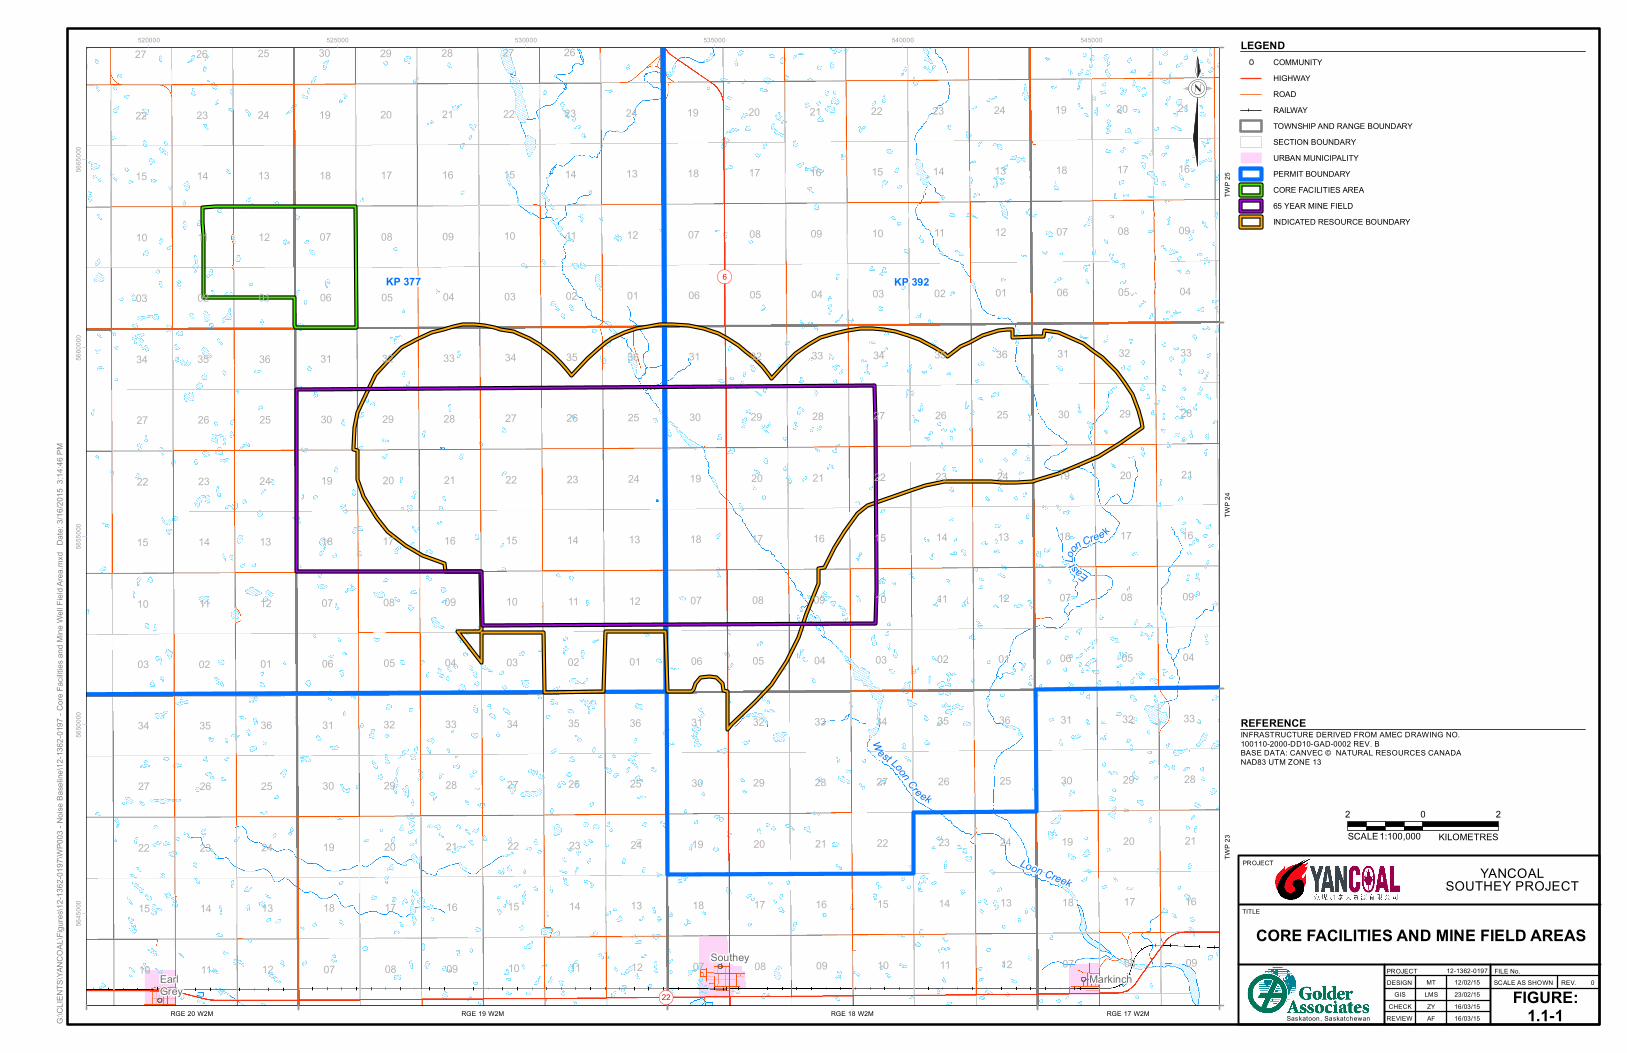
1.1 Project Overview The Project is a greenfield potash mine within the Saskatchewan Prairie Evaporite Formation. The Project will be a solution mine within Subsurface Mineral Permits KP377 and KP392. The Project is located in central Saskatchewan, approximately 60 kilometres (km) north of Regina. The Project (including the core facilities and the mining area) encompasses approximately 143 square kilometres (km2) (14,320 hectares [ha]) and is located in Townships 24 and 25, and Ranges 17, 18, 19, and 20 West of the Second Meridian (W2M) in the Rural Municipality (R.M.) of Longlaketon and the R.M. of Cupar (Figure 1.1-1). Within the region, an existing network of municipal grid roads, provincial highways, and rail lines provides access to the Project.
The Project is located east of Last Mountain Lake and north of the Qu’Appelle Valley in a transitional area between the Moist Mixed Grassland and Aspen Parkland ecoregions of the Prairie Ecozone in Saskatchewan (Acton et al. 1998). The Project is located in a region with a semi-arid continental climate with warm summers and cold, dry winters, and is prone to extreme weather conditions at all times of the year. Approximately 79 percent (%) of the mean annual precipitation in the region falls as rain with the remaining 21% occurring as snowfall (Environment Canada 2014a, b).
Development of the Project is planned in several phases. The construction phase is anticipated to start in May 2016 or as soon as the relevant Project regulatory permits and approvals are in place. The operations phase will begin in 2019 and is anticipated to continue for up to 100 years. Activities following operations will include those necessary to complete reclamation following decommissioning.
Construction of the mine will take approximately 39 months. During the construction phase, the core facilities area and supporting infrastructure will be built. The core facilities area will include the processing plant, administration buildings, maintenance building, equipment and parts storage, tank farm, raw water pond, process upset pond, tailings management area (TMA), product storage, rail loadout, security, and parking.
Support infrastructure for the Project will include water, power, natural gas, communications, road access, and rail access. SaskWater, SaskPower, TransGas, and SaskTel will be the utility providers for the water, power, natural gas, and communication services for the Project. Access to the plant site will be from Highway 6 via an upgraded road to be constructed. Two options are being considered for rail access: a rail spur line to the Canadian Pacific (CP) rail line located approximately 20 km west of the plant site or a spur line to the Canadian National (CN) rail line located approximately 32 km to the north.
During the operations phase, solution mining begins and potash from the Project is processed. Operations will commence following construction; the mine is anticipated to be in operation for up to 100 years.
March 2015 Report No. 12-1362-0197.DCN-042A 1
YANCOALSOUTHEY PROJECT
FILE No.SCALE AS SHOWN
FIGURE:1.1-1
REV. 0
PROJECT
TITLE
PROJECT DESIGN
GISCHECK
CORE FACILITIES AND MINE FIELD AREAS
REVIEWSaskatoon, Saskatchewan
LMS 23/02/15
12-1362-0197
KP 377 KP 392
EastLoon
Cree k
Loon Creek
West Loon Creek
!(6
!(22
08
31
21
32
04
15
12
0712
02
10
30
12
01
36
20
27
32
25
15
07
20
26
21
11
35
04
19
16
24
06
18
08
29
09
20
20
04
13
05
18
12
28
27
24
19 22
27
13 14
25
36
08
20
07
10
25
14
27
12
2930
36
32
32
09
34
20 22
17
19
31
10
28
15
23
15
22
27
08
14
23
13
24
36
04
25
16
30
20
35
23
17
09
16
33
24
14
0306
19
30 29
30 27
21
34
22
13
19
19
13
03
11
23
10
17
28
01
19
02
13 17
28
33
21
27
02
24
06
18
13
08
04
16
22
35
30
32
22
16
03
07
28
32
26
31
02
21
23
16
01
12
35
05
07
35
06
18
29
19
20
16
31
26
14
11
26
31
16
28 25
12
23
07
33
28
18
09
30
21
03
07
20
29
22
09
03
22
10
34
23
18
24
26
25
03
24
18
36 31
17
07
02
35
09
29
15
34 36
11 1007
14
19
17
06
22
08
18
29
27
09
34
15
10
15
01
13
14
05
17
11
33
14
08
18
12
26
17
11
01
15
05
09
24
11
04
34
21
16
09
17
33
08
0601
21
26 25
11
14
23
15
11 12
24
26
10
05
21
02
10
13
23
08
33
05
SoutheyMarkinchEarl
Grey
TWP 2
3TW
P 24
TWP 2
5
RGE 18 W2MRGE 19 W2MRGE 20 W2M RGE 17 W2M
520000 525000 530000 535000 540000 545000
5645
000
5650
000
5655
000
5660
000
5665
000
COMMUNITYHIGHWAYROADRAILWAYTOWNSHIP AND RANGE BOUNDARYSECTION BOUNDARYURBAN MUNICIPALITYPERMIT BOUNDARYCORE FACILITIES AREA65 YEAR MINE FIELDINDICATED RESOURCE BOUNDARY
2 20SCALE 1:100,000 KILOMETRES
G:\C
LIENT
S\YAN
COAL
\Figu
res\12
-1362
-0197
\WP0
03 - N
oise B
aseli
ne\12
-1362
-0197
- Core
Facili
ties a
nd M
ine W
ell Fi
eld Ar
ea.m
xd D
ate: 3
/16/20
15 3
:14:46
PM
INFRASTRUCTURE DERIVED FROM AMEC DRAWING NO.100110-2000-DD10-GAD-0002 REV. BBASE DATA: CANVEC © NATURAL RESOURCES CANADANAD83 UTM ZONE 13
REFERENCE
LEGEND
MT 12/02/15
AF 16/03/15ZY 16/03/15

ANNEX I ATMOSPHERIC ENVIRONMENT BASELINE REPORT
The Project will employ both primary and secondary solution mining techniques. Primary mining involves the injection of hot water to the sylvinite beds to dissolve potassium chloride (KCl) and sodium chloride (NaCl); then the brine solution is extracted and transported by pipeline to the process plant. Secondary mining involves the injection of sodium chloride (NaCl) rich brine into the cavern created during primary mining, to selectively dissolve additional potash from the material left in the cavern. This brine solution is extracted and returned to the process plant via pipeline.
The processing plant will be designed for a production capacity of 2.8 million tonnes of potash per year (Mtpa). Potash processing will include:
injection and solution recovery;
evaporation and crystallization;
product drying and screening;
product compaction; and
product storage and shipping.
Progressive reclamation for the Project will be completed during the operation phase, where possible. Final decommissioning and reclamation activities will be completed when mining operations have ceased.
1.2 Objective of the Baseline Report The Project is subject to review under The Saskatchewan Environmental Assessment Act (SEAA) (2013), as outlined in the Terms of Reference (TOR). The Atmospheric Environment baseline report is part of a comprehensive baseline program to document the biophysical and socio-economic environments near the Project. This baseline report forms Annex I of the Environmental Impact Statement (EIS) being prepared to meet the requirements of the SEAA.
The objective of the Atmospheric Environment baseline report is to provide information on the current environmental conditions for the atmospheric environment. The baseline report integrates local and regional data from sources such as previous studies, literature, and Project-specific baseline investigations. This information will be used to support assessment of the Project’s effects on the atmospheric environment and will
3identify mitigation and protective actions that could be implemented to avoid or reduce potential adverse effects on the existing environment. This baseline also provides supporting information for other components of the environmental assessment, such as socio-economics and traditional and non-traditional land use.
2.0 CLIMATE 2.1 Introduction The Project is located within the prevailing climate of southern Saskatchewan. Climate, which is the long-term record of weather patterns in an area, influences many aspects of the Project. There are strong links between climate and biophysical and socio-economic components of the environment. Climate influences terrestrial and aquatic ecosystems through its continual influence on air, soil, and water environments.
Climate is described by long-term observations of air temperature, relative humidity, wind speed and direction, precipitation, and evaporation. Seasonal and daily air temperatures can range by tens of degrees, while the underlying processes of energy exchange and transformation occur within and between air, soil, snow pack, and
March 2015 Report No. 12-1362-0197.DCN-042A 1

ANNEX I ATMOSPHERIC ENVIRONMENT BASELINE REPORT
surface water. Precipitation (including snowfall) and evapotranspiration (including sublimation) govern the availability of moisture in the environment. Wind influences microclimates over the landscape and enhances evaporation.
Climate data has been used as an input to air and noise dispersion modelling. Data were obtained from several sources, including government records and local monitoring agencies. Site-specific climate data were collected at the Project site for ongoing environmental monitoring. This section presents the existing regional and local climate data available for the Project using averages and extremes of several commonly measured parameters.
2.2 Study Area The Project lies within the Moist Mixed Grassland and Aspen Parkland Ecoregions of the Prairie Ecozone, a region with a semi-arid continental climate. Local meteorological data were collected through an on-site monitoring program and regional climate data are available from the Environment Canada climate normal dataset; therefore, a specific study area for climate is not defined.
2.3 Methods The Regina International Airport Weather Station is located approximately 73 km from the Project. A summary of climate normals from 1981 to 2010 was obtained for the Regina Station (Environment Canada 2014). The historical data are available from 1883 to the present for some parameters in this dataset. The climate normal data were statistically reviewed and summarized on a monthly basis for this baseline.
Environment Canada publishes adjusted precipitation data for numerous long-term climate stations across Canada. Rainfall and snowfall data are adjusted to account for losses from the gauges due to retention of precipitation on the gauge, losses from evaporation off the gauge, losses due to wind effects on the gauge, and wind shield setup. Adjusted precipitation data is currently available for the Regina Airport Station from 1898 to 2006. The adjusted rainfall, snowfall, and total precipitation values from 1981 to 2007 were summarized and compared with observed data. Short-duration rainfall intensity statistics for the Regina International Airport Weather Station were provided by Environment Canada. The 24-hour (h) and 1-h probable maximum precipitation value was calculated for Regina using the empirical method of Hershfield (1977) and the rainfall frequencies are those provided by Hogg and Carr (1985).
Gross evaporation describes the evaporation from free water surfaces (i.e., open to the atmosphere); the results may be applied to small- to moderate-sized water bodies. Mean monthly gross evaporation has been calculated for selected locations on the prairies by the Prairie Farm Rehabilitation Administration (PFRA) using the Meyer formula (PFRA 2002). Losses from snowpack occur from wind scour and sublimation during the winter months. The blowing snow and sublimation data for the Project area were obtained from Pomeroy and Gray (1995).
On-site meteorology monitoring commenced in February 2015. The on-site monitoring data will supplement the available local and regional data to provide Project-specific information. The meteorological parameters being measured and recorded hourly include temperature, relative humidity, wind speed, wind direction, solar radiation, and precipitation. The meteorological station is expected to operate for the life of the Project.
2.4 Results 2.4.1 Regional Climate Classification The climate in the Project region is classified as semi-arid according to the Thornthwaite (1948) temperature and precipitation classification method. The climate classification was based on the meteorological data for the
March 2015 Report No. 12-1362-0197.DCN-042A 2

ANNEX I ATMOSPHERIC ENVIRONMENT BASELINE REPORT
years from 1961 to 1990 (Fung 1999). The region experiences warm summers, cold, dry winters, and is prone to extremes at all times of the year.
2.4.2 Precipitation 2.4.2.1 Rainfall, Snowfall, and Total Precipitation Mean, unadjusted annual precipitation in the region is 390 millimetres (mm), of which 79% falls as rain. The highest monthly precipitation is in June with a long-term average of 71 mm. February has the least precipitation with a long-term average of 9.4 mm (Table 2.4-1). The extreme maximum daily rainfall of 160 mm was recorded on June 15, 1887. The extreme maximum daily snowfall of 26 centimetres (cm) was recorded on October 16, 1984, while the extreme snow depth of 71 cm was recorded on March 15, 1956 (Environment Canada 2014) (Table 2.4-2). Snowmelt runoff usually causes peak annual flow in regional streams. Intense rainfall events can create peak flows in regional streams.
Table 2.4-1: Average Monthly and Annual Observed and Adjusted Precipitation at the Regina International Airport Weather Station
Month Rainfall (mm) Snowfall (cm) Precipitation (mm)
Observed Adjusted Observed Adjusted Observed Adjusted
January 0.6 1.3 19.4 25.2 15.3 25.9
February 0.8 1.4 11.4 15.2 9.4 16.7
March 5.1 5.8 18.8 23.8 19.7 29.3
April 18.1 20.1 6.9 8.9 24.1 28.6
May 47.6 49.6 3.6 4.6 51.4 55.4
June 70.9 75.2 0.0 0.1 70.9 73.6
July 66.9 71.8 0.0 0.0 66.9 70.5
August 44.8 47.4 0.0 0.0 44.8 47.7
September 32.1 34.6 0.7 0.9 32.8 35.6
October 18.3 19.4 6.9 8.9 24.5 28.9
November 3.1 4.1 13.0 16.6 14.2 20.7
December 0.5 1.1 19.5 24.7 15.7 25.8
Annual 308.9 331.7 100.2 128.9 389.7 460.6 Source: Environment Canada: 2014 mm= millimetres; cm = centimetres
March 2015 Report No. 12-1362-0197.DCN-042A 3

ANNEX I ATMOSPHERIC ENVIRONMENT BASELINE REPORT
Table 2.4-2: Extreme Maximum Precipitation Data for Meteorological Stations near the Project
Station Values Day/Month/Year Years of Record
Extreme Maximum Daily Rainfall (mm) 160 June 6, 1887 1883-2007
Extreme Maximum Daily Snowfall (cm) 26 October 16, 1984 1883-2007
Extreme Daily Snow Depth (cm) 71 March 16, 1956 1955-2007
Source: Environment Canada 2014 mm = millimetres; cm = centimetres
The observed total precipitation and the adjusted total precipitation for Regina Airport weather station is shown on Figure 2.4-1. The adjusted values are always greater than the observed values due to underestimation in the measurement during blowing rain and snow conditions. The amount of data adjustment is not constant and depends on a variety of factors including the type of gauge installed and when gauge types were changed. The annual adjusted precipitation is 18% higher than the observed precipitation.
Figure 2.4-1: Observed and Adjusted Precipitations Values from Environment Canada for the Regina International
Airport Weather Station (ID 4016560)
0
50
100
150
200
250
300
350
400
450
500
Prec
ipita
tion,
mm
Date
Observed RainfallAdjusted RainfallObserved SnowfallAdjusted SnowfallObserved PrecipitationAdjusted Precipitation
March 2015 Report No. 12-1362-0197.DCN-042A 4

ANNEX I ATMOSPHERIC ENVIRONMENT BASELINE REPORT
2.4.2.2 Rainfall Intensity, Duration, and Frequency Short-duration rainfall intensity statistics for the Regina International Airport Weather Station were provided by Environment Canada (2012). These statistics are used as design parameters for hydrologic structures where the rainfall intensity is the dominant design variable, such as building roof rain loads, drainage systems, and road culverts. The rainfall intensity statistics reflect an extreme value from an analysis of the historical rainfall data. The results for rainfall durations of 5, 10, 15, and 30 minutes (min); 1-, 2-, 6-, 12-, and 24-h, and for return periods of 2, 5, 10, 25, 50, and 100 years using a series of data from 1960 to 1998 are shown in Table 2.4-3 (Environment Canada 2012). Figure 2.4-2 (i.e., plot of intensity-duration-frequency [IDF] curve) graphically illustrates the short-duration rainfall intensity in millimetres per hour (mm/h), event durations in min and h, and event return periods in years.
Table 2.4-3: Intensity, Duration, and Frequency Rainfall Statistics for the Regina International Airport Weather Station
Duration Return Period (years)
2 (mm) 5 (mm) 10 (mm) 25 (mm) 50 (mm) 100 (mm) 5 min 6.7 10.8 13.5 16.9 19.4 21.9 10 min 10.2 15.8 19.4 24.1 27.5 30.9 15 min 12.5 19.3 23.9 29.7 34.0 38.2 30 min 16.8 26.2 32.5 40.5 46.3 52.2 1 h 20.4 31.6 39.1 48.5 55.5 62.4 2 h 24.4 37.5 46.1 57.0 65.2 73.2 6 h 32.5 51.1 63.4 78.9 90.5 101.9 12 h 38.0 58.0 71.3 88.0 100.5 112.8 24 h 41.8 62.5 76.2 93.6 106.4 119.2 Source: Environment Canada 2012 mm= millimetres; min = minute; h = hour
2.4.2.3 Probable Maximum Precipitation Floods occur when runoff exceeds the hydraulic capacity of the drainage channels in the watershed. Data for the frequency and magnitude of these extreme precipitation events is required to estimate the probable maximum precipitation (PMP) value. The PMP value is important input when designing control structures at and near the Project site.
A statistical 24-h PMP event of 354 mm and the 1-h PMP event of 203 mm were calculated for Regina using the empirical method of Hershfield (1977) and the rainfall frequencies provided by Hogg and Carr (1985). This event is considered reasonable design criteria for the Project given the distance to Regina.
March 2015 Report No. 12-1362-0197.DCN-042A 5

ANNEX I ATMOSPHERIC ENVIRONMENT BASELINE REPORT
Figure 2.4-2: IDF Curve for the Regina International Airport Weather Station (ID 4016560)
2.4.3 Temperature The Project is located in a region that has a semi-arid continental climate with mild, warm summers and cold, dry winters. The mean annual temperature is 3.1 degrees Celsius (˚C), but temperatures generally are below zero from November to March (Table 2.4-4). January is the coldest month with a daily mean of -14.7˚C while July is the warmest month with a daily mean of 18.9˚C. The extreme maximum temperature corresponds to 43.3˚C recorded on July 5, 1937, and the extreme minimum temperature of -50.0˚C was recorded on January 1, 1885.
2.4.4 Wind The region experiences uniform wind speeds over the year with mean monthly values ranging between 16.0 and 20.4 kilometres per hour (km/h). Wind direction is predominately from the southeast (Table 2.4-5). Average wind speed in the winter (18.7 km/h) is slightly higher than in the summer (16.9 km/h). The month of May typically has the highest average wind speeds, while July has the lowest (Table 2.4-5). The maximum-recorded hourly wind speed was 97 km/h on June 27, 1962.
A wind rose summarizing wind speed and wind direction at the Regina Airport for the years 1953 to 2010 is shown on Figure 2.4-3. The most frequent wind direction was from the southeast, followed by west and northwest. Southeast winds are most frequent for the highest wind speed class above 7 metres per sec (m/s) (i.e., 25 km/h).
1
10
100
5 50 500
Inte
nsity
, mm
/h
DurationMinutes Hours
5 10 15 30 60 2 6 12 24
Return Period years 100
50 25
105
2
March 2015 Report No. 12-1362-0197.DCN-042A 6

ANNEX I ATMOSPHERIC ENVIRONMENT BASELINE REPORT
Figure 2.4-3: Regional Wind Speed and Direction at Regina International Airport Station, 1953 to 2010
March 2015 Report No. 12-1362-0197.DCN-042A 7

ANNEX I ATMOSPHERIC ENVIRONMENT BASELINE REPORT
Table 2.4-4: Monthly Temperature Variation at the Regina International Airport Weather Station
Month Daily Average (°C) Standard Deviation (°C) Daily Maximum (°C) Daily Minimum (°C)
January -14.7 4.5 -9.3 -20.1
February -11.7 4.2 -6.4 -17.0
March -4.8 3.7 0.4 -9.9
April 4.8 2.3 11.6 -2.0
May 11.3 1.7 18.5 4.1
June 16.2 1.9 22.8 9.5
July 18.9 1.4 25.8 11.9
August 18.1 1.9 25.5 10.7
September 11.8 1.7 19.1 4.6
October 4.3 1.6 11.0 -2.4
November -5.2 3.6 0.1 -10.5
December -12.4 4.2 -7.1 -17.7
Annual 3.1 1.2 9.3 -3.2 Source: Environment Canada 2014 °C = degrees Celsius
Table 2.4-5: Monthly Average Wind and Maximum Hourly Speed at the Regina International Airport Weather Station
Month Average Speed (km/h)
Most Frequent Direction
Maximum Hourly Speed
km/h Date Direction of Maximum
Hourly Speed
January 19.1 SE 97 January 9, 1966 W
February 18.7 SE 89 February 20, 1965 NW
March 19.6 SE 85 March 12, 1982 NW
April 20.2 SE 84 April 15, 1955 SW
May 20.4 SE 84 May 14, 1960 SW
June 18.3 SE 97 June 27, 1962 W
July 16.0 SE 80 July 27, 1961 NW
August 16.3 SE 74 August 9, 1995 W
September 17.8 SE 78 September 28, 1997 W
October 18.6 SE 89 October 14, 1976 W
November 17.6 SE 85 November 61961 NW
December 18.4 SE 89 December 12, 1955 W
Annual 18.4 SE 97 January 9, 1966 W Source: Environment Canada 2014 km/h= kilometres per hour; SE = southeast; SW = southwest; W = west; NW = northwest
March 2015 Report No. 12-1362-0197.DCN-042A 8

ANNEX I ATMOSPHERIC ENVIRONMENT BASELINE REPORT
2.4.5 Gross Evaporation, Blowing Snow, and Sublimation Mean annual gross evaporation at Regina from 1981 to 2008 was calculated to be approximately 962 mm. Monthly values ranged from 67 mm in April to 186 mm in August (Table 2.4-6). The minimum and maximum monthly gross evaporations at the Regina International Airport Weather Station were estimated to be 44 mm in April and 288 mm in June. The annual gross evaporation ranges from 810 mm to 1,311 mm.
Losses from snowpack occur from wind scour and sublimation during the winter months. According to a study completed between 1970 and 1976 near Regina, sublimation has accounted for average losses of 34% and 41% of the annual snowfall for 1-km fetches in stubble and fallow land use areas, respectively (Pomeroy and Gray 1995). Climate and landscape variables, such as ground cover, wind speed, and temperature, influence the magnitude of losses from the snowpack each year.
Table 2.4-6: Monthly Gross Evaporation at the Regina International Airport Weather Station
Month Minimum (mm) Percentile 25th (mm) Mean (mm) Percentile 75th(mm) Maximum (mm)
January - - - - -
February - - - - -
March - - - - -
April 44 59 67 73 92
May 106 141 158 171 202
June 128 152 175 192 288
July 143 167 183 193 271
August 141 171 186 202 251
September 107 117 130 138 169
October 45 56 62 68 86
November - - - - -
December - - - - -
Annual 810 893 962 1023 1311 Source: Prairie Farm Rehabilitation Administration using the Meyer formula (PFRA 2002) mm = millimetre; "-" = no Monthly Gross Evaporation
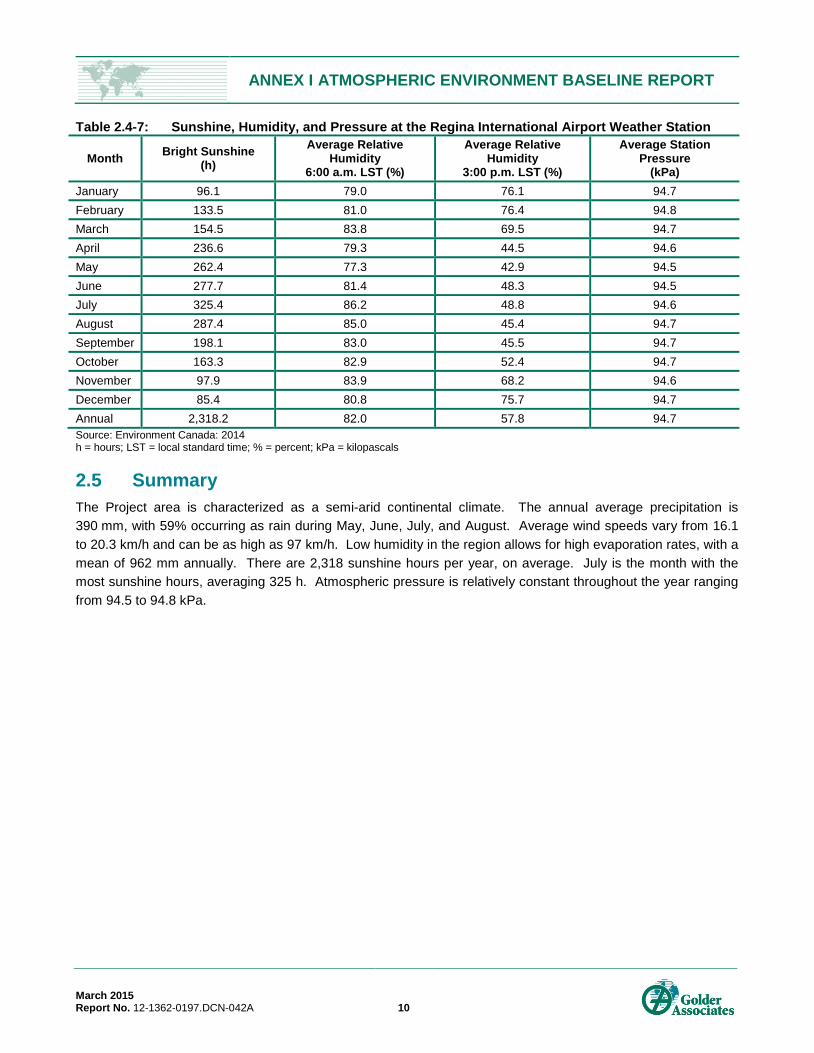
2.4.6 Sunshine, Humidity, and Pressure The region around the Project experiences large amounts of sunlight each year, with an average of 2,318 hours per year. The amounts of sunlight are highest in summer (i.e., June, July, and August) with July experiencing the most sunshine hours (Table 2.4-7). Mean annual relative humidity is approximately 82% and 58% at 6:00 a.m. and 3:00 p.m. local standard times, respectively. Mean annual air pressure at Regina is 94.6 kilopascals (kPa), which corresponds with a sea level pressure of 101.6 kPa (Table 2.4-7).
March 2015 Report No. 12-1362-0197.DCN-042A 9
ANNEX I ATMOSPHERIC ENVIRONMENT BASELINE REPORT
Table 2.4-7: Sunshine, Humidity, and Pressure at the Regina International Airport Weather Station
Month Bright Sunshine (h)
Average Relative Humidity
6:00 a.m. LST (%)
Average Relative Humidity
3:00 p.m. LST (%)
Average Station Pressure
(kPa) January 96.1 79.0 76.1 94.7 February 133.5 81.0 76.4 94.8 March 154.5 83.8 69.5 94.7 April 236.6 79.3 44.5 94.6 May 262.4 77.3 42.9 94.5 June 277.7 81.4 48.3 94.5 July 325.4 86.2 48.8 94.6 August 287.4 85.0 45.4 94.7 September 198.1 83.0 45.5 94.7 October 163.3 82.9 52.4 94.7 November 97.9 83.9 68.2 94.6 December 85.4 80.8 75.7 94.7 Annual 2,318.2 82.0 57.8 94.7 Source: Environment Canada: 2014 h = hours; LST = local standard time; % = percent; kPa = kilopascals
2.5 Summary The Project area is characterized as a semi-arid continental climate. The annual average precipitation is 390 mm, with 59% occurring as rain during May, June, July, and August. Average wind speeds vary from 16.1 to 20.3 km/h and can be as high as 97 km/h. Low humidity in the region allows for high evaporation rates, with a mean of 962 mm annually. There are 2,318 sunshine hours per year, on average. July is the month with the most sunshine hours, averaging 325 h. Atmospheric pressure is relatively constant throughout the year ranging from 94.5 to 94.8 kPa.
March 2015 Report No. 12-1362-0197.DCN-042A 10

ANNEX I ATMOSPHERIC ENVIRONMENT BASELINE REPORT
3.0 AIR QUALITY 3.1 Introduction Air quality, including ground level concentrations and deposition rates of trace gases and particulate matter (PM), is linked to other environmental assessment disciplines such as surface water quality, fish habitat, soils, vegetation, and wildlife habitat.
Air quality baseline data provides historical context for air quality within the regional airshed. Comparison to baseline data is the most objective way to determine the contributions of the Project’s emissions to the over-all emissions within the regional airshed. The objectives of the air quality baseline study are:
to summarize existing baseline concentrations of PM and trace gases within the regional airshed; and
to provide context for the Project’s potential direct and indirect effects on air quality and surface water and terrestrial environments.
3.2 Study Area The Saskatchewan Ministry of Environment (MOE) has implemented an air zone management plan for air quality management. The MOE defines an air zone as a region within the province of Saskatchewan that exhibits similar air quality characteristics and challenges in monitoring. Air zone boundaries are established by considering factors such as topography, meteorology, economic activities, pollution sources, and common air quality issues. Air zone management is conducted by bringing together industry, government, non-government organizations, and the public to form a non-profit association that monitors air quality to ensure clean air remains clean.
Saskatchewan has three active air zones. The province’s first air zone, Southeast Saskatchewan Airshed Association, was incorporated in 2005. In February 2012, a second air zone, Western Yellowhead Air Management Zone was incorporated. The third air zone, the Great Plains Air Zone (GPAZ), was established in 2014. Each air zone is managed by a non-profit Board of Directors and monitored through an independent contractor. The Project is located in the GPAZ.
The MOE delineated five zones in the province, Northern, North Central, Central, Southwestern, and Southeastern, for air quality dispersion modelling. The MOE developed the regional meteorological datasets for use in air dispersion modelling and the background concentrations of air contaminants for each zone. The Project is located in the Southeastern Air Dispersion Modelling Zone.
3.3 Methods The Saskatchewan Air Quality Modelling Guideline (AQMG) provides a summary of the background concentrations of contaminants that are to be used in air dispersion modelling in Saskatchewan. Background concentrations of carbon monoxide (CO), nitrogen dioxide (NO2), sulphur dioxide (SO2), and PM are provided in the AQMG. These background values were compared to the Saskatchewan Ambient Air Quality Standards (SAAQS) and the Canadian Ambient Air Quality Standards (CAAQS) to provide historical context for air quality within the air quality study area for the Project.
March 2015 Report No. 12-1362-0197.DCN-042A 11

ANNEX I ATMOSPHERIC ENVIRONMENT BASELINE REPORT
3.4 Results The Project is located within the Southeastern Air Dispersion Modelling Zone. The regional background air contaminant concentrations for this air zone are summarized in Table 3.4-1. The 90th percentile of one hour carbon monoxide (1-h CO) concentrations is 687 micrograms per cubic metre (µg/m3), which is 4.6% of the SAAQS (15,000 µg/m3). The same concentration was used for the 8-h averaging period (i.e., a value 12% of the SAAQS). The 1-h (90th), 24-h (90th), and annual (50th) background concentrations of NO2 are 41.4, 37.6, and 18.8 µg/m3, respectively. These background values are 14%, 19%, and 42% of the SAAQS, respectively. The background values were small for SO2 when compared to the ambient standards (less than 5%).
Particulate matter mass concentrations in µg/m3 are evaluated for three sizes classes: particles smaller than 2.5 micrometres in aerodynamic diameter (PM2.5), particles smaller than 10.0 micrometres in aerodynamic diameter (PM10), and total suspended particulate matter (TSP). Background PM2.5 and PM10 concentrations in the region are a large fraction of the ambient air quality standards. The 90th percentile of 24-h average PM2.5 is 8.3 µg/m3, which is 30% of the ambient standard (28 µg/m3). The 90th percentile of 24-h PM10 is 36.3 µg/m3, which represents 73% of the ambient standard (50 µg/m3).
The baseline air quality data in the AQMG has some limitations, which reduce its applicability to air quality modelling of PM for the Project. Briefly, these limitations are as follows.
The 99th percentile of 24-h average PM10 is 63.3 µg/m3, which is 27% higher than the ambient standard. This will eliminate the application of screening level air quality modelling for the Project because the AQMG requires that the 99th percentile be used as background concentration in screening level modelling.
The AQMG provides no background concentrations for TSP.
The background air quality data for the southeast air zone was obtained from a monitoring station located in an urban environment (i.e., Regina), but the Project is located in a rural setting.
An on-site air quality monitoring program to obtain Project-specific air quality baseline data for NO2, SO2, and PM commenced in February 2015.
March 2015 Report No. 12-1362-0197.DCN-042A 12

ANNEX I ATMOSPHERIC ENVIRONMENT BASELINE REPORT
Table 3.4-1: Air Quality Baseline for the Project
Air Contaminant Averaging Period Percentile Concentrations SAAQS or
CAAQS (µg/m3)
Baseline’s Percent of Standards (%) ppm µg/m3
Carbon Monoxide (CO) 1 h
90th 0.6 687 15,000
4.6 99th 1.1 1260 8.4
8 h 90th 0.6 687
6,000 11.5
99th 1.1 1260 21.0
Nitrogen Dioxide (NO2)
1 h 90th 0.022 41.4
300 13.8
99th 0.043 80.92 27.0
24 h 90th 0.02 37.64
200 18.8
99th 0.032 60.22 30.1 Annual 50th 0.01 18.82 45 41.8
Sulphur Dioxide (SO2)
1 h 90th 0.001 2.62
450 0.6
99th 0.003 7.86 1.7
24 h 90th 0.001 2.62
125 2.1
99th 0.002 5.24 4.2 Annual 50th 0.000 0 20 0.0
Fine Particulate Matter (PM2.5)
24 h 90th n/a 8.3
28 29.6
99th n/a 14.7 52.5 Annual 50th n/a 3.7 10 37.0
Particulate Matter (PM10) 24 h 90th n/a 36.3
50 72.6
99th n/a 63.3 126.6 n/a = not applicable; ppm = parts per million; µg/m3 = microgram per cubic meter; % = percent; h = hour; SAAQS = Saskatchewan Ambient Air Quality Standards; CAAQS = Canadian Ambient Air Quality Standards; PM2.5 = particulate matter nominally less than or equal to 2.5 micrometres in aerodynamic diameter; PM10 = particulate matter nominally less than or equal to 10 micrometres in aerodynamic diameter
3.5 Summary Air quality is intrinsically linked to human health as well as the health of aquatic and terrestrial ecosystems. The MOE has established regional airsheds in order to monitor and protect ambient air quality in Saskatchewan. The Project is located within the jurisdiction of the GPAZ, which became operational in 2014. Air quality within this airshed is required to meet the SAAQS and the CAAQS.
The MOE has published the Air Quality Modelling Guideline for use in predicting changes to ambient air quality because of developments such as the Project. The Project is located within the Southeastern Air Dispersion Modelling Zone. Background concentrations of CO, NO2, and SO2 in the Southeastern Air Dispersion Modelling Zone are a small fraction of the ambient air quality standards. The background concentration of PM2.5 required for use in refined modelling (90th percentile) in the Southeastern Air Dispersion Modelling Zone is 30% of the ambient air quality standards. However, the background concentration of PM10 in the Southeastern Air Dispersion Modelling Zone is 73% of the ambient standard. These data were obtained in an urban environment (i.e., Regina), whereas the Project occurs in a rural environment. This limits the applicability of the existing background data to the Project.
As a result, an air quality monitoring station that includes measurements of CO, NO2, SO2, and particulate matter is being established in February 2015 at the Project site. The background air quality data will be used to inform air quality modelling carried out as part of the Project’s environmental assessment.
March 2015 Report No. 12-1362-0197.DCN-042A 13

ANNEX I ATMOSPHERIC ENVIRONMENT BASELINE REPORT
4.0 ACOUSTIC ENVIRONMENT 4.1 Introduction Yancoal has expressed intent to pursue the development of a potash mining facility with the Project located approximately 60 km north of Regina, Saskatchewan. The Project is a solution potash mine and processing plant that would produce approximately 2.8 Mtpa. Existing sources of sound include traffic on public roads and agricultural and residential activity. Natural sources of sound, such as wind, birds, frogs, and insects, contribute to background sound levels.
Because Saskatchewan presently does not have any specific acoustic environmental standard or guideline, the monitoring methods used were consistent with the requirements of Alberta Energy Regulator (AER) Directive 038: Noise Control Directive (Directive 038) (Alberta Energy and Utilities Board [EUB] 2007). The Alberta guidance has been found acceptable by MOE for other environmental assessments.
The Project represents a change in the types of acoustic sources in the area, which may influence sound heard at residences and which may influence wildlife. Typically, noise is considered a perception issue and, therefore, the focus of acoustic environmental studies is usually on human response. Some studies also require information relevant to wildlife disturbance issues. The Project is located in an area of extensive agricultural development; therefore, acoustic effects on wildlife are not expected to be a concern. Therefore, the focus of this acoustic environmental baseline study is on public exposure.
The objectives of the acoustic environmental baseline study are:
to establish the existing acoustic environment for residences within the selected study areas; and
to use the information to predict changes in sound levels from the Project on residences.
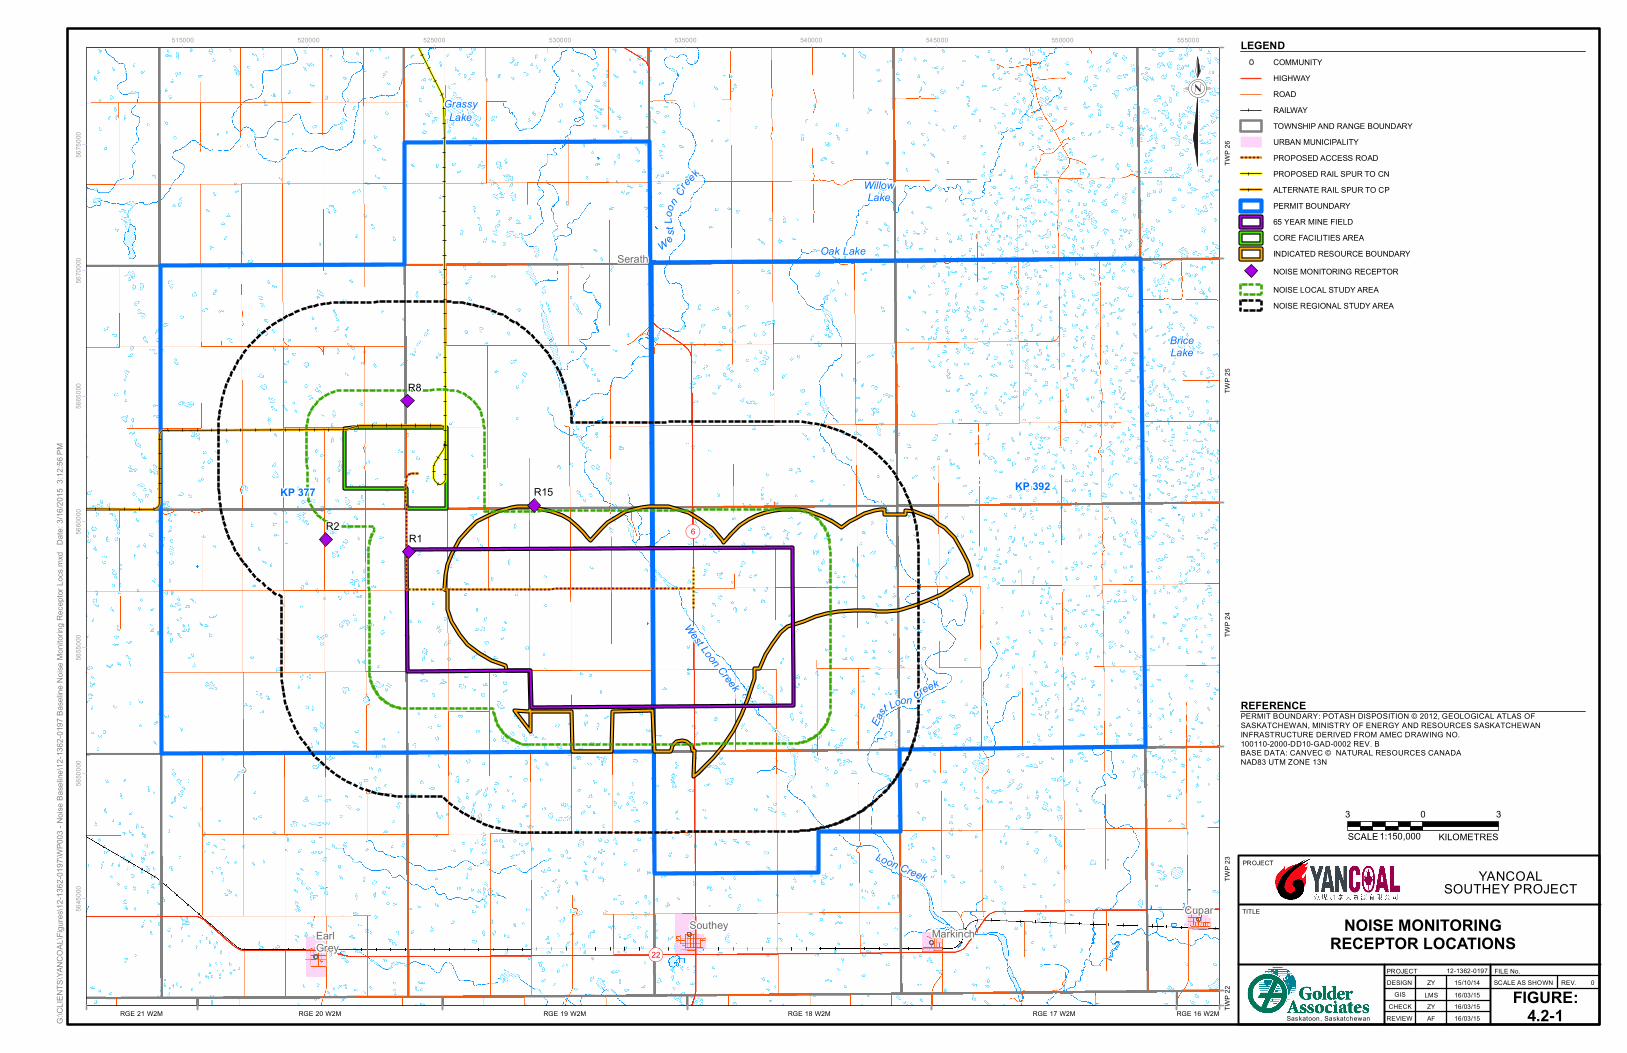
4.2 Study Areas and Receptors The acoustic environmental baseline study focuses on sound levels currently experienced by people at their residences. These residences were used to define the study area. The study area for the acoustic environmental baseline study is defined by the Project area, which includes the core facilities area, the 65-year mine field, and the indicated resource boundary, shown on Figure 4.2-10. The Directive 038 requires that environmental noise impacts be assessed at dwellings located within 1.5 km of the Project area. Where there are no dwellings within 1.5 km, Directive 038 requires that environmental noise impact be assessed at 1.5 km from the facility fence line.
The acoustic environment regional study area (RSA) extends 5.0 km in all directions from the Project area. This definition of the acoustic environment RSA includes the entire area over which the direct effects on the acoustic environment associated with the Project or cumulative effects associated with the Project in combination with other noise sources could be readily detectable (Drew and South 2009). In accordance with Directive 038, the acoustic environment local study area (LSA) is defined as a 1.5 km buffer around the Project area.
March 2015 Report No. 12-1362-0197.DCN-042A 14
YANCOALSOUTHEY PROJECT
FILE No.SCALE AS SHOWN
FIGURE:4.2-1
REV. 0
PROJECT
TITLE
PROJECT DESIGN
GISCHECK
NOISE MONITORINGRECEPTOR LOCATIONS
REVIEWSaskatoon, Saskatchewan
LMS 16/03/15
12-1362-0197
WillowLake
Oak Lake
BriceLake
GrassyLake
East Loon Creek
Loon Creek
West Loon Creek
W e stL
oon Cr
eek
KP 377 KP 392
!(22
!(6
CuparSouthey MarkinchEarl
Grey
Serath
R1R2
R8
R15
TWP 2
3TW
P 26
TWP 2
5TW
P 24
TWP 2
2
RGE 21 W2M RGE 18 W2M RGE 16 W2MRGE 17 W2MRGE 19 W2MRGE 20 W2M
515000 520000 525000 530000 535000 540000 545000 550000 555000
5645
000
5650
000
5655
000
5660
000
5665
000
5670
000
5675
000
COMMUNITYHIGHWAYROADRAILWAYTOWNSHIP AND RANGE BOUNDARYURBAN MUNICIPALITYPROPOSED ACCESS ROADPROPOSED RAIL SPUR TO CNALTERNATE RAIL SPUR TO CPPERMIT BOUNDARY65 YEAR MINE FIELDCORE FACILITIES AREAINDICATED RESOURCE BOUNDARYNOISE MONITORING RECEPTORNOISE LOCAL STUDY AREANOISE REGIONAL STUDY AREA
3 30
SCALE 1:150,000 KILOMETRES
G:\C
LIENT
S\YAN
COAL
\Figu
res\12
-1362
-0197
\WP0
03 - N
oise B
aseli
ne\12
-1362
-0197
Base
line N
oise M
onito
ring R
ecep
tor Lo
cs.m
xd D
ate: 3
/16/20
15 3
:12:56
PM
PERMIT BOUNDARY: POTASH DISPOSITION © 2012, GEOLOGICAL ATLAS OFSASKATCHEWAN, MINISTRY OF ENERGY AND RESOURCES SASKATCHEWANINFRASTRUCTURE DERIVED FROM AMEC DRAWING NO.100110-2000-DD10-GAD-0002 REV. BBASE DATA: CANVEC © NATURAL RESOURCES CANADANAD83 UTM ZONE 13N
REFERENCE
LEGEND
ZY 15/10/14
ZY 16/03/15AF 16/03/15

ANNEX I ATMOSPHERIC ENVIRONMENT BASELINE REPORT
Four representative dwellings within the noise RSA were selected for 24-h sound monitoring. Table 4.2-1 provides the Universal Transverse Mercator (UTM) coordinates for the selected monitoring locations. Figure 4.2-1 shows the location of the sound monitoring sites relative to the Project area, including the core facilities area, the 65-year mine field, the indicated resource boundary, and the noise RSA and LSA. Sound monitoring locations were selected to characterize the acoustic environment surrounding the Project area, in approximately the four cardinal directions. Monitoring locations were chosen to coincide with the nearest occupied dwellings, wherever feasible. In this study, a dwelling was located to the south (the R1 residence), to the west (the R2 residence), to the north (the R8 residence), and to the east (the R15 residence). Among the monitoring locations, R1 is at the edge of the 65-year mine field), R2 is outside of the noise LSA but within the noise RSA, R8 is at the north of the noise LSA, and R15 is located within the noise LSA and at the edge of the indicated resource boundary.
Table 4.2-1: Coordinates for Selected Sound Monitoring Locations
Sound Monitoring Location
Description
Universal Transverse Mercator Location (Zone 12, NAD83) Comments
Distance to the Project Core Facilities
Area (km)
Easting (m) Northing (m)
R1 Farmyard 556262 5577695 occupied dwelling located south of the Project area 1.7
R2 Farmyard 551605 5573835 abandoned dwelling located west of the Project area 2.0
R8 Farmyard 548314 5574898 occupied dwelling located north of the Project area 1.1
R15 Farmyard 551313 5581871 occupied dwelling located east of the Project area 3.5
m = metres; km = kilometres; NAD = North American Datum
4.3 Methods 4.3.1 Noise Regulations Saskatchewan presently does not have any specific acoustic environmental standards or guidelines. Environmental noise related to energy resources projects in Alberta is regulated by the AER, which relies on Directive 038 for environmental noise. The monitoring methods used were consistent with the requirements of AER Directive 038 (EUB 2007). The Alberta guidance has been found acceptable by MOE for other environmental assessments; Directive 038 provided specific guidance for this baseline noise monitoring survey.
The AER Directive 038 defines the Ambient Sound Level (ASL) for the rural areas in Alberta based on research conducted by the Environment Council of Alberta. That is, the average rural ASL in Alberta is 35 dBA (A-weighted decibels) Leq (energy equivalent continuous sound pressure level) during the night (10:00 p.m. to 7:00 a.m.) and 45 dBA during the day (7:00 a.m. to 10:00 p.m.) (EUB 2007). The ASL represents the average sound level in a given area without the contribution of energy-related industry (i.e., ASL represents only natural and non-industrial sources). The ambient acoustic environment for the region is expected to range between 35 and 40 at night, as defined for similar regions in Alberta in Directive 038 (EUB 2007).
Directive 038 provides specific criteria for determining if Low Frequency Noise (LFN) is an issue during facility compliance noise monitoring and for addressing LFN issues when assessing compliance. Directive 038
March 2015 Report No. 12-1362-0197.DCN-042A 16

ANNEX I ATMOSPHERIC ENVIRONMENT BASELINE REPORT
determines a LFN condition through comparison between C-weighted (dBC) and dBA noise levels and the presence of a distinct tone at a frequency below 250 hertz (Hz).
4.3.2 Monitoring Methods Noise monitoring surveys were conducted at receptor locations R1 and R2 from June 30 to July 1, 2014, and receptor locations R8 and R15 from June 29 to 30, 2014. The duration of the survey event at each receptor location was approximately 24 h, in accordance with Directive 038. Noise monitoring surveys of this duration provide information on the daily variability in noise levels, as well as an expected typical or average daily condition.
At each receptor location, a Model 2250 Brüel and Kjær Type I integrating sound level meter (SLM) was used to collect noise measurements and audio recordings. The SLM logged noise levels and recorded audible sound over a set monitoring period, which was selected by the user. The logging rate was set to one minute and audio recordings were saved continuously within Waveform Audio File Format files (wav).
Data parameters logged by the SLM at each receptor location included:
energy equivalent sound level over a one-minute (1-min) period (Leq,1min) in dBA;
energy equivalent sound level over a 1-h period (Leq,1hr) in dBA;
1/3 octave band values over a 1-min period in decibels (dB); and
1/3 octave-band values over a 1-h period in dB.
The SLM was calibrated with a Brüel and Kjær Model 4231 calibrator immediately before and immediately after each monitoring period to confirm SLM variance was within 1.0 dB. The calibration data were logged by the SLM and calibration results were described in field notes.
Directive 038 requires that noise monitoring be conducted under conditions acceptable for noise measurement, which include restrictions on wind speed and direction and the absence of precipitation. At all receptor locations weather data was collected using a Kestrel 4500 pocket weather meter. The weather meter logged the wind speed and direction, temperature, relative humidity, and barometric pressure data at 2-min intervals. Data from the weather meter was used, as required, for the interpretation of the noise data logged by the SLM. Direct observations were made of precipitation, cloud cover, and wind direction. Observed audible noise sources were recorded in field notes and were used in the interpretation of the recorded noise.
At each receptor location, the SLM microphone was deployed at a height of approximately 1.5 m above ground, which is consistent with the approximate height at which human exposure to noise typically would occur. The weather meter was deployed at the same height, approximately 15 m away from the SLM. A separation of 15 m was small enough so that weather conditions were identical at the two locations but large enough so that the weather meter’s spinning wind sensor would not be audible at the SLM.
4.3.3 Data Analysis Approach Data recorded at each of the eight receptor locations were downloaded to a computer for analysis with the Brüel and Kjær 7820 Evaluator software program. In keeping with the requirements of Directive 038, the data were analyzed in the context of broadband noise and of LFN.
March 2015 Report No. 12-1362-0197.DCN-042A 17

ANNEX I ATMOSPHERIC ENVIRONMENT BASELINE REPORT
4.3.3.1 Broadband Noise Analysis Approach The Directive 038 specifies favourable summertime weather conditions that must be met during noise monitoring surveys in order for the logged data to be considered valid, which include no snow, water, or ice (frozen) ground cover, no steady precipitation, and wind speed limits. Therefore, the first step during data analysis was to eliminate from further consideration any 1-min data samples (Leq,1min) that were not recorded under weather conditions specified in Directive 038. For all receptors, 1-min data samples that were not recorded under the weather conditions specified in Directive 038 were omitted from the analysis (i.e., Directive 038 requires that noise monitoring be conducted in the absence of precipitation and at wind speeds below 15 km/h or 4.2 m/s). Some periods of precipitation occurred during the noise monitoring and data collected from all receptors during the periods of precipitation was eliminated. At receptors R8 and R15 there were short periods when wind speed exceeded the mandated maximum of 4.2 m/s and data corresponding to these windy periods were removed from the analysis.
The Directive 038 requires that invalid or abnormal data not typical of the average ambient noise level be eliminated. The purpose of the acoustic environmental study report is to provide acoustic baseline information for the assessment of Project-related effects on the existing environment. Therefore, the second step during data analysis was to eliminate from further consideration any 1-min data samples (Leq,1min) that were contaminated by invalid or abnormal noise sources. Invalid or abnormal data samples were identified using the audio recordings acquired along with the noise level measurements. The 1-min samples were eliminated because of contamination by noise sources related to:
technician activities;
human activities at the dwellings, at outbuildings, or near the microphone;
domestic animals (e.g., dogs, cats, or horses) at the dwelling, at outbuildings, or near the microphone;
birds very near the microphone;
insects very near the microphone;
trucks or mechanised farm equipment working or idling near the microphone;
unidentified tapping on the SLM case or microphone; and
wind-induced microphone noise.
All 1-min data samples recorded when wind speeds exceeded Directive 038 limits were removed during the first step of data processing. During the second data processing step it was necessary to remove 1-min data samples recorded at wind speeds below Directive 038 limits when wind-induced microphone noise was clearly audible (e.g., as the result of a short but intense gust of wind). A list of all Leq,1min values that were eliminated as invalid, along with a justification for their elimination is provided in Appendix I.1.
After excluding 1-min data samples that were recorded under unfavourable weather conditions or that were contaminated by invalid or abnormal noise sources, the third step of data processing was to calculate the energy average of the valid Leq,1min data to obtain equivalent energy sound levels for each hour of monitoring (Leq,1hr). The Leq,1hr values were calculated using only the valid Leq,1min data.
March 2015 Report No. 12-1362-0197.DCN-042A 18

ANNEX I ATMOSPHERIC ENVIRONMENT BASELINE REPORT
The fourth step in processing of the noise data recorded during the baseline monitoring program was to calculate the energy average of the valid Leq,1min data to obtain equivalent energy sound levels for the daytime and nighttime periods (Leq,day and Leq,night, respectively). Directive 038 defines the daytime period as 7 a.m. to 10 p.m. and the nighttime period as 10 p.m. to 7 a.m.
A noise monitoring survey is considered acceptable under Directive 038 if there are a minimum of 180 valid minutes during the daytime period and 180 valid minutes during the nighttime period.
4.3.3.2 Low Frequency Noise Analysis Approach Directive 038 provides specific criteria for determining if LFN is an issue during facility compliance noise monitoring and for addressing LFN issues when assessing compliance. The Directive 038 considers a LFN condition to exist if:
the difference between the measured C-weighted (dBC) and A-weighted (dBA) noise levels is greater than 20 dB; and
a distinct tone exists at a frequency below 250 Hz.
A-weighting (dBA) refers to a specific set of spectral weights that can be applied to measured data to approximate the response of the human auditory system at low noise levels. A-weighting tends to emphasize middle frequency spectral bands. C-weighting (dBC) refers to a specific set of spectral weights that tends to emphasize the low frequency spectral bands. Linear (dBZ) sound levels are sound levels that have no weight applied.
According to Directive 038, a distinct tone exists if:
the linear sound level of one band is 10 dB or more above at least one of the adjacent bands within two 1/3 octave band widths; and
there is a drop of at least 5 dB in level within two bandwidths on the opposite side.
To obtain dBA and dBC levels, A-weights and C-weights were separately applied to the daytime and nighttime 1/3 octave band spectra. The dBA results were then subtracted from the dBC results to obtain a quantity suitable for comparison to the LFN criteria outlined in Directive 038. In accordance with the Directive 038 tone criteria, the daytime and nighttime 1/3 octave band spectra were used to check for the presence of a tone below 250 Hz.
4.4 Results 4.4.1 Monitoring Location R1 This section presents the broadband and LFN noise results at monitoring location R1, which is located south of the core facilities area, on the eastern edge of the 65-year mine field. The sound level metre (SLM) deployment location for this receptor is presented on Figure 4.2-1. Monitoring location R1 is an occupied farmyard. The noise levels at R1 can be representative of the farmyards on the south side of the Project.
Valid noise sources contributing to the baseline noise levels included distant birds, insects, farm activities, and farm equipment, as well as wind in nearby vegetation, infrequent airplane flyovers, and vehicle traffic on the gravel farm road located approximately 90 m west of the SLM.
March 2015 Report No. 12-1362-0197.DCN-042A 19

ANNEX I ATMOSPHERIC ENVIRONMENT BASELINE REPORT
The invalid noise sources removed from the measurements included technician activities, storms, strong wind-induced noise, traffic close to the microphone, and bird activities near the microphone. The R1 location is shown on Figure 2.4-1.
Figure 4.4-1: Sound Level Meter Deployed at R1
4.4.1.1 Broadband Noise Results The individual Leq,1min data recorded at R1 are shown graphically on Figure 4.4-2. The invalid samples that have been eliminated from the calculation of Leq,day and Leq,night have been highlighted. The invalid 1-min noise samples (Leq,1min) that were eliminated from the calculation of hourly, daytime, and nighttime noise levels (Leq,1hr,
Leq,day, and Leq,night) are presented in Appendix I.1. The weather data (wind speed, wind direction, temperature, and humidity) are presented in Appendix I.2.
March 2015 Report No. 12-1362-0197.DCN-042A 20

ANNEX I ATMOSPHERIC ENVIRONMENT BASELINE REPORT
Figure 4.4-2: One-Minute Noise Data for R1
Filtered hourly noise levels (Leq,1hr) and daytime and nighttime noise levels (Leq,day and Leq,night) at R1 are presented in Table 4.4-1. As discussed in Section 4.3.2, the Leq,1hr values presented in Table 4.4-1 were obtained by energy averaging the valid Leq,1min data. A count of the 1-min noise data recorded at R1, including a breakdown for the daytime and nighttime periods is presented in Table 4.4-1. The invalid data in the afternoon of June 30 from 2:00 p.m. to 9:00 p.m. and in the morning of July 1 around 4:00 a.m. was primarily the result of precipitation during the noise monitoring period. The monitoring at R1 would be considered acceptable according to Directive 038 (EUB 2007) because there are more than 180 valid minutes during the daytime period and more than 180 valid minutes during the nighttime period at R1.
10.0
20.0
30.0
40.0
50.0
60.0
70.0
Noi
se L
evel
(dB
A)
Date and Time
Leq,1min Leq,1min (excluded)
March 2015 Report No. 12-1362-0197.DCN-042A 21

ANNEX I ATMOSPHERIC ENVIRONMENT BASELINE REPORT
Table 4.4-1: Hourly Baseline Noise Levels at R1 Calculated from Valid One-Minute Noise Levels Date Start Hour Leq, 1hr (dBA) Number of Valid Minutes
June 30, 2014 2:00 p.m. Not Valid 0 June 30, 2014 3:00 p.m. Not Valid 0 June 30, 2014 4:00 p.m. Not Valid 0 June 30, 2014 5:00 p.m. Not Valid 0 June 30, 2014 6:00 p.m. Not Valid 0 June 30, 2014 7:00 p.m. Not Valid 0 June 30, 2014 8:00 p.m. Not Valid 0 June 30, 2014 9:00 p.m. Not Valid 0 June 30, 2014 10:00 p.m. 41 48 June 30, 2014 11:00 p.m. 37 60 July 1, 2014 12:00 a.m. 36 60 July 1, 2014 1:00 a.m. 41 60 July 1, 2014 2:00 a.m. 41 60 July 1, 2014 3:00 a.m. 36 44 July 1, 2014 4:00 a.m. 40 2 July 1, 2014 5:00 a.m. 40 19 July 1, 2014 6:00 a.m. 39 28 July 1, 2014 7:00 a.m. 39 51 July 1, 2014 8:00 a.m. 40 41 July 1, 2014 9:00 a.m. 41 53 July 1, 2014 10:00 a.m. 41 49 July 1, 2014 11:00 a.m. 42 55 July 1, 2014 12:00 p.m. 41 58 July 1, 2014 1:00 p.m. 39 29 Leq,day (dBA) 7:00 a.m. to 10:00 p.m. 41 336 Leq,night (dBA) 10:00 p.m. to 7:00 a.m. 39 381
Leq, 1hr = equivalent energy sound levels for a one hour period; Leq,day = equivalent energy sound levels for the daytime period; Leq,night = equivalent energy sound levels for the nighttime period; dBA = A-weighted decibels
4.4.1.2 Low Frequency Noise Results The results of the LFN analysis conducted using the 1/3 octave band spectra corresponding to valid 1-min noise samples recorded at R1 are presented in Table 5.4-2.
Table 4.4-2: Low Frequency Analysis for R1 Period dBC – dBA Number of Tones Below 250 Hz LFN Issue
Daytime (7:00 a.m. to 10:00 p.m.) 7 0 no Nighttime (10:00 p.m. to 7:00 a.m.) 9 0 no
dBC = C-weighted noise level; dBA = A-weighted decibels; Hz = hertz; LFN = low frequency noise
The difference between A-weighted and C-weighted noise levels is less than 20 dB during the daytime and the nighttime and there are no tones present below 250 Hz (Table 4.4-2). Therefore, there is no LFN issue during the daytime or nighttime periods at R1; it is not necessary to apply a 5-dBA penalty to the measured broadband noise levels presented in Table 4.4-1.
March 2015 Report No. 12-1362-0197.DCN-042A 22

ANNEX I ATMOSPHERIC ENVIRONMENT BASELINE REPORT
4.4.2 Monitoring Location R2 This section presents the broadband and LFN noise results at monitoring location R2, which is located within the Project RSA and west of the Project area. The SLM deployment location for this receptor is shown on Figure 4.4-3. Monitoring location R2 is an abandoned farmyard. However, the noise levels at R2 can be representative of the farmyards on the west side of the Project area.
Valid noise sources contributing to the baseline noise levels included distant birds, insects, farm activities, and farm equipment, as well as wind in nearby vegetation, infrequent airplane flyovers, and vehicle traffic on the gravel farm road located approximately 112 m to the west of the SLM.
The invalid noise sources removed from the measurements include technician activities, storms, strong wind induced noise, traffic close to the microphone, airplane flyovers, and bird activities near the microphone. The R2 location is shown on Figure 4.4-3.
Figure 4.4-3: Sound Level Meter Deployed at R2
March 2015 Report No. 12-1362-0197.DCN-042A 23

ANNEX I ATMOSPHERIC ENVIRONMENT BASELINE REPORT
4.4.2.1 Broadband Noise Results The individual Leq,1min data recorded at R2 are shown graphically on Figure 4.4-4. The invalid samples that have been eliminated from the calculation of Leq,day and Leq,night have been highlighted. The invalid 1-min noise samples (Leq,1min) that were eliminated from the calculation of hourly, daytime, and nighttime noise levels (Leq,1hr,
Leq,day, and Leq,night) are presented in Appendix I.1. The weather data (wind speed, wind direction, temperature, and humidity) are presented in Appendix I.2.
Figure 4.4-4: One-Minute Noise Data for R2
Filtered hourly noise levels (Leq,1hr) and daytime and nighttime noise levels (Leq,day and Leq,night) at R2 are presented in Table 4.4-3. As discussed in Section 4.3.2, the Leq,1hr values presented in Table 4.4-3 were obtained by energy averaging the valid Leq,1min data. A count of the 1-min noise data recorded at R2, including a breakdown for the daytime and nighttime periods is presented in Table 4.4-3. The invalid data from the afternoon of June 30, 2014 from 2:00 p.m. to 9:00 p.m. and from the morning of July 1, 2014 at around 4:00 a.m. was primarily the result of precipitation during the noise monitoring period. The monitoring at R2 would be considered acceptable according to Directive 038 (EUB 2007) because there are more than 180 valid minutes during the daytime period and more than 180 valid minutes during the nighttime period at R2.
10.0
20.0
30.0
40.0
50.0
60.0
70.0
Noi
se L
evel
(dB
A)
Date and Time
Leq,1min Leq,1min (excluded)
March 2015 Report No. 12-1362-0197.DCN-042A 24

ANNEX I ATMOSPHERIC ENVIRONMENT BASELINE REPORT
Table 4.4-3: Hourly Baseline Noise Levels at R2 Calculated from Valid One-Minute Noise Levels Date Start Hour Leq, 1hr (dBA) Number of Valid Minutes
June 30, 2014 3:00 p.m. Not Valid 0 June 30, 2014 4:00 p.m. Not Valid 0 June 30, 2014 5:00 p.m. Not Valid 0 June 30, 2014 6:00 p.m. Not Valid 0 June 30, 2014 7:00 p.m. Not Valid 0 June 30, 2014 8:00 p.m. Not Valid 0 June 30, 2014 9:00 p.m. Not Valid 0 June 30, 2014 10:00 p.m. 41 58 June 30, 2014 11:00 p.m. 36 60 July 1, 2014 12:00 a.m. 40 48 July 1, 2014 1:00 a.m. 41 46 July 1, 2014 2:00 a.m. 38 60 July 1, 2014 3:00 a.m. 38 57 July 1, 2014 4:00 a.m. 39 20 July 1, 2014 5:00 a.m. 37 43 July 1, 2014 6:00 a.m. 38 46 July 1, 2014 7:00 a.m. 39 58 July 1, 2014 8:00 a.m. 40 51 July 1, 2014 9:00 a.m. 40 50 July 1, 2014 10:00 a.m. 39 52 July 1, 2014 11:00 a.m. 38 51 July 1, 2014 12:00 p.m. 39 59 July 1, 2014 1:00 p.m. 39 58 July 1, 2014 2:00 p.m. 38 42 Leq,day (dBA) 7:00 a.m. to 10:00 p.m. 39 421 Leq,night (dBA) 10:00 p.m. to 7:00 a.m. 39 438
Leq, 1hr = equivalent energy sound levels for a one hour period; Leq,day = equivalent energy sound levels for the daytime period; Leq,night = equivalent energy sound levels for the nighttime period; dBA = A-weighted decibels.
4.4.2.2 Low Frequency Noise Results The results of the LFN analysis conducted using the 1/3 octave band spectra corresponding to valid 1-min noise samples recorded at R2 are presented in Table 5.4-4.
Table 4.4-4: Low Frequency Analysis for R2
Period dBC – dBA Number of Tones Below 250 Hz LFN Issue
Daytime (7:00 a.m. to 10:00 p.m.) 12 0 no Nighttime (10:00 p.m. to 7:00 a.m.) 18 0 no
dBC = C-weighted noise level; dBA = A-weighted decibels; Hz = hertz; LFN = low frequency noise
The difference between A-weighted and C-weighted noise levels is less than 20 dB during the daytime and the nighttime and there are no tones present below 250 Hz (Table 5.4-4). Therefore, there is no LFN issue during the daytime or nighttime periods at R2; it is not necessary to apply a 5-dBA penalty to the measured broadband noise levels presented in Table 4.4-3.
March 2015 Report No. 12-1362-0197.DCN-042A 25

ANNEX I ATMOSPHERIC ENVIRONMENT BASELINE REPORT
4.4.3 Monitoring Location R8 This section presents the broadband and LFN noise results at monitoring location R8, which is located within the Project LSA and north of the Project plant area. The SLM deployment location for this receptor is shown on Figure 4.4-5. Monitoring location R8 is an occupied farmyard. The noise levels at R8 can be representative of the farmyards on the north side of the Project area.
Valid noise sources contributing to the baseline noise levels included distant birds, insects, farm activities, and farm equipment, as well as wind in nearby vegetation, infrequent airplane flyovers, and vehicle traffic on the gravel farm road located approximately 72 m west of the SLM.
The invalid noise sources removed from the measurements include technician activities, storms, strong wind induced noise, traffic close to the microphone, and bird activities near the microphone. The R8 location is shown on Figure 4.4-5.
Figure 4.4-5: Sound Level Meter Deployed at R8
March 2015 Report No. 12-1362-0197.DCN-042A 26

ANNEX I ATMOSPHERIC ENVIRONMENT BASELINE REPORT
4.4.3.1 Broadband Noise Results The individual Leq,1min data recorded at R8 are shown graphically on Figure 4.4-6. The invalid samples that have been eliminated from the calculation of Leq,day and Leq,night have been highlighted. The invalid 1-min noise samples (Leq,1min) that were eliminated from the calculation of hourly, daytime, and nighttime noise levels (Leq,1hr,
Leq,day, and Leq,night) are presented in Appendix I.1. The weather data (wind speed, wind direction, temperature, and humidity) are presented in Appendix I.2.
Figure 4.4-6: One-Minute Noise Data for R8
Filtered hourly noise levels (Leq,1hr) and daytime and nighttime noise levels (Leq,day and Leq,night) at R8 are presented in Table 4.4-5. As discussed in Section 4.3.2, the Leq,1hr values presented in Table 4.4-5 were obtained by energy averaging the valid Leq,1min data. A count of the 1-min noise data recorded at R8, including a breakdown for the daytime and nighttime periods is presented in Table 4.4-5. The invalid data from the morning of June 30, 2014 from 3:00 a.m. to 5:00 a.m. were primarily the result of precipitation (i.e., storm) during the noise monitoring period. The monitoring at R8 would be considered acceptable according to Directive 038 (EUB 2007) because there are more than 180 valid minutes during the daytime period and more than 180 valid minutes during the nighttime period at R8.
10.0
20.0
30.0
40.0
50.0
60.0
70.0
Noi
se L
evel
(dB
A)
Date and Time
Leq,1min Leq,1min (excluded)
March 2015 Report No. 12-1362-0197.DCN-042A 27

ANNEX I ATMOSPHERIC ENVIRONMENT BASELINE REPORT
Table 4.4-5: Hourly Baseline Noise Levels at R8 Calculated from Valid One-Minute Noise Levels Date Start Hour Leq, 1hr (dBA) Number of Valid Minutes
June 29, 2014 12:00 p.m. 47 46 June 29, 2014 1:00 p.m. 47 60 June 29, 2014 2:00 p.m. 50 50 June 29, 2014 3:00 p.m. 50 46 June 29, 2014 4:00 p.m. 49 36 June 29, 2014 5:00 p.m. 49 57 June 29, 2014 6:00 p.m. 48 55 June 29, 2014 7:00 p.m. 50 32 June 29, 2014 8:00 p.m. 47 56 June 29, 2014 9:00 p.m. 43 56 June 29, 2014 10:00 p.m. 41 59 June 29, 2014 11:00 p.m. 42 60 June 30, 2014 12:00 a.m. 45 59 June 30, 2014 1:00 a.m. 45 60 June 30, 2014 2:00 a.m. 47 60 June 30, 2014 3:00 a.m. Not Valid 0 June 30, 2014 4:00 a.m. Not Valid 0 June 30, 2014 5:00 a.m. Not Valid 0 June 30, 2014 6:00 a.m. 49 28 June 30, 2014 7:00 a.m. 47 57 June 30, 2014 8:00 a.m. 48 58 June 30, 2014 9:00 a.m. 49 41 June 30, 2014 10:00 a.m. 48 54 June 30, 2014 11:00 a.m. 48 48 June 30, 2014 12:00 p.m. 47 46 Leq,day (dBA) 7:00 a.m. to 10:00 p.m. 48 798 Leq,night (dBA) 10:00 p.m. to 7:00 a.m. 44 326
Leq, 1hr = equivalent energy sound levels for a one hour period; Leq,day = equivalent energy sound levels for the daytime period; Leq,night = equivalent energy sound levels for the nighttime period; dBA = A-weighted decibels
4.4.3.2 Low Frequency Noise Results The results of the LFN analysis conducted using the 1/3 octave band spectra corresponding to valid 1-min noise samples recorded at R8 are presented in Table 4.4-6.
Table 4.4-6: Low Frequency Analysis for R8
Period dBC – dBA Number of Tones Below 250 Hz LFN Issue
Daytime (7:00 a.m. to 10:00 p.m.) 12 0 no Nighttime (10:00 p.m. to 7:00 a.m.) 8 0 no
dBC = C-weighted noise level; dBA = A-weighted decibels; Hz = hertz; LFN = low frequency noise.
The difference between A-weighted and C-weighted noise levels is less than 20 dB during the daytime and the nighttime and there are no tones present below 250 Hz (Table 4.4-6). Therefore, there is no LFN issue during
March 2015 Report No. 12-1362-0197.DCN-042A 28

ANNEX I ATMOSPHERIC ENVIRONMENT BASELINE REPORT
the daytime or nighttime periods at R8; it is not necessary to apply a 5-dBA penalty to the measured broadband noise levels presented in Table 4.4-5.
4.4.4 Monitoring Location R15 This section presents the broadband and LFN noise results at monitoring location R15, which is located at the edge of the Project mine field. The SLM deployment location for this receptor is presented on Figure 4.4-7. Monitoring location R15 is an occupied farmyard. The noise levels at R15 can be representative of the farmyards on the east side of the Project.
Valid noise sources contributing to the baseline noise levels included distant birds, insects, farm activities, and farm equipment, as well as wind in nearby vegetation, infrequent airplane flyovers, and vehicle traffic on the gravel farm roads located approximately 102 m to the north of the SLM and approximately 192 m to the west of the SLM respectively.
The invalid noise sources removed from the measurements include technician activities, storms, strong wind induced noise, traffic close to the microphone, and bird activities near the microphone. The R15 location is shown on Figure 4.4-7.
Figure 4.4-7: Sound Level Meter Deployed at R1
March 2015 Report No. 12-1362-0197.DCN-042A 29
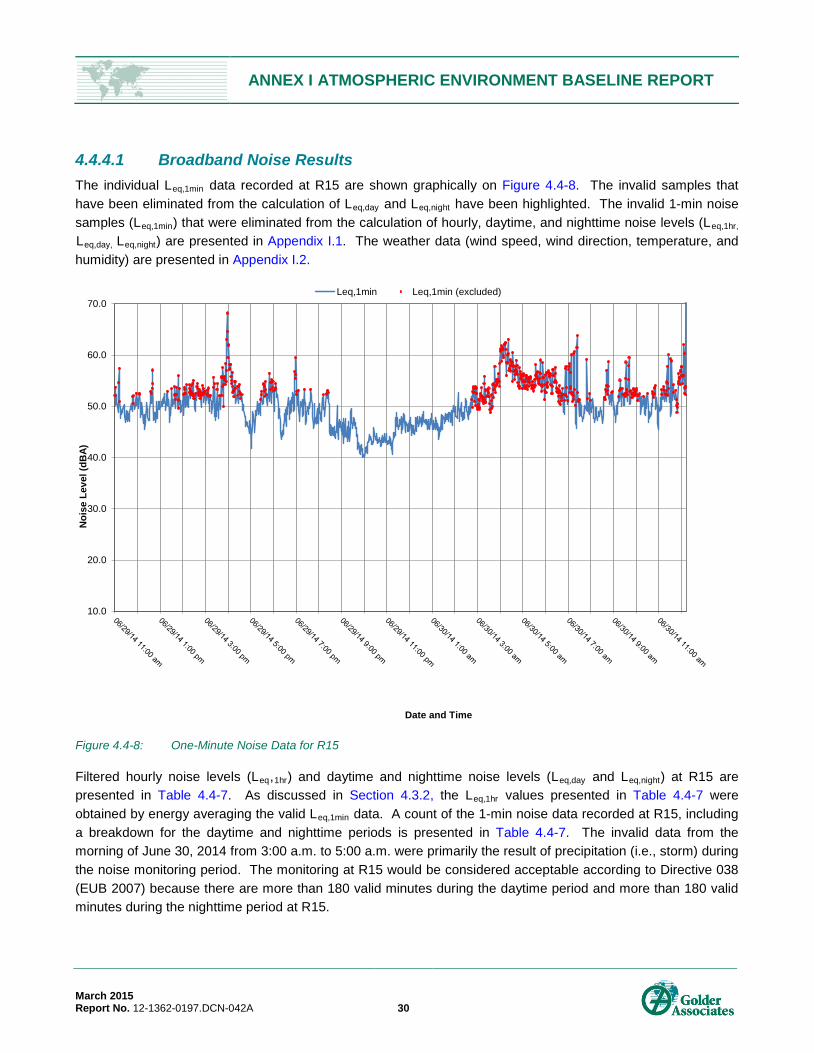
ANNEX I ATMOSPHERIC ENVIRONMENT BASELINE REPORT
4.4.4.1 Broadband Noise Results The individual Leq,1min data recorded at R15 are shown graphically on Figure 4.4-8. The invalid samples that have been eliminated from the calculation of Leq,day and Leq,night have been highlighted. The invalid 1-min noise samples (Leq,1min) that were eliminated from the calculation of hourly, daytime, and nighttime noise levels (Leq,1hr,
Leq,day, Leq,night) are presented in Appendix I.1. The weather data (wind speed, wind direction, temperature, and humidity) are presented in Appendix I.2.
Figure 4.4-8: One-Minute Noise Data for R15
Filtered hourly noise levels (Leq,1hr) and daytime and nighttime noise levels (Leq,day and Leq,night) at R15 are presented in Table 4.4-7. As discussed in Section 4.3.2, the Leq,1hr values presented in Table 4.4-7 were obtained by energy averaging the valid Leq,1min data. A count of the 1-min noise data recorded at R15, including a breakdown for the daytime and nighttime periods is presented in Table 4.4-7. The invalid data from the morning of June 30, 2014 from 3:00 a.m. to 5:00 a.m. were primarily the result of precipitation (i.e., storm) during the noise monitoring period. The monitoring at R15 would be considered acceptable according to Directive 038 (EUB 2007) because there are more than 180 valid minutes during the daytime period and more than 180 valid minutes during the nighttime period at R15.
10.0
20.0
30.0
40.0
50.0
60.0
70.0
Noi
se L
evel
(dB
A)
Date and Time
Leq,1min Leq,1min (excluded)
March 2015 Report No. 12-1362-0197.DCN-042A 30

ANNEX I ATMOSPHERIC ENVIRONMENT BASELINE REPORT
Table 4.4-7: Hourly Baseline Noise Levels at R15 Calculated from Valid One-Minute Noise Levels Date Start Hour Leq, 1hr (dBA) Number of Valid Minutes
June 29, 2014 11:00 a.m. 50 51 June 29, 2014 12:00 p.m. 49 53 June 29, 2014 1:00 p.m. 51 48 June 29, 2014 2:00 p.m. 51 19 June 29, 2014 3:00 p.m. 50 29 June 29, 2014 4:00 p.m. 49 31 June 29, 2014 5:00 p.m. 50 41 June 29, 2014 6:00 p.m. 50 52 June 29, 2014 7:00 p.m. 50 55 June 29, 2014 8:00 p.m. 48 56 June 29, 2014 9:00 p.m. 45 60 June 29, 2014 10:00 p.m. 43 60 June 29, 2014 11:00 a.m. 46 60 June 30, 2014 12:00 a.m. 47 60 June 30, 2014 1:00 a.m. 47 60 June 30, 2014 2:00 a.m. 49 45 June 30, 2014 3:00 a.m. Not Valid 0 June 30, 2014 4:00 a.m. Not Valid 0 June 30, 2014 5:00 a.m. Not Valid 0 June 30, 2014 6:00 a.m. 50 5 June 30, 2014 7:00 a.m. 49 32 June 30, 2014 8:00 a.m. 50 45 June 30, 2014 9:00 a.m. 50 27 June 30, 2014 10:00 a.m. 50 44 June 30, 2014 11:00 a.m. 51 27 Leq,day (dBA) 7:00 a.m. to 10:00 p.m. 49 670 Leq,night (dBA) 10:00 p.m. to 7:00 a.m. 47 290
Leq, 1hr = equivalent energy sound levels for a one hour period; Leq,day = equivalent energy sound levels for the daytime period; Leq,night = equivalent energy sound levels for the nighttime period; dBA = A-weighted decibels
4.4.4.2 Low Frequency Noise Results The results of the LFN analysis conducted using the 1/3 octave band spectra corresponding to valid 1-min noise samples recorded at R15 are presented in Table 4.4-8.
Table 4.4-8: Low Frequency Analysis for R15
Period dBC – dBA Number of Tones Below 250 Hz LFN Issue
Daytime (7:00 a.m. to 10:00 p.m.) 16 0 no Nighttime (10:00 p.m. to 7:00 a.m.) 16 0 no
dBC = C-weighted noise level; dBA = A-weighted decibels; Hz = hertz; LFN = low frequency noise
The difference between A-weighted and C-weighted noise levels is less than 20 dB during the daytime and the nighttime and there are no tones present below 250 Hz (Table 5.4-8). Therefore, there is no LFN issue during
March 2015 Report No. 12-1362-0197.DCN-042A 31

ANNEX I ATMOSPHERIC ENVIRONMENT BASELINE REPORT
the daytime or nighttime periods at R15; it is not necessary to apply a 5-dBA penalty to the measured broadband noise levels presented in Table 4.4-8.
4.5 Summary The results of the acoustic environmental baseline surveys at four monitoring locations are summarized in Table 4.4-9. The period averages were based on the measured data filtered to exclude extraneous sound events and weather conditions.
Table 4.4-9: Baseline Sound Level Survey Results at Monitoring Locations
Monitoring Location Baseline Sound Measurements Leq (dBA)
Day-time, Leq, day 7:00 a.m. to 10:00 p.m. Night-time, Leq, night 10:00 p.m. to 7:00 a.m.
R1 41 39 R2 39 39 R8 48 44 R15 49 47 Leq = equivalent energy sound levels; dBA = A-weighted decibels; Leq,day = equivalent energy sound levels for the daytime period; Leq,night = equivalent energy sound levels for the nighttime period.
The sound levels measured at these four receptors were influenced by sounds from residence activities, road traffic, farm activities, and natural sounds from the rustling of leaves, birds, and insects. Higher noise levels at R8 and R15 were due to the different environment and different farm/resident activities on the measurement days.
March 2015 Report No. 12-1362-0197.DCN-042A 32

ANNEX I ATMOSPHERIC ENVIRONMENT BASELINE REPORT
5.0 GLOSSARY Term Description
Airshed A geographic boundary for air quality standards where local topography and meteorology limit the dispersion of pollutants away from the area.
Atmosphere The mass of air surrounding the earth and bound to it more or less permanently by the earth's gravitational attraction.
A-weighted decibels Incorporates the frequency response of the human ear. The human ear is less sensitive to lower frequency noise. Lower frequency noise needs to be louder to be perceived as loud by the human ear as higher frequency noise.
Biophysical an interdisciplinary science using methods of, and theories from, physics to study biological systems.
Blowing snow Wind driven snow that reduces visibility to six miles or less causing significant drifting. Blowing snow may be snow that is falling or loose snow on the ground picked up by the wind.
Climate
The prevalent long-term weather conditions in a particular area. Climatic elements include precipitation, temperature, humidity, sunshine, and wind velocity and phenomena such as fog, frost, and hailstorms. Climate cannot be considered a satisfactory indicator of actual conditions since it is based upon a vast number of elements taken as an average.
C-weighted decibels The C-weighting network weights the frequencies between 70 and 400 Hz uniformly, but below and above these limits, frequencies are slightly discriminated against.
Daytime Hours range from 7:00 a.m. to 10:00 p.m. dBA A decibel value, which has been A-weighted, or filtered to match the response of the
human ear. dBC A decibel value, which has been C-weighted.
Decibels or linear decibels or dBZ The decibel (dB) is a measure, on a logarithmic scale, of the magnitude of a particular quantity (such as sound pressure level or sound power level) with respect to a standard reference value.
Ecoregion Relatively homogeneous subdivisions of an ecozone, which are characterized by distinctive climatic zones or regional landforms.
Ecozone An area of the earth's surface that is representative of a broad-scale ecological unit characterized by particular abiotic (non-living) and biotic (living) factors (e.g., prairie, boreal plain).
Equivalent Sound Level
Continuous equivalent sound level, defined as the sound pressure level that, if constant over the stated measurement period, would contain the same sound energy as the actual monitored sound that is fluctuating in level over the measurement period. This type of average takes into account the natural variability of sound. A common descriptor used in outdoor sound measurement (Cowan 1994).
Evaporation The process of a liquid changing into a vapour or gas.
Free Water Surface The surface of a body of water at which the pressure is atmospheric and below which the pressure is greater than atmospheric; the surface of any pond, reservoir, lake, or stream that is open to the atmosphere.
Frequency Human ear does not respond to all frequencies in the same way. Mid-range frequencies are most readily detected by the human ear, while low and high frequencies are harder to hear.
Hydraulic capacity The amount of water held by a soil between field capacity and the permanent wilting point, (i.e., a measure of available water).
Meteorology The study of the physics, chemistry, and dynamics of the atmosphere and the direct effects of the atmosphere upon the Earth's surface, the oceans, and life in general.
Microclimate A local climate that differs from the main climate around it.
March 2015 Report No. 12-1362-0197.DCN-042A 33

ANNEX I ATMOSPHERIC ENVIRONMENT BASELINE REPORT
Term Description Monitoring Location Location where the sound meter is setup. Nighttime Hours range from 10:00 PM to 7:00 a.m. Noise Sound levels that can be heard or measured at a receiver.
Precipitation Any product of the condensation of atmospheric water vapour that falls under gravity. The main forms of precipitation include drizzle, rain, sleet, snow, graupel, and hail.
Pressure
Atmospheric pressure in kiloPascal (kPa) is the atmospheric pressure (or force per unit area) exerted by the atmosphere as a consequence, because of the mass of air in a vertical column from the elevation of the observing station to the top of the atmosphere.
Pressure
Atmospheric pressure in kiloPascal (kPa) is the atmospheric pressure (or force per unit area) exerted by the atmosphere as a consequence, because of the mass of air in a vertical column from the elevation of the observing station to the top of the atmosphere.
Probable maximum precipitation The theoretically greatest depth of precipitation for a given duration that is physically possible over a given size storm area at a particular geographical location at a certain time of year.
Relative Humidity Relative humidity in percent is the ratio of the quantity of water vapour the air contains compared to the maximum amount it can hold at that particular temperature.
Socio-economic The social science that studies how economic activity affects social processes.
Sound Acoustic energy generated by natural or man-made sources, including the Project activities.
Sound Level Meter Equipment to measure sound levels.
Sound Power Rate of acoustic energy flow across a specified surface, or emitted by a specified sound source. The sound power in a frequency band is the energy flow rate associated with sound frequencies lying within the band.
Sublimation The change from ice directly to water vapour or from water vapour to ice without going through the liquid water phase.
Watershed An area or ridge of land that separates waters flowing to different rivers, basins, or seas.
Wind direction The direction from which the wind is blowing.
Wind speed The rate at which air is moving horizontally past a given point. It may be a 2-min average speed (reported as wind speed) or an instantaneous speed (reported as a peak wind speed, or gust).
March 2015 Report No. 12-1362-0197.DCN-042A 34

ANNEX I ATMOSPHERIC ENVIRONMENT BASELINE REPORT
Report Signature Page
GOLDER ASSOCIATES LTD.
Report Prepared by:
Zimu Yu, Ph.D. Air Quality Scientist
Cam McNaughton, Ph.D. Environmental Scientist
Zhaohui Yu, Ph.D., Engineer-in-Training Acoustic Scientist
Report Reviewed by:
Chris Madland Andrew Faszer, B.Sc., INCE Associate, Air Quality Scientist Senior Acoustical Engineer
Brian Christensen, M.Sc. Associate, Senior Environment Scientist
Golder, Golder Associates and the GA globe design are trademarks of Golder Associates Corporation.
c:\users\psawchuk\documents\sharepoint drafts\yancoal annex i air and noise baseline report.docx
March 2015 Report No. 12-1362-0197.DCN-042A 35

ANNEX I ATMOSPHERIC ENVIRONMENT BASELINE REPORT
6.0 REFERENCES Environment Canada. 2014. Canadian Climate Normals or Averages 1981-2010. Available at:
ftp://ftp.tor.ec.gc.ca/Pub/Normals/English/. Accessed February 2014.
Environment Canada. 2012. Short Duration Rainfall Intensity-Duration-Frequency Data.
Cowan, J. P. 1994. Handbook of Environmental Acoustics. Van Nostrand Reinhold New York. 273 pp.
EUB (Alberta Energy and Utilities Board). 2007. Directive 038: Noise Control. Issued February 16, 2007. 54 pp.
Drew, T. and D. South. 2009. Cumulative Effects and the 1.5 km Boundary. Alberta Acoustics and Noise Association Spring Noise Conference. May 2009. Banff, AB.
Fung, K (Ed.). 1999. Atlas of Saskatchewan. Saskatoon, Saskatchewan, Canada: University of Saskatchewan.
Hershfield, D.M. 1977. Some Tools for Hydrometeorologists. Preprints, 2nd Conf. Hydrometeorology, American Meteorology Society, Boston, Mass. P. 79-82.
Hogg, W.D. and D.A., Carr. 1985. Rainfall Frequency Atlas for Canada. A publication of the Canadian Climate Program. Minister of Supply and Services Canada 1985.
PFRA (Prairie Farm Rehabilitation Administration). 2002. Gross Evaporation for the 30-Year Period 1971 - 2000 in the Canadian Prairies. Hydrology Report #143. PFRA, Agriculture and Agri-Food Canada.
Pomeroy, J.W, and D.M. Gray. 1995. Snowcover Accumulation, Relocation and Management, NHRI Science Rep. No. 7, Saskatoon, 144 pp.
Thornwaite, C.W. 1948. An Approach toward a Rational Classification of Climate. Geographical Review 38(2), 55-94.
The Environmental Assessment Act. 2013. SS c E-10.1. Available at: http://canlii.ca/t/52361.
March 2015 Report No. 12-1362-0197.DCN-042A 36

ANNEX I ATMOSPHERIC ENVIRONMENT BASELINE REPORT
APPENDIX I.1List of Invalid Noise Samples
March 2015 Report No. 12-1362-0197.DCN-042A

APPENDIX I.1 List of Invalid Noise Samples
This appendix provides tables of all one-minute noise samples (Leq,1min) that were eliminated from the calculation of hourly, daytime, and nighttime noise levels (Leq,1hr, Leq,day, Leq,night) at the Yancoal Southey Project baseline monitoring locations because they were deemed to be invalid based on Directive 038. This appendix also provides a justification for the elimination of these Leq,1min values.
INVALID DATA FROM R1
Table 1: Invalid Leq,1min Data Recorded at R1 Date Time Range Justification
June 30, 2014 2:02 p.m. to 2:32 p.m. technician activity June 30, 2014 2:33 p.m. to 10:10 p.m. wind and storm June 30, 2014 3:41 a.m. to 3:56 a.m. strong wind July 01, 2014 4:02 a.m. to 5:15 a.m. wind and storm July 01, 2014 5:23 a.m. to 5:33 a.m. wind and storm July 01, 2014 5:42 a.m. to 6:03 a.m. wind and storm July 01, 2014 6:16 a.m. to 6:40 a.m. traffic nearby July 01, 2014 6:48 a.m. to 7:04 a.m. strong wind July 01, 2014 8:04 a.m. to 8:06 a.m. birds nearby July 01, 2014 8:14 a.m. to 8:17 a.m. strong wind July 01, 2014 8:28 a.m. to 8:33 a.m. traffic nearby July 01, 2014 8:43 a.m. to 8:45 a.m. strong wind July 01, 2014 8:48 a.m. to 8:52 a.m. traffic nearby July 01, 2014 9:23 a.m. to 9:24 a.m. birds nearby July 01, 2014 9:37 a.m. to 9:39 a.m. dog nearby July 01, 2014 10:18 a.m. to 10:21 a.m. traffic nearby July 01, 2014 10:28 a.m. to 10:29 a.m. birds nearby July 01, 2014 10:39 a.m. to 10:43 a.m. traffic nearby July 01, 2014 1:27 p.m. to 1:33 p.m. traffic nearby July 01, 2014 1:38 p.m. to 1:43 p.m. technician activity
March 2015 Project No. 1401962 1

APPENDIX II.2 List of Invalid Noise Samples
INVALID DATA FROM R2 Table 2: Invalid Leq,1min Data Recorded at R2
Date Time Range Justification June 30, 2014 3:07 p.m. to 3:25 p.m. technician activity June 30, 2014 3:26 p.m. to 10:04 p.m. wind and storm July 01, 2014 12:42 a.m. to 12:43 a.m. strong wind July 01, 2014 12:45 a.m. to 12:49 a.m. strong wind July 01, 2014 12:53 a.m. to 12:54 a.m. strong wind July 01, 2014 12:56 a.m. to 12:57 a.m. strong wind July 01, 2014 1:02 a.m. to 1:04 a.m. strong wind July 01, 2014 1:12 a.m. to 1:13 a.m. strong wind July 01, 2014 1:30 a.m. to 1:32 a.m. strong wind July 01, 2014 1:54 a.m. birds nearby July 01, 2014 3:57 a.m. to 4:25 a.m. strong wind July 01, 2014 4:32 a.m. to 4:37 a.m. strong wind July 01, 2014 4:47 a.m. to 4:50 a.m. strong wind July 01, 2014 4:55 a.m. to 5:04 a.m. strong wind July 01, 2014 5:30 a.m. to 5:35 a.m. birds nearby July 01, 2014 5:44 a.m. to 5:48 a.m. birds nearby July 01, 2014 5:57 a.m. to 6:00 a.m. airplane nearby July 01, 2014 6:04 a.m. to 6:05 a.m. birds nearby July 01, 2014 6:09 a.m. to 6:13 a.m. birds nearby July 01, 2014 6:23 a.m. to 6:26 a.m. strong wind July 01, 2014 8:22 a.m. to 8:25 a.m. traffic nearby July 01, 2014 9:04 a.m. to 9:09 a.m. traffic nearby July 01, 2014 9:21 a.m. to 9:23 a.m. birds nearby July 01, 2014 9:42 a.m. to 9:43 a.m. strong wind July 01, 2014 10:04 a.m. to 10:05 a.m. strong wind July 01, 2014 9:35 a.m. birds nearby July 01, 2014 9:50 a.m. birds nearby July 01, 2014 10:42 a.m. to 10:44 a.m. strong wind July 01, 2014 10:55 a.m. to 10:57 a.m. strong wind July 01, 2014 11:27 a.m. to 11:33 a.m. strong wind July 01, 2014 11:55 a.m. birds nearby July 01, 2014 12:34 p.m. birds nearby July 01, 2014 1:12 p.m. birds nearby July 01, 2014 1:59 p.m. birds nearby July 01, 2014 2:05 p.m. birds nearby July 01, 2014 2:18 p.m. birds nearby July 01, 2014 2:32 p.m. to 2:33 p.m. traffic nearby July 01, 2014 2:46 p.m. to 2:48 p.m. technician activity
March 2015 Project No. 1401962 2

APPENDIX II.2 List of Invalid Noise Samples
INVALID DATA FROM R8 Table 3: Invalid Leq,1min Data Recorded at R8
Date Time Range Justification June 29, 2014 12:04 p.m. to 1:13 p.m. technician activity June 29, 2014 12:19 p.m. strong wind June 29, 2014 12:28 p.m. birds nearby June 29, 2014 12:36 p.m. strong wind June 29, 2014 12:47 p.m. to 12:48 p.m. strong wind June 29, 2014 2:02 p.m. to 2:09 p.m. birds nearby June 29, 2014 2:19 p.m. to 2:20 p.m. strong wind June 29, 2014 2:29 p.m. strong wind June 29, 2014 2:43 p.m. to 2:45 p.m. strong wind June 29, 2014 3:42 p.m. to 3:48 p.m. strong wind June 29, 2014 3:51 p.m. to 4:04 p.m. traffic nearby June 29, 2014 4:18 p.m. to 4:36 p.m. wind and storm June 29, 2014 5:38 p.m. to 5:39 p.m. strong wind June 29, 2014 6:53 p.m. to 6:57 p.m. strong wind June 29, 2014 7:12 p.m. to 7:15 p.m. strong wind June 29, 2014 7:18 p.m. strong wind June 29, 2014 7:24 p.m. to 7:37 p.m. strong wind June 29, 2014 7:44 p.m. to 7:45 p.m. strong wind June 29, 2014 7:53 p.m. to 8:01 p.m. strong wind June 29, 2014 8:15 p.m. to 8:16 p.m. birds nearby June 29, 2014 9:36 p.m. to 9:39 p.m. strong wind June 29, 2014 10:14 p.m. birds nearby June 30, 2014 3:00 a.m. to 6:40 a.m. wind and storm June 30, 2014 7:39 a.m. to 7:41 a.m. strong wind June 30, 2014 8:40 a.m. birds nearby June 30, 2014 8:58 a.m. birds nearby June 30, 2014 9:03 a.m. wind June 30, 2014 9:09 a.m. birds nearby June 30, 2014 9:28 a.m. to 9:43 a.m. strong wind June 30, 2014 10:14 a.m. to 10:17 a.m. strong wind June 30, 2014 10:42 a.m. to 10:43 a.m. strong wind June 30, 2014 11:48 a.m. to 11:59 a.m. strong wind June 30, 2014 12:09 p.m. strong wind June 30, 2014 12:47 p.m. to 1:08 a.m. traffic nearby and technician activity
March 2015 Project No. 1401962 3

APPENDIX II.2 List of Invalid Noise Samples
INVALID DATA FROM R15 Table 4: Invalid Leq, 1min Data Recorded at R15
Date Time Range Justification June 29, 2014 10:50 a.m. to 11:01 a.m. technician activity June 29, 2014 11:10 a.m. to 11:12 a.m. traffic nearby June 29, 2014 11:47 a.m. to 11:49 a.m. strong wind June 29, 2014 11:56 a.m. strong wind June 29, 2014 12:04 p.m. to 12:05 p.m. strong wind June 29, 2014 12:35 p.m. to 12:36 p.m. strong wind June 29, 2014 12:38 p.m. to 12:40 p.m. people nearby June 29, 2014 1:19 p.m. strong wind June 29, 2014 1:30 p.m. strong wind June 29, 2014 1:37 p.m. to 1:43 p.m. strong wind June 29, 2014 1:47 p.m. to 1:50 p.m. traffic nearby June 29, 2014 2:01 p.m. to 2:06 p.m. strong wind June 29, 2014 2:10 p.m. strong wind June 29, 2014 2:16 p.m. to 2:30 p.m. strong wind June 29, 2014 2:37 p.m. to 2:58 p.m. strong wind June 29, 2014 3:04 p.m. to 3:07 p.m. birds nearby June 29, 2014 3:11 p.m. birds nearby June 29, 2014 3:13 p.m. birds nearby June 29, 2014 3:20 p.m. to 3:21 p.m. birds nearby June 29, 2014 3:24 p.m. birds nearby June 29, 2014 3:41 p.m. to 4:19 p.m. wind and storm June 29, 2014 4:24 p.m. to 4:36 p.m. wind and storm June 29, 2014 5:26 p.m. to 5:28 p.m. wind and storm June 29, 2014 5:33 p.m. to 5:40 p.m. wind and storm June 29, 2014 5:48 p.m. to 6:06 p.m. wind and storm June 29, 2014 6:56 p.m. to 7:05 p.m. wind and storm June 29, 2014 7:21 p.m. strong wind June 29, 2014 7:38 p.m. strong wind June 29, 2014 8:11 p.m. strong wind June 29, 2014 8:19 p.m. strong wind June 29, 2014 8:23 p.m. to 8:24 p.m. strong wind June 30, 2014 2:45 a.m. to 7:30 a.m. wind and storm June 30, 2014 7:39 a.m. to 7:41 a.m. strong wind June 30, 2014 7:49 a.m. to 7:50 a.m. birds nearby June 30, 2014 8:35 a.m. to 8:46 a.m. traffic nearby June 30, 2014 9:14 a.m. to 10:05 a.m. wind and storm June 30, 2014 10:43 a.m. to 10:50 a.m. wind and storm June 30, 2014 11:07 a.m. to 11:08 a.m. birds nearby June 30, 2014 11:12 a.m. to 11:14 a.m. traffic nearby June 30, 2014 11:17 a.m. to 11:26 a.m. strong wind June 30, 2014 11:31 a.m. to 11:39 a.m. traffic nearby June 30, 2014 11:45 a.m. to 12:12 p.m. technician activity
March 2015 Project No. 1401962 4

ANNEX I ATMOSPHERIC ENVIRONMENT BASELINE REPORT
APPENDIX I.2Weather Data
March 2015 Report No. 12-1362-0197.DCN-042A

APPENDIX I.2 Weather Data
This appendix provides figures of the weather data (temperature, humidity, wind speed, and direction), recorded at the receptor locations for the Yancoal Southey Project baseline noise monitoring program.
Figure 1: Wind Speed and Direction Data for R1
Figure 2: Temperature and Humidity Data for R1
0
30
60
90
120
150
180
210
240
270
300
330
360
0.0
1.0
2.0
3.0
4.0
5.0
6.0
Win
d Di
rect
ion
(º)
Win
d Sp
eed
(m/s
)
Date and Time
Wind Speed Wind Direction
0.0
20.0
40.0
60.0
80.0
100.0
0
3
6
9
12
15
18
21
24
27
30
33
Rela
tive
Hum
idity
(%)
Tem
pera
ture
(ºC)
Date and Time
Temperature Relative Humidity
March 2015 Project No. 1401962 1

APPENDIX I.2 Weather Data
Figure 3: Wind Speed and Direction Data for R2
Figure 4: Temperature and Humidity Data for R2
0
30
60
90
120
150
180
210
240
270
300
330
360
0.0
1.0
2.0
3.0
4.0
5.0
6.0
Win
d Di
rect
ion
(º)
Win
d Sp
eed
(m/s
)
Date and Time
Wind Speed Wind Direction
0.0
20.0
40.0
60.0
80.0
100.0
0
3
6
9
12
15
18
21
24
27
30
33Re
lativ
e Hu
mid
ity (%
)
Tem
pera
ture
(ºC)
Date and Time
Temperature Relative Humidity
March 2015 Project No. 1401962 2

APPENDIX I.2 Weather Data
Figure 5: Wind Speed and Direction Data for R8
Figure 6: Temperature and Humidity Data for R8
0
30
60
90
120
150
180
210
240
270
300
330
360
0.0
1.0
2.0
3.0
4.0
5.0
6.0
Win
d Di
rect
ion
(º)
Win
d Sp
eed
(m/s
)
Date and Time
Wind Speed Wind Direction
0.0
20.0
40.0
60.0
80.0
100.0
0
3
6
9
12
15
18
21
24
27
30
33Re
lativ
e Hu
mid
ity (%
)
Tem
pera
ture
(ºC)
Date and Time
Temperature Relative Humidity
March 2015 Project No. 1401962 3
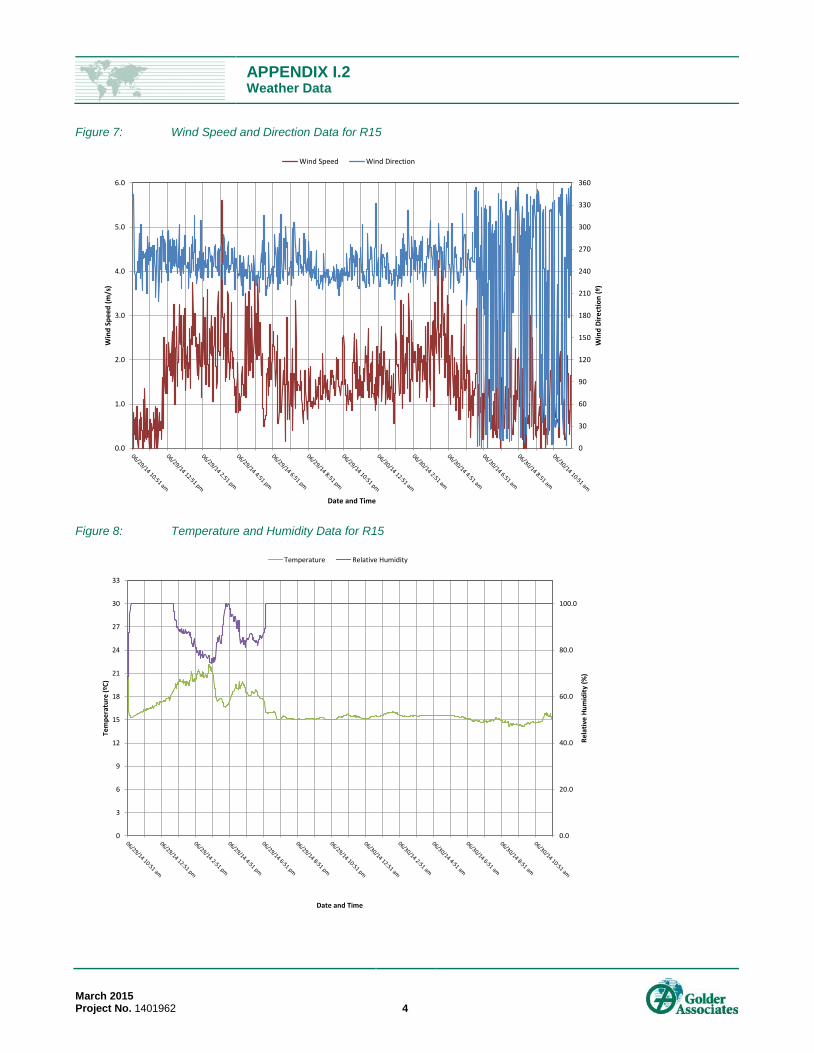
APPENDIX I.2 Weather Data
Figure 7: Wind Speed and Direction Data for R15
Figure 8: Temperature and Humidity Data for R15
0
30
60
90
120
150
180
210
240
270
300
330
360
0.0
1.0
2.0
3.0
4.0
5.0
6.0
Win
d Di
rect
ion
(º)
Win
d Sp
eed
(m/s
)
Date and Time
Wind Speed Wind Direction
0.0
20.0
40.0
60.0
80.0
100.0
0
3
6
9
12
15
18
21
24
27
30
33Re
lativ
e Hu
mid
ity (%
)
Tem
pera
ture
(ºC)
Date and Time
Temperature Relative Humidity
March 2015 Project No. 1401962 4

Golder Associates Ltd. 1721 8th Street East Saskatoon, Saskatchewan, Canada S7H 0T4 Canada T: +1 (306) 665 7989