report - tera.org study final.pdf · final report study title in vitro mammalian cell gene mutation...
TRANSCRIPT

FINAL REPORT
Study Title
In Vitro Mammalian Cell Gene Mutation Test(L5178Y/TK+/- Mouse Lymphoma Assay)
Test Article
Ammonium perchlorate
Authors
Richard H. C. San, Ph.D.Jane J. Clarke, B.A.
Study Completion Date
January 27, 1999
Performing Laboratory
BioReliance9630 Medical Center Drive
Rockville, MD 20850
Laboratory Study Number
G98BA06.702
Sponsor
Perchlorate Study GroupHighway 50 and Aerojet Road
Building 20019/Department 0330Rancho Cordova, CA 95813-6000
Page 1 of 32
BioReliance Study No. G98BA06.702 2
STATEMENT OF COMPLIANCE
Study G98BA06.702 was conducted in compliance with the US FDA Good Laboratory PracticeRegulations as published in 21 CFR 58, the US EPA GLP Standards 40 CFR 160 and 40 CFR792, the UK GLP Compliance Regulations, the Japanese GLP Regulations and the OECDPrinciples of Good Laboratory Practice in all material aspects with the following exceptions:
The identity, strength, purity and composition or othercharacteristics to define the test or control article have not beendetermined by the testing facility.
Analyses to determine the uniformity, concentration, or stabilityof the test or control mixtures were not performed by the testingfacility.
The stability of the test or control article under the test conditionshas not been determined by the testing facility.
Richard H. C. San, Ph.D. DateStudy Director

BioReliance Study No. G98BA06.702 3
qa page

BioReliance Study No. G98BA06.702 4
In Vitro Mammalian Cell Gene Mutation Test(L5178Y/TK+/- Mouse Lymphoma Assay)
FINAL REPORT
Sponsor: Perchlorate Study Group Highway 50 and Aerojet Road
Building 20019/Department 0330Rancho Cordova, CA 95813-6000
Study Monitor: Michael F. GirardPerchlorate Study Group Representative
Scientific Advisor: Michael L. Dourson, Ph.D., D.A.B.T.Toxicology Excellence for Risk Assessment
Performing Laboratory: BioReliance9630 Medical Center Drive
Rockville, MD 20850
Test Article I.D.: ammonium perchlorate
Test Article Lot No.: 05006CQ
Test Article Purity: 99.999% (Provided by Sponsor)
BioReliance Study No.: G98BA06.702
Test Article Description: white, crystalline solid
Storage Conditions: room temperature; protected from light andmoisture
Test Article Receipt: November 16, 1998
Study Initiation: December 2, 1998
Laboratory Manager: Jane J. Clarke, B.A.
Study Director: Richard H. C. San, Ph.D. Date

BioReliance Study No. G98BA06.702 5
TABLE OF CONTENTS
Page
Summary ........................................................................................................................................ 6
Purpose ........................................................................................................................................... 7
Characterization of Test and Control Articles............................................................................... 7
Materials and Methods................................................................................................................... 7
Results and Discussion................................................................................................................. 11
Conclusion.................................................................................................................................... 12
References .................................................................................................................................... 13
Data Tables................................................................................................................................... 14
Figures .......................................................................................................................................... 19
Appendix I: Historical Control Data............................................................................................ 21
Appendix II: Study Protocol ........................................................................................................ 23

BioReliance Study No. G98BA06.702 6
SUMMARY
The test article, ammonium perchlorate, was tested in the L5178Y/TK+/- Mouse LymphomaMutagenesis Assay in the absence and presence of Aroclor-induced rat liver S9. Thepreliminary toxicity assay was used to establish the dose range for the mutagenesis assay. Themutagenesis assay was used to evaluate the mutagenic potential of the test article.
Dimethyl sulfoxide (DMSO) was selected as the solvent of choice based on solubility of the testarticle and compatibility with the target cells. The test article was soluble in DMSO at 500mg/mL, the maximum concentration tested.
In the preliminary toxicity assay, the maximum concentration of ammonium perchlorate intreatment medium was 5000 µg/mL. No visible precipitate was present at any concentration intreatment medium. Selection of dose levels for the mutation assay was based on reduction ofsuspension growth relative to the solvent control. Substantial toxicity, i.e., suspension growthof ≤50% of the solvent control, was not observed at any concentration with or without S9activation.
Based on the results of the preliminary toxicity assay, the doses chosen for the mutagenesisassay ranged from 50 to 5000 µg/mL for both the non-activated and S9-activated cultures. Novisible precipitate was present at any concentration in treatment medium. No cloned culturesexhibited mutant frequencies that were at least 55 mutants per 106 clonable cells over that of thesolvent control. There was not a dose-response trend. Toxicity in the cloned cultures, i.e., totalgrowth of ≤50% of the solvent control, was not observed at any doses without activation butwas observed with S9 activation at doses of 4000 and 5000 µg/mL.
The trifluorothymidine-resistant colonies for the positive and solvent control cultures weresized according to diameter over a range from approximately 0.2 to 1.1 mm. The colony sizingfor the MMS positive control yielded the expected increase in small colonies, verifying theadequacy of the methods used to detect small colony mutants.
Under the conditions of this study, test article ammonium perchlorate was concluded to benegative in the L5178Y/TK+/- Mouse Lymphoma Mutagenesis Assay.

BioReliance Study No. G98BA06.702 7
PURPOSE
The purpose of this study was to evaluate the mutagenic potential of the test article based onquantitation of forward mutations at the thymidine kinase locus of L5178Y mouse lymphomacells.
CHARACTERIZATION OF TEST AND CONTROL ARTICLES
The test article, ammonium perchlorate, was received by BioReliance on November 16, 1998and was assigned the code number 98BA06. The test article was characterized by themanufacturer as a white powder, which should be stored in a cool dry place. Its purity wasgiven as 99.999%. Upon receipt, the test article was described as a white, crystalline solid andwas stored at room temperature, protected from light and moisture.
The vehicle (solvent) used to deliver ammonium perchlorate to the test system was DMSO(CAS 67-68-5) obtained from Fisher.
Methyl methanesulfonate (MMS), CAS 66-27-3, lot # 09419LR, expiration date 5/01, wassupplied by Aldrich Chemical Company and was used as the positive control for the non-activated test system at stock concentrations of 1000 and 2000 µg/mL. 7,12-Dimethyl-benz(a)anthracene (7,12-DMBA), CAS 57-97-6, lot # 85H0296, expiration date 1/99, wassupplied by Sigma Chemical Company and was used at stock concentrations of 250 and400 µg/mL as the positive control for the S9-activated test system.
MATERIALS AND METHODS
Test System
L5178Y cells, clone 3.7.2C, were obtained from Patricia Poorman-Allen, Glaxo Wellcome Inc.,Research Triangle Park, NC. Each lot of cryopreserved cells was tested using the agar cultureand Hoechst staining procedures and found to be free of mycoplasma contamination. Prior touse in the assay, L5178Y cells were cleansed of spontaneous TK-/- cells by culturing in arestrictive medium (Clive and Spector, 1975).
Metabolic Activation System
Aroclor 1254-induced rat liver S9 was used as the metabolic activation system. The S9 wasprepared from male Sprague-Dawley rats induced with a single intraperitoneal injection ofAroclor-1254, 500 mg/kg, five days prior to sacrifice. The S9 was batch prepared and stored at≤-70oC until used. Each bulk preparation of S9 was assayed for sterility and its ability tometabolize 2-aminoanthracene and 7,12-dimethyl-benz(a)anthracene to forms mutagenic toSalmonella typhimurium TA100.

BioReliance Study No. G98BA06.702 8
Immediately prior to use, the S9 was mixed with the cofactors and Fischer's Medium forLeukemic Cells of Mice with 0.1% Pluronics (F0P) to contain 250 µL S9, 6.0 mg nicotinamideadenine dinucleotide phosphate (NADP), 11.25 mg DL-isocitric acid and 750 µL F0P per mL ofS9-activation mixture and kept on ice until used. The cofactor/F0P mixture was filter sterilizedand adjusted to pH 7.0 prior to the addition of S9. The formulation of the activation mixture isbased on information from Turner et al. (1984). The final concentration of S9 in the treatmentmedium was 10%.
Solubility Test
A solubility test was conducted to select the solvent. The test was conducted using one or moreof the following solvents in the order of preference as listed: distilled water, dimethyl sulfoxide,ethanol and acetone. The test article was tested to determine the solvent, selected in order ofpreference, that permitted preparation of the highest soluble or workable concentration, up to500 mg/mL (the highest concentration tested).
Preliminary Toxicity Assay
The preliminary toxicity assay was used to establish the optimal dose levels for the mutagenesisassay. L5178Y cells were exposed to the solvent alone and nine concentrations of test articleranging from 0.5 to 5000 µg/mL in both the absence and presence of S9-activation.
Cell population density was determined 24 and 48 hours after the initial exposure to the testarticle. The cultures were adjusted to 3x10⁵ cells/mL after 24 hours only. Cultures with lessthan 3x10⁵ cells/mL were not adjusted. Toxicity was measured as suspension growth relative tothe growth of the solvent controls.
Mutagenesis Assay
The mutagenesis assay was used to evaluate the mutagenic potential of the test article. L5178Ymouse lymphoma cells were exposed to the solvent alone and at least eight concentrations oftest article in duplicate in both the absence and presence of S9. Positive controls, with andwithout S9-activation, were tested concurrently.
Treatment of the Target Cells
The mutagenesis assay was performed according to a protocol described by Clive and Spector(1975). Treatment was carried out in conical tubes by combining 6 x 10⁶ L5178Y/TK+/- cells,4 mL F0P medium or S9 activation mixture and 100 µL dosing solution of test or control articlein solvent or solvent alone in a total volume of 10 mL. A total of at least eight concentrationsof test article were tested in duplicate. The positive controls were treated with MMS (at finalconcentrations in treatment medium of 10 and 20 µg/mL) and 7,12-DMBA (at finalconcentrations in treatment medium of 2.5 and 4.0 µg/mL). Treatment tubes were gassed with5±1% CO2 in air, capped tightly, and incubated with mechanical mixing for 4 hours at 37±1°C.The preparation and addition of the test article dosing solutions were carried out under amberlighting and the cells were incubated in the dark during the exposure period. After the

BioReliance Study No. G98BA06.702 9
treatment period, the cells were washed twice with F0P or F0P supplemented with 10% horseserum and 2 mM L-glutamine (F10P). After the second wash, the cells were resuspended inF10P, gassed with 5±1% CO2 in air and placed on the roller drum apparatus at 37±1°C.
Expression of the Mutant Phenotype
For expression of the mutant phenotype, the cultures were counted using an electronic cellcounter and adjusted to 3x10⁵ cells/mL at approximately 24 and 48 hours after treatment in 20and 10 mL total volume, respectively. Cultures with less than 3x10⁵ cells/mL were notadjusted.
For expression of the TK-/- cells, cells were placed in cloning medium (C.M.) containing 0.23%granulated agar. Two flasks per culture to be cloned were labeled with the test articleconcentration, activation condition, and either TFT (trifluorothymidine, the selective agent) orV.C. (viable count). Each flask was prewarmed to 37±1ºC, filled with 100 mL C.M., andplaced in an incubator shaker at 37±1°C until used. The cells were centrifuged at 1000 rpm for10 minutes and the supernatant was decanted. The cells were then diluted in C.M. toconcentrations of 3x10⁶ cells/100 mL C.M. for the TFT flask and 600 cells/100 mL C.M. forthe V.C. flask. After the dilution, 1.0 mL of stock solution of TFT was added to the TFT flask(final concentration of 3 µg/mL) and both this flask and the V.C. flask were placed on theshaker at 125 rpm and 37±1°C. After 15 minutes, the flasks were removed and 33 mL of thecell suspension was pipetted into each of three appropriately labeled petri dishes. To acceleratethe gelling process, the plates were placed in cold storage (approximately 4°C) forapproximately 30 minutes. The plates were then incubated at 37±1°C in a humidified 5±1%CO2 atmosphere for 10-14 days.
Scoring Procedures
After the incubation period, the V.C. plates were counted for the total number of colonies perplate and the total relative growth determined. The TFT-resistant colonies were then countedfor each culture with �10% total relative growth. The diameters of the TFT-resistant coloniesfor the positive and solvent controls and, in the case of a positive response, the test article-treated cultures were determined over a range of approximately 0.2 to 1.1 mm. The rationalefor this procedure is as follows: Mutant L5178Y TK-/- colonies exhibit a characteristicfrequency distribution of colony sizes. The precise distribution of large and small TFT-resistantmutant colonies appears to be the characteristic mutagenic "finger-print" of carcinogens in theL5178Y TK+/- system (Clive et al., 1979; DeMarini et al., 1989). Clive et al. (1979) and Hozieret al. (1981) have presented evidence to substantiate the hypothesis that the small colonyvariants carry chromosome aberrations associated with chromosome 11, the chromosome onwhich the TK locus is located in the mouse (Kozak and Ruddle, 1977). They suggested thatlarge colony mutants received very localized damage, possibly in the form of a point mutationor small deletion within the TK locus, while small colony mutants received damage to collateralloci concordant with the loss of TK activity.
Evaluation of Results

BioReliance Study No. G98BA06.702 10
The cytotoxic effects of each treatment condition were expressed relative to the solvent-treatedcontrol for suspension growth over two days post-treatment and for total growth (suspensiongrowth corrected for plating efficiency at the time of selection). The mutant frequency (numberof mutants per 106 surviving cells) was determined by dividing the average number of coloniesin the three TFT plates by the average number of colonies in the three corresponding V.C.plates and multiplying by the dilution factor (2x10⁻⁴) then multiplying by 106. For simplicity,this is described as: (Average # TFT colonies / average # VC colonies) x 200 in the tables.
In evaluation of the data, increases in mutant frequencies that occurred only at highly toxicconcentrations (i.e., less than 10% total growth) were not considered biologically relevant. Allconclusions were based on sound scientific judgement; however, the following criteria arepresented as a guide to interpretation of the data (Clive et al., 1995):
• The result was considered to induce a positive response if a concentration-related increasein mutant frequency was observed and one or more dose levels with 10% or greater totalgrowth exhibited mutant frequencies of �100 mutants per 106 clonable cells over thebackground level.
• A result was considered equivocal if the mutant frequency in treated cultures was between55 and 99 mutants per 106 clonable cells over the background level.
• Test articles producing fewer than 55 mutants per 106 clonable cells over the backgroundlevel were concluded to be negative.
Criteria for a Valid Test
The following criteria must be met for the mutagenesis assay to be considered valid:
Negative Controls:
The spontaneous mutant frequency of the solvent control cultures must be within 20 to100 TFT-resistant mutants per 106 surviving cells. The cloning efficiency of thesolvent control group must be greater than 50%.
Positive Controls:
At least one concentration of each positive control must exhibit mutant frequencies of�100 mutants per 106 clonable cells over the background level. The colony sizedistribution for the MMS positive control must show an increase in both small andlarge colonies (Moore et al., 1985; Aaron et al., 1994).
Test Article-Treated Cultures:
A minimum of four analyzable concentrations with mutant frequency data will berequired.

BioReliance Study No. G98BA06.702 11
Archives
All raw data, protocol, and a copy of all reports will be maintained according to StandardOperating Procedure OPQP3040 by the BioReliance RAQA unit headquartered at:
BioReliance14920 Broschart Rd.Rockville, MD 20850
RESULTS AND DISCUSSION
Solubility Test
Dimethyl sulfoxide (DMSO) was selected as the solvent of choice based on solubility of the testarticle and compatibility with the target cells. The test article was soluble in DMSO at 500mg/mL, the maximum concentration tested.
Preliminary Toxicity Assay
The results of the preliminary toxicity assay are presented in Table 1. The maximum dosetested in the preliminary toxicity assay was 5000 µg/mL. No visible precipitate was present atany dose level in treatment medium. The osmolality of the solvent control was 447 mmol/kgand the osmolality of the highest soluble dose, 5000 µg/mL, was 462 mmol/kg. Suspensiongrowth relative to the solvent controls was 89% at 5000 µg/mL without activation and 72% at5000 µg/mL with S9 activation. Based on the results of the toxicity test, the doses chosen forthe mutagenesis assay ranged from 50 to 5000 µg/mL for both the non-activated and S9-activated cultures.
Mutagenesis Assay
The results of the mutagenesis assay are presented in Tables 2 through 5. Colony sizedistributions are presented in Figures 1 and 2. No visible precipitate was present at any doselevel in treatment medium. In the non-activated system, cultures treated with concentrations of1000, 2000, 3000, 4000 and 5000 µg/mL were cloned and produced a range in suspensiongrowth of 61% to 98%. In the S9-activated system, cultures treated with concentrations of1000, 2000, 3000, 4000 and 5000 µg/mL were cloned and produced a range in suspensiongrowth of 14% to 80%.
No cloned cultures exhibited mutant frequencies that were at least 55 mutants per 106 clonablecells over that of the solvent control. A dose-response trend was not observed in the non-activated or S9-activated systems. The total growths ranged from 69% to 92% for the non-activated cultures at concentrations of 1000 to 5000 µg/mL and 13% to 85% for the S9-activated cultures at concentrations of 1000 to 5000 µg/mL.

BioReliance Study No. G98BA06.702 12
The TFT-resistant colonies for the positive and solvent control cultures were sized according todiameter over a range from approximately 0.2 to 1.1 mm. The colony sizing for the MMSpositive control yielded the expected increase in small colonies, verifying the adequacy of themethods used to detect small colony mutants.
CONCLUSION
All criteria for a valid study were met as described in the protocol. The results of theL5178Y/TK+/- Mouse Lymphoma Mutagenesis Assay indicate that, under the conditions of thisstudy, ammonium perchlorate was concluded to be negative.

BioReliance Study No. G98BA06.702 13
REFERENCES
Aaron, C.S., Bolcsfoldi, G., Glatt, H.-R., Moore, M., Nishi, Y., Stankowski, L., Theiss, J. andThompson, E. (1994) Mammalian cell gene mutation assays working group report. MutationRes. 312:235-239.
Clive, D., Bolcsfoldi, G., Clements, J., Cole, J., Homna, M., Majeska, J., Moore, M., Muller, L.,Myhr, B., Oberly, T., Oudelhkim, M., Rudd, C., Shimada, H., Sofuni, T., Thybaud, V. andWilcox, P. (1995) Consensus agreement regarding protocol issues discussed during the mouselymphoma workshop: Portland, Oregon, May 7, 1994. Environ. Molec. Mutagen. 25:165-168.
Clive D., Johnson K.O., Spector J.F.S., Batson A.G. and Brown M.M.M. (1979) Validationand characterization of the L5178Y TK+/- mouse lymphoma mutagen assay system. MutationRes. 59:61-108.
Clive, D. and Spector, J.F.S. (1975) Laboratory procedure for assessing specific locusmutations at the TK locus in cultured L5178 TK+/- mouse lymphoma cells. Mutation Res.31:17-29.
DeMarini, D.M., Brockman, H.E., de Serres, F.J., Evans, H.H., Stankowski Jr, L.F. and Hsie,A.W. (1989) Specific-locus mutations induced in eukaryotes (especially mammalian cells) byradiation and chemicals: a perspective. Mutation Res. 220:11-29.
Hozier, J., Sawyer, J., Moore, M., Howard, B. and Clive, D. (1981) Cytogenetic analysis of theL5178Y/TK+/- → TK-/- mouse lymphoma mutagenesis assay system. Mutation Res. 84:169-181.
Kozak, C.A. and Ruddle, F.H. (1977) Assignment of the genes for thymidine kinase andgalactokinase to Mus musculus chromosome 11 and the preferential segregation of thischromosome in Chinese hamster/mouse somatic cell hybrids. Somatic Cell Genet. 3:121-133.
Moore, M.M., Clive, D., Howard, B.E., Batson, A.G. and Turner, N.T. (1985) In situ analysis oftrifluorothymidine-resistant (TFTr) mutants of L5178Y/TK+/- mouse lymphoma cells. MutationRes. 151:147-159.
Turner, N.T., Batson, A.G. and Clive, D. (1984) Procedures for the L5178Y/TK+/- → TK-/-
Mouse Lymphoma Cell Mutagenicity Assay. In: B.J. Kilbey, M. Legator, W. Nichols and C.Ramel (Eds.), Handbook of Mutagenicity Test Procedures, Second Edition, Elsevier,Amsterdam, pp. 239-268.

BioReliance Study No. G98BA06.702 14
TABLE 1
PRELIMINARY TOXICITY ASSAY USING ammonium perchlorate-------------------------------------------------------------------------------- Test Article Cell Concentration Suspension Growth Concentration (X10^6)a % of (µg/mL) Day 1 Day 2 Totalb Controlc================================================================================
WITHOUT ACTIVATION Solvent 1 0.921 1.343 13.7 Solvent 2 0.915 1.297 13.2 .5 0.901 1.362 13.6 101 1.5 0.923 1.357 13.9 103 5 0.863 1.373 13.2 98 15 0.827 1.392 12.8 95 50 0.872 1.323 12.8 95 150 0.926 1.282 13.2 98 500 0.862 1.359 13.0 97 1500 0.895 1.281 12.7 95 5000 0.732 1.469 11.9 89
WITH S-9 ACTIVATION Solvent 1 0.663 1.292 9.5 Solvent 2 0.650 1.333 9.6 .5 0.686 1.368 10.4 109 1.5 0.693 1.379 10.6 111 5 0.700 1.349 10.5 110 15 0.652 1.307 9.5 99 50 0.663 1.341 9.9 103 150 0.647 1.316 9.5 99 500 0.661 1.333 9.8 102 1500 0.606 1.413 9.5 99 5000 0.507 1.224 6.9 72
----------------------------------------------------------------------------------------------------------------------------------------------------------------
Solvent = DMSO
1 and 2 are duplicate cultures
a - Cultures containing <0.3x10⁶ cells/mL on day 1 and 2 are considered as having 0%total suspension growth.
b - Total suspension growth = (Day 1 cell conc. / 0.3x10⁶ cells/mL) x (Day 2 cellconc. / Day 1 adjusted cell conc.)
c - % of control suspension growth = (total treatment suspension growth / averagesolvent control total suspension growth) x 100
BioReliance Study No. G98BA06.702 15
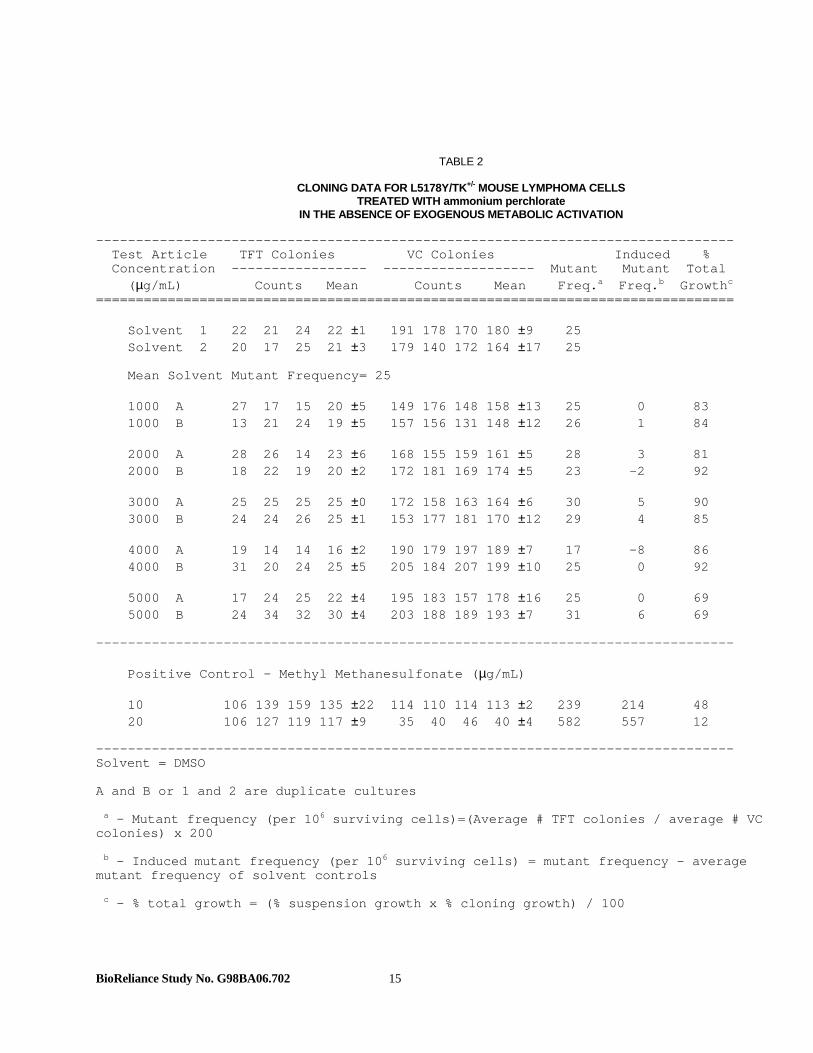
TABLE 2
CLONING DATA FOR L5178Y/TK+/- MOUSE LYMPHOMA CELLSTREATED WITH ammonium perchlorate
IN THE ABSENCE OF EXOGENOUS METABOLIC ACTIVATION
-------------------------------------------------------------------------------- Test Article TFT Colonies VC Colonies Induced % Concentration ----------------- ------------------- Mutant Mutant Total (µg/mL) Counts Mean Counts Mean Freq.a Freq.b Growthc================================================================================
Solvent 1 22 21 24 22 ±1 191 178 170 180 ±9 25 Solvent 2 20 17 25 21 ±3 179 140 172 164 ±17 25
Mean Solvent Mutant Frequency= 25
1000 A 27 17 15 20 ±5 149 176 148 158 ±13 25 0 83 1000 B 13 21 24 19 ±5 157 156 131 148 ±12 26 1 84
2000 A 28 26 14 23 ±6 168 155 159 161 ±5 28 3 81 2000 B 18 22 19 20 ±2 172 181 169 174 ±5 23 -2 92
3000 A 25 25 25 25 ±0 172 158 163 164 ±6 30 5 90 3000 B 24 24 26 25 ±1 153 177 181 170 ±12 29 4 85
4000 A 19 14 14 16 ±2 190 179 197 189 ±7 17 -8 86 4000 B 31 20 24 25 ±5 205 184 207 199 ±10 25 0 92
5000 A 17 24 25 22 ±4 195 183 157 178 ±16 25 0 69 5000 B 24 34 32 30 ±4 203 188 189 193 ±7 31 6 69
--------------------------------------------------------------------------------
Positive Control - Methyl Methanesulfonate (µg/mL) 10 106 139 159 135 ±22 114 110 114 113 ±2 239 214 48 20 106 127 119 117 ±9 35 40 46 40 ±4 582 557 12
--------------------------------------------------------------------------------Solvent = DMSO
A and B or 1 and 2 are duplicate cultures
a - Mutant frequency (per 106 surviving cells)=(Average # TFT colonies / average # VCcolonies) x 200
b - Induced mutant frequency (per 106 surviving cells) = mutant frequency - averagemutant frequency of solvent controls
c - % total growth = (% suspension growth x % cloning growth) / 100

BioReliance Study No. G98BA06.702 16
TABLE 3
TOTAL COMPOUND TOXICITY DATA FOR L5178Y/TK+/- MOUSE LYMPHOMA CELLSTREATED WITH ammonium perchlorate
IN THE ABSENCE OF EXOGENOUS METABOLIC ACTIVATION
Test Article Cell Concentration Concentration (X 10^6)a Susp Growth Cloning Growth % Total (µg/mL) Day 1 Day 2 Totalb %Cntlc Avg VC %Cntld Growthe================================================================================
Solvent 1 1.438 1.362 21.8 180 Solvent 2 1.446 1.270 20.4 164
1000 A 1.229 1.397 19.1 90 158 92 83 1000 B 1.301 1.425 20.6 98 148 86 84
2000 A 1.236 1.333 18.3 87 161 94 81 2000 B 1.311 1.306 19.0 90 174 101 92
3000 A 1.200 1.492 19.9 94 164 96 90 3000 B 1.187 1.367 18.0 85 170 99 85
4000 A 1.131 1.318 16.6 79 189 110 86 4000 B 1.135 1.323 16.7 79 199 116 92
5000 A 1.062 1.193 14.1 67 178 104 69 5000 B 1.068 1.085 12.9 61 193 113 69
--------------------------------------------------------------------------------
Positive Control - Methyl Methanesulfonate (µg/mL) 10 1.232 1.134 15.5 74 113 66 48 20 1.081 0.884 10.6 50 40 23 12
--------------------------------------------------------------------------------Solvent = DMSO
A and B or 1 and 2 are duplicate cultures
a - Cultures containing <0.3x10⁶ cells/mL on day 1 and 2 are considered as having 0%total suspension growth.
b - Total suspension growth = (Day 1 cell conc. / 0.3x10⁶ cells/mL) x (Day 2 cellconc. / Day 1 adjusted cell conc.)
c - % of control suspension growth = (total treatment suspension growth / averagesolvent control total suspension growth) x 100
d - % control cloning growth = (average V.C. of treated culture / average V.C. ofsolvent control) x 100
e - % total growth = (% suspension growth x % cloning growth) / 100

BioReliance Study No. G98BA06.702 17
TABLE 4
CLONING DATA FOR L5178Y/TK+/- MOUSE LYMPHOMA CELLSTREATED WITH ammonium perchlorate
IN THE PRESENCE OF EXOGENOUS METABOLIC ACTIVATION
-------------------------------------------------------------------------------- Test Article TFT Colonies VC Colonies Induced % Concentration ----------------- ------------------- Mutant Mutant Total (µg/mL) Counts Mean Counts Mean Freq.a Freq.b Growthc================================================================================
Solvent 1 21 28 30 26 ±4 150 130 157 146 ±11 36 Solvent 2 24 34 50 36 ±11 163 178 163 168 ±7 43
Mean Solvent Mutant Frequency= 40
1000 A 24 30 18 24 ±5 186 208 166 187 ±17 26 -14 80 1000 B 15 19 28 21 ±5 158 157 181 165 ±11 25 -15 85
2000 A 35 35 25 32 ±5 190 173 153 172 ±15 37 -3 65 2000 B 21 24 26 24 ±2 199 170 207 192 ±16 25 -15 82
3000 A 35 38 33 35 ±2 192 165 169 175 ±12 40 1 58 3000 B 28 22 34 28 ±5 186 176 186 183 ±5 31 -9 64
4000 A 38 32 33 34 ±3 169 172 150 164 ±10 42 2 41 4000 B 33 28 34 32 ±3 183 185 175 181 ±4 35 -5 42
5000 A 38 34 47 40 ±5 135 137 142 138 ±3 57 18 13 5000 B + 40 50 45 ±4 191 162 173 175 ±12 51 12 21
--------------------------------------------------------------------------------
Positive Control - 7,12 Dimethylbenz(a)anthracene (µg/mL) 2.5 135 129 136 133 ±3 120 129 137 129 ±7 207 168 65 4 171 166 189 175 ±10 130 111 99 113 ±13 309 270 42--------------------------------------------------------------------------------Solvent = DMSO
A and B or 1 and 2 are duplicate cultures
+ - Culture lost to contamination
a - Mutant frequency (per 106 surviving cells)=(Average # TFT colonies / average # VCcolonies) x 200
b - Induced mutant frequency (per 106 surviving cells) = mutant frequency - averagemutant frequency of solvent controls
c - % total growth = (% suspension growth x % cloning growth) / 100

BioReliance Study No. G98BA06.702 18
TABLE 5
TOTAL COMPOUND TOXICITY DATA FOR L5178Y/TK+/- MOUSE LYMPHOMA CELLSTREATED WITH ammonium perchlorate
IN THE PRESENCE OF EXOGENOUS METABOLIC ACTIVATION
Test Article Cell Concentration Concentration (X 10^6)a Susp Growth Cloning Growth % Total (µg/mL) Day 1 Day 2 Totalb %Cntlc Avg VC %Cntld Growthe================================================================================
Solvent 1 1.291 1.443 20.7 146 Solvent 2 1.315 1.503 22.0 168
1000 A 1.150 1.129 14.4 68 187 119 80 1000 B 1.225 1.256 17.1 80 165 105 85
2000 A 1.014 1.114 12.5 59 172 110 65 2000 B 1.060 1.218 14.3 67 192 122 82
3000 A 0.919 1.088 11.1 52 175 112 58 3000 B 0.845 1.248 11.7 55 183 116 64
4000 A 0.685 1.108 8.4 40 164 104 41 4000 B 0.642 1.083 7.7 36 181 115 42
5000 A 0.293 0.919 3.1 14 138 88 13 5000 B 0.412 0.866 4.0 19 175 112 21
--------------------------------------------------------------------------------
Positive Control - 7,12 Dimethylbenz(a)anthracene (µg/mL) 2.5 1.087 1.397 16.9 79 129 82 65 4 0.949 1.188 12.5 59 113 72 42
--------------------------------------------------------------------------------Solvent = DMSO
A and B or 1 and 2 are duplicate cultures
a - Cultures containing <0.3x10⁶ cells/mL on day 1 and 2 are considered as having 0%total suspension growth.
b - Total suspension growth = (Day 1 cell conc. / 0.3x10⁶ cells/mL) x (Day 2 cellconc. / Day 1 adjusted cell conc.)
c - % of control suspension growth = (total treatment suspension growth / averagesolvent control total suspension growth) x 100
d - % control cloning growth = (average V.C. of treated culture / average V.C. ofsolvent control) x 100
e - % total growth = (% suspension growth x % cloning growth) / 100

BioReliance Study No. G98BA06.702 19
Figure 1
Colony Size Distribution in the Absence of Metabolic Activation
(Positive Control Compared with Solvent Control)
G98BA06.702 B1 MMS
0.0
10.0
20.0
30.0
40.0
50.0
60.0
70.0
0.2 0.3 0.4 0.5 0.6 0.7 0.8 0.9 1.0 1.1
Colony Size Setting (Approx. mm)
10 µg/mL Solvents

BioReliance Study No. G98BA06.702 20
Figure 2
Colony Size Distribution in the Presence of Metabolic Activation
(Positive Control Compared with Solvent Control)
G98BA06.702 B1 DMBA
0.0
10.0
20.0
30.0
40.0
50.0
60.0
0.2 0.3 0.4 0.5 0.6 0.7 0.8 0.9 1.0 1.1
Colony Size Setting (Approx. mm)
2.5 µg/mL Solvents

BioReliance Study No. G98BA06.702 21
APPENDIX I
Historical Control Data

BioReliance Study No. G98BA06.702 22
Mouse Lymphoma Historical Control Data
1995-1997
Non-activated S9-Activated
SolventControl
20 •g/mLMMS
10 •g/mLMMS
SolventControl
4.0•g/mLDMBA
2.5•g/mLDMBA
Mean MF 35.7 655.3 336.0 58.0 453.2 269.8
SD 10.3 293.3 128.5 18.6 158.5 95.1
Maximum 68.0 2400.0 729.0 100.0 1029.0 1048.0
Minimum 20.0 198.0 128.0 28.0 222.0 141.0
Solvent control (Fischer's medium, distilled water, saline, DMSO, ethanol, acetone or vehiclesupplied by Sponsor)
MMS Methyl methanesulfonateDMBA Dimethylbenz(a)anthraceneMF Mutant frequency per 106 clonable cellsSD Standard deviation

BioReliance Study No. G98BA06.702 23
APPENDIX II
Study Protocol

BioReliance Study No. G98BA06.702 24

BioReliance Study No. G98BA06.702 25

BioReliance Study No. G98BA06.702 26

BioReliance Study No. G98BA06.702 27

BioReliance Study No. G98BA06.702 28

BioReliance Study No. G98BA06.702 29

BioReliance Study No. G98BA06.702 30

BioReliance Study No. G98BA06.702 31

BioReliance Study No. G98BA06.702 32