report series - download.101com.comdownload.101com.com/tdwi/research_report/2003bireport_v7.pdfsmart...
TRANSCRIPT

Wayne Eckerson
REPORT SER IES
SmartCompaniesin the 21stCentury:The Secrets
of Creating
Successful
Business
Intelligence
Solutions

Smart Companies in the 21st Century
WAYNE ECKERSON is the director of research for The Data Warehousing Institute (TDWI), theleading provider of high-quality, in-depth education and research for data warehousing and busi-ness intelligence professionals worldwide. Eckerson oversees TDWI’s research services and coordi-nates its BI Strategies education program.
Eckerson has written and spoken on data warehousing and business intelligence since 1994. He haspublished in-depth reports and articles about data integration, data quality, customer relationshipmanagement, online analytical processing (OLAP), Web-based analytical tools, analytic applications,and portals, among other topics. In addition, Eckerson has delivered presentations at industry confer-ences, user group meetings, and vendor seminars. He has also consulted with vendor and user firms.
About the Author
Executive Summary
Smart companies in the 21st century use business intelligence (BI) solutions to gain a clearer pictureof their internal operations, customers, supply chain, and financial performance. They also derivesignificant ROI by using BI to devise better tactics and plans, respond more effectively to emergencies,and capitalize more quickly on new opportunities. In short, they are using BI to become intelligent about the way they do business.
BI solutions create learning organizations by enabling companies to follow a virtuous cycle of collecting and analyzing information, devising and acting on plans, and reviewing and refining theresults. To support this cycle and gain the insights BI delivers, organizations need to implement aBI system comprised of data warehousing and analytical environments.
Smart companies recognize that the systems that support BI solutions are very different from othersystems in the company. Well-designed BI systems are adaptive by nature; they continually changeto answer new and different business questions. And the best way to adapt effectively is to startsmall and grow organically. Each new increment refines and extends the solution, adjusting to userfeedback and new requirements.
Like a sprawling redwood forest, the best BI solutions take years to mature, expanding in breadthand depth over time. It is no coincidence that the value of a BI solution grows exponentially withthe number of users and applications it supports.
However, not all BI solutions succeed. Even before a project begins, there are telltale signs indicatingwhether it will succeed, struggle, or fail. It’s important that organizations understand the key indicatorsof success so they can surmount the challenges associated with every BI project. This report showsthat successful BI solutions have the following characteristics:
1.Business sponsors are highly committed and actively involved in the project.2.Business users and the BI technical team work together closely.3.The BI system is viewed as an enterprise resource and given adequate funding and guidance
to ensure long-term growth and viability.4. Firms provide users both static and interactive online views of data. 5.The BI team has prior experience with BI and is assisted by vendor and independent
consultants in a partnership arrangement.6.The company’s organizational culture reinforces the BI solution.
These and other traits signal success, but don’t guarantee it. In the end, each organization needs todevise a plan and execute it. Ultimately, smart companies in the 21st century succeed by makingsure the business—not the technical team—drives the BI solution and is accountable for its success.

Research Sponsors
Actuate Corporation
arcplan, Inc.
Business Objects
Cognos Inc.
Scope, Methodology, and Demographics . . . . . . . . . . .2The Need for Business Intelligence . . . . . . . . . . . . . . .3Understanding Business Intelligence . . . . . . . . . . . . .4
The “Data Refinery” . . . . . . . . . . . . . . . . . . . . . . . . . . . .4Learning Organizations . . . . . . . . . . . . . . . . . . . . . . . . . .5Business Intelligence Framework . . . . . . . . . . . . . . .6BI versus OLTP Systems . . . . . . . . . . . . . . . . . . . . . . .7The Analytical Landscape . . . . . . . . . . . . . . . . . . . . .9
The Value of Business Intelligence . . . . . . . . . . . . . . .11Justifying BI Solutions . . . . . . . . . . . . . . . . . . . . . . .11Managing Expectations . . . . . . . . . . . . . . . . . . . . . .13
THE DATA WAREHOUSING INSTITUTE www.dw-institute.com 1
Table of Contents
by Wayne W. Eckerson
Smart Companies in the 21st Century:The Secrets of Creating Successful
Business Intelligence Solutions
REPORT SER IES
The Profile of Success . . . . . . . . . . . . . . . . . . . . . . . . .14Creating the Profile . . . . . . . . . . . . . . . . . . . . . . . . .14Business Leadership . . . . . . . . . . . . . . . . . . . . . . . .14Alignment . . . . . . . . . . . . . . . . . . . . . . . . . . . . . . . . .17Enterprise View . . . . . . . . . . . . . . . . . . . . . . . . . . . .20Budgets . . . . . . . . . . . . . . . . . . . . . . . . . . . . . . . . . .22Culture . . . . . . . . . . . . . . . . . . . . . . . . . . . . . . . . . . .23Analytics . . . . . . . . . . . . . . . . . . . . . . . . . . . . . . . . .25Project Team Competencies . . . . . . . . . . . . . . . . . . .27Partnerships . . . . . . . . . . . . . . . . . . . . . . . . . . . . . . .28Summary—Characteristics of Success . . . . . . . . . .31
Guidelines for Success . . . . . . . . . . . . . . . . . . . . . . . . .32Conclusion . . . . . . . . . . . . . . . . . . . . . . . . . . . . . . . . . . .35
Crystal Decisions, Inc.
Informatica Corporation
MicroStrategy, Inc.
Oracle Corporation

2 THE DATA WAREHOUSING INSTITUTE www.dw-institute.com
Smart Companies in the 21st Century
29%
Business sponsor or user (17%)
Corporate IT professional (54%)
Independent consultant or systems integrator (29%)Independent consultant or systems integrator (29%
54%
17%
7%6%
8%
6%
3%
6%
13%15%
5%
3%
13%
Federal government
Education
Software/InternetTelecommunications
Retail/wholesale/distribution
Computer manufacturingState/local government
Consulting/professional services
InsuranceManufacturing (non-computer)
Financial services
0 3 6 9 12 15
3%3%
3%Utilities
Transportation/logisticsOther
6%
Healthcare
Demographics
Position
Industry
15%
Less than $10 million (11%)
$10 million to $100 million (18%)
$100 million to $500 million (18%)$100 million to $500 million (18%)
18%
11%
$500 million to $1 billion (9%)
$1 billion to $10 billion (30%)
$10 billion+ (15%)
30%
9%
18%
CompanyRevenues
Report Scope. This report is designed forbusiness executives who are evaluatingwhether to fund a business intelligencesolution or who want to ensure the suc-cess of an existing solution. The reportprovides an overview of business intelli-gence concepts and components and thenexamines key indicators of BI success. Methodology. The research for thisreport is based on a survey that TDWIconducted in April 2003, as well as inter-views with BI “experts” including end-user organizations, BI consultants, indus-try analysts, and report sponsors. Survey Methodology. TDWI contactedBI professionals in its database and101communications’ database. (TDWI is abusiness unit of 101communications.) Italso contacted BI professionals in listsfrom BetterManagement.com, IntelligentEnterprise magazine, and CIO magazine. Intotal, 686 people responded, 540 of whichwere qualified to complete the entire survey.Respondents were disqualified from tak-ing the survey if they indicated that theywork for a BI vendor or are a professor orstudent. Respondents were also disquali-fied if they said their organizations had noplans to deploy BI solutions. Branchinglogic accounts for most of the variation inthe number of respondents answeringeach question. Multi-choice questions androunding techniques account for totalsthat don’t equal 100 percent.Survey Demographics. A majority ofthe qualified survey respondents (54 per-cent) are corporate IT professionals. Theremainder are independent consultants(29 percent) and business sponsors/users(17 percent). A majority of respondentswork at large companies with revenues inexcess of $500 million. Most respondentsare based in the United States and workin a range of industries, the largest por-tion being consulting and financial servic-es. On average, respondent organizationshave had a BI solution in place for 3.6years. (See the illustrations at right forbreakouts.)
6.5%
United States (66%)
European countries (14%)
Canada (5%)Canada (5%)
%5%%
2%
Australia (4%)
Latin America (2.5%)
India (2%)
2.5%2
%
14%
4%
Other (6.5%)
66%
7%
Less than 1 year (12%)
2-3 years (29%)
4 5 years (22%)4-5 years (22%)
12%
6-9 years (15%)
10+ years (7%)
About to deploy (9%)
9%7%
29%15%
22%
No plans (7%)
Average: 3.6 years
Country/Region
Years Deployedwith BI
Research Methodology
THE DATA WAREHOUSING INSTITUTE www.dw-institute.com 3
The Need for Business Intelligence
The Need for Business Intelligence
Today’s Business Climate. Today’s business environment is brutal and uncompromising.
Globalization has spawned bigger, more powerful competitors. Customers are more sophisti-
cated and selective, demanding higher levels of service, quality, and customization.
Deregulation has opened once hidebound industries to rough-and-tumble competition while
new privacy regulations require firms to overhaul the way they collect and use customer infor-
mation. The economic slowdown is squeezing profits and slowing capital investments just as
the pace of business is accelerating into the realm of “real time.”
In this climate, companies that work “smarter” have a competitive advantage. Rather than react
to crises and opportunities, these organizations anticipate them. They also see and capitalize
on opportunities before the competition; identify and resolve problems before they escalate
into crises; and reengineer internal processes, products, and services to enhance customer sat-
isfaction and loyalty.
Smart Organizations. The secret weapon that these “smart” organizations wield is informa-
tion—more specifically, highly integrated information that empowers workers with new
insights about what drives the business and how to optimize business processes to better
meet strategic goals and objectives. In short, smart companies in the 21st century use business
intelligence to increase their corporate agility and meet the needs of today’s fast-paced and
demanding marketplace.
The ROI of BI. Business intelligence (or BI for short) is not hype. Organizations around the world
and in many different industries have been reaping the benefits of BI for years. For example:
• A major airline estimates it generated $40 million in new revenue and saved $31
million in costs last year from just four of the 35 applications running in its BI
environment.
• A major distributor of electrical construction products generates $9 million in cost sav-
ings and new revenues from an enterprisewide BI solution. The firm expects a payback
of $70 million by 2004.
• A state department of finance and revenue has closed its tax compliance gap by $10
million a year while optimizing customer satisfaction, thanks to a new BI solution.
• A major electronics retailer attributes $1.3 million a year in fewer out-of-stock situations
to a BI solution. The same solution also saves $2.3 million a year in inventory costs due
to more accurate supplier shipments.
• A major automobile manufacturer generated a 2,000 percent ROI on a financial BI
solution that saved the firm millions of dollars by identifying repossessed vehicle loans
more quickly.
These are just a few of the many successful BI solutions at work today. However, it would be
misleading to suggest that every BI solution generates substantial business value or return on
investment. Not all companies succeed with BI. It takes a considerable amount of money,
time, and business and technical leadership to create and sustain a BI solution that delivers
real value. Unfortunately, many executives underestimate the commitment they and their
organizations need to make to ensure success.
The good news is that most organizations eventually succeed, even if they fail initially. In a
recent TDWI conference survey, only 18 percent of “stalled” BI projects were canceled out-
Organizations MustWork “Smarter” toStay Ahead
“Smart” CompaniesUse BusinessIntelligence
Not All BI ProjectsSucceed, Initially

4 THE DATA WAREHOUSING INSTITUTE www.dw-institute.com
Smart Companies in the 21st Century
right. The rest were given another chance after a restructuring of the project with new
sponsors, project managers, consultants, or funding levels. With the benefit of hard-earned
experience, most BI teams can deliver substantial value.
Report Overview. This report provides an overview of BI concepts and strategies for business
executives who want to transform their organizations into “smart companies” in the 21st century.
It uses survey data to define the key attributes of successful BI solutions, giving executives
and organizations a benchmark against which to compare themselves. It then identifies critical
success factors and pitfalls to avoid when creating a BI solution that delivers real benefits.
Understanding Business Intelligence
The “Data Refinery”
TDWI likens business intelligence to a “data refinery.” To understand this analogy, think of an
oil refinery. It’s designed to take a raw material—crude oil—and process it into a multiplicity
of products such as gasoline, jet fuel, kerosene, and lubricants. In the same way, a BI
environment takes another raw material—data—and processes it into a multiplicity of
information products. (See illustration 1).
From Data to Information. More specifically, a data warehouse extracts data from multiple
transaction or operational systems and integrates and stores the data in a dedicated database.
For example, a data warehouse might match and merge customer records from five opera-
tional systems (e.g. orders, service, sales, shipments, and loyalty programs) into a single file.
This extraction and integration process turns data into a new product—information.
From Information to Knowledge. Then, users equipped with analytical tools (e.g. query,
reporting, OLAP, and data mining tools) access and analyze the information in the data
warehouse. Their analysis identifies trends, patterns, and exceptions. Analytical tools enable
users to turn information into knowledge.
A BI System CreatesMany InformationProducts
Illustration 1. A BI environment can be thought of as a “data refinery.”
enceExperi
elsRules and Mode
ToolsAnalytical
WarehouseData W
neMeasure, RefinReview, MWisdom
Act
Plans
KnowledgeOperational Syystems
Information
EEvvents
DDDaaatata
Data
BI As a Data Refinery

THE DATA WAREHOUSING INSTITUTE www.dw-institute.com 5
Understanding Business Intelligence
From Knowledge to Rules. Armed with these insights, users then create rules from the trends
and patterns they’ve discovered. These rules can be simple (e.g., “Order 50 new units whenev-
er inventory falls below 25 units.”) Or, they can be forecasts or “what if” projections based on
past trends and working assumptions. Or the rules can be highly complex, generated by statis-
tical algorithms or models. For example, statistically-generated rules can dynamically configure
prices in response to changing market conditions, optimize freight hauling schedules in a large
carrier network, or determine the best cross-sell opportunities using customer response models.
From Rules to Plans and Action. Users then create plans that implement the rules. For example,
marketers create campaigns that define what offers to make to which customers through
various channels (e.g. direct mail or email) based on their analysis of customer segments,
models that predict how customers will respond to specific offers, and the results of previous
campaigns. The plans turn knowledge and rules into action.
Feedback Loop. Once the plan is executed, the cycle repeats itself. Operational systems capture
customer responses to the offers or plan and subsequent transactions (e.g. sales.) This data is then
extracted by the data warehouse, integrated with other pertinent data, and analyzed by users who
evaluate the effectiveness of their plans and refine them accordingly. The cycle then repeats itself.
Learning Organizations
Five-Step Learning Cycle. This virtuous cycle—in essence, “capture,” “analyze,” “plan,” “act,”
and “review”—creates a learning organization that can respond flexibly and nimbly to new
events in the marketplace. (See illustration 2) When organizations repeat this learning cycle,
they gain a strong empirical understanding of how their business operates and how its
decisions and actions affect the marketplace and vice versa.
This learning cycle embodies the essence of business intelligence, which TDWI defines as:
The processes, tools, and technologies required to turn data into information and information
into knowledge and plans that drive effective business activity.
The best BI solutions provide robust support for each step in the learning cycle and enhance
an organization’s ability to accelerate the cycle to stay ahead of customers and changing
market conditions.
BI Systems MimicHuman DecisionMaking
Illustration 2. BI uses the same five-step learning cycle that humans use in everyday life: capture, analyze, plan, act, review.
PlalanAn
a yyyyzzzyzyzyze
Review
ActCa
pttt ure
The BI Learning Cycle

6 THE DATA WAREHOUSING INSTITUTE www.dw-institute.com
Smart Companies in the 21st Century
Human Learning. In many respects, the best BI solutions are designed to mimic the processes
that humans use every day to learn and make judicious decisions. During our lifetime, we
experience millions of events that we assimilate, analyze, and turn into rules, consciously or
not. Each time we apply a “rule,” we get feedback on its validity, which enables us to refine
the rules and adapt to changes in our environment. Our “gut instincts” are no more than the
unconscious application of rules refined from millions and millions of life experiences.
Business Intelligence Framework
Now that we understand the conceptual basis of business intelligence, let’s explore the
components that comprise a BI environment.
Data Warehousing Environment. The diagram below depicts a basic BI environment as two
intersecting ovals. (See illustration 3) TDWI calls the left-hand oval the “data warehousing
environment.” This is where the technical team spends 60 to 80 percent of its time. Its job is
to extract, clean, model, transform, transfer, and load transaction data from one or more
operational systems into the data warehouse.
These data warehousing tasks are not easy because operational data is rarely clean, consistent,
or easy to integrate. Like archaeologists, the technical team needs to decipher the meaning and
validity of thousands of data elements and values in multiple operational systems. They then
need to glue everything back together again into a single coherent “model” of the business,
much like a paleontologist might reconstruct a life size model of a dinosaur from its bones.
Needless to say, these tasks take a tremendous amount of time and effort and require that tech-
nical teams have a deep understanding of business. In fact, no matter how much business savvy
the technical team possesses, it still can’t perform this work without step-by-step guidance from
key business experts who can interpret the data and define the rules for gluing it back together.
Once data archaeology and analysis is complete, the technical team loads the integrated data
into a data warehouse, which is typically a relational database optimized for query processing
and report generation. Often, the technical team creates a customized subset of the data ware-
house, called a data mart for users in a single department. A data mart can be implemented
using a relational database or a specialized multidimensional database that lets users “slice and
dice” data by common business dimensions such as customer, geography, time, and revenues.
BI Professionals AreData Archaeologists
Most Business UsersConsume InteractiveReports
Illustration 3. At its most basic, a BI environment consists of a data warehousing environment and an analytical environment.
Business Users
Data Warehousing Environment
Data
Warehouse
Technical TeamExtractCleanModel
TransformTransfer
Load
QueryReportAnalyzeMineVisualizeAct
Orders
Shipping
Inventory
Analytical Environment
BI Component Framework
THE DATA WAREHOUSING INSTITUTE www.dw-institute.com 7
Understanding Business Intelligence
Analytical Environment. The right-hand oval in the previous diagram refers to the analytical
environment, which is the domain of business users, who use analytical tools to query, report,
analyze, mine, visualize, and, most importantly, act on the data in the data warehouse. Since
the majority of business users simply want to interact with standard reports, the technical team
creates these in advance and puts them on the corporate intranet. Users can either view the
report as a static document, filter the report by relevant criteria (e.g. geography, products), or
navigate the report (i.e. search, drill down, drill across) to change the view or level of detail.
In addition, many organizations are delivering exception-driven reports, such as dashboards or
scorecards, which show how performance compares to plan.
For users who want to explore the data in the warehouse in a more ad hoc fashion, the techni-
cal team usually creates a catalog of data fields that users can select from to create a query or
custom report. This catalog—or meta data layer—shields users from the complexity of the
back-end systems and ensures that queries are formed correctly to avoid erroneous results.
BI versus OLTP Systems
One mistake made by business executives is failing to understand the difference between a BI
system and a transaction system, which runs the business on a daily basis (e.g. order entry,
inventory, shipping) Many companies have botched BI systems by designing them as if they
were transaction processing systems.
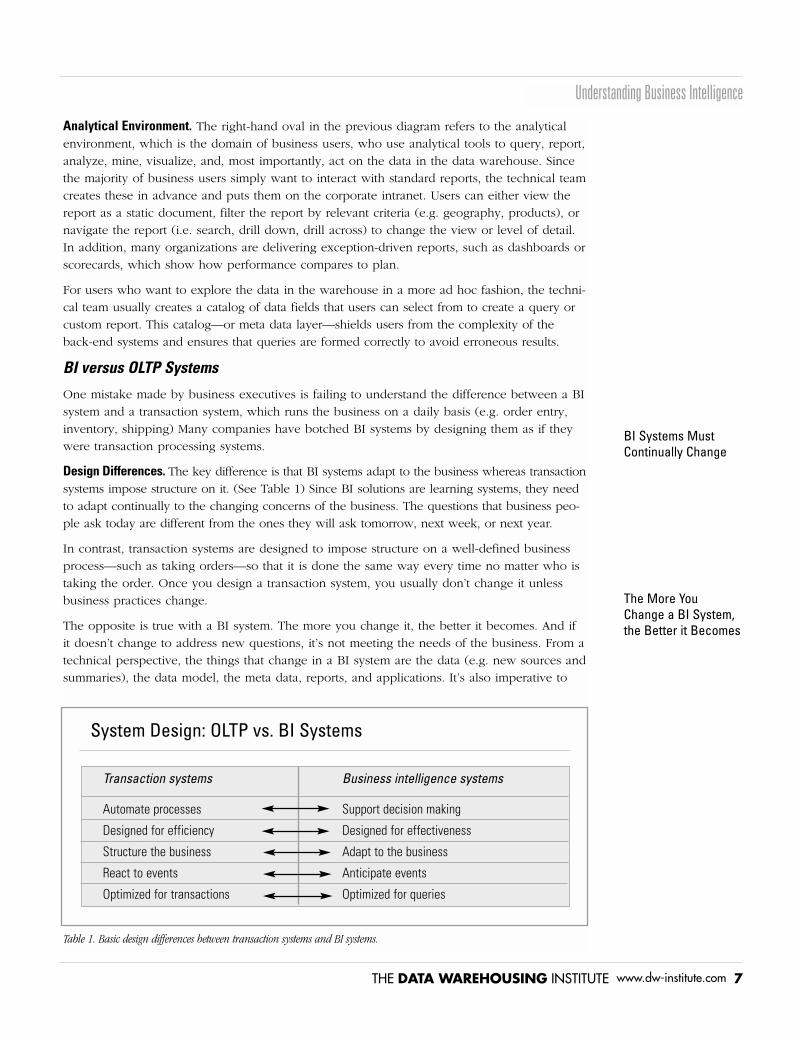
Design Differences. The key difference is that BI systems adapt to the business whereas transaction
systems impose structure on it. (See Table 1) Since BI solutions are learning systems, they need
to adapt continually to the changing concerns of the business. The questions that business peo-
ple ask today are different from the ones they will ask tomorrow, next week, or next year.
In contrast, transaction systems are designed to impose structure on a well-defined business
process—such as taking orders—so that it is done the same way every time no matter who is
taking the order. Once you design a transaction system, you usually don’t change it unless
business practices change.
The opposite is true with a BI system. The more you change it, the better it becomes. And if
it doesn’t change to address new questions, it’s not meeting the needs of the business. From a
technical perspective, the things that change in a BI system are the data (e.g. new sources and
summaries), the data model, the meta data, reports, and applications. It’s also imperative to
Table 1. Basic design differences between transaction systems and BI systems.
BI Systems MustContinually Change
System Design: OLTP vs. BI Systems
Transaction systems Business intelligence systems
Automate processes Support decision making
Designed for efficiency Designed for effectiveness
Structure the business Adapt to the business
React to events Anticipate events
Optimized for transactions Optimized for queries
The More YouChange a BI System,the Better it Becomes
8 THE DATA WAREHOUSING INSTITUTE www.dw-institute.com
Smart Companies in the 21st Century
implement enabling technologies that make it easy to implement changes.
So, the real challenge with a BI solution is how to design and manage a system that always
changes. In other words, how do you create an adaptive system? This is certainly not easy,
which is why many experts say building a BI system (or data warehouse) is a journey, not a
destination.
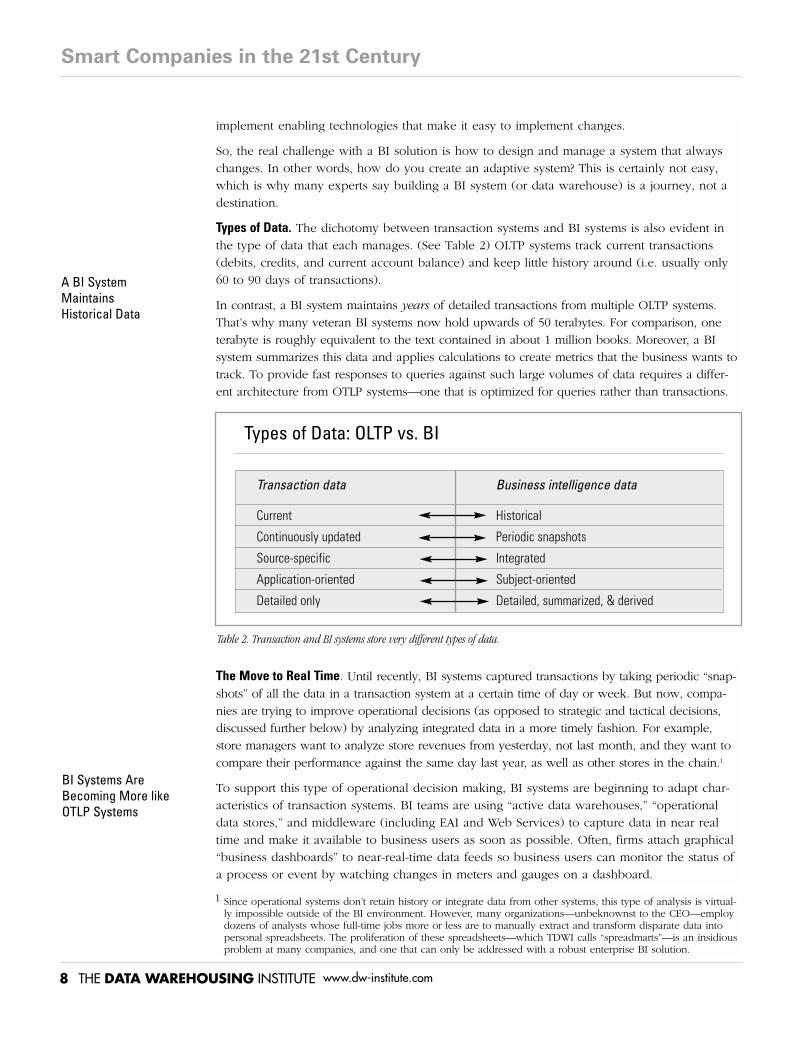
Types of Data. The dichotomy between transaction systems and BI systems is also evident in
the type of data that each manages. (See Table 2) OLTP systems track current transactions
(debits, credits, and current account balance) and keep little history around (i.e. usually only
60 to 90 days of transactions).
In contrast, a BI system maintains years of detailed transactions from multiple OLTP systems.
That’s why many veteran BI systems now hold upwards of 50 terabytes. For comparison, one
terabyte is roughly equivalent to the text contained in about 1 million books. Moreover, a BI
system summarizes this data and applies calculations to create metrics that the business wants to
track. To provide fast responses to queries against such large volumes of data requires a differ-
ent architecture from OTLP systems—one that is optimized for queries rather than transactions.
The Move to Real Time. Until recently, BI systems captured transactions by taking periodic “snap-
shots” of all the data in a transaction system at a certain time of day or week. But now, compa-
nies are trying to improve operational decisions (as opposed to strategic and tactical decisions,
discussed further below) by analyzing integrated data in a more timely fashion. For example,
store managers want to analyze store revenues from yesterday, not last month, and they want to
compare their performance against the same day last year, as well as other stores in the chain.1
To support this type of operational decision making, BI systems are beginning to adapt char-
acteristics of transaction systems. BI teams are using “active data warehouses,” “operational
data stores,” and middleware (including EAI and Web Services) to capture data in near real
time and make it available to business users as soon as possible. Often, firms attach graphical
“business dashboards” to near-real-time data feeds so business users can monitor the status of
a process or event by watching changes in meters and gauges on a dashboard.
A BI SystemMaintains Historical Data
BI Systems AreBecoming More likeOTLP Systems
Table 2. Transaction and BI systems store very different types of data.
Types of Data: OLTP vs. BI
1 Since operational systems don’t retain history or integrate data from other systems, this type of analysis is virtual-ly impossible outside of the BI environment. However, many organizations—unbeknownst to the CEO—employdozens of analysts whose full-time jobs more or less are to manually extract and transform disparate data intopersonal spreadsheets. The proliferation of these spreadsheets—which TDWI calls “spreadmarts”—is an insidiousproblem at many companies, and one that can only be addressed with a robust enterprise BI solution.
Transaction data Business intelligence data
Current Historical
Continuously updated Periodic snapshots
Source-specific Integrated
Application-oriented Subject-oriented
Detailed only Detailed, summarized, & derived

THE DATA WAREHOUSING INSTITUTE www.dw-institute.com 9
Understanding Business Intelligence
BI Is More Than aReporting Tool
The Analytical Landscape
Does BI Stand for Analytics? Many people believe BI refers to the analytical environment only.
Their perception is shaped by the fact that the only thing business users manipulate to access
data and obtain answers to their questions is the analytical tool installed on their desktop or
accessible from a Web browser. They don’t necessarily see the data warehousing environment
behind the analytical tool. However, as we have shown, BI is much bigger conceptually and
architecturally than query-and-reporting and other analytical tools. Business intelligence sys-
tems create a learning environment that enables smart organizations to run their businesses
more intelligently.
Evolution of Analytics. Nevertheless, there has been a sea change of activity in the analytical
environment that is worth noting. Analytical vendors, many of whom have sponsored this
report, have evolved considerably in the past decade. Many now offer suites of tools designed
to serve every type of analytical need within an organization. Many also have embedded these
tools within packaged analytic applications—prebuilt solutions geared to address the ana-
lytical requirements of a specific business area, such as procurement or supplier performance.
Others have focused on delivering vertically integrated suites that combine data integration
software with analytical tools and applications. Still others emphasize analytic developmentplatforms for rapidly building custom analytic applications.2
The illustration above shows the current analytical landscape, focusing primarily on tools, not
analytic applications. (See illustration 4) It depicts four major categories of analytical tools
represented by the intersecting circles. Most tools play in multiple categories, which is why
the circles overlap.
Types of Analysis. The first three domains—report, analyze, and predict—are used to make strate-
gic and tactical decisions. Strategic decisions involve analyzing data for long-term planning pur-
Illustration 4. The majority of users (75 percent) use largely predefined reports to determine what happened (reporting or moni-toring) in their domain of responsibility.
nd TacticStrategic an cal Analysis AO tional AnalysisOperat
75%REPORT
WHAT HAPPENED?WHOperational Reports
Web ReportsException Reports
Scorecards
20%ANALYZE
WHY DID IT HAPPEN?WHSpreadsheets
OLAPPlanningForecast
5%PREDICT
WHAT WILL HAPPEN?WHLinear RegressionAffinity Analysis
OptimizationSimulation
75%MONITOR
WHAT JUST HAPPENED?WHDashboards
AlertsDecision Engines
Agents
BUSINESS PERFORMANCEPEMMANAGEMENTANAGEMENTMAMA
DATADA MININGPPREDICTIVE REDICTIVEPRPR MMODELINGODELING
BUSINESS PROCESSPRMMONITORINGONITORING
Analytic Sophistication
Historical Data (Data Warehouses/Marts) Real-Time Data (OS/EAI)
The Landscape for Analytical Tools
2 For a complete overview of analytic applications, see the TDWI report titled Analytic Applications: Build orBuy? at www.dw-institute.com/aareport/.
BI Systems SupportStrategic, Tactical,and OperationalAnalysis

10 THE DATA WAREHOUSING INSTITUTE www.dw-institute.com
Smart Companies in the 21st Century
poses (i.e. next quarter or next year) or managing an organization’s progress toward strategic
goals and objectives. Balanced scorecards, planning, and budgeting all involve strategic analysis.
Tactical decisions, on the other hand, drive actions that need to take place in the near future
(i.e. next week or month). Tactical decisions are more process-driven than strategic. For exam-
ple, a retail buyer makes tactical decisions when he or she determines which merchandise to
buy in what quantities for different stores.
As mentioned earlier, operational decisions need to be made immediately (i.e. today).
Traditionally, users query a succession of OLTP systems and merge the results, if they bother
at all. But the advent of active data warehousing and real-time analytical devices (e.g. dash-
boards, alerts, agents, and decision engines) makes it possible for business users to analyze
near-real-time data within the context of historical, integrated data in the BI system. This gives
users a much broader, more accurate frame of reference (e.g. year-over-year or seasonal
comparisons) for making nitty-gritty operational decisions.
Reporting and Reacting. Not surprisingly, most users (75 percent) use tools in the reporting or
monitoring domains. Here, users simply view “reports.” These can be static (paper or online),
parameterized (showing only selected variable), or interactive (search, drill down, or drill
across within a predefined report view.) The reports can also be dynamic dashboards or
scorecards that reflect the status of key performance indicators.
Analysis and Prediction. The analysis domain is the province of business analysts who spend
a lot of time crunching data to create forecasts or explore the root cause of various problems
or trends in the industry. The prediction domain is the province of statisticians or analysts
trained in statistical methods. Companies use data mining tools to create predictive and other
types of models that drive mission critical applications, such as identifying fraudulent credit
card activity, forecasting when machine parts in an assembly line will fail, and anticipating
which customers will respond to a given product offer.
Analytical Depth. We know that organizations gain more value from their analytical environ-
ments as users move from reporting (“What happened?”) to analysis (“Why did it happen?”) to
predictive analysis (“What will happen tomorrow?”) to monitoring (“What just happened?”)
However, this doesn’t mean that all users within an organization will follow this evolutionary
path. It is important the organization as a whole evolve to greater levels of analytic sophistication
in order to deliver the most value possible from BI investments.
Analytical Breadth. To derive the full benefit of their analytical environment, companies must
also deploy analytical tools broadly, to all knowledge workers in the organization as well as
customers and suppliers. The benefits of BI accrue in proportion to the number of users using
the system. The more broadly the BI system is used, the more benefits it will deliver.
But it’s important to deploy the right tools to the right types of user. Casual users who only
want to view standard reports on a weekly basis will become befuddled if you give them a
complicated OLAP or data mining tool. Historically, most analytical tools have been geared to
power users, not casual users. This is why many organizations have experienced difficulty
getting users to use the BI solution.
Although many organizations would like to purchase a single analytical tool or suite, one size
does not fit all—at least yet. Vendors of analytical tools have made great strides in recent years
to broaden the audience for their products. In three years, it is likely that their analytical suites
will offer best-of-breed functionality for each category depicted in the diagram on page 9.
Analytical Tools MustProvide Depth andBreadth
Key: Fit the Tools tothe Users

THE DATA WAREHOUSING INSTITUTE www.dw-institute.com 11
The Value of Business Intelligence
The Value of Business Intelligence
At the beginning of this report, we cited six examples of organizations that are reaping signifi-
cant value from BI investments. Despite these examples, many executives wonder whether BI
is worth the money. Having been burned by sizable technology projects in the past, execu-
tives are understandably reluctant to sink hard-earned money into another IT venture.
Tale of Two Data Warehouses. Case in point: when two large telecommunication firms merged
several years ago, the new combined company found itself with two largely redundant BI envi-
ronments. But that’s where the similarity ended. One BI environment was designed like an OLTP
system, which made it difficult and expensive to implement changes. It cost $20 million a year to
maintain. The other environment had a much smaller BI budget, but a more flexible BI architec-
ture, which was updated continuously, covered more subjects, and required a much smaller staff.
Not surprisingly, the organization decided to go with the smaller, more nimble data warehous-
ing environment. But it also learned a stark lesson: large investments of money don’t guaran-
tee success with BI. “The [former] business got used to paying lots of money with few results,”
said a senior technology manager at the firm.
Justifying BI Solutions
Organizations that have deployed BI solutions cite many tangible and intangible benefits.
Our survey shows that a majority of the benefits from BI solutions are intangible in nature.
(See illustration 5)
Although it’s difficult to associate a concrete ROI or dollar figure resulting from these benefits,
most enlightened executives place huge value on having a “single version of the truth,” better
information for strategic and tactical decision making, and more efficient business processes.
These executives know it’s difficult to calculate—let alone foresee—all the benefits that accrue
to an organization that has better access to information than it had in the past.
This is why so many executives do not insist on a rigorous cost-justification for BI projects. A
2001 TDWI conference survey showed that only 13 percent of all respondents had calculated
the ROI of their BI projects, and only 37 percent were planning to do so.
Illustration 5. A BI solution typically delivers more intangible benefits than tangible ones. Based on 510 respondents who ratedthe value of the benefits as “very high” or “high.”
Tangible BenefitsIntangible Benefits
0 10 20 30 40 50 60
Time savings
Cost savings
ROINew revenues
Total cost of ownershipShareholder value
Single version of the "truth" Better strategies and plans
Better tactics and decisionsMore efficient processes
Greater customer/supplier satisfactionGreater employee satisfaction
60%
37%
33%23%
21%15%
59%57%
56%55%
36%35%
Value of Tangible and Intangible Benefits
Money Doesn’tGuarantee Success
BI Solutions ProvideIntangible Benefits
BI Solutions AreStrategic for ManyExecutives

12 THE DATA WAREHOUSING INSTITUTE www.dw-institute.com
Smart Companies in the 21st Century
“Our CEO is the champion of our BI project because he wants to understand what each customer
means to our firm in revenue and usage,” says Ted Carlson, an energy information consultant at
Wisconsin Public Service. “It was difficult to pinpoint the ROI for the project—we primarily justi-
fied it as a strategic asset. It has played a big role in attracting and retaining customers and keep-
ing our stock price and credit rating at high levels compared to the rest of the industry.”
However, most experts recommend that BI teams calculate the ROI for every BI project. “The
exercise of calculating ROI ensures that you are aligning the project with business goals and
gives you ammunition and documentation if your chief sponsor leaves and you have to justify
the project all over again,” says William McKnight, president of McKnight Associates, a BI con-
sultancy in Plano, Texas. “Also, if you can’t find enough tangible benefits to yield an accept-
able ROI, you probably shouldn’t undertake the project, even if it is strategic,” he adds.
Creating BI Application Portfolios. Although ROI is a useful measure of value, many experts
believe executives need to take a broader perspective of the value that BI can bring. Jill Dyché, a
partner in Baseline Consulting Group in Sherman Oaks, California, says smart companies don’t
justify BI projects by assessing the payback on technology. Rather, they evaluate the degree to
which applications in a BI portfolio further the company’s top strategic goals and objectives.
“Too many organizations let technology drive requirements rather than business objectives,” Dyché
says. “Creating a BI application portfolio prevents this and keeps the focus on the business.”
To create a BI portfolio, the BI team first defines a set of “applications” that have relevance to
the business, such as “faster monthly financial reporting,” or “improved supplier performance,”
says Dyché. The BI team then maps all these applications against the firm’s top business
objectives. This creates a grid depicting the value of each BI application to the business and
the likely order in which it should be deployed. (See table below.) The BI team then maps
the BI applications to technical requirements, which forms the roadmap for the technical
architecture and project plan.
Calculating ROI Is aGood Exercise
Business Needs toDrive BI
Table 3. To create a BI portfolio, map BI applications to strategic business objectives. This ensures that business objectives, nottechnology, drive the order of BI projects and the technical architecture and project plan. (Courtesy, Baseline Consulting Group,2003, www.baseline-consulting.com)
Defining the BI Application Portfolio
Decrease Increase Increase IncreaseCosts Customer Value Customer Revenues
Satisfaction per Transaction
Customer X Xprofitability modeling
Target marketing X X X X
Customer segmentation X X
Fraud detection X X
Business ObjectiveBI Application
THE DATA WAREHOUSING INSTITUTE www.dw-institute.com 13
The Value of Business Intelligence
Managing Expectations
The portfolio strategy also helps manage the expectations of business executives, giving them
a longer-term perspective of BI than many are inclined to adopt.
“Many executives don’t see the value of a BI solution unless it fulfills their entire vision,” says
an executive director of BI at a major insurance company who wished to remain anonymous.
“The key is to take their vision and break it into bite-sized chunks so they can see steady
progress towards achieving their final vision. A portfolio strategy prevents executives from
looking for that ‘quick fix’ to BI issues. Rather, it provides them with a series of incremental
fixes to provide some relief along the way.”
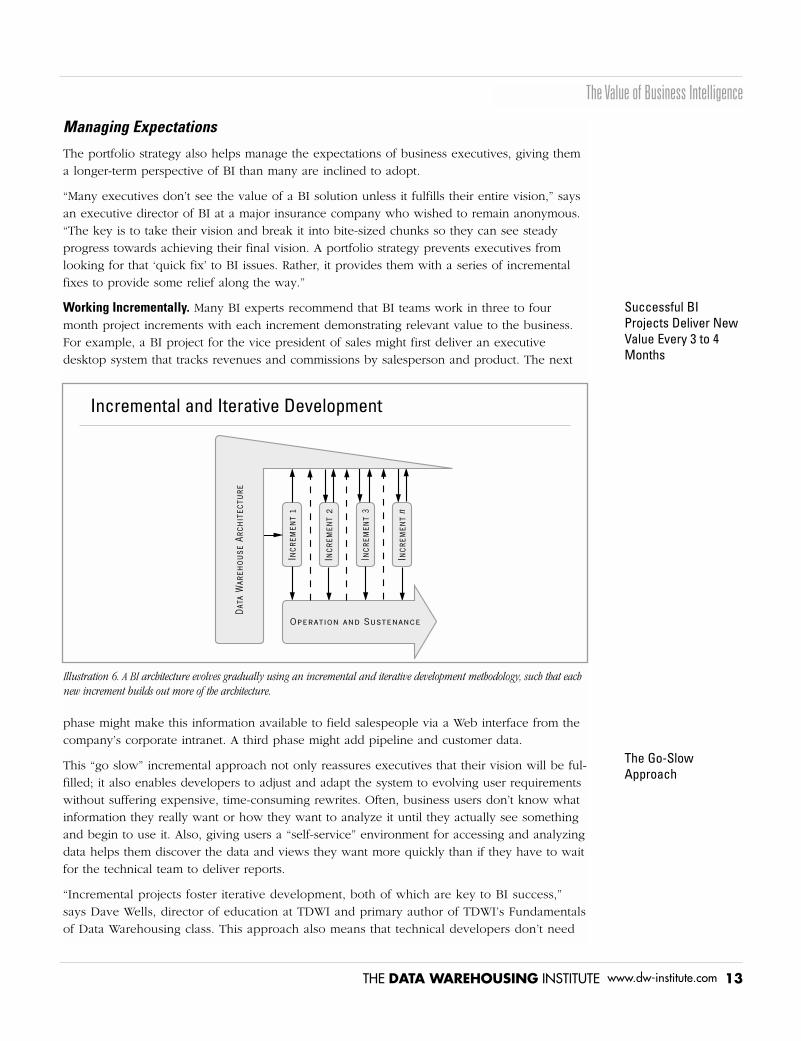
Working Incrementally. Many BI experts recommend that BI teams work in three to four
month project increments with each increment demonstrating relevant value to the business.
For example, a BI project for the vice president of sales might first deliver an executive
desktop system that tracks revenues and commissions by salesperson and product. The next
phase might make this information available to field salespeople via a Web interface from the
company’s corporate intranet. A third phase might add pipeline and customer data.
This “go slow” incremental approach not only reassures executives that their vision will be ful-
filled; it also enables developers to adjust and adapt the system to evolving user requirements
without suffering expensive, time-consuming rewrites. Often, business users don’t know what
information they really want or how they want to analyze it until they actually see something
and begin to use it. Also, giving users a “self-service” environment for accessing and analyzing
data helps them discover the data and views they want more quickly than if they have to wait
for the technical team to deliver reports.
“Incremental projects foster iterative development, both of which are key to BI success,”
says Dave Wells, director of education at TDWI and primary author of TDWI’s Fundamentals
of Data Warehousing class. This approach also means that technical developers don’t need
Illustration 6. A BI architecture evolves gradually using an incremental and iterative development methodology, such that eachnew increment builds out more of the architecture.
Incr
emen
t 1
Incr
emen
t 2
Incr
emen
t 3
Incr
emen
t
Dat
a W
areh
ouse
Arc
hite
ctur
e
Operation and Sustenance
Incremental and Iterative Development
Successful BIProjects Deliver NewValue Every 3 to 4Months
The Go-SlowApproach
14 THE DATA WAREHOUSING INSTITUTE www.dw-institute.com
Smart Companies in the 21st Century
to specify the entire BI architecture up front. Rather, the architecture evolves with each
iteration and increment. (See illustration 6 above.)
The Profile of Success
Creating the Profile
Let’s assume you’ve established the value of a BI solution and you’ve made a commitment to
fund it. Does your involvement stop there? Are you guaranteed success? What does a success-
ful solution look like?
TDWI Success Metrics. To answer these questions, TDWI defines success using three
attributes based on questions in our BI survey3. We believe these attributes reflect BI
solutions that deliver strong business value and measurable ROI:
1.Does the BI solution support a critical process that runs the business on a daily basis?
2.Do users consider the BI solution mission critical? (For example, do they “scream”
immediately if the system goes down?)
3.To what degree has your BI solution succeeded in meeting users’ needs?
Profile of Success. Using these metrics, we created two profile groups from our survey
respondents—those who responded positively to these questions and those who didn’t.
Respondents who replied positively comprise our “successful solution” profile group; those
who responded lukewarm or negatively constitute the “struggling solution” profile group.4
We then examined how respondents in these two groups—”successful” and “struggling”—
answered the remaining survey questions about their organizations, BI environments, and use
of technology. This method enables us to correlate success with numerous project attributes.
The rest of this section describes these profiles so that you can benchmark your team’s efforts
(or potential efforts) against them.
Business Leadership
Business Sponsor. The importance of strong business leadership to the success of a BI project
is almost an industry cliché. Every BI project needs a committed and involved business
sponsor who can evangelize the solution, secure and sustain funding, navigate political issues,
effect cultural change, and help prioritize projects. Our data verifies these claims, showing a
strong correlation between the commitment of a business sponsor and the success rate of a
BI solution. (See illustration 7)
Level of Commitment. In fact, what’s most interesting is that successful projects are twice as
likely to have “very committed” sponsors as “fairly committed” sponsors (67 percent versus 30
percent.) So, BI sponsors can’t be half-hearted—or even three-quarters “hearted” about a BI
solution—they must give it 100 percent if they want their projects to succeed. The more
committed they are, the more successful their projects will be.
Successful BIProjects Have “VeryCommitted” Sponsors
3 To learn about the survey, turn to the “Research Methodology” section on page 2.
4 The “successful solution” group answered either “Definitely” or “Mostly” in response to the first two attributequestions and either “Very High” or “High” to the third question. The “struggling solution” group answeredeither “Somewhat” or “Not Really” in response to the first two questions and either “Average” or “Low” or“Very Low” to the third question. The two groups represent a subset of all qualified respondents, since somerespondents may have selected a mix of positive and negative responses to these questions.

THE DATA WAREHOUSING INSTITUTE www.dw-institute.com 15
The Profile of Success
Type of Sponsor. The most effective sponsors are top business executives who are highly respect-
ed in their organizations and have a vision for how BI technology can drive corporate strategy
or address a critical business problem or opportunity. These executives are either CXOs (CEO,
CFO, COO) or business unit or functional leaders, according to our data (see illustration 8)
IT Sponsors? Many BI experts and many of our survey respondents warn against letting the IT
department sponsor and drive a BI project. We were therefore surprised to see that 21 percent
of the sponsors in our “success” group are either IT executives, program managers, or project
managers. This is due in part to semantics, not substance. We interviewed many “sponsors”
for this report who came from the business side but were assigned to IT (or the BI team if
outside of IT) to drive the BI project.
In addition, once a project becomes enterprise in scope, it is logical to hand corporate IT
responsibility for managing (but not sponsoring) the project. “It’s hard for a single business
unit to deliver an enterprise data warehouse so the IT department is often the best group
to handle this,” says William McKnight. The IT group ensures compliance with enterprise
infrastructure standards, but the business still needs to drive the final solution.
Illustration 7. Successful BI projects have a high proportion of “very committed” sponsors.
0 10 20 30 40 50 60 70 80
67%32%
Very committed
Succeeding
Struggling
Fairly committed
Somewhat committed
Not very committed 2%
7%
30%46%
1%15%
Level of Sponsor’s Commitment
Illustration 8. CXOs and unit leaders most often sponsor BI projects. Percentages reflect “successful” projects.
CXO
Business unit leader
Functional unit leader
Top IT executive
0 5 10 15 20 25 30 35 40
37%
5%
33%
6%
16%
Program or project manager
Successful Sponsors
Business DriversSpearhead theProject on Behalf ofthe Sponsor
16 THE DATA WAREHOUSING INSTITUTE www.dw-institute.com
Smart Companies in the 21st Century
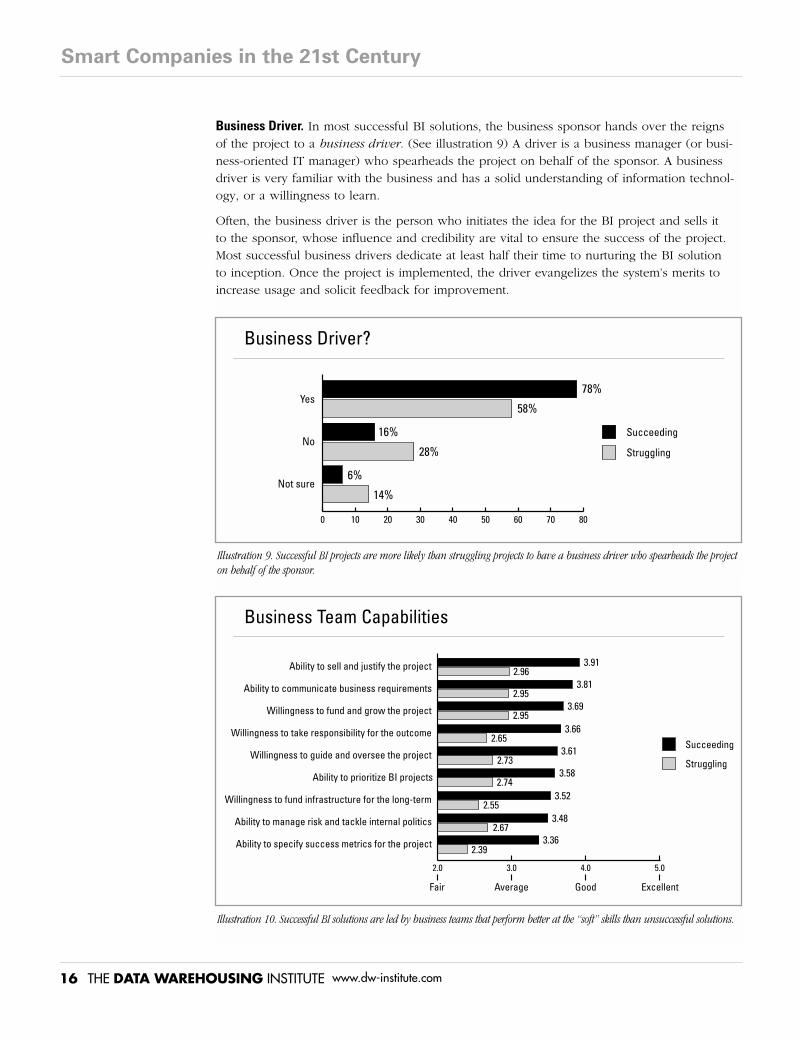
Business Driver. In most successful BI solutions, the business sponsor hands over the reigns
of the project to a business driver. (See illustration 9) A driver is a business manager (or busi-
ness-oriented IT manager) who spearheads the project on behalf of the sponsor. A business
driver is very familiar with the business and has a solid understanding of information technol-
ogy, or a willingness to learn.
Often, the business driver is the person who initiates the idea for the BI project and sells it
to the sponsor, whose influence and credibility are vital to ensure the success of the project.
Most successful business drivers dedicate at least half their time to nurturing the BI solution
to inception. Once the project is implemented, the driver evangelizes the system’s merits to
increase usage and solicit feedback for improvement.
Illustration 9. Successful BI projects are more likely than struggling projects to have a business driver who spearheads the projecton behalf of the sponsor.
0 10 20 30 40 50 60 70 80
Yes
No
78%
6%
58%
16%
28%
14%
Succeeding
Struggling
Not sure
Business Driver?
Illustration 10. Successful BI solutions are led by business teams that perform better at the “soft” skills than unsuccessful solutions.
Succeeding
Struggling
Ability to sell and justify the project
Willingness to guide and oversee the project
Willingness to fund infrastructure for the long-term
Willingness to take responsibility for the outcome
Willingness to fund and grow the project
3.912.96
3.692.95
3.612.73
3.522.55
3.662.65
Fair Average Good Excellent
Ability to communicate business requirements
Ability to specify success metrics for the project
Ability to prioritize BI projects
Ability to manage risk and tackle internal politics
3.812.95
3.362.39
3.582.74
3.482.67
2.0 3.0 4.0 5.0
Business Team Capabilities

THE DATA WAREHOUSING INSTITUTE www.dw-institute.com 17
The Profile of Success
Business Capabilities. It goes without saying that the business side of the BI team needs to
be good at what it does. For the most part, this means the business sponsor and driver must
allocate enough time and attention to nurture the project through its entire lifecycle. They
also must stick around for the duration of the project or garner sufficient consensus and
momentum for the project to continue without them.
Not surprisingly, survey respondents rated business teams running successful BI solutions
better at the “soft” issues involved in managing a BI project than teams that are struggling.
These soft issues include communicating business requirements; selling, justifying, funding,
growing, and prioritizing projects; specifying success metrics; managing risk; and assuming
responsibility for the project’s outcome. (See illustration 9)
Selling Projects and Securing Money. Interestingly, successful business teams score highest
on “selling and justifying” the project but least well on specifying metrics for success. This
reinforces the notion that many sponsors justify projects based on their strategic value, not
measurable outcomes.
On average, it takes sponsors of successful projects 7.28 months to obtain approval and
funding for a project. This seems like a long time, but it is significantly shorter than the 10.5
months it takes struggling projects to obtain approval and funding. (See illustration 11)
LESSONS LEARNED ABOUT SPONSORSHIP:
• Business sponsors should be top business executives who have considerable influence in
the organization and possess a vision for how BI technology can be used to achieve key
business strategies.
• Business sponsors must be very committed to the BI project, or the project’s chances of
success drop precipitously.
• Business sponsors should appoint business drivers to spearhead the project on their behalf.
• Business drivers should dedicate at least half their time to the BI project.
• The IT department should never sponsor a BI project unless its leader was appointed
from the business side to drive the project.
Alignment
Degree of Alignment. Another key factor in successful BI solutions is alignment between the
business sponsors and developers of the BI solution. As in business sponsorship, the degree
of alignment makes a huge difference! Successful teams are almost five times as likely to be
Illustration 11. Successful BI projects obtain funding in just over seven months, more than three months faster than struggling projects.
7.28 months
10.5 months
Succeeding
Struggling
Time to Obtain Approval and Funding
“Highly Aligned”Teams Are 5 TimesAs Likely to Succeed

“very aligned” as teams that struggle with BI. (See illustration 12) The key to ensuring success
in BI is to achieve total alignment between the business and technical sides of your team.
Team Approach. So what does a “very aligned” team look like? First of all, it has an actively
involved business sponsor or driver. Second, it’s a team—not two or more disparate groups
with different leaders, objectives, and cultures. “We sit side by side with business people and
report into the same leadership,” says Wes Flores, senior technology manger who helps run
the BI team at the telecommunications firm Verizon. “The only difference is that we specialize
in the data and they specialize in the business processes.”
For this reason, experts caution against outsourcing BI development to a distant IT department
or a third party with little knowledge or experience with the business. “The best companies
integrate technology experts within the business at all levels,” says Dr. Barbara Wixom, assistant
professor at the University of Virginia’s McIntire School of Commerce in Charlottesville. “It’s
not that you don’t have an IT group, it’s just that you don’t have IT projects.”
Ongoing Project Governance. Once a BI solution is deployed, alignment becomes even more
critical. Smart organizations establish permanent governance structures to ensure that BI
solutions adapt and respond quickly and flexibly to changing business requirements.
Our data shows that both successful and struggling BI solutions employ a wide variety of gov-
ernance strategies, but successful solutions are more likely to employ BI steering committees.
(See illustration 13) These committees are comprised of representatives from business units
and functional areas who meet monthly or quarterly to guide the direction of the BI solution,
set goals, establish priorities, and allocate funds.
Successful projects also employ BI working committees to guide the project on an operational
level. These committees are comprised of BI developers and power users who meet weekly
or monthly to address technical problems, discuss enhancements, and recommend action to
the executive steering committee.
For example, Burlington Northern Santa Fe Railway (BNSF), a TDWI Best Practices winner,
has a BI advisory board that meets quarterly to prioritize new projects, make adjustments to
existing ones, and allocate funding. The board, which consists of directors and assistant vice
presidents in various business units, uses ROI and other metrics to determine which projects
Illustration 12. Teams in which business and the BI project team are “very aligned” are likely to be successful.
Succeeding
Struggling
Very aligned
Fairly aligned
Somewhat aligned
Not very aligned
0 10 20 30 40 50
43%9%
47%46%
9%33%
1%12%
How Aligned Is BI Project Team with Business?
18 THE DATA WAREHOUSING INSTITUTE www.dw-institute.com
Smart Companies in the 21st Century
BI SteeringCommittees AreCritical
Business andTechnical PersonnelWork CloselyTogether

THE DATA WAREHOUSING INSTITUTE www.dw-institute.com 19
The Profile of Success
or enhancements to move ahead with. “Board members work together to determine which
proposals are best for BNSF as a whole,” says Phil Gollhoffer, director of data warehousing
at BNSF.
Bill Schmarzo, a vice president at DecisionWorks Consulting in Portland, Oregon, adds that BI
steering committees should reevaluate and reprioritize BI projects every six months. This keeps
the BI solution focused sharply on addressing the most critical business problems, he says.
Alignment Strategies. Not all alignment strategies work. A business sponsor at a large insur-
ance company said his firm hired specialists to “bridge the chasm” between the worlds of
business and IT. These specialists gathered and translated business requirements into technical
specifications. “The results have been poor,” he said. The company also tried to embed IT
within business units and departments. “That method worked OK when we were constructing
technology ‘silos’ that weren’t integrated, but now integration is our chairman’s top priority.”
Ultimately, there is no right or wrong way for organizations to align business and BI teams.
Each organization needs to devise methods that match both its organizational and cultural
environment and strategic objectives.
LESSONS LEARNED ABOUT ALIGNMENT:
• Organizations need to ensure that the BI project team and business representatives are
working as a single team.
• BI teams should form an executive-level steering committee to guide, fund, and prioritize
BI projects.
• Steering committees should reprioritize BI projects every six months.
• BI teams should form a working committee to guide the BI project from an operational level.
• Organizations need to devise alignment strategies that best fit their organizational
culture and strategic objectives.
Illustration 13. Executive-level BI steering committees are key indicators of successful BI projects.
Succeeding
Struggling
0 10 20 30 40 50 60
56%36%BI steering committee
57%55%BI working committee
12%9%BI center of excellence
38%37%BI program manager
39%43%Business requirements analyst
20%20%Data stewardship program
20%13%
Surveys to gauge satisfaction
21%18%BI help desk
37%24%BI training
11%12%
BI newsletters or Web site
How Do You Ensure Alignment?
The Value of a BISolution Increaseswith Scope

20 THE DATA WAREHOUSING INSTITUTE www.dw-institute.com
Smart Companies in the 21st Century
Enterprise View
The Value of an Enterprise View. Ultimately, most successful BI projects grow into enterprise
resources. That’s because the value of the BI resource grows exponentially with the number
of subject areas it addresses and departments it serves. (See illustration 14) Each new subject
area (e.g. finance or human resources) adds a new set of users who can benefit from the
system, but more importantly, it lets existing users ask questions and integrate data across
subject areas, which often yields extraordinary insight.
For example, a manufacturing firm that integrates data from the marketing, service, engineer-
ing, logistics, and sales departments can give users a more complete and accurate picture of a
product’s lifecycle than when analyzed from a single perspective.
Older, Wiser, and Richer. It’s not surprising that successful BI solutions support more distinct
groups of users and have been around longer than ones that are struggling. (See illustration
15) Healthy BI projects add two or three new subject areas each year. The older a successful
BI project gets, the more value it provides.
This is not to say that given time all BI solutions will eventually succeed. Often, struggling
solutions never generate enough initial value to gain traction or funding to continue growing.
The old adage, “the rich get richer, and the poor get poorer” applies to business intelligence.
“You need to give sponsors and end users some quick wins so they can see that you are
spending their dollars wisely,” says Rick Stotler, a senior manager at Vanderbilt University
Medical Center in Nashville, Tennessee. Once you prove initial value, funding and support
become easier to obtain.
Success Breeds Sponsors. Interestingly, the turnover rate among sponsors for successful BI
solutions is higher than for struggling ones. This is partly because successful BI solutions are
older and outlive the tenure of their initial sponsors. But it’s mostly because sponsorship
evolves as a project expands. “It’s quite natural for sponsors to change over time as the BI
solution tackles new subject areas,” says William McKnight.
Drivers Rotate inLarger Projects
Illustration 14. The value of a BI solution grows exponentially with the number of subject areas it supports.
Number of Subject Areas Covered
BusinessValue
0 252015105 ...
High
Low
Scope and Value

THE DATA WAREHOUSING INSTITUTE www.dw-institute.com 21
The Profile of Success
In the best cases, sponsors and drivers don’t leave the project; they simply fade into the back-
ground as new sponsors and drivers are added to the executive steering committee. (The best
steering committees are established at the outset of the initial project, not later.) The new
sponsors play a vigorous role, adding their subject areas to the BI solution while the “old”
sponsors serve more in an advisory capacity.
Funding Infrastructure. Another sign of successful projects is the willingness of sponsors to fund
the BI infrastructure on an ongoing basis, even in uncertain or difficult economic times. (See
illustration 16) Infrastructure consists of the data warehousing environment (data warehouses,
data marts, analytical tools and applications), the technical platform on which it runs (servers,
storage, networks), and the people to feed and maintain the environment. A robust infrastruc-
ture is needed to support an enterprise BI solution that supports a multiplicity of applications.
A common problem in some projects is that sponsors are only interested in funding subject
areas that interest them. Once they get the information they desire, they turn off the funding
spigot. A cross-departmental BI advisory board can counteract this tendency.
Illustration 16. Successful BI projects have leaders who are willing to fund the BI infrastructure.
Succeeding
Struggling
Very willing
Fairly willing
Somewhat willing
26%
0 10 20 30 40 50 60
10%
51%32%
16%41%
6%18%
Not very willing
Willingness to Fund Infrastructure
Illustration 15. Successful BI solutions are older, support more groups (and subject areas), and have had more sponsors.
Succeeding
Struggling
Years in operation
Distinct groups using the solution
Number of sponsors in last 3 years
0 1 2 3 4 5 6
4.64 years
3.4 years
5.75 groups
3.95 groups
2.17 sponsors
1.89 sponsors
Enterprise Scope
22 THE DATA WAREHOUSING INSTITUTE www.dw-institute.com
Smart Companies in the 21st Century
LESSONS LEARNED ABOUT ENTERPRISE PROJECTS:
• The value of a BI solution grows exponentially with the number of subject areas it
supports.
• Successful BI solutions have a succession of business sponsors as new subject areas are
added to the solution.
• The business must be willing to fund BI infrastructure to ensure that the BI solution can
grow into a valuable enterprise resource.
Budgets
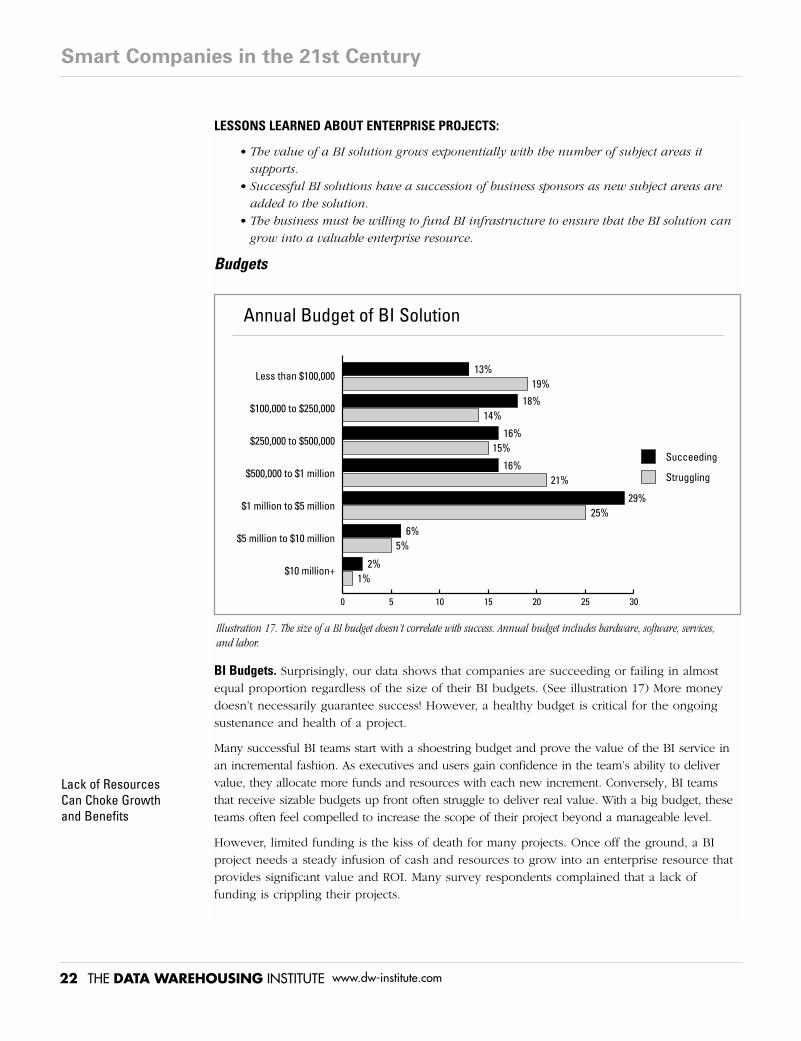
BI Budgets. Surprisingly, our data shows that companies are succeeding or failing in almost
equal proportion regardless of the size of their BI budgets. (See illustration 17) More money
doesn’t necessarily guarantee success! However, a healthy budget is critical for the ongoing
sustenance and health of a project.
Many successful BI teams start with a shoestring budget and prove the value of the BI service in
an incremental fashion. As executives and users gain confidence in the team’s ability to deliver
value, they allocate more funds and resources with each new increment. Conversely, BI teams
that receive sizable budgets up front often struggle to deliver real value. With a big budget, these
teams often feel compelled to increase the scope of their project beyond a manageable level.
However, limited funding is the kiss of death for many projects. Once off the ground, a BI
project needs a steady infusion of cash and resources to grow into an enterprise resource that
provides significant value and ROI. Many survey respondents complained that a lack of
funding is crippling their projects.
Illustration 17. The size of a BI budget doesn’t correlate with success. Annual budget includes hardware, software, services, and labor.
Succeeding
Struggling
Less than $100,000
$250,000 to $500,000
$500,000 to $1 million
$1 million to $5 million
$5 million to $10 million
$10 million+
0 5 10 15 20 25 30
18%
13%19%
14%
16%15%
16%21%
25%29%
6%5%
2%1%
$100,000 to $250,000
Annual Budget of BI Solution
Lack of ResourcesCan Choke Growthand Benefits

THE DATA WAREHOUSING INSTITUTE www.dw-institute.com 23
The Profile of Success
One survey respondent sums it up well: “We have a very small BI team, in an organization
that is just starting to realize the benefits. Our ability to adapt and respond to changing busi-
ness priorities is often limited by the small bandwidth of the team.” Without more resources,
this type of team won’t be able to respond to business needs in a timely manner. Executives
will begin questioning their value and worthiness to receive additional funds.
LESSONS LEARNED ABOUT BI BUDGETS:
• New BI projects that prove their value incrementally are more likely to succeed than
those given a big budget to start.
• BI projects need a steady infusion of cash and resources to grow and adapt to the business.
Culture
An organization’s culture, especially as it pertains to the use of information and technology, is
another leading indicator of whether a BI project will succeed or stagnate.
Technology Adoption. Organizations that characterize themselves as “early adopters” of
information technology are three times as likely to deploy a successful BI solution (32 versus
10 percent), while “late adopters” are almost twice as likely to struggle (32 versus 17 percent.)
(See illustration 18)
Intuition versus Data Analysis. In addition, organizations whose users are accustomed to mak-
ing decisions by analyzing data, rather than consulting their intuition, are more like to succeed
with a BI initiative. (See illustration 19)
“Our company was used to making decisions on gut feel,” says Deb Masdea, director of busi-
ness information and analysis at the Scotts Company, a maker of lawn care products. “But
now our executives believe strongly that fact-based decision making gives us a competitive
advantage. Executives now ask, ‘Where’s the data to back up this decision?’ and they expect
sales people to use information to close deals, not just rely on the strength of their client rela-
tionships. And it’s working!”
Sharing Information. Another indicator of success is how freely employees share information
with each other. Organizations whose employees share information “very openly” are five
times more likely to succeed with BI than those whose employees do not (17 percent to 3
percent), while those whose employees don’t share information very openly are five times
more likely to struggle with BI (23 percent to 4 percent.) (See illustration 20)
Illustration 18. Early adopters of information technology tend to deliver successful BI solutions while late adopters tend to struggle.
Succeeding
Struggling
Early adopter
Mainstream adopter
Late adopter
0 10 20 30 40 50 60
32%10%
51%48%
17%32%
Type of Technology Adopter

24 THE DATA WAREHOUSING INSTITUTE www.dw-institute.com
Evaluating ETL and Data Integration Platforms
Middle managers often feel threatened by BI solutions because they are accustomed to
preparing their own numbers to present to upper management. A BI solution gives upper
management vital performance data before mid- and low-level managers get a chance to
“spin” the numbers. “We had a lot of resistance from middle management when we first
deployed the BI solution,” says Scotts’ Masdea.
Data as a Corporate Asset. Finally, organizations whose executives “definitely” view data as a
corporate asset are six times as likely to be successful than those whose executives do not
(31 percent versus 5 percent.) In contrast, firms where data is not really viewed as an asset
are between two and three times as likely to struggle with BI projects. (See illustration 21)
Not surprisingly, the implementation of a BI system can often effect cultural and organizational
change in the organization. Since organizational culture is notoriously difficult to change, this
only happens when the change is instigated at the top. For example, a CEO who is using the
BI system and expecting his or her subordinates to do likewise can start a chain reaction
where individuals up and down the organization begin to make fact-based decisions and
share information more openly and proactively.
24 THE DATA WAREHOUSING INSTITUTE www.dw-institute.com
Illustration 20. The way organizations share information internally is an indicator of success with BI.
Succeeding
Struggling
Very openly
Fairly openly
Somewhat openly
Not very openly
17%
3%
54%
38%
25%
35%
4%
23%
0 10 20 30 40 50 60
How Openly Do Users Share Information?
Illustration 19. Organizations that make decisions using data rather than intuition have higher success rates.
Succeeding
Struggling
Intuition only
Data, supported by intuition
Intuition, supported by data
Data only
0 10 20 30 40 50 60
5%
11%
51%
38%
41%
49%
4%
1%
How Are Decisions Made?

THE DATA WAREHOUSING INSTITUTE www.dw-institute.com 25
The Profile of Success
LESSONS LEARNED ABOUT THE IMPACT OF CULTURE:
• Organizations that aggressively apply information technology and believe that informa-
tion can provide a competitive advantage have a better chance of succeeding with BI.
• Organizations whose employees use data to make decisions (as opposed to intuition)
and freely share information are more likely to succeed with BI.
Analytics
Analytical tools are the window to the BI solution for business users. How users react to these
tools and the data they deliver often determines whether the overall BI solution is a success.
Driving Usage. Thus, it should be no surprise that 63 percent of the potential users of success-
ful BI solutions use the system at least once a week. This is more than twice the percentage
of potential users who use a struggling BI solution.
Successful BI teams develop strategies to encourage business users to use new analytical tools
to assist in making informed decisions. David Norton, senior vice president of marketing at
Harrah’s Entertainment, Inc., which operates 26 casinos in 13 states, says his firm uses both a
top-down and bottom-up strategy to encourage users to use the firm’s BI solution.
“We develop our reports centrally and educate our casino property managers and teams how to use
them. But we don’t stop there,” Norton says. “Our COO and I use the reports when we visit each
property to review their performance and help them devise new marketing tactics against under-
performing segments. The properties are now eager to obtain as much information as possible.”
Interacting with Data. Another key factor in successful BI solutions is the degree to which the
solution lets users interact with the data. Business users in successful BI projects are less likely
to be viewing paper reports, and more likely to be viewing static online reports or navigating
interactive online reports than business users in stagnating solutions. (See illustration 22)
Types of Analysis. Interestingly, successful solutions also have a higher percentage of users
who view static online reports than struggling solutions do. This is no surprise to David
Norton at Harrah’s. The corporate team has developed roughly 100 static online marketing
reports that are generated and viewed—and often printed—by corporate and field marketing
managers and analysts at the casino.
A Strategy toEncourage Usage Is Critical
Illustration 21. Successful companies are more likely to perceive data as a corporate asset.
Succeeding
Struggling
Definitely
Mostly
Somewhat
31%
5%
39%
27%
24%
46%
6%
21%Not really
0 10 20 30 40 50
Data Viewed as Corporate Asset

26 THE DATA WAREHOUSING INSTITUTE www.dw-institute.com
Smart Companies in the 21st Century
“Our reports present a lot of information in a user-friendly way so marketers don’t have to
spend time running queries—it’s all right there.” However, Norton adds that Harrah’s also
offers OLAP-based reports for users who want or need to explore or “slice and dice” the data
in an interactive fashion.
Build versus Buy. Finally, successful teams build and buy their BI solutions in equal percentages
to struggling teams. However, the majority of both groups are still primarily building custom
solutions. In many cases, they purchase a tool and customize it before delivering it to users.
Illustration 22. Successful BI implementations tend to offer users more interaction with data.
0 10 20 30 40 50
Succeeding
Struggling
View paper reports
Navigate interactive online reports
Create reports from predefined selection criteria
Build "what if" analyses or forecasts
Create reports from scratch
Create statistical models
47%
37%47%
37%
39%24%
34%27%
12%18%
17%14%
9%8%
View static online reports
User Interaction with Data
Illustration 23. Building or buying a BI solution doesn’t correlate with success.
Succeeding
Struggling
Primarily Build
Primarily Buy
Even split
Not sure
54%
53%
23%
19%
26%
21%
1%
3%
0 10 20 30 40 50 60
Primarily Build or Buy?

THE DATA WAREHOUSING INSTITUTE www.dw-institute.com 27
The Profile of Success
LESSONS LEARNED ABOUT ANALYTICS:
• Successful organizations analyze the types of users they have and provide tools or appli-
cations that best fit their analytical needs.
• Successful BI teams develop strategies to encourage the use of a BI solution once deployed.
• Successful BI solutions offer users more interaction with the data and more types of
analysis that can be performed.
• There is no correlation between building or buying a BI solution and a successful outcome.
Project Team Competencies
Many experts claim that assembling the technology is the easiest part of delivering a BI
solution. The BI team must exhibit strong technical and project management skills to succeed.
Illustration 24. Successful BI solutions are deployed and upgraded more quickly than struggling BI solutions.
Succeeding
Struggling
Months to deploy
How often is the solution upgraded?
8.6 months
9.6 months
4 months
3.3 months
0 2 4 6 8 10
Technical Competencies: Months to Deploy the Solution
Illustration 25a. Successful BI teams score above average on many technical and project management criteria.
Succeeding
Struggling
Ability to communicate technical issues clearly
Responsiveness to business requirements
Ability to sell and justify the project
Ability to coordinate the project with all constituencies
Ability to deliver on time and in budget
Willingness to adapt the project as conditions change
Ability to manage project risk and quality
Ability to train and support end users
Ability to develop the desired functionality
4.163.29
4.113.31
3.822.95
2 3 4 5
2.94
3.92
4.123.26
3.822.74
3.953.02
3.762.80
3.812.97
Fair Average Good Excellent
BI Project Team Capabilities

28 THE DATA WAREHOUSING INSTITUTE www.dw-institute.com
Smart Companies in the 21st Century
Our data shows that successful BI teams work faster and deliver results sooner than their
struggling counterparts. On average, successful BI teams deliver BI solutions one month faster
than struggling teams (8.6 months versus 9.6 months). Also, successful BI teams upgrade the
solution approximately one month sooner than their struggling counterparts (3 months versus
4 months), according to our data. (See illustration 24)
Successful BI teams also scored higher on a range of technical and project management capa-
bilities compared to struggling teams. Successful teams scored especially well on their ability
to communicate technical issues clearly, respond to business requirements, and develop
desired functionality. (See illustration 25a).
Successful teams also deliver BI solutions with better overall effectiveness and better scalability,
reliability, usability, response time, and data quality, according to our data. (See illustration 25b)
As we’ll see below, the key to delivering a robust technical solution and successfully managing BI
projects is to create a team of experienced, talented individuals who work closely with the business.
LESSONS LEARNED ABOUT PROJECT TEAMS:
• Successful BI teams hire top-notch technical developers and project managers.
Partnerships
A majority of both successful and struggling BI project teams use the services of both consult-
ants and vendors to assist with the project. (Roughly one-quarter of both groups don’t use
consultants at all, according to the survey.)
The majority of both types of firms are “very reliant” or “fairly reliant” on consultants. (See
illustration 26a) The use of consultants doesn’t seem to make a difference in whether a com-
Illustration 25b. Successful BI teams deliver robust technical solutions.
Succeeding
Struggling
Fair Average Good Excellent
2 3 4 5
Response time4.05
3.12
Data quality 3.983.08
Scalability3.05
4.11
Reliability3.40
4.11
Usability 4.092.93
Effectiveness4.11
2.93
BI Solution Performance
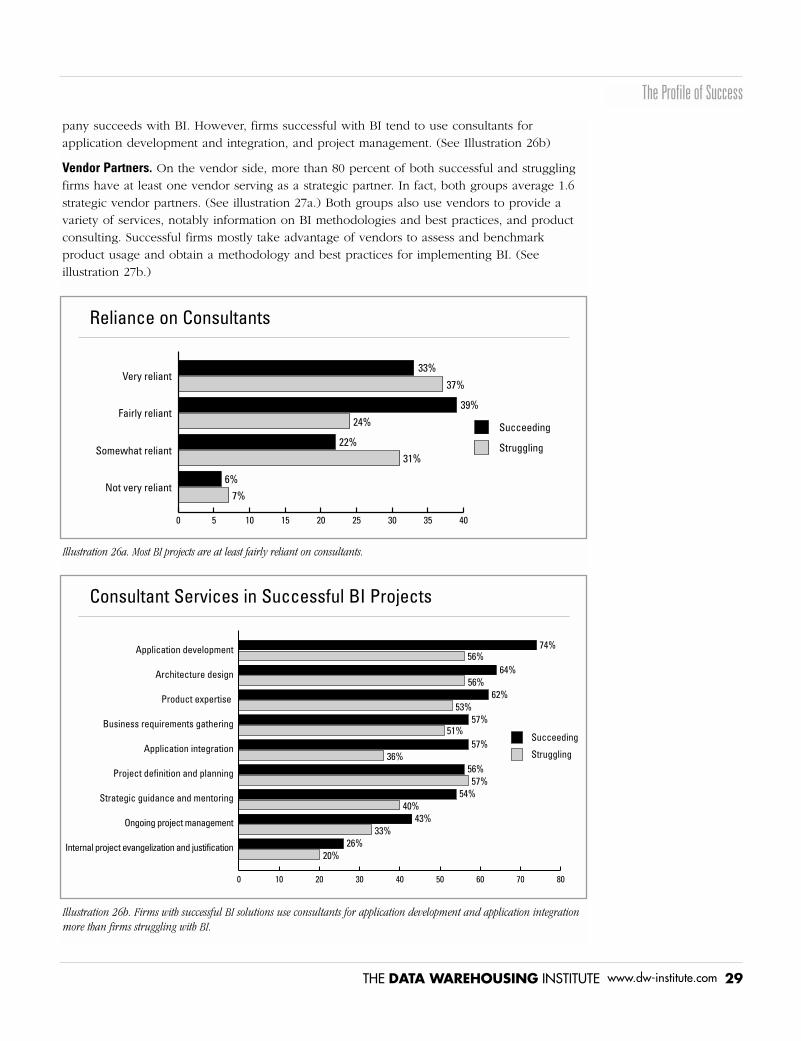
THE DATA WAREHOUSING INSTITUTE www.dw-institute.com 29
The Profile of Success
pany succeeds with BI. However, firms successful with BI tend to use consultants for
application development and integration, and project management. (See Illustration 26b)
Vendor Partners. On the vendor side, more than 80 percent of both successful and struggling
firms have at least one vendor serving as a strategic partner. In fact, both groups average 1.6
strategic vendor partners. (See illustration 27a.) Both groups also use vendors to provide a
variety of services, notably information on BI methodologies and best practices, and product
consulting. Successful firms mostly take advantage of vendors to assess and benchmark
product usage and obtain a methodology and best practices for implementing BI. (See
illustration 27b.)
Illustration 26b. Firms with successful BI solutions use consultants for application development and application integrationmore than firms struggling with BI.
Application development
Succeeding
Struggling
Architecture design
Product expertise
Business requirements gathering
Project definition and planning
Strategic guidance and mentoring
Ongoing project management
Internal project evangelization and justification
Application integration
56%64%
56%62%
57%
33%
53%
51%57%
36%56%57%
54%40%
43%
26%
0 10 20 30 40 50 60 70 80
74%
20%
Consultant Services in Successful BI Projects
Illustration 26a. Most BI projects are at least fairly reliant on consultants.
Succeeding
Struggling
Very reliant
Fairly reliant
Somewhat reliant
Not very reliant
0 5 10 15 20 25 30 35 40
33%
37%
39%
24%
22%31%
6%7%
Reliance on Consultants

However, a strategic vendor partnership doesn’t necessarily translate into over-reliance on
vendors. Only a minority of both groups are “very reliant” on vendors. (See illustration 28)
“The day you start to rely heavily on one or more vendors and become dependent upon them
is the day that your checkbook breaks,” says Verizon’s Wes Flores.
However, others are less timid when it comes to partnering with vendors. “When I get a
vendor relationship that works, I stick with the vendor,” says Scotts’ Masdea, who likes
vendors who are responsive to her needs and incorporate her suggestions into the next
round of product enhancements.
30 THE DATA WAREHOUSING INSTITUTE www.dw-institute.com
Smart Companies in the 21st Century
Illustration 27a. Firms average roughly 1.6 strategic vendor partners.
Succeeding (Average =1.6)
Struggling (Average =1.6)
0
1
2
3+
0 5 10 15 20 25 30 35 40
19%
17%
23%
30%
31%
36%
22%
22%
Number of Vendors Serving as Strategic Partners
Illustration 27b. Successful BI teams leverage vendor methodologies, best practices, and product knowledge and assistance.
Succeeding
Struggling
0 10 20 30 40 50 60 70 80
Vendor expert always on site 29%18%
Vendor expert always on call 59%43%
Success stories in our industry 35%35%
Failure stories in our industry 10%9%
Early briefings on product direction 48%38%
Assess and benchmark product usage 35%19%
Offer methodology and best practices 68%53%
Help evangelize project to all constituencies21%
24%
Suggest ways to enhance product usage 60%52%
Services Provided by Strategic Vendor Partners

THE DATA WAREHOUSING INSTITUTE www.dw-institute.com 31
Guidelines for Success
LESSONS LEARNED ABOUT PARTNERSHIPS:
• Successful BI teams leverage the assistance of consultants and vendors but don’t become
too reliant on them.
Summary—Characteristics of Success
Active Sponsors and Drivers. In summary, successful BI teams exhibit specific characteristics.
They have committed sponsors who have a vision for how BI can further an organization’s
strategic objectives. Sponsors appoint drivers to spearhead projects on their behalf, and drivers
spend at least 50 percent of their time dedicated to the BI project.
Strong Alignment between Business and IT. Successful BI projects also exhibit a high degree of
alignment between business and IT. In fact, the two groups function as a single team with
minimal organizational delineation between them. Successful BI projects are guided by an
executive steering committee that funds and prioritizes BI projects and a working committee
that guides BI projects on an operational level.
Incremental Growth and Enterprise Scope. Successful BI projects start small but add value
exponentially by adding new subject areas and users in increments of three to four months.
As the project gains the confidence of executives and users, it picks up momentum and fund-
ing for infrastructure expansion. It eventually turns into a mature enterprise resource that
serves many departments and provides unique cross-functional views of the data.
Superior Talent. Organizations that succeed with BI also hire and retain talented developers and
project managers and leverage the expertise and resources of vendors and consultants without
becoming too reliant on them. This balance enables the BI team, which works closely with
business drivers, to deliver BI solutions that are fast, scalable, reliable, and highly available.
Receptive Culture. Organizational culture also dictates success. Organizations where BI flour-
ishes typically sincerely believe in the value of information and invest in it. These organiza-
tions also encourage employees to use data rather than just intuition to make decisions, and
they encourage users to share information for the betterment of the company.
Illustration 28. Successful BI firms are more reliant on vendors than less successful ones.
Succeeding
Struggling
Very reliant
Fairly reliant
Somewhat reliant
Not very reliant
0 10 20 30 40 50
25%15%
50%36%
15%39%
9%11%
Reliance on Vendors
Guidelines for Success
It’s one thing to understand the key indicators of a successful BI solution, but it’s another to
roll up your sleeves and make the solution work. Below is a synthesis of the critical success
factors for delivering successful BI solutions that we culled from our interviews with BI pro-
fessionals and experts.
1. Establish a VisionThis point is so obvious it’s often overlooked! One or more top executives must have a vision
for how BI can advance the key strategies and objectives of the business. “You need a spon-
sor who has a vision for how to apply information technology and also really understands the
business,” says Randi Klarin, a technical manager at EDS in Rockville, Maryland.
It doesn’t matter if every knowledge worker and manager in the company wants and needs
the BI solution. The project simply won’t succeed if the top executives aren’t committed to it.
“If your sponsor is not 100 percent behind the project, then look for another job,” says Doug
Hackney, president of Enterprise Group Ltd., a San Diego-based consultancy. “It’s better to
resign than work on a project that is doomed to fail.”
If a potential BI project doesn’t have an enthusiastic, committed sponsor, there are ways to
cultivate one. Those with the vision need to communicate it to potential sponsors so they
adopt it as their own. “The golden rule of BI is to make your sponsor a hero,” Hackney says.
To make the case for the BI solution, it’s helpful to use examples of direct competitors who
are leveraging BI for competitive advantage. It also helps to bring in an outside consultant to
validate concepts and educate sponsors about BI’s potential at your firm. But don’t sidestep
potential pitfalls; be compelling, yet realistic. Also, make sure the sponsor assumes responsi-
bility for the outcome of the project.
2. Evangelize the VisionSince BI acts as a change agent within an organization, the sponsor (or a publicly appointed
driver) must actively evangelize the importance of the project at all levels of the company. “I
am the nexus of change management for our CRM/BI project,” says a vice president and BI
driver at a large insurance agency. “Our chairman evangelizes the project from the top and I
cheerlead from the bottom among people in the field who interact with customers. When you
work the top and the bottom, the middle comes along.”
Sponsors and drivers should use all available communications channels to evangelize the proj-
ect. First, they should map out the key players in the organization with influence and the abili-
ty to kill the project either actively or passively, and explain how the project will benefit them
or their groups and what they need to do. Then, the sponsor/driver should develop a market-
ing plan that uses the corporate intranet, newsletters, annual reports, quotes in the general
media, and company meetings and outings to build enthusiasm and commitment to the project.
But the sponsor/driver should be careful not to raise expectations too high, too soon, because
this can be a recipe for disaster later on. The need to manage expectations goes hand in hand
with the desire to evangelize the project.
32 THE DATA WAREHOUSING INSTITUTE www.dw-institute.com
Smart Companies in the 21st Century
Business Savvy andTechnical AcumenRequired

THE DATA WAREHOUSING INSTITUTE www.dw-institute.com 33
Guidelines for Success
3. Prioritize the PortfolioCompanies should tackle BI projects that are strategically significant to the company or business
unit but not so mammoth in scope that they are impossible to deliver. The key here is to estab-
lish a portfolio of BI applications that fulfills the sponsor’s vision. Then prioritize the applications
by their strategic value and deliver them incrementally over a reasonable period of time.
With a BI portfolio in hand, the BI team can create appropriate project plans and program
offices to coordinate the development of technical resources required to deliver each applica-
tion in the portfolio.
Ideally, the vision for the BI solution should emanate from the top of the organization, rather
than individual departments. Department-driven initiatives often create redundant and costly
analytic silos that perpetuate incompatible views of the business, says Margy Ross, president
of the Ralph Kimball Group. “You need to strike a balance between local needs and the
broader enterprise vision,” she says.
4. Allocate Sufficient ResourcesBusiness sponsors need to secure initial funding to launch the project. More important, they need
to sustain funding over the life of the BI portfolio and allocate funds to build and maintain an
enterprise BI infrastructure. Many survey respondents bemoan the lack of ongoing support from
top management. “Our biggest challenge is maintaining investment levels and senior management
support in a mature environment, including ‘technology refreshes,’” wrote one respondent.
Money is not the only critical resource that sponsors must free up. “Business users say they
want to be involved but they really don’t understand how much of their time the BI project
will consume,” says EDS’ Klarin. “They don’t understand the minutiae of decisions about the
data that have to be made. This is not a part-time job for the business.”
Finally, sponsors need to hire and retain highly experienced and skilled BI professionals who
can work full-time on the project. Continental Airlines, a 2003 TDWI Best Practices winner,
has 16 full-time staff members who all are qualified database administrators and have an aver-
age of 10 years of experience in the airline industry. A majority also have a master’s degree.
The airline attributes the technical and interpersonal skills of its BI development staff as a
critical reason for its success.
5. Align Business and IT for the Long HaulExtraordinarily successful BI projects all have an enterprise scope that took years to imple-
ment. They’ve integrated data from dozens of systems across geographic, organizational, and
political boundaries. They’ve created a single version of the truth from a Babel of incompati-
ble systems and business processes. As a result, they now save millions of dollars in costs and
millions of hours in lost time.
But the journey to this nirvana does not happen overnight. It begins with a small project of
strategic significance, backed by an influential sponsor and driver and implemented by a
close-knit team of developers and business people who work hand in hand to deliver action-
able information to the users who need it.
“Make sure you are planning for the enterprise and not the project,” says Charla Moore, data ware-
housing manager at BNSF. “When you first start out, you have to be creative to get funding and
support. But after several wins, it is not hard to sell an enterprise program and infrastructure.”
Develop a BIMarketing Plan
Don’t Underestimatethe Time CommitmentInvolved

34 THE DATA WAREHOUSING INSTITUTE www.dw-institute.com
Smart Companies in the 21st Century
BNSF’s BI advisory board (mentioned above) and various BI working committees ensure
alignment between the business and technical development teams. But BNSF cements align-
ment by ensuring that its technical developers understand the business and spend lots of time
with business users. “It’s an absolute requirement that developers have business knowledge.
We use joint application development sessions to bring the two groups together to gain a
common understanding. Some sessions last months.”
6. Build Trust in the System The most elegantly designed BI solution provides little business value if no one uses it. A
key responsibility of the business sponsor is to function as a change agent that gets users to
shift from old to new ways of making decisions and analyzing information. “Change always
takes time because users are not going to give up their old ways of doing things,” says one
survey respondent.
Besides evangelizing the new system, sponsors need to ensure the technical team does every-
thing possible to avoid giving users any excuse not to trust the new system. There are very
few ways to directly increase the credibility of a system, but hundreds of ways to undermine
it. Here are a few.
Ways to Undermine the Credibility of a BI Solution:
• The data is inaccurate; it doesn’t reconcile with operational data.
• The data looks different even though it’s accurate.
• There is no way to discover the origins of metrics or data in the solution.
• The user interface is confusing and the analytical tool is hard to use.
• Users find it difficult to locate the reports they want.
• Users can’t access the data or reports from the corporate intranet.
• It’s difficult for users to create custom views of data.
• Users aren’t shown how to use analytical tools in context of their own data.
• Users can’t leverage the BI data in other applications they use.
• There is no easy way to get assistance when using the BI solution.
• User feedback to enhance the BI solution doesn’t get implemented.
• The BI solution doesn’t fit with the organization’s existing infrastructure.
• The BI solution is time consuming to maintain and difficult to administer.
• The BI system is slow, unreliable, and unavailable at night or on weekends.
• The BI solution offers little added value compared to other BI resources.
The only way to build trust in a new BI solution is to have the business team own the solu-
tion and make all the decisions within predefined technical boundaries. This means users
must be involved in the system’s design, data sourcing and validation, and selection and pro-
totyping of tools and applications.
Also, business sponsors need to make sure that, in their eagerness to build the BI solution,
they don’t set arbitrary deadlines that force project managers to cut corners. Business sponsors
need to ensure that the technical team has sufficient time and expertise to carry out the busi-
ness’s wishes. The sponsor needs to review the technical team’s work on a regular basis. You
should ensure that the technical team does the following:
The Technical BI Team Must:
• Implement a rigorous plan to ensure adequate data quality.
• Create a dictionary of data elements and metrics for business users.
Start Small, Grow Big
There are 100 Waysto Undermine a NewBI Solution

THE DATA WAREHOUSING INSTITUTE www.dw-institute.com 35
Conclusion
• Iteratively prototype the user interface and incorporate feedback.
• Make the BI solution or relevant reports available via the company’s intranet.
• Tune the performance of the BI solution to meet response time requirements.
• Architect the system to scale seamlessly and inexpensively as usage grows.
• Develop a training program that provides customizable instruction via multiple modes
using real-life business scenarios and data.
• Train and support power users in every department to create custom reports for their
colleagues and answer questions about the data.
• Establish a help desk to answer technical questions.
• Architect the BI solution so it can be easily updated and changed in response to user
requests.
• Implement backup procedures and disaster recovery plans to maintain availability.
• Provide a scalable, reliable, and high performance solution.
The technical team needs to provide a bullet-proof technical environment that adapts rapidly
to changes in business requirements. This is easier said than done. It requires a Herculean
effort, but it is the only way to engender trust and usage in the system.
Conclusion
Business executives need to focus on these six success factors to minimize project risks and
increase the likelihood of success.
1.Establish a vision.
2.Evangelize the vision.
3.Prioritize the portfolio.
4.Allocate sufficient resources.
5.Align business and IT for the long haul.
6.Build trust in the system.
These are the “bread and butter” issues in BI. Interestingly, the keys to success are not techni-
cal in nature. Projects don’t succeed because they use an innovative design or radical new
technology. They succeed because of the “soft” stuff—leadership, communication, planning,
and interpersonal relationships. Organizations must master these as much as the technical
designs and tools required to deploy BI solutions.
It’s interesting that almost all of our key indicators of success are non-technical in nature. All
technical issues, including infrastructure and analytical tools, require business oversight and
guidance to be implemented correctly.
Business intelligence can provide significant value to your organization. It can provide high
ROI and be a critical enabler of key business strategies and tactics for competing in an
increasingly tough marketplace. By benchmarking your organization against our key success
indicators and following our six critical success factors, your organization will be better able to
extract value from BI.
The Only Way toBuild Trust Is to Havethe Business Ownthe Solution

Actuate Corporation
701 Gateway Blvd.
South San Francisco, CA 94080
650.837.2000
Fax: 650. 827.1560
Email: [email protected]
Web: www.actuate.com
Actuate Corporation is the world leader in scalable business
intelligence applications.Actuate’s Information Application
Platform is the foundation on which Global 9000 organiza-
tions and packaged application software vendors create
reporting and analytics applications that scale to empower
100 percent of their user community inside and outside the
firewall. Information applications built with Actuate enable
companies to increase their business agility, improve cus-
tomer and partner relationships, adhere to corporate gover-
nance policies, and increase revenues while leveraging
existing technology assets.When tested against other busi-
ness intelligence products,Actuate's Information
Application Platform has been proven to offer industry-lead-
ing scalability, the best performance, and lowest total cost
of ownership.
arcplan, Inc.
West Valley Business Center
900 West Valley Road, Suite 204
Wayne, PA 19087
877.2.arcplan
Fax: 610.902.0689
Email: [email protected]; [email protected]
Web: www.arcplan.com
arcplan is a globally successful software developer whose
solutions enable companies to bridge business initiatives
and IT resources for maximum productivity and competi-
tive advantage.With arcplan’s business intelligence and
product configuration platforms, IT and business profession-
als can create custom Web-based applications without the
cost and complexity of traditional solutions. arcplan has
more than 1,500 customers and 200,000 users worldwide.
Headquartered in Düsseldorf, Germany, and Philadelphia,
PA, arcplan delivers its solutions through a global direct
sales force and a network of more than 135 service and
implementation partners in 30 countries. For more infor-
mation, visit www.arcplan.com.
Business Objects
3030 Orchard Parkway
San Jose, CA 95134
408.953.6000
Web: www.businessobjects.com
Business Objects is the world’s leading provider of enter-
prise business intelligence (BI) solutions. Business Objects
enables organizations to track, understand, and manage
enterprise performance.The company’s solutions leverage
the information that is stored in an array of corporate data-
bases including ERP, CRM, and legacy systems. Popular uses
of BI include management dashboards and scorecards,
enterprise performance management applications, customer
intelligence applications, enterprise reporting, financial
reporting, and both customer and partner extranets.
Business Objects provides the industry’s most integrated
business intelligence suite, called BusinessObjects
Enterprise 6.This suite includes the industry’s best Web
query, reporting, and analysis; the most advanced and com-
plete suite of analytic applications; and the best connectivi-
ty to packaged applications. Business Objects has more than
17,500 customers in over 80 countries.
Cognos Inc.
3755 Riverside Drive
Ottawa, ON
K1G 4K9, Canada
Fax: 613.738.0002
Email: [email protected]
Web: www.cognos.com
Cognos is the world leader in business intelligence (BI) and
performance planning software for the enterprise. Our solu-
tions let companies improve and direct corporate perform-
ance by enabling all of the key steps in the management
cycle—from planning and budgeting, to measuring and
monitoring performance, to reporting and analysis. Cognos
is the only company to support all of these key manage-
ment activities with a complete solution that spans all of
the essential components of CPM—enterprise performance
planning, scorecarding, and business intelligence.
Founded in 1969, Cognos employs more than 2,900 peo-
ple and serves more than 22,000 customers in over 135
countries.
Smart Companies in the 21st Century
SPONSORS
Crystal Decisions, Inc.
895 Emerson Street
Palo Alto, CA 94301-2413
800.877.2340 or 604.681.3435
Fax: 604.681.2934
Web: www.crystaldecisions.com/contact/
Crystal Decisions is a leading global provider of business
intelligence software and services that enable the effective
use and management of information within and among
organizations.As of March 28, 2003, we have delivered more
than 14 million licenses and had registered users in more
than 170 countries. Crystal Decisions is headquartered in
Palo Alto, Calif., and has more than 25 offices worldwide.
Crystal Decisions can be found on the Internet at
www.crystaldecisions.com.
Informatica Corporation
2100 Seaport Boulevard
Redwood City, CA 94063
650.385.5000
Fax: 650.385.5500
Web: www.informatica.com
Informatica Corporation is the leading provider of business
analytics software that helps Global 2000 organizations
monitor, manage, and optimize the performance of key busi-
ness operations across the enterprise.Today, more than
1,600 companies worldwide have chosen Informatica to
power their analytic solutions—resulting in millions of dol-
lars in cost savings and productivity gains. For more infor-
mation, call 650.385.5000 (800.970.1179 in the U.S.), or
visit the Informatica Web site at www.informatica.com.
MicroStrategy, Inc.
1861 International Drive
McLean, VA 22102
703.848.8600
Fax: 703.848.8610
Email: [email protected]
Web: www.microstrategy.com
For 11 years, MicroStrategy has helped corporations trans-
form their operational data into actionable information. Our
industrial-strength business intelligence platform,
MicroStrategy 7i, is the culmination of a legacy of technical
innovations. It was specifically designed for fast and simple
initial implementation and to grow seamlessly to support
enterprise-class requirements.
We have over 2,000 satisfied customers, including Bank of
Montreal, Best Buy, and AT&T, and over 300 technology and
integration partners, including IBM, PeopleSoft, and JD
Edwards.As they can attest, MicroStrategy 7i is the best,
most complete solution for any business intelligence need.
Oracle Corporation
500 Oracle Parkway
Redwood Shores, CA 94065
800.ORACLE.1
Fax: 650.506.7200
Web: www.oracle.com
Oracle provides all the infrastructure, tools, and applications a
company needs to support better business decisions, from the
call center to the CEO’s office, from the traveling sales repre-
sentative to the CFO. Oracle9i database provides a single, inte-
grated business intelligence engine for scalable data ware-
housing; OLAP; data mining; and extraction, transformation,
and loading (ETL). In addition, Oracle9i Application Server
provides built-in personalization, ad hoc query, enterprise
reporting, and clickstream intelligence functionalities. Oracle9i
Developer Suite includes BI beans, specially built to tap into
Oracle9i OLAP to develop or customize business intelligence
applications. Finally, Oracle’s E-Business suite offers pre-built
analytical applications in its CRM and ERP modules.
For more information on Oracle’s data warehousing and
business intelligence products, visit www.oracle.com.

The Data Warehousing Institute5200 Southcenter Blvd., Suite 250Seattle, WA 98188Local: 206.246.5059Fax: 206.246.5952Email: [email protected]: www.dw-institute.com
About the TDWI Report SeriesThe TDWI Report Series is designed to educate technical and business professionals
about critical issues in BI. TDWI’s in-depth reports offer objective, vendor-neutral
research consisting of interviews with industry experts and a survey of BI professionals
worldwide. TDWI’s in-depth reports are sponsored by vendors who collectively wish to
evangelize a BI discipline or emerging technology.
AcknowledgementsTDWI would like to thank many people who contributed to this report. First, we appreci-
ate the many users who responded to our survey, as well as those who responded to
our requests for phone interviews. Second, we’d like to thank Dave Wells who reviewed
the draft manuscript, as well as our report sponsors who reviewed outlines, survey
questions, and report drafts. TDWI’s production team includes Dale Chinn, Denelle
Hanlon, Marie McFarland, and Donna Padian.
About TDWIThe Data Warehousing Institute (TDWI), a division of 101communications LLC, is the
premier provider of in-depth, high-quality education and training in the business intelli-
gence and data warehousing industry. TDWI offers quarterly educational conferences,
regional seminars, onsite training, professional membership, leadership awards, print
and online publications, and a public and private (Members-only) Web site.
This special report is the property of The Data Warehousing Institute (TDWI) and is made available toa restricted number of clients only upon these terms and conditions. TDWI reserves all rights herein.Reproduction or disclosure in whole or in part to parties other than the TDWI client, who is the originalsubscriber to this report, is permitted only with the written permission and express consent of TDWI.This report shall be treated at all times as a confidential and proprietary document for internal useonly. The information contained in the report is believed to be reliable but cannot be guaranteed to becorrect or complete.
For more information about this report or its sponsors, and to view the archived report Webinar,please visit www.dw-institute.com/bireport/.
©2003 by 101communications LLC. All rights reserved. Printed in the United States. The DataWarehousing Institute is a trademark of 101communications LLC. Other product and company namesmentioned herein may be trademarks and/or registered trademarks of their respective companies. TheData Warehousing Institute is a division of 101communications LLC based in Chatsworth, CA.