report rep 225 insolvency statistics: external ... · report 225 insolvency statistics: external...
TRANSCRIPT

REPORT 225
Insolvency statistics: External administrators’ reports 1 July 2007–30 June 2010
December 2010
About this report
This report presents statistical findings from reports lodged electronically by liquidators, receivers and administrators from 1 July 2007 to 30 June 2010.

REPORT 225: Insolvency statistics: External administrators’ reports 1 July 2007–30 June 2010
© Australian Securities and Investments Commission December 2010 Page 2
About ASIC regulatory documents
In administering legislation ASIC issues the following types of regulatory documents.
Consultation papers: seek feedback from stakeholders on matters ASIC is considering, such as proposed relief or proposed regulatory guidance.
Regulatory guides: give guidance to regulated entities by: • explaining when and how ASIC will exercise specific powers under
legislation (primarily the Corporations Act) • explaining how ASIC interprets the law • describing the principles underlying ASIC’s approach • giving practical guidance (e.g. describing the steps of a process such
as applying for a licence or giving practical examples of how regulated entities may decide to meet their obligations).
Information sheets: provide concise guidance on a specific process or compliance issue or an overview of detailed guidance.
Reports: describe ASIC compliance or relief activity or the results of a research project.
Previous external administrators’ statistics reports
This is the second report of statistics compiled from external administrators’ reports. The first report was published in June 2008.
Report number Report date
REP 132 June 2008
Disclaimer
This report has not been prepared for and should not be relied on for commercial use. In compiling the statistics in this report, ASIC has relied on the information in the reports lodged electronically with ASIC.
Other than as discussed in Section B, ASIC has not verified or sought to confirm the accuracy of any information in the external administrators’ reports. Accordingly, the statistics in this report cannot be construed or relied on as representing a complete and accurate depiction or statement about the matters or events to which the statistics relate.

REPORT 225: Insolvency statistics: External administrators’ reports 1 July 2007–30 June 2010
© Australian Securities and Investments Commission December 2010 Page 3
Contents Summary of main findings ........................................................................... 5
Profile of companies ................................................................................ 5 Causes of company failure ...................................................................... 5 Possible misconduct ................................................................................ 6 Estimated dividends ................................................................................. 6 Electronically lodged reports.................................................................... 6
A ASIC and company insolvency ............................................................ 7
B About statistics from external administrators’ reports ..................... 8 Important terms used in this report .......................................................... 9 General conditions/limitations .................................................................. 9 Conditions/limitations on information in Sections D, E and F ................10
C Lodgements of statutory reports .......................................................14 Total lodgements of statutory reports ....................................................14 Initial external administrators’ reports lodged ........................................16
D Initial external administrators’ reports 2009–2010 ..............................17 Lodgements by region ...........................................................................17 Lodgement period ..................................................................................18 Section lodged under .............................................................................19 Size of company ....................................................................................19 Industry ..................................................................................................19 Nominated causes of failure ..................................................................21 Possible misconduct ..............................................................................24 Liabilities and assets ..............................................................................35 Employee entitlements ..........................................................................39 Secured creditors ...................................................................................41 Unpaid taxes and charges .....................................................................41 Unsecured creditors ...............................................................................45 Cents in the dollar dividend ...................................................................45 Completion of external administration ...................................................49 Proposed action .....................................................................................49 Company officers ...................................................................................49 External administrator’s remuneration ...................................................50
E Initial external administrators’ reports 2008–2009 ..............................51 Lodgements by region ...........................................................................51 Lodgement period ..................................................................................52 Section lodged under .............................................................................53 Size of company ....................................................................................53 Industry ..................................................................................................54 Nominated causes of failure ..................................................................55 Possible misconduct ..............................................................................58 Liabilities and assets ..............................................................................69 Employee entitlements ..........................................................................73 Secured creditors ...................................................................................75 Unpaid taxes and charges .....................................................................75 Unsecured creditors ...............................................................................79 Cents in the dollar dividend ...................................................................79 Completion of external administration ...................................................83 Proposed action .....................................................................................83 Company officers ...................................................................................83 External administrator’s remuneration ...................................................84

REPORT 225: Insolvency statistics: External administrators’ reports 1 July 2007–30 June 2010
© Australian Securities and Investments Commission December 2010 Page 4
F Initial external administrators’ reports 2007–2008 ..............................85 Lodgements by region ...........................................................................85 Lodgement period ..................................................................................86 Section lodged under .............................................................................87 Size of company ....................................................................................87 Industry ..................................................................................................87 Nominated causes of failure ..................................................................88 Liabilities and assets ..............................................................................91 Employee entitlements ..........................................................................95 Secured creditors ...................................................................................97 Unpaid taxes and charges .....................................................................97 Unsecured creditors .............................................................................101 Cents in the dollar dividend .................................................................101 Completion of external administration .................................................104 Proposed action ...................................................................................104 Company officers .................................................................................104 External administrator’s remuneration .................................................105
Key terms ...................................................................................................106
Related information ...................................................................................108
REPORT 225: Insolvency statistics: External administrators’ reports 1 July 2007–30 June 2010
© Australian Securities and Investments Commission December 2010 Page 5
Summary of main findings
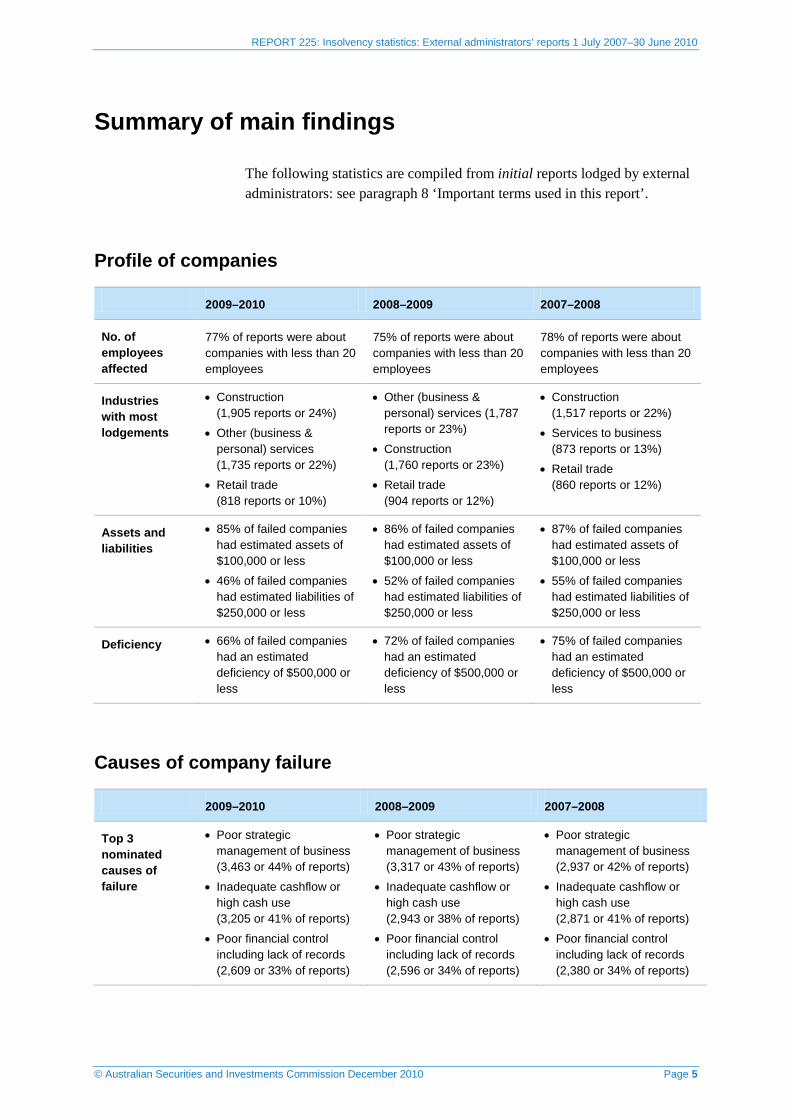
The following statistics are compiled from initial reports lodged by external administrators: see paragraph 8 ‘Important terms used in this report’.
Profile of companies
2009–2010 2008–2009 2007–2008
No. of employees affected
77% of reports were about companies with less than 20 employees
75% of reports were about companies with less than 20 employees
78% of reports were about companies with less than 20 employees
Industries with most lodgements
• Construction (1,905 reports or 24%)
• Other (business & personal) services (1,735 reports or 22%)
• Retail trade (818 reports or 10%)
• Other (business & personal) services (1,787 reports or 23%)
• Construction (1,760 reports or 23%)
• Retail trade (904 reports or 12%)
• Construction (1,517 reports or 22%)
• Services to business (873 reports or 13%)
• Retail trade (860 reports or 12%)
Assets and liabilities
• 85% of failed companies had estimated assets of $100,000 or less
• 46% of failed companies had estimated liabilities of $250,000 or less
• 86% of failed companies had estimated assets of $100,000 or less
• 52% of failed companies had estimated liabilities of $250,000 or less
• 87% of failed companies had estimated assets of $100,000 or less
• 55% of failed companies had estimated liabilities of $250,000 or less
Deficiency • 66% of failed companies had an estimated deficiency of $500,000 or less
• 72% of failed companies had an estimated deficiency of $500,000 or less
• 75% of failed companies had an estimated deficiency of $500,000 or less
Causes of company failure
2009–2010 2008–2009 2007–2008
Top 3 nominated causes of failure
• Poor strategic management of business (3,463 or 44% of reports)
• Inadequate cashflow or high cash use (3,205 or 41% of reports)
• Poor financial control including lack of records (2,609 or 33% of reports)
• Poor strategic management of business (3,317 or 43% of reports)
• Inadequate cashflow or high cash use (2,943 or 38% of reports)
• Poor financial control including lack of records (2,596 or 34% of reports)
• Poor strategic management of business (2,937 or 42% of reports)
• Inadequate cashflow or high cash use (2,871 or 41% of reports)
• Poor financial control including lack of records (2,380 or 34% of reports)

REPORT 225: Insolvency statistics: External administrators’ reports 1 July 2007–30 June 2010
© Australian Securities and Investments Commission December 2010 Page 6
Possible misconduct
2009–2010 2008–2009 2007–2008
Top 3 alleged possible misconduct
s588G(1)–(2) Insolvent trading
• s286 & 344(1) Obligation to keep financial records
• s180 Care & diligence—Directors’ & officers’ duties
• s588G(1)–(2) Insolvent trading
s286 & 344(1) Obligation to keep financial records
• s180 Care & diligence—Directors’ & officers’ duties
(Not available)
Estimated dividends
2009–2010 2008–2009 2007–2008
Dividends to unsecured creditors
In 97% of cases, the dividend estimated to be payable to unsecured creditors was less than 11 cents in the dollar
In 97% of cases, the dividend estimated to be payable to unsecured creditors was less than 11 cents in the dollar
In 96% of cases, the dividend estimated to be payable to unsecured creditors was less than 11 cents in the dollar
Electronically lodged reports
The total number of electronically lodged external administrator statutory reports has increased from 96% in the 2007–2008 financial year to 98% in 2009–2010: see Section C.
The total number of electronic reports lodged directly by external administrators has risen from 93% in 2007–2008 to 96% in 2009–2010.

REPORT 225: Insolvency statistics: External administrators’ reports 1 July 2007–30 June 2010
© Australian Securities and Investments Commission December 2010 Page 7
A ASIC and company insolvency
1 One of ASIC’s regulatory responsibilities is the administration of the provisions in the Corporations Act 2001 (Corporations Act) that relate to insolvency. This responsibility is wide: see Table 1.
Table 1: ASIC’s activities in insolvency
Companies and company officers
Reviewing companies suspected of trading while insolvent, to make directors focus on the solvency of their companies and take early action where solvency problems exist
Investigating possible misconduct associated with the collapse of a company, and taking appropriate enforcement action
Deregistering companies
Disqualifying directors of failed companies
Insolvency practitioners
Registering liquidators
Providing assistance in the conduct of external administrations by insolvency practitioners, including prosecuting directors who do not provide books and records or reports to external administrators
Administering the Assetless Administration Fund (AA Fund), which finances preliminary investigations and reports by liquidators into the failure of companies with few or no assets, when it appears to ASIC that we may be able to take enforcement action as a result of their investigations and reports
Assessing external administrators’ reports lodged with ASIC as part of their statutory responsibilities to investigate company failure and report findings to ASIC
Investigating possible misconduct by insolvency practitioners in their conduct of external administrations, and where appropriate, referring the conduct to the court or to the Companies Auditors and Liquidators Disciplinary Board (CALDB)
All stakeholders Developing ASIC policy and guidance on the insolvency provisions of the Corporations Act
Publishing statistics on corporate insolvency about:
− companies entering external administration
− insolvency appointments
− findings from reports lodged by liquidators, receivers and administrators

REPORT 225: Insolvency statistics: External administrators’ reports 1 July 2007–30 June 2010
© Australian Securities and Investments Commission December 2010 Page 8
B About statistics from external administrators’ reports
2 This statistical report provides a broad picture of corporate insolvencies in Australia for the information of the insolvency profession, creditors, academics, the Australian Government and other interested stakeholders. This report covers the 2007–2008, 2008–2009 and 2009–2010 financial years. The previous statistical report covered 2004–2005, 2005–2006 and 2006–2007 financial years: see Report 132 External administrators: Schedule B statistics 1 July 2004–30 June 2007 (REP 132).
3 This report was compiled from the estimates and opinions contained in statutory reports lodged with ASIC by liquidators, administrators and receivers (external administrators) in the format of Schedule B to Regulatory Guide 16 External administrators: Reporting and lodging (RG 16) (Schedule B report).
4 Reports are lodged under the following sections of the Corporations Act:
s533 (by a liquidator);
s438D (by an administrator); and
s422 (by a receiver).
5 External administrators must lodge a report with ASIC as soon as practicable:
when they suspect an offence under an Australian law, or instances of negligence or misconduct relating to the company to which they are appointed; or
in the case of a liquidation only, when unsecured creditors are unlikely to receive more than 50 cents in the dollar dividend.
6 Changes to the Corporations Act, introduced a statutory time limit on the lodgement of reports by a liquidator appointed after 31 December 2007. Liquidators must now lodge reports as soon as practicable, and in any event within six months, after it so appears to him or her that any of the conditions in s533(1)(a), (b) and (c) apply. No statutory time limit was introduced under s422 or 438D.
7 We also ask external administrators to submit financial and other data when they complete their reports.

REPORT 225: Insolvency statistics: External administrators’ reports 1 July 2007–30 June 2010
© Australian Securities and Investments Commission December 2010 Page 9
Important terms used in this report
8 The following terms are used in this report and are important for understanding the statistics. For a full list of terms used in this report, see ‘Key terms’ at the end of this report.
Term Meaning in this document
Electronically lodged report
A Schedule B report lodged:
directly by external administrators through the registered liquidators’ portal; or
on paper by external administrators in the Schedule B format, and subsequently entered by ASIC staff through the staff portal.
Initial external administrator report
The first electronically lodged Schedule B report after a company has entered external administration.
General conditions/limitations
9 When interpreting the statistics in this report, please keep the following conditions/limitations in mind:
Although we encourage external administrators to report in the Schedule B report format, the use of this format is voluntary. It is not a statutory requirement. Reports not lodged in this format are only included in total lodgement statistics (see Section C and Table 2) and not in the rest of the report.
The statistics in this report will not directly correlate with the monthly statistics for ‘Companies entering external administration’ and ‘Insolvency appointments’ on ASIC’s website due to the time delay in lodgement of reports: see Table 5. Reports are not required to be lodged where the pre-conditions of either s422, 438D or 533 of the Corporations Act are not met.
Some reports are lodged for statistical purposes only, rather than under the Corporations Act. For example, a liquidator may choose to lodge a report for a company with no suspected misconduct and with an estimated dividend of more than 50 cents in the dollar, so that the financial and other data for this company is reflected in the aggregated statistics.

REPORT 225: Insolvency statistics: External administrators’ reports 1 July 2007–30 June 2010
© Australian Securities and Investments Commission December 2010 Page 10
Conditions/limitations on information in Sections D, E and F
10 To avoid double counting, all statistics are compiled only from the first electronically lodged report after a company has entered external administration (EXAD) status (the initial external administrator report). This allows for the following situations:
While a company is in EXAD status, it may be subject to more than one appointment type. Even though a report may be lodged for each appointment type, only the first electronically lodged report for the company is included in the statistics.
More than one report may also be lodged for each appointment type. Again, only the first electronically lodged report is included.
A company may go in and out of EXAD status more than once. For each period in EXAD status, only the first electronically lodged report is included.
11 While only the first electronically lodged report is included in these statistics, an external administrator may have lodged an additional report on paper in a narrative form (not the Schedule B format).
12 Financial information provided in external administrators’ reports reflects estimates and opinions of the external administrator at a point in time. Revised information from subsequent or updated reports is not reflected in these statistics.
13 When completing the report, an external administrator selects from a predetermined set of options for qualitative questions, and ranges for quantitative questions.
14 Limited testing carried out by ASIC while compiling these statistics identified a small number of reports with estimated employee entitlements inconsistent with other responses in those reports (e.g. very high unpaid employee entitlements but less than five employees; high unpaid employee entitlements which are significantly greater than estimated total liabilities). These reports have been eliminated from the employee entitlements statistics where the impact was material.
15 The top six or 12 industries by number of reports lodged are shown for some statistics by industry and remaining industries are grouped under ‘Other industries’.
16 Statistics broken down by region use the latest registered address on ASIC’s corporate database (ASCOT). When an external administrator from another region becomes the external administrator and changes the registered office address on ASCOT, the new address will be used. Companies with international registered addresses are not included in any regional statistics.
17 Percentages may not add up to 100% due to rounding.

REPORT 225: Insolvency statistics: External administrators’ reports 1 July 2007–30 June 2010
© Australian Securities and Investments Commission December 2010 Page 11
Amendments to Schedule B report format 18 In July 2008, we reissued RG 16 to enhance the quality of information disclosed.
The key parts of the Schedule B report format which were amended are as follows: ‘Contraventions’ was renamed ‘Possible misconduct’ and divided into
civil and criminal breaches of the Corporations Act or other Commonwealth or state or territory laws. Availability of evidence is now disclosed for each type of possible misconduct identified.
Contraventions were not included in Report 132 External administrators: Schedule B statistics 1 July 2004–30 June 2007 (REP 132). Possible misconduct is only disclosed for the financial years ended 2008–2009 and 2009–2010.
Changes to industry categories 19 Industry categories were updated to align with 2006 Australian and New
Zealand Standard Industrial Classification (ANZSIC) divisions. ANZSIC divisions are classified into subdivisions, group and classes. Due to the large number of changes made at subdivision and group level, comparison of industry data pre- and post-1 July 2008 is more difficult. Changes to the Schedule B report format for industry categories include the following: The ‘Financial & insurance’ industry category was previously broken
down as separate industry categories due to ASIC’s particular focus in this area. The sub-categories in the Schedule B report format of ‘Credit provider’, ‘Deposit taking institutions’, ‘Insurance’, ‘Managed investments’, ‘Superannuation’ and ‘Other financial services’ are now combined under ‘Financial & insurance services’ and do not align with ANZSIC subdivision, group or class titles. References to ‘Financial & insurance services’ sub-categories have been abbreviated to ‘FIS’.
The number of divisions was increased by rearranging the ‘Property & business services’ category into ‘Administrative & support services’, ‘Professional, scientific & technical services’ and ‘Rental, hiring & real estate services’.
Some industries were renamed to better reflect their composition: ‘Accommodation, cafes & restaurants’ is now ‘Accommodation & food services’; ‘Cultural & recreational services’ is now ‘Arts & recreation services’; ‘Education’ is now ‘Education & training’; ‘Electricity, gas & water supply’ is now ‘Electricity, gas, water & waste services’; ‘Health & community services’ is now ‘Health care & social assistance’; ‘Personal & other services’ is now ‘Other services’; ‘Government administration & defence’ is now ‘Public administration & safety’; and ‘Transport & storage’ is now ‘Transport, postal & warehousing’.
Schedule B’s former industry category ‘Agriculture’ has been renamed ‘Agriculture, forestry & fishing’ in line with ANZSIC divisions.

REPORT 225: Insolvency statistics: External administrators’ reports 1 July 2007–30 June 2010
© Australian Securities and Investments Commission December 2010 Page 12
‘Communication services’ was effectively replaced by ‘Information media & telecommunications’, bringing together a number of classes from previous divisions.
‘Personal & other services’ and Schedule B’s former industry category ‘Services to business’ have been grouped under a new Schedule B category ‘Other (business & personal) services’ (ANZSIC division name ‘Other services’).
Detail of industry descriptions is available from www.abs.gov.au/anzsic. See also Figure 1.

REPORT 225: Insolvency statistics: External administrators’ reports 1 July 2007–30 June 2010
© Australian Securities and Investments Commission December 2010 Page 13
Figure 1: ANZSIC division changes
Agriculture, forestry & fishing
Mining
Manufacturing
Electricity, gas & water supply
Construction
Wholesale trade
Retail trade
Accommodation, cafes & restaurants
Transport & storage
Communication services
Financial & insurance
Property & business services
Government administration & defence
Education
Health & community services
Cultural & recreational services
Personal & other services
Agriculture, forestry & fishing
Mining
Manufacturing
Electricity, gas, water & waste services
Construction
Wholesale trade
Retail trade
Accommodation & food services
Transport, postal & warehousing
Information media & telecommunications
Financial & insurance services
Professional, scientific & technical services
Public administration & safety
Education & training
Health care & social assistance
Arts & recreation services
Other services
Rental, hiring & real estate services
Administrative & support services
1993 Divisions 2006 Divisions

REPORT 225: Insolvency statistics: External administrators’ reports 1 July 2007–30 June 2010
© Australian Securities and Investments Commission December 2010 Page 14
C Lodgements of statutory reports
Total lodgements of statutory reports
20 The total number of external administrator statutory reports lodged has increased consistently over the three-year period ended 30 June 2010. Total reports lodged has increased from 7,715 reports lodged in the 2007–2008 financial year to 8,494 reports lodged in the 2009–2010 financial year.
21 The percentage of electronically lodged reports has increased significantly from 36.8% in the 2002–2003 financial year (when electronic lodgement first became available) to 97.9% of reports electronically lodged in the 2009–2010 financial year.
22 The number of reports lodged directly by external administrators through the registered liquidators’ portal has risen from 36.8% in 2002–2003 to 96.1% in 2009–2010.
Table 2: Total external administrator statutory reports lodged by lodgement type (1 July 2007–30 June 2010)
2009–2010 2008–2009 2007–2008
No. % No. % No. %
Electronic—direct 8,161 96.1% 8,024 95.9% 7,193 93.2%
Electronic—staff portal 151 1.8% 163 1.9% 242 3.1%
Manual 182 2.1% 183 2.2% 280 3.6%
Total 8,494 100.0% 8,370 100.0% 7,715 100.0%
Electronic—direct Schedule B reports lodged directly by external administrators through the registered liquidators’ portal.
Electronic—staff portal Schedule B reports lodged on paper by external administrators in the Schedule B report format and subsequently entered by ASIC staff through the staff portal.
Manual Reports lodged on paper by external administrators.
Note: Excludes supplementary reports (Schedule C reports). This figure relates to reports lodged on paper not in the Schedule B report format, as reports lodged on paper in the Schedule B format were entered through the staff portal: see above.

REPORT 225: Insolvency statistics: External administrators’ reports 1 July 2007–30 June 2010
© Australian Securities and Investments Commission December 2010 Page 15
Figure 2: Total external administrator statutory reports lodged by lodgement type (1 July 2004–30 June 2010)
65%
80%
92% 93%
96% 96%
13%
11%
4%3%
2% 2%
22%
9%
4% 4%
2% 2%
0
1,000
2,000
3,000
4,000
5,000
6,000
7,000
8,000
9,000
2004-2005 2005-2006 2006-2007 2007-2008 2008-2009 2009-2010
Manual
Electronic -staff portal
Electronic -direct

REPORT 225: Insolvency statistics: External administrators’ reports 1 July 2007–30 June 2010
© Australian Securities and Investments Commission December 2010 Page 16
Initial external administrators’ reports lodged
23 To avoid double counting, the statistics in the rest of this report relate only to initial external administrators’ reports that were electronically lodged in the 2007–2008, 2008–2009 and 2009–2010 financial years: see paragraph 8 ‘Important terms used in this report’.
24 The number of initial external administrators’ reports lodged has increased from 6,933 reports in 2007–2008 to 7,903 reports in 2009–2010.
Table 3: Initial external administrators’ reports (1 July 2007–30 June 2010)
2009–2010 2008–2009 2007–2008
Total 7,903 7,733 6,933
25 Table 4 shows the reduction in the percentage of reports that are lodged more than 12 months after the appointment of the external administrator.
Table 4: Initial external administrators’ reports by timing of lodgement (1 July 2005–30 June 2010)
Reports lodged within 6 months
Reports lodged more than 12 months after appointment
2009–2010 51% 23%
2008–2009 53% 23%
2007–2008 46% 29%
2006–2007 48% 29%
2005–2006 51% 27%

REPORT 225: Insolvency statistics: External administrators’ reports 1 July 2007–30 June 2010
© Australian Securities and Investments Commission December 2010 Page 17
D Initial external administrators’ reports 2009–2010
26 For the year ended 30 June 2010, initial external administrators’ reports made up 93.0% (or 7,903 reports) of the total number of external administrator statutory reports lodged: see Table 2 and Table 3 in Section C. This compares to 92.4% (or 7,733 reports) in 2008–2009.
Key points
Initial external administrators’ reports disclosed the following material movements in 2009–2010 from the previous financial year:
• Companies reported as failing due to poor economic conditions increased from 16.6% to 26.8% of reports.
• Companies with no misconduct being reported decreased from 34.2% to 31.2%. Conversely, the number of reports alleging misconduct increased from 65.8% to 68.8%
• Reports alleging criminal misconduct under s429, 438B, 446C and 475 (report as to company’s affairs) decreased from 16% to 12% of reports.
• Reports alleging an insolvent trading breach of civil obligations under s588G(1)–(2) increased from 40.6% to 45.8% of reports.
• Companies with estimated liabilities of $250,000 or less fell from 52% to 45.8% of reports.
• Companies with unsecured creditors liability of $250,000 or less fell from 66.3% to 59.6% of reports.
• Companies with estimated deficiencies of $250,000 or less fell from 54.7% to 48.8% of reports, while deficiencies of between $1 million and less than $5 million increased from 11.9% to 15.1% of reports.
• Companies with unpaid annual leave not being applicable fell from 75.2% to 72.1% of reports.
• Companies with unpaid pay in lieu of notice not being applicable fell from 87.6% to 84.5% of reports.
• Companies with unpaid superannuation not being applicable fell from 64.7% to 61.4% of reports.
• Companies with no secured creditor liability fell from 70.1% to 66.5% of reports.
Note: All other reported figures have not changed by three percentage points or more from the previous financial year.
Lodgements by region
27 The majority of reports in 2009–2010 related to New South Wales registered companies (3,850 reports or 48.7%), followed by Victoria (1,855 reports or

REPORT 225: Insolvency statistics: External administrators’ reports 1 July 2007–30 June 2010
© Australian Securities and Investments Commission December 2010 Page 18
23.5%) and Queensland (1,373 reports or 17.4%). The five remaining states and territories made up 10.4% of reports.
Figure 3: Initial external administrators’ reports by region (1 July 2009–30 June 2010)
Note: Three companies with international registered addresses are not included in regional statistics.
Lodgement period
28 In the year ended 30 June 2010, 51.4% of reports were lodged within six months of the external administrator’s appointment, compared to 53.1% in the year ended 2009. Another 23% of reports were lodged more than 12 months after appointment: see Table 5.
29 The result may be distorted by instances where the first electronically lodged report was not the first report lodged.
Table 5: Initial external administrators’ reports by lodgement period (1 July 2009–30 June 2010)
No. %
Less than 2 months 982 12.4%
Between 2 and 5 months 3,084 39.0%
Between 6 and 12 months 2,016 25.5%
More than 12 months 1,821 23.0%
Total 7,903 100.0%
Note: Liquidators appointed from 1 January 2008 must lodge reports as soon as practicable, and in any event within six months, after it so appears to him or her that any of the conditions in s533 apply.

REPORT 225: Insolvency statistics: External administrators’ reports 1 July 2007–30 June 2010
© Australian Securities and Investments Commission December 2010 Page 19
Section lodged under
30 Most reports in 2009–2010 (95%) were lodged by liquidators for the purpose of complying with s533 of the Corporations Act: see Table 6.
Table 6: Initial external administrators’ reports by section of the Corporations Act (1 July 2009–30 June 2010)
No. %
Section 422 (reports by receiver) 89 1.1%
Section 438D (reports by administrator) 296 3.7%
Section 533 (reports by liquidator) 7,506 95.0%
Statistical purposes 12 0.2%
Total 7,903 100.0%
Size of company
31 The number of employees or the number of full-time equivalent employees is used as a measure of the size of the company. In 2009–2010, 76.7% of reports related to companies with less than 20 employees: see Table 7.
Table 7: Initial external administrators’ reports—Size of company as measured by number of FTEs (1 July 2009–30 June 2010)
No. %
Less than 5 FTE 4,766 60.3%
Between 5 and 19 FTE 1,296 16.4%
Between 20 and 199 FTE 392 5.0%
200 or more FTE 28 0.4%
Not known 1,421 18.0%
Total 7,903 100.0%
Note: FTE = Full-time equivalent employees.
Industry
32 In 2009–2010, the three industries with the highest number of reports lodged were Construction (1,905 reports or 24.1%), Other (business & personal) services (1,735 reports or 22%) and Retail trade (818 reports or 10.4%).
33 The top 12 industries are the same as for 2008–2009, but with some changes in the order of ranking.

REPORT 225: Insolvency statistics: External administrators’ reports 1 July 2007–30 June 2010
© Australian Securities and Investments Commission December 2010 Page 20
Table 8: Initial external administrators’ reports by industry type (1 July 2009–30 June 2010)
No. %
Construction 1,905 24.1%
Other (business & personal) services 1,735 22.0%
Retail trade 818 10.4%
Accommodation & food services 561 7.1%
Manufacturing 511 6.5%
Transport, postal & warehousing 472 6.0%
Information media & telecommunications 254 3.2%
Rental, hiring & real estate services 234 3.0%
Wholesale trade 227 2.9%
Financial & insurance services (FIS)—Other financial services 203 2.6%
Professional, scientific & technical services 159 2.0%
Agriculture, forestry & fishing 147 1.9%
Financial & insurance services (FIS)—Managed investments 112 1.4%
Arts & recreation services 108 1.4%
Health care & social assistance 108 1.4%
Electricity, gas, water & waste services 97 1.2%
Mining 86 1.1%
Administrative & support services 71 0.9%
Education & training 49 0.6%
Financial & insurance services (FIS)—Credit provider 19 0.2%
Public administration & safety 13 0.2%
Financial & insurance services (FIS)—Insurance 12 0.2%
Financial & insurance services (FIS)—Superannuation 2 0.0%
Total 7,903 100.0%
Note 1: No reports were received from Financial & insurance services (FIS)—Deposit taking institutions.
Note 2: A number of amendments to the Schedule B report format were implemented effective from 1 July 2008, including changes to industry categories which were updated to align with 2006 ANZSIC divisions. ANZSIC divisions are classified into subdivisions, group and classes. The large number of changes made at subdivision and group level make comparison of industry data pre- and post-1 July 2008 less accurate. For details, see Section B and Figure 1 in this report.

REPORT 225: Insolvency statistics: External administrators’ reports 1 July 2007–30 June 2010
© Australian Securities and Investments Commission December 2010 Page 21
Nominated causes of failure
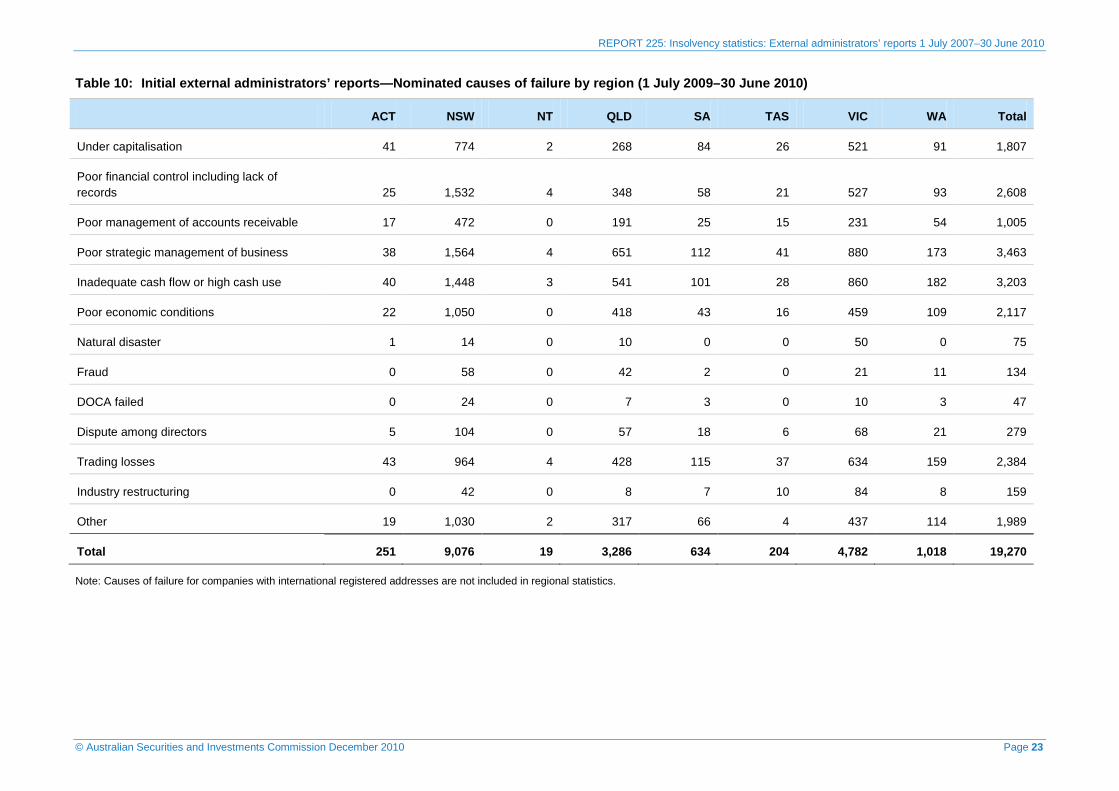
34 There is commonly more than one reason for a company’s failure. External administrators nominated an average of 2.44 causes of failure per report in 2009–2010.
35 The top three nominated causes of failure for companies (see Table 9 and Table 10) were:
poor strategic management of business (3,463 or 43.8% of reports);
inadequate cash flow or high cash use (3,205 or 40.6% of reports); and
poor financial control including lack of records (2,609 or 33% of reports).
36 Of the top 12 industries, the three industries which most exceeded the percentage of reports for these three causes of failure were:
poor strategic management of business: Wholesale trade (47.6% of reports), Accommodation & food services (47.4% of reports) and Manufacturing (46.2% of reports);
Note: A number of industries grouped in the ‘Other industries’ category exceeded the average 43.8% of reports for poor strategic management of business. The top six of these were Public administration & safety (69.2% of reports), FIS—Managed investments (61.6% of reports), Arts & recreation services (55.6% of reports), FIS—Insurance services and FIS—Superannuation (50% of reports each), and Administrative & support services (47.9% of reports).
inadequate cash flow or high cash use: FIS—Other financial services (50.7% of reports), Retail trade (47.2% of reports) and Manufacturing (44.8% of reports);
Note: The following five industries grouped in the ‘Other industries’ category exceeded the average 40.6% of reports for inadequate cash flow or high cash use: FIS—Managed investments (59.8% of reports), Education & training (51% of reports), Administrative & support services (45.1% of reports), Health care & social assistance (42.6% of reports) and Arts & recreation services (40.7% of reports).
poor financial control including lack of records: Other (business & personal) (38.4% of reports), Transport, postal & warehousing (36.9% of reports), and Accommodation & food services (36% of reports).
37 No region shared all of the same top three causes as for industry. The three largest states (New South Wales, Victoria and Queensland) did share the same top cause as per industry, being poor strategic management of business. See Table 10.

REPORT 225: Insolvency statistics: External administrators’ reports 1 July 2007–30 June 2010
© Australian Securities and Investments Commission December 2010 Page 22
Table 9: Initial external administrators’ reports—Nominated causes of failure by industry (1 July 2009–30 June 2010)
Con
stru
ctio
n
Oth
er (b
usin
ess
&
pers
onal
) ser
vice
s
Ret
ail t
rade
Acc
omm
odat
ion
&
food
ser
vice
s
Man
ufac
turin
g
Tran
spor
t, po
stal
&
war
ehou
sing
Info
rmat
ion
med
ia &
te
leco
mm
unic
atio
ns
Ren
tal,
hirin
g &
real
es
tate
ser
vice
s
Who
lesa
le tr
ade
FIS—
Oth
er fi
nanc
ial
serv
ices
Prof
essi
onal
, sc
ient
ific
& te
chni
cal
serv
ices
Agr
icul
ture
, for
estr
y &
fis
hing
Oth
er in
dust
ries
Tota
l
Under capitalisation 428 284 222 135 129 91 66 57 44 84 40 41 186 1,807
Poor financial control including lack of records 672 667 254 202 129 174 54 67 65 47 49 50 179 2,609
Poor management of accounts receivable 323 179 59 32 100 81 37 19 41 14 27 17 76 1,005
Poor strategic management of business 839 746 353 266 236 207 107 89 108 65 59 58 330 3,463
Inadequate cash flow or high cash use 736 608 386 248 229 193 109 90 91 103 68 50 294 3,205
Poor economic conditions 503 351 264 147 169 126 75 75 64 87 26 43 187 2,117
Natural disaster 10 3 1 4 0 6 0 0 1 0 0 6 44 75
Fraud 24 24 12 7 15 4 4 10 5 2 2 2 23 134
DOCA failed 7 16 2 0 3 3 1 6 2 0 1 1 5 47
Dispute among directors 61 40 28 28 20 10 9 14 15 11 10 3 31 280
Trading losses 510 426 317 243 219 151 84 45 81 35 42 45 187 2,385
Industry restructuring 10 8 10 6 30 12 10 3 7 1 2 8 52 159
Other 466 443 215 113 114 93 84 60 56 47 41 45 213 1,990
Nominated causes of failure by industry 4,589 3,795 2,123 1,431 1,393 1,151 640 535 580 496 367 369 1,807 19,276
Note: ‘Other industries’ includes Administrative & support services, Arts & recreation services, Education & training, Electricity, gas, water & waste services, remaining Financial & insurance services sub-categories (Credit provider, Deposit taking institutions, Insurance, Managed investments and Superannuation), Health care & social assistance, Mining and Public administration & safety.
REPORT 225: Insolvency statistics: External administrators’ reports 1 July 2007–30 June 2010
© Australian Securities and Investments Commission December 2010 Page 23
Table 10: Initial external administrators’ reports—Nominated causes of failure by region (1 July 2009–30 June 2010)
ACT NSW NT QLD SA TAS VIC WA Total
Under capitalisation 41 774 2 268 84 26 521 91 1,807
Poor financial control including lack of records 25 1,532 4 348 58 21 527 93 2,608
Poor management of accounts receivable 17 472 0 191 25 15 231 54 1,005
Poor strategic management of business 38 1,564 4 651 112 41 880 173 3,463
Inadequate cash flow or high cash use 40 1,448 3 541 101 28 860 182 3,203
Poor economic conditions 22 1,050 0 418 43 16 459 109 2,117
Natural disaster 1 14 0 10 0 0 50 0 75
Fraud 0 58 0 42 2 0 21 11 134
DOCA failed 0 24 0 7 3 0 10 3 47
Dispute among directors 5 104 0 57 18 6 68 21 279
Trading losses 43 964 4 428 115 37 634 159 2,384
Industry restructuring 0 42 0 8 7 10 84 8 159
Other 19 1,030 2 317 66 4 437 114 1,989
Total 251 9,076 19 3,286 634 204 4,782 1,018 19,270
Note: Causes of failure for companies with international registered addresses are not included in regional statistics.

REPORT 225: Insolvency statistics: External administrators’ reports 1 July 2007–30 June 2010
© Australian Securities and Investments Commission December 2010 Page 24
Possible misconduct
38 Misconduct was alleged in more than two thirds of reports (5,438 or 68.8%) in 2009–2010. As possible misconduct is one of the main reasons for lodging reports, and major improvements were made to this area of the report from 1 July 2008, several tables have been provided on alleged misconduct.
39 External administrators reported 14,652 possible breaches at an average of 2.69 breaches per report where possible misconduct was reported: see Table 11.
Table 11: Initial external administrators’ reports—Possible misconduct (1 July 2009–30 June 2010)
No. of reports
% of reports
No. of breaches
No misconduct reported 2,465 31.2% 0
‘Possible misconduct’ reported 5,438 68.8% 14,652
Total 7,903 100.0% 14,652
40 As a result of reports lodged, we asked the external administrator to prepare either a supplementary s422, 438D or 533 report for 600 of the 5,438 reports (11%) for 2009–2010 where possible misconduct was identified. The request for an additional report is a function of our assessment of risk based on a number of inputs including, but not limited to, the nature of the possible misconduct reported, amount of the liabilities, deficiency suffered, availability of evidence, prior misconduct and the advice of the external administrator that the reported possible misconduct warrants further investigation.
41 Alleged criminal misconduct has been split between alleged misconduct occurring before the appointment of the external administrator (pre-appointment misconduct) and post-appointment misconduct related to directors’ and officers’ failure to assist the liquidator. In 2009–2010, 20.5% of all reported misconduct related to post-appointment misconduct: see Table 12.
42 Alleged breaches of civil obligations are the most common breaches (9,683 or 66.1% of all reported misconduct). For a detailed analysis of civil breaches by section of the Corporations Act, industry and region, see Table 17 and Table 19.

REPORT 225: Insolvency statistics: External administrators’ reports 1 July 2007–30 June 2010
© Australian Securities and Investments Commission December 2010 Page 25
Table 12: Initial external administrators’ reports—Categories of possible misconduct (1 July 2009–30 June 2010)
No. of breaches
% of breaches
Alleged criminal misconduct under Corporations Act by officers or employees:
pre-appointment criminal misconduct 1,725 11.8%
post-appointment criminal misconduct 3,002 20.5%
Alleged breaches of civil obligations 9,683 66.1%
Other criminal offences 76 0.5%
Other possible misconduct 166 1.1%
Total 14,652 100.0%
Note 1: ‘Other criminal offences’ includes breaches by a member or contributory under the Corporations Act or breaches under other Commonwealth statutes or state or territory laws.
Note 2: ‘Other possible misconduct’ relates to people who have taken part in the formation, promotion, administration, management or winding up of the company and may have:
misapplied or retained, or become liable or accountable for, any money or property of the company; or
been guilty of any negligence, default, breach of duty or trust in relation to the company.
Documentary evidence and further inquiry
43 External administrators confirmed they had documentary evidence for 3,263 reports (41.3%) for 2009–2010: see Table 14. Of these, they considered further inquiry into the alleged misconduct by us was warranted in only 885 reports, based on their assessment of the information and documentary evidence available.
44 Documentary evidence in the possession of a third party was identified in 485 reports. Based on this and their assessment, the external administrator recommended we make further inquiry in 233 reports.
Note: For 196 of the 233 reports where evidence was identified as being with a third party, the external administrator was also in possession of evidence. Therefore, these 196 reports were also included in the 885 reports where the external administrator recommended further inquiry.
45 Of the 885 reports where external administrators recommended further inquiry by ASIC, we requested supplementary reports (or Schedule C reports) for 335 reports (37.9%), of which 98 reports related to deficiencies of $5 million or more. Of the remaining 550 reports where we did not request a supplementary report, only 52 reports (9.5%) related to deficiencies of $5 million or more: see Table 13. The amount of deficiency is only one input of our risk assessment model.

REPORT 225: Insolvency statistics: External administrators’ reports 1 July 2007–30 June 2010
© Australian Securities and Investments Commission December 2010 Page 26
Table 13: Initial external administrators’ reports—Evidence with liquidator and further inquiry recommended by deficiency categories (1 July 2009–30 June 2010)
Schedule C requested
Assessed & recorded
Total
$0–$50,000 16 37 53
$50,001–$250,000 51 143 194
$250,001–less than $500,000 47 95 142
$500,000–less than $1 million 42 79 121
$1 million–less than $5 million 81 144 225
$5 million–$10 million 22 31 53
Over $10 million 76 21 97
Total 335 550 885
46 A further 290 reports indicated that further inquiry was warranted. However, the breaches related to post-appointment criminal misconduct where a separate request for liquidator assistance is required. In addition, 262 reports indicated that further inquiry was required; however, no alleged misconduct was reported in those reports.
Table 14: Initial external administrators’ reports—Possible pre-appointment misconduct reported (1 July 2009–30 June 2010)
No. of reports
% of reports
No. of breaches
External administrator has documentary evidence to support allegation
Yes 3,263 41.3% 7,202
No 2,175 27.5% 4,448
Total 5,438 68.8% 11,650
Of those with documentary evidence, did they recommend further inquiry by ASIC?
Yes 885 11.2%
No 2,378 30.1%
Total 3,263 41.3%

REPORT 225: Insolvency statistics: External administrators’ reports 1 July 2007–30 June 2010
© Australian Securities and Investments Commission December 2010 Page 27
No. of reports
% of reports
No. of breaches
External administrator is aware of another person with documentary evidence
Yes 485 6.1% 1,367
No 4,953 62.7% 10,283
Total 5,438 68.8% 11,650
Where the evidence was with another person, did they recommend further inquiry by ASIC?
Yes 233 2.9%
No 252 3.2%
Total 485 6.1%
Note: ‘Pre-appointment misconduct’ refers to pre-appointment criminal misconduct, alleged breaches of civil obligations, other criminal offences and other possible misconduct.
Alleged criminal misconduct
Pre-appointment criminal misconduct
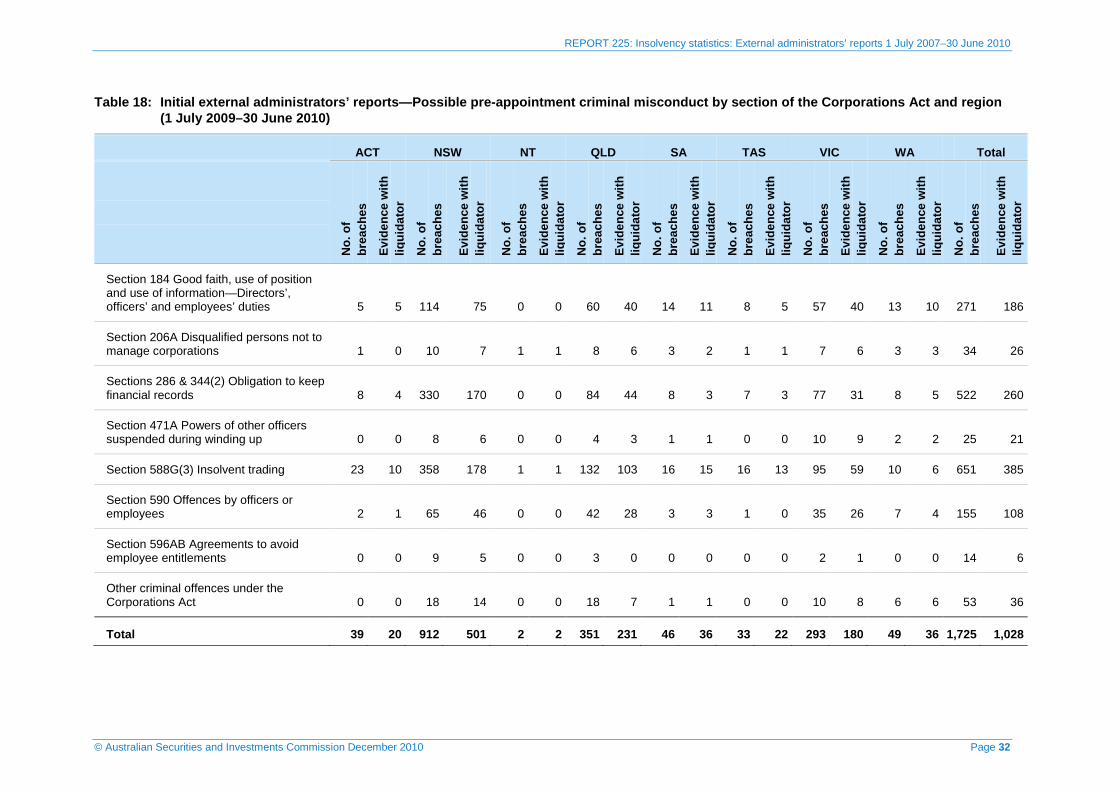
47 Statistics for alleged pre-appointment criminal misconduct are shown by industry and region: see Table 16 and Table 18. These tables also show the number of reports where the external administrator is able to advise that evidence is available. Pre-appointment criminal misconduct predominantly relates to the conduct of an officer or director of the company before the appointment of the external administrator.
48 External administrators had evidence in their possession for 1,028 possible criminal breaches out of 1,725 (59.6%) reported in 2009–2010. This compares with 67.7% in 2008–2009, a fall of 8.1 percentage points, indicating a higher rate of reporting breaches where external administrators had no evidence in their possession.
49 The top three nominated criminal breaches for companies for 2009–2010 were the same as in 2008–2009:
Section 588G(3) Insolvent trading: 651 breaches reported (8.2% of reports);
Sections 286 and 344(2) Obligation to keep financial records: 522 breaches reported (6.6% of reports); and
Section 184 Good faith, use of position and use of information: 271 breaches reported (3.4% of reports).

REPORT 225: Insolvency statistics: External administrators’ reports 1 July 2007–30 June 2010
© Australian Securities and Investments Commission December 2010 Page 28
50 Of the top 12 industries, the three industries which most exceeded the percentage of reports for these three nominated criminal breaches were:
Section 588G(3) Insolvent trading: Agriculture, forestry & fishing (10.2% of reports), Manufacturing (9.8% of reports) and FIS—Other financial services (9.4% of reports);
Sections 286 and 344(2) Obligation to keep financial records: Construction (8.4% of reports), Agriculture, forestry & fishing (8.2% of reports) and Transport, postal, & warehousing (6.8% of reports); and
Section 184 Good faith, use of position and use of information: FIS—Other financial services (6.9% of reports), Information media & telecommunications (5.9% of reports) and Rental, hiring & real estate services (4.3% of reports).
Note: A number of industries grouped in the ‘Other industries’ category exceeded the average 3.4% of reports for Section 184 Good faith, use of position and use of information. The top six of these were FIS—Managed investments (11.6% of reports), FIS—Credit provider (10.5% of reports), Health care & social assistance (9.3% of reports), Mining (6.1% of reports), Arts & recreation services (4.6% of reports) and Electricity, gas, water & waste services (4.2% of reports).
Post-appointment criminal misconduct
51 Alleged post-appointment criminal misconduct reported by external administrators relates to officers of the company failing to assist external administrators subsequent to the appointment of the external administrator: see Table 15. The 3,002 post-appointment breaches related to 1,541 reports (19.5%).
52 We assist external administrators in obtaining compliance by officers with their obligations to prepare a report as to company’s affairs, provide books and records, and assist liquidators through our liquidator assistance program.
Table 15: Initial external administrators’ reports—Possible post-appointment criminal misconduct reported by section of the Corporations Act (1 July 2009–30 June 2010)
No. of breaches
Sections 429, 438B,446C & 475 Report as to company’s affairs 948
Section 530A Officers to help liquidator 855
Section 530B Requirement to provide liquidator with company’s books 1,199
Total 3,002
Note: The Schedule B report format does not require external administrators to advise whether or not evidence is available given the nature of the misconduct being reported.

REPORT 225: Insolvency statistics: External administrators’ reports 1 July 2007–30 June 2010
© Australian Securities and Investments Commission December 2010 Page 29
Alleged breaches of civil obligations
53 Statistics for alleged breaches of civil obligations are available by industry and region: see Table 17 and Table 19. The tables also show the number of reports where the external administrator is able to advise evidence is available. External administrators had evidence in their possession for 5,992 possible breaches of civil obligations out of 9,682 (61.8%) reported.
54 The top three nominated civil breaches for companies for 2009–2010 were:
Section 588G(1)–(2) Insolvent trading: 3,619 breaches reported (45.8% of reports);
Sections 286 and 344(1) Obligation to keep financial records: 2,944 breaches reported (37.3% of reports); and
Section 180 Care and diligence—Directors’ and officers’ duties: 1,398 breaches reported (17.7% of reports).
55 Of the top 12 industries, the three industries which most exceeded the percentage of reports for these three nominated breaches of civil obligations were:
Section 588G(1)–(2) Insolvent trading: FIS—Other financial services (60.6% of reports), Professional, scientific & technical services (56% of reports) and Transport, postal & warehousing (51.1% of reports);
Sections 286 and 344(1) Obligation to keep financial records: FIS—Other financial services (52.2% of reports), Other (business & personal) services (42.7% of reports) and Construction (41.6% of reports); and
Section 180 Care and diligence—Directors’ and officers’ duties: FIS—Other financial services (39.9% of reports), Professional, scientific & technical services (19.5% of reports) and Wholesale trade (19.4% of reports).
Note: A number of industries grouped in the ‘Other industries’ category exceeded the average 17.7% of reports for Section 180 Care and diligence—Directors’ and officers’ duties. The top six of these were FIS—Superannuation (50% of reports), FIS—Managed investments (31.3% of reports), Electricity, gas, water & waste services and FIS—Insurance (25% of reports each), Mining (22.1% of reports) and FIS—Credit provider (21.1% of reports).

REPORT 225: Insolvency statistics: External administrators’ reports 1 July 2007–30 June 2010
© Australian Securities and Investments Commission December 2010 Page 30
Table 16: Initial external administrators’ reports—Possible pre-appointment criminal misconduct by section of the Corporations Act and industry (1 July 2009–30 June 2010)
Con
stru
ctio
n
Oth
er (b
usin
ess
&
pers
onal
) ser
vice
s
Ret
ail t
rade
Acc
omm
odat
ion
& fo
od
serv
ices
Man
ufac
turin
g
Tran
spor
t, po
stal
&
war
ehou
sing
Info
rmat
ion
med
ia &
te
leco
mm
unic
atio
ns
Ren
tal,
hirin
g &
real
es
tate
ser
vice
s
Who
lesa
le tr
ade
FIS—
Oth
er fi
nanc
ial
serv
ices
Prof
essi
onal
, sci
entif
ic &
te
chni
cal s
ervi
ces
Agr
icul
ture
, for
estr
y &
fis
hing
Oth
er in
dust
ries
Tota
l
Section 184 Good faith, use of position and use of information—Directors’, officers’ and employees’ duties
57 47 28 13 21 11 15 10 5 14 2 5 43 271
Section 206A Disqualified persons not to manage corporations
8 5 1 3 3 2 2 3 1 1 1 2 2 34
Sections 286 & 344(2) Obligation to keep financial records
160 114 50 32 25 32 15 15 11 13 9 12 34 522
Section 471A Powers of other officers suspended during winding up
9 2 0 1 5 4 0 0 1 0 0 1 2 25
Section 588G(3) Insolvent trading 169 152 62 48 50 39 19 12 13 19 12 15 41 651
Section 590 Offences by officers or employees
32 24 11 7 19 11 7 10 6 4 2 1 21 155
Section 596AB Agreements to avoid employee entitlements
0 2 2 1 2 1 0 0 0 1 0 0 5 14
Other criminal offences under the Corporations Act
7 17 2 1 5 2 0 4 4 2 0 0 9 53
Total for industry 442 363 156 106 130 102 58 54 41 54 26 36 157 1,725
Note: ‘Other industries’ includes Administrative & support services, Arts & recreation services, Education & training, Electricity, gas, water & waste services, remaining Financial & insurance services sub-categories (Credit provider, Deposit taking institutions, Insurance, Managed investments and Superannuation), Health care & social assistance, Mining and Public administration & safety.

REPORT 225: Insolvency statistics: External administrators’ reports 1 July 2007–30 June 2010
© Australian Securities and Investments Commission December 2010 Page 31
Table 17: Initial external administrators’ reports—Possible breaches of civil obligations by section of the Corporations Act and industry (1 July 2009–30 June 2010)
Con
stru
ctio
n
Oth
er (b
usin
ess
&
pers
onal
) ser
vice
s
Ret
ail t
rade
Acc
omm
odat
ion
&
food
ser
vice
s
Man
ufac
turin
g
Tran
spor
t, po
stal
&
war
ehou
sing
Info
rmat
ion
med
ia &
te
leco
mm
unic
atio
ns
Ren
tal ,
hiri
ng &
real
es
tate
ser
vice
s
Who
lesa
le tr
ade
FIS—
Oth
er fi
nanc
ial
serv
ices
Prof
essi
onal
, sc
ient
ific
& te
chni
cal
serv
ices
Agr
icul
ture
, for
estr
y &
fis
hing
Oth
er in
dust
ries
Tota
l
Section 180 Care and diligence—Directors’ and officers’ duties
314 283 145 86 82 72 46 37 44 81 31 26 151 1,398
Section 181 Good faith—Directors’ and officers’ duties
167 166 80 41 55 37 22 32 26 75 18 13 107 839
Section 182 Use of position—Directors’, officers’ and employees’ duties
122 97 59 27 51 30 25 25 21 71 7 4 87 626
Section 183 Use of information—Directors’, officers’ and employees’ duties
33 29 17 12 20 12 12 6 10 57 5 3 41 257
Sections 286 & 344(1) Obligation to keep financial records
793 740 250 213 138 190 65 84 73 106 61 44 187 2,944
Section 588G(1)–(2) Insolvent trading 896 770 354 264 237 241 129 85 105 123 89 59 267 3,619
Total for industry 2,325 2,085 905 643 583 582 299 269 279 513 211 149 840 9,683
Note: ‘Other industries’ includes Administrative & support services, Arts & recreation services, Education & training, Electricity, gas, water & waste services, remaining Financial & insurance services sub-categories (Credit provider, Deposit taking institutions, Insurance, Managed investments and Superannuation), Health care & social assistance, Mining and Public administration & safety.
REPORT 225: Insolvency statistics: External administrators’ reports 1 July 2007–30 June 2010
© Australian Securities and Investments Commission December 2010 Page 32
Table 18: Initial external administrators’ reports—Possible pre-appointment criminal misconduct by section of the Corporations Act and region (1 July 2009–30 June 2010)
ACT NSW NT QLD SA TAS VIC WA Total
No.
of
brea
ches
Evid
ence
with
liq
uida
tor
No.
of
brea
ches
Evid
ence
with
liq
uida
tor
No.
of
brea
ches
Evid
ence
with
liq
uida
tor
No.
of
brea
ches
Evid
ence
with
liq
uida
tor
No.
of
brea
ches
Evid
ence
with
liq
uida
tor
No.
of
brea
ches
Evid
ence
with
liq
uida
tor
No.
of
brea
ches
Evid
ence
with
liq
uida
tor
No.
of
brea
ches
Evid
ence
with
liq
uida
tor
No.
of
brea
ches
Evid
ence
with
liq
uida
tor
Section 184 Good faith, use of position and use of information—Directors’, officers’ and employees’ duties 5 5 114 75 0 0 60 40 14 11 8 5 57 40 13 10 271 186
Section 206A Disqualified persons not to manage corporations 1 0 10 7 1 1 8 6 3 2 1 1 7 6 3 3 34 26
Sections 286 & 344(2) Obligation to keep financial records 8 4 330 170 0 0 84 44 8 3 7 3 77 31 8 5 522 260
Section 471A Powers of other officers suspended during winding up 0 0 8 6 0 0 4 3 1 1 0 0 10 9 2 2 25 21
Section 588G(3) Insolvent trading 23 10 358 178 1 1 132 103 16 15 16 13 95 59 10 6 651 385
Section 590 Offences by officers or employees 2 1 65 46 0 0 42 28 3 3 1 0 35 26 7 4 155 108
Section 596AB Agreements to avoid employee entitlements 0 0 9 5 0 0 3 0 0 0 0 0 2 1 0 0 14 6
Other criminal offences under the Corporations Act 0 0 18 14 0 0 18 7 1 1 0 0 10 8 6 6 53 36
Total 39 20 912 501 2 2 351 231 46 36 33 22 293 180 49 36 1,725 1,028

REPORT 225: Insolvency statistics: External administrators’ reports 1 July 2007–30 June 2010
© Australian Securities and Investments Commission December 2010 Page 33
Table 19: Initial external administrators’ reports—Possible breaches of civil obligations by section of the Corporations Act and region (1 July 2009–30 June 2010)
ACT NSW NT QLD SA TAS VIC WA Total
No.
of
brea
ches
Evid
ence
with
liq
uida
tor
No.
of
brea
ches
Evid
ence
with
liq
uida
tor
No.
of
brea
ches
Evid
ence
with
liq
uida
tor
No.
of
brea
ches
Evid
ence
with
liq
uida
tor
No.
of
brea
ches
Evid
ence
with
liq
uida
tor
No.
of
brea
ches
Evid
ence
with
liq
uida
tor
No.
of
brea
ches
Evid
ence
with
liq
uida
tor
No.
of
brea
ches
Evid
ence
with
liq
uida
tor
No.
of
brea
ches
Evid
ence
with
liq
uida
tor
Section 180 Care and diligence—Directors’ and officers’ duties 32 27 689 378 2 1 231 153 54 39 17 14 277 182 96 73 1,398 867
Section 181 Good faith—Directors’ and officers’ duties 24 23 366 241 1 0 156 111 43 29 15 13 180 125 54 40 839 582
Section 182 Use of position—Directors’, officers’ and employees’ duties 24 21 263 203 0 0 114 81 22 20 11 10 145 118 47 38 626 491
Section 183 Use of information—Directors’, officers’ and employees’ duties 5 5 134 104 0 0 32 22 2 2 6 5 56 40 22 18 257 196
Sections 286 & 344(1) Obligation to keep financial records 30 21 1,840 852 1 0 317 202 53 40 15 9 619 352 68 48 2,943 1,524
Section 588G(1)–(2) Insolvent trading 62 46 1,995 1,109 4 3 425 328 113 92 27 23 829 599 164 132 3,619 2,332
Total 177 143 5,287 2,887 8 4 1,275 897 287 222 91 74 2,106 1,416 451 349 9,682 5,992
Note: Civil breaches for companies with international registered addresses are not included in region statistics.

REPORT 225: Insolvency statistics: External administrators’ reports 1 July 2007–30 June 2010
© Australian Securities and Investments Commission December 2010 Page 34
Other possible criminal offences
56 There were only 76 other possible criminal offences (0.5% of overall offences) by a member or contributory under the Corporations Act or other Commonwealth statutes or state or territory laws. Of the 76, only 55 were possible offences of laws other than under the Corporations Act: see Table 20.
Table 20: Initial external administrators’ reports—Other possible criminal offences (1 July 2009–30 June 2010)
No. of breaches
Evidence with liquidator
Evidence with other
Criminal offence under the Corporations Act (if a member or contributory) 21 17 10
Criminal offence under another Commonwealth statute 26 22 12
Criminal offence under a state or territory law 29 18 16
Total 76 57 38
Other possible misconduct
57 ‘Other possible misconduct’ relates to persons who have taken part in the formation, promotion, administration, management or winding up of the company: see Table 21. A further 166 instances of other possible misconduct were reported in 2009–2010 (1.1% of overall breaches).
Table 21: Initial external administrators’ reports—Other possible misconduct (1 July 2009–30 June 2010)
No. of
breaches Evidence with
liquidator Evidence
with other
May have misapplied or retained, or may have become liable or accountable for money or property of the company 69 44 23
May have been guilty of negligence, default, breach of duty or breach of trust in relation to the company 97 81 16
Total 166 125 39

REPORT 225: Insolvency statistics: External administrators’ reports 1 July 2007–30 June 2010
© Australian Securities and Investments Commission December 2010 Page 35
Referred to other authorities
58 For reports where possible misconduct was reported, 107 reports in 2009–2010 indicated the external administrator had or was intending to refer the matter to another authority. The highest three number of referrals were to state or territory police (30 reports), the Australian Tax Office (27 reports) and from the ‘Other’ category—Creditors (15 reports).
Books and records
59 External administrators indicated they had obtained or inspected the company’s books and records in 5,895 reports (74.6%) in 2009–2010. Of these, 3,504 reports indicated that the company’s books and records were considered adequate.
Assetless Administration Fund
60 In 2009–2010, 517 of the 7,506 reports by a liquidator (as noted in Table 6) indicated the liquidator had made or was intending to make an application for funding from the Assetless Administration Fund (AA Fund).
61 The AA Fund was established by the Australian Government and is administered by ASIC. It finances preliminary investigations and reports by liquidators into the failure of companies with few or no assets, where it appears to ASIC that enforcement action may result from the investigation and report. A particular focus of the AA Fund is to curb fraudulent phoenix activity.
Liabilities and assets
62 External administrators provide estimates of the assets, liabilities and overall financial deficiency of companies they are reporting on. Table 22 shows the assets and liabilities categories and Table 23 shows the deficiency for the top 12 industries by reports lodged (as noted in Table 8).
Assets
63 Most reports (60.9%) showed that the companies had estimated assets of $10,000 or less.
64 Of the top 12 industries, those with the greatest percentage of reports estimating assets of $10,000 or less were FIS—Other financial services (75.9%), Other (business & personal) services (69.5%) and Construction (64.5%).
65 In 39.3% (3,105) of reports, the external administrator estimated the administration was assetless. Of the top 12 industries, those that most exceeded this percentage for assetless administrations (39.3%) were FIS—

REPORT 225: Insolvency statistics: External administrators’ reports 1 July 2007–30 June 2010
© Australian Securities and Investments Commission December 2010 Page 36
Other financial services (57.6%), Other (business & personal) services (47%) and Rental, hiring & real estate services (45.7%).
66 On the other hand, 9.7% of reports estimated assets of over $250,000. Of the top 12 industries, those well above this percentage were Rental, hiring & real estate services (19.7%), Wholesale trade (18.9%) and Agriculture, forestry & fishing (17.7%).
Note: In the ‘Other industries’ category, FIS—Managed investments (28.6%), Mining (25.6%), FIS—Credit provider (21.1%), Health care & social assistance (13.9%) and Administrative & support services (11.3%) all exceeded this percentage across all industries (9.7%), but made up only 5% of all reports.
Liabilities
67 In the 2009–2010 financial year, 45.8% of reports indicated that the estimated liabilities of the failed companies were $250,000 or less and 75.5% indicated estimated liabilities less than $1 million.
68 Of the top 12 industries, those with the greatest percentage of companies with estimated liabilities of $250,000 or less were Other (business & personal) services (56.6%), Professional, scientific & technical services (50.9%) and Transport, postal & warehousing (50.8%).
69 A comparison of those industries with estimated liabilities over $10 million reveals that the proportion of reports in that category across all industries (4.2%) was exceeded by FIS—Other financial services (27.6%), Agriculture, forestry & fishing (6.1%) and Rental, hiring & real estate services (5.1%).
Note: In the ‘Other industries’ category, FIS—Managed investments (42%), FIS—Credit provider (26.3%), Mining (25.6%) and Arts & recreation services (13%) all exceeded this percentage across all industries (4.2%), but made up only 4.1% of all reports.
Deficiency
70 Across all industries, 48.8% of reports estimated the shortfall between estimated assets and estimated liabilities was $250,000 or less. When comparing the deficiency estimates between the top 12 industries, the three industries with the highest percentage of estimates at $250,000 or less were Other (business & personal) services (58.8%), Transport, postal & warehousing (54.4%) and Professional, scientific & technical services (53.5%).
71 Only 3.8% of all reports estimated a deficiency of over $10 million. Of the top 12 industries, the industry which most exceeded this percentage was FIS—Other financial services (28.1%).
Note: Four industries grouped in the ‘Other industries’ category exceeded this percentage across all industries (3.8%): FIS—Managed investments (42%), FIS—Credit provider (26.3%), Mining (25.6%) and Arts & recreation services (13%). However, when combined, these industries made up only 4.1% of reports.

REPORT 225: Insolvency statistics: External administrators’ reports 1 July 2007–30 June 2010
© Australian Securities and Investments Commission December 2010 Page 37
Table 22: Initial external administrators’ reports—Amount of assets and liabilities by industry (1 July 2009–30 June 2010)
Con
stru
ctio
n
Oth
er (b
usin
ess
&
pers
onal
) ser
vice
s
Ret
ail t
rade
Acc
omm
odat
ion
& fo
od
serv
ices
Man
ufac
turin
g
Tran
spor
t, po
stal
&
war
ehou
sing
Info
rmat
ion
med
ia &
te
leco
mm
unic
atio
ns
Ren
tal,
hirin
g &
real
es
tate
ser
vice
s
Who
lesa
le tr
ade
FIS—
Oth
er fi
nanc
ial
serv
ices
Prof
essi
onal
, sci
entif
ic
& te
chni
cal s
ervi
ces
Agr
icul
ture
, for
estr
y &
fis
hing
Oth
er in
dust
ries
Tota
l
% o
f tot
al
Asset categories
Less than $1 760 816 300 214 126 170 65 107 52 117 59 58 261 3,105 39.3%
$1–$10,000 468 390 186 94 86 102 77 31 50 37 39 17 130 1,707 21.6%
$10,001–$20,000 149 145 79 68 52 49 24 17 20 8 13 13 58 695 8.8%
$20,001–$30,000 69 66 31 38 15 22 6 7 6 9 8 5 28 310 3.9%
$30,001–$50,000 72 80 63 31 45 27 15 10 14 5 7 7 28 404 5.1%
$50,001–$100,000 96 76 69 37 48 31 20 11 20 7 12 10 37 474 6.0%
$100,001–$250,000 91 67 45 30 60 40 23 5 22 5 8 11 35 442 5.6%
$250,001–$5 million 173 90 43 44 75 30 24 39 42 14 13 21 73 681 8.6%
Over $5 million 27 5 2 5 4 1 0 7 1 1 0 5 27 85 1.1%
Total for industry 1,905 1,735 818 561 511 472 254 234 227 203 159 147 677 7,903 100.0%
Liability categories
$1–$250,000 878 982 359 281 159 240 106 79 72 68 81 51 260 3,616 45.8%
$250,001–less than $1 million 547 480 302 180 178 149 80 65 78 41 39 35 180 2,354 29.8%
$1 million–less than $5 million 336 212 133 77 136 72 38 66 60 27 29 38 110 1,334 16.9%
$5 million–$10 million 69 41 10 8 20 7 21 12 10 11 6 14 35 264 3.3%
Over $10 million 75 20 14 15 18 4 9 12 7 56 4 9 92 335 4.2%
Total for industry 1,905 1,735 818 561 511 472 254 234 227 203 159 147 677 7,903 100.0%
Note: ‘Other industries’ includes Administrative & support services, Arts & recreation services, Education & training, Electricity, gas, water & waste services, remaining Financial & insurance services sub-categories (Credit provider, Deposit taking institutions, Insurance, Managed investments and Superannuation), Health care & social assistance, Mining and Public administration & safety.

REPORT 225: Insolvency statistics: External administrators’ reports 1 July 2007–30 June 2010
© Australian Securities and Investments Commission December 2010 Page 38
Table 23: Initial external administrators’ reports—Amount of deficiency by industry (1 July 2009–30 June 2010)
Con
stru
ctio
n
Oth
er (b
usin
ess
&
pers
onal
) ser
vice
s
Ret
ail t
rade
Acc
omm
odat
ion
& fo
od
serv
ices
Man
ufac
turin
g
Tran
spor
t, po
stal
&
war
ehou
sing
Info
rmat
ion
med
ia &
te
leco
mm
unic
atio
ns
Ren
tal,
hirin
g &
real
es
tate
ser
vice
s
Who
lesa
le tr
ade
FIS—
Oth
er fi
nanc
ial
serv
ices
Prof
essi
onal
, sci
entif
ic
& te
chni
cal s
ervi
ces
Agr
icul
ture
, for
estr
y &
fis
hing
Oth
er in
dust
ries
Tota
l
% o
f tot
al
$0–$50,000 358 427 128 94 38 91 25 27 27 18 24 22 101 1,380 17.5%
$50,001–$250,000 570 593 253 204 140 166 90 62 60 56 61 37 181 2,473 31.3%
$250,001–less than $500,000 322 296 169 104 102 84 37 37 39 17 22 15 97 1,341 17.0%
$500,000–less than $1 million 227 174 127 74 80 59 38 31 39 17 17 19 80 982 12.4%
$1 million–less than $5 million 310 192 118 65 118 64 38 56 50 27 25 33 100 1,196 15.1%
$5 million–$10 million 61 33 10 7 20 4 17 11 8 11 6 15 29 232 2.9%
Over $10 million 57 20 13 13 13 4 9 10 4 57 4 6 89 299 3.8%
Total for industry 1,905 1,735 818 561 511 472 254 234 227 203 159 147 677 7,903 100.0%
Note: ‘Other industries’ includes Administrative & support services, Arts & recreation services, Education & training, Electricity, gas, water & waste services, remaining Financial & insurance services sub-categories (Credit provider, Deposit taking institutions, Insurance, Managed investments and Superannuation), Health care & social assistance, Mining and Public administration & safety.

REPORT 225: Insolvency statistics: External administrators’ reports 1 July 2007–30 June 2010
© Australian Securities and Investments Commission December 2010 Page 39
Employee entitlements
72 In all categories of employee entitlements (i.e. wages, annual leave, pay in lieu of notice, redundancy, long service leave and superannuation), ‘Not applicable’ was selected in the majority of reports: see Table 24 and Table 25. ‘Not applicable’ means that no amount of entitlement of that type was unpaid to employee creditors as at the date of the appointment of the external administrator.
Table 24: Initial external administrators’ reports—Amounts owed in unpaid employee entitlements (1 July 2009–30 June 2010)
Unpaid wages Unpaid
annual leave Unpaid pay in lieu of notice
Unpaid redundancy
Unpaid long service leave
No. % No. % No. % No. % No. %
$1–$1,000 302 3.8% 217 2.8% 212 2.7% 189 2.4% 191 2.4%
$1,001–$10,000 1,009 12.8% 996 12.7% 472 6.0% 182 2.3% 213 2.7%
$10,001–$50,000 464 5.9% 672 8.5% 362 4.6% 219 2.8% 245 3.1%
$50,001–$150,000 132 1.7% 210 2.7% 110 1.4% 126 1.6% 72 0.9%
$150,001–$250,000 44 0.6% 51 0.6% 25 0.3% 41 0.5% 31 0.4%
$250,001–$500,000 24 0.3% 22 0.3% 10 0.1% 24 0.3% 12 0.2%
$500,001–less than $1.5 million 9 0.1% 15 0.2% 11 0.1% 21 0.3% 7 0.1%
$1.5 million–$5 million 1 0.0% 9 0.1% 7 0.1% 8 0.1% 3 0.0%
Over $5 million 1 0.0% 2 0.0% 9 0.1% 11 0.1% 3 0.0%
Not applicable 5,886 74.8% 5,678 72.1% 6,654 84.5% 7,051 89.6% 7,095 90.1%
Total 7,872 100.0% 7,872 100.0% 7,872 100.0% 7,872 100.0% 7,872 100.0%
Note: 31 reports identified as being internally inconsistent were excluded from this table.
Unpaid wages
73 74.8% of reports showed unpaid wages as not applicable. In 16.7% of reports, it was estimated that employees were owed $1 to $10,000 in unpaid wages. Categories from $10,001 to over $5 million made up 8.6% of reports.
Unpaid annual leave
74 In all, 72.1% of reports showed unpaid annual leave as not applicable. In 15.4% of cases, employees were owed $1 to $10,000, and 23.9% of companies owed $50,000 or less. 3.9% of reports showed entitlements for unpaid annual leave over $50,000.

REPORT 225: Insolvency statistics: External administrators’ reports 1 July 2007–30 June 2010
© Australian Securities and Investments Commission December 2010 Page 40
Unpaid pay in lieu of notice
75 Again, unpaid pay in lieu of notice was not applicable in most cases (84.5%). Only 2.2% of reports showed entitlements for unpaid pay in lieu of notice over $50,000.
Unpaid redundancy
76 Unpaid redundancy was not applicable in 89.6% of reports. In all, 4.7% of reports showed employees were owed $1 to $10,000 in redundancy payments.
77 Only 0.1% of reports showed unpaid redundancy of over $5 million.
Unpaid long service leave
78 5.1% of reports showed employees were owed $1 to $10,000 in unpaid long service leave, and unpaid long service leave of $1.5 million or more was estimated in only 0.1% of reports.
79 The majority of reports (90.1%) indicated a long service leave debt was not applicable.
Unpaid superannuation
80 Due to the different value categories of superannuation entitlements, these figures are shown separately in Table 25. The results show a similar pattern to other employee entitlements with a large number (61.4%) of reports showing unpaid superannuation as not applicable.
Table 25: Initial external administrators’ reports—Amounts owed in unpaid superannuation entitlements (1 July 2009–30 June 2010)
No. %
$1–$100,000 2,734 34.6%
$100,001–$250,000 232 2.9%
$250,001–$1 million 72 0.9%
Over $1 million 13 0.2%
Not applicable 4,852 61.4%
Total 7,903 100.0%
Note: No reports were identified as being internally inconsistent.
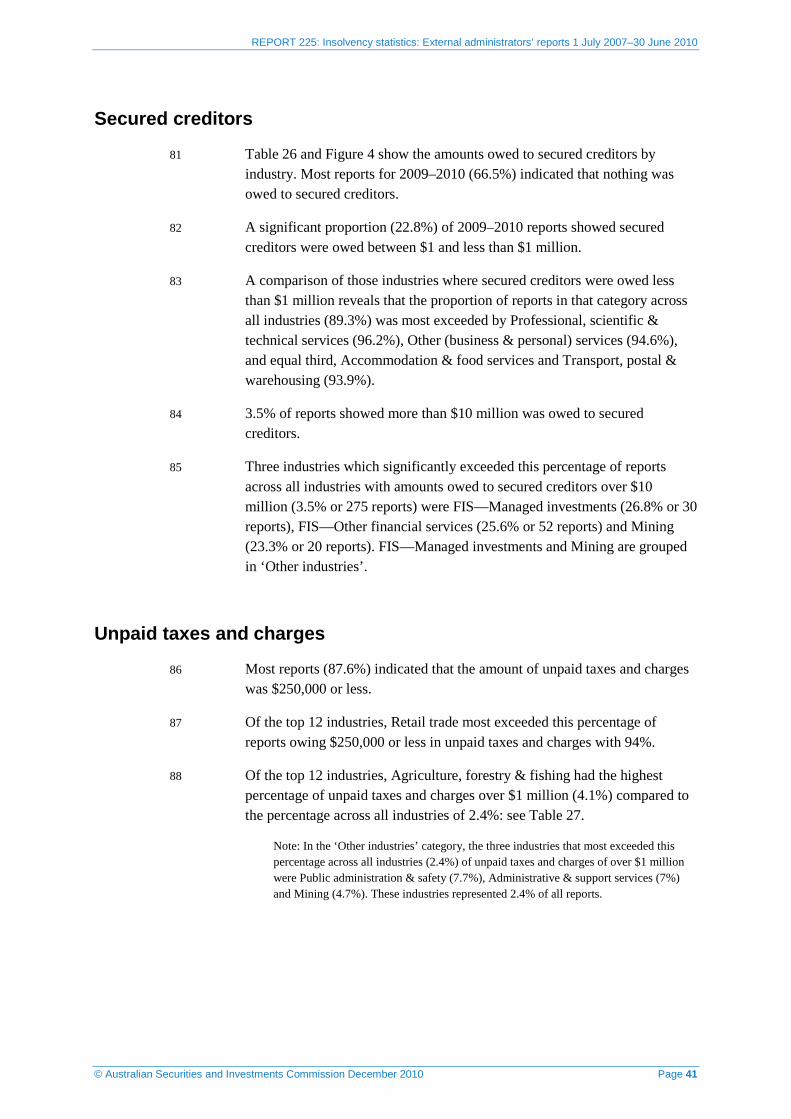
REPORT 225: Insolvency statistics: External administrators’ reports 1 July 2007–30 June 2010
© Australian Securities and Investments Commission December 2010 Page 41
Secured creditors
81 Table 26 and Figure 4 show the amounts owed to secured creditors by industry. Most reports for 2009–2010 (66.5%) indicated that nothing was owed to secured creditors.
82 A significant proportion (22.8%) of 2009–2010 reports showed secured creditors were owed between $1 and less than $1 million.
83 A comparison of those industries where secured creditors were owed less than $1 million reveals that the proportion of reports in that category across all industries (89.3%) was most exceeded by Professional, scientific & technical services (96.2%), Other (business & personal) services (94.6%), and equal third, Accommodation & food services and Transport, postal & warehousing (93.9%).
84 3.5% of reports showed more than $10 million was owed to secured creditors.
85 Three industries which significantly exceeded this percentage of reports across all industries with amounts owed to secured creditors over $10 million (3.5% or 275 reports) were FIS—Managed investments (26.8% or 30 reports), FIS—Other financial services (25.6% or 52 reports) and Mining (23.3% or 20 reports). FIS—Managed investments and Mining are grouped in ‘Other industries’.
Unpaid taxes and charges
86 Most reports (87.6%) indicated that the amount of unpaid taxes and charges was $250,000 or less.
87 Of the top 12 industries, Retail trade most exceeded this percentage of reports owing $250,000 or less in unpaid taxes and charges with 94%.
88 Of the top 12 industries, Agriculture, forestry & fishing had the highest percentage of unpaid taxes and charges over $1 million (4.1%) compared to the percentage across all industries of 2.4%: see Table 27.
Note: In the ‘Other industries’ category, the three industries that most exceeded this percentage across all industries (2.4%) of unpaid taxes and charges of over $1 million were Public administration & safety (7.7%), Administrative & support services (7%) and Mining (4.7%). These industries represented 2.4% of all reports.

REPORT 225: Insolvency statistics: External administrators’ reports 1 July 2007–30 June 2010
© Australian Securities and Investments Commission December 2010 Page 42
Table 26: Initial external administrators’ reports—Amount owed to secured creditors by industry (1 July 2009–30 June 2010)
Con
stru
ctio
n
Oth
er (b
usin
ess
&
pers
onal
) ser
vice
s
Ret
ail t
rade
Acc
omm
odat
ion
&
food
ser
vice
s
Man
ufac
turin
g
Tran
spor
t, po
stal
&
war
ehou
sing
Info
rmat
ion
med
ia &
te
leco
mm
unic
atio
ns
Ren
tal,
hirin
g &
real
es
tate
ser
vice
s
Who
lesa
le tr
ade
FIS—
Oth
er fi
nanc
ial
serv
ices
Prof
essi
onal
, sci
entif
ic
& te
chni
cal s
ervi
ces
Agr
icul
ture
, for
estr
y &
fis
hing
Oth
er in
dust
ries
Tota
l
% o
f tot
al
$0 1,257 1,356 487 393 278 294 180 132 128 117 121 74 441 5,258 66.5%
$1–less than $500,000 362 238 201 111 144 124 42 41 56 17 25 27 99 1,487 18.8%
$500,000–less than $1 million 59 47 42 23 27 25 9 13 18 11 7 10 20 311 3.9%
$1 million–less than $5 million 121 70 35 19 40 26 11 30 15 6 5 24 37 439 5.6%
$5 million–$10 million 56 13 8 8 12 2 2 6 9 0 0 5 12 133 1.7%
Over $10 million 50 11 45 7 10 1 10 12 1 52 1 7 68 275 3.5%
Total for industry 1,905 1,735 818 561 511 472 254 234 227 203 159 147 677 7,903 100.0%
Note: ‘Other industries’ includes Administrative & support services, Arts & recreation services, Education & training, Electricity, gas, water & waste services, remaining Financial & insurance services sub-categories (Credit provider, Deposit taking institutions, Insurance, Managed investments and Superannuation), Health care & social assistance, Mining and Public administration & safety.

REPORT 225: Insolvency statistics: External administrators’ reports 1 July 2007–30 June 2010
© Australian Securities and Investments Commission December 2010 Page 43
Figure 4: Initial external administrators’ reports—Amount owed to secured creditors by industry (1 July 2009–30 June 2010)
Note: ‘Other industries’ includes Administrative & support services, Arts & recreation services, Education & training, Electricity, gas, water & waste services, remaining Financial & insurance services sub-categories (Credit provider, Deposit taking institutions, Insurance, Managed investments and Superannuation), Health care & social assistance, Mining and Public administration & safety.
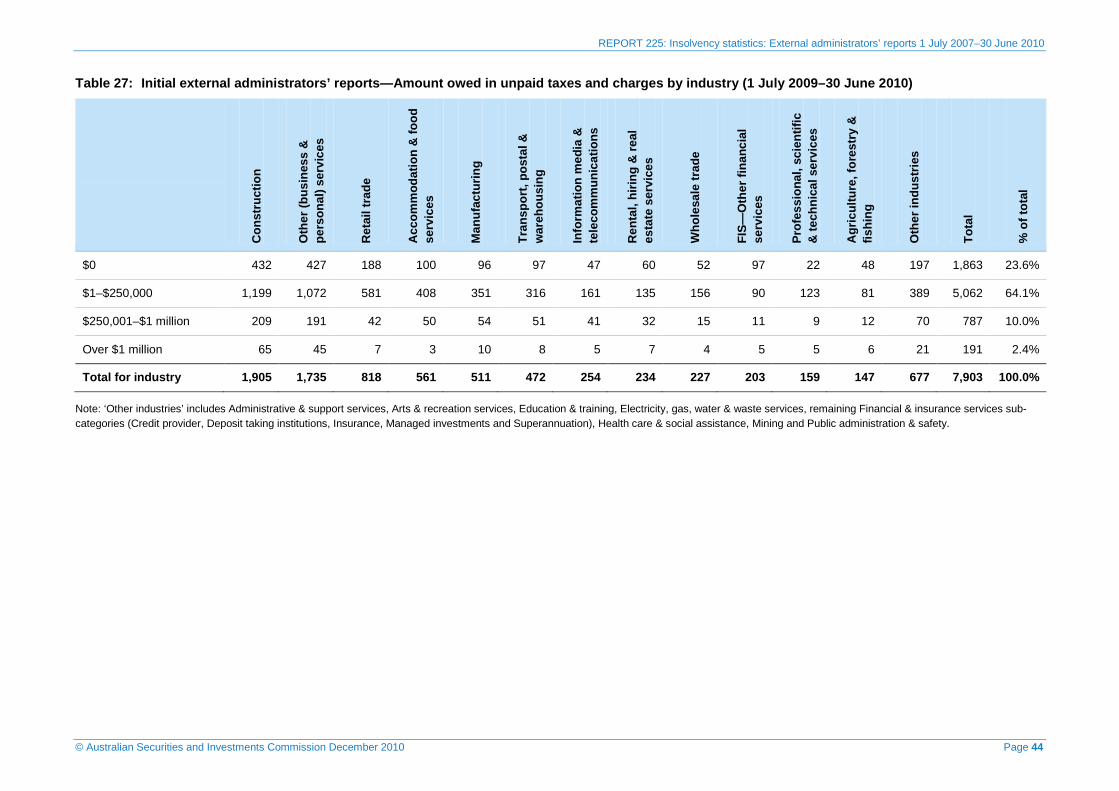
REPORT 225: Insolvency statistics: External administrators’ reports 1 July 2007–30 June 2010
© Australian Securities and Investments Commission December 2010 Page 44
Table 27: Initial external administrators’ reports—Amount owed in unpaid taxes and charges by industry (1 July 2009–30 June 2010)
Con
stru
ctio
n
Oth
er (b
usin
ess
&
pers
onal
) ser
vice
s
Ret
ail t
rade
Acc
omm
odat
ion
& fo
od
serv
ices
Man
ufac
turin
g
Tran
spor
t, po
stal
&
war
ehou
sing
Info
rmat
ion
med
ia &
te
leco
mm
unic
atio
ns
Ren
tal,
hirin
g &
real
es
tate
ser
vice
s
Who
lesa
le tr
ade
FIS—
Oth
er fi
nanc
ial
serv
ices
Prof
essi
onal
, sci
entif
ic
& te
chni
cal s
ervi
ces
Agr
icul
ture
, for
estr
y &
fis
hing
Oth
er in
dust
ries
Tota
l
% o
f tot
al
$0 432 427 188 100 96 97 47 60 52 97 22 48 197 1,863 23.6%
$1–$250,000 1,199 1,072 581 408 351 316 161 135 156 90 123 81 389 5,062 64.1%
$250,001–$1 million 209 191 42 50 54 51 41 32 15 11 9 12 70 787 10.0%
Over $1 million 65 45 7 3 10 8 5 7 4 5 5 6 21 191 2.4%
Total for industry 1,905 1,735 818 561 511 472 254 234 227 203 159 147 677 7,903 100.0%
Note: ‘Other industries’ includes Administrative & support services, Arts & recreation services, Education & training, Electricity, gas, water & waste services, remaining Financial & insurance services sub-categories (Credit provider, Deposit taking institutions, Insurance, Managed investments and Superannuation), Health care & social assistance, Mining and Public administration & safety.

REPORT 225: Insolvency statistics: External administrators’ reports 1 July 2007–30 June 2010
© Australian Securities and Investments Commission December 2010 Page 45
Unsecured creditors
Number of unsecured creditors
89 Most reports for 2009–2010 (86.3%) indicated the company had 50 or less unsecured creditors. Of the top 12 industries, those which had the greatest percentages of 50 or less unsecured creditors were FIS—Other financial services (93.6%), Professional, scientific & technical services (92.5%) and Other (business & personal) services (92.1%). See Table 28.
Amount owed to unsecured creditors
90 The majority (59.6%) of companies owed less than $250,000 to unsecured creditors. Of the top 12 industries, the three which had the greatest percentage of companies in this category were Other (business & personal) services (72.7%), Transport, postal & warehousing (67.6%) and Accommodation & food services (63.5%).
91 The three industries with the highest number of reports where companies owed more than $10 million to unsecured creditors were FIS—Other financial services (55 reports), FIS—Managed investments (33 reports), which is included in ‘Other Industries’, and Construction (20 reports).
Note: In the ‘Other industries’ category, Mining showed the fourth highest number of reports (18 reports) where companies owed more than $10 million to unsecured creditors.
Amounts owed to related parties
92 Of the total amount owed to unsecured creditors, 18.8% of lodgements reported that more than 50% of the debt was owed to related parties. Of the top 12 industries, those with the greatest percentage of reports showing more than 50% owed to related parties were Retail trade (25.3%), Manufacturing (24.9%) and Accommodation & food services (24.8%).
Note: Of those listed in ‘Other industries’, five exceeded this percentage across all industries (18.8%): Mining (47.7%), FIS—Credit provider (42.1%), Health care & social assistance (25.9%), FIS—Managed investments (23.2%) and Public administration & safety (23.1%).
Cents in the dollar dividend
93 In 2009–2010, the dividend estimated to be payable to unsecured creditors was less than 11 cents in the dollar for most reports (97.2%). Of the top 12 industries, the top three with an estimated return of less than 11 cents in the dollar were FIS—Other financial services (98.5%), Retail trade (97.9%), and equal third, Construction and Information media & telecommunications

REPORT 225: Insolvency statistics: External administrators’ reports 1 July 2007–30 June 2010
© Australian Securities and Investments Commission December 2010 Page 46
(97.6% each). ‘Other industries’ includes four industries where 100% estimated less than 11 cents in the dollar: Health care & social assistance (108 reports), Public administration & safety (13 reports), FIS—Insurance (12 reports) and FIS—Superannuation (2 reports).
94 Of the top 12 industries, the two industries with the greatest percentage of estimated returns of more than 50 cents in the dollar to unsecured creditors were Wholesale trade (1.3%) and FIS—Other financial services (1%), compared to the proportion across all industries of 0.6%: see Table 29.

REPORT 225: Insolvency statistics: External administrators’ reports 1 July 2007–30 June 2010
© Australian Securities and Investments Commission December 2010 Page 47
Table 28: Initial external administrators’ reports—Number of unsecured creditors, amount owed and reports where > 50% is owed to related parties by industry (1 July 2009–30 June 2010)
Con
stru
ctio
n
Oth
er (b
usin
ess
&
pers
onal
) ser
vice
s
Ret
ail t
rade
Acc
omm
odat
ion
&
food
ser
vice
s
Man
ufac
turin
g
Tran
spor
t, po
stal
&
war
ehou
sing
Info
rmat
ion
med
ia &
te
leco
mm
unic
atio
ns
Ren
tal,
hirin
g &
real
es
tate
ser
vice
s
Who
lesa
le tr
ade
FIS—
Oth
er fi
nanc
ial
serv
ices
Prof
essi
onal
, sci
entif
ic
& te
chni
cal s
ervi
ces
Agr
icul
ture
, for
estr
y &
fis
hing
Oth
er in
dust
ries
Tota
l
% o
f tot
al
Number of unsecured creditors
Less than 25 1,460 1,468 517 385 270 359 181 193 137 183 128 107 517 5,905 74.7%
25–50 180 130 165 92 108 51 29 18 45 7 19 14 54 912 11.5%
51–200 201 71 113 71 116 40 29 12 36 7 11 20 66 793 10.0%
More than 200 18 7 8 3 9 5 5 1 3 2 0 1 23 85 1.1%
Unknown 46 59 15 10 8 17 10 10 6 4 1 5 17 208 2.6%
Total for industry 1,905 1,735 818 561 511 472 254 234 227 203 159 147 677 7,903 100.0%
Amount owed to unsecured creditors
Less than $250,000 1,126 1,261 451 356 229 319 128 130 104 88 98 77 347 4,714 59.6%
$250,000–$500,000 270 207 151 82 95 60 43 34 43 18 21 17 87 1,128 14.3%
$500,001–less than $1 million 230 123 121 68 76 44 35 24 27 14 16 14 78 870 11.0%
$1 million–less than $5 million 229 121 84 43 92 45 31 38 45 19 18 28 92 885 11.2%
$5 million–$10 million 30 16 8 4 13 3 13 4 7 9 3 9 18 137 1.7%
Over $10 million 20 7 3 8 6 1 4 4 1 55 3 2 55 169 2.1%
Total for industry 1,905 1,735 818 561 511 472 254 234 227 203 159 147 677 7,903 100.0%
Amounts owed to related parties
> 50% owed to related parties 257 302 207 139 127 55 52 52 44 33 37 29 150 1,484 18.8%
% of reports lodged for industry 13.5% 17.4% 25.3% 24.8% 24.9% 11.7% 20.5% 22.2% 19.4% 16.3% 23.3% 19.7% 22.2%
Note: ‘Other industries’ includes Administrative & support services, Arts & recreation services, Education & training, Electricity, gas, water & waste services, remaining Financial & insurance services sub-categories (Credit provider, Deposit taking institutions, Insurance, Managed investments and Superannuation), Health care & social assistance, Mining and Public administration & safety.

REPORT 225: Insolvency statistics: External administrators’ reports 1 July 2007–30 June 2010
© Australian Securities and Investments Commission December 2010 Page 48
Table 29: Initial external administrators’ reports—Amount payable to unsecured creditors—Cents in the dollar dividend by industry (1 July 2009–30 June 2010)
Con
stru
ctio
n
Oth
er (b
usin
ess
&
pers
onal
) ser
vice
s
Ret
ail t
rade
Acc
omm
odat
ion
&
food
ser
vice
s
Man
ufac
turin
g
Tran
spor
t, po
stal
&
war
ehou
sing
Info
rmat
ion
med
ia &
te
leco
mm
unic
atio
ns
Ren
tal,
hirin
g &
real
es
tate
ser
vice
s
Who
lesa
le tr
ade
FIS—
Oth
er fi
nanc
ial
serv
ices
Prof
essi
onal
, sci
entif
ic
& te
chni
cal s
ervi
ces
Agr
icul
ture
, for
estr
y &
fis
hing
Oth
er in
dust
ries
Tota
l
% o
f tot
al
0 cents 1,785 1,646 735 510 460 432 231 224 205 190 149 137 636 7,340 92.9%
Greater than 0 but less than 11 cents 74 46 66 30 31 25 17 3 13 10 2 6 21 344 4.4%
11–20 cents 16 11 5 6 11 6 1 2 2 1 6 1 7 75 0.9%
21–50 cents 17 20 10 10 8 8 3 4 4 0 2 2 8 96 1.2%
51–100 cents 13 12 2 5 1 1 2 1 3 2 0 1 5 48 0.6%
Total for industry 1,905 1,735 818 561 511 472 254 234 227 203 159 147 677 7,903 100.0%
Note: ‘Other industries’ includes Administrative & support services, Arts & recreation services, Education & training, Electricity, gas, water & waste services, remaining Financial & insurance services sub-categories (Credit provider, Deposit taking institutions, Insurance, Managed investments and Superannuation), Health care & social assistance, Mining and Public administration & safety.

REPORT 225: Insolvency statistics: External administrators’ reports 1 July 2007–30 June 2010
© Australian Securities and Investments Commission December 2010 Page 49
Completion of external administration
95 In the opinion of external administrators, the majority of external administrations (70.1%) were expected to be completed within six months of the date of lodging their report. This was in addition to the time already taken to lodge the report. Table 5 in this section shows that 23% of reports were lodged more than 12 months after the external administrator’s appointment.
Table 30: Initial external administrators’ reports— Expected time to complete the external administration (1 July 2009–30 June 2010)
No. %
0–less than 3 months 2,927 37.0%
3–less than 6 months 2,616 33.1%
6 months–1 year 1,753 22.2%
Over 1 year 607 7.7%
Total 7,903 100.0%
Proposed action
Public examinations
96 In 207 reports (2.6%), the external administrator noted that they were intending to hold public examinations to question a company’s directors about the affairs of the company.
Recovery proceedings
97 Recovery proceedings for property or compensation for the benefit of creditors under Pt 5.7B of the Corporations Act either had been initiated or their initiation had been considered in 1,421 (18%) of all reports.
Company officers
98 External administrators advised in 456 reports (5.8%) that, in their opinion, there were shadow directors.

REPORT 225: Insolvency statistics: External administrators’ reports 1 July 2007–30 June 2010
© Australian Securities and Investments Commission December 2010 Page 50
External administrator’s remuneration
99 Excluding the $0 and not applicable results, the most common category of external administrator’s estimated collectible fees was liquidator fees, with 5,357 reports. Of these, 4,791 reports estimated collectible liquidator fees between $1 and $50,000.
100 Of the reports that completed the voluntary administration fees question, 873 estimated the collectible fees to be between $1 and $50,000.
Table 31: Initial external administrators’ reports—External administrator’s remuneration (1 July 2009–30 June 2010)
Voluntary
administration fees Deed of company arrangement fees Liquidator fees
Receiver/ controller fees
No. % No. % No. % No. %
$0 906 11.5% 921 11.7% 2,342 29.6% 937 11.9%
$1–$50,000 873 11.0% 119 1.5% 4,791 60.6% 36 0.5%
$50,001–$100,000 175 2.2% 9 0.1% 380 4.8% 22 0.3%
$100,001–$250,000 83 1.1% 6 0.1% 134 1.7% 14 0.2%
Over $250,000 37 0.5% 8 0.1% 52 0.7% 23 0.3%
Not applicable 5,829 73.8% 6,840 86.5% 204 2.6% 6,871 86.9%
Total 7,903 100.0% 7,903 100.0% 7,903 100.0% 7,903 100.0%
Note: More than one fee type may be entered if the appointee has been, is or expects to be appointed to more than one type of role in relation to the company.

REPORT 225: Insolvency statistics: External administrators’ reports 1 July 2007–30 June 2010
© Australian Securities and Investments Commission December 2010 Page 51
E Initial external administrators’ reports 2008–2009
101 For the year ended 30 June 2009, initial external administrators’ reports made up 92.4% (or 7,733 reports) of the total number of external administrator statutory reports lodged: see Table 2 and Table 3 in Section C. This compares to 89.9% (or 6,933 reports) in 2007–2008.
Key points
Initial external administrators’ reports disclosed the following material movements in 2008–2009 from the previous financial year:
• External administrators increased lodgement of reports within six months of appointment from 41.5% to 53% of reports. The number of reports lodged more than 12 months after their appointment decreased to 22.3% from 28.9% of reports.
• Companies where the number of employees is not known increased from 16.8% to 20.3% of reports.
• Reports of companies failing due to poor economic conditions increased from 9.1% to 16.6% of reports.
• Companies where the estimated liabilities were less than $1 million fell from 84% to 80.6% of reports.
• Companies with unpaid superannuation not being applicable fell from 68% to 64.7% of reports, while companies with unpaid superannuation of $1–$100,000 increased from 29.2% to 32.3% of reports.
• Companies where external administrators expected the time to completion was less than three months decreased from 40.5% to 36.6% of reports.
• The $0 remuneration category decreased for voluntary administrators (19.6% to 12.8%), deed administrators (23.9% to 13.4%) and receivers/controllers (24.1% to 13.7%).
• Remuneration category of $1–$50,000 for voluntary administrators decreased from 20.4% to 13.8%.
Note: All other reported figures have not changed by three percentage points or more from the previous financial year.
Lodgements by region
102 More than half the reports in 2008–2009 related to New South Wales registered companies (3,972 reports or 51.4%), followed by Victoria (1,772 reports or 22.9%) and Queensland (1,311 reports or 17%). The five remaining states and territories make up 8.7% of reports.

REPORT 225: Insolvency statistics: External administrators’ reports 1 July 2007–30 June 2010
© Australian Securities and Investments Commission December 2010 Page 52
Figure 5: Initial external administrators’ reports by region (1 July 2008–30 June 2009)
Note: Three companies with international registered addresses are not included in regional statistics.
Lodgement period
103 In the year ended 30 June 2009, 53% of reports were lodged within six months of the external administrator’s appointment. 22.3% were lodged more than 12 months after appointment: see Table 32.
104 The result may be distorted by instances where the first electronically lodged report was not the first report lodged.
Table 32: Initial external administrators’ reports by lodgement period (1 July 2008–30 June 2009)
No. %
Less than 2 months 963 12.5%
Between 2 and 5 months 3,138 40.6%
Between 6 and 12 months 1,910 24.7%
More than 12 months 1,722 22.3%
Total 7,733 100.0%
Note: Liquidators appointed from 1 January 2008 must lodge reports as soon as practicable, and in any event within six months, after it so appears to him or her that any of the conditions in s533 apply.

REPORT 225: Insolvency statistics: External administrators’ reports 1 July 2007–30 June 2010
© Australian Securities and Investments Commission December 2010 Page 53
Section lodged under
105 Most reports in 2008–2009 (94.7%) were lodged by liquidators for the purpose of complying with s533 of the Corporations Act: see Table 33.
Table 33: Initial external administrators’ reports by section of the Corporations Act (1 July 2008–30 June 2009)
No. %
Section 422 (reports by receiver) 89 1.2%
Section 438D (reports by administrator) 295 3.8%
Section 533 (reports by liquidator) 7,327 94.7%
Statistical purposes 22 0.3%
Total 7,733 100.0%
Size of company
106 The number of employees or the number of full-time equivalent employees is used as a measure of the size of the company. In 2008–2009, 75.2% of reports related to companies with less than 20 employees: see Table 34.
107 The reason for the three percentage point decrease compared to 2007–2008 appears to be the increase in the number of companies where the size of the company is not known, from 16.8% to 20.3%.
Table 34: Initial external administrators’ reports—Size of company as measured by number of FTEs (1 July 2008–30 June 2009)
No. %
Less than 5 FTE 4,679 60.5%
Between 5 and 19 FTE 1,136 14.7%
Between 20 and 199 FTE 345 4.5%
200 or more FTE 7 0.1%
Not known 1,566 20.3%
Total 7,733 100.0%
Note: FTE = Full-time equivalent employees.
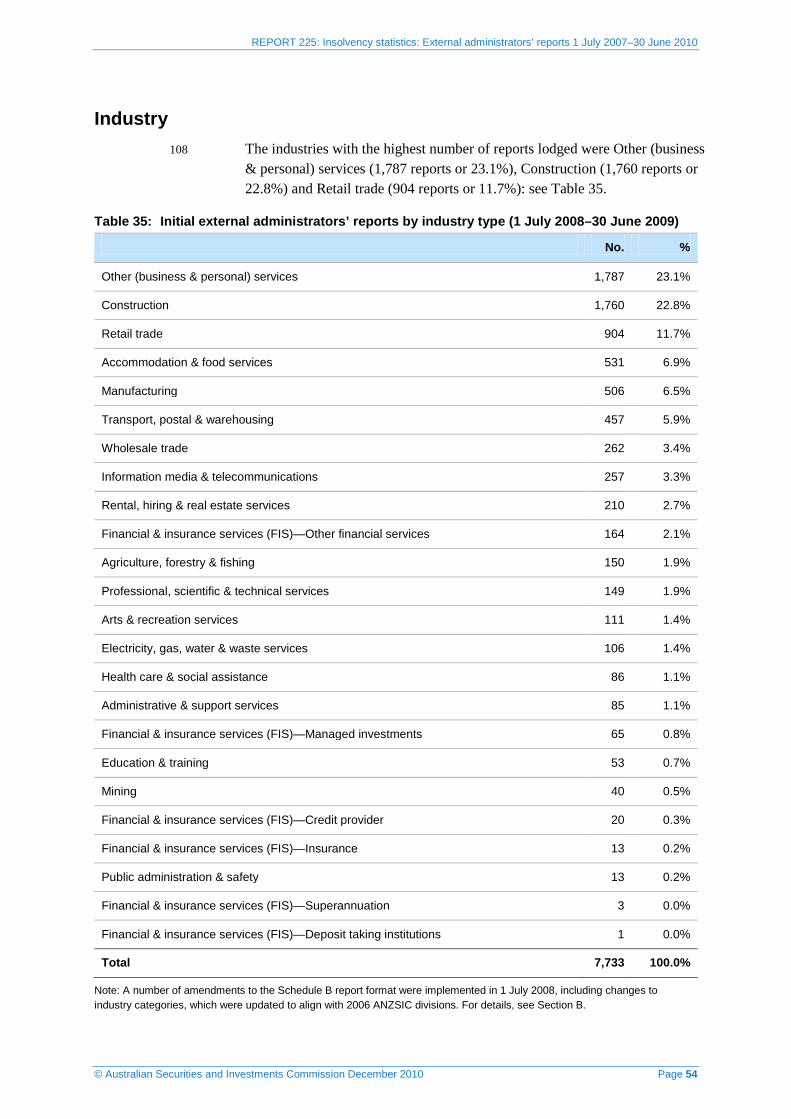
REPORT 225: Insolvency statistics: External administrators’ reports 1 July 2007–30 June 2010
© Australian Securities and Investments Commission December 2010 Page 54
Industry 108 The industries with the highest number of reports lodged were Other (business
& personal) services (1,787 reports or 23.1%), Construction (1,760 reports or 22.8%) and Retail trade (904 reports or 11.7%): see Table 35.
Table 35: Initial external administrators’ reports by industry type (1 July 2008–30 June 2009)
No. %
Other (business & personal) services 1,787 23.1%
Construction 1,760 22.8%
Retail trade 904 11.7%
Accommodation & food services 531 6.9%
Manufacturing 506 6.5%
Transport, postal & warehousing 457 5.9%
Wholesale trade 262 3.4%
Information media & telecommunications 257 3.3%
Rental, hiring & real estate services 210 2.7%
Financial & insurance services (FIS)—Other financial services 164 2.1%
Agriculture, forestry & fishing 150 1.9%
Professional, scientific & technical services 149 1.9%
Arts & recreation services 111 1.4%
Electricity, gas, water & waste services 106 1.4%
Health care & social assistance 86 1.1%
Administrative & support services 85 1.1%
Financial & insurance services (FIS)—Managed investments 65 0.8%
Education & training 53 0.7%
Mining 40 0.5%
Financial & insurance services (FIS)—Credit provider 20 0.3%
Financial & insurance services (FIS)—Insurance 13 0.2%
Public administration & safety 13 0.2%
Financial & insurance services (FIS)—Superannuation 3 0.0%
Financial & insurance services (FIS)—Deposit taking institutions 1 0.0%
Total 7,733 100.0%
Note: A number of amendments to the Schedule B report format were implemented in 1 July 2008, including changes to industry categories, which were updated to align with 2006 ANZSIC divisions. For details, see Section B.

REPORT 225: Insolvency statistics: External administrators’ reports 1 July 2007–30 June 2010
© Australian Securities and Investments Commission December 2010 Page 55
Nominated causes of failure
109 There is commonly more than one reason for a company’s failure. External administrators nominated an average of 2.29 causes of failure per report in 2008–2009.
110 The top three nominated causes of failure for companies (see Table 36 and Table 37) were:
poor strategic management of business (3,317 or 42.9% of reports);
inadequate cash flow or high cash use (2,943 or 38.1% of reports); and
poor financial control including lack of records (2,596 or 33.6% of reports).
111 Of the top 12 industries, the three industries which most exceeded the percentage of reports for these three causes of failure were:
poor strategic management of business: Agriculture, forestry & fishing (49.3% of reports), Retail trade (48.8% of reports) and Transport, postal & warehousing (46.8% of reports);
Note: A number of industries grouped in the ‘Other industries’ category exceeded the average 42.9% of reports for poor strategic management of business. The top six of these were FIS—Superannuation (66.7% of reports), Education & training (60.4% of reports), FIS—Credit provider (55% of reports), FIS—Managed investments (52.3% of reports), Health care & social assistance (47.7% of reports) and Electricity, gas, water & waste services (46.2% of reports).
inadequate cash flow or high cash use: Information media & telecommunications (49% of reports), Rental, hiring & real estate services (41.9% of reports) and Manufacturing (41.7% of reports);
poor financial control including lack of records: Transport, postal & warehousing (37.4% of reports), Construction (37.2% of reports) and Rental, hiring & real estate services (36.2% of reports).
112 Five states and territories, which make up 93% of reports, shared the same top cause of failure: Australian Capital Territory, New South Wales, Queensland Tasmania and Victoria. See Table 36.

REPORT 225: Insolvency statistics: External administrators’ reports 1 July 2007–30 June 2010
© Australian Securities and Investments Commission December 2010 Page 56
Table 36: Initial external administrators’ reports—Nominated causes of failure by industry (1 July 2008–30 June 2009)
Oth
er (b
usin
ess
&
pers
onal
) ser
vice
s
Con
stru
ctio
n
Ret
ail t
rade
Acc
omm
odat
ion
& fo
od
serv
ices
Man
ufac
turin
g
Tran
spor
t, po
stal
&
war
ehou
sing
Who
lesa
le tr
ade
Info
rmat
ion
med
ia &
te
leco
mm
unic
atio
ns
Ren
tal,
hirin
g &
real
est
ate
serv
ices
FIS—
Oth
er fi
nanc
ial
serv
ices
Agr
icul
ture
, for
estr
y &
fis
hing
Prof
essi
onal
, sci
entif
ic &
te
chni
cal s
ervi
ces
Oth
er in
dust
ries
Tota
l
Under capitalisation 313 395 210 116 129 87 68 56 52 34 33 29 121 1,643
Poor financial control including lack of records 635 655 267 176 151 171 87 61 76 46 41 47 183 2,596
Poor management of accounts receivable 176 296 88 14 78 52 44 75 21 17 16 35 64 976
Poor strategic management of business 716 714 441 222 223 214 119 88 93 67 74 68 278 3,317
Inadequate cash flow or high cash use 605 651 376 212 211 187 109 126 88 55 55 62 206 2,943
Poor economic conditions 208 288 216 85 106 94 43 17 30 35 47 16 100 1,285
Natural disaster 1 5 9 5 4 2 1 0 0 0 6 0 4 37
Fraud 21 19 13 7 20 7 7 6 6 5 4 2 19 136
DOCA failed 8 14 7 2 4 3 0 0 1 1 1 0 6 47
Dispute among directors 53 55 37 29 19 7 12 9 16 8 4 12 20 281
Trading losses 445 485 359 209 203 150 105 59 57 28 48 39 167 2,354
Industry restructuring 27 18 19 5 13 10 9 2 0 1 5 2 4 115
Other 450 418 195 114 147 100 63 96 52 74 38 39 173 1,959
Nominated causes of failure by industry 3,658 4,013 2,237 1,196 1,308 1,084 667 595 492 371 372 351 1,345 17,689
Note: ‘Other industries’ includes Administrative & support services, Arts & recreation services, Education & training, Electricity, gas, water & waste services, remaining Financial & insurance services sub-categories (Credit provider, Deposit taking institutions, Insurance, Managed investments and Superannuation), Health care & social assistance, Mining and Public administration & safety.

REPORT 225: Insolvency statistics: External administrators’ reports 1 July 2007–30 June 2010
© Australian Securities and Investments Commission December 2010 Page 57
Table 37: Initial external administrators’ reports—Nominated causes of failure by region (1 July 2008–30 June 2009)
ACT NSW NT QLD SA TAS VIC WA Total
Under capitalisation 26 796 2 280 63 12 378 85 1,642
Poor financial control including lack of records 32 1,554 2 346 58 9 473 120 2,594
Poor management of accounts receivable 16 493 1 184 22 5 209 46 976
Poor strategic management of business 51 1,592 1 631 101 24 793 122 3,315
Inadequate cash flow or high cash use 35 1,402 4 536 79 10 727 149 2,942
Poor economic conditions 10 718 1 237 38 3 239 39 1,285
Natural disaster 0 14 0 10 0 0 11 2 37
Fraud 3 64 0 26 4 1 29 9 136
DOCA failed 3 24 0 9 2 1 5 3 47
Dispute among directors 7 109 0 57 11 3 76 17 280
Trading losses 25 1,120 3 407 115 16 535 133 2,354
Industry restructuring 0 32 1 9 10 4 56 3 115
Other 28 934 3 340 62 6 478 108 1,959
Total 236 8,852 18 3,072 565 94 4,009 836 17,682
Note: Causes of failure for companies with international registered addresses are not included in regional statistics.
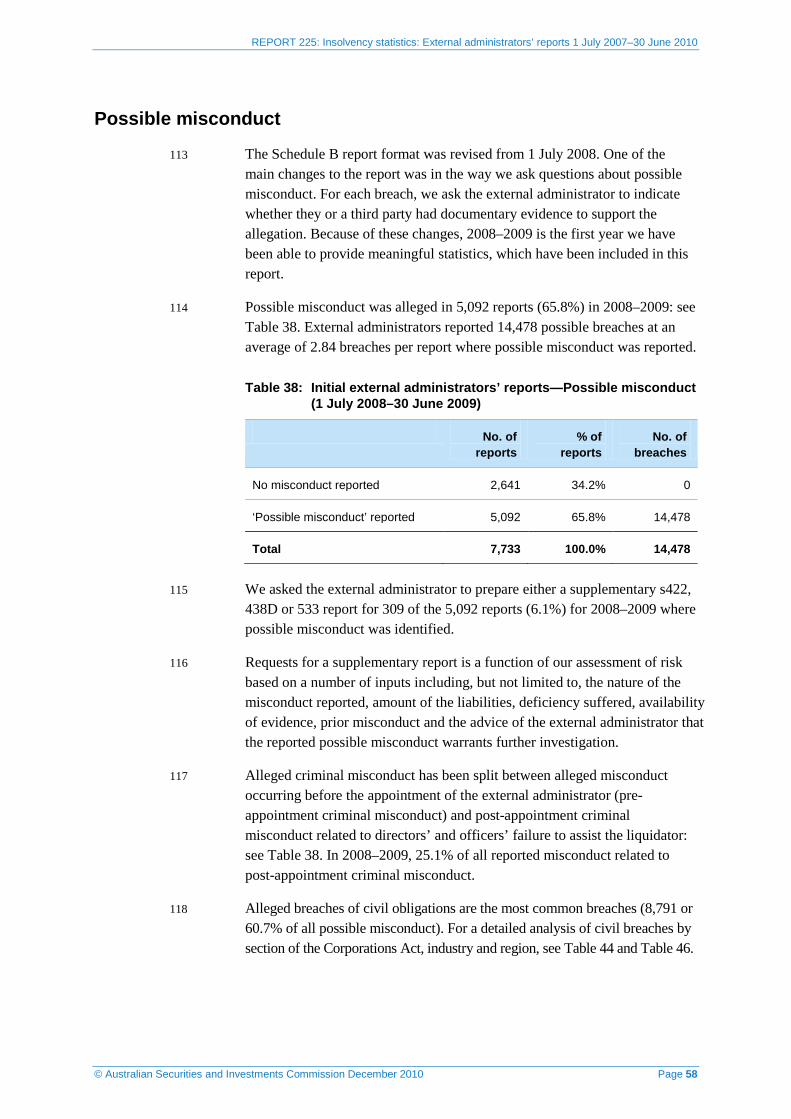
REPORT 225: Insolvency statistics: External administrators’ reports 1 July 2007–30 June 2010
© Australian Securities and Investments Commission December 2010 Page 58
Possible misconduct
113 The Schedule B report format was revised from 1 July 2008. One of the main changes to the report was in the way we ask questions about possible misconduct. For each breach, we ask the external administrator to indicate whether they or a third party had documentary evidence to support the allegation. Because of these changes, 2008–2009 is the first year we have been able to provide meaningful statistics, which have been included in this report.
114 Possible misconduct was alleged in 5,092 reports (65.8%) in 2008–2009: see Table 38. External administrators reported 14,478 possible breaches at an average of 2.84 breaches per report where possible misconduct was reported.
Table 38: Initial external administrators’ reports—Possible misconduct (1 July 2008–30 June 2009)
No. of reports
% of reports
No. of breaches
No misconduct reported 2,641 34.2% 0
‘Possible misconduct’ reported 5,092 65.8% 14,478
Total 7,733 100.0% 14,478
115 We asked the external administrator to prepare either a supplementary s422, 438D or 533 report for 309 of the 5,092 reports (6.1%) for 2008–2009 where possible misconduct was identified.
116 Requests for a supplementary report is a function of our assessment of risk based on a number of inputs including, but not limited to, the nature of the misconduct reported, amount of the liabilities, deficiency suffered, availability of evidence, prior misconduct and the advice of the external administrator that the reported possible misconduct warrants further investigation.
117 Alleged criminal misconduct has been split between alleged misconduct occurring before the appointment of the external administrator (pre-appointment criminal misconduct) and post-appointment criminal misconduct related to directors’ and officers’ failure to assist the liquidator: see Table 38. In 2008–2009, 25.1% of all reported misconduct related to post-appointment criminal misconduct.
118 Alleged breaches of civil obligations are the most common breaches (8,791 or 60.7% of all possible misconduct). For a detailed analysis of civil breaches by section of the Corporations Act, industry and region, see Table 44 and Table 46.

REPORT 225: Insolvency statistics: External administrators’ reports 1 July 2007–30 June 2010
© Australian Securities and Investments Commission December 2010 Page 59
Table 39: Initial external administrators’ reports—Categories of possible misconduct (1 July 2008–30 June 2009)
No. of breaches
% of breaches
Alleged criminal misconduct under Corporations Act by officers or employees:
pre-appointment criminal misconduct
post-appointment criminal misconduct
1,805
3,637
12.5%
25.1%
Alleged breaches of civil obligations 8,791 60.7%
Other criminal offences 84 0.6%
Other possible misconduct 161 1.1%
Total 14,478 100.0%
Note 1: ‘Other criminal offences’ includes offences by a member or contributory under the Corporations Act or offences under other Commonwealth statutes or state or territory laws.
Note 2: ‘Other possible misconduct’ relates to people who have taken part in the formation, promotion, administration, management or winding up of the company and may have:
misapplied or retained, or become liable or accountable for, any money or property of the company; or
been guilty of any negligence, default, breach of duty or trust in relation to the company.
Documentary evidence and further inquiry
119 External administrators confirmed they had documentary evidence for 3,003 reports (59%) of the 5,092 reports where they had identified an offence: see Table 41. Of these, they considered further enquiry by us into the alleged misconduct was warranted in only 691 reports, based on their assessment of the information and documentary evidence available.
120 Documentary evidence in the possession of a third party was identified in 489 reports. Based on this and their assessment, the external administrator recommended we make further enquiry in 174 reports.
Note: For 137 of the 174 reports where evidence was identified as being with a third party, the external administrator was also in possession of evidence. Therefore, these 137 reports were also included in the 691 reports where the external administrator recommended further inquiry was recommended.

REPORT 225: Insolvency statistics: External administrators’ reports 1 July 2007–30 June 2010
© Australian Securities and Investments Commission December 2010 Page 60
Table 40: Initial external administrators’ reports—Evidence with liquidator and further inquiry recommended by deficiency categories (1 July 2008–30 June 2009)
Schedule C requested
Assessed & recorded
Total
$0–$50,000 6 44 50
$50,001–$250,000 25 132 157
$250,001–less than $500,000 28 101 129
$500,000–less than $1 million 26 79 105
$1 million–less than $5 million 44 118 162
$5 million–$10 million 15 15 30
Over $10 million 30 28 58
Total 174 517 691
121 A further 313 reports indicated further inquiry was warranted. However, the breaches related to post-appointment criminal misconduct where a separate request for liquidator assistance is required. In addition, 182 reports indicated that further inquiry was required—however, no alleged misconduct was reported in those reports.
Table 41: Initial external administrators’ reports—Possible pre-appointment misconduct (1 July 2008–30 June 2009)
No. of reports
% of reports
No. of breaches
Liquidator has documentary evidence to support allegation
Yes 3,003 38.8% 6,879
No 2,089 27.0% 3,962
Total 5,092 65.8% 10,841
Of those with documentary evidence, did the liquidator recommend further inquiry by ASIC?
Yes 691 8.9%
No 2,312 29.9%
Total 3,003 38.8%

REPORT 225: Insolvency statistics: External administrators’ reports 1 July 2007–30 June 2010
© Australian Securities and Investments Commission December 2010 Page 61
No. of reports
% of reports
No. of breaches
Liquidator is aware of another person with documentary evidence
Yes 489 6.3% 1,391
No 4,603 59.5% 9,450
Total 5,092 65.8% 10,841
Where the evidence was with another person, did the liquidator recommend further inquiry by ASIC?
Yes 174 2.3%
No 315 4.1%
Total 489 6.3%
Note: ‘Pre-appointment misconduct’ refers to pre-appointment criminal misconduct, alleged breaches of civil obligations, other criminal offences and other possible misconduct.
Alleged criminal misconduct
Pre-appointment criminal misconduct
122 Statistics for alleged pre-appointment criminal misconduct are available by industry and region: see Table 43 and Table 45. The tables also show the number of reports where the external administrator is able to advise where evidence is available. Pre-appointment misconduct predominantly relates to the conduct of an officer or director of the company before the appointment of the external administrator.
123 External administrators had evidence in their possession for 1,220 possible criminal breaches out of 1,805 (67.6%) reported.
124 The top three nominated criminal breaches for companies for 2008–2009 were:
Section 588G(3) Insolvent trading: 678 breaches reported (8.8% of reports);
Sections 286 and 344(2) Obligation to keep financial records: 534 breaches reported (6.9% of reports); and
Section 184 Good faith; use of position and use of information: 283 breaches reported (3.7% of reports).
125 Of the top 12 industries, the three industries which most exceeded the percentage of reports for these three nominated criminal breaches were:
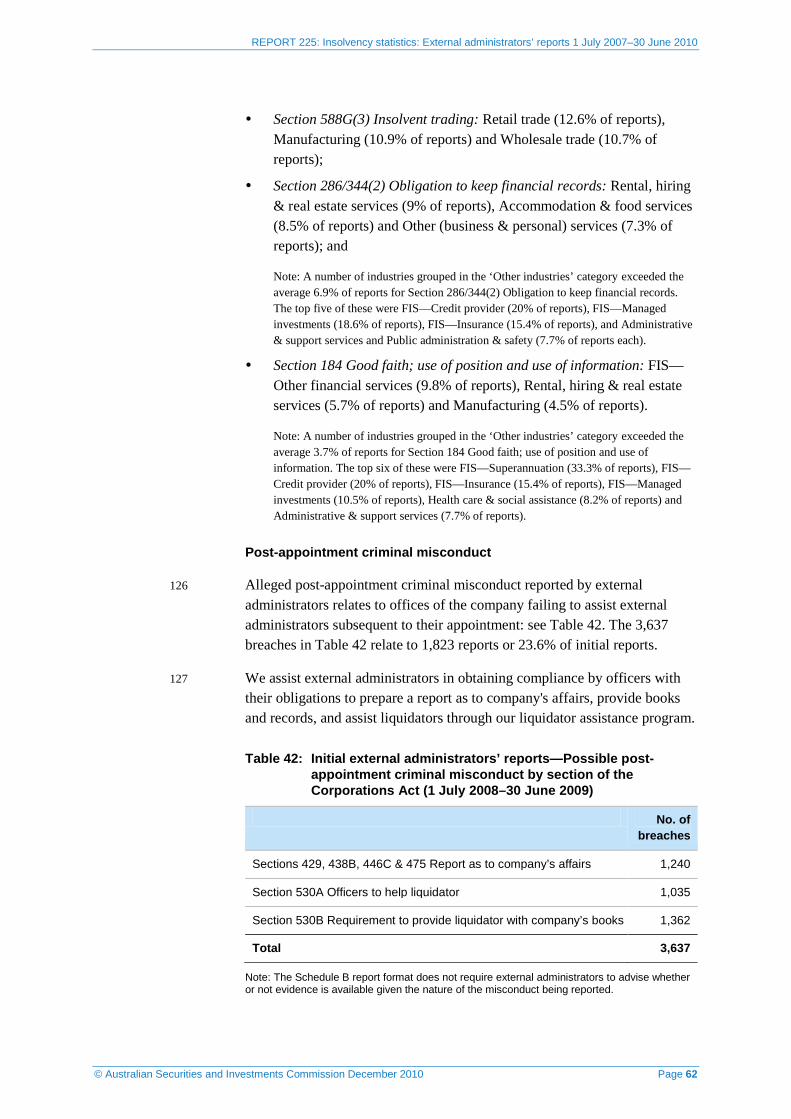
REPORT 225: Insolvency statistics: External administrators’ reports 1 July 2007–30 June 2010
© Australian Securities and Investments Commission December 2010 Page 62
Section 588G(3) Insolvent trading: Retail trade (12.6% of reports), Manufacturing (10.9% of reports) and Wholesale trade (10.7% of reports);
Section 286/344(2) Obligation to keep financial records: Rental, hiring & real estate services (9% of reports), Accommodation & food services (8.5% of reports) and Other (business & personal) services (7.3% of reports); and
Note: A number of industries grouped in the ‘Other industries’ category exceeded the average 6.9% of reports for Section 286/344(2) Obligation to keep financial records. The top five of these were FIS—Credit provider (20% of reports), FIS—Managed investments (18.6% of reports), FIS—Insurance (15.4% of reports), and Administrative & support services and Public administration & safety (7.7% of reports each).
Section 184 Good faith; use of position and use of information: FIS—Other financial services (9.8% of reports), Rental, hiring & real estate services (5.7% of reports) and Manufacturing (4.5% of reports).
Note: A number of industries grouped in the ‘Other industries’ category exceeded the average 3.7% of reports for Section 184 Good faith; use of position and use of information. The top six of these were FIS—Superannuation (33.3% of reports), FIS—Credit provider (20% of reports), FIS—Insurance (15.4% of reports), FIS—Managed investments (10.5% of reports), Health care & social assistance (8.2% of reports) and Administrative & support services (7.7% of reports).
Post-appointment criminal misconduct
126 Alleged post-appointment criminal misconduct reported by external administrators relates to offices of the company failing to assist external administrators subsequent to their appointment: see Table 42. The 3,637 breaches in Table 42 relate to 1,823 reports or 23.6% of initial reports.
127 We assist external administrators in obtaining compliance by officers with their obligations to prepare a report as to company's affairs, provide books and records, and assist liquidators through our liquidator assistance program.
Table 42: Initial external administrators’ reports—Possible post-appointment criminal misconduct by section of the Corporations Act (1 July 2008–30 June 2009)
No. of breaches
Sections 429, 438B, 446C & 475 Report as to company’s affairs 1,240
Section 530A Officers to help liquidator 1,035
Section 530B Requirement to provide liquidator with company’s books 1,362
Total 3,637
Note: The Schedule B report format does not require external administrators to advise whether or not evidence is available given the nature of the misconduct being reported.

REPORT 225: Insolvency statistics: External administrators’ reports 1 July 2007–30 June 2010
© Australian Securities and Investments Commission December 2010 Page 63
Alleged breaches of civil obligations
128 Statistics for alleged breaches of civil obligations are available by industry and region: see Table 44 and Table 46. The tables also show the number of reports where the external administrator is able to advise they have evidence to support their allegation. External administrators had evidence in their possession for 5,464 possible breaches of civil obligations out of 8,791 (62.2%) reported.
129 The top three nominated civil breaches for companies for 2008–2009 were:
Section 588G(1)–(2) Insolvent trading: 3,141 breaches reported (40.6% of reports);
Sections 286 and 344(1) Obligation to keep financial records: 2,653 breaches reported (34.3% of reports); and
Section 180 Care and diligence—Directors’ and officers’ duties: 1,409 breaches reported (18.2% of reports).
130 Of the top 12 industries, the three industries which most exceeded the percentage of reports for these three nominated breaches of civil obligations were:
Section 588G(1)–(2) Insolvent trading: Wholesale trade (50% of reports), Professional, scientific & technical services (47% of reports) and Manufacturing (45.1% of reports);
Sections 286 and 344(1) Obligation to keep financial records: equal first were Other (business & personal) services and Rental, hiring & real estate services (40% of reports each) and Construction (37.4% of reports); and
Section 180 Care and diligence—Directors’ and officers’ duties: FIS—Other financial services (23.8% of reports), Wholesale trade (20.2% of reports) and Accommodation & food services (19.8% of reports).
Note: A number of industries grouped in the ‘Other industries’ category exceeded the average 18.2% of reports for Section 180 Care and diligence—Directors’ and officers’ duties. The top three of these were FIS—Credit provider (50% of reports), FIS—Managed investments (38.4% of reports) and FIS—Superannuation (33.3% of reports).
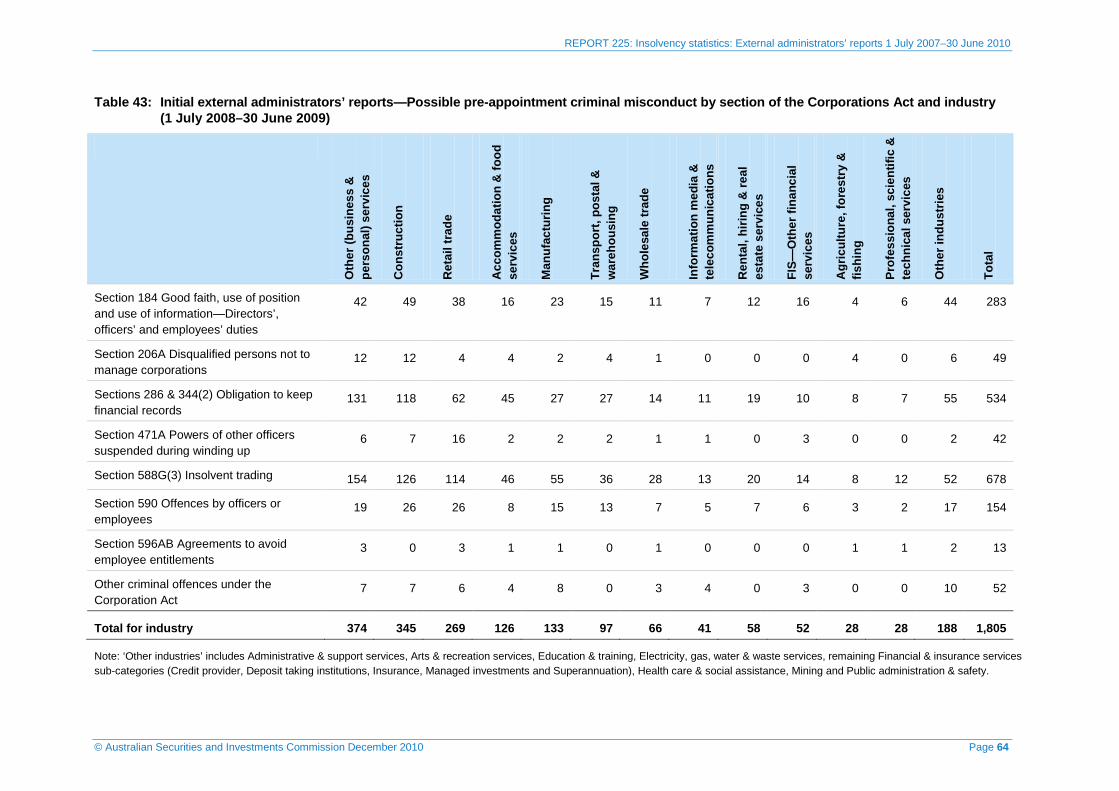
REPORT 225: Insolvency statistics: External administrators’ reports 1 July 2007–30 June 2010
© Australian Securities and Investments Commission December 2010 Page 64
Table 43: Initial external administrators’ reports—Possible pre-appointment criminal misconduct by section of the Corporations Act and industry (1 July 2008–30 June 2009)
Oth
er (b
usin
ess
&
pers
onal
) ser
vice
s
Con
stru
ctio
n
Ret
ail t
rade
Acc
omm
odat
ion
& fo
od
serv
ices
Man
ufac
turin
g
Tran
spor
t, po
stal
&
war
ehou
sing
Who
lesa
le tr
ade
Info
rmat
ion
med
ia &
te
leco
mm
unic
atio
ns
Ren
tal,
hirin
g &
real
es
tate
ser
vice
s
FIS—
Oth
er fi
nanc
ial
serv
ices
Agr
icul
ture
, for
estr
y &
fis
hing
Prof
essi
onal
, sci
entif
ic &
te
chni
cal s
ervi
ces
Oth
er in
dust
ries
Tota
l
Section 184 Good faith, use of position and use of information—Directors’, officers’ and employees’ duties
42 49 38 16 23 15 11 7 12 16 4 6 44 283
Section 206A Disqualified persons not to manage corporations
12 12 4 4 2 4 1 0 0 0 4 0 6 49
Sections 286 & 344(2) Obligation to keep financial records
131 118 62 45 27 27 14 11 19 10 8 7 55 534
Section 471A Powers of other officers suspended during winding up
6 7 16 2 2 2 1 1 0 3 0 0 2 42
Section 588G(3) Insolvent trading 154 126 114 46 55 36 28 13 20 14 8 12 52 678
Section 590 Offences by officers or employees
19 26 26 8 15 13 7 5 7 6 3 2 17 154
Section 596AB Agreements to avoid employee entitlements
3 0 3 1 1 0 1 0 0 0 1 1 2 13
Other criminal offences under the Corporation Act
7 7 6 4 8 0 3 4 0 3 0 0 10 52
Total for industry 374 345 269 126 133 97 66 41 58 52 28 28 188 1,805
Note: ‘Other industries’ includes Administrative & support services, Arts & recreation services, Education & training, Electricity, gas, water & waste services, remaining Financial & insurance services sub-categories (Credit provider, Deposit taking institutions, Insurance, Managed investments and Superannuation), Health care & social assistance, Mining and Public administration & safety.

REPORT 225: Insolvency statistics: External administrators’ reports 1 July 2007–30 June 2010
© Australian Securities and Investments Commission December 2010 Page 65
Table 44: Initial external administrators’ reports—Possible breaches of civil obligations by section of the Corporations Act and industry (1 July 2008–30 June 2009)
Oth
er (b
usin
ess
&
pers
onal
) ser
vice
s
Con
stru
ctio
n
Ret
ail t
rade
Acc
omm
odat
ion
& fo
od
serv
ices
Man
ufac
turin
g
Tran
spor
t, po
stal
&
war
ehou
sing
Who
lesa
le tr
ade
Info
rmat
ion
med
ia &
te
leco
mm
unic
atio
ns
Ren
tal,
hirin
g &
real
es
tate
ser
vice
s
FIS—
Oth
er fi
nanc
ial
serv
ices
Agr
icul
ture
, for
estr
y &
fis
hing
Prof
essi
onal
, sci
entif
ic &
te
chni
cal s
ervi
ces
Oth
er in
dust
ries
Tota
l
Section 180 Care and diligence—Directors’ and officers’ duties 287 305 173 105 94 80 53 47 41 39 23 28 134 1,409
Section 181 Good faith—Directors’ and officers’ duties 144 175 101 55 48 40 32 19 22 32 12 18 92 790
Section 182 Use of position—Directors’, officers’ and employees’ duties 128 126 65 29 42 33 24 14 16 25 8 13 59 582
Section 183 Use of information—Directors’, officers’ and employees’ duties 44 60 23 9 7 12 7 4 6 15 1 7 21 216
Sections 286 & 344(1) Obligation to keep financial records 714 659 252 181 147 155 82 71 84 48 36 41 183 2,653
Section 588G(1)–(2) Insolvent trading 693 716 387 209 228 192 131 91 81 60 54 70 229 3,141
Total for industry 2,010 2,041 1,001 588 566 512 329 246 250 219 134 177 718 8,791
Note: ‘Other industries’ includes Administrative & support services, Arts & recreation services, Education & training, Electricity, gas, water & waste services, remaining Financial & insurance services sub-categories (Credit provider, Deposit taking institutions, Insurance, Managed investments and Superannuation), Health care & social assistance, Mining and Public administration & safety.

REPORT 225: Insolvency statistics: External administrators’ reports 1 July 2007–30 June 2010
© Australian Securities and Investments Commission December 2010 Page 66
Table 45: Initial external administrators’ reports—Possible pre-appointment criminal misconduct by section of the Corporations Act and region (1 July 2008–30 June 2009)
ACT NSW NT QLD SA TAS VIC WA Total
No.
of b
reac
hes
Evid
ence
with
liq
uida
tor
No.
of b
reac
hes
Evid
ence
with
liq
uida
tor
No.
of b
reac
hes
Evid
ence
with
liq
uida
tor
No.
of b
reac
hes
Evid
ence
with
liq
uida
tor
No.
of b
reac
hes
Evid
ence
with
liq
uida
tor
No.
of b
reac
hes
Evid
ence
with
liq
uida
tor
No.
of b
reac
hes
Evid
ence
with
liq
uida
tor
No.
of b
reac
hes
Evid
ence
with
liq
uida
tor
No.
of b
reac
hes
Evid
ence
with
liq
uida
tor
Section 184 Good faith; use of position and use of information—Directors’, officers’ and employees’ duties 5 3 120 86 0 0 61 48 9 6 1 1 71 59 16 11 283 214
Section 206A Disqualified persons not to manage corporations 0 0 25 18 0 0 14 14 0 0 0 0 9 7 1 1 49 40
Sections 286 & 344(2) Obligation to keep financial records 8 2 291 159 2 1 78 46 7 4 5 3 127 74 16 13 534 302
Section 471A Powers of other officers suspended during winding up 1 0 13 9 0 0 17 17 0 0 0 0 7 7 4 4 42 37
Section 588G(3) Insolvent trading 14 5 304 187 2 2 152 109 11 9 9 7 161 113 25 21 678 453
Section 590 Offences by officers or employees 0 0 60 44 0 0 41 33 3 3 0 0 44 36 6 4 154 120
Section 596AB Agreements to avoid employee entitlements 1 0 4 4 0 0 1 0 0 0 0 0 7 5 0 0 13 9
Other criminal offences under the Corporations Act 1 1 26 24 0 0 9 8 0 0 1 1 14 11 1 0 52 45
Total 30 11 843 531 4 3 373 275 30 22 16 12 440 312 69 54 1,805 1,220

REPORT 225: Insolvency statistics: External administrators’ reports 1 July 2007–30 June 2010
© Australian Securities and Investments Commission December 2010 Page 67
Table 46: Initial external administrators’ reports—Possible breaches of civil obligations by section of the Corporations Act and region (1 July 2008–30 June 2009)
ACT NSW NT QLD SA TAS VIC WA Total
No.
of b
reac
hes
Evid
ence
with
liq
uida
tor
No.
of b
reac
hes
Evid
ence
with
liq
uida
tor
No.
of b
reac
hes
Evid
ence
with
liq
uida
tor
No.
of b
reac
hes
Evid
ence
with
liq
uida
tor
No.
of b
reac
hes
Evid
ence
with
liq
uida
tor
No.
of b
reac
hes
Evid
ence
with
liq
uida
tor
No.
of b
reac
hes
Evid
ence
with
liq
uida
tor
No.
of b
reac
hes
Evid
ence
with
liq
uida
tor
No.
of b
reac
hes
Evid
ence
with
liq
uida
tor
Section 180 Care and diligence—Directors’ and officers’ duties 19 15 778 376 0 0 233 176 45 39 6 5 233 167 95 52 1,409 830
Section 181 Good faith—Directors’ and officers’ duties 12 10 383 247 0 0 158 123 22 21 1 0 161 128 53 35 790 564
Section 182 Use of position—Directors’, officers’ and employees’ duties 10 9 261 187 0 0 101 78 27 25 0 0 138 111 45 33 582 443
Section 183 Use of information—Directors’, officers’ and employees’ duties 1 0 107 67 0 0 40 31 2 2 0 0 47 35 19 15 216 150
Sections 286 & 344(1) Obligation to keep financial records 25 16 1,703 757 3 2 250 179 45 37 8 4 510 299 107 86 2,651 1,380
Section 588G(1)–(2) Insolvent trading 47 32 1,808 1101 2 2 378 293 89 75 15 11 666 480 135 103 3,140 2,097
Total 114 82 5,040 2,735 5 4 1,160 880 230 199 30 20 1,755 1,220 454 324 8,788 5,464
Note: Causes of failure for companies with international registered addresses are not included in regional statistics.

REPORT 225: Insolvency statistics: External administrators’ reports 1 July 2007–30 June 2010
© Australian Securities and Investments Commission December 2010 Page 68
Other possible criminal offences
131 In 2008–2009, there were only 84 other possible criminal offences (0.6% of overall offences) by a member or contributory under the Corporations Act or offences under other Commonwealth statutes or state or territory laws. Of the 84, only 71 were possible offences of laws other than the Corporations Act: see Table 47.
Table 47: Initial external administrators’ reports—Other possible criminal offences (1 July 2008–30 June 2009)
No. of breaches
Evidence with liquidator
Evidence with other
Criminal offence under the Corporations Act (if a member or contributory)
13 10 5
Criminal offence under another Commonwealth statute
42 36 22
Criminal offence under a state or territory law
29 20 13
Total 84 66 40
Other possible misconduct
132 ‘Other possible misconduct’ relates to persons who have taken part in the formation, promotion, administration, management or winding up of the company and are described in Table 48. A further 161 instances of other possible misconduct were reported in 2008–2009 or 1.1% of overall breaches.
Table 48: Initial external administrators’ reports—Other possible misconduct (1 July 2008–30 June 2009)
No. of
breaches Evidence with
liquidator Evidence
with other
May have misapplied or retained, or may have become liable or accountable for money or property of the company 86 8 26
May have been guilty of negligence; default; breach of duty or breach of trust in relation to the company 75 60 21
Total 161 68 47

REPORT 225: Insolvency statistics: External administrators’ reports 1 July 2007–30 June 2010
© Australian Securities and Investments Commission December 2010 Page 69
Referred to other authorities
133 Where possible misconduct was reported, 124 reports in 2008–2009 indicated the external administrator had or was intending to refer the matter to another authority. The highest three number of referrals were to the Australian Tax Office (41 reports), state or territory police (28 reports) and Fair Trading/Consumer Affairs (14 reports).
Books and records
134 External administrators indicated they had obtained or inspected the company’s books and records in 5,697 reports (73.7%) in 2008–2009. Of these, 3,404 reports indicated that the company’s books and records were considered adequate.
Assetless Administration Fund
135 In 2008–2009, 477 of the 7,327 reports by a liquidator (as noted in Table 33) indicated the liquidator had made or was intending to make an application for funding from the Assetless Administration Fund.
Liabilities and assets
136 External administrators provide estimates of the assets, liabilities and overall financial deficiency of companies they are reporting on. Table 49 shows the assets and liabilities categories. Table 50 shows the deficiency for the top 12 industries by reports lodged (as noted in Table 35).
Assets
137 Most reports (62.7%) showed that the companies had estimated assets of $10,000 or less.
138 Of the top 12 industries, those with the greatest percentage of reports estimating assets of $10,000 or less were Other (business & personal) services (72.1%), FIS—Other financial services (70.1%) and Information media & telecommunications (69.6%).
139 In 42.3% (3,272) of reports, the external administrator estimated the administration was assetless. Of the top 12 industries, those that most exceeded this percentage for assetless administrations (42.3%) were Other (business & personal) services (51.1%), Rental, hiring & real estate services (50%) and Information media & telecommunications (47.1%).

REPORT 225: Insolvency statistics: External administrators’ reports 1 July 2007–30 June 2010
© Australian Securities and Investments Commission December 2010 Page 70
140 On the other hand, 8.7% of reports estimated assets of over $250,000. Of the top 12 industries, those well above this percentage were Agriculture, forestry & fishing (20%) and Rental, hiring & real estate services (15.7%).
Note: In the ‘Other industries’ category, Mining (27.5%), FIS—Managed investments (21.5%), FIS—Credit provider (20%), Public administration & safety (15.4%), Education & training (15.1%) and Health care & social assistance (12.8%) all exceeded this percentage across all industries (8.7%), but made up only 3.6% of all reports.
Liabilities
141 More than half of reports (52%) indicated that the estimated liabilities of the failed companies were $250,000 or less and 80.6% indicated estimated liabilities less than $1 million.
142 Of the top 12 industries, those with the greatest percentage of companies with estimated liabilities of $250,000 or less were Other (business & personal) services (63.7%), Transport, postal & warehousing (56%) and FIS—Other financial services (54.3%).
143 A comparison of those industries with estimated liabilities over $10 million reveals that the proportion of reports in that category across all industries (3.6%) was exceeded by Information media & telecommunication (19.8%), FIS—Other financial services (7.9%) and Agriculture, forestry & fishing (6%).
Note: In the ‘Other industries’ category, Mining (22.5%), Education & training (15.1%), FIS—Credit provider (15%), FIS—Managed investments (9.2%) and Administrative & support services (5.9%) all exceeded this percentage across all industries (3.6%), but made up only 3.4% of all reports.
Deficiency
144 Across all industries, 54.7% of reports estimated the shortfall between estimated assets and estimated liabilities was $250,000 or less. When comparing the deficiency estimates between the top 12 industries, the three industries with the highest percentage of estimates at $250,000 or less were Other (business & personal) services (66%), Transport, postal & warehousing (59.3%) and FIS—Other financial services (57.3%). Only 3.1% of all reports estimated a deficiency of over $10 million.
145 Of the top 12 industries, those that most exceeded this percentage were Information media & telecommunications (19.8%), FIS—Other financial services (7.9%) and Agriculture, forestry & fishing (5.3%).
Note: Six industries grouped in ‘Other industries’ exceeded this percentage across all industries (3.1%): Mining (20%), Education & training (15.1%), FIS—Credit provider (15%), FIS—Managed investments (6.2%), Administrative & support services (5.9%) and Health care & social assistance (3.5%). However, when combined, these industries made up only 4.5% of reports.

REPORT 225: Insolvency statistics: External administrators’ reports 1 July 2007–30 June 2010
© Australian Securities and Investments Commission December 2010 Page 71
Table 49: Initial external administrators’ reports—Amount of assets and liabilities by industry (1 July 2008–30 June 2009)
Oth
er (b
usin
ess
&
pers
onal
) ser
vice
s
Con
stru
ctio
n
Ret
ail t
rade
Acc
omm
odat
ion
& fo
od
serv
ices
Man
ufac
turin
g
Tran
spor
t, po
stal
&
war
ehou
sing
Who
lesa
le tr
ade
Info
rmat
ion
med
ia &
te
leco
mm
unic
atio
ns
Ren
tal,
hirin
g &
real
es
tate
ser
vice
s
FIS—
Oth
er fi
nanc
ial
serv
ices
Agr
icul
ture
, for
estr
y &
fis
hing
Prof
essi
onal
, sci
entif
ic
& te
chni
cal s
ervi
ces
Oth
er in
dust
ries
Tota
l
% o
f tot
al
Asset categories
Less than $1 914 779 319 224 154 183 78 121 105 67 47 48 233 3,272 42.3%
$1–$10,000 374 360 188 117 85 88 46 58 31 48 23 39 122 1,579 20.4%
$10,001–$20,000 151 137 82 43 49 45 28 16 16 6 14 17 57 661 8.5%
$20,001–$30,000 57 67 42 23 23 20 16 8 4 7 7 6 24 304 3.9%
$30,001–$50,000 58 86 68 31 29 29 20 11 7 6 10 6 31 392 5.1%
$50,001–$100,000 61 83 74 32 53 29 23 20 7 11 9 14 38 454 5.9%
$100,001–$250,000 64 86 59 24 47 26 19 14 7 5 10 9 27 397 5.1%
$250,001–$5 million 101 144 70 30 59 34 30 9 27 12 26 10 52 604 7.8%
Over $5 million 7 18 2 7 7 3 2 0 6 2 4 0 12 70 0.9%
Total for industry 1,787 1,760 904 531 506 457 262 257 210 164 150 149 596 7,733 100.0%
Liability categories
$1–$250,000 1,138 949 402 250 205 256 103 114 100 89 48 71 300 4,025 52.0%
$250,001–less than $1 million 401 437 328 198 194 126 91 64 55 34 50 58 169 2,205 28.5%
$1 million–less than $5 million 188 285 116 63 76 59 44 25 43 23 32 18 79 1,051 13.6%
$5 million–$10 million 25 45 21 8 15 9 12 3 6 5 11 1 13 174 2.3%
Over $10 million 35 44 37 12 16 7 12 51 6 13 9 1 35 278 3.6%
Total for industry 1,787 1,760 904 531 506 457 262 257 210 164 150 149 596 7,733 100.0%
Note: ‘Other industries’ includes Administrative & support services, Arts & recreation services, Education & training, Electricity, gas, water & waste services, remaining Financial & insurance services sub-categories (Credit provider, Deposit taking institutions, Insurance, Managed investments and Superannuation), Health care & social assistance, Mining and Public administration & safety.

REPORT 225: Insolvency statistics: External administrators’ reports 1 July 2007–30 June 2010
© Australian Securities and Investments Commission December 2010 Page 72
Table 50: Initial external administrators’ reports—Amount of deficiency by industry (1 July 2008–30 June 2009)
Oth
er (b
usin
ess
&
pers
onal
) ser
vice
s
Con
stru
ctio
n
Ret
ail t
rade
Acc
omm
odat
ion
& fo
od
serv
ices
Man
ufac
turin
g
Tran
spor
t, po
stal
&
war
ehou
sing
Who
lesa
le tr
ade
Info
rmat
ion
med
ia &
te
leco
mm
unic
atio
ns
Ren
tal,
hirin
g &
real
es
tate
ser
vice
s
FIS—
Oth
er fi
nanc
ial
serv
ices
Agr
icul
ture
, for
estr
y &
fis
hing
Prof
essi
onal
, sci
entif
ic &
te
chni
cal s
ervi
ces
Oth
er in
dust
ries
Tota
l
% o
f tot
al
$0–$50,000 527 391 112 80 81 105 32 37 30 39 13 19 112 1,578 20.4%
$50,001–$250,000 652 592 317 186 148 166 72 79 76 55 42 60 206 2,651 34.3%
$250,001–less than $500,000 239 273 205 124 107 70 55 40 34 22 29 27 96 1,321 17.1%
$500,000–less than $1 million 164 182 115 70 77 54 43 26 29 12 20 23 67 882 11.4%
$1 million–less than $5 million 158 255 101 58 66 50 41 21 32 17 32 18 71 920 11.9%
$5 million–$10 million 18 32 18 6 17 8 11 3 5 6 6 1 12 143 1.8%
Over $10 million 29 35 36 7 10 4 8 51 4 13 8 1 32 238 3.1%
Total for industry 1,787 1760 904 531 506 457 262 257 210 164 150 149 596 7,733 100.0%
Note: ‘Other industries’ includes Administrative & support services, Arts & recreation services, Education & training, Electricity, gas, water & waste services, remaining Financial & insurance services sub-categories (Credit provider, Deposit taking institutions, Insurance, Managed investments and Superannuation), Health care & social assistance, Mining and Public administration & safety.

REPORT 225: Insolvency statistics: External administrators’ reports 1 July 2007–30 June 2010
© Australian Securities and Investments Commission December 2010 Page 73
Employee entitlements
146 In all categories of employee entitlements (i.e. wages, annual leave, pay in lieu of notice, redundancy, long service leave and superannuation), ‘Not applicable’ was selected in the majority of reports: see Table 51 and Table 52. ‘Not applicable’ means that no amount of entitlement of that type was unpaid to employee creditors as at the date of the appointment of the external administrator.
Table 51: Initial external administrators’ reports—Amounts owed in unpaid employee entitlements (1 July 2008–30 June 2009)
Unpaid wages Unpaid
annual leave Unpaid pay in lieu of notice
Unpaid redundancy
Unpaid long service leave
No. % No. % No. % No. % No. %
$1–$1,000 264 3.4% 192 2.5% 181 2.4% 139 1.8% 134 1.7%
$1,001–$10,000 902 11.7% 933 12.1% 376 4.9% 160 2.1% 165 2.1%
$10,001–$50,000 401 5.2% 557 7.2% 283 3.7% 167 2.2% 198 2.6%
$50,001–$150,000 121 1.6% 164 2.1% 68 0.9% 84 1.1% 58 0.8%
$150,001–$250,000 30 0.4% 28 0.4% 13 0.2% 35 0.5% 15 0.2%
$250,001–$500,000 21 0.3% 16 0.2% 14 0.2% 15 0.2% 8 0.1%
$500,001–less than $1.5 million 5 0.1% 11 0.1% 6 0.1% 9 0.1% 6 0.1%
$1.5 million– $5 million 0 0.0% 1 0.0% 3 0.0% 7 0.1% 0 0.0%
Over $5 million 0 0.0% 4 0.1% 6 0.1% 8 0.1% 4 0.1%
Not applicable 5,946 77.3% 5,784 75.2% 6,740 87.6% 7,066 91.9% 7,102 92.4%
Total 7,690 100.0% 7,690 100.0% 7,690 100.0% 7,690 100.0% 7,690 100.0%
Note: 43 reports identified as being internally inconsistent were excluded from this table.
Unpaid wages
147 77.3% of reports showed unpaid wages as not applicable. In 15.2% of reports, it was estimated that employees were owed $1 to $10,000 in unpaid wages. Categories over $10,001 made up 7.5% of reports.

REPORT 225: Insolvency statistics: External administrators’ reports 1 July 2007–30 June 2010
© Australian Securities and Investments Commission December 2010 Page 74
Unpaid annual leave
148 In all, 75.2% of reports showed unpaid annual leave as not applicable. In 14.6% of cases employees were owed $1 to $10,000, and 21.9% of companies owed $50,000 or less. All other categories make up 2.9% of reports.
Unpaid pay in lieu of notice
149 Again, unpaid pay in lieu of notice was not applicable in most cases (87.6%). 1.4% of reports showed entitlements for unpaid pay in lieu of notice over $50,000.
Unpaid redundancy
150 Unpaid redundancy was not applicable in 91.9% of reports. In all, 3.9% of reports showed employees were owed $1 to $10,000 in redundancy payments.
151 Only 0.1% of reports showed unpaid redundancy of over $5 million.
Unpaid long service leave
152 3.9% of reports showed employees were owed $1 to $10,000 in unpaid long service leave, and unpaid long service leave of more than $5 million was estimated in only 0.1% of reports.
153 The majority of reports (92.4%) indicated a long service leave debt was not applicable.
Unpaid superannuation
154 Due to the different value categories of superannuation entitlements, these figures are shown separately in Table 52. The results show a similar pattern to other employee entitlements with a large number (64.7%) of reports showing unpaid superannuation as not applicable.
Table 52: Initial external administrators’ reports—Amounts owed in unpaid superannuation entitlements (1 July 2008–30 June 2009)
No. %
$1–$100,000 2,495 32.3%
$100,001–$250,000 177 2.3%
$250,001–$1 million 46 0.6%
Over $1 million 11 0.1%
Not applicable 5,004 64.7%
Total 7,733 100.0%
Note: No reports were identified as being internally inconsistent.

REPORT 225: Insolvency statistics: External administrators’ reports 1 July 2007–30 June 2010
© Australian Securities and Investments Commission December 2010 Page 75
Secured creditors
155 Table 53 and Figure 6 show the amounts owed to secured creditors by industry. Most reports for 2008–2009 (70.1%) indicated that nothing was owed to secured creditors.
156 A significant proportion (21%) of 2008–2009 reports showed secured creditors were owed between $1 and less than $1 million.
157 Of the top 12 industries, those with the greatest percentage of reports showing secured creditors were owed less than $1 million (91.2%) were Professional, scientific & technical services (98%), Other (business & personal) services (95%) and Transport, postal & warehousing (94.7%).
Note: Other industries exceeded this average (91.2%) mainly due to 100% of reports for four industries where secured creditors were owed less than $1 million – FIS – Insurance, Public administration & safety, FIS – Superannuation and FIS – Deposit taking institutions.
158 2.9% of reports showed more than $10 million was owed to secured creditors. Information media & telecommunications significantly exceeded this percentage (20.2%).
Note: Of those listed in ‘Other industries’, the three industries which most exceeded this percentage of reports across all industries with amounts owed to secured creditors over $10 million (2.9%) were Education & training (15.1% or 8 reports) and equal second, Mining (10% or 4 reports) and FIS—Credit provider (10% or 2 reports).
Unpaid taxes and charges
159 Most reports (89.3%) indicated that the amount of unpaid taxes and charges was $250,000 or less.
160 Of the top 12 industries, Retail trade most exceeded this percentage with 93.3% of reports indicating $250,000 or less was owed in unpaid taxes and charges.
161 The average percentage of unpaid taxes and charges over $1 million across all industries was 2.1% in 2008-2009. Of the top 12 industries, the industries which most exceeded this were Agriculture, forestry & fishing (4.7%), FIS—Other services (3.7%) and Rental, hiring & real estate services (3.3%). See Table 54.
Note: In the ‘Other industries’ category, the three industries that most exceeded this percentage across all industries (2.1%) of unpaid taxes and charges of over $1 million were Public administration & safety (7.7%), and equal second, Health care & social assistance and Administrative & support services (3.5%) These industries represented 2.4% of all reports.

REPORT 225: Insolvency statistics: External administrators’ reports 1 July 2007–30 June 2010
© Australian Securities and Investments Commission December 2010 Page 76
Table 53: Initial external administrators’ reports—Amount owed to secured creditors by industry (1 July 2008–30 June 2009)
Oth
er (b
usin
ess
&
pers
onal
) ser
vice
s
Con
stru
ctio
n
Ret
ail t
rade
Acc
omm
odat
ion
& fo
od
serv
ices
Man
ufac
turin
g
Tran
spor
t, po
stal
&
war
ehou
sing
Who
lesa
le tr
ade
Info
rmat
ion
med
ia &
te
leco
mm
unic
atio
ns
Ren
tal,
hirin
g &
real
es
tate
ser
vice
s
FIS—
Oth
er fi
nanc
ial
serv
ices
Agr
icul
ture
, for
estr
y &
fis
hing
Prof
essi
onal
, sci
entif
ic
& te
chni
cal s
ervi
ces
Oth
er in
dust
ries
Tota
l
% o
f tot
al
$0 1,431 1,281 581 371 279 295 165 157 126 115 74 111 438 5,424 70.1%
$1–less than $500,000 226 278 209 104 140 118 51 36 42 27 34 30 92 1,387 17.9%
$500,000–less than $1 million 40 43 32 20 21 20 15 3 7 5 11 5 18 240 3.1%
$1 million–less than $5 million 62 104 47 22 32 14 18 7 26 7 22 3 23 387 5.0%
$5 million–$10 million 10 23 3 3 8 3 7 2 5 0 2 0 6 72 0.9%
Over $10 million 18 31 32 11 26 7 6 52 4 10 7 0 19 223 2.9%
Total for industry 1,787 1,760 904 531 506 457 262 257 210 164 150 149 596 7,733 100.0%
Note: ‘Other industries’ includes Administrative & support services, Arts & recreation services, Education & training, Electricity, gas, water & waste services, all Financial & insurance services sub-categories (Credit provider, Deposit taking institutions, Insurance, Managed investments and Superannuation), Health care & social assistance, Mining, and Public administration & safety.

REPORT 225: Insolvency statistics: External administrators’ reports 1 July 2007–30 June 2010
© Australian Securities and Investments Commission December 2010 Page 77
Figure 6: Initial external administrators’ reports—Amount owed to secured creditors by industry (1 July 2008–30 June 2009)
0
200
400
600
800
1,000
1,200
1,400
1,600
1,800 Over $10 million$5 million - $10 million$1 million - less than $5 million$500,001 - less than $1 million$1 - less than $500,000$0
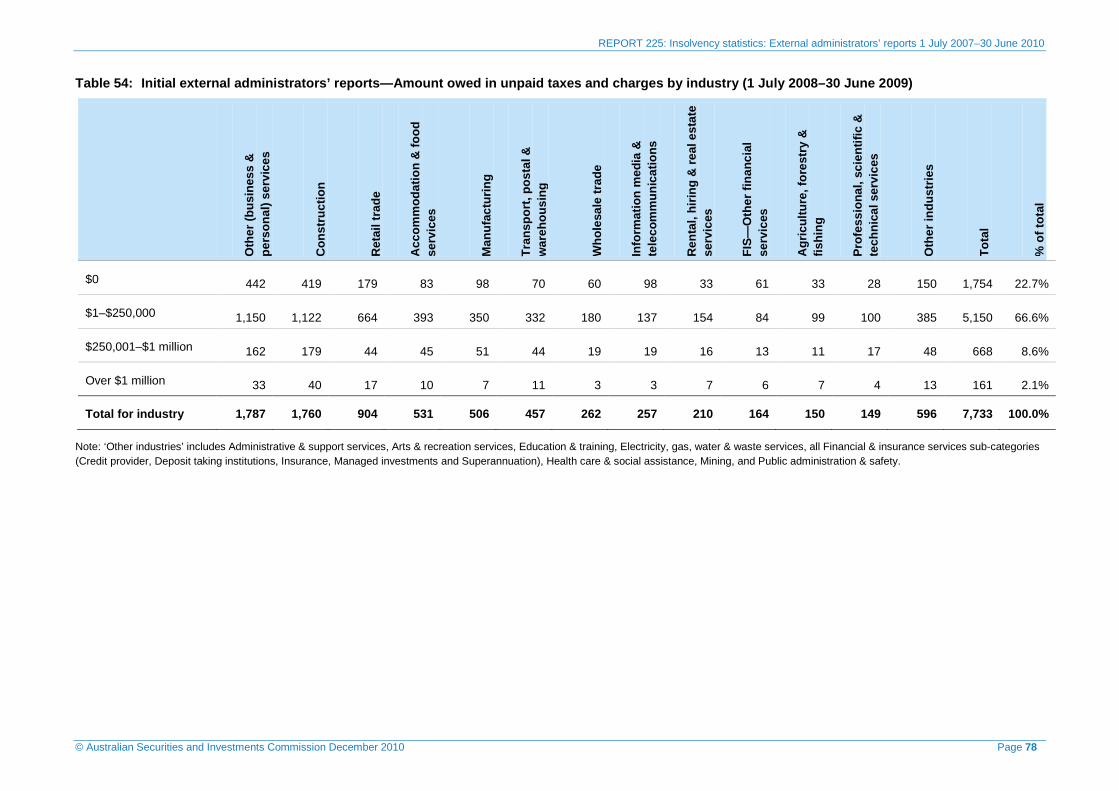
REPORT 225: Insolvency statistics: External administrators’ reports 1 July 2007–30 June 2010
© Australian Securities and Investments Commission December 2010 Page 78
Table 54: Initial external administrators’ reports—Amount owed in unpaid taxes and charges by industry (1 July 2008–30 June 2009)
Oth
er (b
usin
ess
&
pers
onal
) ser
vice
s
Con
stru
ctio
n
Ret
ail t
rade
Acc
omm
odat
ion
& fo
od
serv
ices
Man
ufac
turin
g
Tran
spor
t, po
stal
&
war
ehou
sing
Who
lesa
le tr
ade
Info
rmat
ion
med
ia &
te
leco
mm
unic
atio
ns
Ren
tal,
hirin
g &
real
est
ate
serv
ices
FIS—
Oth
er fi
nanc
ial
serv
ices
Agr
icul
ture
, for
estr
y &
fis
hing
Prof
essi
onal
, sci
entif
ic &
te
chni
cal s
ervi
ces
Oth
er in
dust
ries
Tota
l
% o
f tot
al
$0 442 419 179 83 98 70 60 98 33 61 33 28 150 1,754 22.7%
$1–$250,000 1,150 1,122 664 393 350 332 180 137 154 84 99 100 385 5,150 66.6%
$250,001–$1 million 162 179 44 45 51 44 19 19 16 13 11 17 48 668 8.6%
Over $1 million 33 40 17 10 7 11 3 3 7 6 7 4 13 161 2.1%
Total for industry 1,787 1,760 904 531 506 457 262 257 210 164 150 149 596 7,733 100.0%
Note: ‘Other industries’ includes Administrative & support services, Arts & recreation services, Education & training, Electricity, gas, water & waste services, all Financial & insurance services sub-categories (Credit provider, Deposit taking institutions, Insurance, Managed investments and Superannuation), Health care & social assistance, Mining, and Public administration & safety.

REPORT 225: Insolvency statistics: External administrators’ reports 1 July 2007–30 June 2010
© Australian Securities and Investments Commission December 2010 Page 79
Unsecured creditors
Number of unsecured creditors
162 Most reports for 2008–2009 (86.5%) indicated the company had 50 or less unsecured creditors. Of the top 12 industries, those which had the greatest percentages of 50 or less unsecured creditors were Professional, scientific & technical services (91.3%), Other (business & personal) services (91.2%) and Rental, hiring & real estate services (90.5%). See Table 55.
Amount owed to unsecured creditors
163 The majority (66.3%) of companies owed less than $250,000 to unsecured creditors. Of the top 12 industries, the three which had the greatest percentage of companies in this category were Other (business & personal) services (77.1%), Rental, hiring & real estate services (71.9%) and Transport, postal & warehousing (69.1%).
164 The two industries with the highest number of reports where companies owed more than $10 million to unsecured creditors were Construction (17 reports) and Other (business & personal) services (15 reports).
Note: In the ‘Other industries’ category, three industries with a highest number of reports where companies owed more than $10 million to unsecured creditors were Mining with 6 reports, and with 4 reports each, Administrative & support services and FIS—Managed investments.
Amounts owed to related parties
165 Of the total amount owed to unsecured creditors, 18.5% of lodgements reported that more than 50% of the debt was owed to related parties. Of the top 12 industries, those with the greatest percentage of reports showing more than 50% owed to related parties were Accommodation & food services (25.8%), Manufacturing (25.7%) and Retail trade (25%).
Note: Of those listed in ‘Other industries’, seven exceeded this percentage across all industries (18.5%): Mining (42.5%), Education & training (30.2%), FIS—Managed investments (27.7%), Administrative & support services (25.9%), Arts & recreation services (21.6%) and FIS—Credit provider (20%).
Cents in the dollar dividend
166 In 2008–2009, the dividend estimated to be payable to unsecured creditors was less than 11 cents in the dollar for most reports (97.4%). Of the top 12 industries, the top three with an estimated return of less than 11 cents in the dollar were Accommodation & food services (98.7%), and equal second, Other (business & personal) services and FIS—Other financial services (98.2% each). ‘Other industries’ includes four industries where 100%

REPORT 225: Insolvency statistics: External administrators’ reports 1 July 2007–30 June 2010
© Australian Securities and Investments Commission December 2010 Page 80
estimated less than 11 cents in the dollar: FIS—Insurance (13 reports), Public administration & safety (13 reports), FIS—Superannuation (3 reports) and FIS—Deposit taking institution (1 report).
167 Of the top 12 industries, the two industries with the greatest percentage of estimated returns of more than 50 cents in the dollar to unsecured creditors were Agriculture, forestry & fishing (3.3%) and Rental, hiring & real estate services (2.9%), compared to the proportion across all industries of 0.7%. See Table 56.

REPORT 225: Insolvency statistics: External administrators’ reports 1 July 2007–30 June 2010
© Australian Securities and Investments Commission December 2010 Page 81
Table 55: Initial external administrators’ reports—Number of unsecured creditors, amount owed and reports where > 50% is owed to related parties by industry (1 July 2008–30 June 2009)
Oth
er (b
usin
ess
&
pers
onal
) ser
vice
s
Con
stru
ctio
n
Ret
ail t
rade
Acc
omm
odat
ion
& fo
od
serv
ices
Man
ufac
turin
g
Tran
spor
t, po
stal
&
war
ehou
sing
Who
lesa
le tr
ade
Info
rmat
ion
med
ia &
te
leco
mm
unic
atio
ns
Ren
tal,
hirin
g &
real
es
tate
ser
vice
s
FIS—
Oth
er fi
nanc
ial
serv
ices
Agr
icul
ture
, for
estr
y &
fis
hing
Prof
essi
onal
, sci
entif
ic
& te
chni
cal s
ervi
ces
Oth
er in
dust
ries
Tota
l
% o
f tot
al
Number of unsecured creditors
Less than 25 1,529 1,367 574 382 301 356 163 200 173 136 110 123 463 5,877 76.0%
25–50 100 139 163 80 101 35 48 24 17 9 23 13 62 814 10.5%
51–200 69 175 127 50 87 42 40 10 8 6 13 10 47 684 8.8%
More than 200 6 17 22 1 11 6 5 3 1 3 0 0 5 80 1.0%
Unknown 83 62 18 18 6 18 6 20 11 10 4 3 19 278 3.6%
Total for industry 1,787 1,760 904 531 506 457 262 257 210 164 150 149 596 7,733 100.0%
Amount owed to unsecured creditors
Less than $250,000 1,377 1,154 527 343 273 316 137 175 151 108 79 102 385 5,127 66.3%
$250,000–$500,000 166 222 153 94 102 55 45 32 22 17 18 22 82 1,030 13.3%
$500,001–less than $1 million 115 163 103 47 60 35 41 18 19 8 20 13 51 693 9.0%
$1 million–less than $5 million 104 181 90 40 56 41 29 18 15 17 27 12 51 681 8.8%
$5 million–$10 million 10 23 17 5 8 7 5 3 1 5 5 0 9 98 1.3%
Over $10 million 15 17 14 2 7 3 5 11 2 9 1 0 18 104 1.3%
Total for industry 1,787 1,760 904 531 506 457 262 257 210 164 150 149 596 7,733 100.0%
Amounts owed to related parties
> 50% owed to related parties 291 229 226 137 130 55 56 44 33 38 28 32 129 1,428 18.5%
% of reports lodged for industry 16.3% 13.0% 25.0% 25.8% 25.7% 12.0% 21.4% 17.1% 15.7% 23.2% 18.7% 21.5% 21.6% Note: ‘Other industries’ includes Administrative & support services, Arts & recreation services, Education & training, Electricity, gas, water & waste services, remaining Financial & insurance services sub-categories (Credit provider, Deposit taking institutions, Insurance, Managed investments and Superannuation), Health care & social assistance, Mining and Public administration & safety.

REPORT 225: Insolvency statistics: External administrators’ reports 1 July 2007–30 June 2010
© Australian Securities and Investments Commission December 2010 Page 82
Table 56: Initial external administrators’ reports—Amount payable to unsecured creditors—Cents in the dollar dividend by industry (1 July 2008–30 June 2009)
Oth
er (b
usin
ess
&
pers
onal
) ser
vice
s
Con
stru
ctio
n
Ret
ail t
rade
Acc
omm
odat
ion
& fo
od
serv
ices
Man
ufac
turin
g
Tran
spor
t, po
stal
&
war
ehou
sing
Who
lesa
le tr
ade
Info
rmat
ion
med
ia &
te
leco
mm
unic
atio
ns
Ren
tal,
hirin
g &
real
es
tate
ser
vice
s
FIS
– O
ther
fina
ncia
l se
rvic
es
Agr
icul
ture
, for
estr
y &
fis
hing
Prof
essi
onal
, sci
entif
ic &
te
chni
cal s
ervi
ces
Oth
er in
dust
ries
Tota
l
% o
f tot
al
0 cents 1,691 1,623 832 501 461 420 234 238 188 154 130 135 541 7,148 92.4%
Greater than 0 but less than 11 cents 63 90 54 23 27 25 21 13 9 7 11 6 32 381 4.9%
11–20 cents 10 18 9 6 4 3 3 4 1 3 3 6 70 0.9%
21–50 cents 11 20 4 4 9 7 1 3 3 00 1 3 13 79 1.0%
51–100 cents 12 9 5 3 3 1 3 0 6 2 5 2 4 55 0.7%
Total for industry 1,787 1,760 904 531 506 457 262 257 210 164 150 149 596 7,733 100.0%
Note: ‘Other industries’ includes Administrative & support services, Arts & recreation services, Education & training, Electricity, gas, water & waste services, remaining Financial & insurance services sub-categories (Credit provider, Deposit taking institutions, Insurance, Managed investments and Superannuation), Health care & social assistance, Mining and Public administration & safety.

REPORT 225: Insolvency statistics: External administrators’ reports 1 July 2007–30 June 2010
© Australian Securities and Investments Commission December 2010 Page 83
Completion of external administration
168 In the opinion of external administrators, the majority of external administrations (72.3%) were expected to be completed within six months of the date of lodging their report. This was in addition to the time already taken to lodge the report. Table 32 shows that 22.3% of reports were lodged more than 12 months after the external administrator’s appointment.
Table 57: Initial external administrators’ reports—Expected time to complete the external administration (1 July 2008–30 June 2009)
No. %
0–less than 3 months 2,828 36.6%
3–less than 6 months 2,764 35.7%
6 months–1 year 1,680 21.7%
Over 1 year 461 6.0%
Total 7,733 100.0%
Proposed action
Public examinations
169 In 184 reports (2.4%), the external administrator noted that they were intending to hold public examinations to question a company’s directors about the affairs of the company.
Recovery proceedings
170 Recovery proceedings for property or compensation for the benefit of creditors under Pt 5.7B of the Corporations Act either had been initiated or their initiation had been considered in 1,298 (16.8%) of all reports.
Company officers
171 External administrators advised in 443 reports (5.7%) that, in their opinion, there were shadow directors.

REPORT 225: Insolvency statistics: External administrators’ reports 1 July 2007–30 June 2010
© Australian Securities and Investments Commission December 2010 Page 84
External administrator’s remuneration
172 Excluding the $0 and not applicable results, the most common category of external administrator’s estimated collectible fees was liquidator fees, with 5,083 reports. Of these, 4,709 reports estimated collectible liquidator fees between $1 and $50,000.
173 Of the reports that completed the voluntary administration fees question, 1,066 estimated the collectible fees to be between $1 and $50,000.
Table 58: Initial external administrators’ reports—External administrator’s remuneration (1 July 2008–30 June 2009)
Voluntary
administration fees Deed of company arrangement fees Liquidator fees
Receiver/ controller fees
No. % No. % No. % No. %
$0 992 12.8% 1,035 13.4% 2,446 31.6% 1,061 13.7%
$1–$50,000 1,066 13.8% 119 1.5% 4,709 60.9% 33 0.4%
$50,001–$100,000 156 2.0% 18 0.2% 247 3.2% 30 0.4%
$100,001–$250,000 57 0.7% 13 0.2% 96 1.2% 18 0.2%
Over $250,000 31 0.4% 13 0.2% 31 0.4% 34 0.4%
Not applicable 5,431 70.2% 6,535 84.5% 204 2.6% 6,557 84.8%
Total 7,733 100.0% 7,733 100.0% 7,733 100.0% 7,733 100.0%
Note: More than one fee type may be entered if the appointee has been, is or expects to be appointed to more than one type of role in relation to the company.

REPORT 225: Insolvency statistics: External administrators’ reports 1 July 2007–30 June 2010
© Australian Securities and Investments Commission December 2010 Page 85
F Initial external administrators’ reports 2007–2008
174 For the year ended 30 June 2008, initial external administrators’ reports made up 89.9% (or 6,933 reports) of the total number of external administrator statutory reports lodged: see Table 2 and Table 3 in Section C. This compares to 90.8% (or 6,865 reports) in 2006–2007.
Key points
Initial external administrators’ reports disclosed the following material movements in 2007–2008 from the previous financial year:
• Companies registered in New South Wales increased from 46.6% to 50.7% of reports.
• Companies with less than 20 employees decreased from 82.3% to 78.1% of reports. The number of reports where the size of the company was unknown increased from 12.6% to 16.8%.
• Companies with unpaid superannuation of $1–$100,000 decreased from 32.5% to 29.2% of reports.
• Unpaid taxes and charges of $250,001–$1 million decreased from 19.8% to 9.2% of reports.
• The $0 remuneration category decreased for voluntary administrators (28.7% to 19.6%), deed administrators (37.8% to 23.9%) and receivers/controllers (38.6% to 24.1%).
• The $0 remuneration category for liquidators increased from 26.9% to 30.7% of reports. In addition, the $1–$50,000 remuneration category for voluntary administrators decreased from 24% to 20.4% of reports and liquidators decreased from 65.3% to 61.8% of reports.
Lodgements by region
175 More than half the reports in 2007–2008 related to New South Wales registered companies (3,515 reports or 50.7%), followed by Victoria (1,651 reports or 23.8%) and Queensland (1,015 reports or 14.6%). The five remaining states and territories made up 10.8% of reports.

REPORT 225: Insolvency statistics: External administrators’ reports 1 July 2007–30 June 2010
© Australian Securities and Investments Commission December 2010 Page 86
Figure 7: Initial external administrators’ reports by region (1 July 2007–30 June 2008)
Note: One company with an international registered address is not included in regional statistics.
Lodgement period
176 In the year ended 30 June 2008, only 15.1% of reports were lodged within two months of the external administrator’s appointment, with 28.9% lodged more than 12 months after appointment: see Table 59.
177 The result may be distorted by instances where the first electronically lodged report was not the first report lodged.
Table 59: Initial external administrators’ reports by lodgement period (1 July 2007–30 June 2008)
No. %
Less than 2 months 1,045 15.1%
Between 2 and 5 months 2,167 31.3%
Between 6 and 12 months 1,714 24.7%
More than 12 months 2,007 28.9%
Total 6,933 100.0%

REPORT 225: Insolvency statistics: External administrators’ reports 1 July 2007–30 June 2010
© Australian Securities and Investments Commission December 2010 Page 87
Section lodged under
178 Most reports in 2007–2008 (94%) were lodged by liquidators under s533 of the Corporations Act: see Table 60.
Table 60: Initial external administrators’ reports by section of the Corporations Act (1 July 2007–30 June 2008)
No. %
Section 422 (reports by receiver) 51 0.7%
Section 438D (reports by administrator) 363 5.2%
Section 533 (reports by liquidator) 6,514 94.0%
Statistical purposes 5 0.1%
Total 6,933 100.0%
Size of company
179 The number of employees or the number of full-time equivalent employees is used as a measure of the size of the company. In 2007–2008, 78.1% of reports related to companies with less than 20 employees compared to 82.3% in 2006–2007: see Table 61.
Table 61: Initial external administrators’ reports—Size of company as measured by number of FTEs (1 July 2007–30 June 2008)
No. %
Less than 5 FTE 4,287 61.8%
Between 5 and 19 FTE 1,129 16.3%
Between 20 and 199 FTE 342 4.9%
200 or more FTE 7 0.1%
Not known 1,168 16.8%
Total 6,933 100.0%
Note: FTE = Full-time equivalent employees.
Industry 180 As for the previous financial year, in 2007–2008, the industries with the
highest number of reports lodged were Construction (1,517 reports or 21.9%), Services to business (873 reports or 12.6%) and Retail trade (860 reports or 12.4%): see Table 62.
181 The top 12 industries are the same as for 2006–2007, but with some changes in order of ranking.

REPORT 225: Insolvency statistics: External administrators’ reports 1 July 2007–30 June 2010
© Australian Securities and Investments Commission December 2010 Page 88
Table 62: Initial external administrators’ reports by industry type (1 July 2007–30 June 2008)
No. % No. %
Construction 1,517 21.9% Agriculture 127 1.8%
Services to business 873 12.6% Health & community services 90 1.3%
Retail trade 860 12.4% Cultural & recreational services 86 1.2%
Property & business services 643 9.3% Managed investments 50 0.7%
Accommodation, cafes & restaurants 507 7.3% Mining 33 0.5%
Personal & other services 498 7.2% Education 28 0.4%
Transport & storage 438 6.3% Electricity, gas & water supply 27 0.4%
Manufacturing 434 6.3% Credit provider 15 0.2%
Wholesale trade 260 3.8% Insurance 12 0.2%
Communication & services 234 3.4% Superannuation 3 0.0%
Other financial services 198 2.9% Total 6,933 100.0%
Note: No reports were received for Deposit taking institutions and Government administration & defence.
Nominated causes of failure 182 There is commonly more than one reason for a company’s failure. External
administrators nominated an average of 2.31 causes of failure per report in 2007–2008.
183 The top three nominated causes of failure for companies (see Table 63 and Table 64) were: poor strategic management of business (2,937 or 42.4% of reports); inadequate cash flow or high cash use (2,871 or 41.4% of reports); and poor financial control including lack of records (2,380 or 34.3% of reports).
184 Of the top 12 industries, the three industries which most exceeded the percentage of reports for these three causes of failure were: poor strategic management of business: Manufacturing (46.3% of
reports), and equal second, Property & business services and Transport & storage (45.7% of reports each);
inadequate cash flow or high cash use: Transport & storage (46.6% of reports), Communication & services (45.7% of reports) and Accommodation, cafes & restaurants (45.4% of reports);
poor financial control including lack of records: equal first were Property & business services and Communication & services (39.3% of reports), and Transport & storage (38.4% of reports).
185 Six states and territories shared the same top two causes of failure but not in the same order: Australian Capital Territory, New South Wales, Queensland, Tasmania, Victoria and Western Australia. See Table 62.

REPORT 225: Insolvency statistics: External administrators’ reports 1 July 2007–30 June 2010
© Australian Securities and Investments Commission December 2010 Page 89
Table 63: Initial external administrators’ reports—Nominated causes of failure by industry (1 July 2007–30 June 2008)
Con
stru
ctio
n
Serv
ices
to b
usin
ess
Ret
ail t
rade
Prop
erty
& b
usin
ess
serv
ices
Acc
omm
odat
ion,
caf
es
& re
stau
rant
s
Pers
onal
& o
ther
se
rvic
es
Tran
spor
t & s
tora
ge
Man
ufac
turin
g
Who
lesa
le tr
ade
Com
mun
icat
ion
&
serv
ices
Oth
er fi
nanc
ial
serv
ices
Agr
icul
ture
Oth
er in
dust
ries
Tota
l
Under capitalisation 357 184 225 149 141 103 101 113 62 59 44 29 73 1,640
Poor financial control including lack of records 581 264 264 253 190 156 168 116 76 92 70 41 109 2,380
Poor management of accounts receivable 298 130 81 63 20 45 92 65 40 41 12 8 41 936
Poor strategic management of business 609 370 350 294 229 214 200 201 100 99 70 49 152 2,937
Inadequate cash flow or high cash use 609 346 380 265 230 182 204 191 111 107 77 38 131 2,871
Poor economic conditions 139 47 95 50 53 21 57 61 27 15 22 23 19 629
Natural disaster 5 0 13 0 8 2 4 4 2 0 0 8 3 49
Fraud 13 5 23 21 7 7 14 3 7 7 13 0 16 136
DOCA failed 11 3 9 6 3 0 4 6 4 0 2 2 8 58
Dispute among directors 68 37 33 38 29 19 18 19 17 10 13 6 20 327
Trading losses 442 323 399 158 235 150 153 164 106 75 37 33 98 2,373
Industry restructuring 13 13 27 6 2 6 11 18 15 9 1 5 12 138
Other 323 181 188 160 78 124 74 105 62 46 72 29 87 1,529
Nominated causes of failure by industry 3,468 1,903 2,087 1,463 1,225 1,029 1,100 1,066 629 560 433 271 769 16,003
Note: ‘Other industries’ includes Credit provider, Cultural & recreational services, Education, Electricity, gas & water supply, Health & community services, Insurance, Managed investments, Mining and Superannuation.

REPORT 225: Insolvency statistics: External administrators’ reports 1 July 2007–30 June 2010
© Australian Securities and Investments Commission December 2010 Page 90
Table 64: Initial external administrators’ reports—Nominated causes of failure by region (1 July 2007–30 June 2008)
ACT NSW NT QLD SA TAS VIC WA Total
Under capitalisation 38 782 6 240 97 11 377 89 1,640
Poor financial control including lack of records 45 1,379 5 319 84 11 433 103 2,379
Poor management of accounts receivable 20 458 1 160 54 9 201 33 936
Poor strategic management of business 52 1,398 2 493 141 20 695 135 2,936
Inadequate cash flow or high cash use 50 1,440 4 464 134 14 638 126 2,870
Poor economic conditions 8 382 1 79 22 2 117 18 629
Natural disaster 3 20 0 7 2 0 15 2 49
Fraud 4 54 0 32 8 1 27 10 136
DOCA failed 0 22 0 15 4 0 8 9 58
Dispute among directors 5 128 2 49 16 3 101 23 327
Trading losses 28 1,173 7 382 149 11 504 119 2,373
Industry restructuring 2 49 0 13 9 3 49 13 138
Other 17 673 3 253 66 9 423 85 1,529
Total 272 7,958 31 2,506 786 94 3,588 765 16,000
Note: Causes of failure for companies with international registered addresses are not included in regional statistics.

REPORT 225: Insolvency statistics: External administrators’ reports 1 July 2007–30 June 2010
© Australian Securities and Investments Commission December 2010 Page 91
Liabilities and assets
186 External administrators provide estimates of the assets, liabilities and overall financial deficiency of companies they are reporting on. Table 65 shows the assets and liabilities categories and Table 66 shows the deficiency for the top 12 industries by reports lodged (as noted in Table 62).
Assets
187 Most reports (63.8%) showed that the companies had estimated assets of $10,000 or less.
188 Of the top 12 industries, those with the greatest percentage of reports estimating assets of $10,000 or less were Services to business (73.5%), Personal & other services (72.9%) and equal third, Communication & services and Other financial services (66.7%).
189 In 42.2% (2,925) of reports, the external administrator estimated the administration was assetless. Of the top 12 industries, those that most exceeded this percentage for assetless administrations (42.2%) were Services to business (50.3%) Personal and other services (46.6%) and Communication & services (46.2%).
190 On the other hand, 7.4% of reports estimated assets of over $250,000. Of the top 12 industries, those well above this percentage were Agriculture (14.2%), Other financial services (14.1%) and Wholesale trade (13.8%).
Note: In the ‘Other industries’ category, Mining (18.2%), Managed investments (18%), Health & community services (11.1%), Insurance (8.3%) and Cultural & recreational services (8.1%) all exceeded this percentage across all industries (7.4%), but made up only 3.9% of all reports.
Liabilities
191 More than half of reports (54.6%) indicated that the estimated liabilities of the failed companies were $250,000 or less and 84% indicated estimated liabilities less than $1 million.
192 Of the top 12 industries, those with the greatest percentage of companies with estimated liabilities of $250,000 or less were Personal & other services (70.9%), Services to business (65.9%) and Transport & storage (58.7%).
193 A comparison of those industries with estimated liabilities over $10 million reveals that the proportion of reports in that category across all industries (1.4%) was exceeded by Other financial services (4%), Manufacturing (2.5%) and Accommodation, cafes & restaurants (2%).
Note: In the ‘Other industries’ category, Mining (15.2%), Managed investments (8%), Health & community services (2.2%) all exceeded this percentage across all industries (1.4%), but made up only 2.5% of all reports.

REPORT 225: Insolvency statistics: External administrators’ reports 1 July 2007–30 June 2010
© Australian Securities and Investments Commission December 2010 Page 92
Deficiency
194 Across all industries, 57.6% of reports estimated the shortfall between estimated assets and estimated liabilities was $250,000 or less. When comparing the deficiency estimates between the top 12 industries, the three industries with the highest percentage of estimates at $250,000 or less were Personal & other services (72.9%), Services to business (68.7%) and Transport & storage (61.4%).
195 Only 1.1% of all reports estimated a deficiency of over $10 million. Of the top 12 industries, those that most exceeded this percentage were Other financial services (4%), Manufacturing (2.3%) and Wholesale trade (1.9%).
Note: Five industries grouped in ‘Other industries’ exceeded this percentage across all industries (1.1%): Mining (15.2%), Credit provider (6.7%), Managed investments (6%), Health & community services (2.2%) and Cultural & recreational services (1.2%). However, when combined, these industries made up only 4% of reports.

REPORT 225: Insolvency statistics: External administrators’ reports 1 July 2007–30 June 2010
© Australian Securities and Investments Commission December 2010 Page 93
Table 65: Initial external administrators’ reports—Amount of assets and liabilities by industry (1 July 2007–30 June 2008)
Con
stru
ctio
n
Serv
ices
to
busi
ness
Ret
ail t
rade
Prop
erty
& b
usin
ess
serv
ices
Acc
omm
odat
ion,
ca
fes
& re
stau
rant
s
Pers
onal
& o
ther
se
rvic
es
Tran
spor
t & s
tora
ge
Man
ufac
turin
g
Who
lesa
le tr
ade
Com
mun
icat
ion
&
serv
ices
Oth
er fi
nanc
ial
serv
ices
Agr
icul
ture
Oth
er in
dust
ries
Tota
l
% o
f tot
al
Asset categories
Less than $1 675 439 312 294 213 232 175 132 87 108 81 47 130 2,925 42.2%
$1–$10,000 328 203 220 126 94 131 84 74 49 48 51 27 66 1,501 21.7%
$10,001–$20,000 133 79 81 46 68 40 54 47 16 13 13 8 41 639 9.2%
$20,001–$30,000 55 29 48 18 28 28 14 20 11 5 4 6 13 279 4.0%
$30,001–$50,000 62 25 61 17 30 21 30 31 14 10 4 8 16 329 4.7%
$50,001–$100,000 78 30 57 29 31 14 25 36 22 9 10 3 21 365 5.3%
$100,001–$250,000 81 33 41 30 18 19 25 51 25 20 7 10 19 379 5.5%
$250,001–$5 million 96 33 40 73 24 13 31 42 34 20 23 18 33 480 6.9%
Over $5 million 9 2 0 10 1 0 0 1 2 1 5 0 5 36 0.5%
Total for industry 1,517 873 860 643 507 498 438 434 260 234 198 127 344 6,933 100.0%
Liability categories
$1–$250,000 864 575 439 318 270 353 257 181 109 112 96 53 159 3,786 54.6%
$250,001–less than $1 million 410 215 308 189 183 111 130 156 75 64 58 45 97 2,041 29.4%
$1 million–less than $5 million 185 76 92 105 42 28 42 72 64 44 26 24 66 866 12.5%
$5 million–$10 million 40 6 9 22 2 4 5 14 7 10 10 3 10 142 2.0%
Over $10 million 18 1 12 9 10 2 4 11 5 4 8 2 12 98 1.4%
Total for industry 1,517 873 860 643 507 498 438 434 260 234 198 127 344 6,933 100.0%
Note: ‘Other industries’ includes Credit provider, Cultural & recreational services, Education, Electricity, gas & water supply, Health & community services, Insurance, Managed investments, Mining and Superannuation.

REPORT 225: Insolvency statistics: External administrators’ reports 1 July 2007–30 June 2010
© Australian Securities and Investments Commission December 2010 Page 94
Table 66: Initial external administrators’ reports—Amount of deficiency by industry (1 July 2007–30 June 2008)
Con
stru
ctio
n
Serv
ices
to b
usin
ess
Ret
ail t
rade
Prop
erty
& b
usin
ess
serv
ices
Acc
omm
odat
ion,
ca
fes
& re
stau
rant
s
Pers
onal
& o
ther
se
rvic
es
Tran
spor
t & s
tora
ge
Man
ufac
turin
g
Who
lesa
le tr
ade
Com
mun
icat
ion
&
serv
ices
Oth
er fi
nanc
ial
serv
ices
Agr
icul
ture
Oth
er in
dust
ries
Tota
l
% o
f tot
al
$0–$50,000 386 222 122 121 81 141 99 51 30 47 51 30 64 1,445 20.8%
$50,001–$250,000 516 378 343 228 204 222 170 152 83 67 53 28 107 2,551 36.8%
$250,001–less than $500,000 247 135 182 110 107 72 87 73 38 42 35 20 56 1,204 17.4%
$500,000–less than $1 million 145 63 108 78 70 31 38 71 40 25 19 22 38 748 10.8%
$1 million–less than $5 million 178 70 84 89 41 27 37 64 61 38 24 21 58 792 11.4%
$5 million–$10 million 32 5 10 13 1 4 4 13 3 12 8 4 9 118 1.7%
Over $10 million 13 0 11 4 3 1 3 10 5 3 8 2 12 75 1.1%
Total for industry 1,517 873 860 643 507 498 438 434 260 234 198 127 344 6,933 100.0%
Note: ‘Other industries’ includes Credit provider, Cultural & recreational services, Education, Electricity, gas & water supply, Health & community services, Insurance, Managed investments, Mining and Superannuation.

REPORT 225: Insolvency statistics: External administrators’ reports 1 July 2007–30 June 2010
© Australian Securities and Investments Commission December 2010 Page 95
Employee entitlements
196 In all categories of employee entitlements (i.e. wages, annual leave, pay in lieu of notice, redundancy, long service leave and superannuation), ‘Not applicable’ was selected in the majority of reports: see Table 67 and Table 68. ‘Not applicable’ means that no amount of entitlement of that type was unpaid to employee creditors as at the date of the appointment of the external administrator.
Table 67: Initial external administrators’ reports—Amounts owed in unpaid employee entitlements (1 July 2007–30 June 2008)
Unpaid wages Unpaid
annual leave Unpaid pay in lieu of notice
Unpaid redundancy
Unpaid long service leave
No. % No. % No. % No. % No. %
$1–$1,000 292 4.2% 217 3.1% 216 3.1% 186 2.7% 183 2.7%
$1,001–$10,000 825 12.0% 846 12.3% 324 4.7% 135 2.0% 140 2.0%
$10,001–$50,000 347 5.0% 448 6.5% 204 3.0% 159 2.3% 166 2.4%
$50,001–$150,000 90 1.3% 107 1.6% 51 0.7% 75 1.1% 41 0.6%
$150,001–$250,000 25 0.4% 23 0.3% 7 0.1% 13 0.2% 3 0.0%
$250,001–$500,000 16 0.2% 12 0.2% 3 0.0% 5 0.1% 3 0.0%
$500,001–less than $1.5 million 6 0.1% 4 0.1% 3 0.0% 7 0.1% 0 0.0%
$1.5 million– $5 million 0 0.0% 0 0.0% 2 0.0% 1 0.0% 0 0.0%
Over $5 million 5 0.1% 4 0.1% 9 0.1% 5 0.1% 4 0.1%
Not applicable 5,291 76.7% 5,236 75.9% 6,078 88.1% 6,311 91.5% 6,357 92.2%
Total 6,897 100.0% 6,897 100.0% 6,897 100.0% 6,897 100.0% 6,897 100.0%
Note: 36 reports identified as being internally inconsistent were excluded from this table.
Unpaid wages
197 76.7% of reports showed unpaid wages as not applicable. In 16.2% of reports, it was estimated that employees were owed $1 to $10,000 in unpaid wages. Categories from $10,001 to over $5 million made up 7.1% of reports.

REPORT 225: Insolvency statistics: External administrators’ reports 1 July 2007–30 June 2010
© Australian Securities and Investments Commission December 2010 Page 96
Unpaid annual leave
198 In all, 75.9% of reports showed unpaid annual leave as not applicable. In 15.4% of cases, employees were owed $1 to $10,000, and 21.9% of companies owed $50,000 or less. All other categories made up 2.2% of reports.
Unpaid pay in lieu of notice
199 Again, unpaid pay in lieu of notice was not applicable in most cases (88.1%). 1.1% of reports showed entitlements for unpaid pay in lieu of notice over $50,000.
Unpaid redundancy
200 Unpaid redundancy was not applicable in 91.5% of reports. In all, 4.7% of reports showed employees were owed $1 to $10,000 in redundancy payments.
201 Only 0.1% of reports showed unpaid redundancy of over $5 million.
Unpaid long service leave
202 4.7% of reports showed employees were owed $1 to $10,000 in unpaid long service leave, and unpaid long service leave of more than $5 million was estimated in only 0.1% of reports.
203 The majority of reports (92.2%) indicated a long service leave debt was not applicable.
Unpaid superannuation
204 Due to the different value categories of superannuation entitlements, these figures are shown separately in Table 68. The results show a similar pattern to other employee entitlements with a large number (68%) of reports showing unpaid superannuation as not applicable.
Table 68: Initial external administrators’ reports— Amounts owed in unpaid superannuation entitlements (1 July 2007–30 June 2008)
No. %
$1–$100,000 2,021 29.2%
$100,001–$250,000 144 2.1%
$250,001–$1 million 32 0.5%
Over $1 million 24 0.3%
Not applicable 4,711 68.0%
Total 6,932 100.0%
Note: One report identified as being internally inconsistent was excluded from this table.

REPORT 225: Insolvency statistics: External administrators’ reports 1 July 2007–30 June 2010
© Australian Securities and Investments Commission December 2010 Page 97
Secured creditors
205 Table 69 shows the amounts owed to secured creditors for the six industries with the highest number of reports, with the remaining 29.4% grouped under ‘Other industries’. Most reports for 2007–2008 (72.8%) indicated that nothing was owed to secured creditors.
206 A significant proportion (21.8%) of 2007–2008 reports showed secured creditors were owed between $1 and less than $1 million.
207 0.8% of reports showed more than $10 million was owed to secured creditors.
Note: Of those listed in ‘Other industries’, the three industries which most exceeded this percentage of reports across all industries with amounts owed to secured creditors over $10 million (0.8%) were Mining (9.1% or 3 reports), Other financial services (3% or 6 reports) and Health & community services (2.2% or 2 reports).
208 Figure 8 illustrates the amounts owed to secured creditors by industry.
Unpaid taxes and charges
209 Most reports (89%) indicated that the amount of unpaid taxes and charges was $250,000 or less.
210 Of the top six industries, Personal & other services exceeded this percentage of reports owing $250,000 or less in unpaid taxes and charges with 94.4%.
211 Of the top six industries, Construction and Services to business had the highest percentage of unpaid taxes and charges over $1 million (2.5% each) compared to the percentage across all industries of 1.8%. See Table 70.
Note: In the ‘Other industries’ category, the three industries that most exceeded this percentage across all industries (1.8%) of unpaid taxes and charges of over $1 million were Managed investments (12%), Mining (9.1%), and Credit provider (6.7%). These industries represented 1.4% of all reports.

REPORT 225: Insolvency statistics: External administrators’ reports 1 July 2007–30 June 2010
© Australian Securities and Investments Commission December 2010 Page 98
Table 69: Initial external administrators’ reports—Amount owed to secured creditors by industry (1 July 2007–30 June 2008)
Construction
Services to business
Retail trade
Property & business services
Accommodation, cafes &
restaurants
Personal & other
services
Other industries
Total
No. % No. % No. % No. % No. % No. % No. % No. %
$0 1,148 75.7% 735 84.2% 583 67.8% 450 70.0% 345 68.0% 407 81.7% 1,379 67.8% 5,047 72.8%
$1–less than $500,000 254 16.7% 112 12.8% 207 24.1% 104 16.2% 124 24.5% 70 14.1% 431 21.2% 1,302 18.8%
$500,000–less than $1 million 42 2.8% 18 2.1% 26 3.0% 24 3.7% 12 2.4% 12 2.4% 72 3.5% 206 3.0%
$1 million–less than $5 million 53 3.5% 6 0.7% 31 3.6% 43 6.7% 18 3.6% 8 1.6% 109 5.4% 268 3.9%
$5 million–$10 million 9 0.6% 2 0.2% 2 0.2% 15 2.3% 0 0.0% 1 0.2% 23 1.1% 52 0.8%
Over $10 million 11 0.7% 0 0.0% 11 1.3% 7 1.1% 8 1.6% 0 0.0% 21 1.0% 58 0.8%
Total for industry 1,517 100.0% 873 100.0% 860 100.0% 643 100.0% 507 100.0% 498 100.0% 2,035 100.0% 6,933 100.0%
Note: ‘Other industries’ includes Agriculture, Communication & services, Credit provider, Cultural & recreational services, Education, Electricity, gas & water supply, Health & community services, Insurance, Managed investments, Manufacturing, Mining, Other financial services, Superannuation, Transport and storage and Wholesale trade.

REPORT 225: Insolvency statistics: External administrators’ reports 1 July 2007–30 June 2010
© Australian Securities and Investments Commission December 2010 Page 99
Figure 8: Initial external administrators’ reports—Amount owed to secured creditors by industry (1 July 2007–30 June 2008)
0
200
400
600
800
1,000
1,200
1,400
1,600
1,800 Over $10 million$5 million - $10 million$1 million - less than $5 million$500,001 - less than $1 million$1 - less than $500,000$0

REPORT 225: Insolvency statistics: External administrators’ reports 1 July 2007–30 June 2010
© Australian Securities and Investments Commission December 2010 Page 100
Table 70: Initial external administrators’ reports—Amount owed in unpaid taxes and charges by industry (1 July 2007–30 June 2008)
Construction Services to business Retail trade
Property & business services
Accommodation, cafes & restaurants
Personal & other services
Other industries Total
No. % No. % No. % No. % No. % No. % No. % No. %
$0 309 20.4% 152 17.4% 165 19.2% 145 22.6% 51 10.1% 98 19.7% 376 18.5% 1,296 18.7%
$1–$250,000 1,013 66.8% 595 68.2% 641 74.5% 406 63.1% 418 82.4% 372 74.7% 1,430 70.3% 4,875 70.3%
$250,001–$1 million 157 10.3% 104 11.9% 47 5.5% 82 12.8% 31 6.1% 24 4.8% 190 9.3% 635 9.2%
Over $1 million 38 2.5% 22 2.5% 7 0.8% 10 1.6% 7 1.4% 4 0.8% 39 1.9% 127 1.8%
Total for industry 1,517 100.0% 873 100.0% 860 100.0% 643 100.0% 507 100.0% 498 100.0% 2,035 100.0% 6,933 100.0%
Note: ‘Other industries’ includes Agriculture, Communication & services, Credit provider, Cultural & recreational services, Education, Electricity, gas & water supply, Health & community services, Insurance, Managed investments, Manufacturing, Mining, Other financial services, Superannuation, Transport & storage and Wholesale trade.

REPORT 225: Insolvency statistics: External administrators’ reports 1 July 2007–30 June 2010
© Australian Securities and Investments Commission December 2010 Page 101
Unsecured creditors
Number of unsecured creditors
212 Most reports for 2007–2008 (88.6%) indicated the company had 50 or less unsecured creditors. Of the top 12 industries, those which had the greatest percentages of 50 or less unsecured creditors were Other financial services (94.4%), Property & business services (93.8%) and Services to business (92.3%). See Table 71.
Amount owed to unsecured creditors
213 The majority (68.3%) of companies owed less than $250,000 to unsecured creditors. Of the top 12 industries, the three which had the greatest percentage of companies in this category were Personal & other services (83.3%), Services to business (79.8%) and Transport & storage (73.1%).
214 The two industries with the highest number of reports where companies owed more than $10 million to unsecured creditors were Retail trade (12 reports) and Other financial services (6 reports).
Note: In the ‘Other industries’ category, two industries showed three reports each where companies owed more than $10 million to unsecured creditors: Managed investments and Mining.
Amounts owed to related parties
215 Of the total amount owed to unsecured creditors, 17% of lodgements reported that more than 50% of the debt was owed to related parties. Of the top 12 industries, those with the greatest percentage of reports showing more than 50% owed to related parties were Retail trade (23.8%), Other financial services (23.7%), and equal third, Accommodation, cafes & restaurants and Manufacturing (22.1%).
Note: Of those listed in ‘Other industries’, seven exceeded this percentage across all industries (17%): Health & community services and Credit provider (26.7% each), Managed investments (26%), Mining (24.2%), Electricity, gas & water supply (22.2%), Cultural & recreational services (19.8%) and Education (17.9%).
Cents in the dollar dividend 216 In 2007–2008, the dividend estimated to be payable to unsecured creditors was less
than 11 cents in the dollar for most reports (96.4%). Of the top 12 industries, the top three with an estimated return of less than 11 cents in the dollar were Other financial services (99%), Retail trade (98.4%) and Communication & services (98.3%). ‘Other industries’ includes two industries where 100% estimated less than 11 cents in the dollar: Education (28 reports) and Superannuation (3 reports).
217 Of the top 12 industries, the two industries with the greatest percentage of estimated returns of more than 50 cents in the dollar to unsecured creditors were Property & business services (2.3%) and Wholesale trade (1.5%), compared to the proportion across all industries of 1%. See Table 72.

REPORT 225: Insolvency statistics: External administrators’ reports 1 July 2007–30 June 2010
© Australian Securities and Investments Commission December 2010 Page 102
Table 71: Initial external administrators’ reports—Number of unsecured creditors, amount owed and reports where > 50% is owed to related parties by industry (1 July 2007–30 June 2008)
Con
stru
ctio
n
Serv
ices
to
busi
ness
Ret
ail t
rade
Prop
erty
& b
usin
ess
serv
ices
Acc
omm
odat
ion,
ca
fes
& re
stau
rant
s
Pers
onal
& o
ther
se
rvic
es
Tran
spor
t & s
tora
ge
Man
ufac
turin
g
Who
lesa
le tr
ade
Com
mun
icat
ion
&
serv
ices
Oth
er fi
nanc
ial
serv
ices
Agr
icul
ture
Oth
er in
dust
ries
Tota
l
% o
f tot
al
Number of unsecured creditors
Less than 25 1,206 754 568 563 375 434 337 263 166 176 172 95 251 5,360 77.3%
25–50 153 52 162 40 74 25 47 80 45 29 15 14 47 783 11.3%
51–200 123 39 103 26 44 20 38 77 41 22 8 12 27 580 8.4%
More than 200 7 1 6 1 0 2 6 4 4 1 1 0 6 39 0.6%
Unknown 28 27 21 13 14 17 10 10 4 6 2 6 13 171 2.5%
Total for industry 1,517 873 860 643 507 498 438 434 260 234 198 127 344 6,933 100.0%
Amount owed to unsecured creditors
Less than $250,000 1,049 697 536 423 358 415 320 251 130 141 133 74 207 4,734 68.3%
$250,000–$500,000 208 85 157 74 81 41 63 75 40 33 22 19 40 938 13.5%
$500,001–less than $1 million 113 43 84 67 46 22 19 55 30 24 16 17 39 575 8.3%
$1 million–less than $5 million 124 46 67 72 21 18 29 45 52 25 17 14 40 570 8.2%
$5 million–$10 million 18 2 4 5 0 1 3 6 3 9 4 2 9 66 1.0%
Over $10 million 5 0 12 2 1 1 4 2 5 2 6 1 9 50 0.7%
Total for industry 1,517 873 860 643 507 498 438 434 260 234 198 127 344 6,933 100.0%
Amounts owed to related parties
> 50% owed to related parties 173 123 205 128 112 57 34 96 53 48 47 24 78 1,178 17.0%
% of reports lodged for industry 11.4% 14.1% 23.8% 19.9% 22.1% 11.4% 7.8% 22.1% 20.4% 20.5% 23.7% 18.9% 22.7%
Note: ‘Other industries’ includes Credit provider, Cultural & recreational services, Education, Electricity, gas & water supply, Health & community services, Insurance, Managed investments, Mining and Superannuation.

REPORT 225: Insolvency statistics: External administrators’ reports 1 July 2007–30 June 2010
© Australian Securities and Investments Commission December 2010 Page 103
Table 72: Initial external administrators’ reports—Amount payable to unsecured creditors—Cents in the dollar dividend by industry (1 July 2007–30 June 2008)
Con
stru
ctio
n
Serv
ices
to b
usin
ess
Ret
ail t
rade
Prop
erty
& b
usin
ess
serv
ices
Acc
omm
odat
ion,
ca
fes
& re
stau
rant
s
Pers
onal
& o
ther
se
rvic
es
Tran
spor
t & s
tora
ge
Man
ufac
turin
g
Who
lesa
le tr
ade
Com
mun
icat
ion
&
serv
ices
Oth
er fi
nanc
ial
serv
ices
Agr
icul
ture
Oth
er in
dust
ries
Tota
l
% o
f tot
al
0 cents 1,370 800 807 577 479 470 391 393 220 214 186 105 297 6,309 91.0%
Greater than 0 but less than 11 cents 85 40 39 35 14 13 29 26 22 16 10 12 31 372 5.4%
11–20 cents 20 13 6 7 0 3 10 5 7 2 1 5 5 84 1.2%
21–50 cents 24 14 5 9 8 6 5 5 7 2 1 4 9 99 1.4%
51–100 cents 18 6 3 15 6 6 3 5 4 0 0 1 2 69 1.0%
Total for industry 1,517 873 860 643 507 498 438 434 260 234 198 127 344 6,933 100.0%
Note: ‘Other industries’ includes Credit provider, Cultural & recreational services, Education, Electricity, gas & water supply, Health & community services, Insurance, Managed investments, Mining and Superannuation.

REPORT 225: Insolvency statistics: External administrators’ reports 1 July 2007–30 June 2010
© Australian Securities and Investments Commission December 2010 Page 104
Completion of external administration
218 In the opinion of external administrators, the majority of external administrations (73.6%) were expected to be completed within six months of the date of lodging their report. This was in addition to the time already taken to lodge the report. Table 59 shows that 28.9% of reports were lodged more than 12 months after the external administrator’s appointment.
Table 73: Initial external administrators’ reports—Expected time to complete the external administration (1 July 2007–30 June 2008)
No. %
0–less than 3 months 2,811 40.5%
3–less than 6 months 2,289 33.0%
6 months–1 year 1,418 20.5%
Over 1 year 415 6.0%
Total 6,933 100.0%
Proposed action
Public examinations
219 In 148 reports (2.1%), the external administrator noted that they were intending to hold public examinations to question a company’s directors about the affairs of the company.
Recovery proceedings
220 Recovery proceedings for property or compensation for the benefit of creditors under Pt 5.7B of the Corporations Act either had been initiated or their initiation had been considered in 1,073 (15.5%) of all reports.
Company officers
221 External administrators advised in 3,636 reports (52.4%) that officers of the company were or had been officers of other companies. A further 1,846 (26.6%) reports indicated it was unknown if officers were or had been officers in other companies.
222 External administrators advised in 445 reports (6.4%) that, in their opinion, there were shadow directors.

REPORT 225: Insolvency statistics: External administrators’ reports 1 July 2007–30 June 2010
© Australian Securities and Investments Commission December 2010 Page 105
External administrator’s remuneration
223 Excluding the $0 and not applicable results, the most common category of external administrator’s estimated collectible fees was liquidator fees, with 4,675 reports. Of these, 4,282 reports estimated collectible liquidator fees between $1 and $50,000.
224 Of the reports that completed the voluntary administration fees question, 1,417 estimated the collectible fees to be between $1 and $50,000.
Table 74: Initial external administrators’ reports—External administrator’s remuneration (1 July 2007–30 June 2008)
Voluntary
administration fees Deed of company arrangement fees Liquidator fees
Receiver/ controller fees
No. % No. % No. % No. %
$0 1,362 19.6% 1,654 23.9% 2,125 30.7% 1,671 24.1%
$1–$50,000 1,417 20.4% 117 1.7% 4,282 61.8% 26 0.4%
$50,001–$100,000 149 2.1% 17 0.2% 276 4.0% 21 0.3%
$100,001–$250,000 41 0.6% 1 0.0% 90 1.3% 7 0.1%
Over $250,000 19 0.3% 10 0.1% 27 0.4% 14 0.2%
Not applicable 3,945 56.9% 5,134 74.1% 133 1.9% 5,194 74.9%
Total 6,933 100.0% 6,933 100.0% 6,933 100.0% 6,933 100.0%
Note: More than one fee type may be entered if the appointee has been, is or expects to be appointed to more than one type of role in relation to the company.

REPORT 225: Insolvency statistics: External administrators’ reports 1 July 2007–30 June 2010
© Australian Securities and Investments Commission December 2010 Page 106
Key terms
Term Meaning in this document
AA Fund Assetless Administration Fund
administrator A voluntary administrator Note: The definition in this document is therefore different to that in s9.
ANZSIC Australian and New Zealand Standard Industrial Classification
ASCOT ASIC’s corporate database
ASIC Australian Securities and Investments Commission
CALDB Companies Auditors and Liquidators Disciplinary Board
Ch 5 (for example) A chapter of the Corporations Act (in this example numbered 5)
Corporations Act Corporations Act 2001 (Cth)
deed administrator An administrator of a deed of company arrangement
electronic—direct Schedule B reports lodged directly by external administrators through the registered liquidators’ portal
electronic—staff portal
Schedule B reports lodged on paper by external administrators in the Schedule B report format and subsequently entered by ASIC staff through the staff portal
electronically lodged report
A Schedule B report lodged directly by external administrators through the registered liquidators’ portal, or on paper by external administrators in the Schedule B format, and subsequently entered by ASIC staff through the staff portal
EXAD External administration
external administration
The corporate insolvency that the external administrator has been appointed to administer
external administrator A liquidator, receiver or administrator
initial external administrator report
The first electronically lodged Schedule B report after a company has entered external administration
insolvency practitioner
A generic term to describe registered liquidators generally, regardless of whether they have been appointed to one or more specific external administrations

REPORT 225: Insolvency statistics: External administrators’ reports 1 July 2007–30 June 2010
© Australian Securities and Investments Commission December 2010 Page 107
Term Meaning in this document
liquidator An insolvency practitioner appointed under Ch 5 of the Corporations Act to wind up the affairs and distribute the property of a body corporate
manual report A report lodged by external administrators on paper not in Schedule B format
Practice Note 50 A guide first issued by ASIC on 28 April 1994 for external administrators regarding their reporting obligations to ASIC, superseded by Regulatory Guide 16 on 2 October 2007
Pt 5.7B (for example) A part of the Corporations Act (in this example, numbered 5.7B)
receiver An insolvency practitioner appointed under an instrument or by the court to receive property of a body corporate
report An initial external administrator report
RG 16 Regulatory Guide 16 issued by ASIC on 2 October 2006 for external administrators on their reporting obligations to ASIC, replacing Practice Note 50
registered liquidator A person registered by ASIC under s1282(2)
remuneration Estimated remuneration to be paid to the insolvency practitioner for services rendered in conducting an external administration
s9 (for example) A section of the Corporations Act (in this example, numbered 9)
secured creditor A chargee as defined by s9
Schedule B report A report whose format is in accordance with Schedule B of RG 16 and lodged with ASIC under s533 (by a liquidator), s438D (by an administrator), or s422 (by a receiver)
voluntary administrator
An administrator of a company but not a deed of company arrangement

REPORT 225: Insolvency statistics: External administrators’ reports 1 July 2007–30 June 2010
© Australian Securities and Investments Commission December 2010 Page 108
Related information
Regulatory guides
RG 16 External administrators: Reporting and lodging
Legislation
Corporations Act, Pt 5.2, 5.3A, 5.6
Other
Statistics on companies entering external administration and insolvency appointments are available from http://www.asic.gov.au/insolvency-resources.
Information on Australian and New Zealand Standard Industrial Classification (ANZSIC) 2006 is available from www.abs.gov.au/anzsic.