report on the quality of marine surface observations · chief, ocean affairs division, wmo (...
TRANSCRIPT
Report on the Quality of Marine Surface Observations Report Number 43
January to June 2010
Met Office Data Assimilation © Crown copyright 2010

REPORT ON THE QUALITY OF MARINE SURFACE OBSERVATIONS:
JANUARY TO JUNE 2010
(i) Report no. 43
Distribution list : i) External Technical Co-ordinator DBCP, Mr E. Charpentier Chief, Ocean Affairs Division, WMO ([email protected])
Diretoria de Hidrografia e Navegação (attn. [email protected]) National Oceanography Centre, Southampton (attn. Dr. Peter K. Taylor) National Oceanic and Atmospheric Administration (attn. Mr. John Warrelmann) PMO, Hong Kong Observatory ([email protected]) European Centre for Medium-range Weather Forecasts (attn. Mr D. Richardson)
European Centre for Medium-range Weather Forecasts (attn. Mr. A. Garcia) Deutscher Wetterdienst (attn. Ms. Yvonne Ditzel) Bibliothek des Deutschen Wetterdienstes ([email protected]) Japan Meteorological Agency (attn. Dr. Kazuhiko Hayashi) Japan Meteorological Agency ([email protected]) Office of Marine Prediction, Japan Meteorological Agency ([email protected]) Office of International Affairs, Japan Meteorological Agency (attn. Dr S. Nakagawa)
ii) Internal Manager of Global Assimilation, Mr. F. Rawlins Observation Monitoring Scientist, Mr. C. A. Parrett Offshore Adviser, Mr. Iain Hendry This report and other related documents can be found at the following URL: http://research.metoffice.gov.uk/research/nwp/observations/monitoring/marine/Biannual/index.html
For further information, please contact: Manager of Global Data Assimilation Discovery 2 The Met Office Fitzroy Road Exeter Devon EX1 3PB United Kingdom. E-mail: [email protected]

REPORT ON THE QUALITY OF MARINE SURFACE OBSERVATIONS:
JANUARY TO JUNE 2010
(ii) Report no. 43
CONTENTS
1. Introduction 2. Monitoring methods 3. Monitoring results:
3.1 Pressure 3.2 Wind 3.3 Sea-surface temperature
4. Summary

REPORT ON THE QUALITY OF MARINE SURFACE OBSERVATIONS:
JANUARY TO JUNE 2010
(iii) Report no. 43
LIST OF TABLES
1. Frequency distribution of the number of observations of pressure, wind and SST.
2. Number of observations of pressure for past six-month periods.
3. Platforms reporting suspect pressure observations: 3a Stations reporting in DRIFTR code.
3b Stations reporting in SHIP code.
4. Platforms reporting in SHIP code, not listed in table 3 but listed as suspect in the previous six-month period.
5. Platforms reporting suspect wind speed observations:
5a Stations reporting in DRIFTR code.
5b Stations reporting in SHIP code.
6. Platforms reporting in SHIP code,not listed in table 5 but listed as suspect in the previous six-month period.
7. Platforms reporting suspect wind direction observations:
7a Stations reporting in DRIFTR code.
7b Stations reporting in SHIP code.
8. Platforms reporting in SHIP code, not listed in table 7 but listed as suspect in the previous six-month period.
9. Platforms reporting suspect sea surface temperature:
9a Stations reporting in DRIFTR code.
9b Stations reporting in SHIP code.
10. Platforms reporting in SHIP code, not listed in table 9 but listed as suspect in the previous six-month period.
11. Number of platforms reporting suspect pressure, wind and sst observations for each of the six-month periods covered by the WMO reports on the quality of marine observations.
REPORT ON THE QUALITY OF MARINE SURFACE OBSERVATIONS:
JANUARY TO JUNE 2010
(iv) Report no. 43
LIST OF FIGURES
1. Number of observations of pressure for past six-month periods. 2a Distribution of O-B SHIP pressure differences, all observations. 2b Distribution of O-B SHIP pressure differences, flagged observations only. 2c Distribution of O-B SHIP pressure differences, unflagged observations only. 2d-f As 2a-c but for wind speed. 2g-I As 2a-c but for wind direction. 2j-l As 2a-c but for SST. 3. Geographical distribution of bias of SHIP pressure. 4. Geographical distribution of standard deviation of SHIP pressure. 5. Geographical distribution of the number of SHIP pressure observations. 6-8 As figures 3-5 but for wind speed. 9-11 As figures 3-5 but for wind direction. 12-14 As figures 3-5 but for SST.

REPORT ON THE QUALITY OF MARINE SURFACE OBSERVATIONS:
JANUARY TO JUNE 2010
Page 1 Report no. 43
1. INTRODUCTION
In 1985, the Commission for Basic Systems (CBS) agreed that there was a need for GDPS / Global NWP centres to monitor the quality of observations available on the GTS and to exchange monthly lists of stations providing seemingly erroneous data. In 1988 three lead centres were nominated which would have a co-ordinating role of producing, at six-monthly intervals, consolidated lists of suspect stations for given data types together with information on the nature of the error. NCEP was given responsibility for aircraft and satellite data and ECMWF, that for upper-air data. The Met Office was allocated the role as lead centre for marine surface observations which encompass observations from ships, drifting buoys, moored buoys and other fixed marine platforms. This is the forty-third report and covers the period January to June 2010. For each observing platform identified as suspect, values are supplied for the number of observations received at the Met Office, the number of these observations with gross errors, the observations' mean differences from the background values used by the numerical data assimilation system and the standard deviations of these differences.
Following the CBS recommendations, by the end of the 1980s there were four centres active in the
monthly exchange of monitoring information; The Met Office, ECMWF, RSMC Tokyo and NCEP. Since then, a number of other centres have also begun to exchange this information and these reports have included data provided by Météo-France as of report number 23. Initially, the only monitoring information exchanged on marine surface observations related to pressure, and the first two WMO reports addressed that parameter alone. Since then, these reports have contained monitoring statistics for wind observations, now being exchanged between centres on a consistent monthly basis. In addition, the report contains monitoring results for sea-surface temperature (SST). Due to changes in the observation processing system and database structure, there was no monitoring of SST data at the Met Office from May 1998 to September 2000. The SST information presented in reports 20 to 23 was therefore compiled, with permission, from the monthly NCEP monitoring data and so is not directly comparable with that presented in other reports. SST monitoring was reinstated at the Met Office from October 2000.
Report no. 43 Page 2
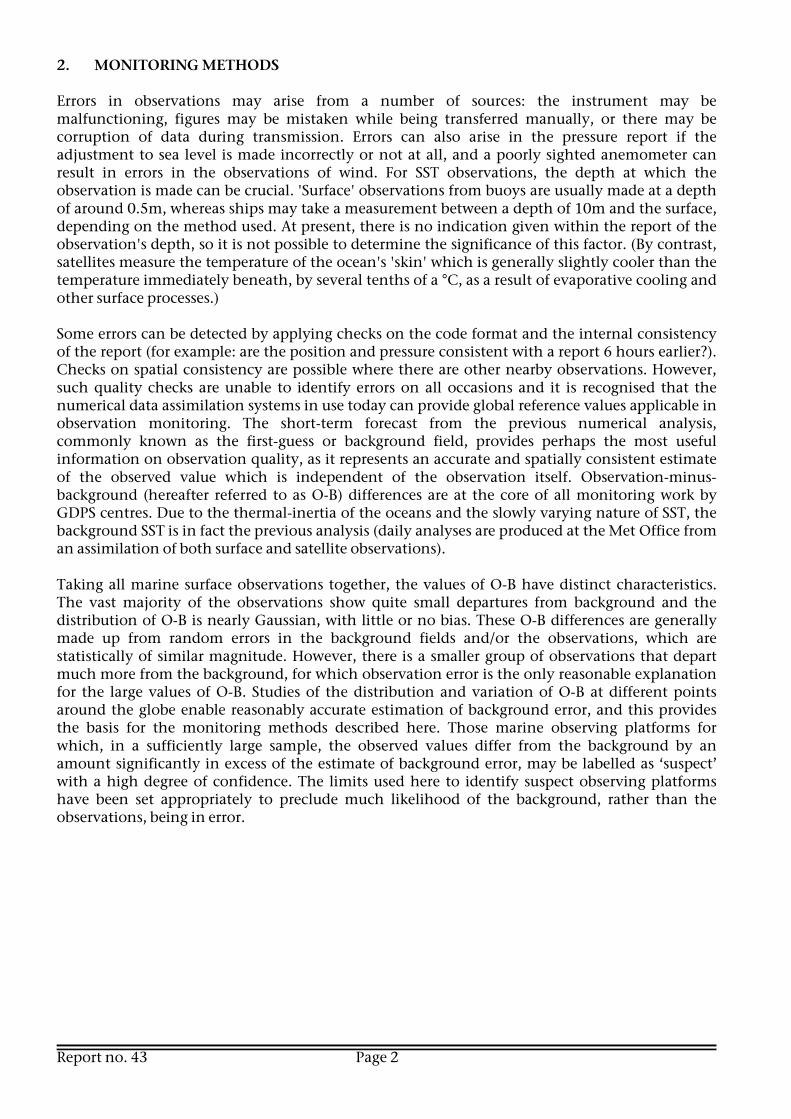
2. MONITORING METHODS Errors in observations may arise from a number of sources: the instrument may be malfunctioning, figures may be mistaken while being transferred manually, or there may be corruption of data during transmission. Errors can also arise in the pressure report if the adjustment to sea level is made incorrectly or not at all, and a poorly sighted anemometer can result in errors in the observations of wind. For SST observations, the depth at which the observation is made can be crucial. 'Surface' observations from buoys are usually made at a depth of around 0.5m, whereas ships may take a measurement between a depth of 10m and the surface, depending on the method used. At present, there is no indication given within the report of the observation's depth, so it is not possible to determine the significance of this factor. (By contrast, satellites measure the temperature of the ocean's 'skin' which is generally slightly cooler than the temperature immediately beneath, by several tenths of a °C, as a result of evaporative cooling and other surface processes.) Some errors can be detected by applying checks on the code format and the internal consistency of the report (for example: are the position and pressure consistent with a report 6 hours earlier?). Checks on spatial consistency are possible where there are other nearby observations. However, such quality checks are unable to identify errors on all occasions and it is recognised that the numerical data assimilation systems in use today can provide global reference values applicable in observation monitoring. The short-term forecast from the previous numerical analysis, commonly known as the first-guess or background field, provides perhaps the most useful information on observation quality, as it represents an accurate and spatially consistent estimate of the observed value which is independent of the observation itself. Observation-minus-background (hereafter referred to as O-B) differences are at the core of all monitoring work by GDPS centres. Due to the thermal-inertia of the oceans and the slowly varying nature of SST, the background SST is in fact the previous analysis (daily analyses are produced at the Met Office from an assimilation of both surface and satellite observations). Taking all marine surface observations together, the values of O-B have distinct characteristics. The vast majority of the observations show quite small departures from background and the distribution of O-B is nearly Gaussian, with little or no bias. These O-B differences are generally made up from random errors in the background fields and/or the observations, which are statistically of similar magnitude. However, there is a smaller group of observations that depart much more from the background, for which observation error is the only reasonable explanation for the large values of O-B. Studies of the distribution and variation of O-B at different points around the globe enable reasonably accurate estimation of background error, and this provides the basis for the monitoring methods described here. Those marine observing platforms for which, in a sufficiently large sample, the observed values differ from the background by an amount significantly in excess of the estimate of background error, may be labelled as ‘suspect’ with a high degree of confidence. The limits used here to identify suspect observing platforms have been set appropriately to preclude much likelihood of the background, rather than the observations, being in error.

Page 3 Report no. 43
Each monitoring centre produces a monthly list of the identifiers of marine observing platforms considered suspect according to their departures from the model background values. All observations are used, both synoptic and asynoptic, and the background fields are interpolated to the observation time. Given that the number of observations made during the month is at least 20, then the condition used by all centres for obtaining platforms for the suspect lists is that at least one of the following criteria are satisfied:
Pressure
1. | mean of O-B | ≥ 4.0 hPa 2. standard deviation of O-B ≥ 6.0 hPa 3. percentage of gross errors ≥ 25
Wind
1. | mean of O-B | ≥ 5.0ms-1 (Speed) ≥ 30° (Direction) 2. standard deviation of O-B ≥ 80° (Direction) 3. percentage of gross errors ≥ 25
Criteria used for monthly monitoring
Gross errors are defined as observations that depart from the background by more than 15hPa (Pressure) or 25ms-1 (Vector Wind). The mean and standard deviation of the samples are evaluated excluding gross errors, so that occasional extreme values resulting from, for example, corruption during transmission, do not influence the sample characteristics. Direction statistics are also calculated excluding values in light winds, where either the observed or background speeds are less than 5ms-1. The monthly results for pressure from all five monitoring centres show considerable agreement, both on the observing platforms listed as suspect and the values of the mean and rms difference from each centre's background. Differences between the monthly suspect lists are usually due to the different numbers of observations available at each centre, due to different cut-off times. There are also some unexplained variations in the data receipt between the centres, which may be due to problems on the GTS or in the local procedures for handling the data. Monitoring results for wind speed also show reasonable agreement on the mean and standard deviation from each centre's background. This report draws together all the monthly monitoring results exchanged on marine surface data and identifies a list of observing platforms that have provided observations of poor quality over the 6-month period. In drawing up this list, there have been a number of guiding principles:
1. As with the monthly lists, accuracy is assessed relative to background values. 2. Observing platforms are listed only where there is a reasonable degree of confidence
that the observations rather than the background values are in error. 3. At least 40 reports are required over the period in which the observations are
considered suspect. 4. The perceived accuracy over the last part of the six-month period is of greatest
importance; observing platforms are not listed if there has been recent improvement and their reports are at present without major error.
5. Given that the number of observations made during the period is greater than or equal to 40, then the condition for listing a platform as suspect in this report is that at least one of the following criteria are satisfied:
Report no. 43 Page 4
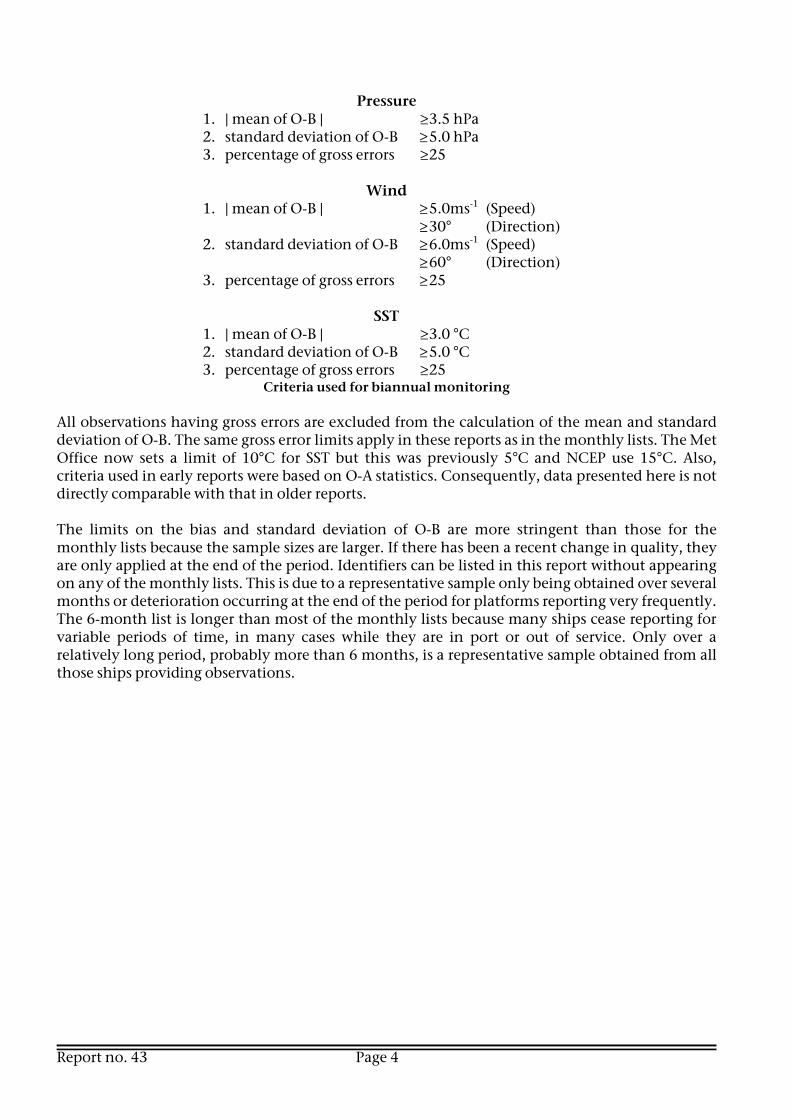
Pressure 1. | mean of O-B | ≥ 3.5 hPa 2. standard deviation of O-B ≥ 5.0 hPa 3. percentage of gross errors ≥ 25
Wind
1. | mean of O-B | ≥ 5.0ms-1 (Speed) ≥ 30° (Direction) 2. standard deviation of O-B ≥ 6.0ms-1 (Speed) ≥ 60° (Direction) 3. percentage of gross errors ≥ 25
SST
1. | mean of O-B | ≥ 3.0 °C 2. standard deviation of O-B ≥ 5.0 °C 3. percentage of gross errors ≥ 25
Criteria used for biannual monitoring
All observations having gross errors are excluded from the calculation of the mean and standard deviation of O-B. The same gross error limits apply in these reports as in the monthly lists. The Met Office now sets a limit of 10°C for SST but this was previously 5°C and NCEP use 15°C. Also, criteria used in early reports were based on O-A statistics. Consequently, data presented here is not directly comparable with that in older reports. The limits on the bias and standard deviation of O-B are more stringent than those for the monthly lists because the sample sizes are larger. If there has been a recent change in quality, they are only applied at the end of the period. Identifiers can be listed in this report without appearing on any of the monthly lists. This is due to a representative sample only being obtained over several months or deterioration occurring at the end of the period for platforms reporting very frequently. The 6-month list is longer than most of the monthly lists because many ships cease reporting for variable periods of time, in many cases while they are in port or out of service. Only over a relatively long period, probably more than 6 months, is a representative sample obtained from all those ships providing observations.
Page 5 Report no. 43
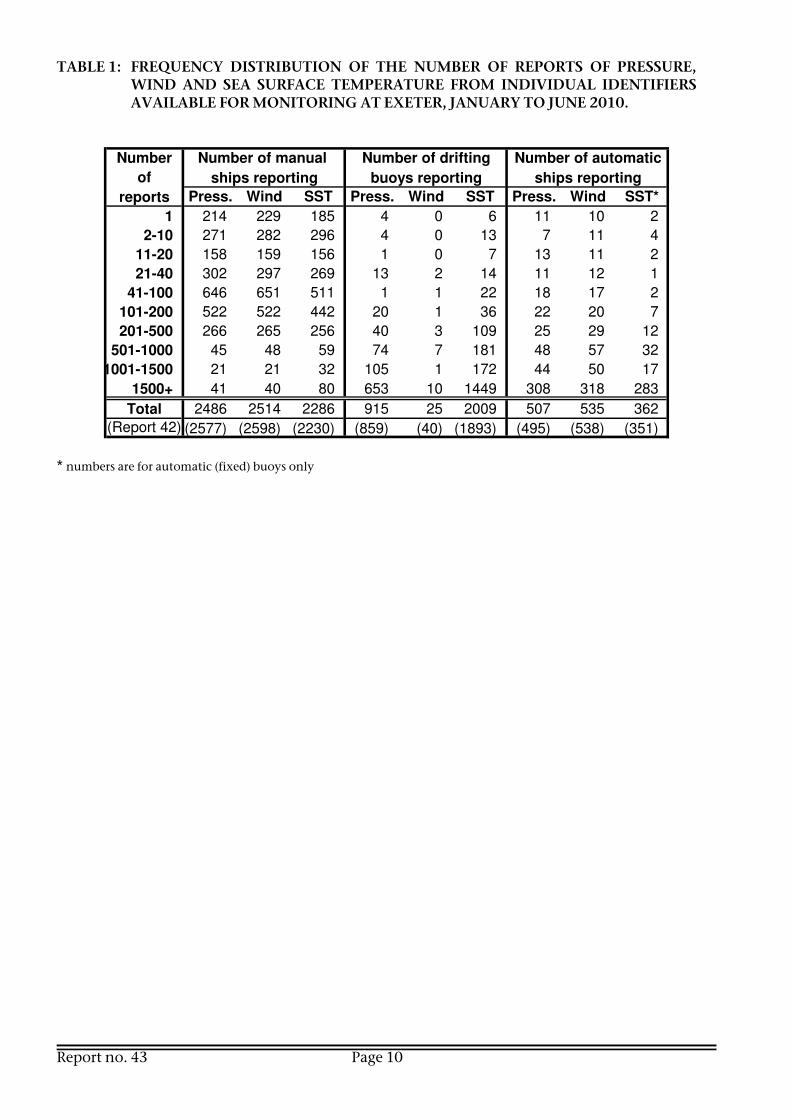
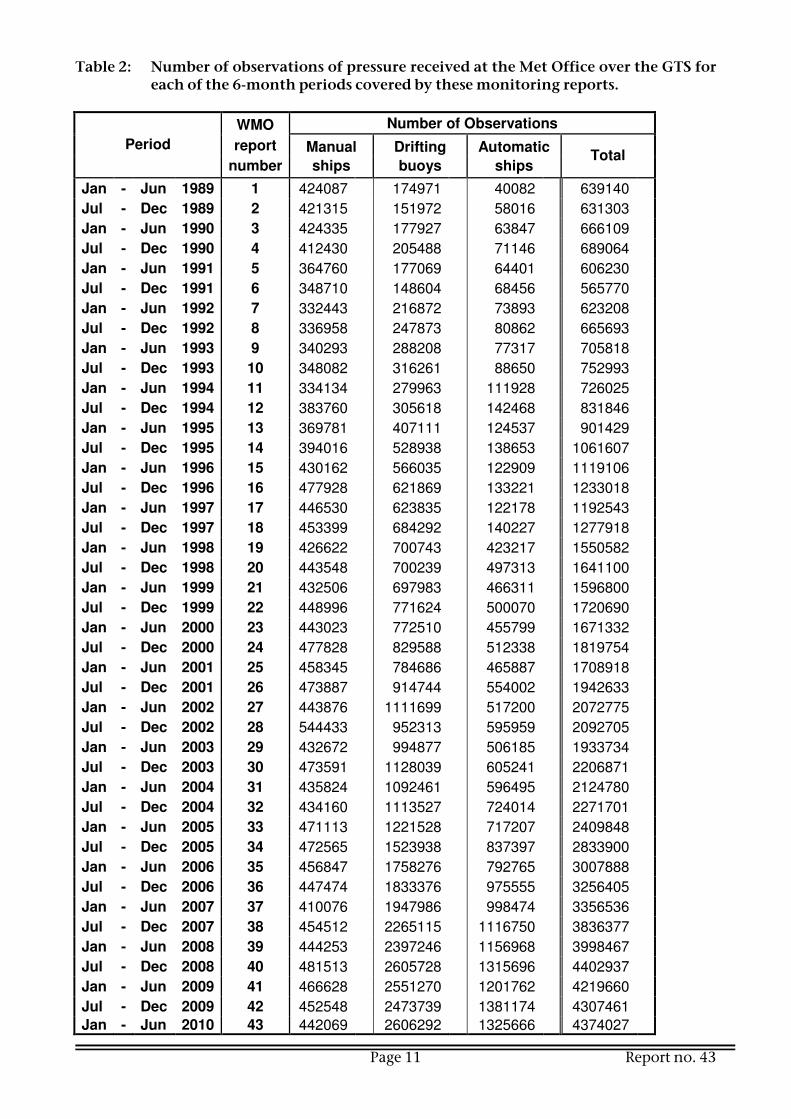
3. MONITORING RESULTS The monitoring results presented in this report relate only to data exchanged over the GTS. Observations from marine platforms are transmitted in one of two formats: the SHIP code, used for most observations from ships, moored buoys and other fixed platforms, and the BUOY code, used mostly for observations from drifting buoys. In this report, the term "ship observations" refers to those received in the SHIP code and the "drifting buoy observations" to those received in BUOY code. The SHIP code indicates whether the observation was made manually or by an automatic system and accordingly the sub-divisions "manual ship" and "automatic ship" will be defined. 3.1 Pressure In the six-month period, January to June 2010, 4374027 observations of pressure were monitored at Exeter from 2486 manual ships, 915 drifting buoys, and 507 automatic ships. The number of reports received from individual ships varies greatly as Table 1 demonstrates: apparently a large percentage of ships continue to report only once, which may be due to erroneous call signs, caused by errors in the part of the message giving the ship identifier. A comparison with the corresponding table in report number 42 shows little change. Since most marine observations are located in the northern hemisphere, there is inevitably some seasonal variation in the number of vessels reporting, especially in the case of buoys, since new or replacement buoys are generally deployed in better weather conditions. Considering the general trends over previous reports, the decline in the number of manual ships reporting pressure seems to be continuing, with a small decrease, while the recent decrease in automatic ships seems to have stopped, and there was an increase in the number of drifting buoys reporting. Table 2 and Figure 1 show the number of observations of pressure that have been received over the GTS at the Met Office and processed, over past 6-month periods. It can be seen that the total number of observations remained fairly steady with only minor fluctuations until report number 11 (January-June 1994). Since that time however, there has been a steady increase in the total up to 2008, with the number of observations of pressure nearly doubling between reports 11 and 16 (1994-1996) and doubling again between reports 33 and 38 (2005-2007). The first increase was largely due to the increase in number of drifting buoy reports, due to the larger number of reports from each drifting buoy. The second increase was due to increased numbers of both drifting buoys and automatic ships, with the number of reports from manual ships remaining fairly constant over recent years, despite the slow reduction in the number of manual ships reporting pressure. The number of reports from drifting buoys seems to have peaked in the second half of 2008 and has remained fairly constant since then. Reports from drifting buoys now account for 60% of the total, while those from manual ships make up just 10% of the total, and those from automatic ships account for the remaining 30%. The sudden increase seen in the number of automatic ships in report number 19 (January-June 1998) was due to observation processing changes at the Met Office, whereby all reports from 'automatic ships' began to be processed, rather than only one report per 6-hour assimilation period, as previously. Since then there has been a fairly steady increase in the total number of pressure reports, which has only recently levelled-off.

Report no. 43 Page 6
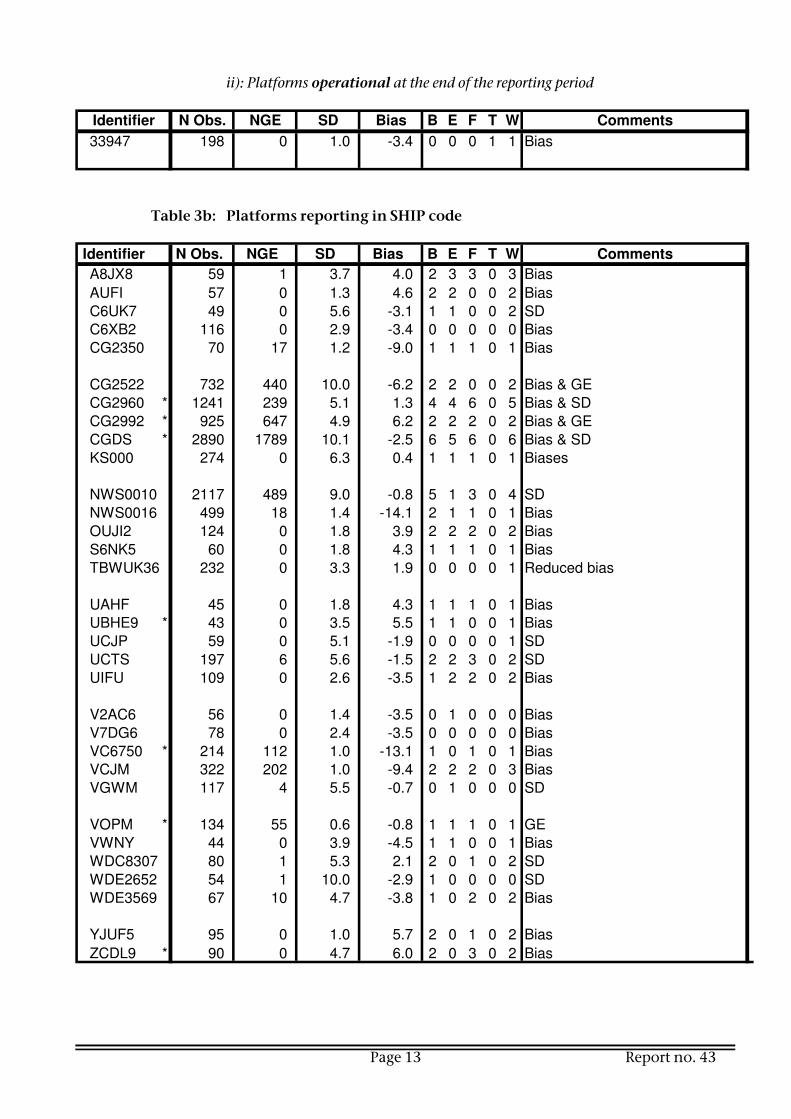
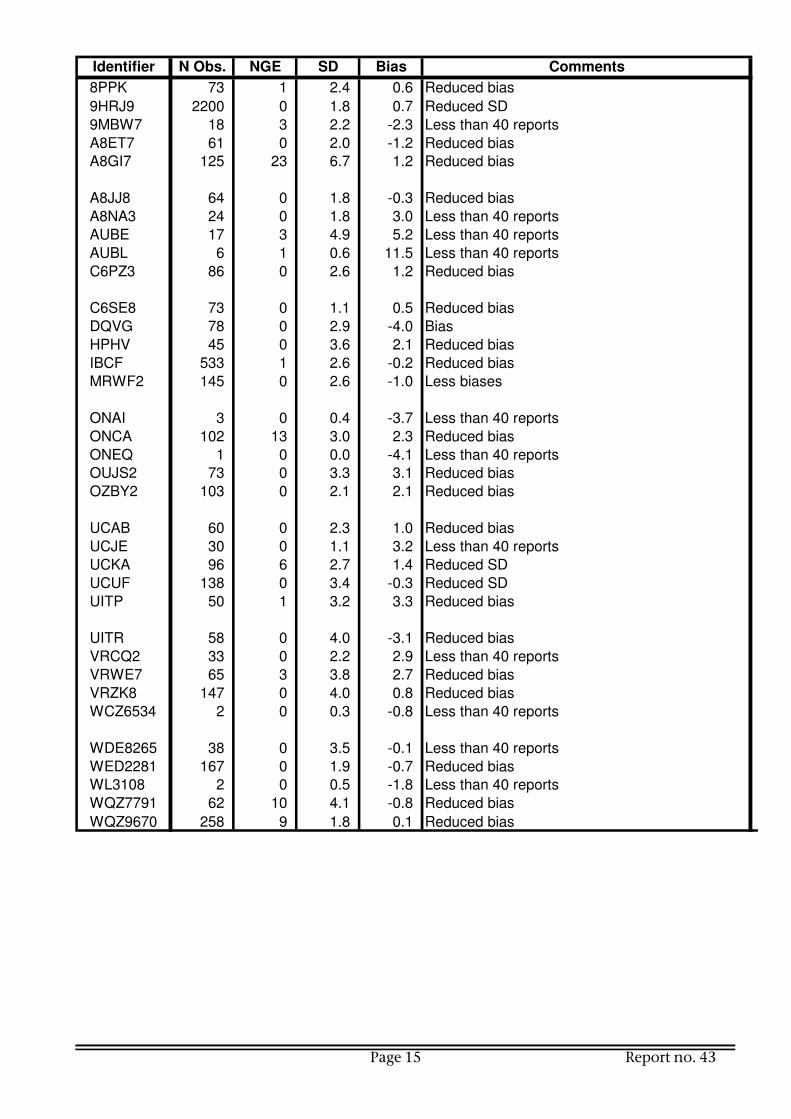
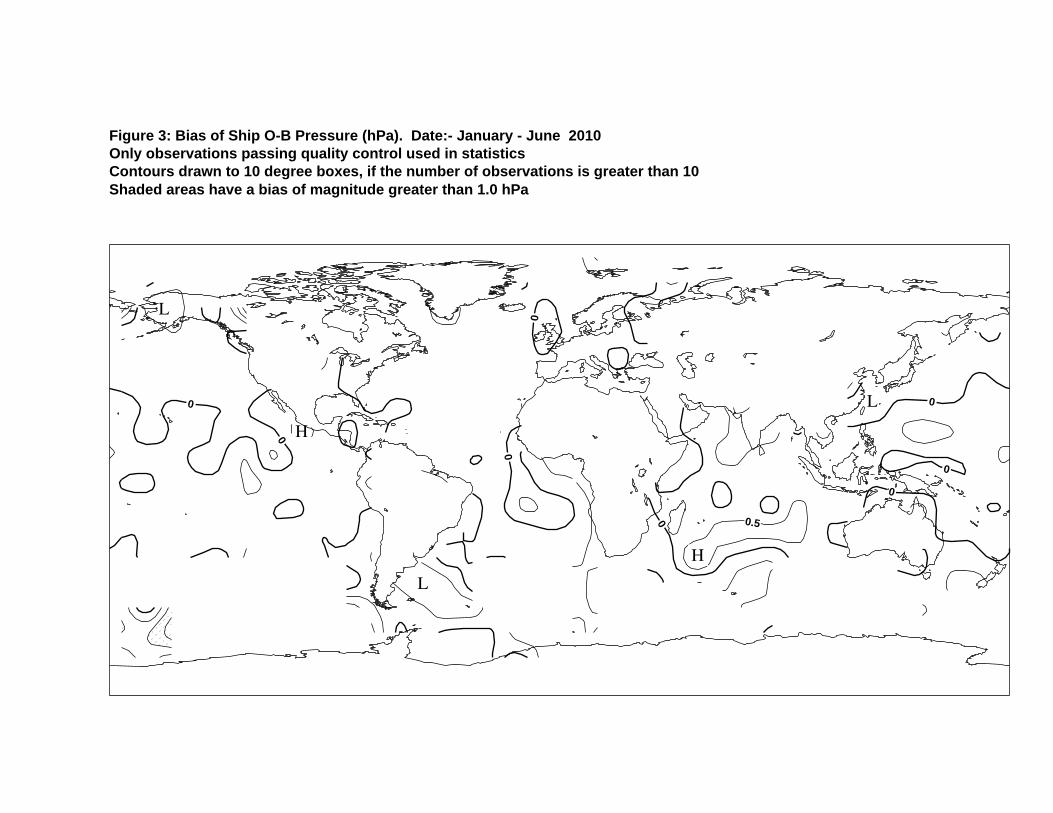
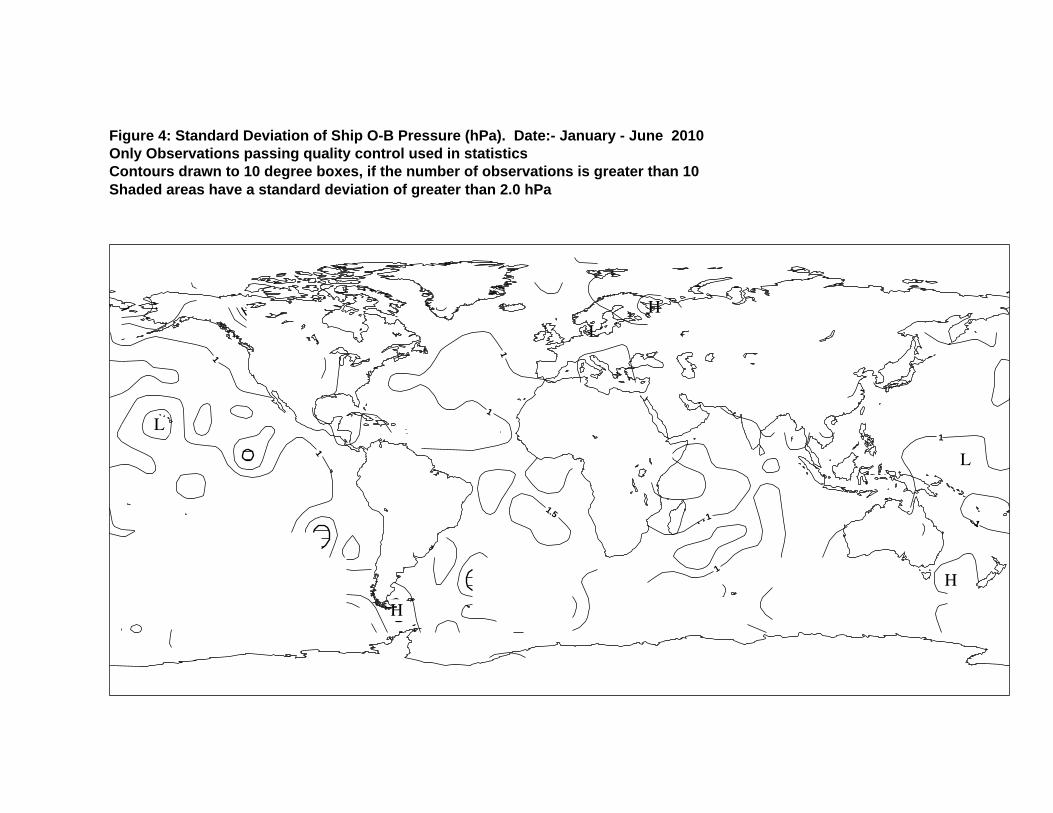
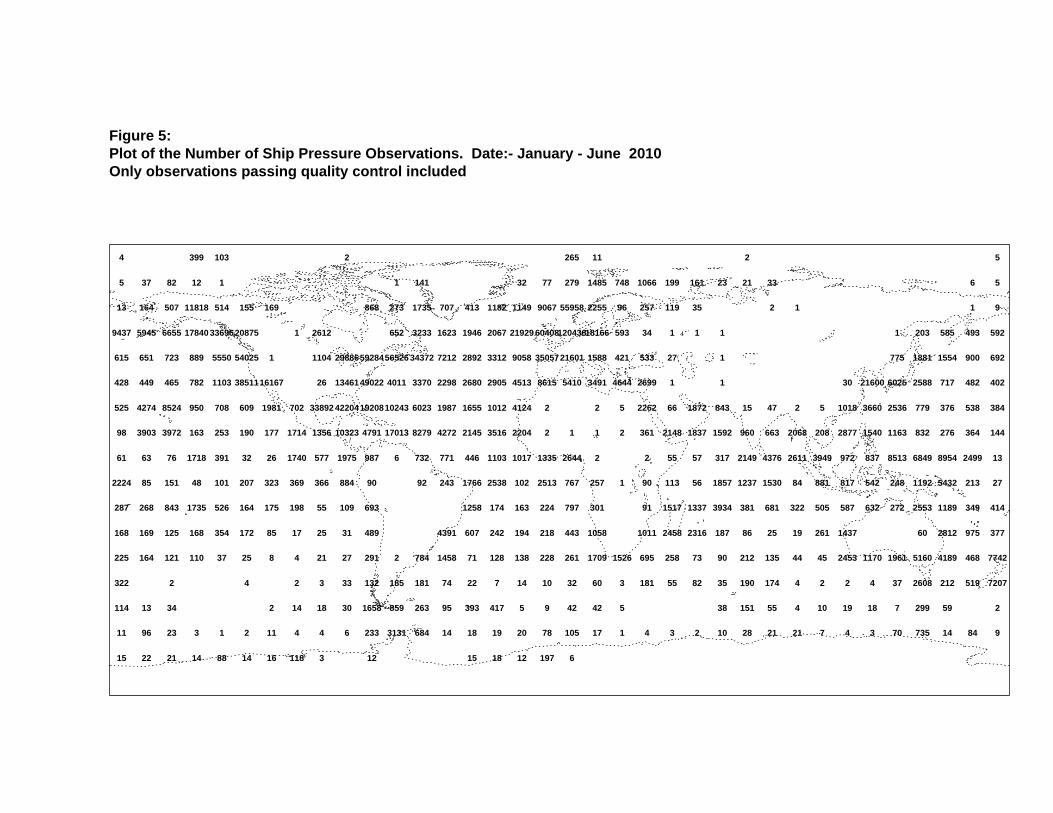
A histogram of O-B differences for all ship pressure reports in the period January to June 2010 is shown in Figure 2a, together with the Gaussian distribution with the same mean and standard deviation. Although almost all values fall within the range +5 to -5 hPa, a small number of much larger values, presumably resulting from erroneous observations, contribute to the large standard deviation of the population. The distribution for all those observations which fail the automatic quality-control checks is broad (Figure 2b). The remaining 94% of observations that pass the quality checks show a distribution of O-B which is very close to Gaussian (Figure 2c) with mean -0.1 hPa and standard deviation 1.1 hPa. The principal contribution to the standard deviation is assumed to be from background errors. A global estimate of the background error, such as that provided above, can conceal large spatial variations. Background values will be more accurate in data-rich areas (e.g.: in the North Sea or Mediterranean) or where the meteorological variability is low (e.g.: the tropics). Figures 3 and 4 show the geographical distributions of the mean and standard deviation of the values of O-B from ship observations that passed the quality control checks, calculated for 10-degree latitude-longitude boxes. In most areas, the magnitude of the mean is less than 0.5 hPa, the exceptions being generally where the sample size is small. The standard deviation is generally in the range 1.0 to 1.5 hPa, but is less than 1.0 hPa in some areas of the north Atlantic, the north-west Pacific and the tropics. The number of ship pressure reports that passed the quality control checks are shown in Figure 5. Table 3 contains a list of those ships and drifting buoys considered to have produced suspect observations of pressure in the period January to June 2010. Values over the six-month period are given for the number of observations of pressure available for Met Office global model runs, the number of observations differing from the model background value by more than 15 hPa (gross errors), and the mean and standard deviation of the model O-B. The number of times the identifier has appeared on the monthly suspect lists from the five monitoring centres is also given. In order to give a detailed picture of the frequency of reporting and any changes in the observation accuracy, 6-month time-series of O-B differences are given at the end of the report for each of the identifiers listed (although the data for March is unfortunately missing due to a problem with database corruption). An interesting characteristic of the errors identified here, which soon becomes obvious on inspection of the time-series charts at the end of this report, is that most can be attributed to a bias in the observed pressure. In many cases, the bias is constant over much of the monitoring period; although some values depart greatly from the sample mean, presumably due to some gross error in the observation, these are generally isolated instances. In only a few cases are there regular large random departures from background. Those observing platforms listed in Table 3 which appeared in report number 42 (July to December 2009) have been indicated with an asterisk. A comparison of the statistics given here with those in report number 41 (January to June 2009), clearly indicates that the bias in the pressure observations from a few ships has hardly changed for more than a year. Statistics for those marine observing platforms listed in report number 42 and which do not appear in Table 3b, are given in Table 4 along with comments on the quality of their pressure observations. Time-series of the pressure observations from these platforms are not given. Less than 40 reports were received in the 6-month period for many of these platforms, but 63% of platforms on the list do show some improvement in the quality of their observations.

Page 7 Report no. 43
3.2 Wind
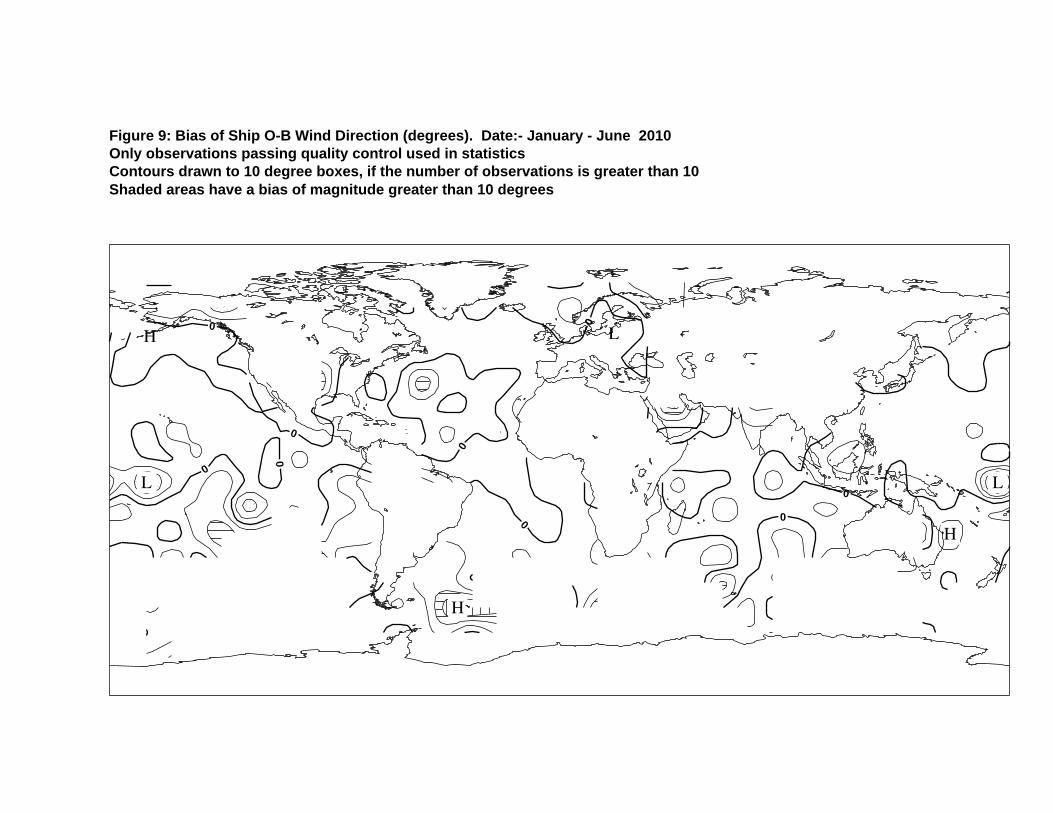
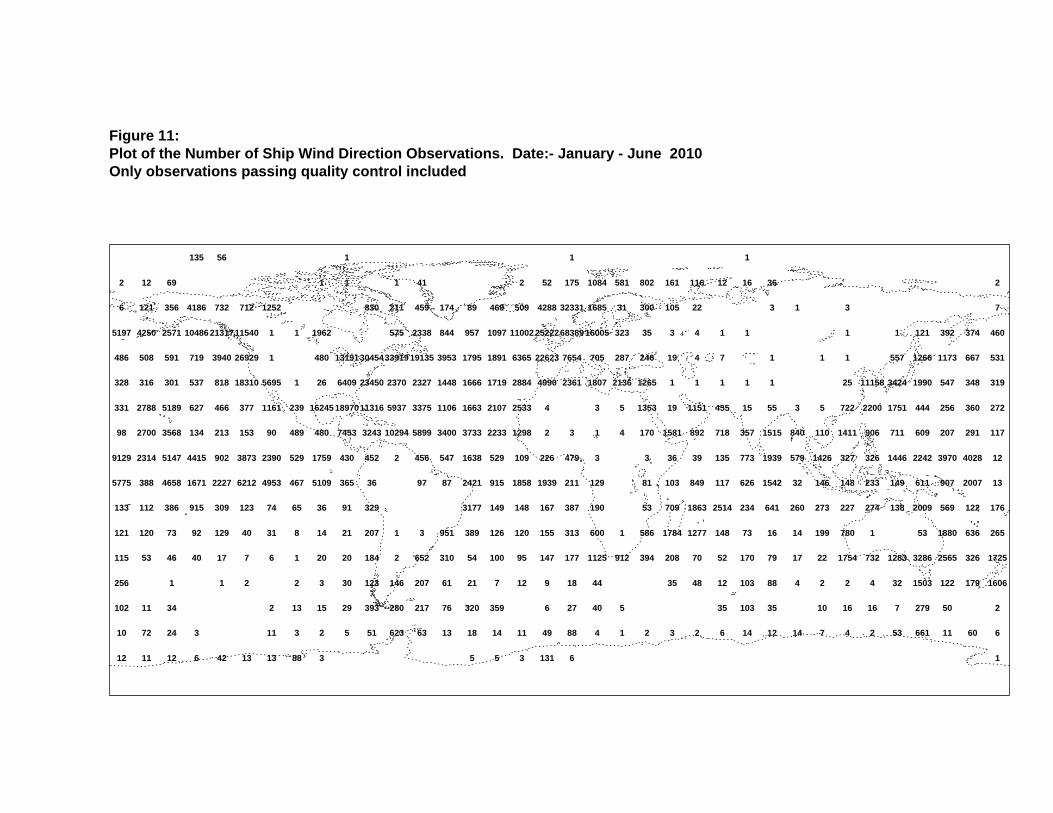
Monitoring observations of wind is more problematical than pressure. On most observing platforms, wind is measured using anemometers; the reported speed depends upon the averaging period and instrument height above sea level, which varies a great deal between platforms. Since large structures distort wind flow, the anemometer position relative to the wind bearing and platform structure does affect the measurement. (These factors do not apply to those ship observations where wind speed is based on visual estimates of the sea state e.g. the UK VOS fleet.) In these monitoring results, the background winds are valid at a height of 10 metres above mean sea level; rather lower than the average height of ship anemometers. Where anemometer height is much different from 10 metres, a significant O-B speed bias may be evident. Examples of this are (i) observations from oil rigs or tankers with anemometer heights of 50m or more, although the speeds reported by most rigs are now adjusted on board to be nominal 10m values, and (ii) buoys, where the anemometer can be as low as 2m. In the period January to June 2010, 1512764 wind observations were available for monitoring at Exeter, from 2514 manual ships, 25 drifting buoys, and 535 automatic ships. (More detail is given in Table 1.) The number of reported manual ship identifiers shows the same trends as for pressure, but with slightly more identifiers reporting wind. As stated for pressure observations, the large increase in the number of monitored wind observations, seen in report number nineteen, was largely due to the inclusion of all 'automatic ship' data, rather than just one report in each six hour period. Histograms of O-B differences for ship observations of wind speed are presented in Figures 2d, 2e and 2f and of wind direction in Figures 2g, 2h and 2i. As with observations of pressure, those wind observations that fail the quality-control checks differ most from background, some by as much as 50 ms-1, and they make a large contribution to the variance of O-B. The distributions of O-B wind speed and direction for the remaining 93% of the observations that passed the quality control checks are nearly Gaussian; these observations had a speed bias of +1.0ms-1 relative to background and a direction bias of -1.1°. Figures 6 and 7 show the geographical distributions over the six-month period of the mean and standard deviation of O-B for ship observations of wind speed that pass the quality-control checks. The numbers of wind reports used to generate these statistics are presented in Figure 8. The standard deviation of O-B wind speed is typically 2-3 ms-1 in middle latitudes and around 2 ms-1 in the tropics. The wind speed bias is generally around +1 ms-1, but exceeds +2 ms-1 in a few places and is slightly negative in areas off north-west Europe and North America and in some tropical areas. Similar distributions of the mean and standard deviation of O-B wind direction are shown in Figures 9 and 10. Only reports where both the observed and background wind speeds are greater than 5 ms-1 were used to obtain these values. The magnitude of the bias is less than 5 degrees in most places, but exceeds 15 degrees in a few places in the tropics. The standard deviation is generally between 15 and 30 degrees globally, but in some data-sparse areas and near some coasts it is as large as 40-50 degrees. The numbers of reports of wind direction used to generate these statistics are presented in Figure 11.

Report no. 43 Page 8
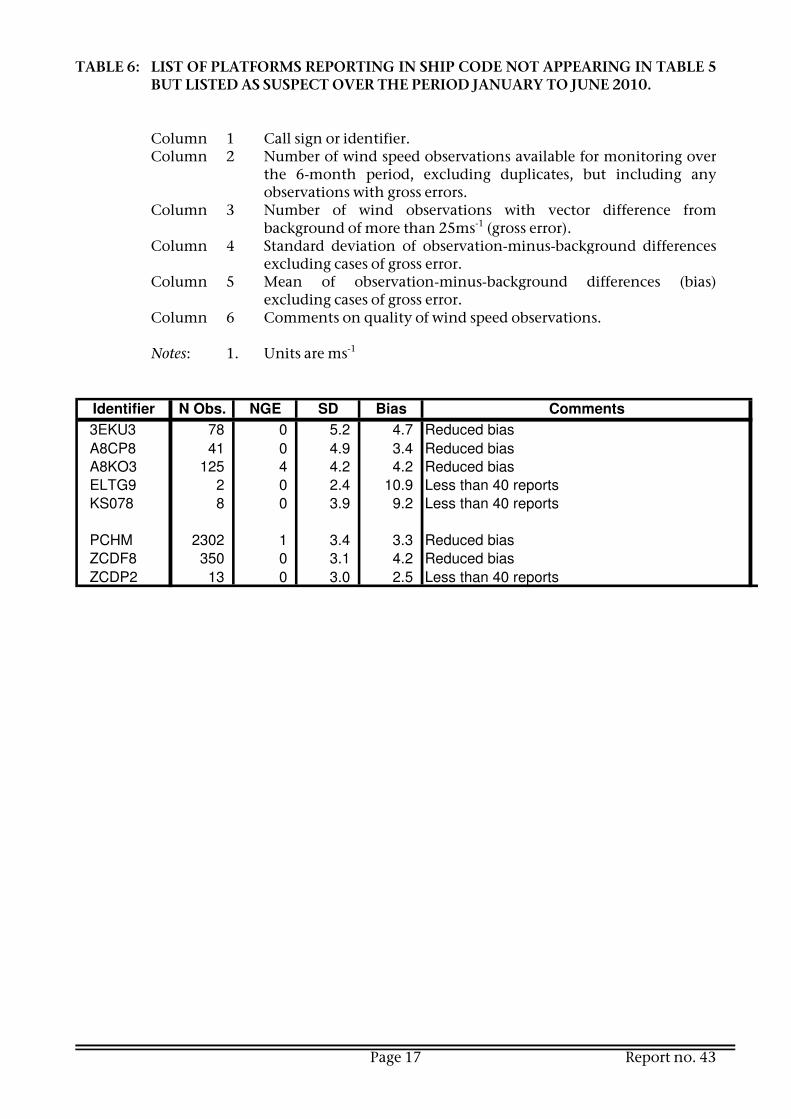
Figures 6-11 provide reference values against which to compare the O-B characteristics for different marine observing platforms. Table 5 contains a list of those ships and drifting buoys considered to have produced suspect observations of wind speed in the period January to June 2010, and in Table 7 a similar list is provided for wind direction. Values are given for the number of observations of wind received at the Met Office, the number of observations having a vector difference from background of more than 25 ms-1 (gross errors), and the mean and standard deviation of O-B. Time-series of O-B are given at the end of the report for each listed identifier. In nearly all of the suspect speed observations, a constant bias is clearly evident. Errors in observations of direction are more random in nature. Tables 6 and 8 contain statistics for platforms reporting in ship code that are not included in Tables 5 and 7 but were listed in the previous report, for wind speed and direction respectively. Time-series for these identifiers are not included in this report. 3.3 Sea-surface temperature
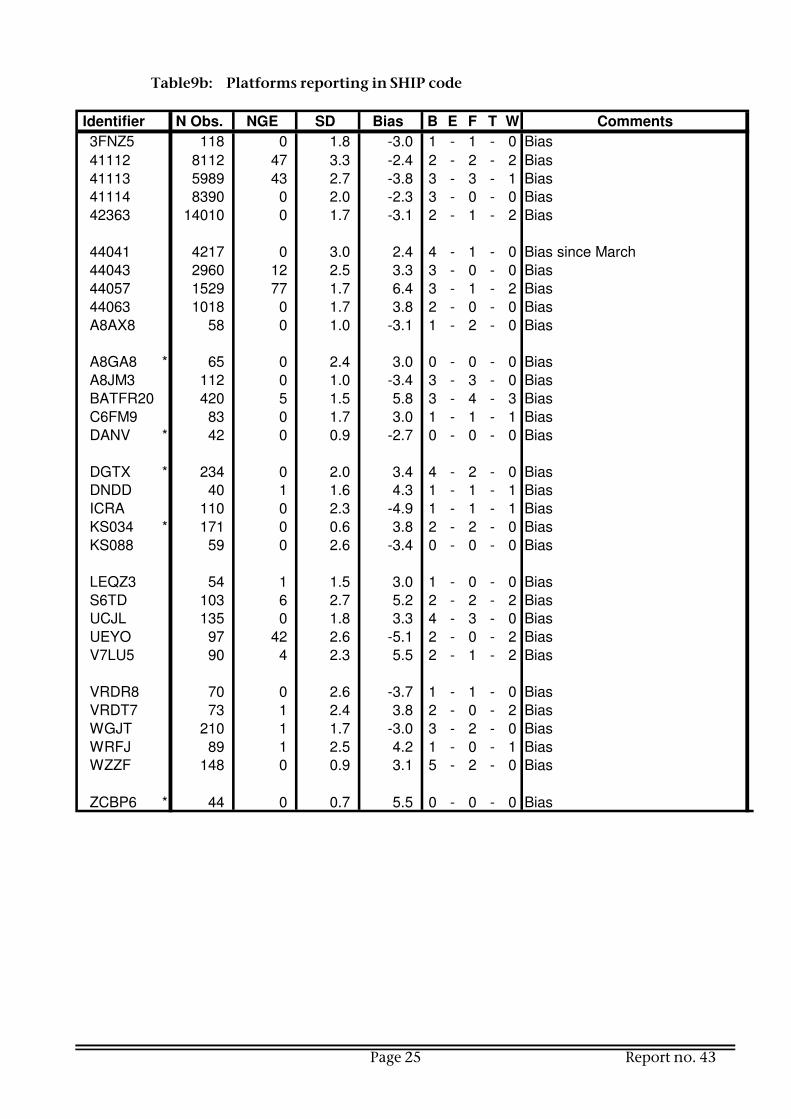
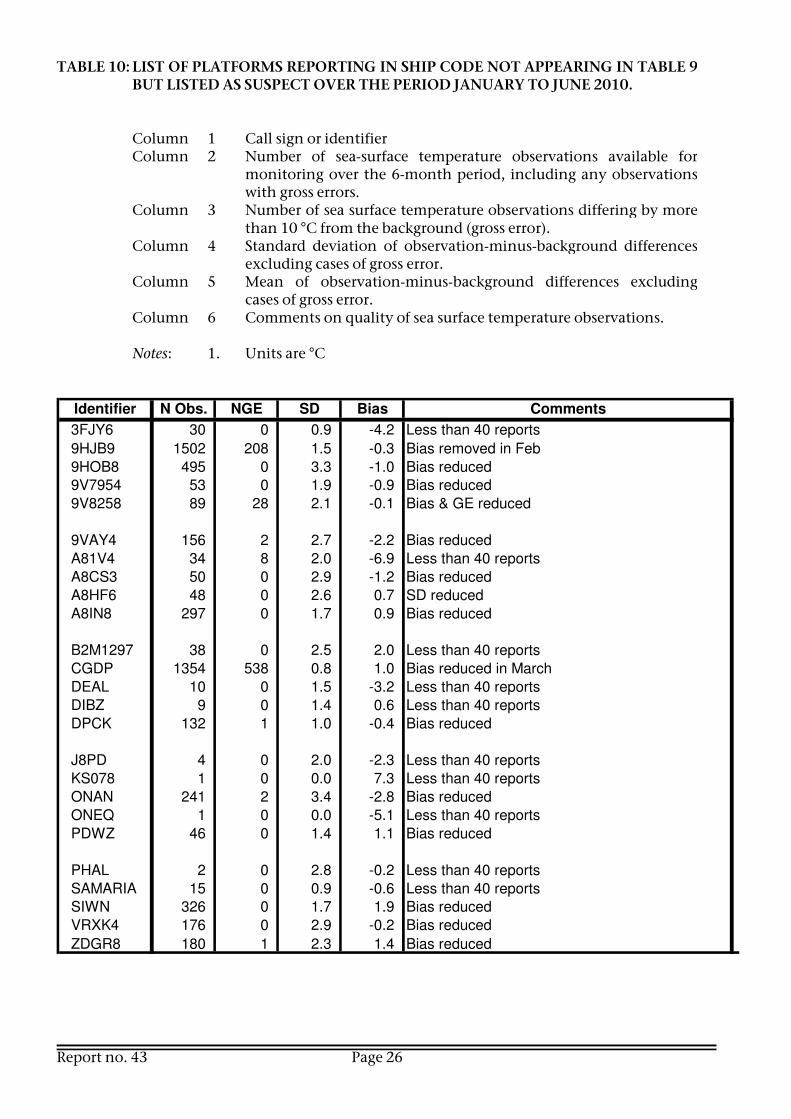
In the 6-month period January to June 2010, a total of 7880828 observations of SST were monitored at the Met Office, from 2286 manual ships, 2009 drifting buoys and 362 automatic ships. Of the total, 469452 were from manual ships, 6163024 from drifting buoys and 1248352 from automatic ships. (More detail is given in Table 1.) For the same reasons as stated for pressure observations, it appears that many identifiers report only once during the 6-month period. There has been little change in the numbers of ships and drifters reporting SST over the last 4 years, although the number of buoys has increased by 13% in the last year. There are similar numbers of manual ships reporting SST as there are drifting buoys and automatic ships combined, but manual ships account for only 6% of the total number of observations. This is due to the greater frequency of automatic ship and buoy observations, hourly in many cases, with manual ships tending to report only at the main synoptic hours. Histograms of O-B differences for all ship SST reports are shown in Figures 2j, 2k and 2l. As with observations of pressure and wind, those SST observations that fail the quality-control checks differ most from background and make a large contribution to the variance of O-B. The distribution of O-B SST for the remaining 87% of observations that pass the quality control checks is nearly Gaussian and they have a bias of +0.1°C relative to the background and a standard deviation of 1.2°C. Figures 12 and 13 show the geographical distributions over the 6-month period of the mean and standard deviation of O-B for ship observations that passed the quality control checks. The numbers of reports used to generate these statistics are presented in Figure 14. The bias is generally less than 0.5°C and the standard deviation is around 1°C. Table 9 contains a list of the ships and drifting buoys considered to have produced suspect observations over the 6-month period. The comments given in each case provide an indication of the main reason for the station to be listed as suspect; time-series charts have also been plotted for SST and are included at the end of the report. The majority of the identifiers appearing on the list do so because of bias. Table 10 gives details of the performance over the latest 6-month period of ships which were considered suspect in the previous period but which do not appear in Table 9.

Page 9 Report no. 43
4. SUMMARY There are 52 marine observing platforms listed as producing suspect observations of pressure over the period January to June 2010, 85 as producing suspect wind observations and 59 as producing suspect SST observations. The first report issued by RSMC Bracknell, for the period January to June 1989, listed 150 marine platforms producing suspect observations of pressure. With the selection criteria remaining unchanged, an initial reduction in the number of platforms listed as suspect was followed by a series of reports listing similar numbers of suspects, around 80. There was an increase in suspect numbers during 1999 and 2000 and since then the numbers have fluctuated, mostly between 100 and 160, although over the past two or three years there has been a downward trend, with a decrease of 61% over the previous two years (compared with report 39). Considering the fluctuations in numbers of platforms reporting and observations monitored, there seems to have been little overall trend in observation quality until recently, although there are signs of a possible improvement in quality over the past two years. For wind observations, over the years up to 2002 there was a tendency for a small increase in the number of wind observing platforms listed as suspect, but since then the numbers have fluctuated, mostly between 100 and 150, except for the last three report periods which have been well below 100. The number of SST observing platforms listed as being suspect has been fairly constant recently, following a decrease in numbers from a high value of 225 in 2005. The most common characteristic in the case of identifiers listed as producing suspect pressure observations is bias in the reported pressure, sometimes remaining constant for many months. In the case of wind suspects, the most common reason for listing a platform is either a bias in the reported wind speed or a large standard deviation in wind direction, with fewer having a bias in wind direction. For sea-surface temperature observations, bias is again the most common cause of error. The selection criteria have been set appropriately to ensure that the platforms listed are only those for which there is a high degree of confidence in their reports having errors. There are many others, not listed here, for which there must be considerable doubt over the quality of the observations. A wider range of monitoring results is available from the Met Office on request.
Report no. 43 Page 10
TABLE 1: FREQUENCY DISTRIBUTION OF THE NUMBER OF REPORTS OF PRESSURE, WIND AND SEA SURFACE TEMPERATURE FROM INDIVIDUAL IDENTIFIERS AVAILABLE FOR MONITORING AT EXETER, JANUARY TO JUNE 2010.
1 214 229 185 4 0 6 11 10 2
2-10 271 282 296 4 0 13 7 11 4
11-20 158 159 156 1 0 7 13 11 2
21-40 302 297 269 13 2 14 11 12 1
41-100 646 651 511 1 1 22 18 17 2
101-200 522 522 442 20 1 36 22 20 7
201-500 266 265 256 40 3 109 25 29 12
501-1000 45 48 59 74 7 181 48 57 32
1001-1500 21 21 32 105 1 172 44 50 17
1500+ 41 40 80 653 10 1449 308 318 283
2486 2514 2286 915 25 2009 507 535 362
(2577) (2598) (2230) (859) (40) (1893) (495) (538) (351)
Number
of
reports
(Report 42)
Total
buoys reporting
Press. Wind SST Press.
Number of manual
ships reporting
Wind SST*
Number of automatic
ships reporting
Wind SST Press.
Number of drifting
* numbers are for automatic (fixed) buoys only
Page 11 Report no. 43
Table 2: Number of observations of pressure received at the Met Office over the GTS for each of the 6-month periods covered by these monitoring reports.
WMO Number of Observations
report Manual Drifting Automatic Period
number ships buoys ships Total
Jan - Jun 1989 1 424087 174971 40082 639140
Jul - Dec 1989 2 421315 151972 58016 631303
Jan - Jun 1990 3 424335 177927 63847 666109
Jul - Dec 1990 4 412430 205488 71146 689064
Jan - Jun 1991 5 364760 177069 64401 606230
Jul - Dec 1991 6 348710 148604 68456 565770
Jan - Jun 1992 7 332443 216872 73893 623208
Jul - Dec 1992 8 336958 247873 80862 665693
Jan - Jun 1993 9 340293 288208 77317 705818
Jul - Dec 1993 10 348082 316261 88650 752993
Jan - Jun 1994 11 334134 279963 111928 726025
Jul - Dec 1994 12 383760 305618 142468 831846
Jan - Jun 1995 13 369781 407111 124537 901429
Jul - Dec 1995 14 394016 528938 138653 1061607
Jan - Jun 1996 15 430162 566035 122909 1119106
Jul - Dec 1996 16 477928 621869 133221 1233018
Jan - Jun 1997 17 446530 623835 122178 1192543
Jul - Dec 1997 18 453399 684292 140227 1277918
Jan - Jun 1998 19 426622 700743 423217 1550582
Jul - Dec 1998 20 443548 700239 497313 1641100
Jan - Jun 1999 21 432506 697983 466311 1596800
Jul - Dec 1999 22 448996 771624 500070 1720690
Jan - Jun 2000 23 443023 772510 455799 1671332
Jul - Dec 2000 24 477828 829588 512338 1819754
Jan - Jun 2001 25 458345 784686 465887 1708918
Jul - Dec 2001 26 473887 914744 554002 1942633
Jan - Jun 2002 27 443876 1111699 517200 2072775
Jul - Dec 2002 28 544433 952313 595959 2092705
Jan - Jun 2003 29 432672 994877 506185 1933734
Jul - Dec 2003 30 473591 1128039 605241 2206871
Jan - Jun 2004 31 435824 1092461 596495 2124780
Jul - Dec 2004 32 434160 1113527 724014 2271701
Jan - Jun 2005 33 471113 1221528 717207 2409848
Jul - Dec 2005 34 472565 1523938 837397 2833900
Jan - Jun 2006 35 456847 1758276 792765 3007888
Jul - Dec 2006 36 447474 1833376 975555 3256405
Jan - Jun 2007 37 410076 1947986 998474 3356536
Jul - Dec 2007 38 454512 2265115 1116750 3836377
Jan - Jun 2008 39 444253 2397246 1156968 3998467
Jul - Dec 2008 40 481513 2605728 1315696 4402937
Jan - Jun 2009 41 466628 2551270 1201762 4219660
Jul - Dec 2009 42 452548 2473739 1381174 4307461
Jan - Jun 2010 43 442069 2606292 1325666 4374027

Report no. 43 Page 12
TABLE 3: LIST OF MARINE OBSERVING PLATFORMS REPORTING SUSPECT PRESSURE OBSERVATIONS OVER THE PERIOD JANUARY TO JUNE 2010.
Column 1 Call sign or identifier. Column 2 Number of pressure observations available for monitoring over the
6-month period, excluding duplicates, but including any observations with gross errors.
Column 3 Number of pressure observations differing by more than 15 hPa from background (gross error).
Column 4 Standard deviation of observation-minus-background differences excluding cases of gross error.
Column 5 Mean of observation-minus-background differences (bias) excluding cases of gross error.
Columns 6-10 Number of times observing platform has appeared on suspect lists. B=Exeter, E=ECMWF, F=MétéoFrance, T=Tokyo, W=Washington.
Column 11 Comments on quality of pressure observations. Notes: 1. Units are hPa. 2. Observing platforms marked with an asterisk were listed in the
previous report January to June 2010) Table 3a: Platforms reporting in BUOY code i): Platforms non-operational at the end of the reporting period
B E F T W Comments
14908 504 0 3.0 -3.6 0 0 2 0 0 Bias
16523 119 33 0.4 0.3 1 1 1 1 1 GE
16525 465 61 5.2 -3.6 0 1 0 0 0 Bias & SD
16527 1874 7 3.1 0.5 0 0 0 0 0 SD
17671 2057 10 3.5 5.9 5 5 4 5 5 Bias
17679 2640 10 3.5 3.1 3 3 2 3 3 Bias
17907 2369 33 3.1 3.5 2 1 0 2 1 Bias
21984 764 224 0.4 0.0 2 2 2 1 2 GE
23706 2567 904 1.1 1.0 2 2 2 2 2 GE
23997 1621 0 0.6 4.2 2 0 2 2 1 Bias
33689 244 0 1.1 -3.7 0 1 0 1 0 Bias
33903 583 0 0.9 -3.7 0 1 0 1 0 Bias
33946 597 0 0.8 -3.7 0 0 0 1 0 Bias
33949 169 0 0.9 -5.2 1 1 1 1 1 Bias
46636 136 126 0.9 0.3 1 1 0 1 1 GE
48596 266 221 5.5 -8.8 1 1 2 0 1 Bias & SD
56517 143 143 --- --- 2 2 2 0 1 GE
56901 1126 601 0.4 0.0 1 1 1 1 1 GE
71705 1090 1 2.7 3.6 1 2 0 1 1 Bias
BiasIdentifier N Obs. NGE SD
Page 13 Report no. 43
ii): Platforms operational at the end of the reporting period
B E F T W Comments
33947 198 0 1.0 -3.4 0 0 0 1 1 Bias
BiasIdentifier N Obs. NGE SD
Table 3b: Platforms reporting in SHIP code
Identifier N Obs. NGE SD Bias B E F T W Comments
A8JX8 59 1 3.7 4.0 2 3 3 0 3 Bias
AUFI 57 0 1.3 4.6 2 2 0 0 2 Bias
C6UK7 49 0 5.6 -3.1 1 1 0 0 2 SD
C6XB2 116 0 2.9 -3.4 0 0 0 0 0 Bias
CG2350 70 17 1.2 -9.0 1 1 1 0 1 Bias
CG2522 732 440 10.0 -6.2 2 2 0 0 2 Bias & GE
CG2960 * 1241 239 5.1 1.3 4 4 6 0 5 Bias & SD
CG2992 * 925 647 4.9 6.2 2 2 2 0 2 Bias & GE
CGDS * 2890 1789 10.1 -2.5 6 5 6 0 6 Bias & SD
KS000 274 0 6.3 0.4 1 1 1 0 1 Biases
NWS0010 2117 489 9.0 -0.8 5 1 3 0 4 SD
NWS0016 499 18 1.4 -14.1 2 1 1 0 1 Bias
OUJI2 124 0 1.8 3.9 2 2 2 0 2 Bias
S6NK5 60 0 1.8 4.3 1 1 1 0 1 Bias
TBWUK36 232 0 3.3 1.9 0 0 0 0 1 Reduced bias
UAHF 45 0 1.8 4.3 1 1 1 0 1 Bias
UBHE9 * 43 0 3.5 5.5 1 1 0 0 1 Bias
UCJP 59 0 5.1 -1.9 0 0 0 0 1 SD
UCTS 197 6 5.6 -1.5 2 2 3 0 2 SD
UIFU 109 0 2.6 -3.5 1 2 2 0 2 Bias
V2AC6 56 0 1.4 -3.5 0 1 0 0 0 Bias
V7DG6 78 0 2.4 -3.5 0 0 0 0 0 Bias
VC6750 * 214 112 1.0 -13.1 1 0 1 0 1 Bias
VCJM 322 202 1.0 -9.4 2 2 2 0 3 Bias
VGWM 117 4 5.5 -0.7 0 1 0 0 0 SD
VOPM * 134 55 0.6 -0.8 1 1 1 0 1 GE
VWNY 44 0 3.9 -4.5 1 1 0 0 1 Bias
WDC8307 80 1 5.3 2.1 2 0 1 0 2 SD
WDE2652 54 1 10.0 -2.9 1 0 0 0 0 SD
WDE3569 67 10 4.7 -3.8 1 0 2 0 2 Bias
YJUF5 95 0 1.0 5.7 2 0 1 0 2 Bias
ZCDL9 * 90 0 4.7 6.0 2 0 3 0 2 Bias

Report no. 43 Page 14
TABLE 4: LIST OF PLATFORMS REPORTING IN SHIP CODE NOT APPEARING IN TABLE 3 BUT LISTED AS SUSPECT OVER THE PERIOD JANUARY TO JUNE 2010.
Column 1 Call sign or identifier. Column 2 Number of pressure observations available for monitoring over the
6-month period, excluding duplicates, but including any observations with gross errors.
Column 3 Number of pressure observations differing by more than 15 hPa from background (gross error).
Column 4 Standard deviation of observation-minus-background differences excluding cases of gross error.
Column 5 Mean of observation-minus-background differences (bias) excluding cases of gross error.
Column 6 Comments on quality of pressure observations. Notes: 1. Units are hPa
Page 15 Report no. 43
Comments
8PPK 73 1 2.4 0.6 Reduced bias
9HRJ9 2200 0 1.8 0.7 Reduced SD
9MBW7 18 3 2.2 -2.3 Less than 40 reports
A8ET7 61 0 2.0 -1.2 Reduced bias
A8GI7 125 23 6.7 1.2 Reduced bias
A8JJ8 64 0 1.8 -0.3 Reduced bias
A8NA3 24 0 1.8 3.0 Less than 40 reports
AUBE 17 3 4.9 5.2 Less than 40 reports
AUBL 6 1 0.6 11.5 Less than 40 reports
C6PZ3 86 0 2.6 1.2 Reduced bias
C6SE8 73 0 1.1 0.5 Reduced bias
DQVG 78 0 2.9 -4.0 Bias
HPHV 45 0 3.6 2.1 Reduced bias
IBCF 533 1 2.6 -0.2 Reduced bias
MRWF2 145 0 2.6 -1.0 Less biases
ONAI 3 0 0.4 -3.7 Less than 40 reports
ONCA 102 13 3.0 2.3 Reduced bias
ONEQ 1 0 0.0 -4.1 Less than 40 reports
OUJS2 73 0 3.3 3.1 Reduced bias
OZBY2 103 0 2.1 2.1 Reduced bias
UCAB 60 0 2.3 1.0 Reduced bias
UCJE 30 0 1.1 3.2 Less than 40 reports
UCKA 96 6 2.7 1.4 Reduced SD
UCUF 138 0 3.4 -0.3 Reduced SD
UITP 50 1 3.2 3.3 Reduced bias
UITR 58 0 4.0 -3.1 Reduced bias
VRCQ2 33 0 2.2 2.9 Less than 40 reports
VRWE7 65 3 3.8 2.7 Reduced bias
VRZK8 147 0 4.0 0.8 Reduced bias
WCZ6534 2 0 0.3 -0.8 Less than 40 reports
WDE8265 38 0 3.5 -0.1 Less than 40 reports
WED2281 167 0 1.9 -0.7 Reduced bias
WL3108 2 0 0.5 -1.8 Less than 40 reports
WQZ7791 62 10 4.1 -0.8 Reduced bias
WQZ9670 258 9 1.8 0.1 Reduced bias
BiasIdentifier N Obs. NGE SD

Report no. 43 Page 16
TABLE 5: LIST OF MARINE OBSERVING PLATFORMS REPORTING SUSPECT WIND SPEED OBSERVATIONS OVER THE PERIOD JANUARY TO JUNE 2010.
Column 1 Call sign or identifier. Column 2 Number of wind speed observations available for monitoring over
the 6-month period, excluding duplicates, but including any observations with gross errors.
Column 3 Number of wind observations with vector difference from background of more than 25ms -1 (gross error).
Column 4 Standard deviation of observation-minus-background differences excluding cases of gross error.
Column 5 Mean of observation-minus-background differences (bias) excluding cases of gross error.
Column 6-10 Number of times observing platform has appeared on suspect lists. B=Exeter, E=ECMWF, F=MétéoFrance, T=Tokyo, W=Washington.
Column 11 Comments on quality of wind speed observations. Notes: 1. Units are ms-1 2. Observing platforms marked with an asterisk were listed in the
previous report (January to June 2010) Table 5a: Platforms reporting in BUOY code i): Platforms non-operational at the end of the reporting period
Identifier N Obs. NGE SD Bias B E F T W Comments
ii): Platforms operational at the end of the reporting period
Identifier N Obs. NGE SD Bias B E F T W Comments
Table 5b: Platforms reporting in SHIP code
Identifier N Obs. NGE SD Bias B E F T W Comments
A8ET7 61 0 4.3 4.8 1 1 0 0 1 Bias
A8JR5 81 0 3.9 5.0 1 0 0 0 0 Bias
A8RH4 94 0 4.2 5.0 2 2 2 0 2 Bias
A8SW4 85 0 3.7 4.9 1 0 0 0 0 Bias
BATFR20 55 26 10.3 7.7 1 0 2 0 1 Bias & SD
DHDH 47 0 2.9 5.9 2 1 2 0 2 Bias
HP6038 284 1 4.0 6.1 3 0 0 0 2 Bias
KS000 * 274 14 5.7 7.9 3 3 3 0 2 Bias
UCUE 105 0 1.6 -5.3 1 1 2 0 1 Bias
VEP717 * 991 3 4.4 6.3 6 4 3 0 3 Bias
Page 17 Report no. 43
TABLE 6: LIST OF PLATFORMS REPORTING IN SHIP CODE NOT APPEARING IN TABLE 5 BUT LISTED AS SUSPECT OVER THE PERIOD JANUARY TO JUNE 2010.
Column 1 Call sign or identifier. Column 2 Number of wind speed observations available for monitoring over
the 6-month period, excluding duplicates, but including any observations with gross errors.
Column 3 Number of wind observations with vector difference from background of more than 25ms-1 (gross error).
Column 4 Standard deviation of observation-minus-background differences excluding cases of gross error.
Column 5 Mean of observation-minus-background differences (bias) excluding cases of gross error.
Column 6 Comments on quality of wind speed observations. Notes: 1. Units are ms-1
Comments
3EKU3 78 0 5.2 4.7 Reduced bias
A8CP8 41 0 4.9 3.4 Reduced bias
A8KO3 125 4 4.2 4.2 Reduced bias
ELTG9 2 0 2.4 10.9 Less than 40 reports
KS078 8 0 3.9 9.2 Less than 40 reports
PCHM 2302 1 3.4 3.3 Reduced bias
ZCDF8 350 0 3.1 4.2 Reduced bias
ZCDP2 13 0 3.0 2.5 Less than 40 reports
BiasIdentifier N Obs. NGE SD

Report no. 43 Page 18
TABLE 7: LIST OF MARINE OBSERVING PLATFORMS PRODUCING SUSPECT WIND DIRECTION OBSERVATIONS OVER THE PERIOD JANUARY TO JUNE 2010 .
Column 1 Call sign or identifier. Column 2 Number of wind direction observations available for monitoring
over the 6-month period, excluding duplicates, but including any observations with gross errors.
Column 3 Number of wind observations with vector difference from background of more than 25ms-1 (gross error).
Column 4 Standard deviation of observation-minus-background differences excluding cases of gross error.
Column 5 Mean of observation-minus-background differences (bias) excluding cases of gross error.
Column 6-10 Number of times observing platform has appeared on suspect lists. B=Exeter, E=ECMWF, F=MétéoFrance, T=Tokyo, W=Washington.
Column 11 Comments on quality of wind direction observations. Notes: 1. Units are degrees ( ° ). 2. Observing platforms marked § had a significant speed bias at some
time within the period and the statistics and their plots refer to direction reports associated with background wind speeds greater than 5 ms-1 . If no significant speed bias was present, the statistics and plots refer to direction reports with an observed speed greater than 5 ms-1.
3. Observing platforms marked with an asterisk were listed in the previous report (January to June 2010)
Table 7a: Platforms reporting in BUOY code i): Platforms non-operational at the end of the reporting period
Identifier N Obs. NGE SD Bias B E F T W Comments
ii): Platforms operational at the end of the reporting period
Identifier N Obs. NGE SD Bias B E F T W Comments
Table 7b: Platforms reporting in SHIP code

Page 19 Report no. 43
Identifier N Obs. NGE SD Bias B E F T W Comments
31260 641 0 78.5 37.1 1 3 5 2 5 Bias & SD
3EBL5 * 326 0 63.0 9.4 0 0 2 0 0 SD
3EJM9 66 0 49.3 -41.3 0 0 0 0 0 Bias
42364 * 5287 0 29.8 1.9 0 0 0 0 0 SD
45144 334 1 106.0 100.1 1 1 1 1 1 Bias & SD
45145 459 0 50.7 -94.5 1 1 1 1 1 Bias
46022 * 1128 0 47.1 29.8 0 0 0 0 0 Bias
46081 * 3230 0 37.5 -29.8 0 0 3 1 6 Bias
46146 3410 0 46.2 -37.7 0 0 0 0 3 Bias
61010 * 1043 0 58.1 81.5 6 6 6 6 0 Bias
62128 * 3352 0 49.4 31.0 0 0 0 0 1 Bias
9HJH9 53 0 45.0 -38.3 0 0 0 0 0 Bias
9HOB8 389 0 64.2 -1.9 0 0 0 0 2 SD
9HOM8 * 304 0 55.9 -8.2 0 0 0 0 1 SD
9VAY4 * 139 0 73.7 -8.4 0 0 0 0 3 SD
A3CW4 73 0 64.2 -8.8 0 0 0 0 0 SD
A8CJ9 * 139 0 59.8 -1.1 1 1 2 0 1 SD
A8IH6 97 0 65.9 14.6 0 0 0 0 1 SD
A8IN9 200 5 60.2 -13.9 0 0 0 0 3 SD
A8IP3 109 1 74.9 1.9 0 0 1 0 3 SD
A8JH7 87 1 64.3 -28.7 1 1 0 0 0 SD & bias
A8PQ8 * 54 0 59.9 15.0 0 0 0 0 0 SD
A8RQ6 102 0 61.7 2.4 0 0 0 0 1 SD
BATFR20 § 55 24 55.0 -37.2 1 0 2 0 1 Bias
BATFR32 § 141 0 84.2 -1.3 1 0 1 0 1 SD
C6KD4 § 255 0 65.3 -0.8 0 0 0 0 2 SD
C6ME8 117 1 66.4 4.2 0 0 0 0 1 SD
C6OM7 96 0 41.7 -40.1 0 1 0 0 2 Bias
C6UG4 81 7 94.1 -1.7 2 1 1 0 2 SD
DAQZ * 83 1 51.9 -30.2 0 0 0 0 1 Bias
DFRZ 116 0 68.5 -4.4 0 0 0 0 0 SD
DPCK 121 7 67.1 -0.4 0 0 0 0 2 SD
ELZY4 95 0 67.1 -45.6 0 0 0 0 1 Bias & SD
GLNE 114 1 67.8 -13.5 1 1 1 0 1 SD
H3VR 171 0 54.9 -38.1 0 0 0 0 0 Bias
H3VS 138 0 60.1 -17.8 0 0 0 0 1 SD
H9UY § 209 5 81.7 -2.7 2 4 2 0 3 SD
HZDD 127 0 61.8 -2.7 0 0 0 0 2 SD
HZZB 54 0 61.6 7.7 0 0 0 0 1 SD
IBLQ 65 0 62.5 4.1 0 0 0 0 0 SD
Continued >
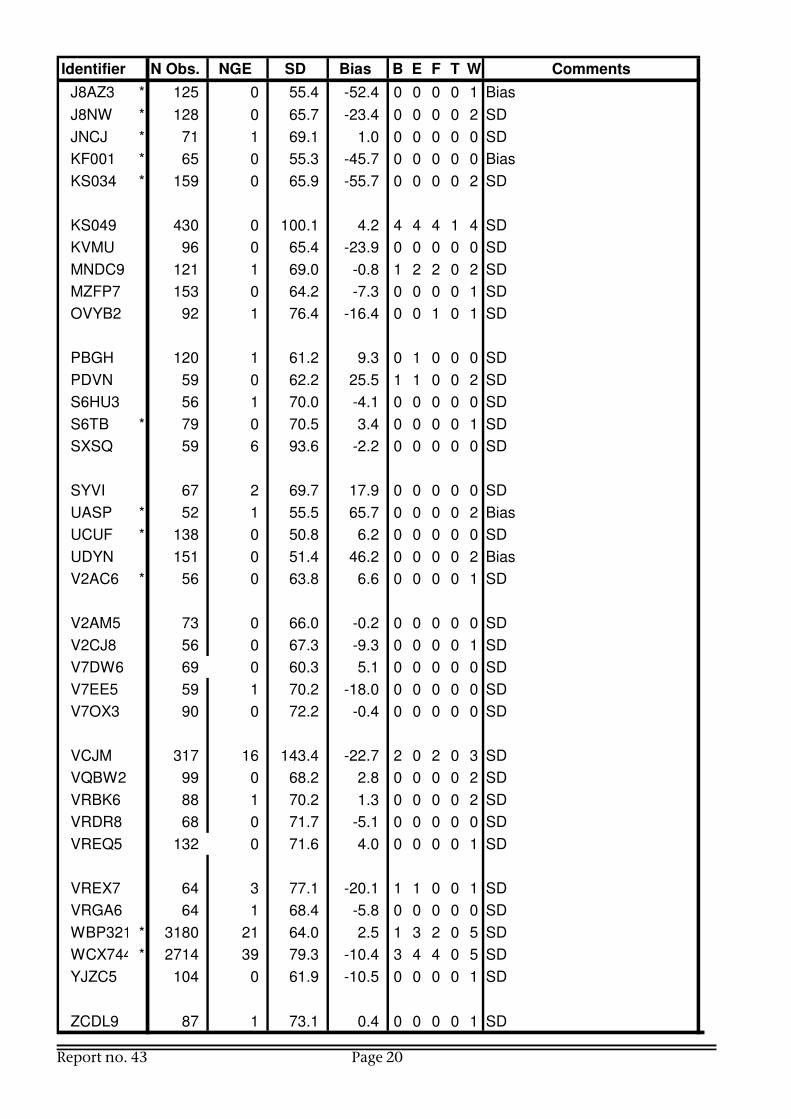
Report no. 43 Page 20
Identifier N Obs. NGE SD Bias B E F T W Comments
J8AZ3 * 125 0 55.4 -52.4 0 0 0 0 1 Bias
J8NW * 128 0 65.7 -23.4 0 0 0 0 2 SD
JNCJ * 71 1 69.1 1.0 0 0 0 0 0 SD
KF001 * 65 0 55.3 -45.7 0 0 0 0 0 Bias
KS034 * 159 0 65.9 -55.7 0 0 0 0 2 SD
KS049 430 0 100.1 4.2 4 4 4 1 4 SD
KVMU 96 0 65.4 -23.9 0 0 0 0 0 SD
MNDC9 121 1 69.0 -0.8 1 2 2 0 2 SD
MZFP7 153 0 64.2 -7.3 0 0 0 0 1 SD
OVYB2 92 1 76.4 -16.4 0 0 1 0 1 SD
PBGH 120 1 61.2 9.3 0 1 0 0 0 SD
PDVN 59 0 62.2 25.5 1 1 0 0 2 SD
S6HU3 56 1 70.0 -4.1 0 0 0 0 0 SD
S6TB * 79 0 70.5 3.4 0 0 0 0 1 SD
SXSQ 59 6 93.6 -2.2 0 0 0 0 0 SD
SYVI 67 2 69.7 17.9 0 0 0 0 0 SD
UASP * 52 1 55.5 65.7 0 0 0 0 2 Bias
UCUF * 138 0 50.8 6.2 0 0 0 0 0 SD
UDYN 151 0 51.4 46.2 0 0 0 0 2 Bias
V2AC6 * 56 0 63.8 6.6 0 0 0 0 1 SD
V2AM5 73 0 66.0 -0.2 0 0 0 0 0 SD
V2CJ8 56 0 67.3 -9.3 0 0 0 0 1 SD
V7DW6 69 0 60.3 5.1 0 0 0 0 0 SD
V7EE5 59 1 70.2 -18.0 0 0 0 0 0 SD
V7OX3 90 0 72.2 -0.4 0 0 0 0 0 SD
VCJM 317 16 143.4 -22.7 2 0 2 0 3 SD
VQBW2 99 0 68.2 2.8 0 0 0 0 2 SD
VRBK6 88 1 70.2 1.3 0 0 0 0 2 SD
VRDR8 68 0 71.7 -5.1 0 0 0 0 0 SD
VREQ5 132 0 71.6 4.0 0 0 0 0 1 SD
VREX7 64 3 77.1 -20.1 1 1 0 0 1 SD
VRGA6 64 1 68.4 -5.8 0 0 0 0 0 SD
WBP3210 * 3180 21 64.0 2.5 1 3 2 0 5 SD
WCX7445 * 2714 39 79.3 -10.4 3 4 4 0 5 SD
YJZC5 104 0 61.9 -10.5 0 0 0 0 1 SD
ZCDL9 87 1 73.1 0.4 0 0 0 0 1 SD

Page 21 Report no. 43
TABLE 8: LIST OF PLATFORMS REPORTING IN SHIP CODE NOT APPEARING IN TABLE 7 BUT LISTED AS SUSPECT OVER THE PERIOD JANUARY TO JUNE 2010.
Column 1 Call sign or identifier. Column 2 Number of wind direction observations available for monitoring
over the 6-month period, excluding duplicates, but including any observations with gross errors.
Column 3 Number of wind observations with vector difference from background of more than 25ms -1 (gross error).
Column 4 Standard deviation of observation-minus-background differences excluding cases of gross error.
Column 5 Mean of observation-minus-background differences (bias) excluding cases of gross error.
Column 6 Comments on quality of wind direction observations. Notes: 1. Units are degrees ( ° )

Report no. 43 Page 22
Comments
21210 3107 312 123.3 -4.7 Bias removed in April
3FCA9 40 0 54.5 -4.2 Reduced SD
3FPQ9 109 0 43.1 0.8 Reduced SD
3FPS9 88 0 42.2 -10.0 Reduced SD
46094 5068 0 43.1 12.7 Reduced bias
62081 1358 0 29.2 3.8 Reduced bias
9VVD6 93 0 46.3 -26.6 Reduced SD
A8FS8 16 0 76.8 -49.2 Less than 40 reports
A8FW3 42 1 34.3 -9.0 Reduced SD
A8GX4 65 0 55.7 15.8 Reduced bias
A8IH2 134 0 41.2 -8.6 Reduced SD
A8JM3 82 0 37.4 3.6 Reduced SD
A8ME4 97 0 38.4 -10.5 Reduced SD
A8PQ4 1294 4 41.4 4.9 Reduced SD
ATMG 27 0 81.8 35.3 Less than 40 reports
ATVX 142 0 40.7 -2.2 Reduced SD
C6JT 185 1 43.9 -3.8 Reduced SD
C6KD5 165 0 51.5 -22.1 Reduced SD
C6XE5 35 0 81.6 11.0 Less than 40 reports
DCPC2 82 0 51.8 -27.0 Reduced SD
DDVK2 214 3 68.2 -2.3 Reduced SD & bias
DGOS 143 0 50.5 -3.4 Reduced SD
DICB 36 0 49.2 -9.5 Less than 40 reports
IBCE 98 0 55.8 9.7 Reduced SD
MGSM5 36 0 57.0 -0.8 Less than 40 reports
MHNO6 30 0 37.5 -5.6 Less than 40 reports
PEBP 143 0 42.4 -7.1 Reduced SD
TBWUK18 14 0 60.9 -2.3 Less than 40 reports
UCAD 136 1 57.0 0.3 Reduced SD
UCJE 30 0 40.0 -15.1 Less than 40 reports
UCKA 110 1 52.0 -14.0 Reduced SD
UCUO 239 0 60.3 -11.4 Reduced SD
V2BM5 64 0 49.4 -7.0 Reduced SD
V2NA1 21 0 65.1 -36.8 Less than 40 reports
VRCQ2 33 0 65.4 -12.8 Less than 40 reports
VRDT7 66 1 54.1 5.8 Reduced SD
VRFS2 131 0 45.8 21.2 Reduced SD
VRXK4 102 0 49.0 -1.2 Reduced SD
WBS5272 57 0 37.4 1.2 Reduced SD
WCF3990 20 0 41.5 5.5 Less than 40 reports
WCX4608 26 0 77.0 -17.8 Less than 40 reports
WDD9281 357 0 51.1 -2.3 Reduced SD
WWU8 252 0 50.9 -1.5 Reduced SD
ZCBP6 30 0 41.5 -22.6 Less than 40 reports
BiasIdentifier N Obs. NGE SD

Page 23 Report no. 43
TABLE 9: LIST OF MARINE OBSERVING PLATFORMS REPORTING SUSPECTSEA SURFACE TEMPERATURE OBSERVATIONS OVER THE PERIOD JANUARY TO JUNE 2010.
Column 1 Call sign or identifier. Column 2 Number of sea-surface temperature observations available for
monitoring over the six-month period, excluding duplicates, but including any observations with gross errors.
Column 3 Number of sea surface temperature observations differing by more than 10 °C from background (gross error).
Column 4 Standard deviation of observation-minus-background differences excluding cases of gross error.
Column 5 Mean of observation-minus-background differences excluding cases of gross error.
Columns 6-10 Number of times observing platform has appeared on suspect lists. B=Exeter, E=ECMWF, F=MétéoFrance, T=Tokyo, W=Washington.
Column 11 Comments on quality of sea surface temperature observations. Notes: 1. Units are °C 2. Observing platforms marked with an asterisk were listed in the
previous report (January to June 2010)

Report no. 43 Page 24
Table 9a: Platforms reporting in BUOY code i): Platforms non-operational at the end of the reporting period
B E F T W Comments
15613 176 0 1.5 5.8 2 - 0 - 2 Bias
21984 744 218 0.4 -0.4 2 - 0 - 2 GE
21987 234 1 2.1 3.3 1 - 1 - 0 Bias
23706 3239 871 0.4 0.2 1 - 0 - 1 GE
31733 835 704 5.7 2.3 3 - 2 - 3 SD
32719 125 125 --- --- 1 - 1 - 1 GE
44641 1468 514 0.7 8.6 3 - 4 - 3 Bias
44914 210 210 --- --- 2 - 0 - 2 GE & bias
46568 711 20 1.1 8.5 1 - 1 - 1 Bias
51621 625 0 2.2 3.7 1 - 0 - 1 Bias
51822 345 0 1.7 3.5 1 - 0 - 0 Bias
51826 223 3 1.2 7.8 1 - 0 - 1 Bias
51964 344 141 0.3 0.1 1 - 0 - 1 GE
52676 374 149 3.1 -1.8 1 - 1 - 1 GE & bias
52805 238 91 1.1 -7.7 2 - 1 - 2 GE & bias
52810 296 97 3.2 0.0 1 - 1 - 0 GE
54914 1212 858 2.2 6.5 2 - 2 - 2 Bias
56517 135 135 --- --- 2 - 0 - 1 GE
56528 199 199 --- --- 1 - 0 - 1 GE
61854 152 1 3.5 -3.4 1 - 0 - 0 Bias
63529 7686 1413 1.9 -7.0 4 - 0 - 0 Bias
64931 88 43 1.1 -0.8 1 - 1 - 1 GE
64932 86 41 1.2 -0.2 1 - 1 - 1 GE
64933 81 43 0.7 -0.3 1 - 1 - 1 GE
64935 92 41 0.1 -1.9 1 - 1 - 1 GE
BiasIdentifier N Obs. NGE SD
ii): Platforms operational at the end of the reporting period
B E F T W Comments
13544 1526 9 2.4 3.0 2 - 0 - 0 Bias
51955 243 1 0.3 3.4 1 - 0 - 0 Bias
64930 81 34 1.1 -1.6 1 - 1 - 1 GE
BiasIdentifier N Obs. NGE SD
Page 25 Report no. 43
Table9b: Platforms reporting in SHIP code
Identifier N Obs. NGE SD Bias B E F T W Comments
3FNZ5 118 0 1.8 -3.0 1 - 1 - 0 Bias
41112 8112 47 3.3 -2.4 2 - 2 - 2 Bias
41113 5989 43 2.7 -3.8 3 - 3 - 1 Bias
41114 8390 0 2.0 -2.3 3 - 0 - 0 Bias
42363 14010 0 1.7 -3.1 2 - 1 - 2 Bias
44041 4217 0 3.0 2.4 4 - 1 - 0 Bias since March
44043 2960 12 2.5 3.3 3 - 0 - 0 Bias
44057 1529 77 1.7 6.4 3 - 1 - 2 Bias
44063 1018 0 1.7 3.8 2 - 0 - 0 Bias
A8AX8 58 0 1.0 -3.1 1 - 2 - 0 Bias
A8GA8 * 65 0 2.4 3.0 0 - 0 - 0 Bias
A8JM3 112 0 1.0 -3.4 3 - 3 - 0 Bias
BATFR20 420 5 1.5 5.8 3 - 4 - 3 Bias
C6FM9 83 0 1.7 3.0 1 - 1 - 1 Bias
DANV * 42 0 0.9 -2.7 0 - 0 - 0 Bias
DGTX * 234 0 2.0 3.4 4 - 2 - 0 Bias
DNDD 40 1 1.6 4.3 1 - 1 - 1 Bias
ICRA 110 0 2.3 -4.9 1 - 1 - 1 Bias
KS034 * 171 0 0.6 3.8 2 - 2 - 0 Bias
KS088 59 0 2.6 -3.4 0 - 0 - 0 Bias
LEQZ3 54 1 1.5 3.0 1 - 0 - 0 Bias
S6TD 103 6 2.7 5.2 2 - 2 - 2 Bias
UCJL 135 0 1.8 3.3 4 - 3 - 0 Bias
UEYO 97 42 2.6 -5.1 2 - 0 - 2 Bias
V7LU5 90 4 2.3 5.5 2 - 1 - 2 Bias
VRDR8 70 0 2.6 -3.7 1 - 1 - 0 Bias
VRDT7 73 1 2.4 3.8 2 - 0 - 2 Bias
WGJT 210 1 1.7 -3.0 3 - 2 - 0 Bias
WRFJ 89 1 2.5 4.2 1 - 0 - 1 Bias
WZZF 148 0 0.9 3.1 5 - 2 - 0 Bias
ZCBP6 * 44 0 0.7 5.5 0 - 0 - 0 Bias
Report no. 43 Page 26
TABLE 10: LIST OF PLATFORMS REPORTING IN SHIP CODE NOT APPEARING IN TABLE 9 BUT LISTED AS SUSPECT OVER THE PERIOD JANUARY TO JUNE 2010.
Column 1 Call sign or identifier Column 2 Number of sea-surface temperature observations available for
monitoring over the 6-month period, including any observations with gross errors.
Column 3 Number of sea surface temperature observations differing by more than 10 °C from the background (gross error).
Column 4 Standard deviation of observation-minus-background differences excluding cases of gross error.
Column 5 Mean of observation-minus-background differences excluding cases of gross error.
Column 6 Comments on quality of sea surface temperature observations. Notes: 1. Units are °C
Comments
3FJY6 30 0 0.9 -4.2 Less than 40 reports
9HJB9 1502 208 1.5 -0.3 Bias removed in Feb
9HOB8 495 0 3.3 -1.0 Bias reduced
9V7954 53 0 1.9 -0.9 Bias reduced
9V8258 89 28 2.1 -0.1 Bias & GE reduced
9VAY4 156 2 2.7 -2.2 Bias reduced
A81V4 34 8 2.0 -6.9 Less than 40 reports
A8CS3 50 0 2.9 -1.2 Bias reduced
A8HF6 48 0 2.6 0.7 SD reduced
A8IN8 297 0 1.7 0.9 Bias reduced
B2M1297 38 0 2.5 2.0 Less than 40 reports
CGDP 1354 538 0.8 1.0 Bias reduced in March
DEAL 10 0 1.5 -3.2 Less than 40 reports
DIBZ 9 0 1.4 0.6 Less than 40 reports
DPCK 132 1 1.0 -0.4 Bias reduced
J8PD 4 0 2.0 -2.3 Less than 40 reports
KS078 1 0 0.0 7.3 Less than 40 reports
ONAN 241 2 3.4 -2.8 Bias reduced
ONEQ 1 0 0.0 -5.1 Less than 40 reports
PDWZ 46 0 1.4 1.1 Bias reduced
PHAL 2 0 2.8 -0.2 Less than 40 reports
SAMARIA 15 0 0.9 -0.6 Less than 40 reports
SIWN 326 0 1.7 1.9 Bias reduced
VRXK4 176 0 2.9 -0.2 Bias reduced
ZDGR8 180 1 2.3 1.4 Bias reduced
BiasIdentifier N Obs. NGE SD

Figure 1: Number of observations of pressure received at Exeter on the GTS for each of the six-
month periods covered by the WMO reports on the quality of marine surface observations
0123456789
1011121314151617181920212223242526272829303132333435363738394041424344454647
1 2 3 4 5 6 7 8 9 10 11 12 13 14 15 16 17 18 19 20 21 22 23 24 25 26 27 28 29 30 31 32 33 34 35 36 37 38 39 40 41 42 43
Report number
Num
ber
of pre
ssure
obs. (x
100000)
Manual ships Drifting buoys Automatic ships Total

Figure 2a: Distribution of ship O-B pressure (hPa)
Period of data: JAN-JUN 2010 Data used: All observations
0.00
0.05
0.10
0.15
0.20
0.25
0.30
0.35
-49
.5
-44
.5
-39
.5
-34
.5
-29
.5
-24
.5
-19
.5
-14
.5
-9.5
-4.5
0.5
5.5
10
.5
15
.5
20
.5
25
.5
30
.5
35
.5
40
.5
45
.5
O-B (hPa)
Mean O-B = -0.2 SD O-B = 3.1
N./
To
tal
N./
Cla
ss w
idth
Figure 2b: Distribution of ship O-B pressure (hPa)
Period of data: JAN-JUN 2010 Data used: Flagged observations
0.00
0.01
0.02
0.03
0.04
0.05
0.06
0.07
0.08
0.09
-49
.5
-44
.5
-39
.5
-34
.5
-29
.5
-24
.5
-19
.5
-14
.5
-9.5
-4.5
0.5
5.5
10
.5
15
.5
20
.5
25
.5
30
.5
35
.5
40
.5
45
.5
O-B (hPa)
Mean O-B = -1.4 SD O-B = 8.8
N./
To
tal
N./
Cla
ss w
idth
Figure 2c: Distribution of ship O-B pressure (hPa)
Period of data: JAN-JUN 2010 Data used: Unflagged observations
0.00
0.05
0.10
0.15
0.20
0.25
0.30
0.35
0.40
-49
.5
-44
.5
-39
.5
-34
.5
-29
.5
-24
.5
-19
.5
-14
.5
-9.5
-4.5
0.5
5.5
10
.5
15
.5
20
.5
25
.5
30
.5
35
.5
40
.5
45
.5
O-B (hPa)
Mean O-B = -0.1 SD O-B = 1.1
N./
To
tal
N./
Cla
ss w
idth

Figure 2d: Distribution of ship O-B wind speed (ms-1
)
Period of data: JAN-JUN 2010 Data used: All observations
0.00
0.02
0.04
0.06
0.08
0.10
0.12
0.14
0.16
0.18
-49
.0
-45
.0
-41
.0
-37
.0
-33
.0
-29
.0
-25
.0
-21
.0
-17
.0
-13
.0
-9.0
-5.0
-1.0
3.0
7.0
11
.0
15
.0
19
.0
23
.0
27
.0
31
.0
35
.0
39
.0
43
.0
47
.0
O-B (ms-1
)
Mean O-B = 1.1 SD O-B = 3.1
N./
To
tal
N./
Cla
ss w
idth
Figure 2e: Distribution of ship O-B wind speed (ms-1
)
Period of data: JAN-JUN 2010 Data used: Flagged observations
0.00
0.02
0.04
0.06
0.08
0.10
0.12
-49
.0
-45
.0
-41
.0
-37
.0
-33
.0
-29
.0
-25
.0
-21
.0
-17
.0
-13
.0
-9.0
-5.0
-1.0
3.0
7.0
11
.0
15
.0
19
.0
23
.0
27
.0
31
.0
35
.0
39
.0
43
.0
47
.0
O-B (ms-1
)
Mean O-B = 1.8 SD O-B = 5.5
N./
To
tal
N./
Cla
ss w
idth
Figure 2f: Distribution of ship O-B wind speed (ms-1
)
Period of data: JAN-JUN 2010 Data used: Unflagged observations
0.00
0.02
0.04
0.06
0.08
0.10
0.12
0.14
0.16
0.18
-49
.0
-45
.0
-41
.0
-37
.0
-33
.0
-29
.0
-25
.0
-21
.0
-17
.0
-13
.0
-9.0
-5.0
-1.0
3.0
7.0
11
.0
15
.0
19
.0
23
.0
27
.0
31
.0
35
.0
39
.0
43
.0
47
.0
O-B (ms-1
)
Mean O-B = 1.0 SD O-B = 2.6
N./
To
tal
N./
Cla
ss w
idth

Figure 2g: Distribution of ship O-B wind direction (degrees)
Period of data: JAN-JUN 2010 Data used: All observations
0.000
0.005
0.010
0.015
0.020
0.025
-17
7.5
-16
2.5
-14
7.5
-13
2.5
-11
7.5
-10
2.5
-87
.5
-72
.5
-57
.5
-42
.5
-27
.5
-12
.5
2.5
17
.5
32
.5
47
.5
62
.5
77
.5
92
.5
10
7.5
12
2.5
13
7.5
15
2.5
16
7.5
O-B (degrees)
Mean O-B = -1.2 SD O-B = 36.2
N./
To
tal
N./
Cla
ss w
idth
Figure 2h: Distribution of ship O-B wind direction (degrees)
Period of data: JAN-JUN 2010 Data used: Flagged observations
0.000
0.002
0.004
0.006
0.008
0.010
0.012
0.014
-17
7.5
-16
2.5
-14
7.5
-13
2.5
-11
7.5
-10
2.5
-87
.5
-72
.5
-57
.5
-42
.5
-27
.5
-12
.5
2.5
17
.5
32
.5
47
.5
62
.5
77
.5
92
.5
10
7.5
12
2.5
13
7.5
15
2.5
16
7.5
O-B (degrees)
Mean O-B = -2.1 SD O-B = 63.6
N./
To
tal
N./
Cla
ss w
idth
Figure 2i: Distribution of ship O-B wind direction (degrees)
Period of data: JAN-JUN 2010 Data used: Unflagged observations
0.000
0.005
0.010
0.015
0.020
0.025
-17
7.5
-16
2.5
-14
7.5
-13
2.5
-11
7.5
-10
2.5
-87
.5
-72
.5
-57
.5
-42
.5
-27
.5
-12
.5
2.5
17
.5
32
.5
47
.5
62
.5
77
.5
92
.5
10
7.5
12
2.5
13
7.5
15
2.5
16
7.5
O-B (degrees)
Mean O-B = -1.1 SD O-B = 30.2
N./
To
tal
N./
Cla
ss w
idth
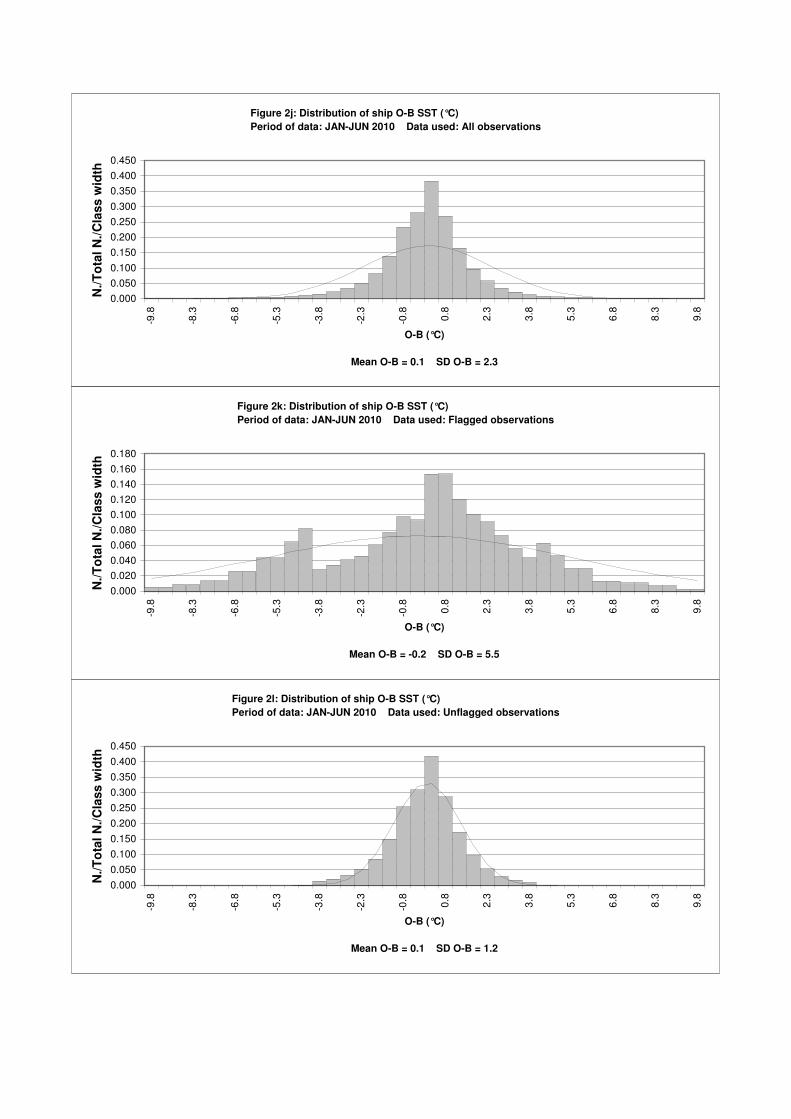
Figure 2j: Distribution of ship O-B SST (°C)
Period of data: JAN-JUN 2010 Data used: All observations
0.000
0.050
0.100
0.150
0.200
0.250
0.300
0.350
0.400
0.450
-9.8
-8.3
-6.8
-5.3
-3.8
-2.3
-0.8
0.8
2.3
3.8
5.3
6.8
8.3
9.8
O-B (°C)
Mean O-B = 0.1 SD O-B = 2.3
N./
To
tal
N./
Cla
ss w
idth
Figure 2k: Distribution of ship O-B SST (°C)
Period of data: JAN-JUN 2010 Data used: Flagged observations
0.000
0.020
0.040
0.060
0.080
0.100
0.120
0.140
0.160
0.180
-9.8
-8.3
-6.8
-5.3
-3.8
-2.3
-0.8
0.8
2.3
3.8
5.3
6.8
8.3
9.8
O-B (°C)
Mean O-B = -0.2 SD O-B = 5.5
N./
To
tal
N./
Cla
ss w
idth
Figure 2l: Distribution of ship O-B SST (°C)
Period of data: JAN-JUN 2010 Data used: Unflagged observations
0.000
0.050
0.100
0.150
0.200
0.250
0.300
0.350
0.400
0.450
-9.8
-8.3
-6.8
-5.3
-3.8
-2.3
-0.8
0.8
2.3
3.8
5.3
6.8
8.3
9.8
O-B (°C)
Mean O-B = 0.1 SD O-B = 1.2
N./
To
tal
N./
Cla
ss w
idth

H
H
L
L
L0
0
0
0
0
0
0
00.5
H
H
L
L
L
Shaded areas have a bias of magnitude greater than 1.0 hPaContours drawn to 10 degree boxes, if the number of observations is greater than 10Only observations passing quality control used in statisticsFigure 3: Bias of Ship O-B Pressure (hPa). Date:- January - June 2010
1
1
1
1
1
1
1
1
1.5
H
H
H
L
L
L
H
H
H
L
L
L
Shaded areas have a standard deviation of greater than 2.0 hPaContours drawn to 10 degree boxes, if the number of observations is greater than 10Only Observations passing quality control used in statisticsFigure 4: Standard Deviation of Ship O-B Pressure (hPa). Date:- January - June 2010
15 22 21 14 88 14 16 118 3 12 15 18 12 197 6
11 96 23 3 1 2 11 4 4 6 233 3131 684 14 18 19 20 78 105 17 1 4 3 2 10 28 21 21 7 4 3 70 735 14 84 9
114 13 34 2 14 18 30 1658 859 263 95 393 417 5 9 42 42 5 38 151 55 4 10 19 18 7 299 59 2
322 2 4 2 3 33 132 185 181 74 22 7 14 10 32 60 3 181 55 82 35 190 174 4 2 2 4 37 2608 212 519 7207
225 164 121 110 37 25 8 4 21 27 291 2 784 1458 71 128 138 228 261 1709 1526 695 258 73 90 212 135 44 45 2453 1170 1961 5160 4189 468 7742
168 169 125 168 354 172 85 17 25 31 489 4391 607 242 194 218 443 1058 1011 2458 2316 187 86 25 19 261 1437 60 2812 975 377
287 268 843 1735 526 164 175 198 55 109 693 1258 174 163 224 797 301 91 1517 1337 3934 381 681 322 505 587 632 272 2553 1189 349 414
2224 85 151 48 101 207 323 369 366 884 90 92 243 1766 2538 102 2513 767 257 1 90 113 56 1857 1237 1530 84 881 817 542 248 1192 5432 213 27
61 63 76 1718 391 32 26 1740 577 1975 987 6 732 771 446 1103 1017 1335 2644 2 2 55 57 317 2149 4376 2611 3949 972 837 8513 6849 8954 2499 13
98 3903 3972 163 253 190 177 1714 1356 10323 4791 17013 8279 4272 2145 3516 2204 2 1 1 2 361 2148 1837 1592 960 663 2068 208 2877 1540 1163 832 276 364 144
525 4274 8524 950 708 609 1981 702 33892 422041920810243 6023 1987 1655 1012 4124 2 2 5 2262 66 1872 843 15 47 2 5 1018 3660 2536 779 376 538 384
428 449 465 782 1103 3851116167 26 1346149022 4011 3370 2298 2680 2905 4513 8615 5410 3491 4644 2699 1 1 30 21600 6025 2588 717 482 402
615 651 723 889 5550 54025 1 1104 298865928456526 34372 7212 2892 3312 9058 3505721601 1588 421 533 27 1 775 1881 1554 900 692
9437 5945 6655 17840 3369620875 1 2612 652 3233 1623 1946 2067 21929 6040812043618166 593 34 1 1 1 1 203 585 493 592
13 164 507 11818 514 155 169 868 273 1735 707 413 1182 1149 9067 55958 2255 96 257 119 35 2 1 1 9
5 37 82 12 1 1 141 32 77 279 1485 748 1066 199 161 23 21 33 6 5
4 399 103 2 265 11 2 5
Only observations passing quality control includedPlot of the Number of Ship Pressure Observations. Date:- January - June 2010Figure 5:

0
0
1
1
1 1
1
1
11
1
H
HL
L L
H
HL
L L
Shaded areas have a bias of magnitude greater than 2.0 ms-1Contours drawn to 10 degree boxes, if the number of observations is greater than 10Only observations passing quality control used in statisticsFigure 6: Bias of Ship O-B Wind Speed (ms-1). Date:- January - June 2010

2
2
2
2
2
2
2
2
3H
H
H
LL
H
H
H
LL
Shaded areas have a standard deviation of greater than 4.0 ms-1Contours drawn to 10 degree boxes, if the number of observations is greater than 10Only Observations passing quality control used in statisticsFigure 7: Standard Deviation of Ship O-B Wind Speed (ms-1). Date:- January - June 2010

14 22 21 14 88 14 16 118 3 12 15 18 12 160 6 1
10 97 24 3 1 2 11 4 4 6 89 745 78 14 18 17 15 62 98 16 1 4 3 2 10 28 21 21 7 4 3 69 725 14 83 7
114 14 34 2 14 18 31 398 347 271 101 380 408 1 6 28 42 5 38 151 55 4 11 19 17 7 298 59 2
323 2 1 4 2 3 33 146 195 255 76 25 8 14 10 19 59 1 55 49 13 124 174 4 2 2 4 38 1665 174 226 2066
191 107 66 62 28 10 8 4 26 33 255 2 885 462 76 132 143 233 270 1568 1333 585 262 92 91 213 136 45 49 2002 975 1777 3843 3130 434 2227
164 164 122 157 260 59 37 9 32 34 396 1 3 1774 605 248 207 228 417 901 1 881 2215 2125 197 94 30 18 250 1231 1 68 2323 845 395
215 194 765 1630 449 138 86 72 38 109 554 5738 177 173 224 601 285 84 1510 2994 3827 373 659 341 437 475 590 201 2615 861 271 307
12111 675 6929 2086 2530 7334 5193 580 6691 718 65 97 125 3590 2540 2235 2496 610 266 88 117 1881 326 1152 3619 75 443 472 537 233 1005 4394 6611 28
11537 2899 6458 6034 1520 6637 4870 1732 4028 1663 703 6 557 751 2591 1658 1019 1101 2030 3 3 53 57 316 1982 5732 2409 3198 972 911 4117 6704 8276 6855 12
108 3903 3970 145 243 181 166 1751 1322 10247 4273 16880 8145 4296 4309 3068 2225 3 3 1 4 369 2659 1898 1623 1089 2830 2073 234 2814 1507 1113 789 278 366 150
526 4260 7440 944 713 607 2095 790 30594 369021896610042 5773 1795 2862 2950 3800 5 3 5 2145 49 2245 909 17 63 4 7 1099 3426 2561 701 385 533 372
409 431 449 795 1118 3566316280 1 26 1410254309 3731 3148 2038 2368 2638 3969 7175 4271 3118 3649 2144 1 1 1 1 1 36 25688 5898 3326 700 465 401
657 670 752 926 5336 50253 1 1348 341115807957488 28153 4821 2137 2499 8500 3291014087 1435 385 539 25 5 7 1 1 1 825 1990 1626 941 745
6810 5753 3508 17063 3235519236 1 2 3245 2 1 665 3164 1064 1251 1412 15274 4390310997420083 609 35 3 4 1 1 1 1 220 628 498 595
15 178 484 11241 759 712 1252 869 273 887 388 118 730 827 6398 52056 2148 94 364 179 36 3 1 3 1 13
5 37 81 12 1 1 1 2 141 32 79 338 1626 735 1028 206 166 26 28 43 1 6 5
4 399 103 2 44 11 2 1 1 5
Only observations passing quality control includedPlot of the Number of Ship Wind Speed Observations. Date:- January - June 2010Figure 8:
H
H
H
LL
L
0
0
0
0
0
0
0
00
H
H
H
LL
L
Shaded areas have a bias of magnitude greater than 10 degreesContours drawn to 10 degree boxes, if the number of observations is greater than 10Only observations passing quality control used in statisticsFigure 9: Bias of Ship O-B Wind Direction (degrees). Date:- January - June 2010

20
20
20
20
20
20
40
40
40
H
HL
H
HL
Shaded areas have a standard deviation of greater than 40 degreesContours drawn to 10 degree boxes, if the number of observations is greater than 10Only Observations passing quality control used in statisticsFigure 10: Standard Deviation of Ship O-B Wind Direction (degrees). Date:- January - June 2010
12 11 12 6 42 13 13 88 3 5 5 3 131 6 1
10 72 24 3 11 3 2 5 51 623 63 13 18 14 11 49 88 4 1 2 3 2 6 14 12 14 7 4 2 53 661 11 60 6
102 11 34 2 13 15 29 393 280 217 76 320 359 6 27 40 5 35 103 35 10 16 16 7 279 50 2
256 1 1 2 2 3 30 123 146 207 61 21 7 12 9 18 44 35 48 12 103 88 4 2 2 4 32 1503 122 179 1606
115 53 46 40 17 7 6 1 20 20 184 2 652 310 54 100 95 147 177 1125 912 394 208 70 52 170 79 17 22 1754 732 1283 3286 2565 326 1725
121 120 73 92 129 40 31 8 14 21 207 1 3 951 389 126 120 155 313 600 1 586 1784 1277 148 73 16 14 199 780 1 53 1880 636 265
133 112 386 915 309 123 74 65 36 91 329 3177 149 148 167 387 190 53 709 1863 2514 234 641 260 273 227 274 138 2009 569 122 176
5775 388 4658 1671 2227 6212 4953 467 5109 365 36 97 87 2421 915 1858 1939 211 129 81 103 849 117 626 1542 32 146 148 233 149 611 907 2007 13
9129 2314 5147 4415 902 3873 2390 529 1759 430 452 2 456 547 1638 529 109 226 479 3 3 36 39 135 773 1939 579 1426 327 326 1446 2242 3970 4028 12
98 2700 3568 134 213 153 90 489 480 7453 3243 10294 5899 3400 3733 2233 1298 2 3 1 4 170 1581 892 718 357 1515 840 110 1411 906 711 609 207 291 117
331 2788 5189 627 466 377 1161 239 16245 1897011316 5937 3375 1106 1663 2107 2533 4 3 5 1353 19 1151 455 15 55 3 5 722 2200 1751 444 256 360 272
328 316 301 537 818 18310 5695 1 26 6409 23450 2370 2327 1448 1666 1719 2884 4990 2361 1807 2136 1265 1 1 1 1 1 25 11158 3424 1990 547 348 319
486 508 591 719 3940 26929 1 480 131913045433919 19135 3953 1795 1891 6365 22623 7654 705 287 246 19 4 7 1 1 1 557 1266 1173 667 531
5197 4250 2571 10486 2131711540 1 1 1962 575 2338 844 957 1097 11002 2522268389 16005 323 35 3 4 1 1 1 1 121 392 374 460
6 121 356 4186 732 712 1252 830 211 459 174 89 469 509 4288 32331 1685 31 300 105 22 3 1 3 7
2 12 69 1 1 1 41 2 52 175 1084 581 802 161 116 12 16 36 2
135 56 1 1 1
Only observations passing quality control includedPlot of the Number of Ship Wind Direction Observations. Date:- January - June 2010Figure 11:

H
H
L
L
L0
0
0
0
0
0
0
0
0H
H
L
L
L
Shaded areas have a bias of magnitude greater than 1.0 degree CContours drawn to 10 degree boxes, if the number of observations is greater than 10Only observations passing quality control used in statisticsFigure 12: Bias of Ship O-B SST (degrees C). Date:- January - June 2010

1
1
1
1
1
1
1
H
HH
L
LL
H
HH
L
LL
Shaded areas have a standard deviation of greater than 2.0 degrees CContours drawn to 10 degree boxes, if the number of observations is greater than 10Only Observations passing quality control used in statisticsFigure 13: Standard Deviation of Ship O-B SST (degrees C). Date:- January - June 2010

46 10
345 1697 613 607 117155 64 1 1 80 101 89
8721 3067 103 99 37 1 14405 209 132 11092 111 95 91 1 39 819 616 3822
52983 20434 591 35 237 569 481 57110942 8692 7030 16685 3452018041 325 1165 626 1003 1241 23568 31467
21486 1336 365 529 26 1 801 1835 1546 857 715638 676 713 1421 5944 96403 6963151674 23608 6204 2052 2332 9068 39381
5388 3634 4152 2709 27 26166 5839 6628 797 591 471517 526 523 860 1169 99453110569 1221180372 4749 3579 2067 2189 2394 3554 6455
2399 41 2373 949 14 49 3 1052 3680 2826 756 392 526 434985 5537 36660 1000 759 662 2312 758 57897 961552587811154 6194 1652 2878 3403 3133
445 2864 2122 1938 1079 2896 1900 214 2901 1644 1206 8167 399 501 212159 4754 5023 225 225 232 300 2201 1537 11114 4848 31568 10000 4874 5037 3390 1699
2946 67 57 314 1976 7938 2324 2544 1121 1063 11869 8623 11372 8676 306617129 4121 8680 7399 1664 7926 4869 2094 5703 2327 970 6 1261 1260 943 3352 831 3521
637 615 62 116 47 1841 1511 6661 77 777 901 516 194 1050 6796 9264 9918326 1015 10243 2519 3265 6998 6374 831 8819 979 71 6 183 4063 3298 2687 4070
700 386 99 977 1138 1488 355 798 315 326 368 449 132 615 936 253 209925 586 882 1920 575 135 92 86 153 433 881 5662 150 269 301
587 727 710 1884 2448 325 114 61 27 234 1073 58 2423 619 350144 145 130 165 221 70 63 18 47 78 565 2519 465 208 185 332
445 1731 1534 593 275 172 110 221 139 44 44 1685 837 1858 3343 3177 340 1283166 95 48 49 39 27 9 4 24 32 340 2 734 328 78 117 124 195
210 63 1 162 54 208 37 118 160 3 2 2 11 48 1776 102 113 1749285 5 3 1 1 4 2 3 33 198 215 167 91 57 42 75 47
134 5 7 38 155 55 5 23 34 29 8 299 10 8 3116 15 33 2 11 15 31 1207 1012 303 49 79 38 2 9
18 16 3 7 11 6 8 46 32 33 9 4 3 65 682 15 87 712 90 21 3 1 17 18 30 4 6 254 2948 713 16 18 22 27 40
16 213 23 21 14 88 18 47 189 3 37 16 17 24 90
Only observations passing quality control includedPlot of the Number of Ship SST Observations. Date:- January - June 2010Figure 14: