report on the labor market in macedonia
TRANSCRIPT

REPORT ON THE LABOR MARKET IN MACEDONIA
Center for Economic Analyses (CEA)
Skopje March, 2005
Disclaimer: Opinions expressed in this report are those of the Center for Economic Analyses and do not represent the opinion of the USAID or any other concerned institutions. It is the responsibility of other authors to cite this report when it has informed their research and publications.
1

Table of Contents Executive summary............................................................................................................. 4 Definitions........................................................................................................................... 5 I. Statistical information system in Macedonia................................................................... 6 II. Labor Force Survey in Macedonia ................................................................................. 7 III. Selected labor statistics in Macedonia .......................................................................... 7 IV. Macroeconomic background ........................................................................................ 8 V. Skill mismatch and unemployment in Macedonia....................................................... 11 VI. Discouraged workers .................................................................................................. 14 VII. Minority and regional employment, unemployment and participation..................... 15
a. Minority..................................................................................................................... 15 b. Regional .................................................................................................................... 17
VIII. The discrepancy between the official and actual labor force................................... 18 IX. The informal economy labor market in Macedonia ................................................... 20 X. Human capital building................................................................................................ 23 References......................................................................................................................... 25
2

General information about CEAGeneral information about CEA
Logo:Logo:
Address:Address:
CENTER FOR ECONOMIC ANALYSES (CEA) Bul. Jane Sandanski 63/3, 1000 Skopje Macedonia
Tel: + 389 (0)2 24 44 766 Mob: + 389 70 834 636
TIN: 4030003479278 Reg. 5763061
Account number:Account number:
Stopanska Banka AD Skopje Account number: 200000856268559
Web page and e-mail:Web page and e-mail:
www.cea.org.mk
www.lsg-data.org.mk
3

Executive summary
This report was prepared under the contract provisions signed between CEA and USAID for nonexclusive services to USAID as part of a grant agreement. This report is the first in a series of such reports and provides research findings on the labor market in Macedonia. This report should be regarded as an initial study that sets the basis for a more thorough and systematic analysis of the labor market in Macedonia, and its findings should be regarded in that light. Source of data used were obtained from the State Statistical Office-SSO, Agency for Employment, Electric Power Company-ESM, National Bank, and Ministry of Finance and the findings are: (1). The problem of unemployment in Macedonia is not a new one. Many studies and programs were implemented using domestic and/or donor financing, yet lower unemployment and increased employment have not yet been achieved. (2). This study has presented a range of statistics on characteristics of who is employed and unemployed, participation in the labor market, and key features of unemployment. We also provide an estimate of the size of unofficial employment. (3). High unemployment in Macedonia is not due to lack of labor market flexibility, but to more systematic problems. These problems include education appropriate to the needs of the labor market, lack of structural change and inefficient privatization, low level of investment, weak institutions, and a poor general business environment. The main characteristic of the unemployed in Macedonia is that the typical Macedonian unemployed person has been unemployed for a long time, is possibly a discouraged worker, and has a low level of education and skills that do not fit with labor demand. (4). Economic growth is regionally unbalanced, and this has produced a distinct geographical pattern in employment and unemployment. Policy challenges include lack of implementation of sound policies for agriculture and tourism and poor or no policies for urban/rural development within the framework of transition and globalization. (5). Employment and unemployment also show significant variation across minorities. In particular, Albanians might participate to a lesser degree in the formal labor market, and to a greater extent in the informal labor market. Policies designed to ensure equal representation in the formal labor market should take this into account, and they should not be introduced without being based on appropriate criteria such that economic efficiency is not overly sacrificed. (6). Our estimate using the electricity method suggests that roughly 110,000 in 2004 participate in the unofficial economy, and the true unemployment rate is much less than the official rate based on LFS data. This is an important finding but should be
4

used quite cautiously. A more thorough study is needed on estimating the size of the informal/unofficial sector. (7). The Macedonian economy continues to move towards services. Whether deindustrialization will continue or the industry sector will recover and grow is not yet clear. FDI and investment in general as a driver of job creation has been very modest, and weak institutions and an unpredictable business environment continue to depress investment levels. (8). The decline in Macedonian industry output may have reduced incentives to start working and increased the rate of return on higher education. The labor market is apparently shifting away from low VA-low wage sectors. A slow pace of restructuring and low economic growth lowered the opportunity cost of further education and may have caused the participation rate to fall through 2002. (9). Last but not least, we are concerned that some statistics essential for understanding labor market outcomes are not being provided by State Statistical Office. Most required data are available, but the publication of some statistics has been discontinued. The presentation of the LFS should also be improved: in particular, yearly and quarterly presentations should be consistent with each other. Finally, new questions should be added to the survey itself in order to better understand specific features of the Macedonian labor market. All methodological techniques used in this report are explained in greater detail in the papers listed in the References section and will not be explained in detail in this report. This document will be published on the CEA web site 10 working days after submission to USAID (http://www.cea.org.mk). The report has been prepared by Marjan Nikolov, MSc ([email protected]). Critical review and useful comments and inputs were provided by Malgorzata Markiewitz, Economist at CEA and Bryan Roberts, PhD, Vice President of CEA’s Board.
Definitions Working age population consists of the population between 15 and 80 years of age (this definition changed in 2004 and now it is between 15 and 65). Labor force is the sum of people registered as employed and people registered as unemployed. Participation rate is the ratio of the labor force over the working age population. Employment rate is the ratio of the number of people employed over the working age population. Unemployment rate is the ratio of the number of people unemployed over the labor force.
5
Underemployed person is one if his/hers employment is unsuitable for the specific norms taking into account his/hers professional abilities (education and working experience). Visible underemployment is one reflecting insufficient working hours. Invisible underemployment is one reflecting low income, insufficient use of professional abilities, low productivity etc.
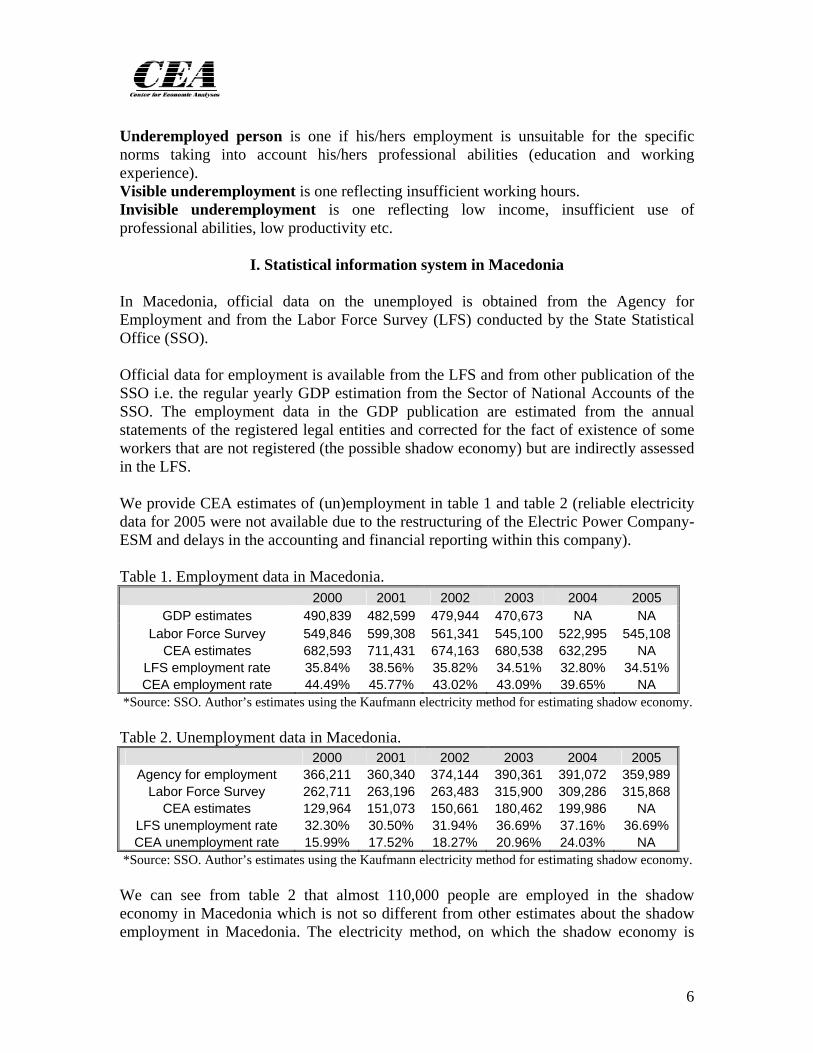
I. Statistical information system in Macedonia In Macedonia, official data on the unemployed is obtained from the Agency for Employment and from the Labor Force Survey (LFS) conducted by the State Statistical Office (SSO). Official data for employment is available from the LFS and from other publication of the SSO i.e. the regular yearly GDP estimation from the Sector of National Accounts of the SSO. The employment data in the GDP publication are estimated from the annual statements of the registered legal entities and corrected for the fact of existence of some workers that are not registered (the possible shadow economy) but are indirectly assessed in the LFS. We provide CEA estimates of (un)employment in table 1 and table 2 (reliable electricity data for 2005 were not available due to the restructuring of the Electric Power Company-ESM and delays in the accounting and financial reporting within this company). Table 1. Employment data in Macedonia.
2000 2001 2002 2003 2004 2005 GDP estimates 490,839 482,599 479,944 470,673 NA NA
Labor Force Survey 549,846 599,308 561,341 545,100 522,995 545,108CEA estimates 682,593 711,431 674,163 680,538 632,295 NA
LFS employment rate 35.84% 38.56% 35.82% 34.51% 32.80% 34.51% CEA employment rate 44.49% 45.77% 43.02% 43.09% 39.65% NA
*Source: SSO. Author’s estimates using the Kaufmann electricity method for estimating shadow economy. Table 2. Unemployment data in Macedonia.
2000 2001 2002 2003 2004 2005 Agency for employment 366,211 360,340 374,144 390,361 391,072 359,989
Labor Force Survey 262,711 263,196 263,483 315,900 309,286 315,868CEA estimates 129,964 151,073 150,661 180,462 199,986 NA
LFS unemployment rate 32.30% 30.50% 31.94% 36.69% 37.16% 36.69% CEA unemployment rate 15.99% 17.52% 18.27% 20.96% 24.03% NA
*Source: SSO. Author’s estimates using the Kaufmann electricity method for estimating shadow economy. We can see from table 2 that almost 110,000 people are employed in the shadow economy in Macedonia which is not so different from other estimates about the shadow employment in Macedonia. The electricity method, on which the shadow economy is
6

estimated, is based on the empirical evidence that the change in GDP and change in electricity consumption goes one for one. However, the connection between shadow economy and shadow employment is more complex (see box 2) and these findings should be taken with precautious.
II. Labor Force Survey in Macedonia The Labor Force Survey-LFS in Macedonia is a method of research based on sample of surveyed units in order to find information and data on the economic active population in accordance to International Labor Organization-ILO. First LFS in Macedonia was published in 1996 as yearly survey and starting 2004 it goes out as a quarterly publication. The labor force is a set of people that work or in search for jobs in order to earn for living and that is why the main categories that are subject to the survey are: employment, unemployment, demographic, educational and other characteristics of the persons within each of these categories. A person is considered employed if he/she had some kind of economic activity in the last week for at least one hour. The earning is not limited to financial resources but in goods as well. However, households work, small maintenance around car etc are not considered as economic activity. The basis for the survey is the so called “sample of census circles” from the census of population, households and dwellings. The selection of the census circles is the first phase of the LFS. In the second phase out from the census circles and by using the population register and the register of space units, randomly 10000 addresses (households) are selected as from 2004. Before 2004 the sample was taken on 7200 households. The selected households represent around 2 % of the total population.
III. Selected labor statistics in Macedonia
Table 3. Basic labor market indicators in Macedonia: 1996-2004. 1996 1997 1998 1999 2000 2001 2002 2003 2004 2005
Working age* 1,436,602 1,489,625 1,503,365 1,518,250 1,534,256 1,554,420 1,566,954 1,579,500 1,594,557 1,579,450Employed 537,591 512,301 539,762 545,222 549,846 599,308 561,341 545,100 522,995 545,108
Unemployed 251,489 288,213 284,064 261,451 262,711 263,196 263,483 315,900 309,286 315,868 Labor force 789,080 800,514 823,826 806,673 812,557 862,504 824,824 861,000 832,281 860,976 Participation
rate 54.90% 53.70% 54.80% 53.10% 53.00% 55.50% 52.64% 54.51% 52.20% 54.51% Employment
rate 37.42% 34.39% 35.90% 35.91% 35.84% 38.56% 35.82% 34.51% 32.80% 34.51% Unemployment
rate 31.90% 36.00% 34.50% 32.40% 32.30% 30.50% 31.94% 36.69% 37.16% 36.69% Working age
growth - 3.70% 0.90% 1.00% 1.10% 1.30% 1.31% 0.81% 0.80% 0.95% Employment - -4.70% 5.40% 1.00% 0.80% 9.00% 9.00% -6.34% -2.89% -4.06%
7

growth
Unemployment growth - 14.60% -1.40% -8.00% 0.50% 0.20% 0.11% 19.89% -2.09% 2.13%
Labor force growth - 1.40% 2.90% -2.10% 0.70% 6.10% 6.15% -4.37% 4.39% -3.34%
Source: LFS SSO. We can see from the table 3 above that the unemployment rate declined from 1997 to 2001 and then began rising so that by 2005, the rate was higher than it was in 1996. What is also interesting is that the participation rate is low and steady in Macedonia. The 50,000 newly employed in 2001 compared to 2000 increased the employment rate by 2.72 percentage points while the participation rate increased by 2.5 percentage points. Most of the 50,000 newly employed in 2001 were reservists engaged because of the crises in 2001.
! Recommendation to the SSO:
• The SSO should publish data on the previous job engagement of those moving from one job to another and their structure by education, age and qualification. This will permit monitoring of labor flexibility.
• The SSO should provide information on the matching process (ratio of job seekers to vacancies) if LFS data or data from the Agency for Employment permits
IV. Macroeconomic background The next figure 1 shows the unemployment rate from the LFS compared with the GDP growth. As GDP is growing during 1996-2001 the unemployment rate declines countercyclically which is what we would expect. 2001 is an outlier: GDP growth declined dramatically due to the crisis, but employment did not respond immediately. In 2002, GDP growth recovered, but unemployment rose. After 2002, the unemployment rate rose even though GDP growth was increasing, which is unusual. This might be due to the quality of data, higher labor productivity in the shadow economy, a lower participation rate, and/or structural changes that led to labor shedding.
8

Unemployement rate and GDP growth
30.00%
31.00%
32.00%
33.00%
34.00%
35.00%
36.00%
37.00%
38.00%
1996 1997 1998 1999 2000 2001 2002 2003 2004-5
-4
-3
-2
-1
0
1
2
3
4
5
Unemployment rate GDP growth
Figure 1. Cyclicality of unemployment Table 4. Trade deficit and FDI for the period 1997-2004.
1997 1998 1999 2000 2001 2002 2003 2004
Trade deficit as
% of GDP 15.67 16.89 15.68 19.78 14.30 22.62 20.62 21.50
FDI in mln US $
30.01 127.72 32.40 175.13 440.66 77.72 95.99 155.85
FDI as % of GDP
0.9 3.6 0.9 4.9 12.8 2.1 2 2.9
*Source: SSO and National Bank. In Macedonia, the trade deficit is relatively high and rose significantly after 2001, and foreign direct investment (FDI) is relatively low compared to other transitional countries.
9

10
-0.5
4.5
9.5
14.5
19.5
24.5
1997 1998 1999 2000 2001 2002 2003 2004-50.00
50.00
150.00
250.00
350.00
450.00
550.00
trade deficit FDI
Figure 2. FDI and trade deficit
After the inflation stabilization in the early 90s, lower uncertainty about relative price movements did not encourage FDI inflows because institutional uncertainty (eg protection of property rights) and policy uncertainty were high. Thus, potential productivity gains from the FDI expectations in terms of new ways of doing business, managerial skills and new technologies were lost. FDI inflows after 2000 were largely acquisitions of existing assets and not green field investments, and these foreign purchasers often shed labor to improve productivity, thus increasing unemployment1. The objectives of improving institutional rigidities and capacities and promoting structural change were not met during the transition; thus the resulted anemic economic growth couldn’t improve the situation with labor market shift, competitiveness, product qualities and trade deficit (on economic growth and social capital see also Nikolov 2005). In Macedonia while there were significant structural reforms in the financial sector and trade regime, the track record in enterprise reform has been weak. Most of the socially owned enterprises were sold to insiders rather than to strategic investors with capital and know-how. Many old firms survive with substandard performance and progress in winding up a few large loss-making enterprises has been slow. Despite a relatively sound macro-economic environment, comparatively slow progress with structural reform has resulted in disappointing growth and employment creation. 1 In some instances, acquirers also gained monopoly power.
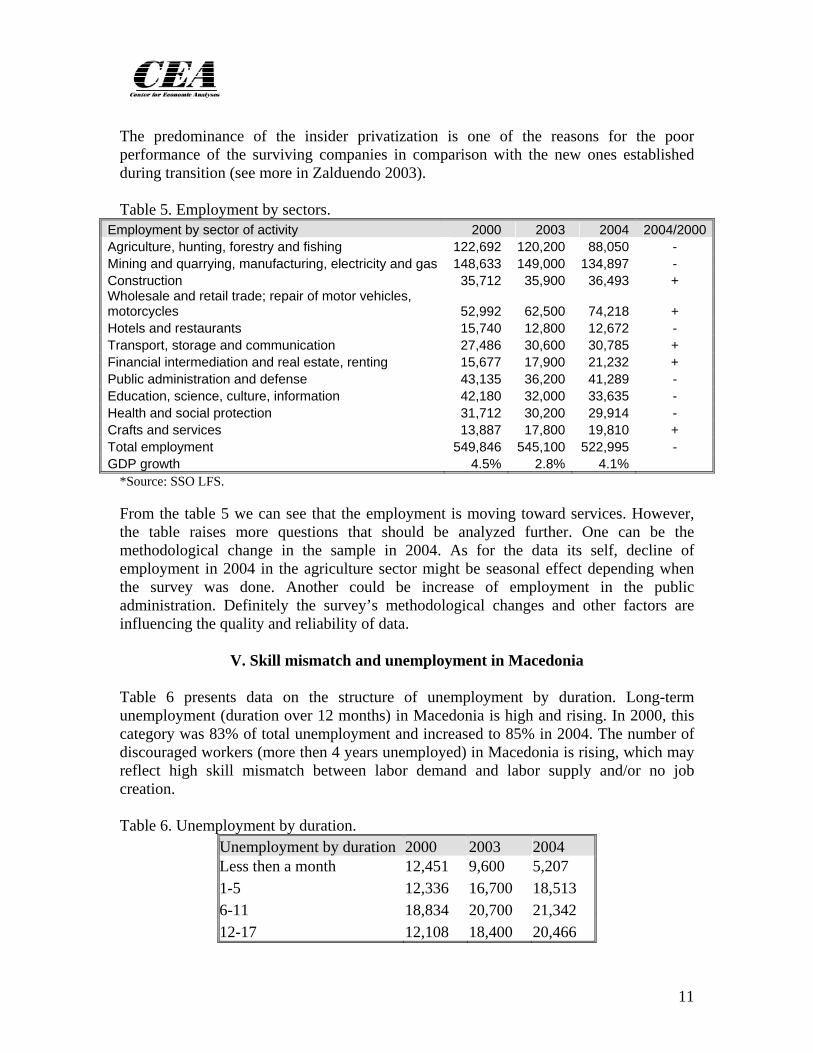
The predominance of the insider privatization is one of the reasons for the poor performance of the surviving companies in comparison with the new ones established during transition (see more in Zalduendo 2003). Table 5. Employment by sectors.
Employment by sector of activity 2000 2003 2004 2004/2000Agriculture, hunting, forestry and fishing 122,692 120,200 88,050 - Mining and quarrying, manufacturing, electricity and gas 148,633 149,000 134,897 - Construction 35,712 35,900 36,493 + Wholesale and retail trade; repair of motor vehicles, motorcycles 52,992 62,500 74,218 + Hotels and restaurants 15,740 12,800 12,672 - Transport, storage and communication 27,486 30,600 30,785 + Financial intermediation and real estate, renting 15,677 17,900 21,232 + Public administration and defense 43,135 36,200 41,289 - Education, science, culture, information 42,180 32,000 33,635 - Health and social protection 31,712 30,200 29,914 - Crafts and services 13,887 17,800 19,810 + Total employment 549,846 545,100 522,995 - GDP growth 4.5% 2.8% 4.1%
*Source: SSO LFS. From the table 5 we can see that the employment is moving toward services. However, the table raises more questions that should be analyzed further. One can be the methodological change in the sample in 2004. As for the data its self, decline of employment in 2004 in the agriculture sector might be seasonal effect depending when the survey was done. Another could be increase of employment in the public administration. Definitely the survey’s methodological changes and other factors are influencing the quality and reliability of data.
V. Skill mismatch and unemployment in Macedonia Table 6 presents data on the structure of unemployment by duration. Long-term unemployment (duration over 12 months) in Macedonia is high and rising. In 2000, this category was 83% of total unemployment and increased to 85% in 2004. The number of discouraged workers (more then 4 years unemployed) in Macedonia is rising, which may reflect high skill mismatch between labor demand and labor supply and/or no job creation. Table 6. Unemployment by duration.
Unemployment by duration 2000 2003 2004 Less then a month 12,451 9,600 5,207 1-5 12,336 16,700 18,513 6-11 18,834 20,700 21,342 12-17 12,108 18,400 20,466
11

18-23 20,407 10,600 14,399 2 years 3,195 2,100 2,614 3 years 24,399 36,900 27,791 More than a 4 years 157,982 200,900 198,955 Long term unemployment 83.33% 85.12% 85.43% Discouraged workers 63.38% 65.59% 65.43%
*Source: SSO. In Macedonia most of the business people say that they need specific skills that are not supplied by the labor market. This is why much of the assistance in the labor market in Macedonia is directed towards retraining activities. No evaluation on the effectiveness of passive and active measures of Macedonian labor market assistance programs is yet available. Ex post evaluation of donor- and/or central budget-financed support programs can give valuable results and lessons learned for future policy measures, especially in the light of the new Law on Labor Relations. The unemployed in Macedonia still face difficulties in competing for jobs and finding employment. As we can see from the structure of unemployed in Macedonia during 2002-04 shown in table 7 below, more than 50% of the unemployed have less than secondary education. It is troubling that unemployment is rising from 5.1% to 5.8% for those with university degree (one must be aware of the fact that there might be small-sample-bias error as well in the data that are common to this type of surveys). These findings might reflect the skill mismatch in the labor market and limited transition from unemployment into jobs maybe because the long-term unemployed are with lower skills. Table 7. Estimating excess supply in 2002/03/04 in Macedonia2.
2002 year Employed Unemployed Excess supply University 12.7% 5.1% -7.6%Higher vocational 5.5% 2.3% -3.2%Secondary vocational 49.6% 35.3% -14.4%Skilled and lower education 32.1% 57.3% 25.2% 100.0% 100.0% 0.0%2003 year Employed Unemployed Excess supply University 13.8% 5.6% -8.2%Higher vocational 5.6% 2.4% -3.2%Secondary vocational 51.0% 34.3% -16.7%Skilled and lower education 29.6% 57.6% 28.0% 100.0% 100.0% 0.0%2004 year Employed Unemployed Excess supply University 15.0% 5.8% -9.2%Higher vocational 5.6% 2.0% -3.6%
2 The excess supply is developed in accordance with Rutkowski (2003). Basically it takes into account the fact that unemployment is disproportionately concentrated among workers with low educational attainment.
12

Secondary vocational 53.2% 39.8% -13.4%Skilled and lower education 26.3% 52.4% 26.1% 100.0% 100.0% 0.0%
Source LFS; Author’s calculation. Also, what we can see is that the share of the least-skilled in employment fell sharply during 2002-04 – but their share in unemployment also fell. The data in table 7 show that the skill gap even though looks overall pretty stable during 2002-04, on the margin, is increasing. In 2002, the excess supply of low-skilled labor was 25%, rose to 28% in 2003, and remained at 26% in 2004. This is a big gap and reflects a big lack of demand for the skills that many unemployed have. BOX 1. In Macedonia unemployed have lower educational attainment and there is an “excess supply” of people with lower education among them. This assumption is based in a sense that all else equal, there are not enough low skilled jobs to eliminate unemployment. For example in Macedonia the concentration of unemployed persons is within those with less than a secondary education taking a share of 52-57 % within 2002-2004 as from table 7 whereas those with university level are with a share of 5-6 %. Let us assume that the available jobs grows to the point where there are enough jobs for all of the unemployed but that the skill mismatch occurs between educational levels and not within. Under this assumption, the skill gap of 26.1 % in 2004 and given the rate of unemployment in Macedonia of 37.16 % in 2004 will result in 9.7 % unemployment rate caused by the skill gap. This is the lowest possible percent given the optimistic assumptions on which this calculation is done (see Rutkowski 2003). These findings show that around 80,000 people in Macedonia cannot find a job because they lack the skills that the market require. Another worrying feature is that the skill gap is increasing, and the prospect of decreasing unemployment in the future is under question regardless of whether labor market inflexibilities are eliminated. Change in the mix of skills demanded by employers requires changes in the educational system, which is a long run measure, but Macedonian policymakers need to implement active labor market measures that might give results in the short to mid term. Given that there are a large number of those who have been unemployed for a long time, the situation in Macedonia regarding the labor market is worrying, particularly given that there has been a focus on policies to improve labor market flexibility, which is not the major problem. Findings from previous research also support the view that the problem in Macedonia is not so much labor market flexibility but job creation and the skill gap (see Nikolov 2002 and Nikolov 2003).
13
VI. Discouraged workers
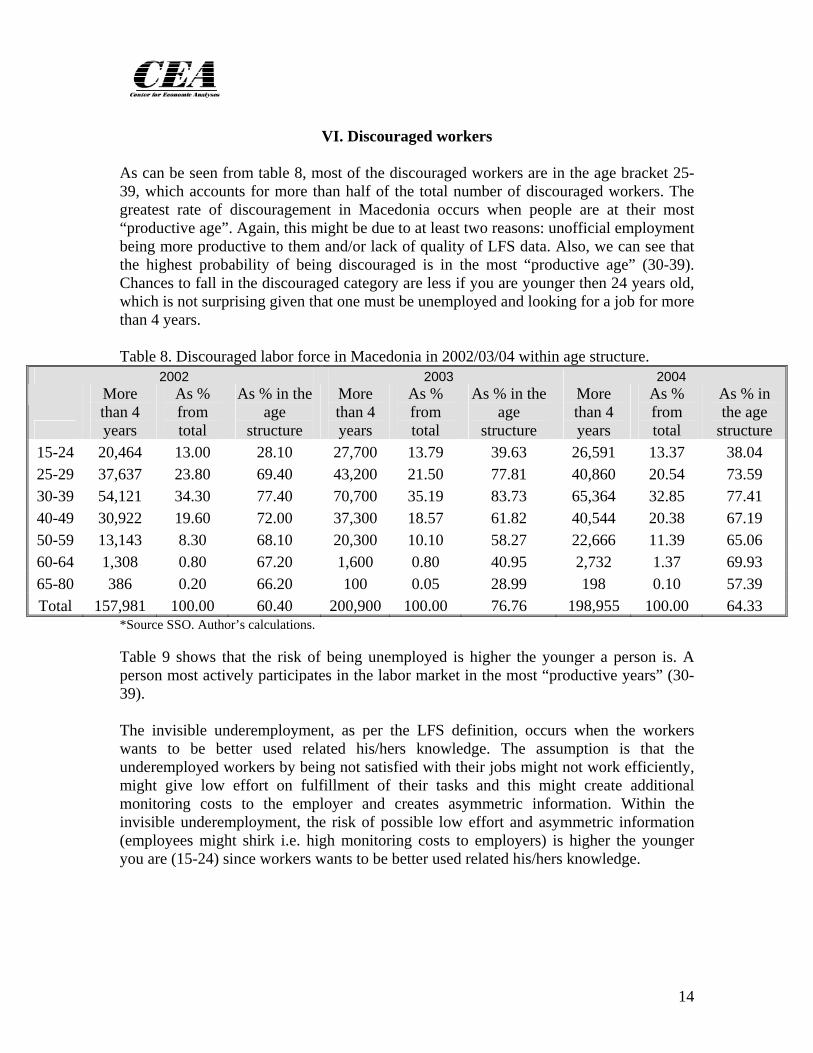
As can be seen from table 8, most of the discouraged workers are in the age bracket 25-39, which accounts for more than half of the total number of discouraged workers. The greatest rate of discouragement in Macedonia occurs when people are at their most “productive age”. Again, this might be due to at least two reasons: unofficial employment being more productive to them and/or lack of quality of LFS data. Also, we can see that the highest probability of being discouraged is in the most “productive age” (30-39). Chances to fall in the discouraged category are less if you are younger then 24 years old, which is not surprising given that one must be unemployed and looking for a job for more than 4 years. Table 8. Discouraged labor force in Macedonia in 2002/03/04 within age structure.
2002 2003 2004
More than 4 years
As % from total
As % in the age
structure
More than 4 years
As % from total
As % in the age
structure
More than 4 years
As % from total
As % in the age
structure 15-24 20,464 13.00 28.10 27,700 13.79 39.63 26,591 13.37 38.04 25-29 37,637 23.80 69.40 43,200 21.50 77.81 40,860 20.54 73.59 30-39 54,121 34.30 77.40 70,700 35.19 83.73 65,364 32.85 77.41 40-49 30,922 19.60 72.00 37,300 18.57 61.82 40,544 20.38 67.19 50-59 13,143 8.30 68.10 20,300 10.10 58.27 22,666 11.39 65.06 60-64 1,308 0.80 67.20 1,600 0.80 40.95 2,732 1.37 69.93 65-80 386 0.20 66.20 100 0.05 28.99 198 0.10 57.39 Total 157,981 100.00 60.40 200,900 100.00 76.76 198,955 100.00 64.33
*Source SSO. Author’s calculations. Table 9 shows that the risk of being unemployed is higher the younger a person is. A person most actively participates in the labor market in the most “productive years” (30-39). The invisible underemployment, as per the LFS definition, occurs when the workers wants to be better used related his/hers knowledge. The assumption is that the underemployed workers by being not satisfied with their jobs might not work efficiently, might give low effort on fulfillment of their tasks and this might create additional monitoring costs to the employer and creates asymmetric information. Within the invisible underemployment, the risk of possible low effort and asymmetric information (employees might shirk i.e. high monitoring costs to employers) is higher the younger you are (15-24) since workers wants to be better used related his/hers knowledge.
14

Table 9. (Un)employment rate, age structure and underemployment in 2003.
Employment rate within
the age structure
Employment rate in the
total
Unemployment rate within the
age structure
Unemployment rate in
the total
Participation rate
Efficiency: under
employment/employed
Not efficient
because of possible
low effort and
asymmetric information
15-24 34.30% 7.37% 65.70% 24.38% 35.30% 2.49% 40.00% 25-29 49.22% 10.93% 50.78% 19.47% 75.78% 2.68% 18.75% 30-39 62.14% 27.52% 37.86% 28.94% 80.07% 2.13% 12.50% 40-49 75.94% 31.50% 24.06% 17.23% 77.97% 1.40% 4.17% 50-59 77.25% 17.76% 22.75% 9.02% 57.56% 1.24% 33.33% 60-64 85.79% 3.10% 14.21% 0.89% 22.51% 0.59% - 65-80 98.02% 1.82% 1.98% 0.06% 5.29% 1.01% -
*Source SSO. Author’s calculation. For example, consider that 40% of the total in age 15-24 category that are underemployed want to be better used related to his/her knowledge. On the one hand, these workers should move to sectors that make use of their skills instead of inefficiently utilizing their already accumulated skills/knowledge. On the other hand, these workers are in the youngest stratum of the age structure showing that they might work in a sector not compatible with their skills causing them to pay premium for their training through lower real wages. Another reason might be that the education system does not fit the labor market demand in terms of skills and this is one reason more for young people to shift to human capital production sector in Macedonia (see the discussion further in the text). Evidence for this is the increasing supply of Universities in Macedonia (see more in Nikolov 2003).
! Recommendation to the SSO:
• Continue to publish the usual underemployed in the LFS. This practice stopped in 2004.
VII. Minority and regional employment, unemployment and participation
a. Minority The proportional share of a minority in unemployment follows closely the proportional share of a minority’s population according to the 2002 census. Macedonians and Roma have a higher unemployment share than population share. Macedonians also have a
15

higher share of employment than their population share, the only group for which this is true. Table 10. Unemployment, employment and population by minority.
Unemployment Employment Census 1999 2000 1999 2000 2000 2000 2002
Macedonians 176,298 180,164 67.4% 68.8% 459,200 83.5% 64.18%Albanians 52,782 52,062 20.2% 19.9% 53,566 9.7% 25.17%
Vlach 533 734 0.2% 0.3% 1,555 0.3% 0.48%Roma 11,337 9,776 4.3% 3.7% 3,589 0.7% 2.66%
Turkish 9,500 7,834 3.6% 3.0% 12,474 2.3% 3.85%Serbian 4,115 4,277 1.6% 1.6% 7,416 1.3% 1.78%Total 261451 261711 97% 97% 537800 97.8% 98.12%
*Source SSO. In order to explore further, we need to look at participation rates by minority, shown in table 11. Minority concentration on the labor force is on Macedonians. Vlachs have the highest participation rate of 61.9% but are a very small group. Macedonians have the next highest participation rate of 58.3%. Albanians participate at the lowest rate of 36.4%. This might be due to greater participation in the informal sector. The total participation rate in the Macedonian labor market in 2000 was 53.0%. Of those 53.0%, 80.7% were Macedonians, which is higher then their share in total population by the 2002 census of 64.2%. All other minorities are participating at a rate less then their share in the population. Table 11. Participation in the labor market by minority in 2000.
Labor force
Population 2002 census
Active population by LFS Employ
ed Unemploy
ed
Own category
labor force
over total labor force
Own category participation rate
over total active
Participation rate
in its own category
Population census
2002 shares
Macedonians 1,297,981 1,096,582 459,200 180,164 80.7% 43.1% 58.3% 64.18% Albanians 509,083 290,293 53,566 52,062 13.3% 7.1% 36.4% 25.17%
Vlachs 9,695 3,695 1,555 734 0.3% 0.2% 61.9% 0.48% Roma 53,879 27,590 3,589 9,776 1.7% 0.9% 48.4% 2.66% Turks 77,959 43,261 12,474 7,834 2.6% 1.4% 46.9% 3.85% Serbs 35,939 23,373 7,416 4,277 1.5% 0.8% 50.0% 1.78% Total: 1984536 1,484,794 537,800 254,847 100.0% 53.0%
*Source SSO.
16

b. Regional The regional disparity is presented in the next table 12. Table 12. Urban/rural unemployment figures from December 2003.
Unemployment rate Unemployment rate Local office in:
Urban Rural
Local office in:
Urban Rural 1 Berovo 46.8% 53.2% 16 Krusevo 55.4% 44.6% 2 Bitola 74.0% 26.0% 17 Kumanovo 71.0% 29.0%
3 Makedonski Brod 58.8% 41.2% 18 Negotino 72.0% 28.0%
4 Valandovo 32.5% 67.5% 19 Ohrid 74.4% 25.6% 5 Vinica 63.2% 36.8% 20 Prilep 76.6% 23.4% 6 Gevgelija 48.7% 51.3% 21 Probishtip 80.8% 19.2% 7 Gostivar 54.9% 45.1% 22 Radovis 47.6% 52.4% 8 Debar 62.6% 37.4% 23 Resen 52.8% 47.2% 9 Delcevo 69.2% 30.8% 24 Sveti Nikole 64.8% 35.2% 10 Demir Hisar 26.4% 73.6% 25 Skopje 81.1% 18.9%
11 Kavadarci 77.1% 22.9% 26 Struga 33.6% 66.4% 12 Kicevo 63.4% 36.6% 27 Strumica 34.7% 65.3% 13 Kocani 63.7% 36.3% 28 Tetovo 39.4% 60.6% 14 Kratovo 75.6% 24.4% 29 Veles 74.4% 25.6% 15 Kriva Palanka 62.9% 37.1% 30 Stip 88.0% 12.0% Total: 66.1% 33.9%
Source: Agency for Employment. Urban unemployment in Macedonia in December 2003 was 66.1% of total unemployment, and 33.9% was rural unemployment. The highest urban unemployment is registered at the Agency for Employment in Stip (88.0%), Skopje (81.1%) and Probistip (80.8%). The lowest urban unemployment is found in Demir Hisar (26.4%). Balanced urban/rural ratios characterized Gevgelija, Resen and Gostivar. The urban/rural disparity ratio rises with the size of the city. The regional mismatch is high, and this might reflect unbalanced regional development, low labor mobility, and large disparity in regional unemployment rates. Additional analyses should be done to see if regional disparity can be explained by population, type of businesses, minority, agriculture possibilities, mountain/valley geographical characteristics etc.
17

It is acknowledged that know-how is transmitted by labor mobility. The diffusion of know-how across the economy might stimulate economic growth. Balanced regional development, more optimal portfolios of business activities in urban settlements, and carefully designed agriculture and tourism policies might result in higher economic growth within regions and thus in Macedonia.
! Recommendation to the SSO:
• Continue to publish the (un)employment by minorities in the LFS. This practice stopped in 2001.
• Start to publish urban/rural (un)employment with cross cutting on type of business, agriculture possibilities, geographical characteristics. This can be done by adding additional questions in the “Identification data” (first page from the survey) from the data on the Local Government Units and regions.
• LFS should start to be published also by regions because soon the Law on Regional Development will be adopted and the need for data especially on NUTS 3 level will be demanded.
VIII. The discrepancy between the official and actual labor force Many of the long term unemployed might participate in the informal sector. The problem is not only structural but reflects cyclical factors related to slow economic growth. The number of unemployed registered with the Agency for Employment overestimates the true number of unemployed, as many workers actually working are registered as unemployed to take advantage of social, health, and unemployment insurance benefits. One step to improve the situation is to separate the employment benefits from the other benefits, and the Ministry of Labor and Social Policies is moving in the direction of “cleaning” the Agency’s registry. Table 13 gives the number of health insured by category (the SSO stopped publishing this data after 1999.) Those with health insurance in the agriculture, self-employed and workers sectors in 1997 are 38,245 fewer individuals than total employment estimated by the LFS, a shortfall of 7.5%. This difference rose to 60,347 individuals in 1999, a shortfall of 11.1%. This difference might illustrate the level of informal employment in Macedonia. However, care must be taken because the “unpaid family worker” category is treated as employed by the LFS, but they are not included in row 5 of table 14. Unpaid family workers are 4.9% of total LFS employment in 1997, 10.3% in 1999, and 8.5% in 2004. The number of unpaid family workers is very close to the difference between employment as measured by the health benefits system and the LFS, suggesting that the difference is not useful as a proxy for informal-sector employment.
18

Table 13. Number of health insured in Macedonia by category.
1997 1998 1999 1 Unemployed 192,147 197,870 207,656 2 Agriculture 31,052 293,38 26,137 3 Self employed 19,554 19,483 17,444 4 Workers 423,450 439,830 441,294 5 Employed: 5=2+3+4 474,056 488,651 484,875 6 Employment LFS 512,301 539,762 545,222 7 Difference: 6-5 38,245 51,111 60,347 Unpaid family worker 25,101 44,831 56,087
*Source: SSO. Author’s calculation. Another cross check can be done by looking at numbers receiving social insurance, shown in table 14 for 2003. In this case, the unpaid family worker category can account for some of the difference between employment as measured by the two sources, but to a much lesser degree than in the case of health insurance shown in table 13. Table 14. Number of socially insured in Macedonia by category.
2003 1 Unemployed 264238 2 Agriculture 20854 3 Self employed 12951 4 Workers 408399 5 Employed: 5=2+3+4 442204 6 Employment LFS 545100 7 Difference: 6-5 102896 Unpaid family worker 62400
*Source: SSO. Author’s calculation. Informal and illicit work can take many shapes. The underground use of labor may consist of a second job after (or even during) regular working hours. A second form is informal economy work by individuals who do not participate in the official labor market. A third component is the employment of people (e.g. clandestine or illegal immigrants), who are not allowed to work in the official economy. Empirical research on the informal economy labor market is even more difficult than on output of the informal economy (e.g. value added), since one has very little knowledge about how many hours an average “informal economy worker” is actually working (from a few hours to full time); hence, it is not easy to provide empirical facts. The informal economy labor market seems to be quite active and may provide an explanation as to why there is such high and persistent unemployment in Macedonia. It is possible that in some or many cases, productivity and the incentive to work effectively is stronger in the informal economy than in the official economy, and this could help explain why the informal economy labor force might have reached a large size in Macedonia. However, the size of the informal economy labor market will be
19

influenced by other factors such as distortions in labor market policies, enforcement of existing laws, regulation of formal-sector firms, etc, and further research is necessary in order to draw any strong conclusions about what is creating a large informal sector.
Participation rate in Macedonia in the period 1996-2005
52.00%
52.50%
53.00%
53.50%
54.00%
54.50%
55.00%
55.50%
56.00%
1996 1997 1998 1999 2000 2001 2002 2003 2004 2005
Figure 3. Participation rate of the labor force in Macedonia A decline in participation of the labor force in the official economy can be seen as an indication of increased activity in the informal economy. If total labor force participation is assumed to be constant, a decreasing official rate of participation can be seen as an indicator of an increase in the activities in the informal economy, ceteris paribus. Figure 3 therefore suggests that the informal economy labor market was increasing up to 2002 and then declining. The weakness of this method is that differences in the rate of participation may also have other causes. Moreover, people can work in the informal economy and also have a job in the formal economy. Therefore change in the participation rate as shown in figure 3 must be viewed as a weak indicator of the size and development of the informal economy labor market in Macedonia.
IX. The informal economy labor market in Macedonia In order to attempt to estimate the size of informal economy labor market in Macedonia, I will use the model of Kaufmann, Shleifer, and Johnson (1997.) I will first estimate the
20

unofficial economy as a percentage of GDP and will then convert this estimate into employment. The method is based on the assumption that electricity consumption is a rough measure of overall economic activity country, and it is usually found that the short-run elasticity of electricity consumption with respect to GDP is close to 1. Officially measured GDP captures only the registered part of the economy, and the difference between the overall and measured GDP gives the size of the unofficial economy. The change in the size of the unofficial economy is the difference between the change in electricity consumption and the change in official GDP. I will use electricity consumption of light industry in Macedonia after filtering out electricity losses, the electricity producer’s (ESM’s) own consumption, consumption of heavy industry (I assume that there is no informal unemployment in this sector), and consumption by households used for household production. Electricity consumption growth for light industry and Macedonian real GDP growth are graphed in figure 4.
Electricity consumption growth and GDP growth
-25.0%
-20.0%
-15.0%
-10.0%
-5.0%
0.0%
5.0%
10.0%
15.0%
20.0%
1997 1998 1999 2000 2001 2002 2003
-5.0%
-4.0%
-3.0%
-2.0%
-1.0%
0.0%
1.0%
2.0%
3.0%
4.0%
5.0%
Light industry GDP
Figure 4. Growth of electricity consumption and GDP in Macedonia
We can see from figure 4 that electricity consumption declined during the Kosovo crisis in 1999 and during the crisis in Macedonia in 2001. To estimate the size of the informal economy in Macedonia in a beginning year, I will use the CSD (2003) estimate for 1995. Table 15. Size of informal GDP economy in selected countries as percentage of the official economy.
1990/93 1994/95 Bulgaria 26.3 32.7Croatia 23.5 28.5Czech Republic 13.4 14.5
21
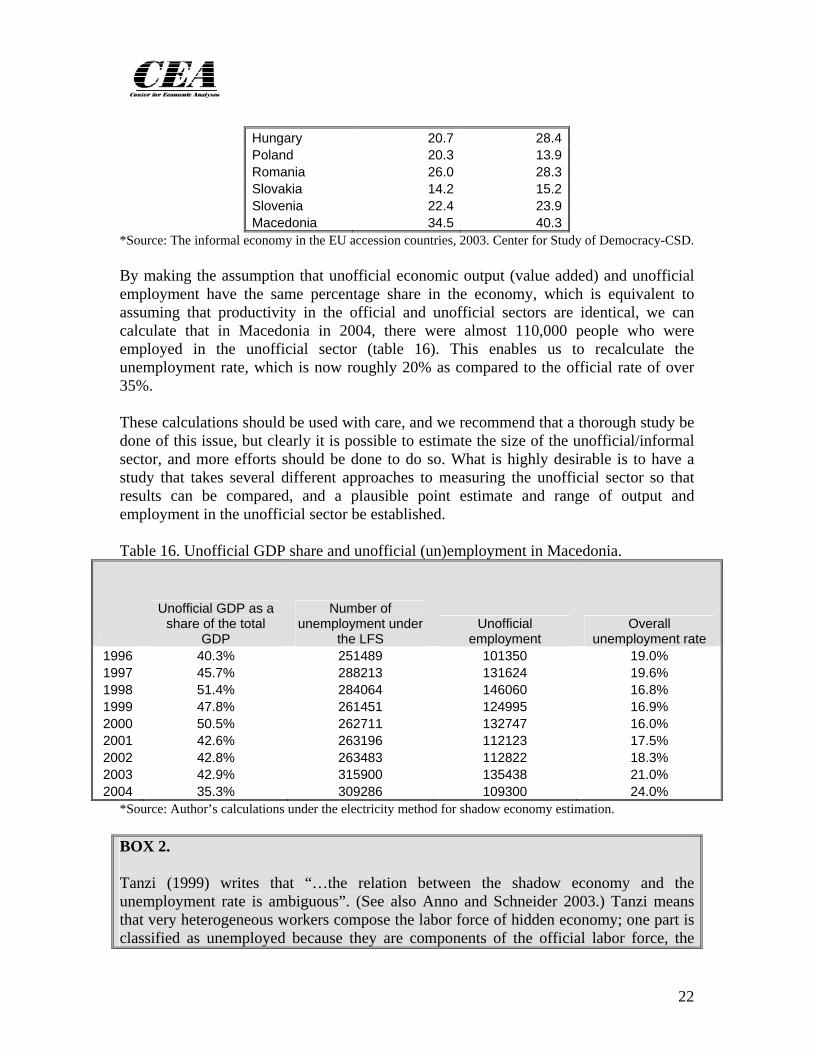
Hungary 20.7 28.4Poland 20.3 13.9Romania 26.0 28.3Slovakia 14.2 15.2Slovenia 22.4 23.9Macedonia 34.5 40.3
*Source: The informal economy in the EU accession countries, 2003. Center for Study of Democracy-CSD. By making the assumption that unofficial economic output (value added) and unofficial employment have the same percentage share in the economy, which is equivalent to assuming that productivity in the official and unofficial sectors are identical, we can calculate that in Macedonia in 2004, there were almost 110,000 people who were employed in the unofficial sector (table 16). This enables us to recalculate the unemployment rate, which is now roughly 20% as compared to the official rate of over 35%. These calculations should be used with care, and we recommend that a thorough study be done of this issue, but clearly it is possible to estimate the size of the unofficial/informal sector, and more efforts should be done to do so. What is highly desirable is to have a study that takes several different approaches to measuring the unofficial sector so that results can be compared, and a plausible point estimate and range of output and employment in the unofficial sector be established. Table 16. Unofficial GDP share and unofficial (un)employment in Macedonia.
Unofficial GDP as a share of the total
GDP
Number of unemployment under
the LFS Unofficial
employment Overall
unemployment rate 1996 40.3% 251489 101350 19.0% 1997 45.7% 288213 131624 19.6% 1998 51.4% 284064 146060 16.8% 1999 47.8% 261451 124995 16.9% 2000 50.5% 262711 132747 16.0% 2001 42.6% 263196 112123 17.5% 2002 42.8% 263483 112822 18.3% 2003 42.9% 315900 135438 21.0% 2004 35.3% 309286 109300 24.0%
*Source: Author’s calculations under the electricity method for shadow economy estimation. BOX 2. Tanzi (1999) writes that “…the relation between the shadow economy and the unemployment rate is ambiguous”. (See also Anno and Schneider 2003.) Tanzi means that very heterogeneous workers compose the labor force of hidden economy; one part is classified as unemployed because they are components of the official labor force, the
22

other part of ‘hidden’ workers is composed by retired people, illegal immigrants, minors or housewives who are not part of the official work force. Furthermore, there are people who have at the same time an official and unofficial job.
X. Human capital building Previously we saw that the “old” education system might not fit the labor market demand well in terms of skills, and this is one reason more for young people to shift to human capital production sector in Macedonia i.e. to move to study in the newly established Universities in Macedonia and/or to move to study abroad. Long-term unemployment might be a special problem because of the depreciation of human capital and know-how. If the economy experiences high growth in future, highly skilled labor supply will be overtaxed and will not meet specific labor demand needs (consider the recent debate on the undersupply of labor in the Macedonian IT labor market). The decline in industrial output in Macedonia has reduced incentives to start work earlier and has increased the rate of return on higher education, and labor is shifting away from low value-added/low wage sectors (we saw earlier that the unemployed find themselves less discouraged the more educated they are). Thus, slow progress in restructuring and low economic growth lowered the opportunity cost of further education and might continue to shrink the participation rate up to 2002 in Macedonia. Figure 5 shows that during the academic years 1991-2003, the gap between active students and graduates was increasing, and young people were shifting from participating in the real sector to creating human capital. This is a good investment for the future and might solve the bottleneck problem that could occur if demand for skilled labor increases as economic growth accelerates. When a worker shifts from a sector in which he or she has accumulated specific skills to a new sector not compatible with those skills, it is to be expected that the worker pays a premium for on-the-job training through lower real wages. This is another reason why younger Macedonians are shifting to the human capital production sector. For example, in 2001 compared to 2000 the number of newly enrolled students from Macedonia studying in USA increased for 20 %. The concentration on young and less educated unemployed might suggest shift out from Macedonian labor market toward human capital production. We can see from the next figure 6 how active pupil and students are increasing in number in the secondary and university schooling production, while the primary schooling is decreasing in number. However, we haven’t studied more carefully the demographic determinants of these findings.
23

305000
307000
309000
311000
313000
315000
317000
319000
321000
323000
325000
90/91 91/92 92/93 93/94 94/95 95/96 96/97 97/98 98/99 99/00 00/01 01/02 02/03
active -graduated
Figure 5. Active students minus graduated students in Universities in Macedonia
20000
30000
40000
50000
60000
70000
90/91 91/92 92/93 93/94 94/95 95/96 96/97 97/98 98/99 99/00 00/01 01/02 02/03200000
205000
210000
215000
220000
225000
230000
235000
240000
secondary university elementary
Figure 6. Active pupil and students in the Primary, Secondary and University
24
References [1] Center for Study of Democracy-CSD;. “The informal economy in the EU accession countries”, 2003. [2] D. Kaufmann, A. Shleifer and S. Johnson; “The unofficial economy in transition”; Brookings Papers on Economic Activity; 1997; 2; ABI/INFORM Global pg. 159 [3] G. Stoev; “Macroeconomic development in Bulgaria after 1996-1997 crisis: A labor market perspective”; Institute for Market Economics, February 2002. [4] J. Rutkowski; “Why is unemployment so high in Bulgaria”, Policy Research Working Paper-WB; 2003. [5] J. Zalduendo; “Enterprise restructuring and transition: Evidence from Macedonia”; 2003. [6] M. Nikolov; “Transitional highlights on the labor market in Macedonia”; 2002; technical assistance to the Ministry of finance under the USAID’s Fiscal Reform Project. [7] M. Nikolov; “Labor market flexibility: Empirical evidence about Macedonia”; 2003; Ministry of finance bulletin. [8] M. Nikolov; “Is the work force in Macedonia moving toward human capital production?”; 2003; presented at conference organized by the Economic Institute. [9] M. Nikolov; “The aspect of the social capital and the economic growth in Macedonia”; 2005; paper for the OSI project on identifying and measuring transaction costs in the Macedonian economy. [10] R. Dell Anno and F. Schneider; “The Shadow Economy of Italy and other OECD Countries: What do we know?”; 2003; Journal of Public Finance and Public Choice (PFPC) / Economia delle scelte pubbliche, XXI, Nos. 2-3, pp. 97-120. http://www.jpfpc.org. [11] V. Tanzi; “Uses and Abuses of Estimates of the Underground Economy”; 1999; The Economic Journal, 109, No.46, pp. 338-347.
25

NOTES:
26