report on short-term power market in india:2010-11 · pdf filereport on short-term power...
TRANSCRIPT

Report on Short-term Power Market in India:2010-11
July, 2011
Economics Division Central Electricity Regulatory Commission 3rd & 4th Floor, Chanderlok Building 36, Janpath, New Delhi-110001.

Report on Short-term Power Market in India, 2010-11 Page 2
Contents
S.No Contents Page No
Cover page 1
Contents 2
List of Tables 3
List of Charts 4
Abbreviations 5
Executive Summary 7
1 Yearly trends in short-term transactions of electricity (2008-09 to
2010-11)
10
1.1 Total Short-term Transactions of Electricity with respect to Total
Electricity Generation
11
1.2 Electricity Transacted through Trading Licensees and Power
Exchanges
11
1.3 Electricity Transacted through UI 15
1.4 Electricity Transacted Directly Between DISCOMs 16
2 Monthly trends in short-term transactions of electricity (April
2010-March 2011)
17
2.1 Volume of short-term transactions of electricity 18
2.2 Price of short-term transactions of electricity 21
2.3 Time of the day variation in Volume and Price of Electricity
transacted through Power Exchanges (Day Ahead Market Sub-
Segment) and Traders
23
2.4 Volume of Electricity Transacted in Various Price Slabs 25
2.5 Trading Margin Charged by Trading Licensees for Bilateral
Transactions during 2010-11
27
3 Daily trends in short-term transactions of electricity (1st April 10
to 31st March 11)
27
3.1 Volume of Short-term transactions of Electricity 27
3.2 Price of Short-term transactions of Electricity 28
3.2.1 Trends in price of electricity transacted through Power Exchanges 28
3.2.2 Trends in price of electricity transacted through UI 29
4 Analysis of open access consumers on power exchanges (Day
Ahead Market Sub-Segment)
30
5 Major Sellers and Buyers of Electricity through Licensed Traders
and Power Exchanges
34
6 Effect of congestion on Volume of Electricity Transacted through
Power Exchanges
38
7 Comparison of short term prices with Tariffs of long term sources
of power for various distribution companies
39
8 Annexure-I: List of Trading Licensees as on 31.03.2011 45
9 Annexure-II: Historic Volatility Calculation 46
10 Annexure-III: Herfindahl-Hirschman Index (HHI) Calculation 47

Report on Short-term Power Market in India, 2010-11 Page 3
List of Tables
Table-1 Total Volume of Short-term Transactions of Electricity with respect to Total
Electricity Generation
Table-2 Volume of Electricity Transacted through Trading Licensees and Power
Exchanges
Table-3 Electricity Transacted through Trading Licensees and Power Exchanges as
percentage of Total Volume of Short-term
Table-4 Price of Electricity Transacted through Traders & Power Exchanges
Table-5 Size of the OTC and Power Exchange Market in Monetary Term
Table-6 Volume and Price of Electricity transacted through UI
Table-7 Volume of Electricity Transacted Directly between DISCOMs
Table-8 Volume of Short-Term Transactions of Electricity (MUs)
Table-9 Volume of Short-term transactions of electricity as % of total electricity
generation
Table-10 Percentage Share of Electricity Traded by Trading Licensees and HHI in
2010-11
Table-11 Price of Short-term Transactions of Electricity (`/kWh)
Table-12 Average Trading Margin Charged by Trading Licensees during 2010-11
Table-13 Number of Open Access Consumers in IEX, 2010-11
Table-14 Volume Participation of Open Access Consumers in IEX Day Ahead Market
in 2010-11
Table-15 Number of Open Access Consumers in PXIL, 2010-11
Table-16 Volume Participation of Open Access Consumers in Day Ahead Market of
PXIL in 2010-11
Table-17 Major Sellers of Electricity through Bilateral Trader Segment (Trading
Licensees) in 2010-11
Table-18 Major Buyers of Electricity through Bilateral Trader Segment (Trading
Licensees) in 2010-11
Table-19 Major Sellers of Electricity in the Day Ahead Market in IEX, 2010-11
Table-20 Major Buyers of Electricity in the Day Ahead Market in IEX, 2010-11
Table-21 Major Sellers of Electricity in the Day Ahead Market in PXIL, 2010-11
Table-22 Major Buyers of Electricity in the Day Ahead Market in PXIL, 2010-11
Table-23 Details of Congestion in Power Exchanges, 2010-11
Table-24 Price of Short-Term Transactions of Electricity in 2010-11
Table-25 Tariff of Thermal Generating Stations of NTPC, NLC and NEEPCO, 2010-11
Table-26 Composite Tariff of Hydro Stations under the Purview of CERC, 2009-10
Table-27 Capacity Contracted under Case-I Bidding Route during
the year 2010
Report on Short-term Power Market in India, 2010-11 Page 4
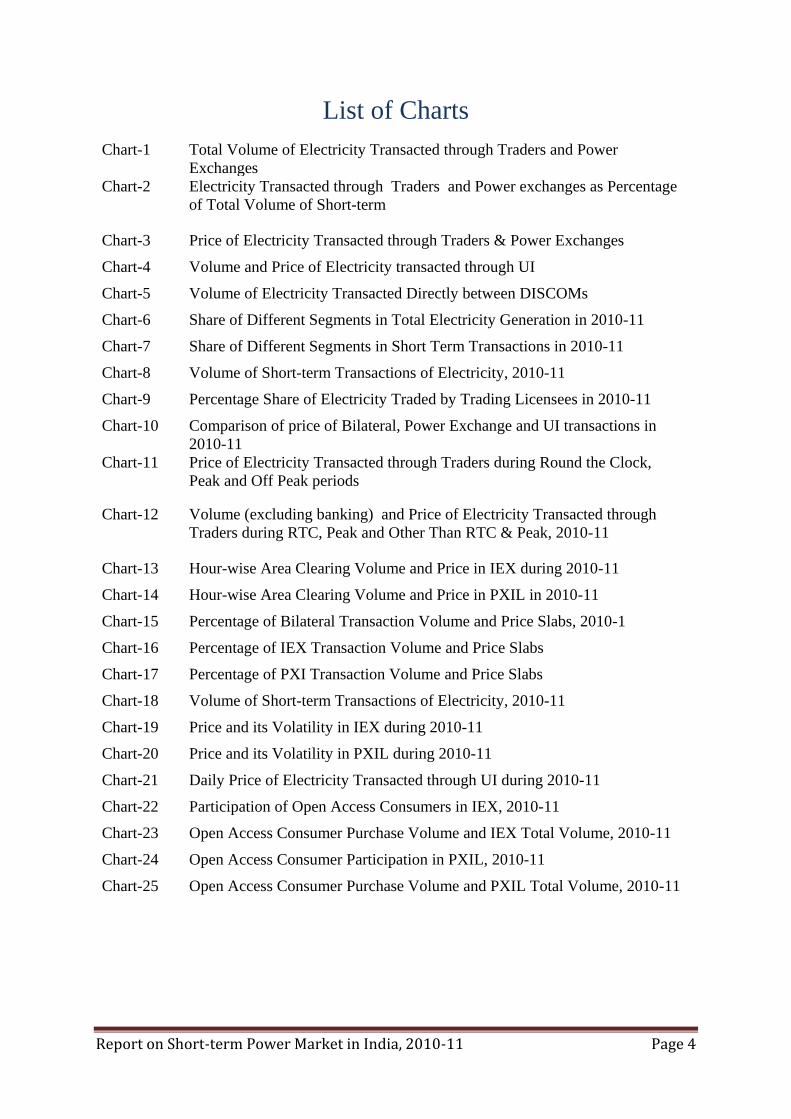
List of Charts
Chart-1 Total Volume of Electricity Transacted through Traders and Power
Exchanges
Chart-2 Electricity Transacted through Traders and Power exchanges as Percentage
of Total Volume of Short-term
Chart-3 Price of Electricity Transacted through Traders & Power Exchanges
Chart-4 Volume and Price of Electricity transacted through UI
Chart-5 Volume of Electricity Transacted Directly between DISCOMs
Chart-6 Share of Different Segments in Total Electricity Generation in 2010-11
Chart-7 Share of Different Segments in Short Term Transactions in 2010-11
Chart-8 Volume of Short-term Transactions of Electricity, 2010-11
Chart-9 Percentage Share of Electricity Traded by Trading Licensees in 2010-11
Chart-10 Comparison of price of Bilateral, Power Exchange and UI transactions in
2010-11
Chart-11 Price of Electricity Transacted through Traders during Round the Clock,
Peak and Off Peak periods
Chart-12 Volume (excluding banking) and Price of Electricity Transacted through
Traders during RTC, Peak and Other Than RTC & Peak, 2010-11
Chart-13 Hour-wise Area Clearing Volume and Price in IEX during 2010-11
Chart-14 Hour-wise Area Clearing Volume and Price in PXIL in 2010-11
Chart-15 Percentage of Bilateral Transaction Volume and Price Slabs, 2010-1
Chart-16 Percentage of IEX Transaction Volume and Price Slabs
Chart-17 Percentage of PXI Transaction Volume and Price Slabs
Chart-18 Volume of Short-term Transactions of Electricity, 2010-11
Chart-19 Price and its Volatility in IEX during 2010-11
Chart-20 Price and its Volatility in PXIL during 2010-11
Chart-21 Daily Price of Electricity Transacted through UI during 2010-11
Chart-22 Participation of Open Access Consumers in IEX, 2010-11
Chart-23 Open Access Consumer Purchase Volume and IEX Total Volume, 2010-11
Chart-24 Open Access Consumer Participation in PXIL, 2010-11
Chart-25 Open Access Consumer Purchase Volume and PXIL Total Volume, 2010-11

Report on Short-term Power Market in India, 2010-11 Page 5
Abbreviations
Abbreviation Expanded Version
AGBPP Assam Gas Based Power Project
APCPDCL Central Power Distribution Company of Andhra Pradesh Limited
APPCC Andhra Pradesh Power Coordination Committee
APTRANCO Transmission Corporation of Andhra Pradesh Limited
BALCO Bharat Aluminium Company Limited
BESCOM Bangalore Electricity Supply Company Limited
BRPL BSES Rajdhani Power Limited
BUs Billion units (billion kWh)
BYPL BSES Yamuna Power Limited
CCGT Combined Cycle Gas Turbine
CGSEB Chhattisgarh State Electricity Board
CSPTCL Chhattisgarh State Power Trading Company Limited
DAM Day Ahead Market
DISCOMS Distribution Companies
FGUTPP Firoz Gandhi Unchahar Thermal Power Project
GEL GMR Energy Limited
GMR GMR Energy Trading Limited
GPS Gas Power Station
GUVNL Gujarat Urja Vikas Nigam Limited
HHI Herfindahl-Hirschman Index
HPPC Haryana Power Procurement Centre
HPSEB Himachal Pradesh State Electricity Board
IEX Indian Energy Exchange Limited
JPL Jindal Power Limited
JSL/JSL_Ltd Jindal Stainless Limited
JSW JSW Power Trading Company Limited
JSWEL JSW Energy Limited
JVVNL Jaipur Vidyut Vitaran Nigam Limited
KISPL Knowledge Infrastructure & Systems Private Limited
KSEB Kerala State Electricity Board
kWh Kilo Watt Hour
LAPL LANCO Amarkantak Power Limited
LKPPL LANCO Kondapalli Power Private Limited
LNG Liquified Natural Gas
Ltd Limited
MPPTCL Madhya Pradesh Power Trading Company Limited
MSEDCL Maharashtra State Electricity Distribution Company Limited

Report on Short-term Power Market in India, 2010-11 Page 6
Abbreviation Expanded Version
MUs Million Units
MW Mega Watts
NBVL Nav Bharat Ventures Limited
NDPL North Delhi Power Limited
NEEPCO North Eastern Electric Power Corporation Limited.
NEW Grid Northern, Eastern, Western and North-Eastern Region Grid
NHDC NHDC Limited
NHPC National Hydro-Electric Power Corporation Limited
NLC Neyveli Lignite Corporation Limited
NTPC National Thermal Power Corporation Limited
NVVN NTPC Vidyut Vyapar Nigam Limited
OA Open Access
OAC Open Access Consumer
PCKL Power Corporation of Karnataka Limited
PSEB Punjab State Electricity Board
PSPCL Punjab State Power Corporation Limited
PTC PTC India Limited
PX/PXs/Pxes Power Exchange/Power Exchanges
PXIL Power Exchange India Limited
R Infra Reliance Infrastructure Limited
RLNG Re-gasified Liquefied Natural Gas
RPPC Rajasthan Power Procurement Centre
RTC Round The Clock
SJVNL Sutlej Jal Vidyut Nigam Limited
SPDC-J&K State Power Development Corporation of Jammu and Kashmir
SR Grid Southern Region Grid
ST Stage
STPS Super Thermal Power Station
TAM Term Ahead Market
THDC Tehri Hydro Development Corporation Limited
TNEB Tamil Nadu Electricity Board
TPC-(D) Tata Power Company Limited - Distribution Business
TPS Thermal Power Station
TPTL Tata Power Trading Company Limited
UI Unscheduled Interchange
UMPP Ultra Mega Power Project
UPPCL Uttar Pradesh Power Corporation Limited
WBSEDCL West Bengal State Electricity Distribution Company Limited

Report on Short-term Power Market in India, 2010-11 Page 7
Executive Summary
An analysis on short-term transactions of electricity in India has been made in this
report on short-term power market1 for the year 2010-11. Here, “short-term transactions of
electricity” refers to contracts of less than one year period, for electricity transacted under
bilateral transactions through Inter-State Trading Licensees (only inter-state part) and directly
by the Distribution Licensees, Power Exchanges (Indian Energy Exchange Ltd (IEX) and
Power Exchange India Ltd (PXIL)), and Unscheduled Interchange (UI). The analysis
includes (i) Years/Monthly/Daily trends in short-term transactions of electricity; (ii) Analysis
of open access consumers on power exchanges; (iii) Major Sellers and Buyers of Electricity
through Licensed Traders and Power Exchanges; (iv) Effect of congestion on Volume of
Electricity transacted through Power Exchanges; and (v) Comparison of short-term prices
with tariffs of long-term sources of power for various distribution companies.
Salient features of the report are listed below and are discussed in details in
subsequent sections.
Of the total electricity procured in India in 2010-11, the short-term power market
comprises only 10 per cent. The balance 90 percent of generation is being procured
mainly by distribution companies through long-term contracts and short term intra-state
transactions.
In volume (kWh) terms, the size of the short term market in India was about 81.56 billion
kWh (units) in the year 2010-11. As compared to the volume of electricity transacted
through short term market in the year 2009-10 (65.90 billion units), this was about 24
percent higher. Majority of this growth in volume of 15.66 billion units (81.56-65.90
=15.66) was accounted for by growth in transactions through the power exchanges
(53.3%), followed by growth in direct bilateral transactions between the DISCOMs
(about 26%). Transactions through traders accounted for only about 6.3% of the overall
growth of about 15.66 billion units and were lower than the contribution of UI to the
overall growth (UI contribution in overall growth of 15.66 billion units was about 14.4%).
A caveat, however, needs to be added here that the transactions through traders
considered here are the interstate transactions.
Excluding UI and direct bilateral sale between the DISCOMs, the volume of electricity
transacted was about 43.22 billion units in the year 2010-11. This was about 27.5 percent
higher than the year 2009-10. Volume of electricity transacted through power exchanges
witnessed a sharp increase of about 116.2% over 2009-10 volumes. On the other hand,
the increase in the volume of electricity traded under bilateral transactions through traders
was very moderate at 3.7%. In monetary terms, the size of this segment of the short term
1 Although unscheduled interchange (UI) is not a market mechanism, electricity transacted
under UI is often considered a part of short term transaction. Also, electricity transacted
bilaterally directly between the distribution companies (without involving trading licensees
or power exchanges) is also considered a part of short term market. In the year 2010-11, the
volume of UI was about 28.08 billion kWh and that of between distribution companies was
about 10.25 billion kWh.

Report on Short-term Power Market in India, 2010-11 Page 8
market was about `18657 crore in the year 2010-112, which was 5.9% more than in the
year 2009-10. About `5389 crore of which was the value of electricity transacted through
power exchanges (51.3% more than `3563 crore done in 2009-10), and the balance of
about `13271 crore was the value of inter-state transaction of electricity through trading
licensees (about 5.6% less than `14055 crore done in 2009-10).
Although in absolute terms, the volume of UI in the year 2010-11 increased by 8.8% over
2009-10 figure, the share of UI as a percentage of total volume of short term transaction
of electricity continued the downward trend of past years and UI volume as percentage of
total volume of short trem transaction of electricity was about 34% in the year 2010-11
(down from 41% and 39% respectively in the years 2008-09 and 2009-10).
The volume of direct bilateral transactions between DISCOMs witnessed a steep rise of
about 65.7% during 2010-11 as compared to 2009-10 volume level. In percentage terms,
the share of direct bilateral transactions between DISCOMs as a percentage of total short
term transaction volume increased to about 12.4% in the year 2010-11 (as compared to
about 9.6% in the year 2009-10).
The weighted average price of electricity transacted through power exchanges was `3.47
per kWh and through trading licensees was `4.79 per kWh in the year 2010-11. The
corresponding values for the year 2009-10 were `4.96 per kWh and `5.26 per kWh,
respectively. In the year 2010-11, the weighted average price of electricity transacted
through Day Ahead Market sub-segment of the power exchanges was `3.44/kWh and that
through Term Ahead Market sub-segment was `3.70/kWh.
The weighted average price of weekly contracts under the Term Ahead Market sub-
segment was `3.56/kWh; which was lower than the weighted average price of `4.79/kWh
for electricity transacted through bilateral contracts through traders.
During the year 2010-11, 90% of the volume of electricity in the two power exchanges
has been transacted at the price less than `6/kWh. 73% of the volume in IEX and 67%
volume in PXIL transacted at the price less than `4/kWh.
During the year 2010-11, about 80% of the volume of electricity transacted under
bilateral transactions through traders has been transacted at the price of less than `6/kWh.
Almost 58% of the volume has been transacted at prices between `4 and `5 per kWh.
During the year 2010-11, only about 495 million units of electricity was exclusively
bought during peak hours under bilateral transactions from traders (exclusive of banking).
This was about 2.4% of the total electricity bought under bilateral transaction from traders
(excluding banking). Majority, about 78.6% , was bought on round the clock (RTC)
basis, followed by 19% being exclusively bought in periods other than peak periods. The
per unit price of electricity procured on round the clock (RTC) basis was the cheapest
2 Excluding transactions pertaining to, banking transactions.

Report on Short-term Power Market in India, 2010-11 Page 9
(`4.69/kWh), followed by electricity exclusively procured during non-peak hours
(`4.74/kWh) and electricity exclusively procured during peak hours (`5.59/kWh).
The beginning of the process of procurement of power by the industrial sector consumers
through power exchanges witnessed in the year 2009, continued vigorously during the
year 2010-11. At IEX, Open Access industrial sector consumers bought about 4.056
billion units of electricity, which formed about 34.4 % of the total day ahead volume
transacted during 2010-11. For PXIL, the respective figures were: 92.72 million units,
5.33% (3.3%).
The weighted average price of electricity bought by open access consumers at IEX was
lower (`2.72/kWh) when compared with the weighted average price of total electricity
transacted through IEX (`3.38/kWh). The weighted average price of electricity bought by
open access consumers at PXIL was lower (`3.62/kWh) when compared with the
weighted average price of total electricity transacted through PXIL (`3.87/kWh).
The year also witnessed constraints on the volume of electricity that could be transacted
through power exchanges, mainly due to transmission congestion. During the year 2010-
11, the actual volume transacted could have been about 5 percent higher, had there been
no congestion prevalent in the system. Because of congestion and the attendant splitting
of day ahead market at both the power exchanges, the congestion amount as of 31st March
2011 was `457.04 crore.

Report on Short-term Power Market in India, 2010-11 Page 10
Report on
Short-term Power Market in India, 2010-11
An analysis on short-term transactions of electricity in India has been made in this
report on short-term power market3 for the year 2010-11. Here, “short-term transactions of
electricity” refers to contracts of less than one year period, for electricity transacted under
bilateral transactions through Inter-State Trading Licensees (only inter-state part) and directly
by the Distribution Licensees, Power Exchanges (Indian Energy Exchange Ltd (IEX) and
Power Exchange India Ltd (PXIL)), and Unscheduled Interchange (UI). The analysis
includes (i) Years/Monthly/Daily trends in short-term transactions of electricity; (ii) Analysis
of open access consumers on power exchanges; (iii) Major Sellers and Buyers of Electricity
through Licensed Traders and Power Exchanges; (iv) Effect of congestion on Volume of
Electricity transacted through Power Exchanges; and (v) Comparison of short-term prices
with tariffs of long-term sources of power for various distribution companies.
1. Yearly trends in short-term transactions of electricity (2008-09 to 2010-11)
The analysis on yearly trends in short-term transactions includes the electricity
transacted through following segments:
trading licensees (inter-state part only) under bilateral transactions or “bilateral
trader” segment ,
power exchange segment with transactions in both, Day Ahead and Term Ahead
Markets,
UI segment and
direct between distribution companies (DISCOMs) segment.
Inter-state trading licensees have been undertaking trading in electricity since the year
2004 and the power exchanges are in operation since the year 2008. The IEX and PXIL are in
3 Although unscheduled interchange (UI) is not a market mechanism, electricity transacted
under UI is often considered a part of short term transaction. Also, electricity transacted
bilaterally directly between the distribution companies (without involving trading licensees
or power exchanges) is also considered a part of short term market. In the year 2010-11, the
volume of UI was about 28.08 billion kWh and that of between distribution companies was
about 10.25 billion kWh.

Report on Short-term Power Market in India, 2010-11 Page 11
operation since June 2008 and October 2008 respectively. As of March 2011, there were 40
inter-state trading licensees (list is enclosed at Annexure-I) and two power exchanges.
1.1. Total Short-term Transactions of Electricity with respect to Total Electricity
Generation
Total volume of short-term transactions of electricity has increased from 65.90 billion
kWh (BUs) in 2009-10 to 81.56 BUs in 2010-11. The growth in volume in absolute terms
thus has been 15.66 BUs and in percentage terms, the same has been about 23.76 percent.
Total volume of short-term transactions of electricity as percentage of total electricity
generation has also increased from 9% in 2009-10 to 10% in 2010-11 (Table-1).
Table-1: Total Volume of Short-term Transactions of Electricity with respect to
Total Electricity Generation
Year Total Volume of
Short-term
Transactions of
Electricity (BU)
Total Electricity
Generation (BU)
Total volume of Short-
term Transactions of
Electricity as % of Total
Electricity Generation
2009-10 65.90 764.03 9%
2010-11 81.56 809.45 10%
Source: NLDC
1.2. Electricity Transacted through Trading Licensees and Power Exchanges
Table-2, Table-3, Chart-1 & Chart-2 show details of volume of electricity transacted
through trading licensees under bilateral transactions and through power exchanges for the
period from 2008-09 to 2010-11. The volume of electricity transacted through inter-state
trading licensees and power exchanges has increased from 24.69 BUs in 2008-09 to 43.22
BUs in 2010-11. The share of electricity transacted through trading licensees and power
exchanges in volume terms as a percentage of total short-term transactions of electricity in
2010-11 has shown a moderate level of rise (from 51.45% to 53%) over the year 2009-10.
The growth in volume for this segment during the year 2010-11 as compared to year 2009-10
thus has been 9.31BUs in absolute terms and about 27.5 in percentage terms. Majority of this
growth has come about due to growth in volume of about 6.45 BUs (or 69.3% of total
growth) in Day Ahead Market sub-segment, followed by about 1.88 BUs (or about 20.2 % of
total growth) in Term Ahead Market sub-segment and about 0.98 BUs (or about 10.5% of the
total growth) in the bilateral trader segment. Looking at the individual sub-segment growth

Report on Short-term Power Market in India, 2010-11 Page 12
between the years 2009-10 and 2010-11, it is observed that the growth has been highest for
Term Ahead Market sub-segment (1822 %), followed by Day Ahead Market sub-segment (91
%), and bilateral trader segment (3.54 %).
Table-2: Volume of Electricity Transacted through Trading Licensees and Power
Exchanges
Year Electricity
Transacted
through
trading
Licensees
(BUs)
Electricity
Transacted through
IEX (BUs)
Electricity
Transacted
through PXIL
(BUs)
Electricity
Transacted
through
IEX and
PXIL
(BUs)
Total
(BUs)
Day
Ahead
Market
Term
Ahead
Market
Day
Ahead
Market
Term
Ahead
Market
2008-09 21.92 2.62 0.15 2.77 24.69
2009-10 26.72 6.17 0.0952 0.92 0.003 7.19 33.91
2010-11 27.70 11.80 0.91 1.74 1.07 15.52 43.22
Note1: The volume of electricity transacted through trading licensees in 2008-09 (April to
July 2008) includes cross border trading and intra-state trading volume.
Table-3: Electricity Transacted through Trading Licensees and Power Exchanges as
percentage of Total Volume of Short-term
Year Volume of Electricity
Transacted through
Traders and Power
Exchanges (BUs)
Total Short-term
Transactions of
Electricity (BUs)
Electricity Transacted
through traders and
PXs as % to Total
Volume of Short-term
2008-09 24.69 35.27 70.00%
2009-10 33.91 65.90 51.45%
0.00
10.00
20.00
30.00
40.00
50.00
2008-09 2009-10 2010-11
24.69
33.91
43.22
Vo
lum
e (
BU
s)
Chart 1: Total Volume of Electricity Transacted through Traders and Power Exchanges

Report on Short-term Power Market in India, 2010-11 Page 13
2010-11 43.22 81.56 53.00%
Note1: The volume of electricity transacted through trading licensees in 2008-09 (April to
July 2008) includes cross border trading and intra-state trading volume. Since 2008-09
figures include cross border and intra state trading for part of the year, its comparison
with other two years cannot be strictly done.
The price of electricity transacted through trading licensees and Power Exchanges is
shown in Table-4 and Chart-3. The weighted average price of electricity transacted through
trading licensees and power exchanges declined from `7.29/kWh and `7.49/kWh respectively
in 2008-09 to `4.79/kWh and `3.47/kWh respectively in 2010-11. It is thus seen that the
price of electricity in the short term market in the year 2010-11 was on the lower side as
compared to price prevalent in the previous two years.
During the year 2010-11, the weighted average price of electricity in the Term Ahead
Market sub-segment, which registered a growth of 1822% in volume terms, was `3.70/kWh.
This was slightly higher than the weighted average price discovered in the Day Ahead Market
sub-segment where the weighted average price was `3.44/kWh. An interesting observation is
with respect to the weighted average price of weekly contracts in the Term Ahead Market
sub-segment. The same was `3.56/kWh during the year 2010-11 for a total volume
transaction of about 1.92 BUs. It is thus seen that the weighted average price of Term Ahead
Contracts (Weekly contracts) as discovered in the power exchanges was lower than the
weighted average price of electricity transacted through trading licensees (bilateral trader
segment), which, as mentioned in the preceding paragraph, was `4.79/kWh
0.00%
20.00%
40.00%
60.00%
80.00%
2008-09 2009-10 2010-11
70.00%
51.45% 53.00%
Chart 2: Electricity Transacted through Traders and Power exchanges as Percentage of Total Volume of Short-term

Report on Short-term Power Market in India, 2010-11 Page 14
The decreasing trend in weighted average prices has had its effect on the market size
of this segment in monetary terms (Table-5). Thus, although in physical terms (BU terms) the
size of this segment has increased by about 27.5 % in the year 2010-11 as compared to the
year 2009-10, in monetary terms the growth has only been about 5.9% (or about `1040
crore). In fact the bilateral trader sub-segment, though registering a growth of about 3.54 % in
physical terms, has registered a negative growth in monetary terms of about minus 5.6 % (or
about minus `787 crore). The power exchange segment, however, has registered a healthy
growth of 49.9% in monetary terms (or about `1826 crore).
Table-4: Price of Electricity Transacted through Traders & Power Exchanges
Year Price of Electricity
transacted through Trading
Licensees (`/kWh)
Price of Electricity
transacted through Power
Exchanges (DAM+TAM)
(`/kWh)
2008-09 7.29 7.49
2009-10 5.26 4.96
2010-11 4.79 3.47
7.29
5.26
4.79
7.49
4.96
3.47
0.00
2.00
4.00
6.00
8.00
2008-09 2009-10 2010-11
Pri
ce (`/
kWh
)
Chart 3: Price of Electricity Transacted through Traders & Power
Exchanges
Price of Electricity Transacted through Traders
Price of Electricity Transacted through Power Exchanges

Report on Short-term Power Market in India, 2010-11 Page 15
1.3 Electricity Transacted through UI
The volume and price of electricity transacted through UI is shown in Table-6 and
Chart-4. The volume and price of electricity transacted through UI in 2008-09 represents the
period from August 2008 to March 2009. It is observed from the Table that the volume of
electricity transacted through UI has increased from 25.81 BU in 2009-10 to 28.08 BU in
2010-11, the volume of UI as percentage of total short-term volume has declined to a level of
34% in the year 2010-11 as compared to 39% in the year 2009-10. It is also observed from
the table that there is a declining trend in the average price of UI (New Grid and SR Grid)
during the last 3 years i.e. from `6.70/kWh in 2008-09 to `3.91/kWh in 2010-11.
Table-6: Volume and Price of Electricity transacted through UI
Year Volume of UI
(BU)
Total Volume of
Short term (BU)
Volume of UI as %
of total volume of
Short term
Price of UI
(`/kWh)
2008-09 14.39 35.27 41% 6.70
2009-10 25.81 65.90 39% 4.62
2010-11 28.08 81.56 34% 3.91
Note: The data for the year 2008-09, represents the period from August 2008 to March
2009.
Table-5: Size of the Bilateral Trader and Power Exchange Market in Monetary Terms
Year
Electricity
Transacted
through
trading
Licensees
(BU)
Price of
Electricity
Transacted
through
Trading
licensees
(`/kWh)
Size of
bilatera
l trader
Market
in `
Crore
Electricity
Transacted
through
Power
Exchanges
(BU)
Price of
Electricity
Transacted
through
Power
Exchanges
(`/kWh)
Size of
Power
Exchan
ge
Market
in ` Crore
Total
Size of
the
bilateral
trader +
Power
Exchang
e Market
(` Crore)
2009-10 26.72 5.26 14055 7.19 4.96 3563 17617
2010-11 27.7 4.79 13268 15.52 3.47 5389 18657

Report on Short-term Power Market in India, 2010-11 Page 16
1.4 Electricity Transacted Directly Between DISCOMs
The volume of electricity transacted directly between distribution companies
(DISCOMs) is shown in Table-7 and Chart-5. It is observed from the table that the volume of
electricity transacted directly between DISCOMs increased significantly from 6.19 BU in
2009-10 to 10.25 BU in 2010-11. It is also observed that, in the year 2010-11, the share of
electricity transacted directly between DISCOMs as percentage to total volume of short term
transaction of electricity has also increased from 9% to 13%.
Table-7: Volume of Electricity Transacted Directly between DISCOMs
Year Volume of Electricity
Transacted Directly
between DISCOMs (BU)
Total Volume
of Short term
(BU)
Volume of Bilateral
Direct as % of total
volume of Short term
2008-09 3.31 35.27 9%
2009-10 6.19 65.90 9%
2010-11 10.25 81.56 13%
Note: The data for the year 2008-09 is for the period from August 2008 to March 2009.
14.39
25.81 28.08
6.70
4.623.91
0.00
1.00
2.00
3.00
4.00
5.00
6.00
7.00
8.00
0.00
5.00
10.00
15.00
20.00
25.00
30.00
2008-09 2009-10 2010-11
Pri
ce (
`/k
Wh
)
Vo
lum
e (
BU
)Chart-4: Volume and Price of Electricity transacted through UI
Volume of UI (BU) Price of UI (`/kwh)

Report on Short-term Power Market in India, 2010-11 Page 17
2. Monthly trends in short-term transactions of electricity (April 2010-March 2011)
During 2010-11, the share of the total short term transactions in volume terms,
including UI and bilateral transactions between distribution companies, as a percentage of
total electricity generation in the country was about 10 percent (Chart-6).
The share of different segments within the total short term transaction for the year
2010-11 has been shown in the Chart-7 below.
3.31
6.19
10.25
0.00
2.00
4.00
6.00
8.00
10.00
12.00
2008-09 2009-10 2010-11
Vo
lum
e (
BU
)Chart-5: Volume of Electricity Transacted Directly between
DISCOMs
5% 2%3%
90%
Chart-6: Share of Different Segments in Total Electricity
Generation in 2010-11
Bilateral Transactions Power Exchange Transactions
UI Transactions Long Term Transactions

Report on Short-term Power Market in India, 2010-11 Page 18
2.1. Volume of short-term transactions of electricity
The volume of short-term transactions of electricity during different months of the year
2010-11 with respect to different segments of transaction is shown in Table-8 and Chart-8.
Table-8: VOLUME OF SHORT-TERM TRANSACTIONS OF ELECTRICITY (MUs)
Period Bilateral
through
Traders
Bilateral
between
DISCOM
S
Total
Bilateral
transac-
tions
Power
Exchange
transac-tions
(DAM+TAM
)
UI
transac-
tions
Total
Short-
term
transac-
tions
Total
Electricity
Generatio
n
Apr-10 2092.18 604.01 2696.19 646.70 2010.96 5353.85 66572.47
May-10 2560.20 634.43 3194.63 670.49 2529.56 6394.67 67980.40
Jun-10 2609.91 1211.62 3821.52 1024.11 2450.00 7295.64 65211.13
Jul-10 2701.39 1231.55 3932.95 1478.21 3041.12 8452.28 65632.15
Aug-10 2834.87 1112.16 3947.03 1623.60 2398.99 7969.62 67174.98
Sep-10 2290.14 804.10 3094.23 1488.53 2302.70 6885.46 64315.24
Oct-10 1908.17 549.50 2457.66 1318.29 2470.02 6245.96 70558.09
Nov-10 1823.91 732.02 2555.93 1130.88 1953.60 5640.41 62583.80
Dec-10 1691.21 884.55 2575.76 1486.80 2121.38 6183.94 67079.74
Jan-11 2287.06 895.45 3182.51 1519.46 2527.68 7229.65 71282.05
Feb-11 2271.85 783.76 3055.61 1566.50 1890.66 6512.77 65566.23
Mar-11 2632.84 811.79 3444.64 1566.83 2381.60 7393.07 75497.39
Total 27703.73 10254.93 37958.66 15520.40 28078.28 81557.34 809453.67
Compounded
monthly
growth rate 2.11% 2.72% 2.25% 8.38% 1.55% 2.98% 1.15%
34%
13%19%
34%
Chart-7: Share of Different Segments in Short Term Transactions in
2010-11
Bilateral through Traders Bilateral between DISCOMS
Power Exchange Transactions UI Transactions

Report on Short-term Power Market in India, 2010-11 Page 19
It is observed from the above table (Table-8) that the volume of short-term
transactions of electricity has grown steadily over the months at the compounded monthly
rate of 2.98 %. Volume of transactions though power exchanges has shown a healthy growth
and has grown at the monthly compounded rate of 8.38%. It is observed from the table that
the monthly compounded growth rate in UI volume (1.55%) is lower than the monthly
compounded growth rate in volume of electricity transacted through all other segments of
short-term transactions. It is also observed that the monthly compounded growth rate in
volume of electricity transacted through short-term is relatively high (2.98%) when compared
with the monthly compounded growth rate in total electricity generation (1.15%).
It is observed from the chart below (Chart-8) that there is a cyclical trend in the total
volume of short-term transactions of electricity. It is also observed from the chart that there is
no constant increase/decrease in the volume of all segments of the short-term transactions of
electricity. This trend may have emerged due to demand and supply of electricity which vary
from season to season. However, a rising trend in the volume of total short term transactions
as well as in the volumes of all segments of the short term transactions, albeit with differing
growth rates, is clearly discernable from the Chart-8.
The volume of short-term transactions of electricity as % of total electricity
generation is varying between 8.04% and 12.88% during the period (Table-9).
0.00
1000.00
2000.00
3000.00
4000.00
5000.00
6000.00
7000.00
8000.00
9000.00
Vo
lum
e (M
U)
Chart-8: Volume of Short-term Transactions of Electricity, 2010-11
Bilateral Transactions (Traders+Discoms) Power Exchange transactions (DAM+TAM)
UI transactions Total Short-term transac-tions

Report on Short-term Power Market in India, 2010-11 Page 20
Table-9: Volume of Short-term transactions of electricity as % of total electricity
generation
Period Short-term transactions as % of total electricity
generation
Apr-10 8.04%
May-10 9.41%
Jun-10 11.19%
Jul-10 12.88%
Aug-10 11.86%
Sep-10 10.71%
Oct-10 8.85%
Nov-10 9.01%
Dec-10 9.22%
Jan-11 10.14%
Feb-11 9.93%
Mar-11 9.79%
The volume of electricity transacted through trading licensees (traders inter-state
bilateral transactions + traders transactions through Power Exchanges) has been analysed
using the Herfindahl-Hirschman Index (HHI) for measuring the competition among the
trading licensees (Table-10). Increases in the HHI generally indicate a decrease in
competition and an increase of market power, whereas decreases indicate the opposite. A
HHI between 0.15 to 0.25 indicates moderate concentration and a HHI above 0.25 indicates
high concentration. The HHI computed for volume of electricity transacted by trading
licensees during 2010-11 is 0.1943 which shows moderate concentration/market power
among the trading licensees.
Table-10: Percentage Share of Electricity Traded by Trading Licensees and HHI in 2010-11
Sr No
Name of the Trading Licensee Share of Electricity traded by Licensees in
2010-11
Herfindahl Herschman Index (HHI)
1 PTC India Ltd 35.11% 0.1233
2 NTPC Vidyut Vyapar Nigam Ltd 17.07% 0.0291
3 National Energy Trading & Services Ltd 13.52% 0.0183
4 Reliance Energy Trading (P) Ltd 11.48% 0.0132
5 Tata Power Trading Company (P) Ltd 8.25% 0.0068
6 JSW Power Trading Company Ltd 4.40% 0.0019
7 Knowledge Infrastructure Systems (P) Ltd 2.31% 0.0005
8 GMR Energy Trading Ltd 2.22% 0.0005
9 Instinct Infra & Power Ltd 1.99% 0.0004
10 Adani Enterprises Ltd 1.31% 0.0002

Report on Short-term Power Market in India, 2010-11 Page 21
11 Shree Cements Ltd 1.11% 0.0001
12 Pune Power Development (P) Ltd 0.42% 0.0000
13 Mittal Processes (P) Ltd 0.27% 0.0000
14 RPG Power Trading Company Ltd 0.26% 0.0000
15 Indrajit Power Technologies (P) Ltd 0.08% 0.0000
16 Godavari Power & Ispat Ltd 0.08% 0.0000
17 Essar Electric Power Development Corp. Ltd 0.06% 0.0000
18 Jindal Power Trading Company Ltd 0.03% 0.0000
19 Global Energy (P) Ltd 0.02% 0.0000
Total 100.00% 0.1943
Top 5 Trading Licensees 85.43%
Note: Percentage share in total volume traded by Licensees in 2010-11 computed based on the volume which includes the volume traded by inter-state trading licensees through bilateral and power exchanges. The volume excludes cross border trading volume and intra-state trading volume.
Source: Information submitted by Trading Licensees.
The percentage share of electricity transacted by major trading licensee in the total
volume of electricity transacted by all the licensees is shown in Chart-9.
2.2. Price of short-term transactions of electricity
The trends in price of short-term transactions of electricity are shown in Table-11 and
Chart-10 & 11. The price analysis is mainly based on the average price of UI and the
weighted average price of other short-term transactions of electricity. The price of bilateral
trader transactions represents the price of electricity transacted through trading licensees.
35%
17%14%
11%
8%
15%
Chart-9: Percentage Share of Electricity Traded by Trading Licensees in 2010-11
PTC India Ltd NTPC Vidyut Vyapar Nigam Ltd
National Energy Trading & Services Ltd Reliance Energy Trading (P) Ltd
Tata Power Trading Company (P) Ltd Others

Report on Short-term Power Market in India, 2010-11 Page 22
The trends in price of electricity transacted through trading licensees (bilateral trader
transactions) have been studied separately for total transactions as well as the transactions
undertaken Round the Clock (RTC), during Peak, and during Off-peak periods.
Table-11: Price of Short-term Transactions of Electricity (`/KWh)
Period Bilateral through Traders Power Exchange UI
RTC Peak Off-peak
Total IEX PXIL NEW Grid
SR Grid
Apr-10 5.68 6.62 5.72 5.74 7.75 7.43 7.75 6.66
May-10 6.26 6.39 5.88 6.17 4.54 4.65 5.14 4.25
Jun-10 3.23 7.28 5.59 5.59 3.50 3.47 3.61 4.67
Jul-10 4.97 5.89 5.02 4.98 3.36 3.23 4.11 3.95
Aug-10 4.86 4.80 5.34 4.92 3.41 3.52 3.45 4.91
Sep-10 4.71 2.20 4.90 4.73 2.53 2.82 2.02 3.38
Oct-10 3.90 4.97 4.23 4.00 2.73 3.00 2.27 3.25
Nov-10 3.92 4.88 3.81 3.91 2.04 2.65 1.79 2.46
Dec-10 4.12 4.86 3.46 3.95 2.47 2.99 2.54 2.64
Jan-11 4.12 5.13 3.55 4.00 3.44 3.66 3.29 3.48
Feb-11 4.22 5.91 3.98 4.24 3.88 4.54 3.00 5.16
Mar-11 4.65 5.64 4.79 4.67 3.34 5.13 3.12 7.00
It is observed from the above Chart that the price of electricity transacted through
trading licensees was relatively high when compared with the price of electricity transacted
through power exchanges and UI during the period May 2010 to February 2011. It is also
0.00
1.00
2.00
3.00
4.00
5.00
6.00
7.00
8.00
9.00
Pri
ce (`/
kWh
)
Chart-10: Comparison of price of Bilateral, Power Exchange and UI transactions in 2010-11
Price of Bilateral Transactions Price of Power Exchange Transactions
Price of UI Transactions

Report on Short-term Power Market in India, 2010-11 Page 23
observed that there was divergence of prices of power transacted through different short term
segments in the month of April 2010 and March 2011.
The trends in price of electricity transacted by trading licensees during RTC, Peak and
Off-peak periods are shown in Chart-11. The price of electricity transacted during peak RTC
and Off-peak periods shows a slight declining trend. In the month of September 2010, the
price during peak period is very low when compared with the price during RTC and off peak
periods. This is mainly for the reason that the volume of electricity transacted during peak
period was very less (5.7 MU) and it was sourced from hydro generation.
2.3 Time of the day variation in Volume and Price of Electricity transacted through
Power Exchanges (Day Ahead Market Sub-Segment) and Traders
Time of the day variation in volume and price of electricity transacted through
bilateral trader transactions is shown in Chart-12. The volume of the traders represents inter-
state transaction volume i.e. excluding banking transaction volume. Time of the day variation
in volume is shown during RTC (Round the Clock), Peak period and other than RTC & Peak
period. Of the total volume, 79% of the volume has been transacted during RTC followed by
19% exclusively during Other than RTC & peak and only about 2% exclusively during Peak
period. It is observed from the chart that there is hardly any volume transacted exclusively
during peak period. It is also observed that the price during peak period is high (`5.59/kWh),
as expected, when compared with the price during RTC and other than RTC & Peak period.
0.001.002.003.004.005.006.007.00
Pri
ce `
/(kW
h)
Chart-11: Price of Electricity Transacted through Traders during Round the Clock, Peak and Off Peak periods
RTC Peak Off-peak

Report on Short-term Power Market in India, 2010-11 Page 24
Time of the day variation in volume and price of electricity transacted through IEX
and PXIL is shown in Chart-13 & Chart-14. Time of the day variation in volume and price of
electricity transacted through power exchanges is shown hour-wise. It is observed from the
charts that during Peak period (between hour 18 to 24), the price in both the exchanges is
high when compared with the rest of the hours. It is also observed that volume of electricity
transacted in PXIL during Peak period is high when compared with the rest of the hours
which shows that there is more demand during peak period. On the other hand, the volume of
electricity transacted in IEX during evening peak hours is relatively lower compared to other
periods.
16245.87
494.84
3915.464.69
5.59
4.74
4.20
4.40
4.60
4.80
5.00
5.20
5.40
5.60
5.80
0
2000
4000
6000
8000
10000
12000
14000
16000
18000
RTC Peak OTP
Pri
ce in
`/k
Wh
Vo
lum
e (
MU
)
Type of Transaction
Chart-12: Volume (excluding banking) and Price of Electricity Transacted through Traders during RTC, Peak and Other Than RTC &
Peak, 2010-11
0.00
1.00
2.00
3.00
4.00
5.00
6.00
0.00
100.00
200.00
300.00
400.00
500.00
600.00
1 2 3 4 5 6 7 8 9 10 11 12 13 14 15 16 17 18 19 20 21 22 23 24
Pri
ce `
/kW
h
Vo
lum
e (
MU
)
Hours During the Day
Chart-13: Hour-wise Area Clearing Volume and Price in IEX during 2010-11
Area Clearing Volume (ACV) Area Clearing Price (ACP)

Report on Short-term Power Market in India, 2010-11 Page 25
2.4 Volume of Electricity Transacted in Various Price Slabs
Volume of electricity transacted in various price slabs is shown for bilateral trader
and power exchange segments separately. In the case of power exchanges, it is the Day
Ahead Market sub-segment that has been considered.
Cumulative volume and price of bilateral trader segment transactions in 2010-11 is
depicted in the following chart (Chart -15). The chart shows that only 22% of the volume of
electricity through traders has been transacted at the price less than `4/kWh. It is observed
from the chart that 81% of the volume has been transacted at the price of less than `6/kWh.
0.00
1.00
2.00
3.00
4.00
5.00
6.00
0.00
20.00
40.00
60.00
80.00
100.00
1 2 3 4 5 6 7 8 9 10 11 12 13 14 15 16 17 18 19 20 21 22 23 24
Pri
ce `
/kW
h
Vo
lum
e (
MU
)Chart -14: Hour-wise Area Clearing Volume and Price in PXIL in 2010-
11
Area Clearing Volume (ACV) Weighted Average Area Clearing Price (ACP)
0-2 2-3 3-4 4-5 5-6 6-7 7-8 8-9 9-10Above
10
Cumulative Volume % 0% 4% 22% 58% 81% 95% 100% 100% 100% 100%
Volume in Price Range (%) 0% 4% 18% 36% 23% 14% 5% 0% 0% 0%
0%
5%
10%
15%
20%
25%
30%
35%
40%
0%
20%
40%
60%
80%
100%
120%
Vo
lum
e in
Pri
ce R
ange
(%
)
Cu
mu
lati
ve V
olu
me
(%
)
Chart-15: Percentage of Bilateral Transaction Volume and Price Slabs, 2010-11

Report on Short-term Power Market in India, 2010-11 Page 26
Cumulative volume and price of IEX Transactions in 2010-11 is depicted in the
following chart (Chart -16). The chart shows that 73% of the volume of electricity in IEX has
been transacted at the price less than `4/kWh.
Cumulative volume and price of PXIL Transactions in 2010-11 is depicted in the
following chart (Chart -17). The chart shows that 67% of the volume of electricity in PXI has
been transacted at the price less than `4/kWh.
0-2 2-3 3-4 4-5 5-6 6-7 7-8 8-9 9-1010-11
11-12
12-13
13-14
14-15
15-16
18-19
Cumulative Volume (MU) 18% 49% 73% 86% 90% 93% 95% 97% 98% 99% 99% 100%100%100%100%100%
Volume in Price Range (MU) 18% 32% 23% 13% 5% 3% 2% 2% 1% 1% 1% 0% 0% 0% 0% 0%
0%
5%
10%
15%
20%
25%
30%
35%
0%
20%
40%
60%
80%
100%
120%
Chart 16: Percentage of IEX Transaction Volume and Price Slabs
0-2 2-3 3-4 4-5 5-6 6-7 7-8 8-9 9-10 10-11 11-12 12-13 13-14
Cumulative Volume (MU) 10% 42% 67% 82% 90% 93% 96% 97% 98% 99% 100% 100% 100%
Volume in Price Range (MU) 10% 32% 25% 15% 7% 3% 3% 1% 1% 1% 1% 0% 0%
0%
5%
10%
15%
20%
25%
30%
35%
0%
20%
40%
60%
80%
100%
120%
Chart 17: Percentage of PXIL Transaction Volume and Price Slabs

Report on Short-term Power Market in India, 2010-11 Page 27
2.5 Trading Margin charged by Trading Licensees for Bilateral Transactions during
2010-11
As per the Central Electricity Regulatory Commission (Fixation of Trading Margin)
Regulations, 2010, the trading licensees are allowed to charge trading margin up to 7
paise/kWh in case the sale price is exceeding `3/kWh and 4 paise/kWh where the sale price is
less than or equal to `3/kWh.
Average trading margin charged by the trading licensees for bilateral transactions
during 2010-11 is provided in Table-12 below.
Table-12: Average Trading Margin Charged by Trading Licensees during 2010-11
Sale Price of Electricity Transacted by
Trading Licensees (`/kWh)
Average Trading Margin charged by
Trading Licensees (Paise/kWh)
when sale price is less than or equal to
`3/kWh 4.00
when sale price is greater than `3/kWh 4.81
3-4 5.74
4-5 4.68
5-6 4.57
6-7 4.73
7-8 5.36
8-9 6.43
9-10 4.00
> 10 7.00
Note: Average trading margin computed based on all Inter-state Trading Transactions
excluding Banking Transactions.
3. Daily trends in short-term transactions of electricity (1st April 10 to 31
st March 11)
3.1 Volume of Short-term transactions of Electricity
Trends in daily volume of short-term transactions are shown in Chart-18. It is
observed from the chart that there is an increasing trend in the volume of electricity
transacted through power exchanges during the year 2010-11.

Report on Short-term Power Market in India, 2010-11 Page 28
3.2 Price of Short-term transactions of Electricity
Trends in daily price of short-term transactions are shown for transactions of power
exchanges and UI.
3.2.1 Trends in price of electricity transacted through Power Exchanges
The weighted average price of electricity transacted through IEX and its volatility is
shown in Chart-19. Volatility in the Price of electricity transacted through IEX has been
computed using daily data for the year 2010-11 and it was 11.97%. (See Annexure-II for
historic volatility formula).
0.0020.0040.0060.0080.00
100.00120.00140.00160.00180.00
1-A
pr-
10
22
-Ap
r-1
0
13
-May
-10
3-J
un
-10
24
-Ju
n-1
0
15
-Ju
l-1
0
5-A
ug-
10
26
-Au
g-1
0
16
-Sep
-10
7-O
ct-1
0
28
-Oct
-10
18
-No
v-1
0
9-D
ec-1
0
30
-Dec
-10
20
-Jan
-11
10
-Feb
-11
3-M
ar-1
1
24
-Mar
-11
Vo
lum
e (
MU
)Chart 18: Volume of Short-term Transactions of Electricity, 2010-11
Bilateral Transactions (Traders+Direct) PX Transactions (IEX+PXIL) UI Transactions
-200%
-150%
-100%
-50%
0%
50%
100%
150%
200%
0.001.002.003.004.005.006.007.008.009.00
10.0011.0012.0013.0014.00
01
/04
/10
15
/04
/10
29
/04
/10
13
/05
/10
27
/05
/10
10
/06
/10
24
/06
/10
08
/07
/10
22
/07
/10
05
/08
/10
19
/08
/10
02
/09
/10
16
/09
/10
30
/09
/10
14
/10
/10
28
/10
/10
11
/11
/10
25
/11
/10
09
/12
/10
23
/12
/10
06
/01
/11
20
/01
/11
03
/02
/11
17
/02
/11
03
/03
/11
17
/03
/11
31
/03
/11
Vo
lati
lity
(%)
Pri
ce (`
/kw
h)
Chart 19: Price and its Volatility in IEX during 2010-11
Price Volatility

Report on Short-term Power Market in India, 2010-11 Page 29
The weighted average price of electricity transacted through PXI and its volatility is
shown in Chart-20. Volatility in the Price of electricity transacted through PXI has been
computed using daily data for the year 2010-11 and it was 12.08%.
3.2.2 Trends in price of electricity transacted through UI
Trends in daily price of electricity transacted through UI, i.e. in the New Grid and SR
Grid, are shown in Chart-21.
-200%
-150%
-100%
-50%
0%
50%
100%
150%
200%
0.001.002.003.004.005.006.007.008.009.00
10.0011.0012.0013.0014.00
01
/04
/10
15
/04
/10
29
/04
/10
13
/05
/10
27
/05
/10
10
/06
/10
24
/06
/10
08
/07
/10
22
/07
/10
05
/08
/10
19
/08
/10
02
/09
/10
16
/09
/10
30
/09
/10
14
/10
/10
28
/10
/10
11
/11
/10
25
/11
/10
09
/12
/10
23
/12
/10
06
/01
/11
20
/01
/11
03
/02
/11
17
/02
/11
03
/03
/11
17
/03
/11
31
/03
/11
Vo
lati
lity
(%)
Pri
ce (`
/kw
h)
Chart-20: Price and its Volatility in PXIL during 2010-11
Price Volatility
0.00
2.00
4.00
6.00
8.00
10.00
12.00
14.00
UI P
rice
(`/
Kw
h)
Chart-21: Daily Price of Electricity Transacted through UI during 2010-11
Average Price of UI (NEW Grid) Average Price of UI (SR Grid)

Report on Short-term Power Market in India, 2010-11 Page 30
It is observed from the above chart that there was divergence in the price of UI in the
NEW Grid and SR Grid in the last two months (with prices in SR Grid registering higher
levels than price in the NEW Gris) and that there was convergence in the price of UI in the
rest of the months. The divergence was due to higher demand in the two Southern states of
Tamil Nadu and Kerala due to state elections.
4. Analysis of open access consumers on power exchanges (Day Ahead Market Sub-
Segment)
The year witnessed significant development in the process of procurement of power
by the industrial sector consumers through power exchanges (collective open access
transactions). It is observed that, as of end March 2010-11, 825 Open Access (OA)
Consumers were procuring part of their power requirements through IEX. These consumers
were mostly located in Punjab, Tamil Nadu, Haryana, Rajasthan and Madhya Pradesh.
During the year, these OA consumers procured a total of about 4056 MU of electricity
through IEX. In 2010-11, the weighted average price of electricity bought by open access
consumers at IEX was lower (`2.72/kWh) when compared with the weighted average price of
total electricity transacted through IEX (`3.38/kWh).
In Table-13 & Chart-22, a monthly comparison is made between number of open
access consumer participation and total number of portfolios in IEX. In Table-14 & Chart-23,
a monthly comparison is shown between purchase volume of open access consumers and
total volume of IEX. It is seen that the number of OA consumers as a percentage of total
number of portfolios in IEX has steadily gone up from about 80% at the beginning of the year
in April 2010 to about 95% at the end of the year in March 2011. The volumes procured by
OA consumers as a percentage of total volume transacted in IEX, however, has gone up
dramatically as the year progressed – starting with mere 2.8 % in April 2010 to 36.6% by the
end of the year in March 2011. In between, in the months of November and December 2010,
the percentage of total volume procured by OA consumers was about 63% and 56% of total
volume transacted in respective months. For the year as a whole, volume procured by OA
consumers as a percentage of total volume transacted in IEX was about 34.38%.

Report on Short-term Power Market in India, 2010-11 Page 31
Table-13: Number of Open Access Consumers in IEX, 2010-11
Month No. of Open Access
Consumers
Total No. of
Portfolios in IEX
% of Open Access
Consumers
Apr-10 178 222 80.18%
May-10 216 259 83.40%
Jun-10 255 296 86.15%
Jul-10 338 381 88.71%
Aug-10 403 442 91.18%
Sep-10 480 519 92.49%
Oct-10 586 627 93.46%
Nov-10 665 704 94.46%
Dec-10 726 761 95.40%
Jan-11 770 806 95.53%
Feb-11 793 830 95.54%
Mar-11 825 863 95.60%
Table-14: Volume Participation of Open Access Consumers in IEX Day Ahead
Market in 2010-11
Month OAC Purchase
Volume (MUs)
IEX Total Volume
(MUs)
% OAC Purchase
Participation
Apr-10 15.96 563.54 2.83%
May-10 88.07 591.86 14.88%
Jun-10 153.68 748.39 20.54%
Jul-10 189.58 888.05 21.35%
Aug-10 242.96 1181.30 20.57%
Sep-10 403.01 1127.85 35.73%
Oct-10 433.07 1089.46 39.75%
Nov-10 542.75 865.62 62.70%
0
200
400
600
800
1000
Chart -22: Participation of Opea Access Consumers in IEX, 2010-11
No. of Open Access Consumers Total No. of Portfolios in IEX

Report on Short-term Power Market in India, 2010-11 Page 32
Dec-10 625.98 1121.37 55.82%
Jan-11 512.10 1205.64 42.48%
Feb-11 390.84 1163.61 33.59%
Mar-11 458.51 1253.88 36.57%
Total 4056.51 11800.58 34.38%
About 155 Open Access Consumers were procuring part of their power requirements
through PXIL. These consumers were mostly located in Tamil Nadu, Punjab and Rajasthan.
During the year, these OA consumers procured a total of about 93 MU of electricity through
PXIL. In 2010-11, the weighted average price of electricity bought by open access consumers
at PXIL was lower (`3.62/kWh) when compared with the weighted average price of total
electricity transacted through PXIL (`3.87/kWh).
In Table-15 & Chart-24, a monthly comparison is made between number of open
access consumer participation and total number of portfolios in PXIL. In Table-16 & Chart-
25, a monthly comparison is shown between purchase volume of open access consumers and
total volume of PXIL. It is seen that the number of OA consumers as a percentage of total
number of portfolios in PXIL has steadily gone up from about 73% at the beginning of the
year in April 2010 to about 89.5 % at the end of the year in March 2011. Surprisingly,
however, as per the data from PXIL, it is seen that it is only from the month of October 2010
that OA consumers started procuring power in PXIL. Like IEX, however, once OA
consumers started their procurement in PXIL, here too the volumes procured by OA
consumers as a percentage of total volume transacted in PXIL went up rapidly – starting with
0.00
200.00
400.00
600.00
800.00
1000.00
1200.00
1400.00
Vo
lum
e (
MU
)
Chart-23: Open Access Consumer Purchase Volume and IEX Total Volume, 2010-11
OAC Purchase Volume (MUs) IEX Total Volume (MUs)

Report on Short-term Power Market in India, 2010-11 Page 33
mere 1.9 % in October 2010, the percentage of total volume procured by OA consumers went
up to as much as 6.2% by the end of the year in March 2011. In between, in the month of
December 2010, the percentage of total volume procured by OA consumers was about 21%.
For the year as a whole, volume procured by OA consumers as a percentage of total volume
transacted in PXIL was about 5.33 %.
Table-15: Number of Open Access Consumers in PXIL, 2010-11
Month No. of Open Access
Consumers
Total No. of Portfolios
in PXIL
% of Open Access
Consumers
Apr-10 41 56 73.21%
May-10 43 58 74.14%
Jun-10 45 61 73.77%
Jul-10 46 62 74.19%
Aug-10 47 64 73.44%
Sep-10 53 70 75.71%
Oct-10 59 77 76.62%
Nov-10 102 120 85.00%
Dec-10 137 155 88.39%
Jan-11 155 173 89.60%
Feb-11 164 184 89.13%
Mar-11 170 190 89.47%
0
20
40
60
80
100
120
140
160
180
200
Chart-24: Open Access Consumer Participation in PXIL, 2010-11
No. of Open Access Consumers Total No. of Portfolios in PXIL

Report on Short-term Power Market in India, 2010-11 Page 34
Table-16: Volume Participation of Open Access Consumers in Day Ahead Market
of PXIL in 2010-11
Month OAC Purchase
Volume (MUs)
PX Total Volume
(MUs)
% OAC Purchase
Participation
Apr-10 0.00 80.77 0.00%
May-10 0.00 78.53 0.00%
Jun-10 0.00 142.25 0.00%
Jul-10 0.00 155.19 0.00%
Aug-10 0.00 219.44 0.00%
Sep-10 0.00 117.80 0.00%
Oct-10 2.08 112.31 1.86%
Nov-10 11.17 76.22 14.66%
Dec-10 29.57 138.60 21.34%
Jan-11 25.89 222.14 11.66%
Feb-11 13.53 227.90 5.94%
Mar-11 10.47 169.01 6.19%
Total 92.72 1740.17 5.33%
5. Major Sellers and Buyers of Electricity through Licensed Traders and Power
Exchanges
Table-17 and Table-18 below show top 10 sellers and buyers of electricity through
trading licensees (bilateral trader segment transactions). The same data with respect to IEX is
shown in Table-19 and Table-20 and the same data with respect to PXIL is shown in Table-
21 and Table-22. It is seen that dominant sellers at both, the power exchanges and through
licensed traders, re a mixed group comprising of independent power producers, distribution
0.00
50.00
100.00
150.00
200.00
250.00
Vo
lum
e (
MU
)
Chart -25: Open Access Consumer Purchase Volume and PXIL
Total Volume, 2010-11
OAC Purchase Volume (MUs) PX Total Volume (MUs)

Report on Short-term Power Market in India, 2010-11 Page 35
companies, state government agencies/bodies, and captive power plants. The major buyers
through trading licensees and at power exchanges are mostly Northern and Southern region
distribution companies and state electricity boards.
Table-17: Major Sellers of Electricity through Bilateral Trader Segment (Trading
Licensees) in 2010-11
S.No Seller State Volume
(MU)
Approximate
percentage
of total
volume
transacted
through
traders
Weighted
Average
Sale Price
in `/kWh
1 LANCO +
LAPL+LKPPL
Chhattisgarh +
Andhra Pradesh
2949.62 16.33% 4.71
2 Government of
Himachal Pradesh
Himachal
Pradesh
2807.24 15.54% 5.06
3 JPL Chhattisgarh 2200.14 12.18% 4.66
4 JSWEL Karnataka 1363.27 7.55% 4.76
5 SPDC J&K Jammu &
Kashmir
1349.19 7.47% 4.13
6 Torrent Power Limited Gujarat 984.78 5.45% 4.81
7 CSPTCL Chhattisgarh 911.60 5.05% 4.52
8 Adani Power Limited Gujarat 806.80 4.47% 4.85
9 NBVL Orissa + Andhra
Pradesh
741.72 4.11% 4.67
10 BALCO Chhattisgarh 719.92 3.99% 4.91
Note: Volume sold by major sellers and total volume transacted through trading licensees
does not include the volume through banking arrangement.
Table-18: Major Buyers of Electricity through Bilateral Trader Segment (Trading
Licensees) in 2010-11
S.No Buyer State Volume
(MU)
Approximate
percentage of
total volume
transacted
through traders
Weighted
Average
Purchase
Price in
`/kWh
1 BESCOM Karnataka 2329.53 11.60% 4.57
2 PSEB Punjab 2293.37 11.42% 5.28
3 TNEB Tamil Nadu 2184.30 10.88% 5.36
4 APPCC Andhra Pradesh 1679.63 8.36% 5.09
5 MSEDCL Maharashtra 1191.29 5.93% 4.77
6 HPSEB Himachal Pradesh 1116.62 5.56% 3.30
7 HPPC Haryana 1107.27 5.51% 5.01

Report on Short-term Power Market in India, 2010-11 Page 36
8 NDPL Delhi 925.74 4.61% 6.02
9 BRPL Delhi 798.13 3.97% 5.87
10 PSPCL Punjab 776.87 3.87% 4.51
Note: Volume bought by major buyers and total volume transacted through trading licensees
does not include the volume through banking arrangement.
From the above Table-18 it is seen that major buyers such as PSEB, TNEB, APPCC,
HPPC, NDPL and BRPL have bought electricity from traders under bilateral transactions at
weighted average prices which were higher than the weighted average price for the entire
bilateral trader segment, which was `4.79/kWh
Table-19: Major Sellers of Electricity in the Day Ahead Market in IEX, 2010-11
S.No. Name of Seller State Sell
Volume
(MU)
Percentage of
the Total
Volume
Transacted
in IEX
Weighted
Average
Sell Price
(`/KWh)
1 GUVNL Gujarat 1541.54 13.06% 3.81
2 BRPL Delhi 951.56 8.06% 3.31
3 CGSEB Chhattisgarh 791.09 6.70% 2.64
4
Torrent Power,
Sugen
Gujarat
651.29 5.52% 3.63
5 BYPL Delhi 618.61 5.24% 3.40
6 BALCO Chhattisgarh 528.83 4.48% 2.89
7 WBSEDCL West Bengal 483.79 4.10% 3.07
8
Government of
Himachal Pradesh
Himachal
Pradesh 458.70 3.89% 3.36
9
LANCO
Kondapalli Power
Andhra Pradesh
401.09 3.40% 3.77
10 JPL Jindal Power 397.93 3.37% 2.83
Note: Total Volume transacted through Day Ahead Market in IEX was about 11800 MU.
Table-20: Major Buyers of Electricity in the Day Ahead Market in IEX, 2010-11
S.No. Name of
Buyer
State Buy
Volume
(MU)
Percentage of the
Total Volume
Transacted in
IEX
Weighted
Average Buy
Price (`/kWh)
1 TNEB Tamil Nadu 2043.57 17.32% 4.95
2 UPPCL Uttar Pradesh 1185.15 10.04% 3.32
3 JVVNL Rajasthan 1136.76 9.63% 4.19
4 MSEDCL Maharashtra 674.70 5.72% 3.70
5 R Infra Maharashtra 641.65 5.44% 3.62

Report on Short-term Power Market in India, 2010-11 Page 37
6 HPPC Haryana 440.56 3.73% 5.31
7 JSL Ltd Haryana 384.28 3.26% 2.43
8 APCPDCL Andhra
Pradesh
262.87 2.23% 4.42
9 KSEB Kerala 215.30 1.82% 3.71
10 Torrent
Power, Surat
Gujarat 200.58 1.70% 4.30
Note: Total Volume transacted through IEX was about 11800 MU.
From the above Table-20 it is seen that major buyers such as Tamil Nadu, UPPCL,
APPCC, JVVNL, MSEDCL, HPPC, APCPDCL and KSEB were able to procure electricity
from IEX day ahead market at weighted average prices which were higher than the weighted
average price for the entire day ahead market in IEX, which was `3.38/kWh
Table-21: Major Sellers of Electricity in the Day Ahead Market in PXIL, 2010-11
Sr.
No
Name of the Seller State Sell
Volume
(MU)
Percentage
of the
Total
Volume
Transacted
in PXIL
Weighted
Average
Sell Price
(`/kWh)
1 GUVNL GUJARAT 962.5744 55.31% 3.77
2 CSPTCL CHHATTISGARH 156.4561 8.99% 2.56
3 APTRANSCO ANDRA PRADESH 87.1786 5.01% 3.51
4 Uttarakhand Power
Company
UTTARAKHAND 72.8866 4.19% 2.44
5 BYPL DELHI 51.9797 2.99% 2.82
6 BRPL DELHI 44.6012 2.56% 3.49
7 HPSEB HIMACHAL
PRADESH
44.1187 2.54% 2.61
8 WBSEDCL WEST BENGAL 39.6440 2.28% 3.41
9 LANCO,
Kondapalli
ANDRA PRADESH 34.1623 1.96% 5.63
10 GEL ANDRA PRADESH 33.2685 1.91% 3.74
Note: Total Volume transacted in the Day Ahead Market in PXIL was about 1740 MU.

Report on Short-term Power Market in India, 2010-11 Page 38
Table-22: Major Buyers of Electricity in Day Ahead Market in PXIL, 2010-11
Sr.
No
Name of the
Buyer
State Buy
Volume
(MU)
Percentage
of the Total
Volume
Transacted
Weighted
Average
Buy Price
(`/kWh)
1 TNEB TAMILNADU 560.92 32.23% 4.83
2 RPPC RAJASTHAN 309.46 17.78% 4.11
3 UPPCL UTTAR PRADESH 283.38 16.28% 3.28
4 KSEB KERALA 201.91 11.60% 3.53
5 APTRANSCO ANDRA PRADESH 101.57 5.84% 4.80
6 TPC D MUMBAI 62.56 3.59% 3.05
7 Wardha Power
Company Ltd
MAHARASHTRA 40.89 2.35% 3.81
8 PCKL KARNATAKA 21.18 1.22% 3.81
9 MPPTCL MADHYA PRADESH 19.38 1.11% 3.02
10 NDPL DELHI 16.65 0.96% 7.07
Note: Total Volume transacted through PXIL was about 1740 MU.
From the above Table-22 it is seen that major buyers such as NDPL, Tamil Nadu,
Rajasthan, and APTRANSCO were able to procure electricity from IEX Day Ahead Market
at weighted average prices which were higher than the weighted average price for the entire
day ahead market in IEX, which was `Rs. 3.87/kWh.
6. Effect of congestion on Volume of Electricity Transacted through Power Exchanges
The volume of electricity transacted/sold through power exchanges is sometimes
constrained due to transmission congestion. The details of congestion in both the power
exchanges are shown in Table-23.
During 2010-11, in IEX, the unconstrained cleared volume and the actual volume
transacted was 12.26 billion kWh and 11.80 billion kWh respectively. This is indicating that
the actual transacted volume could have been about 3.94 percent higher had there been no
congestion present in the system. During the same year, in PXIL, the unconstrained cleared
volume and the actual volume transacted was 2.01 billion kWh and 1.74 billion kWh
respectively. This is indicating that the actual transacted volume could have been about 15.45
percent higher had there been no congestion present in the system.
Congestion, consequent market splitting and the resultant difference in market prices
in different regions give rise to congestion amount. This congestion amount is being

Report on Short-term Power Market in India, 2010-11 Page 39
deposited in to the Power System Development Fund, created pursuant to CERC (Power
System Development Fund) Regulations, 2010. Congestion in power exchanges thus, apart
from affecting the volume, also results in formation of a fund. The congestion
revenue/amount as of 31st March 2011 was `457.04 crore.
Table-23: Details of Congestion in Power Exchanges, 2010-11
Details of Congestion IEX PXIL
A Unconstrained Cleared Volume* (MU) 12264.46 2009.09
B Actual Cleared Volume and hence scheduled (MU) 11800.57 1740.17
C Volume of electricity that could not be cleared and
hence not scheduled because of congestion (MU)
(A-B)
463.90 268.93
D Volume of electricity that could not be cleared as %
to Actual Cleared Volume
3.93% 15.45%
* This power would have been scheduled had there been no congestion.
7. Comparison of short term prices with Tariffs of long term sources of power for
various distribution companies
It is seen that short term market, including UI, power transacted through licensed
traders (inter-state part), bilateral power transactions directly between DISCOMs, and power
transacted through power exchanges met about 10 percent of the power requirement of the
distribution companies in the year 2010-11. The balance i.e., about 90 percent of the power
requirement of the distribution companies in the country was met from power procured under
long term contracts from state and central government owned power generating companies
and independent power producers (also intra-state power purchases from traders under
bilateral transactions). The central government power generating companies in 2010-11,
accounted for about 43 percent of the total power generation in the country. From the data
presented earlier, it is seen that during the year 2010-11, the weighted average cost of
electricity procured through different segments of short term power market was as follows:

Report on Short-term Power Market in India, 2010-11 Page 40
Table-24: Price of Short-Term Transactions of Electricity in 2010-11
Description Price (`/kWh)
Weighted average price of power procured through Power
exchanges
3.47
Weighted average price of power procured through Traders 4.79
Weighted average price of power procured through Traders and
Power exchanges
4.32
Average price of power through UI 3.91
Combined weighted average price of electricity procured UI,
traders, and power exchanges
4.15
The distribution companies thus paid about ` 4.32 for procuring one unit of electricity
through short term market, if UI is excluded and about ` 4.15 per unit if UI is included.
As against this, the prices paid by distribution companies to procure power from
central government owned generating companies (about 43 percent of total generation in the
country) for the year 2010-11 (under long term Power Purchase Agreements) are shown in
Table-25 and 26. It is seen that, on an average, the distribution companies paid between `1.29
and `3.71 per kWh for procuring power from coal and lignite based stations, between `2.50
and `5.95 per kWh for procuring power from gas/RLNG based power stations, between
`8.27 and `10.14 per kWh for liquid fuel based power stations (Table-25), and between `0.56
per kWh and `6.01 per kWh for procuring power from hydro stations (Table-26).
From Table-27, it is also seen that the levelised tariff for power long term available
from power projects bid in the year 2010 under Case I varies in the range of `2.35 per kWh to
`3.28 per kWh.

Report on Short-term Power Market in India, 2010-11 Page 41
Table-25: Tariff of Thermal Generating Stations of NTPC, NLC and NEEPCO, 2010-
11
Sl.
No.
Name of the
Generating Station
Installed
Capacity
(MW) as
on
31.3.2010
Fixed
charges
(Paise/kWh)
Energy
Charges
(Paise/kWh)
as on
March, 2011
Total
(Paise/kWh)
I: Coal Based thermal generating Stations of NTPC
A. Pit head Generating Stations
1 Rihand STPS St-I 1000 50 144 194
2 Rihand STPS St-II 1000 76 153 228
3 Singrauli STPS 2000 26 138 163
4 Vindhyachal STPS St-I 1260 35 156 191
5 Vindhyachal STPS St-II 1000 58 151 209
6 Vindhyachal STPS St-
III
1000 88 151 239
7 Korba STPS 2100 29 100 129
8 Ramagundam STPS St-I
& II
2100 33 152 185
9 Ramagundam STPS St-
III
500 76 225 301
10 Talcher TPS 460 60 60
11 Talcher STPS St-I 1000 58 172 230
12 Talcher STPS St-II 2000 63 172 235
13 Sipat-II 1000 102 77 179
Sub-Total 16420
B. Non-Pit head Generating Stations
14 FGUTPP TPS St-I 420 50 186 236
15 FGUTPP St-II 420 62 187 249
16 FGUTPP St-III 210 104 187 291
17 NCTP Dadri ( stage-I) 840 56 219 275
NCTP Dadri ( stage-II) 490 0 0 0
18 Farrakka STPS 1600 47 282 329
19 Tanda TPS 440 60 243 303
20 Badarpur TPS 705 46 325 371
21 Kahalgaon STPS St-I 840 61 199 260
22 Kahalgaon STPS St-II 1500 50 193 242
23 Simhadri 1000 68 171 238
Sub-Total 8465
Total Coal 24885
II: Using Natural Gas as Fuel
1 Dadri CCGT 830 31 238 270
2 Faridabad 431 61 207 267
3 Anta CCGT 419 34 248 282
4 Auraiya GPS 663 24 237 261
5 Gandhar GPS 657 77 192 269
6 Kawas GPS 656 56 194 250
Total 3657

Report on Short-term Power Market in India, 2010-11 Page 42
III: Using LNG as Fuel
1 Dadri CCGT 830 31 485 516
2 Anta CCGT 419 34 406 440
3 Auraiya GPS 663 24 495 519
4 Gandhar GPS 657 77 518 595
5 Kawas GPS 656 56 527 583
6 Faridabad 431 61 370 430
Total 3226
IV: Using (Naphtha/HSD) as Fuel
1 Dadri CCGT 830 31 795 827
2 Faridabad 431 61 0 0
3 Anta CCGT 419 34 811 845
4 Auraiya GPS 663 24 990 1014
5 Kawas GPS 656 56 0 0
6 Kayamkulam CCGT 360 72 926 998
Total 3359
Note1: For NTPC stations : AFC for 2010-11 , Provisional as approved AFC by CERC for
the period 2008-09
V: Lignite Based thermal generating Stations of NLC
1 TPS-I 600 42 132 174
2 TPS-II Stage-I 630 29 121 150
3 TPS-II Stage-II 840 32 121 153
4 TPS-I (Expansion) 420 91 184 274
Total Lignite 2490
Note2: For NLC TPS-I&II &stage-II : AFC for 2010-11 , Provisional as approved AFC by
CERC for the period 2008-09
Note3: For NLC TPS-I Expansion : AFC for 2010-11 , Approved AFC by CERC for the
period 2009-14
VI: North Eastern Electric Power Corporation Ltd.
1 AGBPP 291 133 137 270
2 AGTPP 84 129 175 304
Total NEEPCO 375
Note4: For AGTPP : AFC for 2010-11 , Approved AFC by CERC for the period 2009-14
Note5: For AGBPP : AFC for 2010-11 , Provisional as approved AFC by CERC for the
period 2008-09

Report on Short-term Power Market in India, 2010-11 Page 43
Table-26: Composite Tariff of Hydro Stations under the purview of CERC,
2009-10
Name of
Generating
Company
Station Installed
Capacity
(MW)
Annual Fixed
Charges
(`/Lakhs)
Composite
Tariff
(`/kWh)
NHPC
1 Baira siul 180 8481.19 1.25
2 Loktak 105 8485.87 2.17
3 Salal 690 17674.23 0.66
4 Tanakpur 123 7462.67 1.89
5 Chamera -I 540 19952.65 1.38
6 Uri-I 480 45062.96 2.00
7 Rangit 60 4860.23 1.65
8 Chamera-II 300 34737.20 2.66
9 Dhauliganga-I 280 26881.76 2.72
10 Dulhasti 390 99656.42 6.01
11 Teesta-V 510 36300.00 1.62
3658
NHDC
1 Indira Sagar 1000 50014.00 2.55
2 Omkareshwar 520 26327.00 2.97
1520
THDC
1 Tehri stage-I 1000 110825.46 3.50
1000
SJVNL
1 Nathpa Jhakri 1500 131243.00 2.16
1500
NEEPCO
1 Khandong 50 1963.28 0.81
2 Kopili Stage-I 200 5767.38 0.56
3 Doyang 75 5850.00 2.95
4 Ranganadi 420 29848.51 1.83
5 Kopili Stage-II 25 1295.11 1.72
770
Total Hydro 8448 2.33
Note: Figures are provisional

Report on Short-term Power Market in India, 2010-11 Page 44
Table-27: Capacity Contracted under Case-I Bidding Route during 2010
State Developer Capacity
(MW)
Fuel Used Levelised Tariff
(`/kWh)
Gujarat KSK Energy 1010 Domestic Coal 2.35
Gujarat Essar 800 Imported Coal 2.80
Gujarat Shapoorji
Pallonji 800 Imported Coal 2.80
Maharashtra Adani 1320 Domestic Coal 3.28
Maharashtra India Bulls 1200 Domestic Coal 3.26
Maharashtra Emco 300 Domestic Coal 2.88

Report on Short-term Power Market in India, 2010-11 Page 45
Annexure-I
List of Trading Licensees as on 31.3.2011 Sr.
No. Name of Licensee Address
Contact
Number Email-ID
1 Tata Power Trading
Company (P) Ltd.
34, Sant Tukaram Road,
Carnac Bunder,
Mumbai-400009
022-67172863
022-67172852
power@tatapowertradi
ng.com
2 Adani Enterprises
Ltd.
Adani House,
Plot No 83, Sector 32,
Institutional Area,
Gurgaon - 122001
0124-2555332
0124-2555555
praveen.tamak@adani.
in,
om
3 PTC India Ltd.
2nd Floor ,NBCC
Towers, 15 Bhikaji
Cama Place, New Delhi-
110066
011 -46026724 [email protected]
4 Reliance Energy
Trading (P) Ltd.
Reliance Energy Center,
Santa Cruz(E), Mumbai-
400055
011-30323444 Mahendrakumar.Garg
@relianceada.com
5
Vinergy
International (P)
Ltd.
Shivsagar Estate,
“A” Block
1st Floor South Wing,
Dr. Annie Besant Road
Worli, Mumbai – 400
018.
022 6653 7221 /
7222/7179
6 NTPC Vidyut
Vyapar Nigam Ltd.
NTPC Bhawan, Core 7,
Scope Complex,
7 Institutional Area,
Lodhi Road,
New Delhi-110003.
011- 24387741
011- 24364775
m
7
National Energy
Trading & Services
Ltd.
B-Block, 10th Floor,
Statesman House,
Barakhamba Road, New
Delhi-110001
011-66035888 rajendran@lancogroup
.com
8 Karam Chand
Thapar & Bros Ltd.
Thapar House, 25
Brabourne Road
,Kolkata, West Bengal-
700001
033- 4005 7000 kctpowertrading@yah
oo.in
9
Subhash Kabini
Power Corporation
Ltd.
8/2 Ulsoor Road,
Bangalore – 560042 080-41229490
in
10 Maheshwari Ispat
Ltd.
D-404, City Centre
Sec - 1, Salt lake City,
Kolkata - 700064
033-
23588985/8993
11 Special Blast Ltd
Nathani Building,
Shastri Chowk,
Raipur-492001(C.G.)
0771 – 4065900 pecpltd@specialblasts.
com

Report on Short-term Power Market in India, 2010-11 Page 46
Sr.
No. Name of Licensee Address
Contact
Number Email-ID
12 Instinct Infra &
Power Ltd.
C-201, Naraina Ind.
Area ,Phase-1, New
Delhi-110028
011-25893432
011-257796209
m
m
13
Essar Electric
Power Development
Corporation Ltd.
Essar House, 11,
Keshavrao Khadye
Marg,Mahalaxmi,
Mimbai – 400034
02266601100 [email protected]
om
14 Suryachakra Power
Corporation (P) Ltd.
725,1st floor, Street
No.11, Himayathnagar,
Hyderabad-500029
040-23550597 [email protected]
om
15 JSW Power Trading
Company Ltd.
Jindal Mansion, 5-A, G
Deshmukh Marg,
Mumbai-400026
011-46191101
hiralal.chaudhary@js
w.in
16 Visa Power Ltd. 9, Shakespeare Sarani,
Kolkata- 700071 033-305191202
paramesh.bhattacharyy
in
17
Pune Power
Development Pvt.
Ltd
Anmol, 25, Yashwant
Nagar,
Range Hill Corner, Pune
– 411007
punepower.power@g
mail.com
18 Ispat Energy Ltd.
202, Town Centre,
Andheri – Kurla Road,
Marol, Andheri (East)
Mumbai – 400059
022-66542222
022-66542398
saurabh_chaturvedi@i
spatind.com
19 Greenko Energies
(P) Ltd.
#1071, Road No. 44,
Jubilee Hills,
Hyderabad - 500033
0771-4266902
040 40301000
04032915858
04032946868
vandanaavidyut@redif
fmail.com
20 Vandana Vidyut
Ltd.
Vandana Bhawan
M.G. Road, Raipur –
492001
Chhattisgarh
077140060000 agmfinance@vanadan
aglobal.com
21 Indrajit Power
Technology (P) Ltd.
1, Pearl Mansion (N),
91, M. Karve Road,
Mumbai-400 020.
022-0418260
022-22006969
rmalegavi@indrainfra.
in
22 Adhunik Alloys &
Power Ltd.
Crescent Tower (3rd
Floor), 229 A.J.C. Bose
Road, Kolkatta-20
033-30915300 vksarawagi@adhunikg
roup.co.in
23 Indiabulls Power
Trading Ltd.
Indiabulls House, 448 –
451,Udyog Vihar,
Phase – V,
Gurgaon – 122001
prashantpanda@india
bulls.com

Report on Short-term Power Market in India, 2010-11 Page 47
Sr.
No. Name of Licensee Address
Contact
Number Email-ID
24
Jindal Power
Trading Company
Ltd.
12, Bhikaiji Cama Place,
New Delhi 110 066,
India
011-1619674
011-
25928038/45
25 RPG Power Trading
Company Ltd.
6th Floor, Agrawal
House, 2 St George Gate
Road,
Kolkatta-700022
033-2109358
033-66252010 [email protected]
26 GMR Energy
Trading Ltd.
IBC- knowledge Park,
Phase 2, 9th Floor,
Tower-D, 4/1,
Bannerghatta Road, Near
Dairy Circle, Bangalore-
560029
080-40432000
080-40432744
sunil.agarwal@gmrgro
up.in
Surajeet.Mukherjee@
gmrgroup.in
27 Jain Energy Ltd.
39, Shakespeare Sarani,
5th Floor, Premlata
Kolkata – 700017
080-40533249 [email protected]
28 Righill Electrics
Ltd.
Righill Electric Pvt Ltd.
5/1 to 5/3, Sector – H,
Industrial Area,
Govindpura,
Bhopal – 462023
0755-4284170
29 Shyam Indus Power
Solutions (P) Ltd.
129, Transport Centre,
Rohtak Road, Punjabi
Bagh,
New Delhi – 110035
pdgoyal@shyamindus.
com
30 Global Energy (P)
Ltd.
1st Floor, Shangri La's
Eros Corporate Plaza, 19
Ashoka Road,
Connaught Place,
New Delhi-11001
011-47334444 [email protected]
31
Knowledge
Infrastructure
Systems (P) Ltd.
G-02, Salcon Aurum
Complex,
4, Commercial Centre,
Jasola,
New Delhi-110076
011-1651074
011-46067070
mahajan@knowledgeg
roup.in
32 Mittal Processors
(P) Ltd.
GF-71,Vardman
Apartment, Abhay
Khand-III, Indira Puram,
Ghaziabad-201010, U.P.
0180-
6612531/532
m
controlroom@mittalgr
oup.com
33 Godavari Power &
Ispat Ltd.
Hira Arcade Pandri,
Raipur,
Chhattisgarh
0771-4082333
tradepower@gpilindia.
com
om
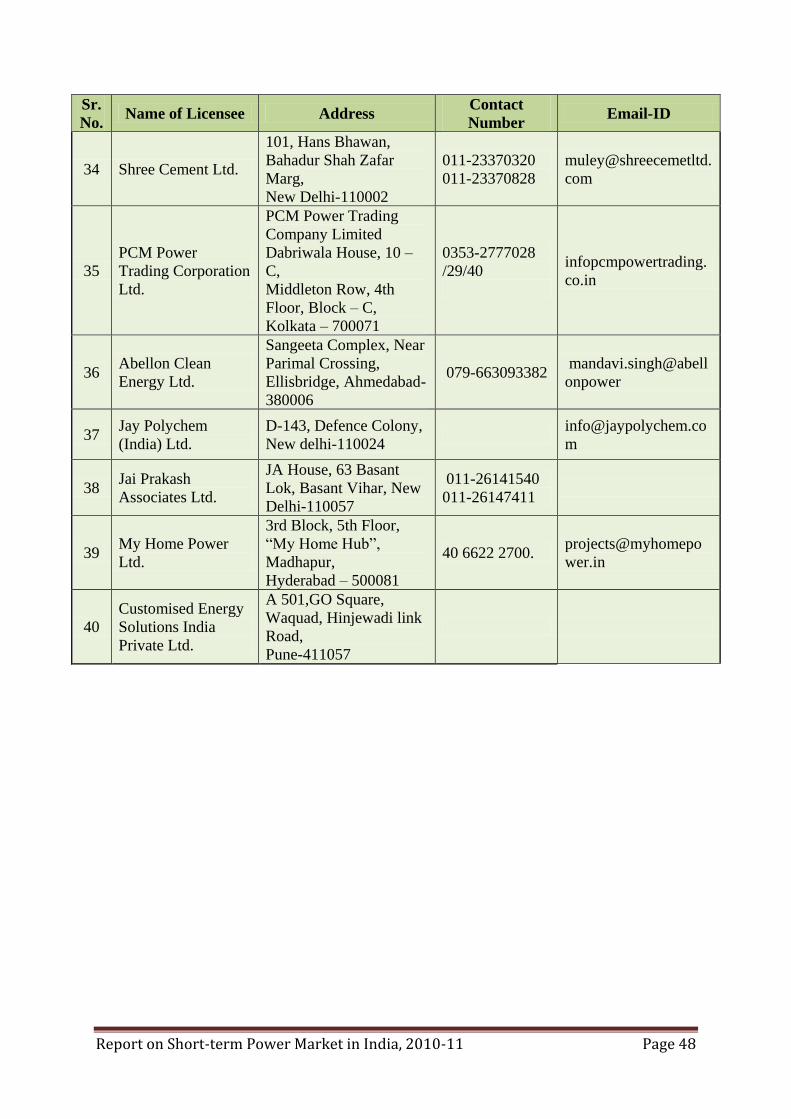
Report on Short-term Power Market in India, 2010-11 Page 48
Sr.
No. Name of Licensee Address
Contact
Number Email-ID
34 Shree Cement Ltd.
101, Hans Bhawan,
Bahadur Shah Zafar
Marg,
New Delhi-110002
011-23370320
011-23370828
muley@shreecemetltd.
com
35
PCM Power
Trading Corporation
Ltd.
PCM Power Trading
Company Limited
Dabriwala House, 10 –
C,
Middleton Row, 4th
Floor, Block – C,
Kolkata – 700071
0353-2777028
/29/40
infopcmpowertrading.
co.in
36 Abellon Clean
Energy Ltd.
Sangeeta Complex, Near
Parimal Crossing,
Ellisbridge, Ahmedabad-
380006
079-663093382 mandavi.singh@abell
onpower
37 Jay Polychem
(India) Ltd.
D-143, Defence Colony,
New delhi-110024
m
38 Jai Prakash
Associates Ltd.
JA House, 63 Basant
Lok, Basant Vihar, New
Delhi-110057
011-26141540
011-26147411
39 My Home Power
Ltd.
3rd Block, 5th Floor,
“My Home Hub”,
Madhapur,
Hyderabad – 500081
40 6622 2700. projects@myhomepo
wer.in
40
Customised Energy
Solutions India
Private Ltd.
A 501,GO Square,
Waquad, Hinjewadi link
Road,
Pune-411057

Report on Short-term Power Market in India, 2010-11 Page 49
Annexure-II
Historic Volatility Calculation Volatility = Standard deviation of daily prices returns.
1. Daily prices returns = Ln (y i / yi-1).
2. y i is price today; y i-1 is price on previous day.
3. Ln is natural logarithm
4. n is the number of observations
5. u is the average daily returns

Report on Short-term Power Market in India, 2010-11 Page 50
Annexure-III
Herfindahl-Hirschman Index (HHI) Calculation
Formula for computing the HHI is as under:
N
HHI = ∑ si2
i =1
where si is the market share of firm i in the market, and N is the number of firms.
The Herfindahl-Hirschman Index (HHI) ranges from 1 / N to one, where N is the
number of firms in the market. Equivalently, if percents are used as whole numbers, as in 75
instead of 0.75, the index can range up to 1002 or 10,000.
A HHI index below 0.01 (or 100) indicates a highly competitive index.
A HHI index below 0.15 (or 1,500) indicates an unconcentrated index.
A HHI index between 0.15 to 0.25 (or 1,500 to 2,500) indicates moderate
concentration.
A HHI index above 0.25 (above 2,500) indicates high concentration.
There is also a normalised Herfindahl index. Whereas the Herfindahl index ranges from
1/N to one, the normalized Herfindahl index ranges from 0 to 1.