report on severe fixed obstructive lung disease in workers ... · pdf filereport on severe...
TRANSCRIPT
Report on Severe Fixed Obstructive Lung Disease in Workers at a Flavoring Manufacturing PlantRichard Kanwal, MD, MPH
Greg Kullman, PhD, CIH
Health Hazard Evaluation ReportHETA 2006-0303-3043Carmi Flavor and Fragrance Company, Inc.Commerce, CaliforniaApril 2007
DEPARTMENT OF HEALTH AND HUMAN SERVICESCenters for Disease Control and Prevention
WorkplaceSafety and Health
National Institute for Occupational Safety and Health
This Health Hazard Evaluation (HHE) report and any recommendations made herein are for the specific facility evaluated and may not be universallyapplicable. Any recommendations made are not to be considered as final statements of NIOSH policy or of any agency or individual involved.Additional HHE reports are available at http://www.cdc.gov/niosh/hhe/reports

For the purpose of informing affected employees, copies of this report shall be posted by the employer in a prominent place accessible to the employees for 30 calendar days.

Page iHealth Hazard Evaluation Report 2006-0303-3043
REPORT Abbreviations ....................................................................... ii
Highlights of the NIOSH Health Hazard Evaluation ............ iii
Summary .............................................................................v
Introduction ..........................................................................1
Assessment .........................................................................3
Results .................................................................................5
Conclusions .......................................................................18
Recommendations .............................................................21
References ........................................................................24
Tables ................................................................................26
Figures ...............................................................................35
CONTENTS
APPENDICES Appendix I
Medical Survey Questionnaire ........................................42
Appendix II
October 2006 Interim Report ..........................................58
Appendix III
Exposure Control Guidance ............................................63
ACKNOWLEDGEMENTS Acknowledgements and Availability of Report ...................75
Page ii Health Hazard Evaluation Report 2006-0303-3043
ACGIH American Conference of Governmental Industrial Hygienists
ATS American Thoracic Society
Cal/OSHA California Department of Industrial Relations’ Division of Occupational Safety and Health
CDHS-OHB California Department of Health Services’ Occupational Health Branch
CT computerized tomography
ERS European Respiratory Society
F degrees Fahrenheit
FEV1 forced expiratory volume in the first second of exhalation
FTIR Fourier transform infrared
FVC forced vital capacity
GM geometric mean
GSD geometric standard deviation
HHE health hazard evaluation
HPLC high performance liquid chromatography
mg/m3 milligrams per cubic meter of air
NHANES III Third National Health and Nutrition Examination Survey
NMAM NIOSH Manual of Analytical Methods
NIOSH National Institute for Occupational Safety and Health
OSHA Occupational Safety and Health Administration
PEL permissible exposure limit
PID photoionization detector
ppm parts per million
ppb parts per billion
PVC polyvinyl chloride
REL recommended exposure limit
STD standard deviation
TWA time-weighted average
VOC volatile organic compound
ABBREVIATIONS

Page iiiHealth Hazard Evaluation Report 2006-0303-3043
On June 11, 2006, CDHS-OHB and Cal/OSHA made a joint request for NIOSH technical assistance with industrial hygiene assessment and medical screening for occupational lung disease risk at the Carmi Flavor and Fragrance Company plant in Commerce, California.
HIGHLIGHTS OF THE NIOSH HEALTH HAZARD EVALUATION
What NIOSH Did
Interviewed workers and measured their lung function with spirometry.
Measured air concentrations of flavoring chemicals in the production room while workers made liquid and powdered flavorings.
Measured air concentrations of flavoring chemicals in other areas of the plant.
What NIOSH Found
Many workers from all areas of the plant reported symptoms of eye and nasal irritation.
Respiratory symptoms were most common in production workers who made powdered flavorings and in laboratory workers.
Respiratory illness was reported more often by production workers who made powdered flavorings than by other workers.
Two former workers and one current worker who made powdered flavorings have severe fixed obstructive lung disease consistent with bronchiolitis obliterans.
Diacetyl air concentrations were highest in the production room when workers filled boxes with butter-flavored powder.
What Carmi Flavor and Fragrance Company Managers Can Do
Install exposure controls in the production room and laboratory.
Require mandatory respirator use by all workers when they are in the production room.
Continue spirometry tests every three months for all workers who enter the production room.
●
●
●
●
●
●
●
●
●
●
●

Page iv Health Hazard Evaluation Report 2006-0303-3043
HIGHLIGHTS OF THE NIOSH HEALTH HAZARD EVALUATION (CONTINUED)
What Carmi Flavor and Fragrance Company Workers Can Do
Wear a respirator with organic vapor cartridges and particulate filters at all times when in the production room.
Report any persistent cough or shortness of breath to your supervisor and your doctor.
●
●Based on our measurements of fl avoring chemicals in the air in all areas of the plant, we found that levels were highest in the production room when workers prepared batches of butter- and vanilla-fl avored powders, especially when workers fi lled boxes with the fi nished product. Among the small number of workers who have made fl avorings at this plant, three workers who made powdered fl avorings have severe obstructive lung disease. We recommend that all workers wear a respirator at all times when they are in the production room, and that management install ventilation and other engineering controls to minimize the amounts of fl avoring chemicals in the plant air.
Page vHealth Hazard Evaluation Report 2006-0303-3043
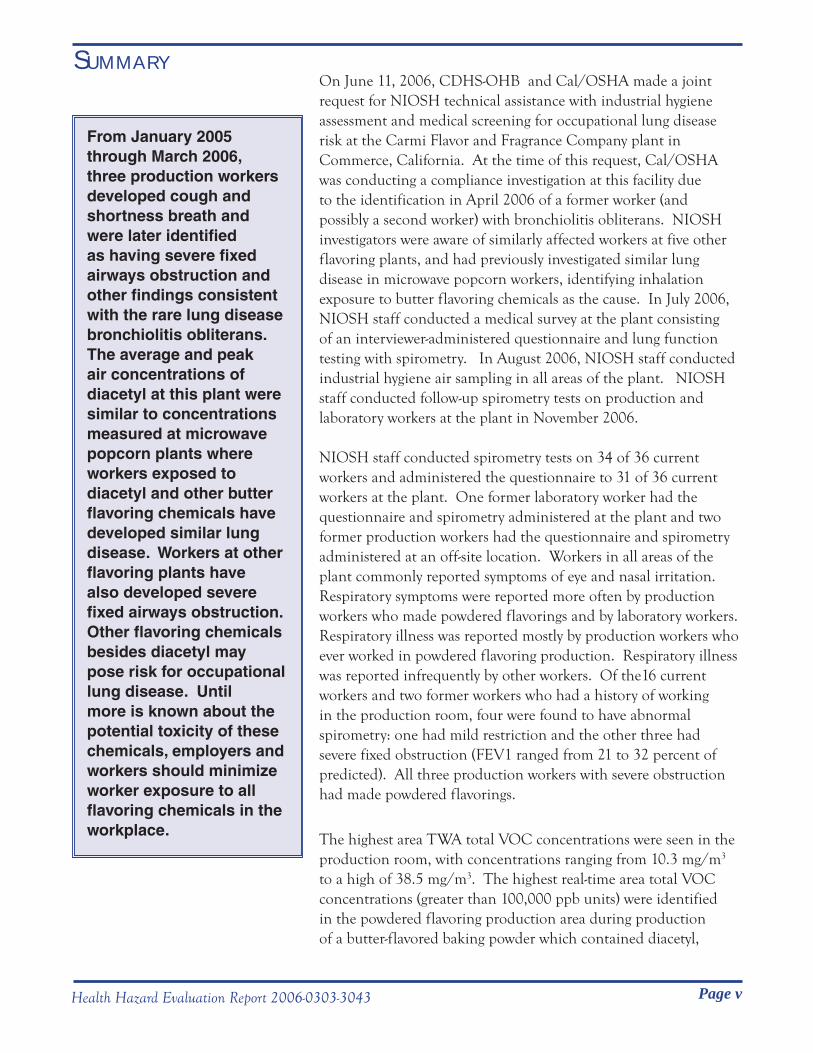
On June 11, 2006, CDHS-OHB and Cal/OSHA made a joint request for NIOSH technical assistance with industrial hygiene assessment and medical screening for occupational lung disease risk at the Carmi Flavor and Fragrance Company plant in Commerce, California. At the time of this request, Cal/OSHA was conducting a compliance investigation at this facility due to the identification in April 2006 of a former worker (and possibly a second worker) with bronchiolitis obliterans. NIOSH investigators were aware of similarly affected workers at five other flavoring plants, and had previously investigated similar lung disease in microwave popcorn workers, identifying inhalation exposure to butter flavoring chemicals as the cause. In July 2006, NIOSH staff conducted a medical survey at the plant consisting of an interviewer-administered questionnaire and lung function testing with spirometry. In August 2006, NIOSH staff conducted industrial hygiene air sampling in all areas of the plant. NIOSH staff conducted follow-up spirometry tests on production and laboratory workers at the plant in November 2006.
NIOSH staff conducted spirometry tests on 34 of 36 current workers and administered the questionnaire to 31 of 36 current workers at the plant. One former laboratory worker had the questionnaire and spirometry administered at the plant and two former production workers had the questionnaire and spirometry administered at an off-site location. Workers in all areas of the plant commonly reported symptoms of eye and nasal irritation. Respiratory symptoms were reported more often by production workers who made powdered flavorings and by laboratory workers. Respiratory illness was reported mostly by production workers who ever worked in powdered flavoring production. Respiratory illness was reported infrequently by other workers. Of the16 current workers and two former workers who had a history of working in the production room, four were found to have abnormal spirometry: one had mild restriction and the other three had severe fixed obstruction (FEV1 ranged from 21 to 32 percent of predicted). All three production workers with severe obstruction had made powdered flavorings.
The highest area TWA total VOC concentrations were seen in the production room, with concentrations ranging from 10.3 mg/m3 to a high of 38.5 mg/m3. The highest real-time area total VOC concentrations (greater than 100,000 ppb units) were identified in the powdered flavoring production area during production of a butter-flavored baking powder which contained diacetyl,
1.
From January 2005 through March 2006, three production workers developed cough and shortness breath and were later identifi ed as having severe fi xed airways obstruction and other fi ndings consistent with the rare lung disease bronchiolitis obliterans. The average and peak air concentrations of diacetyl at this plant were similar to concentrations measured at microwave popcorn plants where workers exposed to diacetyl and other butter fl avoring chemicals have developed similar lung disease. Workers at other fl avoring plants have also developed severe fi xed airways obstruction. Other fl avoring chemicals besides diacetyl may pose risk for occupational lung disease. Until more is known about the potential toxicity of these chemicals, employers and workers should minimize worker exposure to all fl avoring chemicals in the workplace.
SUMMARY

Page vi Health Hazard Evaluation Report 2006-0303-3043
SUMMARY (CONTINUED)specifically when the production worker was filling boxes with the finished product. Some of the highest peak real-time VOC concentrations observed in the liquid flavoring production area may have resulted from migration of contaminants from the powdered flavoring production area. Full-shift personal and area mean TWA diacetyl air concentrations in the liquid flavoring production area were 0.030 ppm and 0.025 ppm respectively, and in the powdered flavoring production area were 0.223 ppm and 0.249 ppm respectively. Partial-shift personal and area mean TWA diacetyl air concentrations in the powdered flavoring production area during the production of butter-flavored and vanilla-flavored powders were 7.76 ppm and 21.2 ppm respectively. Real-time FTIR sampling in the workers’ breathing zones during the production of these butter- and vanilla-flavored powders showed peak diacetyl air concentrations as high as 204 ppm during the packaging of the finished product.
Keywords: NAICS 311930 (Flavoring Syrup and Concentrate Mfr), bronchiolitis, respiratory, fl avorings, diacetyl, airways obstruction
Page 1Health Hazard Evaluation Report 2006-0303-3043
INTRODUCTIONOn June 11, 2006, CDHS-OHB and Cal/OSHA made a joint request for NIOSH technical assistance with industrial hygiene assessment and medical screening for occupational lung disease risk at the Carmi Flavor and Fragrance Company plant in Commerce, California (hereafter referred to as “Carmi Flavors”). At the time of this request, Cal/OSHA was conducting a compliance investigation at this facility due to the identification in April 2006 of a former worker (and possibly a second worker) with bronchiolitis obliterans. Cal/OSHA and CDHS-OHB were also collaborating in a broader effort to assess worker respiratory health and exposures to diacetyl and other chemicals in flavoring plants in California. In late 2004, a worker at another California flavoring plant had been identified as having bronchiolitis obliterans. NIOSH was aware of similarly affected workers at four flavoring plants located in other states [NIOSH 1986; Lockey et al. 2002; two other reports by private physicians to NIOSH]. NIOSH had investigated similar lung disease in microwave popcorn workers and had identified inhalation exposure to butter flavoring chemicals as the cause [Kreiss et al. 2002; Akpinar-Elci et al. 2004; Kanwal et al. 2006].
In January 2005, a 42 year-old non-smoking worker who had made powdered flavorings for seven years at this plant developed a chronic cough. In June 2005, the worker noted shortness of breath on exertion which worsened progressively. In November 2005, spirometry testing showed severe fixed airways obstruction (FEV1 0.55 liters, 18% of predicted). A high resolution CT scan of the chest was interpreted as showing small areas of patchy ground glass opacities in the lungs. The report of a follow-up CT scan described a small amount of scarring in the right lower lobe and lingula (part of the left lung) and indicated that the ground glass opacities had resolved. The report of an open lung biopsy described peribronchial fibrosis and some granulomas. An occupational and pulmonary medicine physician who evaluated this worker favored a diagnosis of bronchiolitis obliterans over hypersensitivity pneumonitis. For the first five to six years that this worker made powdered flavorings, the worker mostly used a small ribbon blender (250-pound capacity). Starting in 2003, the worker started using a large ribbon blender (800-pound capacity) to make larger batches. This worker stopped working in December 2005 due to severe cough and shortness of breath on exertion. Another worker who helped with the production of large batches of powdered flavorings reportedly stopped working in early 2006 due to respiratory symptoms diagnosed as asthma by a physician.
Page 2 Health Hazard Evaluation Report 2006-0303-3043
INTRODUCTION (CONTINUED)Process Description
The Carmi Flavors plant in Commerce, California, produces liquid and powdered flavorings for sale to other companies for use in the production of many different products. The plant has been in production for approximately 20 years. Approximately 700 different flavoring products are produced using over 800 chemical or natural ingredients. The plant consists of a production room, warehouse areas, a laboratory, and offices (see Figure 1, plant diagram). There are approximately 35 workers at the plant, approximately 12 of whom work in production. Several laboratory workers perform product development and quality control tasks.
The production room is a large open space approximately 70 feet long by 20 feet wide with a 16-foot ceiling. Liquid flavoring production utilizes approximately half of the room. Powdered flavoring production is performed at the opposite end of the room from liquid flavoring production. The powdered flavoring production area has three ribbon blenders: an 800-pound blender, a 250-pound blender, and a 90-pound blender. The liquid flavoring production area contains a number of mixing tanks; the larger tanks (250-gallon and 600-gallon capacity) have loose-fitting lids while smaller tanks do not. Workers produce many different flavorings by manually combining many different chemical ingredients, using open containers to pour and measure flavoring ingredients which are then transferred to open tanks (for liquid flavorings) or ribbon blenders (for powdered flavorings). Weighing and measuring of flavoring ingredients can occur at various locations throughout the production room, usually near the mixing tank or blender that will be used to produce the final product. Some production workers make liquid flavorings mostly, while others make powdered flavorings mostly.
At the time of our site visit in July 2006, the company was in the process of fit-testing all production workers for full- or half-face mask, negative-pressure, air-purifying respirators. Prior to July 2006, management provided production workers with 3M® N-95 filtering-facepiece respirators for voluntary use.

Page 3Health Hazard Evaluation Report 2006-0303-3043
ASSESSMENTTwo physicians and an industrial hygienist from the NIOSH Division of Respiratory Disease Studies visited the plant for an initial walkthrough on July 20, 2006. CAL/OSHA and CDHS-OHB staff were also present. A medical survey consisting of an interviewer-administered questionnaire and spirometry testing was conducted from July 21 through July 25. All workers were invited to participate in the medical survey. After NIOSH staff obtained signed informed consent from participants, staff from NIOSH, CAL/OSHA, and CDHS-OHB administered a standardized questionnaire to collect information on symptoms, medical diagnoses, smoking history, work history, and work-related exposures (Appendix I). This questionnaire included questions from the ATS standardized adult respiratory symptom questionnaire and NHANES III [Ferris 1978; CDC 1996], supplemented with questions on skin, upper respiratory, and mucous-membrane irritation or problems, and with additional asthma symptom questions [Venables et al. 1993].
Following ATS/ERS guidelines [Miller et al. 2005], a NIOSH technician administered spirometry tests using a dry rolling-seal spirometer interfaced to a personal computer. Spirometry results were compared to reference values generated from NHANES III data [Hankinson et al. 1999]. Each participating worker’s largest FVC and FEV1 were selected for analysis. Obstruction was defined as an FEV1/FVC ratio and FEV1 below their respective lower limits of normal. Restriction was defined as an FVC below the lower limit of normal with a normal FEV1/FVC ratio. A mixed pattern (obstruction and restriction) was defined as an FEV1/FVC ratio, FEV1, and FVC below their respective lower limits of normal. Workers with evidence of airways obstruction were administered albuterol, a bronchodilator medication used to treat obstructive lung diseases such as asthma, and were then re-tested to see if the obstruction was reversible. Reversible obstruction was defined as an improvement in the FEV1 of at least 12% and at least 200 milliliters after administration of albuterol. A NIOSH technician performed follow-up spirometry tests on production and laboratory workers on November 2, 2006. A report which explained each individual’s spirometry results and provided recommendations for follow-up of abnormalities was mailed to each participant at their home address within three to four weeks after each test.
On August 21 through 25, 2006, industrial hygiene sampling was conducted to measure contaminants generated during the
Page 4 Health Hazard Evaluation Report 2006-0303-3043
ASSESSMENT(CONTINUED)production of different flavor products. Area air samples were collected for total and respirable dusts, particle size distributions, volatile organic compounds, ketones (diacetyl, acetoin, and 2-nonanone), organic acids (acetic and butyric acids), and aldehyde compounds (acetaldehyde, benzaldehyde, and valeraldehyde). Personal samples were also collected for these ketones, organic acids, and aldehydes. Full-shift and partial-shift TWA area samples were collected. Real-time diacetyl and acetoin measurements were also made using a FTIR gas analyzer [Gasmet DX-4010, Temet Instruments Oy, Helsinki, Finland]. This instrument was used to provide continuous one-minute concentration measurements. A PID was used to quantify real-time VOCs in air (Rae Systems, Inc., Sunnyvale, CA). Real-time respirable dust measurements were taken using a PersonalDataRam®, model pDR-1000An/1200 (Thermo Electron Corporation, Franklin, MA). Samples were collected at different sampling locations in the plant, including the laboratory, warehouse areas, offices, and production room (liquid flavoring production area and powder flavoring production area). Details on the industrial hygiene sampling methods used during this survey are provided in Table 1. Sampling results that were below detectable limits were assigned a value of one-half of the minimum detectable concentration in air for statistical analyses. To assess quality control for diacetyl sampling, 6 tubes were spiked with known quantities of diacetyl in the NIOSH Division of Applied Research and Technology laboratory. These spiked tubes were express-mailed to the field and sent to the contract laboratory unmarked with the other field samples for analysis.
Page 5Health Hazard Evaluation Report 2006-0303-3043
Medical SurveyParticipation
Out of 36 workers currently employed in July 2006, 31 participated in the medical survey at the plant. A former worker who had worked in the laboratory also participated in the July medical survey at the plant. Two former production workers participated in the NIOSH medical survey at a local health department office. Three current workers who were unavailable in July 2006 had a spirometry test in November 2006 but were not administered the questionnaire.
Work History
Of the 34 participants who were currently employed in July 2006, five currently worked in the laboratory, nine worked in office areas, 12 worked in production, and eight worked in the warehouse. The average age of participants was 31.8 years for laboratory workers, 39.7 years for office workers, 35.4 years for production workers, and 35.1 years for warehouse workers. Ten workers reported current or past cigarette use: two office workers, five production workers, and three warehouse workers. Five workers reported having worked for a different flavoring company in the past.
Sixteen of 34 participants reported current or past work in the production room. Fifteen of these 16 were administered the questionnaire. Of these fifteen, 14 reported working four to eight or more hours per day in the production room. All 15 reported mixing or pouring flavoring chemicals and 13 of 15 reported that they handled diacetyl. Five handled diacetyl on a weekly basis, six on a monthly basis, and two handled diacetyl less than once a month. Five workers reported that they worked with liquids mostly, five workers reported working with powders mostly, and five workers reported working with both liquids and powders. (The questionnaire did not specifically ask about working in liquid flavoring production or powdered flavoring production or in both areas. Since powdered flavoring production involves both liquid and powdered ingredients, the workers that answered “both” may have meant they used both liquids and powders in powdered flavoring production. Management reported that workers generally work only in one or the other production area and not both. For data analyses by work area presented in this report, workers that
RESULTS
Page 6 Health Hazard Evaluation Report 2006-0303-3043
RESULTS (CONTINUED)answered “mostly powders” or “both” were considered to work in powdered flavoring production.) Thirteen of 15 ever production workers reported using a respirator or dust mask when in the production room (nine reported part-time use and four reported full-time use).
Eight workers reported current or past work in the laboratory. All eight reported that they mixed or poured flavoring chemicals, including diacetyl. One worker handled diacetyl on a weekly basis, four on a monthly basis, and three handled diacetyl less than once a month. None of these eight workers reported using a respirator or dust mask while in the laboratory.
Eighteen workers reported that they entered the production room regularly as part of another job. Fifteen of these 18 provided data on how much time they spent in the production room: 12 workers reported entering the production room on a daily basis; two workers reported entering the production room on a weekly basis, and one worker reported entering the production room less than once per month. Of the 12 workers who entered the production room on a daily basis, nine reported spending less than one hour per day in the production room and the other three reported spending several hours per day in the production room.
Current Worker Symptoms and Spirometry Results
Given that the size of the workforce at this plant is small, grouping survey participants by work area and by other work history considerations for data analysis leads to small total numbers of participants in each work category. For example, the total number of participants by current work area ranges from five in the laboratory to 12 in the production room. In this situation, an increase or decrease of one in the number of participants with a symptom or spirometry abnormality results in a large change in the prevalence (e.g., a prevalence of 16.7% if one out of six participants has a particular symptom compared to a prevalence of 33% if two out of six participants have a particular symptom). Such unstable prevalences can limit the inferences regarding health risk that can be drawn from the survey data.
The percentages of current workers reporting eye and nasal
Page 7Health Hazard Evaluation Report 2006-0303-3043
RESULTS (CONTINUED)irritation were high in all work areas (Table 2). Approximately half of current production and office workers and all current laboratory and warehouse workers reported having experienced nasal irritation. Approximately half of current office workers and warehouse workers and approximately 80% of current production workers and laboratory workers reported experiencing eye irritation. Skin problems were most common in current production workers (36%), especially in workers who mostly made liquid flavorings (60%).
Table 3 shows the prevalences of respiratory symptoms, self-reported respiratory illness, and spirometry abnormalities by work history: Ever-production mostly making liquid flavorings; ever-production mostly making powdered flavorings; ever-laboratory (but not also in production); and worked only in other areas of the plant. The production workers who reported mostly making liquid flavorings did not report any respiratory symptoms. The highest prevalences of shortness of breath on exertion were seen in ever-laboratory workers. Ever-production workers who made powdered flavorings and workers with no laboratory or production work history had similar prevalences of shortness of breath on exertion. Of the 10 participants who reported having had trouble breathing in the last 12 months, only one worker who made powdered flavorings reported that “my breathing is never quite right.” Three of these 10 (two who made powdered flavorings and one laboratory worker) reported regular trouble breathing that “always gets completely better.” The other six reported that they only rarely experienced trouble breathing. Chronic cough was only reported by one ever-production worker who made powdered flavorings and one worker with no laboratory or production work history. Wheeze apart from a cold was reported by approximately one-third of ever-production workers who made powdered flavorings and one-third of ever-laboratory workers, and by 20% of workers with no laboratory or production work history. Additional asthma-like symptoms were more common in ever-production workers who made powdered flavorings and ever-laboratory workers (20% and 33% respectively with three or more yes responses). Self-report of respiratory illness was most common in ever-production workers who made powdered flavorings (20% prevalence of pneumonia and physician-diagnosed chronic bronchitis; 30% prevalence of bronchitis and physician-diagnosed asthma). Self-report of respiratory illness was less common in all other groups.
Two of 16 participants who had ever worked in the production

Page 8 Health Hazard Evaluation Report 2006-0303-3043
RESULTS (CONTINUED)room were found to have abnormal spirometry; one had mild restriction and another had severe fixed airways obstruction (FEV1 0.78 liters, 23 percent of predicted). The worker with severe obstruction reported a past history of asthma, but said he was asymptomatic when he began work in flavoring production. He reported the onset of difficulty breathing within two weeks of starting work in powdered flavoring production, along with blurred vision. Due to severe and progressive shortness of breath, he was hospitalized several months later and underwent an open lung biopsy which was interpreted by the hospital pathologist as showing bronchiolitis obliterans.
Of the 14 workers who had follow-up spirometry tests in November 2006, the largest decline in FEV
1 was 159 milliliters, which is
within the range of normal variability.
Former Workers
Spirometry testing by NIOSH revealed severe fixed airways obstruction in both former production workers tested. One worker had an FEV
1 of 0.54 liters (21 percent of predicted) and the other
had an FEV1 of 1.11 liters (32 percent of predicted). Both former
workers reported wheezing and shortness of breath on exertion; one reported chronic cough.
Workers with Severe Airways Obstruction
Of the three current and former workers with severe fixed airways obstruction, two reported handling diacetyl in the production of powdered flavorings. The third reported helping in the production of powdered butter flavorings when other workers poured diacetyl. These three workers reported that they had never worked at another flavoring plant.
Industrial Hygiene Survey
Predominant VOCs in Air
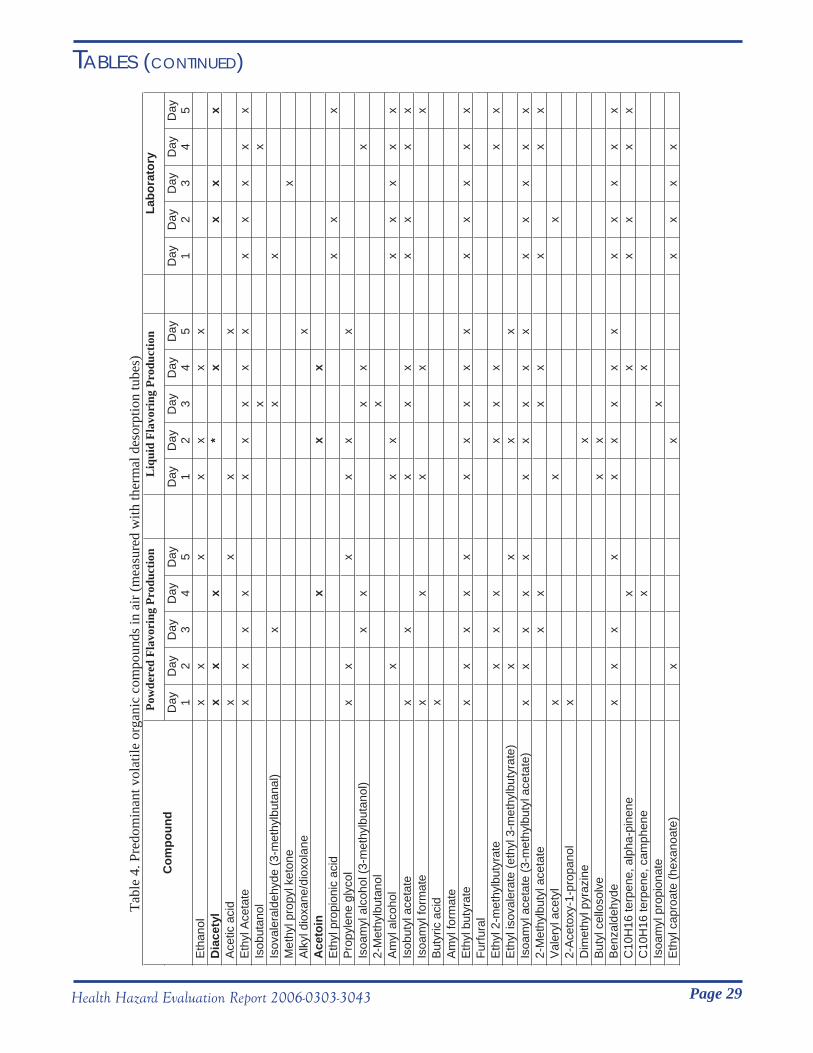
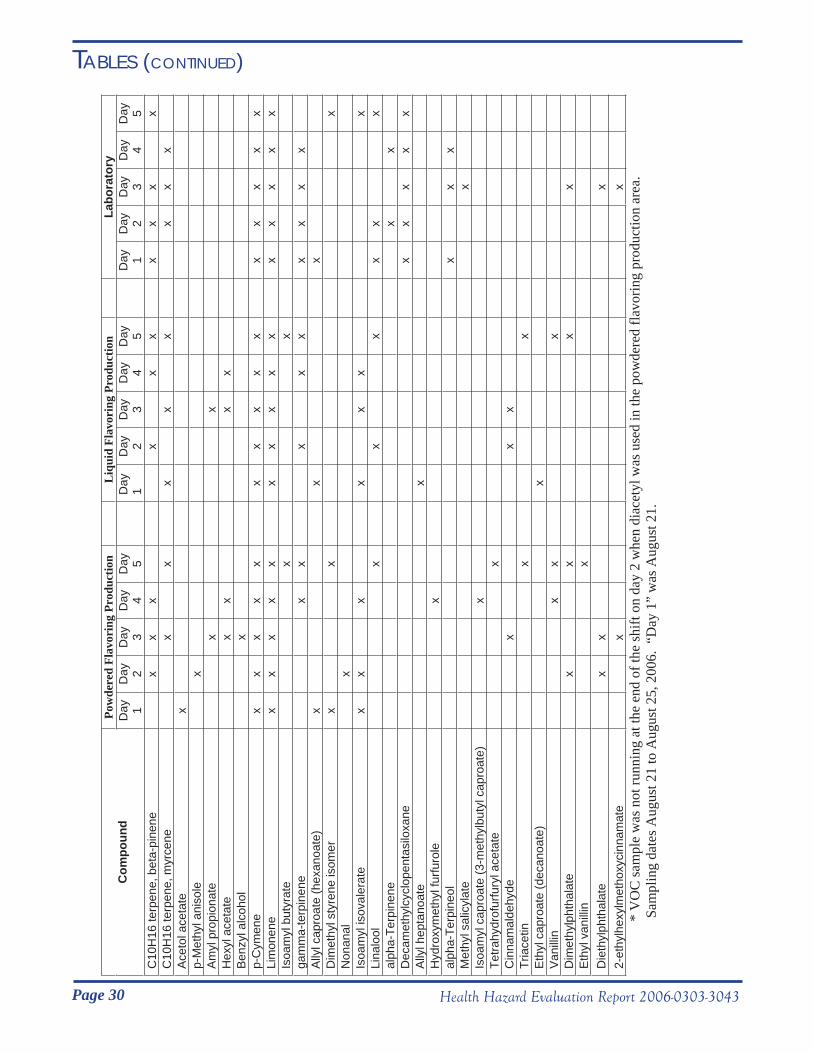
Table 4 provides semi-quantitative sampling data identifying the twenty predominant VOCs detected in daily air samples collected from different areas of the plant using thermal desorption

Page 9Health Hazard Evaluation Report 2006-0303-3043
RESULTS (CONTINUED)tubes. Several chemicals were predominant in air during most days: ethyl butyrate, isoamyl acetate, ethyl acetate, limonene, benzaldehyde, and p-cymene. Diacetyl was identified as a predominant volatile organic compound in air samples in both the production room and the laboratory on certain days. Acetic acid, acetoin, and several other chemical compounds were identified as predominant airborne chemicals only in the production room. Decamethylcyclopentasiloxane (also known as D5) was identified each day as a predominant airborne chemical only in the laboratory.
Average VOC Air Concentrations
TWA air concentrations of total VOCs from full-shift area samples are presented in Table 5. The highest VOC concentrations were seen in the production room, with concentrations ranging from 10.3 mg/m3 to a high of 38.5 mg/m3. The powdered flavoring production area had a mean VOC concentration of 24.1 mg/m3 while the liquid flavoring production area had a mean of 22.4 mg/m3 Lower VOC concentrations were seen in the other plant areas. The laboratory had a mean VOC concentration of 5.52 mg/m3. The two VOC concentrations measured in Office 1 (which has a door opening into the laboratory) were 1.76 mg/m3 and 1.77 mg/m3, somewhat higher than measurements taken in the other two offices (1.56 mg/m3 and 1.65 mg/m3).
Real-Time VOC Air Concentrations
Figures 2a and 2b show the real-time concentration of VOCs in the production room on August 24. As seen in Figure 2a, the highest VOC concentrations were identified in the powdered flavoring production area during production of a vanilla-flavored powder which contained diacetyl, specifically when the production worker was filling boxes with finished product. Total VOC concentrations at this time exceeded 100,000 ppb (parts per billion parts air) units. (Note: Since air samples contain many different VOCs, this is not a true ppb concentration for each individual air contaminant present; instead, it provides a general measure of all VOCs determined from calibrating the meter using the VOC isobutylene as a standard.) Prior to the mixing of the vanilla-flavored powder, VOC concentrations were lower in the powdered flavoring production area, ranging from approximately 1400 ppb units to 43,000 ppb units.

Page 10 Health Hazard Evaluation Report 2006-0303-3043
RESULTS (CONTINUED)
Real-time VOC concentrations in the liquid flavoring production area on August 24 are shown in Figure 2b. Concentrations exceeding 25,000 ppb units were seen at several points throughout the sampling period. One of these peaks occurred when butter-flavored powder was being mixed in the powdered flavoring production area. Since it did not appear that diacetyl was being used in the liquid flavoring production area at that time, and the powdered and liquid flavoring production areas are at separate ends of one large room, part of the VOC concentrations observed in the liquid flavoring production area could have resulted from migration of contaminants from the adjacent vanilla-flavored powder mixing operations.
Figure 2c shows the real-time concentration of volatile organic compounds in the laboratory on August 25. The VOC concentrations in the laboratory were lower than in the production room, and never exceeded 8,000 ppb units.
Average Ketone Air Concentrations
Personal and area concentrations of diacetyl and acetoin from full-shift samples are presented by plant area in Table 6. 2-Nonanone concentrations (not shown in the table) were all below the limit of detection, less than approximately 0.003 ppm. The production room had the highest TWA diacetyl concentrations, ranging from below detectable limits (with an assigned a value of 0.002 ppm) to a high of 1.13 ppm. The mean concentration from the two personal diacetyl samples from the liquid flavoring production area was 0.030 ppm. The eight area samples from this location had a similar mean of 0.025 ppm. The mean concentration from the nine personal diacetyl samples from the powdered flavoring production area was 0.223 ppm. The six area samples from this location had a similar mean of 0.249 ppm. Diacetyl concentrations from other plant areas were lower. TWA diacetyl concentrations in the laboratory ranged from below detectable limits (0.002 ppm) to a high of 0.021 ppm. The mean area diacetyl concentration in the laboratory was 0.011 ppm. The mean diacetyl concentrations in the offices and warehouse areas were all below either detectable limits (approximately 0.002 ppm depending on sample volume) or quantifiable limits (approximately 0.056 ppm depending on sample volume). Quality control analysis of spiked samples suggested a diacetyl recovery of approximately 99%.

Page 11Health Hazard Evaluation Report 2006-0303-3043
RESULTS (CONTINUED)Average and Real-Time Ketone Air Concentrations during Butter- and Vanilla-Flavored Powder Production
On August 22, the large (800-pound) ribbon blender was used to produce a 600-pound batch of butter-flavored powder. A worker first poured bags of powdered ingredients (corn syrup and corn starch solids) into the top of the ribbon blender. Liquid diacetyl was obtained from a premixed butter base (15.5 lbs) and from a 55-gallon drum of pure diacetyl that was kept refrigerated prior to use (18 lbs). (Management had recently started refrigerating diacetyl in an attempt to decrease vapor emissions.) The diacetyl and butter base were poured into a metal pail positioned on an electronic scale to measure exact amounts. Five pounds of acetoin powder was added to the contents of the metal pail. Next, one of the workers used a pitcher and a funnel to pour this acetoin and diacetyl-containing liquid into an opening on the top of the blender. After all the ingredients were mixed in the blender, the finished product was dispensed into 50-pound boxes from a port located at the bottom of the blender. A plastic liner was placed around the blender port to decrease product emissions into room air. One worker operated a lever on the blender port to control the dispensing of the finished product into 12 boxes. The production workers also used a batch of butter-flavored powder that was mixed the previous week to fill nine additional boxes. This transfer was done by hand using a scoop. On August 24, an 800-pound batch of vanilla-flavored powder was produced using the 800-pound ribbon blender. This batch contained approximately 3.5 pounds of diacetyl and approximately 4 pounds of acetoin powder. Production of this second powder mix was similar to the first, except that a small pneumatic hand screen was used during the packaging of finished product. On both days, two workers performed the production process, and both workers wore loose-fitting powered air-purifying respirators.
The results of short-term air sampling (approximately 70- to 100-minute TWAs) during the production of the butter-flavored and vanilla-flavored powders are presented in Table 7. The mean concentration for diacetyl from area samples was 21.2 ppm (range 2.47 ppm to 47.0 ppm). The mean concentration for diacetyl from personal sampling was 7.76 ppm. (Note: Personal sampling inlets were positioned outside the respirator hood.) The mean concentration for acetoin from area samples was 1.35 ppm (range 0.472 ppm to 2.38 ppm). The mean concentration for acetoin

Page 12 Health Hazard Evaluation Report 2006-0303-3043
RESULTS (CONTINUED)from personal sampling was 0.378 ppm.
Figures 3a and 3b show the real-time diacetyl and acetoin measurements by FTIR made in the powdered flavoring production area during the production of the butter-flavored powder on August 22 and the vanilla-flavored powder on August 24. During these FTIR measurements, the sampling inlet was held in the worker’s breathing zone by NIOSH staff except as otherwise noted and for several instances when the worker moved beyond the range of the sampling unit or left the production area. On both days, the company scheduled blending operations with diacetyl at the end of the work shift to minimize exposures to other workers in the production room. On August 22, a reading taken directly above the metal pail, while the worker poured chilled liquid diacetyl into it, registered over 1000 ppm. This sample was not in the worker’s breathing zone (Figure 3a). Transfer of the diacetyl-containing liquid from the metal pail into the blender resulted in diacetyl measurements ranging from approximately 4 ppm to 21 ppm. The dispensing of finished powder product into boxes resulted in the highest diacetyl concentrations, ranging from approximately 25 ppm to a high of approximately 204 ppm. Acetoin concentrations were lower than diacetyl concentrations, reaching a peak of approximately 11 ppm during the weighing and scooping of the butter-flavored powder that had been produced the previous week. The average diacetyl concentration measured with the FTIR during the butter-flavored powder mixing operations was 27.4 ppm; by comparison, the mean from the six corresponding short-term, personal and area diacetyl samples obtained on August 22 and analyzed by NIOSH method 2557 was 22.9 ppm.
Figure 3b shows FTIR sampling results for diacetyl and acetoin during production of a vanilla-flavored powder on August 24. On this day, the FTIR was operated as an area sampler until the workers starting handing diacetyl-containing liquids, at which time the sampling inlet was positioned in the worker’s breathing zone. As seen in Figure 3b, diacetyl concentrations were below detectable levels for most of the shift and became quantifiable only when the vanilla-flavored powder was mixed towards the end of the shift. At the start of this shift, a reading was taken upon opening one of the boxes of butter-flavored powder produced two days earlier. This was done at the request of company management to assess diacetyl emissions from the opening of a box of finished product. For this measurement, the sampling inlet was positioned just above the plastic liner as it was opened. The diacetyl concentration at this point was approximately 20 ppm. During the pouring of liquid
Page 13Health Hazard Evaluation Report 2006-0303-3043
RESULTS (CONTINUED)diacetyl at the start of the vanilla-flavored powder production, peak diacetyl concentrations increased up to approximately 18 ppm. During the screening and filling of boxes with finished product, diacetyl concentrations ranged from approximately 23 ppm to a high of approximately 188 ppm. Consistent with the FTIR results during the same process on August 22, the filling of containers with the flavored powder was the primary point source for the high diacetyl concentrations associated with these operations. Following the screening and filling operations, a worker opened and cleaned the ribbon blender by spraying water from a hose, resulting in peak diacetyl concentrations of approximately 36 ppm. As cleaning progressed, diacetyl concentrations fell to background levels. The average diacetyl concentration measured with the FTIR during the production of the vanilla-flavored powder was 37.5 ppm.
Average Aldehyde Air Concentrations
Full-shift mean TWA air concentrations of acetaldehyde and benzaldehyde from personal and area sampling are presented in Table 8 by plant area. Samples below the limit of detection were assigned a value of 0.0001 ppm (acetaldehyde) or 0.0002 ppm (benzaldehyde) for the calculation of means. Samples above the limit of detection but below the limit of quantification were assigned the value reported by the laboratory for the calculation of means. (Note: One of the media blank samples had quantifiable levels of acetaldehyde and benzaldehyde; all samples were corrected for this amount.) Valeraldehyde concentrations were all below the limit of detection, less than approximately 0.0006 ppm. The production room had TWA acetaldehyde air concentrations ranging from below detectable limits (approximately 0.0002 ppm) to a high of 0.315 ppm. The mean air concentration from the three personal acetaldehyde samples from the liquid flavoring production area was 0.130 ppm. One production worker stationed in the warehouse had an acetaldehyde exposure of 0.187 from pouring banana- and blueberry-flavored concentrate from a 55-gallon drum into one-gallon jugs. The mean air concentration from the two personal acetaldehyde samples from the powdered flavoring production area was 0.057 ppm. The five area samples from this location had a mean acetaldehyde air concentration of 0.113 ppm. The mean air concentration from the three personal samples for benzaldehyde from the liquid flavoring production area was 0.089 ppm. One production worker who worked in all areas of the production room had a benzaldehyde exposure of 2.23 ppm. The mean air concentration from the two personal samples for

Page 14 Health Hazard Evaluation Report 2006-0303-3043
RESULTS (CONTINUED)benzaldehyde from the powder flavoring production area was 0.510 ppm. Acetaldehyde air concentrations in the laboratory ranged from 0.003 ppm to 0.040 ppm. Benzaldehyde air concentrations in the laboratory ranged from 0.050 ppm to 1.10 ppm. Benzaldehyde concentrations in the area samples from the offices ranged from 0.039 to 1.31 ppm. Acetaldehyde and benzaldehyde air concentrations in other plant areas are listed in Table 8.
Average Organic Acid Air Concentrations
Full-shift mean TWA acetic acid air concentrations are presented in Table 9 by plant area. Butyric acid concentrations were all below the limit of detection (approximately 0.03 ppm), and are not listed in the table. The production areas had TWA acetic acid air concentrations ranging from below detectable limits (approximately 0.02 ppm) to a high of 1.02 ppm. The mean exposure from the 3 personal samples for acetic acid from the liquid flavoring production area was 0.348 ppm. One short-term (23-minute) area sample for acetic acid was collected in the liquid flavoring production area during the pouring of glacial acetic acid. This sample had an acetic acid concentration of 6.22 ppm. The mean exposure from the three personal samples for acetic acid from the powdered flavoring production area was 0.281 ppm. Acetic acid exposures in the laboratory (personal samples) ranged from below detectable limits to a high of 0.313 ppm. The personal acetic acid exposure measured in Office 1 was below detectable limits. One of four area samples for acetic acid (obtained in Office 1) had a concentration of 1.35 ppm; this area sample was collected next to the door leading into the laboratory. All acetic acid air concentrations in the warehouse area were below detectable limits.
Particulate Air Concentrations
TWA total and respirable dust air concentrations from gravimetric analyses of area samples are presented by plant area in Table 10. The highest total and respirable dust air concentrations were measured in the powder flavoring production area. Total dust air concentrations in this area ranged from 0.588 mg/m3 to a high of 5.79 mg/m3. The mean total dust air concentration from the five area samples collected in the powder flavoring production area was 3.47 mg/m3. The mean respirable dust air concentration in powdered flavoring production area was 0.189 mg/m3. The mean total dust air concentration in the liquid flavoring production area

Page 15Health Hazard Evaluation Report 2006-0303-3043
RESULTS (CONTINUED)was 0.780 mg/m3. The mean respirable dust air concentration in the liquid flavoring production area was 0.108 mg/m3. Respirable and total dust air concentrations in the laboratory, warehouse, and office areas were lower.
Real-time area air concentrations of respirable dust are presented in Figures 4a, 4b and 4c. Concentrations are reported in mg/m3
as determined by optical measures, instead of gravimetric measures as reported for the TWA samples above. Optically measured dust concentrations are not always equivalent to dust concentrations made using gravimetric analyses. The real-time respirable dust air concentrations in the powder flavoring production area on August 22 ranged from 0.09 mg/m3 to a high of 22.3 mg/m3 in Figure 4a. The highest concentrations occurred during powder blending operations. Peak concentrations from the blending of several different powder flavors are observed in this figure, including the blending operations with diacetyl. Respirable dust air concentrations in the liquid flavoring production area (Figure 4b), also on August 22, were lower than in the powdered flavoring production area, ranging from 0.08 mg/m3 to a high of 2.85 mg/m3. Some of the peak concentrations in the liquid flavoring production area occurred at the same time that peak concentrations were observed in the powdered flavoring production area, suggesting migration of dust emissions from the powdered flavoring production area into the liquid flavoring production area. The real-time respirable dust concentrations in the laboratory (Figure 4c) were lower, ranging from 0.07 mg/m3 to 0.58 mg/m3.
Particle Size Distributions
Figure 5 presents the aerodynamic size distribution of airborne particles in the flavoring production room including three samples from the powdered flavorings production area and one sample from the liquid flavorings production area. Approximately 32% of the airborne dust from the powdered production area was less than 10 micrometers in aerodynamic diameter, a size range that would be considered respirable and likely to penetrate to gas exchange regions of the lung. The percentage of particulate in this area that was less than 10 micrometers in aerodynamic diameter ranged from 21% to 43%. Approximately 10% of the airborne particulate in the powdered production area was less than 3.5 micrometers in aerodynamic diameter; this smaller aerodynamic dust size range has an even greater ability to penetrate to the gas exchange regions of
Page 16 Health Hazard Evaluation Report 2006-0303-3043
RESULTS (CONTINUED)the lung. The liquid production area had a larger fraction of the airborne dust in the respirable size range (approximately 57% was less than 10 micrometers in aerodynamic diameter; approximately 30% was less than 3.5 micrometers in aerodynamic diameter).
Applicable OSHA PELs and NIOSH RELs
Of the analytes measured by NIOSH, only acetic acid and acetaldehyde have an OSHA PEL and/or NIOSH REL. All acetic acid exposures were below the OSHA PEL and the NIOSH REL of 10 ppm TWA. All the acetaldehyde exposures were below the OSHA PEL of 200 ppm TWA. NIOSH recommends the lowest exposure feasible for acetaldehyde because it is a potential carcinogen. Animal studies have shown nasal tumors in rats and laryngeal tumors in hamsters exposed to acetaldehyde.
Air Temperature and Percent Relative Humidity
Air temperatures in the production and warehouse areas ranged from approximately 76°F to a high of 87°F during the five days of sampling; relative humidity in these areas ranged from 42% to 74%. In the laboratory, air temperatures ranged from approximately 75°F to a high of 78°F; relative humidity in the laboratory ranged from 31% to 48%.
Ventilation / Air Movement
The flavoring production room is served by a combination of exhaust and supply ventilation systems. Three supply air registers are positioned along the south wall of the room at a height of approximately 12-14 feet above the floor. The fan for the supply air system was located on the roof of the room and was not operating during the visit. A 2 x 2 foot (estimated) return air register is located towards the western end of the room and driven by an industrial ventilation fan that exhausted through the ceiling of the warehouse. An additional 16-inch axial (propeller type), wall-mounted exhaust fan was located along the east wall of the room near the powder blender. We were not able to measure the supply or exhaust flow rate of the registers due to inaccessibility. In addition, large floor fans were used for air circulation and temperature moderation throughout the production area.
Air pressure differentials were checked between the flavor

Page 17Health Hazard Evaluation Report 2006-0303-3043
RESULTS (CONTINUED)production room, the laboratory, the offices and all neighboring areas with the use of a smoke tracer. This simple test indicates whether air is flowing into the room or out of the room into nearby adjacent areas. These tests showed that the flavor production room was generally under negative pressure with respect to the warehouse along the doors on the southern wall (i.e., air was flowing into the room along the southern main doorways). However, the room was under positive pressure with respect to the door in the northwestern corner of the room leading into the warehouse and lunch/break area. Similar tests conducted in the laboratory showed that it was under positive pressure with adjacent areas (i.e., air flowed out of the laboratory into the warehouse and office areas). Finally, the tests showed that office 1 was under negative pressure with respect to both the warehouse and laboratory (i.e., air flowed into the office from the warehouse and laboratory).
Page 18 Health Hazard Evaluation Report 2006-0303-3043
In the U.S. general population, severe obstruction on spirometry is an uncommon finding. Data from NHANES III show that, among individuals less than 50 years-old (including both smokers and never-smokers), the prevalence of obstruction with an FEV
1
less than 40 percent of predicted is 0.1% (1 in 1000 people). In a plant with less than 40 workers, finding one worker with severe obstruction would be unusual. It would be highly unlikely to find three severely obstructed workers in this setting. At Carmi Flavors, all three workers with severe obstruction worked in the production room, an area where there have been less than 25 workers over the entire history of the plant according to management. The three affected workers also made powdered flavorings mostly as opposed to primarily making liquid flavorings. Air sampling performed by us at this plant demonstrated that the highest exposures to diacetyl occurred during the dispensing of finished butter-flavored powder from a ribbon blender. In at least three other flavoring plants with similar size or smaller workforces, investigations have documented that workers who made powdered flavorings utilizing the same process developed severe fixed airways obstruction (NIOSH HHE at a flavoring plant in Indiana in 1985 [NIOSH 1986]; an investigation by Cal/OSHA at a California flavoring plant in 2004-5; and an ongoing NIOSH HHE at another California flavoring plant in 2006).
Although it is highly likely that exposures to diacetyl contributed to the occurrence of severe fixed obstructive lung disease in production workers at the Carmi Flavors plant, whether or not the exposures to other flavoring chemicals also contributed to the development of disease in these workers is unknown. Vapors from a butter flavoring used at a microwave popcorn plant, and from pure diacetyl, have both been shown to cause severe injury to the lining of the respiratory tract in animal toxicology studies [Hubbs et al. 2002; Hubbs et al. 2004]. Medical and industrial hygiene surveys in microwave popcorn plants have revealed evidence of industry-wide risk for severe fixed obstructive lung disease in workers with inhalation exposures to butter flavoring chemicals, the predominant one of which is diacetyl [Kanwal et al. 2006]. The diacetyl air concentrations at the Carmi Flavors plant are similar to the concentrations measured at microwave popcorn plants where workers developed bronchiolitis obliterans [Kanwal et al. 2006]. Many chemicals used to make flavorings can give off vapors that are highly irritating to the eyes and respiratory tract (e.g., acetoin, acetaldehyde, benzaldehyde, acetic acid). The potential of these chemicals to cause lung disease alone or as mixed exposures
CONCLUSIONS

Page 19Health Hazard Evaluation Report 2006-0303-3043
CONCLUSIONS (CONTINUED) is unknown. In one outbreak of fixed airways obstruction at a
flavoring plant, acetaldehyde exposures were suspected as a cause [Lockey et al. 2002]. Chemicals used to make flavorings are generally evaluated for safety to consume in food products, not for safety to inhale in the workplace. OSHA PELs and NIOSH RELs have not been established for most of the chemicals used in flavoring manufacture [NIOSH 2004]. The Flavor and Extract Manufacturers Association has indicated that 34 “high priority” and 49 “low priority” substances may pose respiratory hazards in the flavor manufacturing workplace [FEMA 2004]. Until more is known about the potential toxicity of flavoring chemicals, it is important to minimize exposures during their use.
Although the Carmi Flavors workers with severe airways obstruction worked mostly in powdered flavoring production, the risk to workers who mostly make liquid flavorings is unclear. Liquid flavoring production workers reported fewer symptoms and did not have airways obstruction, but there were only six workers in this group; one liquid flavoring worker did have mild restriction on spirometry. A larger group might have included individuals with greater susceptibility to develop fixed airways obstruction from inhalation of flavoring-related chemicals during liquid flavoring production. FTIR air sampling showed a peak diacetyl air concentration of approximately 1000 ppm directly above a container while a worker poured chilled liquid diacetyl into it during production of a powdered flavoring. While this measurement was not in the worker’s breathing zone, increases in the frequency and amounts of use of certain chemicals in the production of liquid flavorings, as well as variations or changes in the ways workers handle the chemicals, could increase exposures and lung disease risk for workers performing this task. In addition, in a production area or room where both types of flavorings are produced, exposures from one type of flavor production could affect workers doing other tasks nearby. The risk to workers exposed to flavoring-related chemicals during laboratory tasks is also unclear. We are not aware of reports of flavoring-related lung disease in laboratory workers at this or other flavoring plants. However, some of the six participants who had ever worked in the laboratory at this plant reported respiratory symptoms. Exposures to flavoring chemicals and dust in the laboratory should be controlled through the use of laboratory exhaust hoods whenever workers are required to handle open containers of flavoring chemicals or mixtures. Additional information from medical surveys and industrial hygiene air sampling at other flavoring plants is necessary to adequately characterize the potential risk to

Page 20 Health Hazard Evaluation Report 2006-0303-3043
CONCLUSIONS (CONTINUED) workers from exposures to flavoring-related chemicals experienced
during the performance of specific work tasks.
Page 21Health Hazard Evaluation Report 2006-0303-3043
In an interim letter we sent to the company in October 2006, we provided recommendations based on preliminary findings from the medical and environmental surveys (see Appendix II). Our revised recommendations for Carmi Flavors’ management are presented below. In Appendix III of this report, we provide additional detailed guidance on engineering control considerations.
Engineering controls:
Production room: Implement engineering controls to minimize worker exposures to chemicals during production room processes such as weighing and transfer of ingredients, operation of blenders and mixing tanks, and packaging of finished product. Both enclosures and local exhaust ventilation should be considered as engineering control options. Engineering controls should be implemented for all ribbon blenders in the blending area, at one weighing/mixing station, at one or more mixing tanks in the liquids area, and at one cleaning station. Consider using an experienced industrial ventilation engineer in the design of these engineering controls. Utilize these exposure controls for all flavoring ingredient handling and for production of all flavoring products. See Appendix III for additional engineering control guidance. After implementation, assess the efficacy of controls with industrial hygiene air sampling and repeat air sampling regularly to ensure that this effectiveness is maintained. Also, the production room should be maintained under negative air pressure relative to other plant areas. Direct all exhaust ventilation outside the plant and comply with all applicable environmental regulations.
Laboratory: Install laboratory exhaust hoods and require staff to perform all open handling of flavoring ingredients / chemicals within the hoods. Direct all hood exhaust outside the plant and comply with all applicable environmental regulations.
Respiratory protection: If not already established, implement mandatory respirator use by mixers and any other workers who enter the production area. Assure that the respirators provide protection from organic vapors and particulates. A formal respiratory protection program that adheres to the requirements of the OSHA Respiratory Protection Standard (29 CFR 1910.134) is required. The
1.
a.
b.
2.
RECOMMENDATIONS

Page 22 Health Hazard Evaluation Report 2006-0303-3043
RECOMMENDATIONS (CONTINUED) program administrator for the program must have adequate
training and experience to run it and regularly evaluate its effectiveness. Details on the Respiratory Protection Standard and on how a company can set up a respiratory protection program are available on the OSHA website (http://www.osha.gov/SLTC/respiratoryprotection/index.html). In accordance with Cal/OSHA direction, “full-facepiece respirators fit-tested with an approved quantitative method are needed as minimal protection for employees exposed to flavoring ingredients in this industry. All employees entering flavor formulation areas or unprotected areas (e.g., packaging areas) must wear respirators” (correspondence from K. Howard to California flavoring companies dated Oct. 13, 2006). A full-facepiece respirator will also protect the eyes from airborne dust and chemical splashes that might occur during pouring, mixing, or cleaning. A loose-fitting powered air-purifying respirator (PAPR) is an option to consider for increased worker comfort and, unlike tight-fitting respirators, does not require fit testing. Follow manufacturer’s recommendations for cartridge change out schedules. If you would like assistance in evaluating cartridge life, NIOSH may be able to assist. It may be possible in the future to discontinue mandatory respirator use if exposure controls have been shown through industrial hygiene assessment to prevent uncontrolled exposures. However, respirator use may still be necessary for situations where exposures may be difficult to control (e.g., cleaning out tanks and blenders).
Medical surveillance with spirometry: It is important to identify as early as possible if any workers are experiencing declines in lung function that may be due to exposures to flavoring chemicals. We recommended continued spirometry testing every three months for all workers who enter the production area. The spirometry provider should follow American Thoracic Society (ATS) guidelines for performance of high-quality tests, and have technicians who have attended a NIOSH-certified spirometry course and can demonstrate proper testing technique. The physician who reviews the tests should be familiar with the ATS guidelines and with the nature of the risk to workers from exposures to flavoring-related chemicals. (We can provide the physician with information on occupational flavoring-related lung disease risk if he/she is not already familiar with this issue.) Once Carmi Flavors has fully implemented
3.
Page 23Health Hazard Evaluation Report 2006-0303-3043
RECOMMENDATIONS (CONTINUED) exposure controls, it may be possible in the future to do
testing less often if testing up to that point has not revealed any excessive declines in lung function.
Work practices: Use closed containers and mixing tanks to reduce the emission of volatile flavoring chemicals into plant air. To the extent possible, flavoring transfers should be closed and done in a way to minimize volatilization of flavoring chemicals into plant air. If possible, use cold water to clean out tanks and blenders to reduce the volatilization of chemicals into plant air.
Skin protection: Provide production room workers with appropriate protective clothing and gloves to prevent skin contact with flavoring chemicals during production and cleanup activities. Warehouse and laboratory workers may also require similar skin protection approaches if they are at risk for skin contact with flavoring or other chemicals in the workplace.
Administrative controls: Limit entry into the production room to production workers and supervisory staff (i.e., eliminate the necessity for laboratory or office workers to enter the production room).
Other issues: The following recommendations are based on observations made at the plant but not addressed in this report:
Evaluate noise exposures in the production room during operation and cleaning of the blenders and, if noise exposures exceed CAL/OSHA standards, develop a hearing conservation program for workers.
Evaluate fork lift safety in the production area and ensure that workers have training on the best safety practices for fork-lift operation and load handling. Workers should not stand on pallets of flavoring materials hoisted by fork lifts. Ensure that workers have training on proper techniques for manual lifting of flavoring materials / containers.
4.
5.
6.
7.
a.
b.

Page 24 Health Hazard Evaluation Report 2006-0303-3043
REFERENCESACGIH [1995]. Air-sampling instruments for evaluation of atmospheric contaminants, 8th ed. Cincinnati, OH: American Conference of Governmental Industrial Hygienists.
ACGIH [2004]. Industrial ventilation: a manual of recommended practice, 25th ed. Cincinnati, OH: American Conference of Governmental Industrial Hygienists.
Akpinar-Elci M, Travis WD, Lynch DA, Kreiss K [2004]. Bronchiolitis obliterans syndrome in popcorn plant workers. Eur Respir J 24(2): 298-302.
CDC [1996]. Third National Health and Nutrition Examination Survey, 1988-1994, NHANES III Examination Data File [CD-ROM]. Hyattsville, Maryland: U.S. Department of Health and Human Services, Public Health Service, CDC. (Public use data file documentation No. 76300).
FEMA [2004]. Respiratory health and safety in the flavor manufacturing workplace. Washington, DC: The Flavor and Extract Manufacturers Association of the United States.
Ferris BG [1978]. Epidemiology standardization project. Am Rev Respir Dis 118(6 pt 2):Suppl:1-53.
Hankinson JL, Odencrantz JR, Fedan KB [1999]. Spirometric reference values from a sample of the general U.S. population. Am J Respir Crit Care Med 159(1):179-187.
Hubbs AF, Batelli LA, Goldsmith WT, Porter DW, Frazer D, Friend S, Schwegler-Berry D, Mercer RR, Reynolds JS, Grote A. Castranova V, Kullman G, Fedan JS, Dowdy J, Jones WG [2002]. Necrosis of nasal and airway epithelium in rats inhaling vapors of artificial butter flavoring. Toxicol Appl Pharmacol 185(2):128-135.
Hubbs AF, Battelli LA, Mercer RR, Kashon M, Friend S, Schwegler-Berry D, Goldsmith WT [2004]. Inhalation toxicity of the flavoring agent, diacetyl (2,3-butanedione), in the upper respiratory tract of rats. Toxicol Sci 78 (S1):438-439.
Kanwal R, Kullman G, Piacitelli C, Boylstein R, Sahakian N, Martin S, Fedan K, Kreiss K [2006]. Evaluation of flavoring related lung disease risk at six microwave popcorn plants. J Occup Environ Med. 48(2):149-157.
Kreiss K, Gomaa A, Kullman G, Fedan K, Simoes EJ, Enright PL [2002]. Clinical bronchiolitis obliterans in workers at a microwave-popcorn plant. N Engl J Med 347(5):330-338.
Lockey J, McKay R, Barth E, Dahlsten J, Baughman R. [2002]. Bronchiolitis obliterans in the food flavoring manufacturing industry [Abstract]. Am J Respir Crit Care Med 165:Suppl:A461.
Miller MR, Hankinson J, Brusasco V, Burgos F, Casaburi R, Coates A, Crapo R, Enright P, van der Grinten CP, Gustafsson P, Jensen R, Johnson DC, MacIntyre N, McKay R, Navajas D, Pedersen OF, Pellegrino R, Viegi G, Wanger J [2005]. ATS/ERS Task Force. Standardisation of spirometry. Eur Respir J 26(2):319-38.
Page 25Health Hazard Evaluation Report 2006-0303-3043
RFERENCES (CONTINUED)NIOSH [1986]. Health Hazard Evaluation and Technical Assistance Report: International Bakers Services, Inc., South Bend, Indiana. Cincinnati, OH: U.S. Department of Health and Human Services, Public Health Service, Centers for Disease Control, National Institute for Occupational Safety and Health, DHHS (NIOSH) Publication No. 85-171-1710.
NIOSH [2003]. In: Schlecht P, O’Connor P, eds. Manual of Analytical Methods (NMAM), 4th ed., Third Supplement. Cincinnati, OH: U.S. Department of Health and Human Services, DHHS (NIOSH) Publication No. 2003-154.
NIOSH [2004]. NIOSH Alert: Preventing lung disease in workers that use or make flavorings. Division of Respiratory Disease Studies, National Institute for Occupational Safety and Health, Department of Health and Human Services, DHHS (NIOSH) Publication Number 2004-110.
Venables KM, Farrer N, Sharp L, Graneek BJ, Newman Taylor AJ [1993]. Respiratory symptoms questionnaire for asthma epidemiology: validity and reproducibility. Thorax 48(3):214-219.

Page 26 Health Hazard Evaluation Report 2006-0303-3043
Table 1. Industrial hygiene sampling methodsAnalytes Media/sampler Flow
rate (lpm)
Analytical methods
Total dust in air 37-mm PVC filter, open-face filter cassette
3.0 Gravimetric analysis by NMAM 0500 [NIOSH 2003]
Respirable dust in air 37-mm PVC filter, BGI® cyclone
4.2 Gravimetric analysis by NMAM 0600 [NIOSH 2003]
Real-time respirable dust in air
Photometric meter, PersonalDataRAM® pDR-1000AN/1200
-- Direct-reading instrument (Thermo Electron Corporation, Franklin, MA) [ACGIH 1995]
Particle size distributions in air
Eight-stage cascade impactor with PVC media for all stages
2.0 Gravimetric analysis [NIOSH 2003; ACGIH 1995]
Volatile organic compounds (VOCs) in air (Screening for Identification)
Thermal desorption tube 0.02 Gas chromatography / mass spectrometry by NMAM 2549 [NIOSH 2003]
Real-time VOCs in air Photoionization meter, ppbRAE®
-- Direct-reading instrument (Rae Systems, Inc., Sunnyvale, CA) [ACGIH 1995]
Total VOCs in air (Quantitative for total mass)
Coconut shell charcoal (CSC) tubes
0.10 Gas chromatography by NMAM Method 1550 [NIOSH 2003]
Ketone compounds in air (diacetyl, acetoin, and 2-nonanone)
Anasorb® tube 0.1 or 0.2
Gas chromatography by NMAM 2557 and 2558 [NIOSH 2003]
Real-time diacetyl, acetoin, and nonanone concentrations in air
Fourier transform infrared (FTIR) gas analyzer
-- Direct-reading instrument (Gasmet DX-4010,TM Temet Instruments Oy, Helsinki, Finland) [ACGIH 1995]
Aldehydes in air Sorbent tube (silica gel treated with 2,4 dinitrophenylhydrazine)
0.1 or 0.5
High performance liquid chromatography (HPLC) by NMAM 2016 [NIOSH 2003]
Organic acids in air Sorbent tube (silica gel) – ORBO 53 tubes
0.1 or 0.5
HPLC methods by NIOSH*
Air temperature and % relative humidity
Psychrometer -- Direct-reading meter [ACGIH 1995]
*Developed by NIOSH Division of Applied Research and Technology; not yet published
TABLES

Page 27Health Hazard Evaluation Report 2006-0303-3043
TABLES (CONTINUED)Table 2. Prevalence of nasal irritation, eye irritation, and skin problems among current workers by current work area
Health Outcome Laboratory
N=5
Office
N=9
Production Room
N=11
Warehouse
N=6
Nasal Irritation1 5 (100%) 4 (44%) 5 (45%) 6 (100%)
Eye Irritation2 4 (80%) 5 (56%) 9 (82%) 3 (50%)
Skin Problems3 0 0 4 (36%) 2 (33%)
1 Since working at this plant, have you had symptoms of nasal irritation such as a stuffy or blocked nose, an itchy nose, a stinging or burning nose, or a runny nose?2 Since working at this plant, have you had any symptoms of eye irritation such as: watering or tearing eyes, red or burning eyes, itching eyes, dry eyes?3 Since working at this plant, have you developed any new skin rash or skin problems?

Page 28 Health Hazard Evaluation Report 2006-0303-3043
TABLES (CONTINUED)Table 3. Current-worker symptoms, self-reported respiratory illness history, and spirometry results by work history Health Outcome Ever-Production
(Mostly Liquid Flavorings)
N=5
Ever-Production
(Mostly Powdered Flavorings)
N=10
Ever-Laboratory
N=6
Never Worked in Laboratory or Production
RoomN=10
Shortness of breath in last 12 months1
- Always resolves2
- Persists3
0 3 (30%)2 (20%)1 (10%)
2 (33%)1 (17%)
0
1 (10%)00
Shortness of breath on exertion4
0 3 (30%) 3 (50%) 3 (30%)
Shortness of breath on exertion5
0 2 (20%) 2 (33%) 2 (20%)
Chronic cough6 0 1 (10%) 0 1 (10%)
Wheeze without respiratory infection7
0 3 (30%) 2 (33%) 2 (20%)
Additional asthma-like symptoms8
-1 or more yes responses-3 or more yes responses
00
4 (40%)2 (20%)
3 (50%)2 (33%)
2 (20%)0
Bronchitis9 1 (20%) 3 (30%) 0 0
Chronic bronchitis10 0 2 (20%) 1 (17%) 1 (10%)
Pneumonia11 0 2 (20%) 0 0
Asthma12 0 3 (30%) 1 (17%) 1 (10%)
Obstruction or mixed pattern on spirometry
0 1 (10%) 0 0
Restriction on spirometry 1 (17%)* 0 0 0
*”N”Includes additional participant who had spirometry testing but did not have the questionnaire administered. 1 During the last 12 months, have you had any trouble with your breathing? 2 I have regular trouble with my breathing but it always gets
completely better. 3 My breathing is never quite right. 4 Are you troubled by shortness of breath when hurrying on level ground or walking
up a slight hill? 5 Do you get short of breath walking with people of your own age on level ground? 6 Do you usually cough on most days
for 3 consecutive months or more during the year? 7 During the 12 months, have you had this wheezing or whistling in your chest when you
did not have a cold? 8 If you run, or climb stairs fast do you ever cough? If you run, or climb stairs fast do you ever wheeze? If you run, or
climb stairs fast do you ever get tight in the chest? Is your sleep ever broken by wheeze? Is your sleep ever broken by difficulty breathing? Do
you ever wake up in the morning with wheeze? Do you ever wake up in the morning with difficulty breathing? Do you ever wheeze if you are
in a smoky room? Do you ever wheeze if you are in a very dusty place? 9 Since you began working at this plant, have you ever had attacks of
bronchitis? 10 Have you ever had chronic bronchitis (confirmed by a doctor)? 11 Since you began working at this plant have you ever had
pneumonia? 12 Have you ever had asthma (confirmed by a doctor)?
Page 29Health Hazard Evaluation Report 2006-0303-3043
TABLES (CONTINUED)
Tabl
e 4.
Pre
dom
inan
t vol
atile
org
anic
com
poun
ds in
air
(mea
sure
d w
ith th
erm
al d
esor
ptio
n tu
bes)
Po
wde
red
Flav
orin
g Pr
oduc
tion
Liq
uid
Flav
orin
g Pr
oduc
tion
Labo
rato
ry
Com
poun
d D
ay
1D
ay
2D
ay
3D
ay
4D
ay
5
D
ay
1D
ay
2D
ay
3D
ay
4D
ay
5D
ay
1D
ay
2D
ay
3D
ay
4D
ay
5Et
hano
l x
x
x
x x
x
x
Dia
cety
l x
x
x
*
x
x x
x
Acet
ic a
cid
x
x
x
x
Et
hyl A
ceta
te
x x
x x
x
x x
x x
x x
x x
x Is
obut
anol
x
x
Isov
aler
alde
hyde
(3-m
ethy
lbut
anal
)
x
x
x
Met
hyl p
ropy
l ket
one
x
A
lkyl
dio
xane
/dio
xola
ne
x
A
ceto
in
x
x
x
E
thyl
pro
pion
ic a
cid
x x
x Pr
opyl
ene
glyc
ol
x x
x
x
x
x
Is
oam
yl a
lcoh
ol (3
-met
hylb
utan
ol)
x x
x
x
x
2-
Met
hylb
utan
ol
x
Am
yl a
lcoh
ol
x
x
x
x x
x x
x Is
obut
yl a
ceta
te
x
x
x
x
x
x x
x
x Is
oam
yl fo
rmat
e x
x
x
x
x
Buty
ric a
cid
x
Am
yl fo
rmat
e
Ethy
l but
yrat
e x
x x
x x
x x
x x
x
x
x x
x x
Furfu
ral
Et
hyl 2
-met
hylb
utyr
ate
x
x x
x x
x
x
x E
thyl
isov
aler
ate
(eth
yl 3
-met
hylb
utyr
ate)
x
x
x
x
Isoa
myl
ace
tate
(3-m
ethy
lbut
yl a
ceta
te)
x x
x x
x
x
x x
x x
x x
x x
x 2-
Met
hylb
utyl
ace
tate
x
x
x x
x
x x
Vale
ryl a
cety
l x
x
x
2-A
ceto
xy-1
-pro
pano
l x
Dim
ethy
l pyr
azin
e
x
Buty
l cel
loso
lve
x
x
Be
nzal
dehy
de
x x
x
x
x
x x
x x
x x
x x
x C
10H
16 te
rpen
e, a
lpha
-pin
ene
x
x
x x
x
x C
10H
16 te
rpen
e, c
amph
ene
x
x
Is
oam
yl p
ropi
onat
e
x
Ethy
l cap
roat
e (h
exan
oate
)
x
x
x
x x
x
Page 30 Health Hazard Evaluation Report 2006-0303-3043
TABLES (CONTINUED)
Pow
dere
d Fl
avor
ing
Prod
uctio
n
L
iqui
d Fl
avor
ing
Prod
uctio
n
La
bora
tory
C
ompo
und
Day
1
Day
2
Day
3
Day
4
Day
5
Day
1
Day
2
Day
3
Day
4
Day
5
Day
1
Day
2
Day
3
Day
4
Day
5
C10
H16
terp
ene,
bet
a-pi
nene
x x
x
x
x
x
x
x x
x
C10
H16
terp
ene,
myr
cene
x
x
x
x
x
x x
x
Ace
tol a
ceta
te
x
p-
Met
hyl a
niso
le
x
A
myl
pro
pion
ate
x
x
H
exyl
ace
tate
x
x
x x
Benz
yl a
lcoh
ol
x
p-
Cym
ene
x x
x x
x
x
x x
x x
x x
x x
x Li
mon
ene
x x
x x
x
x
x x
x x
x x
x x
x Is
oam
yl b
utyr
ate
x
x
ga
mm
a-te
rpin
ene
x
x
x
x x
x x
x x
A
llyl c
apro
ate
(hex
anoa
te)
x
x
x
D
imet
hyl s
tyre
ne is
omer
x
x
x
Non
anal
x
Isoa
myl
isov
aler
ate
x x
x
x
x
x
x Li
nalo
ol
x
x
x
x x
x al
pha-
Terp
inen
e
x
x
Dec
amet
hylc
yclo
pent
asilo
xane
x
x x
x x
Ally
l hep
tano
ate
x
H
ydro
xym
ethy
l fur
furo
le
x
al
pha-
Terp
ineo
l
x
x
x
Met
hyl s
alic
ylat
e
x
Isoa
myl
cap
roat
e (3
-met
hylb
utyl
cap
roat
e)
x
Te
trahy
drof
urfu
ryl a
ceta
te
x
C
inna
mal
dehy
de
x
x x
Tr
iace
tin
x
x
E
thyl
cap
roat
e (d
ecan
oate
)
x
Vani
llin
x
x
x
D
imet
hylp
htha
late
x
x
x
x
Eth
yl v
anilli
n
x
Die
thyl
phth
alat
e
x x
x
2-et
hylh
exyl
met
hoxy
cinn
amat
e
x
x
* V
OC
sam
ple
was
not
runn
ing
at th
e en
d of
the
shift
on
day
2 w
hen
diac
etyl
was
use
d in
the
pow
dere
d fla
vorin
g pr
oduc
tion
area
. S
ampl
ing
date
s Aug
ust 2
1 to
Aug
ust 2
5, 2
006.
“D
ay 1
” w
as A
ugus
t 21.

Page 31Health Hazard Evaluation Report 2006-0303-3043
TABLES (CONTINUED)Table 5. Full-shift mean TWA total VOC concentrations1 by plant area
Plant Area Samples Mean STD GM GSD Min MaxOffices 4 1.69 0.01 1.69 1.06 1.57 1.77Laboratory 5 5.52 3.17 4.90 1.70 2.81 10.6Production/Liquids 8 22.4 3.92 22.1 1.19 16.9 28.9Production/Powders 5 24.1 10.1 22.2 1.62 10.3 38.5Warehouse 3 1.28 0.06 1.28 1.04 1.24 1.35
1 Mean concentrations in mg/m3
GM - geometric mean; GSD - geometric standard deviation; STD - standard deviationNote: One VOC sample from the powdered flavoring production area had in excess of 50% of the analyte on the second sorbent tube section, indicating a potential for loss of analyte during sampling.
Table 6. Full-shift mean TWA diacetyl and acetoin air concentrations1 by sample type and area
Plant Area Type Samples Mean STD GM GSD Min MaxOffices Diacetyl (Area) 4 0.005 0.004 0.004 2.08 0.002 0.011
Diacetyl (Personal) 2 0.002 0.001 0.001 2.00 0.001 0.002Acetoin (Area) 4 0.004 0.002 0.003 1.64 0.002 0.007Acetoin (Personal) 2 0.002 0.001 0.002 1.95 0.001 0.002
Laboratory Diacetyl (Area) 5 0.011 0.008 0.009 2.34 0.002 0.021Diacetyl (Personal) 3 0.009 0.008 0.007 2.68 0.002 0.018Acetoin (Area) 5 0.008 0.005 0.006 2.27 0.002 0.015Acetoin (Personal) 3 0.007 0.005 0.006 2.28 0.002 0.013
Production/Liquids
Diacetyl (Area) 8 0.025 0.019 0.020 1.98 0.009 0.065Diacetyl (Personal) 2 0.030 0.014 0.028 1.65 0.020 0.040Acetoin (Area) 8 0.097 0.087 0.064 2.79 0.017 0.256Acetoin (Personal) 2 0.195 0.233 0.103 5.82 0.030 0.360
Production/Powders
Diacetyl (Area) 6 0.249 0.341 0.064 8.56 0.002 0.790Diacetyl (Personal) 9 0.223 0.369 0.055 7.09 0.002 1.13Acetoin (Area) 6 0.120 0.134 0.078 2.64 0.029 0.382Acetoin (Personal) 9 0.235 0.282 0.118 3.75 0.023 0.894
Warehouse Diacetyl (Area) 3 0.009 0.008 0.006 2.66 0.002 0.018Acetoin (Area) 3 0.015 0.011 0.013 2.00 0.007 0.027
1 Mean concentrations in parts per million parts air (ppm).GM - geometric mean; GSD - geometric standard deviation; STD - standard deviation

Page 32 Health Hazard Evaluation Report 2006-0303-3043
TABLES (CONTINUED)Table 7. Partial-shift mean TWA diacetyl and acetoin air concentrations1 in the production room during the production of butter-flavored and vanilla-flavored powders
Plant Area Type Samples Mean STD GM GSD Min MaxProduction /Liquids
Diacetyl (Area) 1 0.002 -- 0.002 -- 0.002 0.002Acetoin (Area) 1 0.002 -- 0.002 -- 0.002 0.002
Production /Powders
Diacetyl (Area) 6 21.2 18.7 12.5 3.63 2.47 47.0Diacetyl (Personal) 2 7.76 1.28 7.70 1.18 6.85 8.66Acetoin (Area) 6 1.35 0.764 1.15 1.92 0.472 2.38Acetoin (Personal) 2 0.378 0.098 0.372 1.30 0.309 0.447
1 Mean concentrations in ppmGM - geometric mean; GSD - geometric standard deviation; STD - standard deviation

Page 33Health Hazard Evaluation Report 2006-0303-3043
TABLES (CONTINUED)Table 8. Full-shift mean TWA acetaldehyde and benzaldehyde air concentrations1 by sample type and area
Plant Area Type Samples Mean STD GM GSD Min MaxOffices Acetaldehyde (Area) 4 0.016 0.005 0.016 1.41 0.009 0.020
Acetaldehyde (Personal) 1 0.0001 -- 0.0001 -- 0.0001 0.0001Benzaldehyde (Area) 4 0.357 0.633 0.096 5.69 0.039 1.31Benzaldehyde (Personal) 1 0.0002 -- 0.0002 -- 0.0002 0.0002
Laboratory Acetaldehyde (Area) 5 0.024 0.013 0.020 2.08 0.006 0.040Acetaldehyde (Personal) 2 0.013 0.013 0.009 3.91 0.003 0.022Benzaldehyde (Area) 5 0.271 0.462 0.113 3.57 0.057 1.10Benzaldehyde (Personal) 2 0.242 0.273 0.146 4.67 0.050 0.435
Production/ Liquids
Acetaldehyde (Area) 8 0.120 0.090 0.073 4.11 0.003 0.303Acetaldehyde (Personal) 3 0.130 0.049 0.124 1.42 0.094 0.185Benzaldehyde (Area) 8 0.189 0.163 0.143 2.18 0.057 0.525Benzaldehyde (Personal) 3 0.089 0.002 0.089 1.02 0.091 0.088
Production/ Powders
Acetaldehyde (Area) 5 0.113 0.123 0.027 24.7 0.0001 0.315Acetaldehyde (Personal) 2 0.057 0.080 0.003 144.8 0.0001 0.114Benzaldehyde (Area) 5 0.138 0.081 0.114 2.13 0.040 0.227Benzaldehyde (Personal) 2 0.510 0.540 0.337 3.96 0.127 0.892
Production / All Over
Acetaldehyde (Personal) 1 0.016 -- 0.016 -- 0.016 0.016Benzaldehyde (Personal) 1 2.23 -- 2.23 -- 2.23 2.23
Warehouse Acetaldehyde (Area) 3 0.012 0.004 0.012 1.34 0.010 0.017Acetaldehyde (Personal) 1 0.015 -- 0.015 -- 0.015 0.015Benzaldehyde (Area) 3 0.034 0.018 0.030 1.83 0.015 0.052Benzaldehyde (Personal) 1 0.091 -- 0.091 -- 0.091 0.091
1Mean concentrations in ppm.GM - geometric mean; GSD - geometric standard deviation; STD - standard deviationNote: One acetaldehyde and two benzaldehyde samples from the production area had in excess of 50% of the analyte on the second sorbent tube section indicating a potential for loss of analyte during sampling.
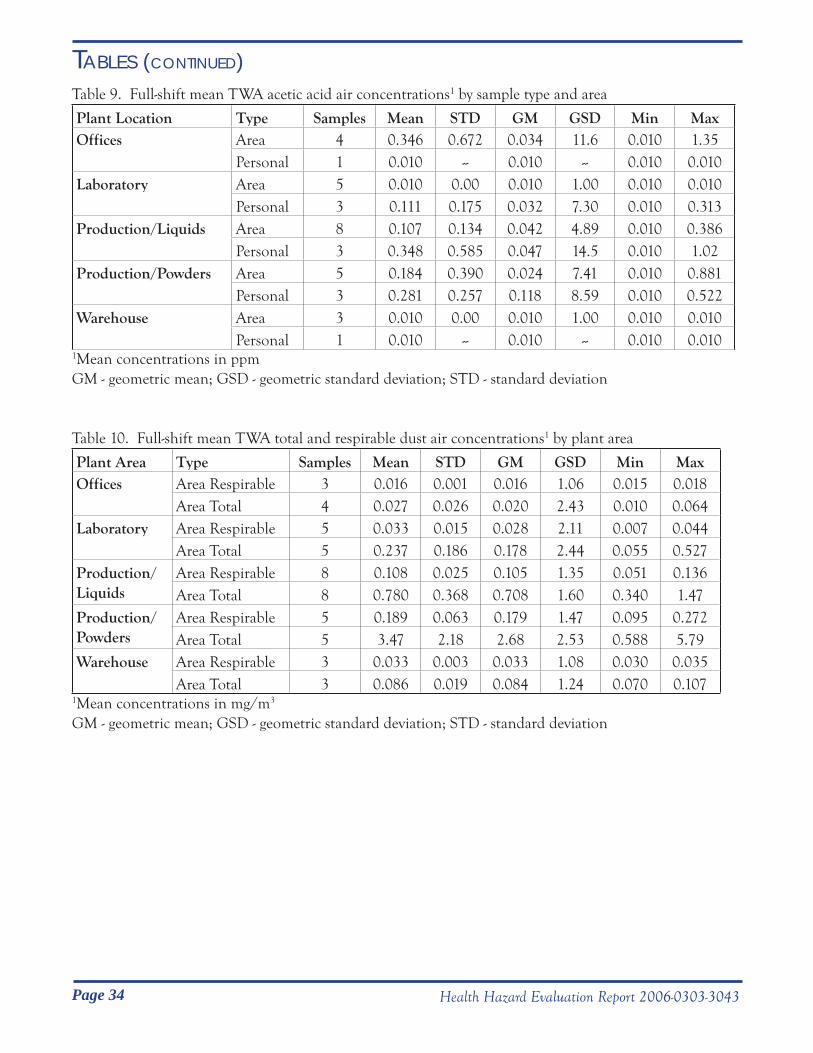
Page 34 Health Hazard Evaluation Report 2006-0303-3043
TABLES (CONTINUED)Table 9. Full-shift mean TWA acetic acid air concentrations1 by sample type and area
Plant Location Type Samples Mean STD GM GSD Min MaxOffices Area 4 0.346 0.672 0.034 11.6 0.010 1.35
Personal 1 0.010 -- 0.010 -- 0.010 0.010Laboratory Area 5 0.010 0.00 0.010 1.00 0.010 0.010
Personal 3 0.111 0.175 0.032 7.30 0.010 0.313Production/Liquids Area 8 0.107 0.134 0.042 4.89 0.010 0.386
Personal 3 0.348 0.585 0.047 14.5 0.010 1.02Production/Powders Area 5 0.184 0.390 0.024 7.41 0.010 0.881
Personal 3 0.281 0.257 0.118 8.59 0.010 0.522Warehouse Area 3 0.010 0.00 0.010 1.00 0.010 0.010
Personal 1 0.010 -- 0.010 -- 0.010 0.0101Mean concentrations in ppmGM - geometric mean; GSD - geometric standard deviation; STD - standard deviation
Table 10. Full-shift mean TWA total and respirable dust air concentrations1 by plant area
Plant Area Type Samples Mean STD GM GSD Min MaxOffices Area Respirable 3 0.016 0.001 0.016 1.06 0.015 0.018
Area Total 4 0.027 0.026 0.020 2.43 0.010 0.064Laboratory Area Respirable 5 0.033 0.015 0.028 2.11 0.007 0.044
Area Total 5 0.237 0.186 0.178 2.44 0.055 0.527Production/Liquids
Area Respirable 8 0.108 0.025 0.105 1.35 0.051 0.136Area Total 8 0.780 0.368 0.708 1.60 0.340 1.47
Production/Powders
Area Respirable 5 0.189 0.063 0.179 1.47 0.095 0.272Area Total 5 3.47 2.18 2.68 2.53 0.588 5.79
Warehouse Area Respirable 3 0.033 0.003 0.033 1.08 0.030 0.035Area Total 3 0.086 0.019 0.084 1.24 0.070 0.107
1Mean concentrations in mg/m3
GM - geometric mean; GSD - geometric standard deviation; STD - standard deviation

Page 35Health Hazard Evaluation Report 2006-0303-3043
FIGURESFigure 1. Diagram of plant
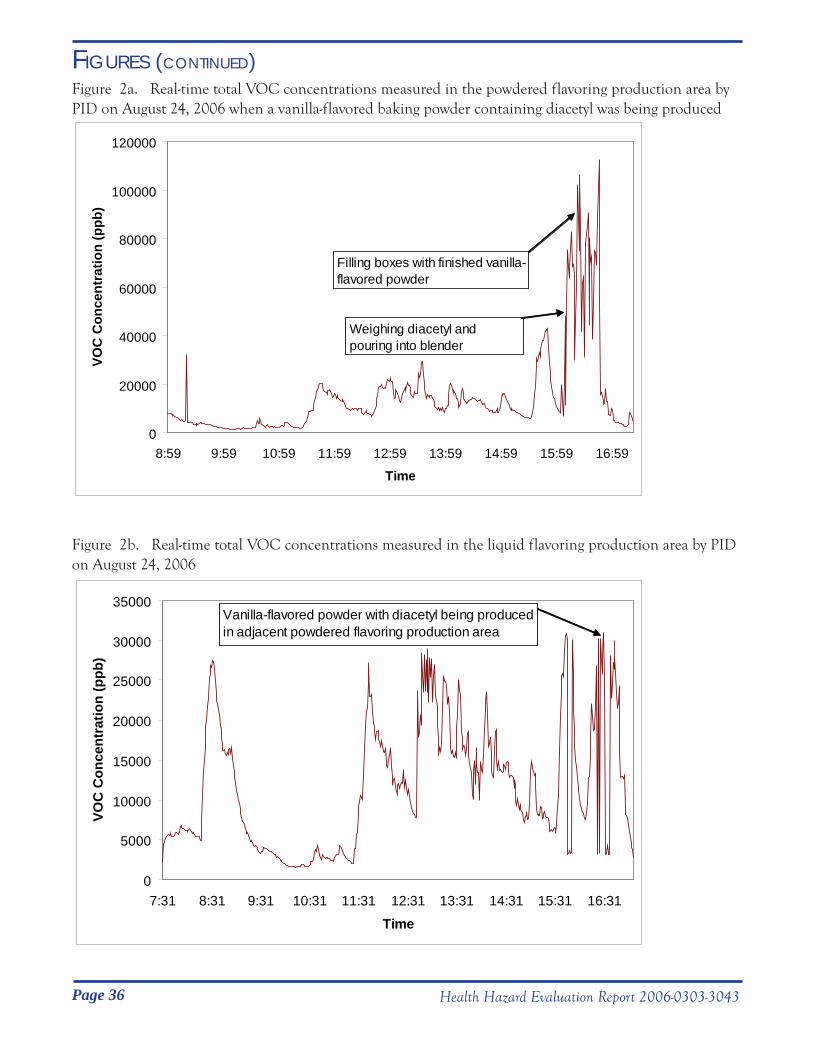
Page 36 Health Hazard Evaluation Report 2006-0303-3043
FIGURES (CONTINUED)Figure 2a. Real-time total VOC concentrations measured in the powdered flavoring production area by PID on August 24, 2006 when a vanilla-flavored baking powder containing diacetyl was being produced
0
20000
40000
60000
80000
100000
120000
8:59 9:59 10:59 11:59 12:59 13:59 14:59 15:59 16:59
Time
VOC
Con
cent
ratio
n (p
pb)
Filling boxes with finished vanilla-flavored powder
Weighing diacetyl and pouring into blender
Figure 2b. Real-time total VOC concentrations measured in the liquid flavoring production area by PID on August 24, 2006
0
5000
10000
15000
20000
25000
30000
35000
7:31 8:31 9:31 10:31 11:31 12:31 13:31 14:31 15:31 16:31
Time
VOC
Con
cent
ratio
n (p
pb)
Vanilla-flavored powder with diacetyl being produced in adjacent powdered flavoring production area

Page 37Health Hazard Evaluation Report 2006-0303-3043
FIGURES (CONTINUED)Figure 2c. Real-time total volatile organic compound concentrations measured by PID in the laboratory area on August 25, 2006
0
1000
2000
3000
4000
5000
6000
7000
8000
9000
7:18 8:18 9:18 10:18 11:18 12:18 13:18 14:18
Time
VOC
Con
cent
ratio
n (p
pb)

Page 38 Health Hazard Evaluation Report 2006-0303-3043
FIGURES (CONTINUED)Figure 3a. Real-time diacetyl and acetoin concentrations measured by FTIR during the mixing of a butter-flavored baking powder on August 22, 2006
0
50
100
150
200
250
15:52
:55
16:01
:28
16:07
:03
16:12
:32
16:17
:28
16:22
:25
16:27
:22
16:32
:19
16:37
:16
16:42
:13
16:47
:09
16:52
:56
16:57
:52
17:02
:48
17:07
:44
17:12
:41
17:17
:36
17:22
:46
17:27
:42
17:32
:39
17:37
:36
17:42
:32
17:47
:29
17:52
:25
17:57
:20
18:02
:16
18:07
:12
18:12
:58
18:17
:53
Time
Dia
cety
l (pp
m)
0
5
10
15
20
25
Ace
toin
(ppm
)
Diacetyl Acetoin
Blending operations
Pouring diacetyl and butter bases into mixing containers
Hand transfer of liquid butter flavor into ribbon blender
Filling boxes with finished butter-flavored powder
Labeling boxes
Weighing and scooping product
Sample at container opening during pour of concentrated diacetyl
Figure 3b. Real-time diacetyl and acetoin concentrations measured by FTIR during the mixing of a vanilla-flavored baking powder on August 24, 2006
0
20
40
60
80
100
120
140
160
180
200
9:03
9:19
9:33
9:4810
:0310
:1810
:3310
:4811
:0211
:1711
:3211
:4712
:0212
:1612
:3112
:4613
:0113
:1613
:3013
:4514
:0014
:1514
:3014
:4515
:0015
:1415
:2915
:4415
:5916
:1316
:2816
:4316
:5817
:13
Time
Dia
cety
l (pp
m)
0
10
20
30
40
50
60
Ace
toin
(ppm
)
DiacetylAcetoin
Filling boxes with finished vanilla-flavored power
Sample at opening of a box of butter flavored powder
Cleaning the blender
Weighing diacetyl and pouring into blender

Page 39Health Hazard Evaluation Report 2006-0303-3043
FIGURES (CONTINUED)Figure 4a. Respirable dust concentrations from the powdered production area during production of a butter-flavored baking powder on August 22, 2006
0
5
10
15
20
25
8:25
9:25
10:25
11:25
12:25
13:25
14:25
15:25
16:25
17:25
18:25
Time
Con
cent
ratio
n (m
g/m
³)
Powder blending
Powder blending with diacetyl
Figure 4b. Respirable dust concentrations from the liquid production area on August 22, 2006
0
0.5
1
1.5
2
2.5
3
8:24
9:24
10:24
11:24
12:24
13:24
14:24
15:24
16:24
17:24
Time
Con
cent
ratio
n (m
g/m
³)

Page 40 Health Hazard Evaluation Report 2006-0303-3043
FIGURES (CONTINUED)Figure 4c. Respirable dust concentrations from the laboratory on August 21, 2006
0
0.1
0.2
0.3
0.4
0.5
0.6
0.7
7:48
8:48
9:48
10:48
11:48
12:48
13:48
14:48
15:48
Time
Con
cent
ratio
n (m
g/m
³)

Page 41Health Hazard Evaluation Report 2006-0303-3043
FIGURES (CONTINUED)Figure 5. Aerodynamic size distribution of airborne dust from production areas
0
10
20
30
40
50
60
1 um 3.5 um 10 um
Aerodynamic Particle Size (micrometers)
Cum
ulat
ive
Perc
ent L
ess
Than
Siz
e
8/22/06, Powder Area
8/24/06, Powder Area
8/25/06, Powder Area
Average, Powder Area
8/22/06, Liquid Area
*Disclaimer: Mention of company names or products does not constitute endorsement by NIOSH.

Page 42 Health Hazard Evaluation Report 2006-0303-3043
MEDICAL SURVEY QUESTIONNAIRE
APPENDIX I
ID:_________
RDHETA 2006 - 0303
Interviewer: ____________ Interview Date: __ __ / __ __ / __ __ __ __ (Month) (Day) (Year)
Section I: Identification and Demographic Information
Name: ____________________________ ______________________ ____ (Last name) (First name) (MI)
Address:_______________________________________________________(Number, Street, and/or Rural Route)
_____________________ ______________ __________ (City) (State) (Zip Code)
Home Telephone Number: ( ) _______ - __________
If you were to move, is there someone who would know how to contact you?
Name: ____________________________ ______________________ ____ (Last name) (First name) (MI)
Relationship to you:____________________
Address:_______________________________________________________ (Number, Street, and/or Rural Route)
_____________________ ______________ __________ (City) (State) (Zip Code)
Home Telephone Number: ( ) _______ - __________
~~~~~~~~~~~~~~~~~~~~~~~~~~~~~~~~~~~~~~~~~~~~~~~~~~~~~~~~~~~~~~~~~~~~
1. Date of Birth: __ __ / __ __ / __ __ __ __ (Month) (Day) (Year)
2. Sex: 1. ____ Male 2. ____ Female
3. Are you Spanish, Hispanic, or Latino? 1.____Yes 0.____No.
4. Select one or more of the following categories to describe your race:
1. ___ White
2. ___ African-American or Black
3. ___ Asian
4. ___ American Indian or Alaska Native
5. ___ Native Hawaiian or Other Pacific Islander

Page 43Health Hazard Evaluation Report 2006-0303-3043
APPENDIX I (CONTINUED)ID:_________
Section II: Health Information
I’m going to ask you some questions about your health. The answer to many of these questions will
be “Yes” or “No.” If you are in doubt about whether to answer “Yes” or “No,” then please answer
“No.”
5. During the last 12 months, have you had any trouble with
your breathing? 1.____Yes 0. ____No
IF YES:
a) Which of the following statements best describes your breathing?
1. ___ I only rarely have trouble with my breathing
2. ___ I have regular trouble with my breathing but it always gets completely better
3. ___ My breathing is never quite right
6. Are you troubled by shortness of breath when hurrying
on level ground or walking up a slight hill? 1. ___ Yes 0. ___ No
IF YES:
a) Do you get short of breath walking with people
of your own age on level ground? 1. ___ Yes 0. ___ No
b) Do you ever have to stop for breath when
walking at your own pace on level ground? 1. ___ Yes 0. ___ No
c) Do you ever have to stop for breath after walking about
100 yards (or after a few minutes) on level ground? 1. ___ Yes 0. ___ No
d) In what month and year did this breathlessness start? __ __ / __ __ __ __ (Month) (Year)
7. Do you usually have a cough? 1. ___ Yes 0. ___ No
(Count cough with first smoke or on first going
out-of-doors. Exclude clearing of throat.)
IF YES:
a) Do you usually cough on most days for 3
consecutive months or more during the year? 1. ___ Yes 0. ___ No
b) In what month and year did this cough begin? __ __ / __ __ __ __ (Month) (Year)

Page 44 Health Hazard Evaluation Report 2006-0303-3043
APPENDIX I (CONTINUED)ID:_________
8. Have you ever had wheezing or whistling in your chest? 1. ___ Yes 0. ___ No
IF YES:
a) Have you had this wheezing or whistling when you
did not have a cold? 1. ___ Yes 0. ___ No
b) In what month and year did this wheezing or
whistling begin? __ __ / __ __ __ __ (Month) (Year)
c) When you are away from this plant on days off
or on vacation, is this wheezing or whistling 1. ___ Better
2. ___ The same
3. ___ Worse
4. ___ N/A
d) During the last 12 months, have you had this
wheezing or whistling in your chest when you
did not have a cold? 1. ___ Yes 0. ___ No
I am now going to ask you some questions about your health during the last four weeks:
9. If you run, or climb stairs fast do you ever cough? 1. ___ Yes 0. ___ No
10. If you run, or climb stairs fast do you ever wheeze? 1. ___ Yes 0. ___ No
11. If you run, or climb stairs fast do you ever get tight in the chest? 1. ___ Yes 0. ___ No
12. Is your sleep ever been broken by wheeze? 1. ___ Yes 0. ___ No
13. Is your sleep ever been broken by difficulty with breathing? 1. ___ Yes 0. ___ No
14. Do you ever wake up in the morning (or from your sleep
if a shift worker) with wheeze? 1. ___ Yes 0. ___ No
15. Do you ever wake up in the morning (or from your sleep
if a shift worker) with difficulty breathing? 1. ___ Yes 0. ___ No
16. Do you ever wheeze if you are in a smoky room? 1. ___ Yes 0. ___ No
17. Do you ever wheeze if you are in a very dusty place? 1. ___ Yes 0. ___ No
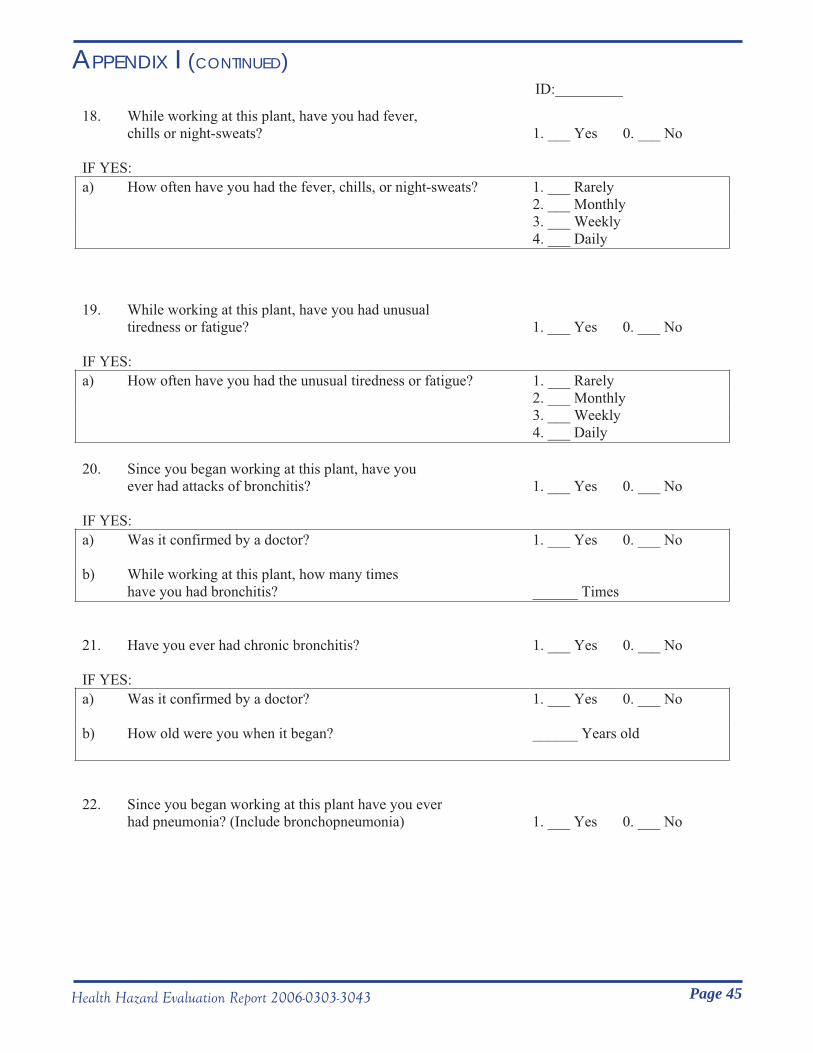
Page 45Health Hazard Evaluation Report 2006-0303-3043
APPENDIX I (CONTINUED)ID:_________
18. While working at this plant, have you had fever,
chills or night-sweats? 1. ___ Yes 0. ___ No
IF YES:
a) How often have you had the fever, chills, or night-sweats? 1. ___ Rarely
2. ___ Monthly
3. ___ Weekly
4. ___ Daily
19. While working at this plant, have you had unusual
tiredness or fatigue? 1. ___ Yes 0. ___ No
IF YES:
a) How often have you had the unusual tiredness or fatigue? 1. ___ Rarely
2. ___ Monthly
3. ___ Weekly
4. ___ Daily
20. Since you began working at this plant, have you
ever had attacks of bronchitis? 1. ___ Yes 0. ___ No
IF YES:
a) Was it confirmed by a doctor? 1. ___ Yes 0. ___ No
b) While working at this plant, how many times
have you had bronchitis? ______ Times
21. Have you ever had chronic bronchitis? 1. ___ Yes 0. ___ No
IF YES:
a) Was it confirmed by a doctor? 1. ___ Yes 0. ___ No
b) How old were you when it began? ______ Years old
22. Since you began working at this plant have you ever
had pneumonia? (Include bronchopneumonia) 1. ___ Yes 0. ___ No
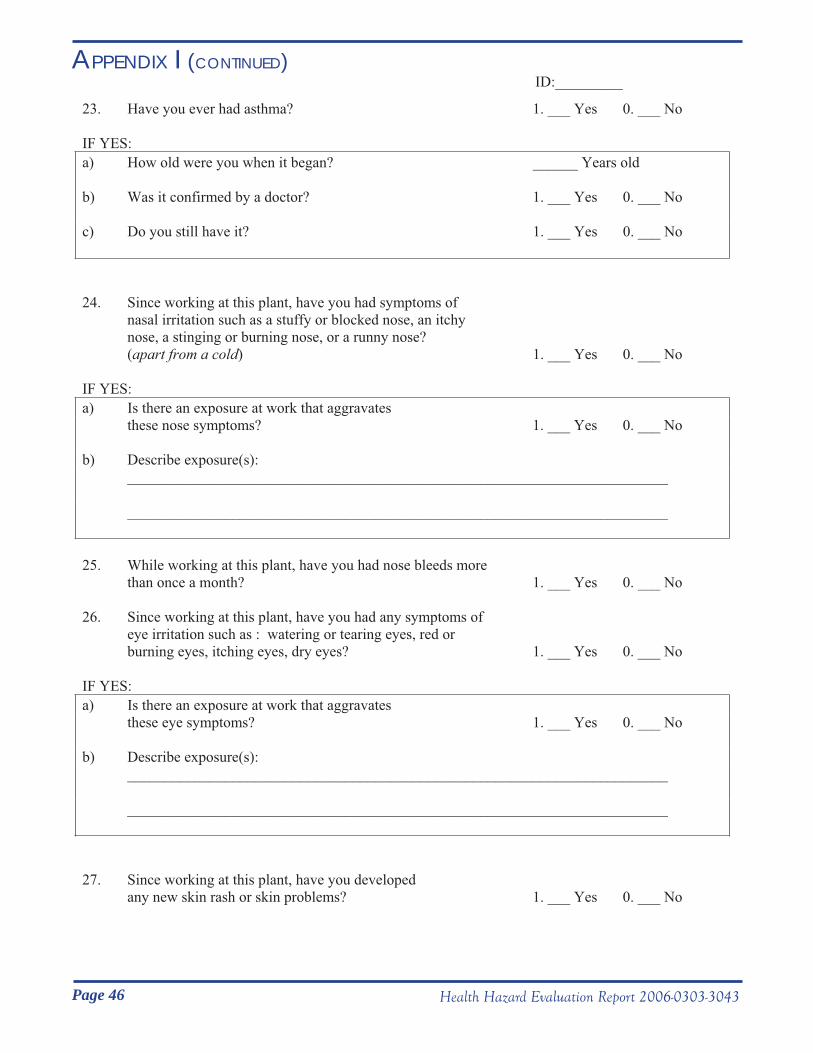
Page 46 Health Hazard Evaluation Report 2006-0303-3043
APPENDIX I (CONTINUED)ID:_________
23. Have you ever had asthma? 1. ___ Yes 0. ___ No
IF YES:
a) How old were you when it began? ______ Years old
b) Was it confirmed by a doctor? 1. ___ Yes 0. ___ No
c) Do you still have it? 1. ___ Yes 0. ___ No
24. Since working at this plant, have you had symptoms of
nasal irritation such as a stuffy or blocked nose, an itchy
nose, a stinging or burning nose, or a runny nose?
(apart from a cold) 1. ___ Yes 0. ___ No
IF YES:
a) Is there an exposure at work that aggravates
these nose symptoms? 1. ___ Yes 0. ___ No
b) Describe exposure(s):
________________________________________________________________________
________________________________________________________________________
25. While working at this plant, have you had nose bleeds more
than once a month? 1. ___ Yes 0. ___ No
26. Since working at this plant, have you had any symptoms of
eye irritation such as : watering or tearing eyes, red or
burning eyes, itching eyes, dry eyes? 1. ___ Yes 0. ___ No
IF YES:
a) Is there an exposure at work that aggravates
these eye symptoms? 1. ___ Yes 0. ___ No
b) Describe exposure(s):
________________________________________________________________________
________________________________________________________________________
27. Since working at this plant, have you developed
any new skin rash or skin problems? 1. ___ Yes 0. ___ No

Page 47Health Hazard Evaluation Report 2006-0303-3043
APPENDIX I (CONTINUED)ID:_________
28. Have you ever had to change your job, job duties, or
work area at this plant because of breathing
difficulties? 1. ___ Yes 0. ___ No
IF YES:
a) What month and year did you change your job,
job duties, or work area? __ __ / __ __ __ __ (Month) (Year)
b) What was your job, job duties, and/or work area before the change?
Describe: ___________________________________________________________
c) How did your job, job duties, and/or work area differ after the change?
Describe:___________________________________________________________
d) Were your breathing problems after the change:
1. ___ Better
2. ___ The Same
3. ___ Worse

Page 48 Health Hazard Evaluation Report 2006-0303-3043
APPENDIX I (CONTINUED)ID:_________
Section III. Work Information
I’m now going to ask you questions about your work history at this plant.
29. Do you or did you work in the production room? 1. ___Yes 0. ___No
IF YES:
a) How many hours per day: __ <1 hour
__ 2-3 hours
__4-8 hours
__> 8 hours
b) Do you mix or pour flavoring chemicals 1. ___Yes 0. ___No
IF YES:
c) Do you handle diacetyl? 1. ___Yes 0. ___No
IF YES:
d) How often do you handle diacetyl: ____ daily
____ 2-3 times per week
____ 2-3 times per month
____ < one time per month
e) Do you work mostly with: ___ liquids
___ powders
___ both
f) Do you wear a respirator or dust mask? ___ Yes, all of the time
___ Yes, some of the time
___ No
IF YES
g) When did you start wearing the respirator or dust mask? ___ / ______
(mm / yyyy)

Page 49Health Hazard Evaluation Report 2006-0303-3043
APPENDIX I (CONTINUED)ID:_________
30. Do you or did you work in the lab? 1. ___Yes 0. ___No
IF YES:
a) Do you mix or pour flavoring chemicals? 1. ___Yes 0. ___No
IF YES:
b) Do you handle diacetyl? 1. ___Yes 0. ___No
IF YES:
c) How often do you handle diacetyl: ___ daily
___ 2-3 times per week
___ 2-3 times per month
___ < 1 one time per month
d) Do you wear a respirator or dust mask? ___ Yes, all of the time
___ Yes, some of the time
___ No
IF YES
e) When did you start wearing the respirator or dust mask? ___ / ______
(mm / yyyy)
31. Do any chemicals make you cough or short of breath? 1. ___Yes 0. ___No
IF YES:
Which chemicals make you cough or short of breath?
_______________________________________________________________________
_______________________________________________________________________
_______________________________________________________________________

Page 50 Health Hazard Evaluation Report 2006-0303-3043
APPENDIX I (CONTINUED)ID:_________
32. If you do not work in the production room, do you ever enter the
production room as part of another job? 1. ___Yes 0. ___No
IF YES:
a) How often do you enter the production room? ___ daily
___ 2-3 times per week
___ 2-3 times per month
___ < 1 time per month
IF DAILY
b) How many times per day? ___ 1 time per day
___ 2-3 times per day
___ 4-8 times per day
___ > 8 times per day
c) How many hours per day do you spend in the
the production room? ___ < 1 hour per day
___ 2-3 hours per day
___ 4-8 hours per day
___ > 8 hours per day
33. During an average work week, how many hours
do you work? ______ Hours per week
34. Have you ever been exposed to a spill or unusual chemical
release at work? 1.___ Yes 0.___ No
IF YES:
What was the
chemical?
What was the date
of the spill?
(mm/yyyy)
Did you have any
symptoms from it?
If Yes,
What were your symptoms?
1.___ Yes 0.___ No
1.___ Yes 0.___ No
1.___ Yes 0.___ No
1.___ Yes 0.___ No
1.___ Yes 0.___ No
1.___ Yes 0.___ No
1.___ Yes 0.___ No
1.___ Yes 0.___ No
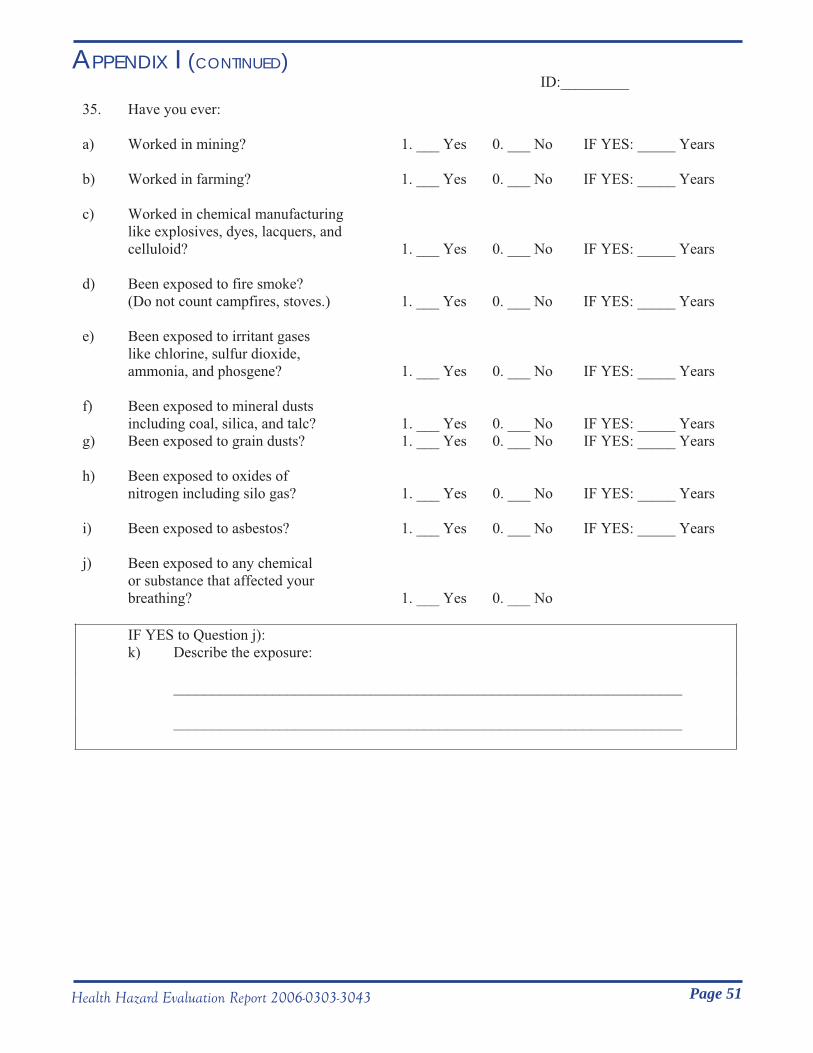
Page 51Health Hazard Evaluation Report 2006-0303-3043
APPENDIX I (CONTINUED)ID:_________
35. Have you ever:
a) Worked in mining? 1. ___ Yes 0. ___ No IF YES: _____ Years
b) Worked in farming? 1. ___ Yes 0. ___ No IF YES: _____ Years
c) Worked in chemical manufacturing
like explosives, dyes, lacquers, and
celluloid? 1. ___ Yes 0. ___ No IF YES: _____ Years
d) Been exposed to fire smoke?
(Do not count campfires, stoves.) 1. ___ Yes 0. ___ No IF YES: _____ Years
e) Been exposed to irritant gases
like chlorine, sulfur dioxide,
ammonia, and phosgene? 1. ___ Yes 0. ___ No IF YES: _____ Years
f) Been exposed to mineral dusts
including coal, silica, and talc? 1. ___ Yes 0. ___ No IF YES: _____ Years
g) Been exposed to grain dusts? 1. ___ Yes 0. ___ No IF YES: _____ Years
h) Been exposed to oxides of
nitrogen including silo gas? 1. ___ Yes 0. ___ No IF YES: _____ Years
i) Been exposed to asbestos? 1. ___ Yes 0. ___ No IF YES: _____ Years
j) Been exposed to any chemical
or substance that affected your
breathing? 1. ___ Yes 0. ___ No
IF YES to Question j):
k) Describe the exposure:
___________________________________________________________________
___________________________________________________________________

Page 52 Health Hazard Evaluation Report 2006-0303-3043
APPENDIX I (CONTINUED)ID
:_________
I’m
no
w g
oin
g t
o a
sk y
ou
so
me
qu
esti
on
s a
bo
ut
all
th
e jo
bs
tha
t y
ou
ha
ve
ha
d w
hil
e a
t th
is p
lan
t. W
e w
ill
sta
rt w
ith
yo
ur
curr
ent
job
an
d w
ork
back
th
rou
gh
tim
e.
Job
Nu
mb
er
Maj
or
Wo
rk A
rea
Job
Tit
le
Sta
rt D
ate
(MM
/YY
YY
)
En
d D
ate
(MM
/YY
YY
)C
om
men
ts
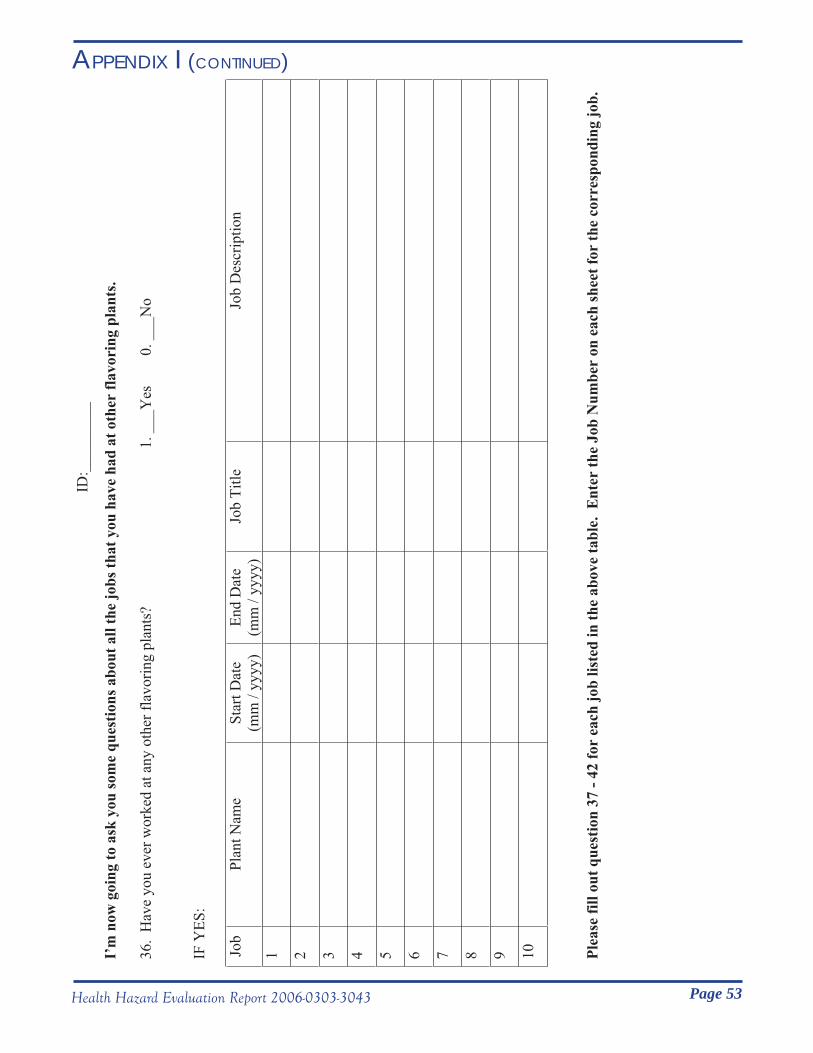
Page 53Health Hazard Evaluation Report 2006-0303-3043
APPENDIX I (CONTINUED)ID
:__
__
__
__
_
I’m
no
w g
oin
g t
o a
sk y
ou
so
me
qu
esti
on
s a
bo
ut
all
th
e jo
bs
tha
t y
ou
ha
ve
ha
d a
t o
ther
fla
vo
rin
g p
lan
ts.
36. H
ave
you e
ver
work
ed a
t an
y o
ther
fla
vori
ng p
lants
?
1. ___Y
es
0. ___N
o
IF Y
ES
:
Job
P
lan
t N
ame
Sta
rt D
ate
(mm
/ y
yy
y)
En
d D
ate
(mm
/ y
yyy)
Job
Tit
le
Job
Des
crip
tio
n
1
2
3
4
5
6
7
8
9
10
Ple
ase
fil
l o
ut
qu
esti
on
37
- 4
2 f
or
each
jo
b l
iste
d i
n t
he
ab
ov
e ta
ble
. E
nte
r th
e J
ob
Nu
mb
er o
n e
ach
sh
eet
for
the
corr
esp
on
din
g j
ob
.
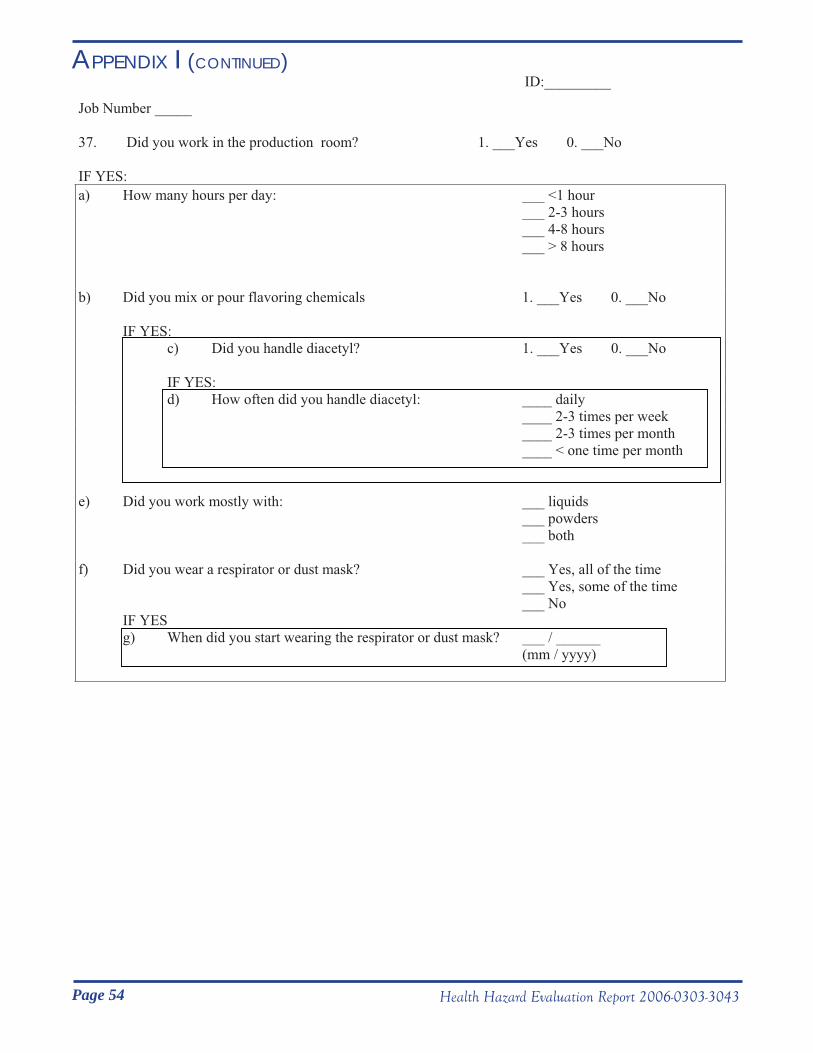
Page 54 Health Hazard Evaluation Report 2006-0303-3043
APPENDIX I (CONTINUED)ID:_________
Job Number _____
37. Did you work in the production room? 1. ___Yes 0. ___No
IF YES:
a) How many hours per day: ___ <1 hour
___ 2-3 hours
___ 4-8 hours
___ > 8 hours
b) Did you mix or pour flavoring chemicals 1. ___Yes 0. ___No
IF YES:
c) Did you handle diacetyl? 1. ___Yes 0. ___No
IF YES:
d) How often did you handle diacetyl: ____ daily
____ 2-3 times per week
____ 2-3 times per month
____ < one time per month
e) Did you work mostly with: ___ liquids
___ powders
___ both
f) Did you wear a respirator or dust mask? ___ Yes, all of the time
___ Yes, some of the time
___ No
IF YES
g) When did you start wearing the respirator or dust mask? ___ / ______
(mm / yyyy)

Page 55Health Hazard Evaluation Report 2006-0303-3043
APPENDIX I (CONTINUED)ID:_________
Job Number _____
38. Did you work in the lab? 1. ___Yes 0. ___No
IF YES:
a) Did you mix or pour flavoring chemicals? 1. ___Yes 0. ___No
IF YES:
b) Did you handle diacetyl? 1. ___Yes 0. ___No
IF YES:
c) How often did you handle diacetyl: ___ daily
___ 2-3 times per week
___ 2-3 times per month
___ < 1 one time per month
d) Did you wear a respirator or dust mask? ___ Yes, all of the time
___ Yes, some of the time
___ No
IF YES
e) When did you start wearing the respirator or dust mask? ___ / ______
(mm / yyyy)
39. Did any chemicals make you cough or short of breath? 1. ___Yes 0. ___No
IF YES:
Which chemicals made you cough or short of breath?
_______________________________________________________________________
_______________________________________________________________________
_______________________________________________________________________

Page 56 Health Hazard Evaluation Report 2006-0303-3043
APPENDIX I (CONTINUED)ID:_________
Job Number _____
40. If you did not work in the production room, did you ever enter the
production room as part of another job? 1. ___Yes 0. ___No
IF YES:
a) How often did you enter the production room? ___ daily
___ 2-3 times per week
___ 2-3 times per month
___ < 1 time per month
IF DAILY
b) How many times per day? ___ 1 time per day
___ 2-3 times per day
___ 4-8 times per day
___ > 8 times per day
c) How many hours per day did you spend in the
the production room? ___ < 1 hour per day
___ 2-3 hours per day
___ 4-8 hours per day
___ > 8 hours per day
41. During an average work week, how many hours
did you work? ______ Hours per week
42. Were you ever exposed to a spill or unusual chemical
release at this job? 1.___ Yes 0.___ No
IF YES:
What was the
chemical?
What was the date of
the spill?
(mm/yyyy)
Did you have any
symptoms from it?
If Yes,
What were your symptoms?
1.___ Yes 0.___ No
1.___ Yes 0.___ No
1.___ Yes 0.___ No
1.___ Yes 0.___ No
1.___ Yes 0.___ No
1.___ Yes 0.___ No
1.___ Yes 0.___ No
1.___ Yes 0.___ No
Page 57Health Hazard Evaluation Report 2006-0303-3043
APPENDIX I (CONTINUED)ID:_________
Section IV: Tobacco Use Information
I’m now going to ask you a few questions about tobacco use.
43. Have you ever smoked cigarettes? 1. ___ Yes 0. ___ No
(NO if less than 20 packs of cigarettes in a
lifetime or less than 1 cigarette a day for 1 year.)
IF YES:
a) How old were you when you first started
smoking regularly? ______ Years old
b) Over the entire time that you have smoked,
what is the average number of cigarettes
that you smoked per day? ______ Cigarettes/day
c) Do you still smoke cigarettes? 1. ___ Yes 0. ___ No
IF NO:
d) How old were you when you stopped
smoking regularly? ______ Years old
Thank you for participating in this survey!

Page 58 Health Hazard Evaluation Report 2006-0303-3043
OCTOBER 2006 INTERIM REPORT
APPENDIX II
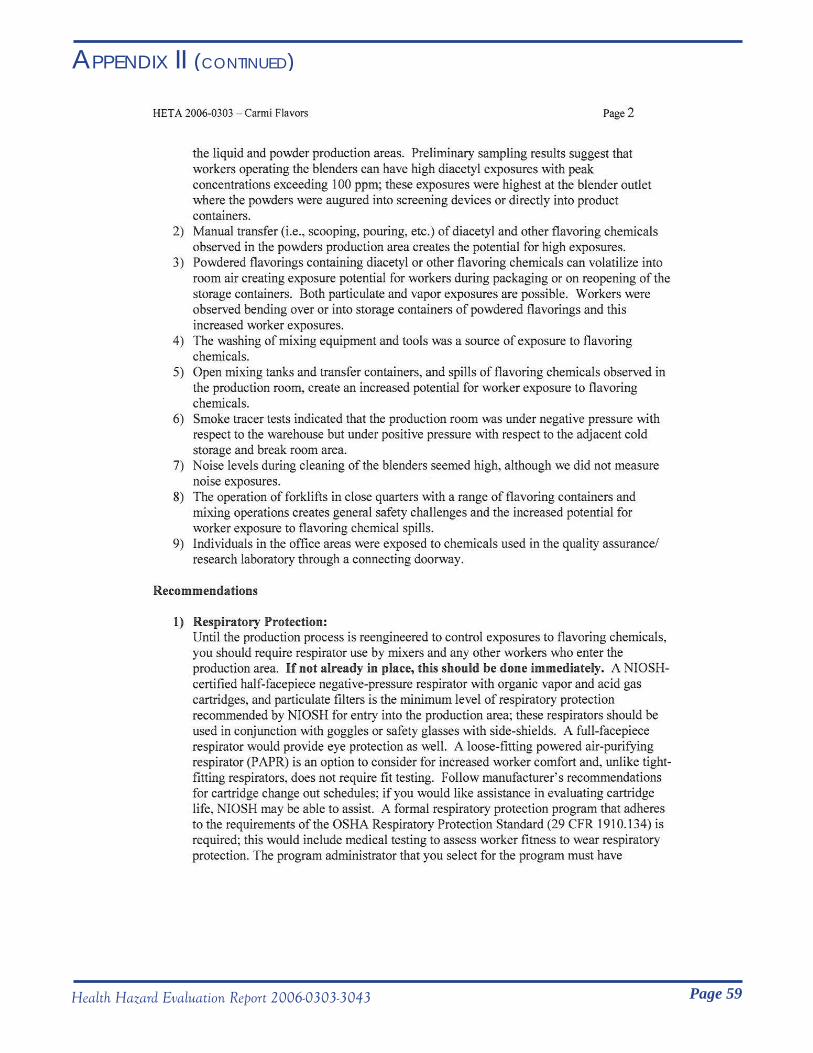
Page 59Health Hazard Evaluation Report 2006-0303-3043
APPENDIX II (CONTINUED)
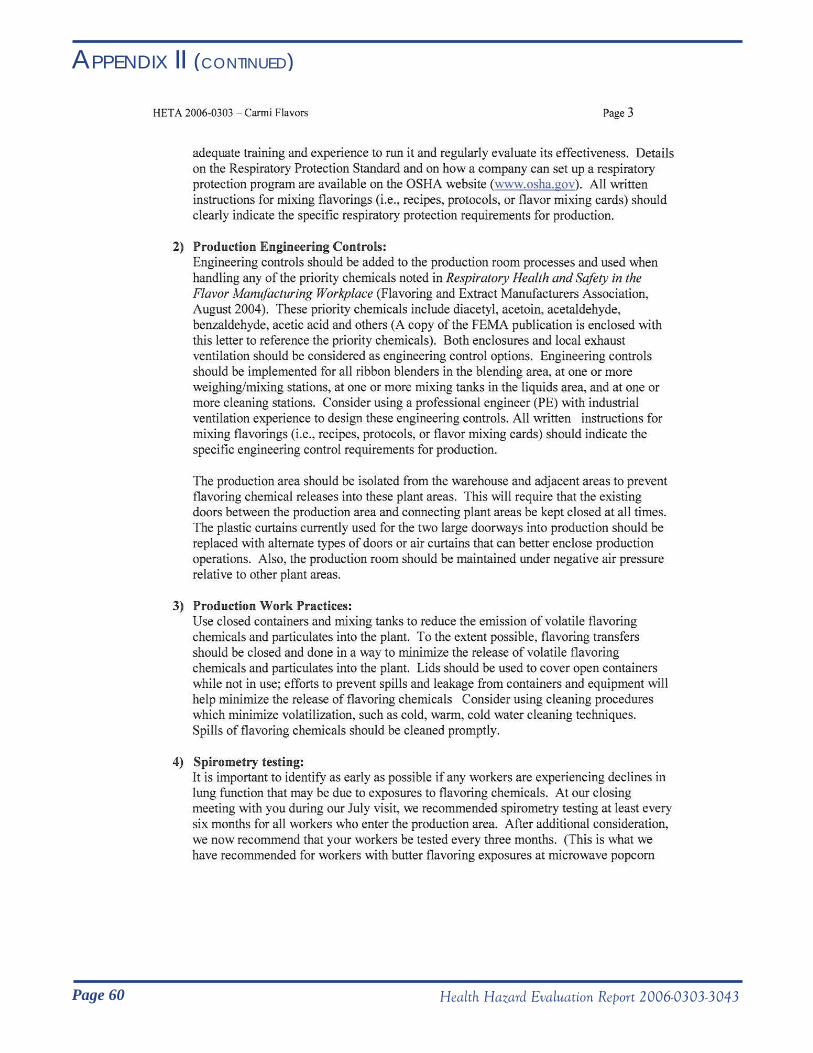
Page 60 Health Hazard Evaluation Report 2006-0303-3043
APPENDIX II (CONTINUED)

Page 61Health Hazard Evaluation Report 2006-0303-3043
APPENDIX II (CONTINUED)
Page 62 Health Hazard Evaluation Report 2006-0303-3043
APPENDIX II (CONTINUED)

Page 63Health Hazard Evaluation Report 2006-0303-3043
EXPOSURE CONTROL GUIDANCE
APPENDIX III
Where possible, it is always best to use engineering controls (e.g., enclosing processes) to reduce exposure followed by administrative controls (e.g., implementing new work practices). The use of respirators is the least attractive option given the burdens placed on the worker to properly use the equipment and upon the employer to administer a respiratory protection program properly. However, given the recent identification of severe work-related obstructive lung disease among workers in the flavoring industry, an approach which seeks to reduce worker exposure immediately is necessary. This approach should include a respiratory protection program for all employees who work in or enter the production area.
The approaches discussed below are somewhat general in nature and they need to be adapted to processes at Carmi Flavors. Carmi Flavors’ management should use their detailed understanding of specific plant processes to implement the exposure controls. In general, worker exposure to air contaminants can be reduced by a combination of efforts to minimize air contaminant emissions and to control the emissions at their source. The ventilation options described below were obtained from an industrial ventilation consultant and the ACGIH Industrial Ventilation Manual [ACGIH 2004]. We have included examples of possible controls from the Industrial Ventilation Manual. Employers should always contact their local air pollution control agency to ensure compliance with emissions requirements for new or revised engineering controls that exhaust to the outdoors.
Work Practices and Process Emission Minimization
The emission of the volatile components in each flavoring mixture can be minimized by preventing spillage and using lids on mixing and holding tanks while not in immediate use. To the extent possible, open containers used to mix and store flavoring chemicals should be covered when not in use. This practice would decrease the evaporation of chemical into the workplace air. Until lids for mixing vessels become available, the continued use of plastic wrap with sealing tape seems appropriate for this purpose. Manual handling of chemicals also provides a potentially significant source of worker exposures and emissions. Use of closed transfer processes, where feasible, would significantly reduce exposure. Also slow, careful pouring/handling of chemicals can reduce splashing, spillage, and exposure during this activity. Reducing spills and eliminating leakage from vessels will aid in reducing the overall emission of chemicals into the workplace and thereby lower worker exposure.
Another source of evaporation of chemicals may come from the cleaning of mixing tanks using hot water. A suggested change in process, which includes an initial wash down with cold water followed by a rinse with warm water, may reduce the emission of chemical vapors during tank cleaning. Another potential method for reducing emissions is to provide cold storage of chemicals on the Flavor and Extract Manufacturer’s Association (FEMA) priority list prior to use. The pouring and mixing of these chemicals at a lower temperature should reduce the amount of evaporative emissions arising from their use.
Ventilation Controls
The options presented below are a result of our observations of the work processes and measurements collected while at the plant. A general approach that addresses each potential emission point is detailed

Page 64 Health Hazard Evaluation Report 2006-0303-3043
APPENDIX III (CONTINUED)along with some engineering control alternatives. There are several different approaches that could be used to control worker exposure to dust and vapors in your plant. The approaches outlined below have not been fully evaluated. The assistance of a qualified ventilation engineer is necessary for the design and implementation of any additions or modifications to your facility.
Where applicable, we have provided a list of suppliers for various engineering control devices. We are providing them as examples of approaches to reduce occupational exposures. Mention of company names or products does not constitute endorsement by NIOSH.
General Ventilation - The production area should be isolated from the warehouse and adjacent areas to keep chemical vapors from migrating and becoming a source of exposure for other workers. This will require that doors between the production area and connecting areas be kept closed when not in use. Also, the office area should be placed under positive pressure relative to the laboratory and warehouse—air should flow out of the office into both the laboratory and warehouse. This may be accomplished simply by increasing the air supply to the office. A higher air supply flow to the office area will help maintain a positive pressure with respect to adjacent areas. A simple test using smoke tracer tubes can be used to indicate the direction of airflow.
When making these adjustments, it is important to make sure that the pressure differential does not negatively affect the operation of the laboratory. A pressure differential of greater than approximately 0.05 inches of water from the office to adjacent areas will make opening of the doors difficult due to the air pressure exerted on the surface of the door.
Mixing tank / kettle ventilation - The control of exposure to chemicals from mixing tanks and kettles during pouring and mixing operations is critical. A primary source of exposure in the liquid compounding room is the evaporation of chemicals from the mixing tanks. The use of local exhaust ventilation at the source is a fundamental method that should be used to minimize emissions into the production room and thereby reduce worker exposure.
Controlling evaporation of chemicals from tanks during mixing operations:
To contain evaporation during mixing, one approach which has been adopted by another flavoring company is to keep the tanks under slight negative pressure at all times. Their approach was to use hinged tank lids which remained closed during mixing but were modified with a ventilation takeoff which was exhausted at a low flow rate.
Another approach would be to move the tanks into a ventilated enclosure while they are mixing. The use of a ventilated booth with flexible strip curtains would allow for the movement of mixing tanks into and out of the ventilated enclosure (Figure 1 in this appendix). A low flow rate should be sufficient to maintain a negative pressure in the enclosure.
Controlling worker exposure during pouring operations for tanks smaller than two feet in diameter: During pouring and other activities which require operator involvement, additional localized exhaust is required to capture the vapors due to the increased surface area open to the atmosphere and the proximity of the worker to the chemicals.
One method for reducing the emission from the surface is to minimize the amount of open area. Using lids with smaller openings for adding ingredients through funnels is an option
1.
2.
a.
1.
2.
b.
1.
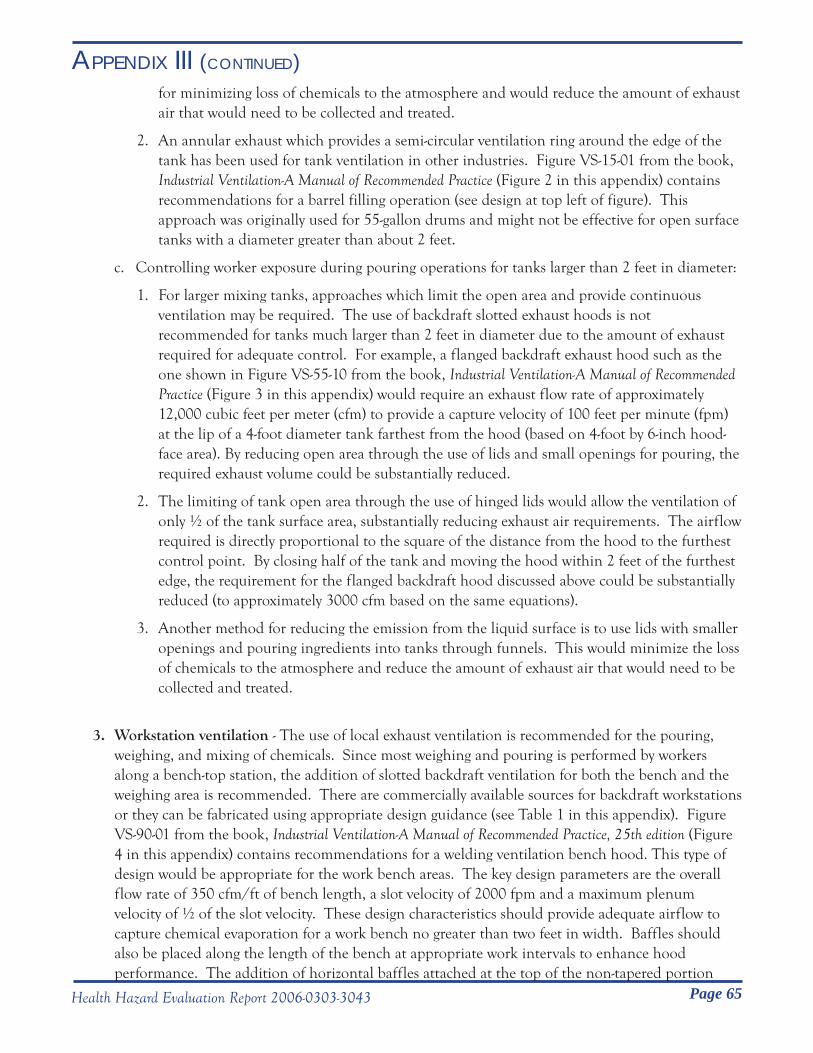
Page 65Health Hazard Evaluation Report 2006-0303-3043
APPENDIX III (CONTINUED)for minimizing loss of chemicals to the atmosphere and would reduce the amount of exhaust air that would need to be collected and treated.
An annular exhaust which provides a semi-circular ventilation ring around the edge of the tank has been used for tank ventilation in other industries. Figure VS-15-01 from the book, Industrial Ventilation-A Manual of Recommended Practice (Figure 2 in this appendix) contains recommendations for a barrel filling operation (see design at top left of figure). This approach was originally used for 55-gallon drums and might not be effective for open surface tanks with a diameter greater than about 2 feet.
Controlling worker exposure during pouring operations for tanks larger than 2 feet in diameter:
For larger mixing tanks, approaches which limit the open area and provide continuous ventilation may be required. The use of backdraft slotted exhaust hoods is not recommended for tanks much larger than 2 feet in diameter due to the amount of exhaust required for adequate control. For example, a flanged backdraft exhaust hood such as the one shown in Figure VS-55-10 from the book, Industrial Ventilation-A Manual of Recommended Practice (Figure 3 in this appendix) would require an exhaust flow rate of approximately 12,000 cubic feet per meter (cfm) to provide a capture velocity of 100 feet per minute (fpm) at the lip of a 4-foot diameter tank farthest from the hood (based on 4-foot by 6-inch hood-face area). By reducing open area through the use of lids and small openings for pouring, the required exhaust volume could be substantially reduced.
The limiting of tank open area through the use of hinged lids would allow the ventilation of only ½ of the tank surface area, substantially reducing exhaust air requirements. The airflow required is directly proportional to the square of the distance from the hood to the furthest control point. By closing half of the tank and moving the hood within 2 feet of the furthest edge, the requirement for the flanged backdraft hood discussed above could be substantially reduced (to approximately 3000 cfm based on the same equations).
Another method for reducing the emission from the liquid surface is to use lids with smaller openings and pouring ingredients into tanks through funnels. This would minimize the loss of chemicals to the atmosphere and reduce the amount of exhaust air that would need to be collected and treated.
Workstation ventilation - The use of local exhaust ventilation is recommended for the pouring, weighing, and mixing of chemicals. Since most weighing and pouring is performed by workers along a bench-top station, the addition of slotted backdraft ventilation for both the bench and the weighing area is recommended. There are commercially available sources for backdraft workstations or they can be fabricated using appropriate design guidance (see Table 1 in this appendix). Figure VS-90-01 from the book, Industrial Ventilation-A Manual of Recommended Practice, 25th edition (Figure 4 in this appendix) contains recommendations for a welding ventilation bench hood. This type of design would be appropriate for the work bench areas. The key design parameters are the overall flow rate of 350 cfm/ft of bench length, a slot velocity of 2000 fpm and a maximum plenum velocity of ½ of the slot velocity. These design characteristics should provide adequate airflow to capture chemical evaporation for a work bench no greater than two feet in width. Baffles should also be placed along the length of the bench at appropriate work intervals to enhance hood performance. The addition of horizontal baffles attached at the top of the non-tapered portion
2.
c.
1.
2.
3.
3.

Page 66 Health Hazard Evaluation Report 2006-0303-3043
APPENDIX III (CONTINUED)of the hood and extending six inches or more will further enhance the slot hood performance. Alternatively, a simple bench-top mixing hood designed for 100-150 cfm per square foot of open access area could enclose the pouring operation and sufficiently contain any generated contaminant at a lower air and energy expense (see Figure 5 in this appendix).
Bag dump ventilation for blenders - Significant dust exposures are possible during bag dumping. No local exhaust ventilation was in place at the 8 ft 3 in x 2 ft 5 in powder blender located along the eastern wall of the production area. Figure VS-50-10 from Industrial Ventilation-A Manual of Recommended Practice (Figure 6 in this appendix) contains recommendations for a bag dump station. The primary design considerations are to enclose the face of the blender as much as possible and to maintain a face velocity of approximately 150 feet per minute. For large blenders, the use of properly designed slots would help distribute the exhaust flow more evenly across the face of the hood. A secondary source of exposure is the handling of the bags following dumping. This process has been shown in other industries to be a major source of uncontrolled exposure. An integral pass through to a bag disposal chute/compactor may help reduce dust exposure resulting from bag handling. Other approaches may also be beneficial; one study reported that a company sprayed the inside of bags with water before compacting to reduce dust generations. There are several commercial vendors of bag dumping and handling stations (see Table 1).
Blender product collection - Another important source of dust exposure is in the collection of powder product from the ribbon blender. There are several ways to reduce the escape of dust from this process. The use of an elastic cord to secure the top of the product bag to the outlet of the blender while product is being unloaded would provide a simple method to reduce dust escape during this process. A solution being used in other industries is the continuous liner which provides a continuous pull-down bag which can be crimped at each end to contain any dust generated during product collection (see Table 1). The use a local exhaust ventilation hood around the outlet could provide containment of the potential dust emissions. A hood such as the one shown in Figure VS-15-02 from Industrial Ventilation-A Manual of Recommended Practice (Figure 7 in this appendix) provides a ventilated collar around the discharge point.
4.

Page 67Health Hazard Evaluation Report 2006-0303-3043
APPENDIX III (CONTINUED)Table 1. List of ventilation product manufacturers (Disclaimer: Mention of company names or products does not constitute endorsement by NIOSH.)
Backdraft Ventilation Work Bench
Suppliers
Bag Opening, Emptying, and
Disposal Product Suppliers
Dust Collection/Containment
Systems
TBJ Incorporated
1671 Orchard Drive
Chambersburg, Pennsylvania 17201
Phone: (717) 261-9700
Web address: www.tbjinc.com
Whirl-Air Flow
20055 177th Street
Big Lake, Minnesota 55309
Phone: (800) 373-3461
Web address: http://www.whirlair.
com/index.htm
Ventilation Sleeves for Dust Containment
EHS Solutions
3309 Woodhams Avenue
Portage, Michigan 49002
Phone: (800) 463-7817
Web address: http://www.ehsnow.
com/products_ventilation-sleeve.html
Mopec, Inc.
21750 Coolidge Highway
Oak Park, Michigan 48237
Phone: (800) 362-8491
Web address: http://www.mopec.
com/index.html (see grossing stations/
backdraft)
Hapman
2002 East Kilgore Road
Kalamazoo, Michigan 49048
Phone: (800) 427-6260
Web address: http://www.hapman.
com/
Continuous Liner
ILC Dover
One Moonwalker Road
Frederica, Delaware, 19946-2080
Phone: (302) 335-3911
Web address: http://www.ilcdover.
com/products/pharm_biopharm/
operations/continuousliner.htm
Labconco Incorporated
8811 Prospect Avenue
Kansas City, Missouri 64132-2696
Phone: (800) 821-5525
Web address: http://www.labconco.
com/_Scripts/editc25.asp?catid=325
(see lab fume hoods for examples of
backdraft type benches)
Young Industries
PO Box 30
Muncy, Pennsylania 17756-0030
Phone: (570) 54-3165
Web address: http://www.younginds.
com/
Continuous Liner
Fab Ohio
52 East 7th Street
Uhrichsville, Ohio 44683
Phone: (740) 922-4233
Web Address: http://www.fabohio.
com/
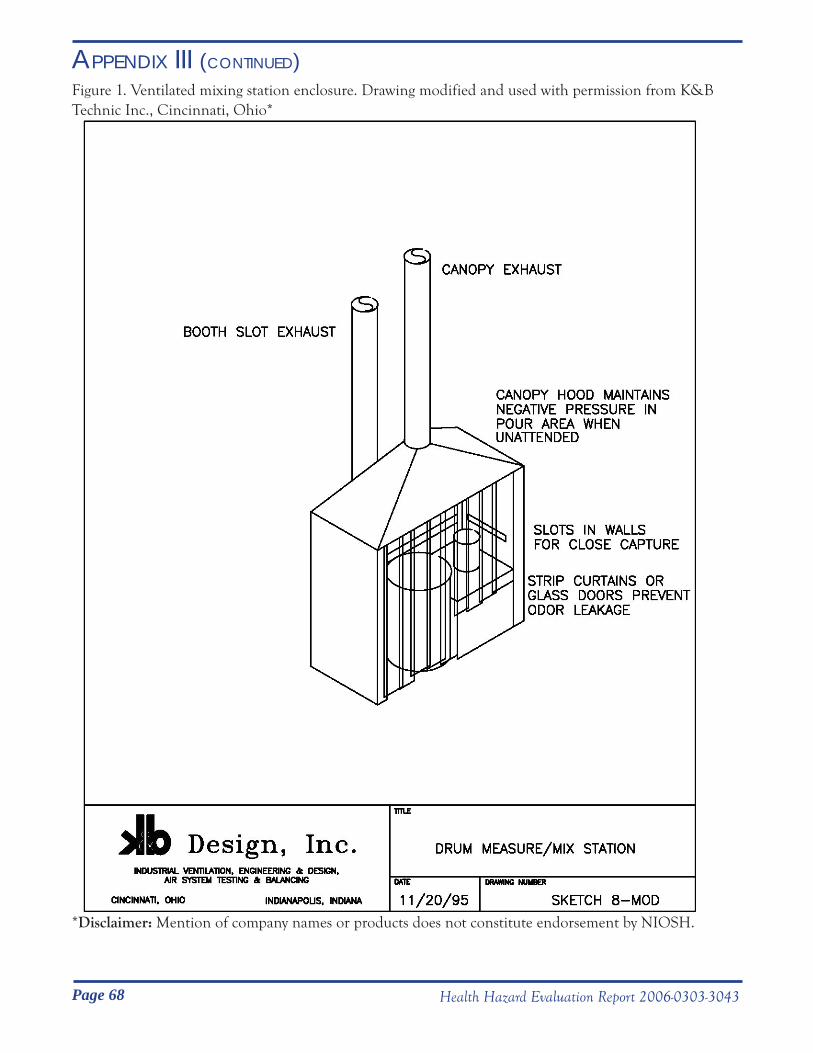
Page 68 Health Hazard Evaluation Report 2006-0303-3043
APPENDIX III (CONTINUED)Figure 1. Ventilated mixing station enclosure. Drawing modified and used with permission from K&B Technic Inc., Cincinnati, Ohio*
*Disclaimer: Mention of company names or products does not constitute endorsement by NIOSH.

Page 69Health Hazard Evaluation Report 2006-0303-3043
APPENDIX III (CONTINUED)Figure 2. Figure VS-15-01 from ACGIH Industrial Ventilation Manual (ACGIH 2004)

Page 70 Health Hazard Evaluation Report 2006-0303-3043
APPENDIX III (CONTINUED)Figure 3. Figure VS-55-10 from ACGIH Industrial Ventilation Manual (ACGIH 2004)

Page 71Health Hazard Evaluation Report 2006-0303-3043
APPENDIX III (CONTINUED)Figure 4. Figure VS-90-01 from ACGIH Industrial Ventilation Manual (ACGIH 2004)
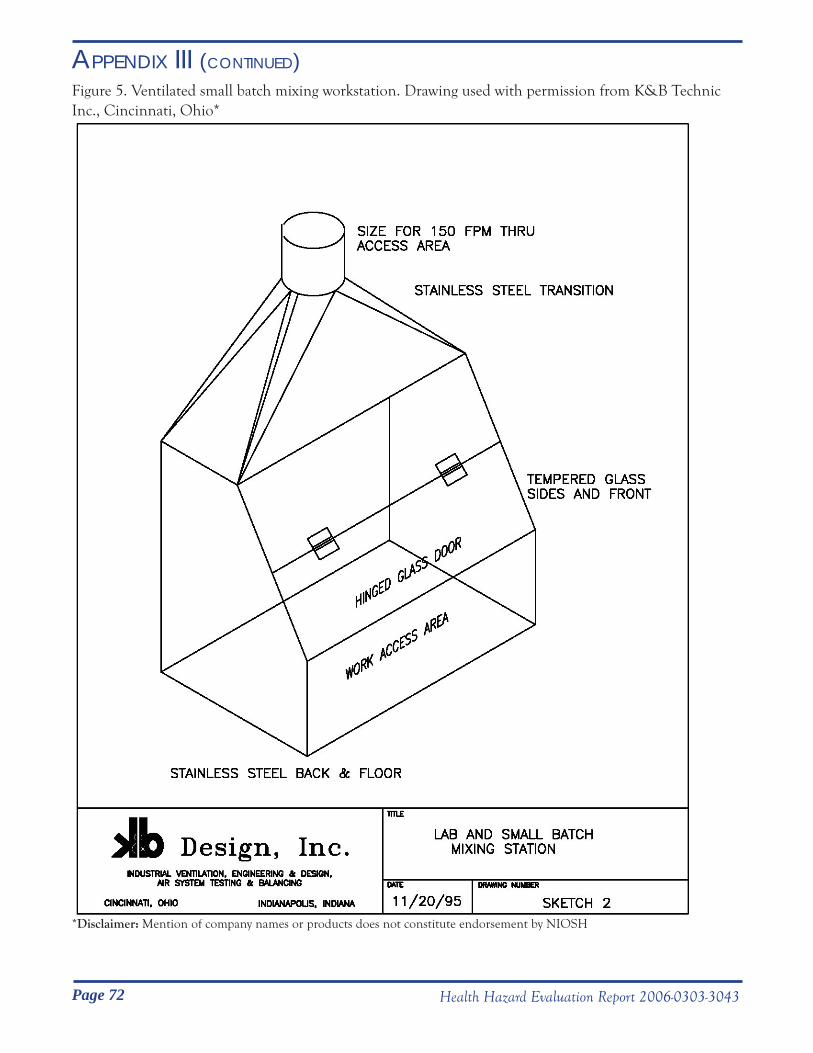
Page 72 Health Hazard Evaluation Report 2006-0303-3043
APPENDIX III (CONTINUED)Figure 5. Ventilated small batch mixing workstation. Drawing used with permission from K&B Technic Inc., Cincinnati, Ohio*
*Disclaimer: Mention of company names or products does not constitute endorsement by NIOSH

Page 73Health Hazard Evaluation Report 2006-0303-3043
APPENDIX III (CONTINUED)Figure 6. Figure VS-50-10 from ACGIH Industrial Ventilation Manual (ACGIH 2004)
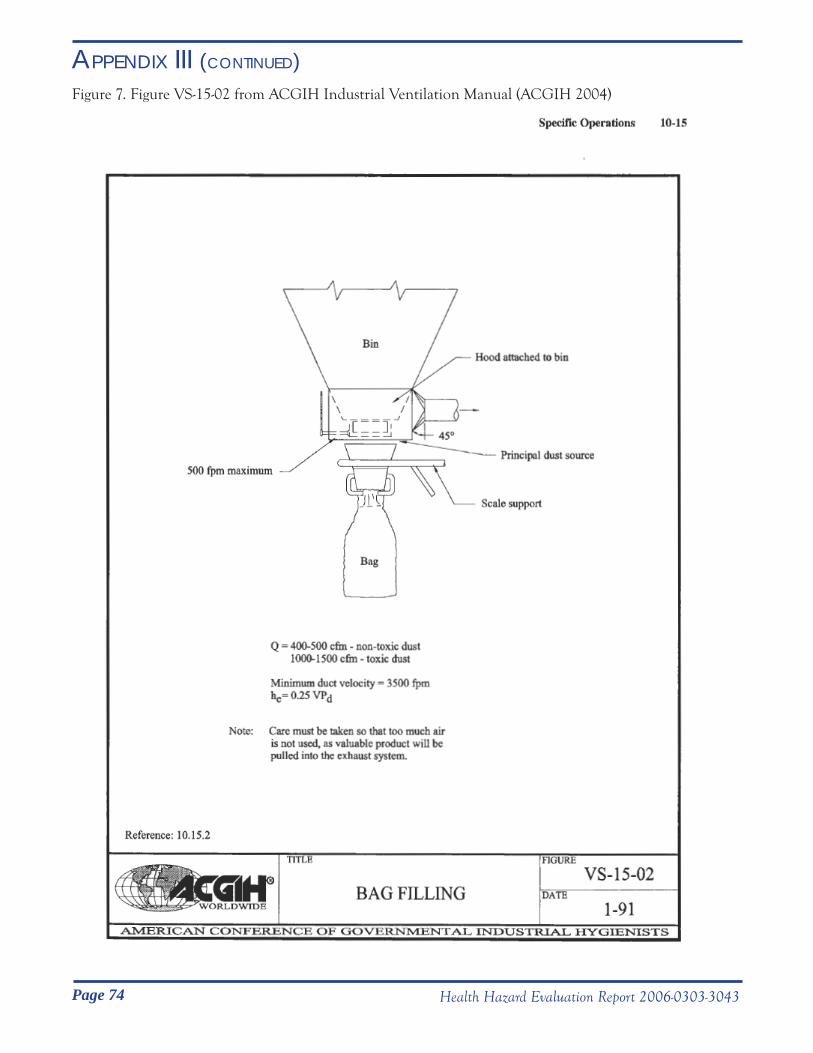
Page 74 Health Hazard Evaluation Report 2006-0303-3043
APPENDIX III (CONTINUED)Figure 7. Figure VS-15-02 from ACGIH Industrial Ventilation Manual (ACGIH 2004)
Page 75Health Hazard Evaluation Report 2006-0303-3043
The Respiratory Disease Hazard Evaluation and Technical Assistance Program (RDHETAP) of NIOSH conducts field investigations of possible health hazards in the workplace. These investigations are conducted under the authority of Section 20(a)(6) of the Occupational Safety and Health (OSH) Act of 1970, 29 U.S.C. 669(a)(6), or Section 501(a)(11) of the Federal Mine Safety and Health Act of 1977, 30 U.S.C. 951(a)(11), which authorizes the Secretary of Health and Human Services, following a written request from any employers or authorized representative of employees, to determine whether any substance normally found in the place of employment has potentially toxic effects in such concentrations as used or found.
RDHETAP also provides, upon request, technical and consultative assistance to federal, state, and local agencies; labor; industry; and other groups or individuals to control occupational health hazards and to prevent related trauma and disease. Mention of company names or products does not constitute endorsement by NIOSH.
This report was prepared by Richard Kanwal and Greg Kullman, of RDHETAP, Division of Respiratory Disease Studies. Field assistance was provided by Diana Freeland, Brian Tift, Thomas Jefferson, and Nancy Sahakian of the Division of Respiratory Disease Studies, Lauralynn Taylor Mckernan of the Division of Surveillance, Hazard Evaluations, and Field Studies, Kevin Dunn of the Division of Applied Research and Technology, Barbara Materna of CDHS-OHB, and Mary Kochie, Zohra Ali, and Kelly Howard of Cal/OSHA. The content for Appendix III (Exposure Control Guidance) was provided by Kevin Dunn. Statistical programming was provided by Nicole Edwards. Analytical support was provided by the Division of Applied Research and Technology, and Datachem, Inc. Desktop publishing was performed by Nicole Edwards.
Copies of this report have been sent to employee and management representatives at Carmi Flavor and Fragrance Comapny, Inc., and to CDHS-OHB and Cal/OSHA. This report is not copyrighted and may be freely reproduced. The report may be viewed and printed from the following internet address: http://www.cdc.gov/niosh/hhe. Copies may be purchased from the National Technical Information Service (NTIS) at 5825 Port Royal Road, Springfield, Virginia 22161. Information regarding the NTIS stock number may be obtained from the NIOSH Publications Office at the Cincinnati address.
ACKNOWLEDGEMENTS AND AVAILABILITY OF REPORT
NIOSH [2007]. Health Hazard Evaluation Report: Report on Severe Fixed Obstructive Lung Disease in Workers at a Flavoring Manufacturing Plant, Commerce, California. Cincinnati, OH: U.S. Department of Health and Human Services, Public Health Service, Centers for Disease Control and Prevention, National Institute for Occupational Safety and Health, NIOSH HETA No. 2006-0303-3043.
To receive NIOSH documents or information about occupational safety and health topics contact NIOSH at:1-800-35-NIOSH (356-4674)Fax: 1-513-533-8573E-mail: [email protected] visit the NIOSH web site at:http://www.cdc.gov/niosh
Delivering on the Nation’s promise:Safety and Health at work for all peoplethrough research and prevention.
National Institute for Occupational Safety and Health