report on second-hand smoke in prisons: final report · report title : report on second-hand smoke...
TRANSCRIPT

October 2015
REPORT ON SECOND-HAND SMOKE IN
PRISONS: FINAL REPORT
National Offender Management Service
3513889A
Final


Report on Second-Hand Smoke in Prisons: Final Report
3513889A
Prepared for National Offender Management Service
Prepared by
Parsons Brinckerhoff
www.pbworld.com
Report on Second-Hand Smoke in Prisons: Final Report
SHS in Prisons Final Report Prepared by Parsons Brinckerhoff September 2015 for National Offender Management Service - 4 -
Report Title : Report on Second-Hand Smoke in Prisons: Final Report
Report Status : Final
Date : October 2015
DOCUMENT HISTORY AND STATUS
Document control
Prepared by
Name Organisation
Checked by (technical)
Sean Semple, PhD
Respiratory Group, Division of Applied Health Sciences, University of Aberdeen, Aberdeen
Karen Galea, PhD
Centre for Human Exposure Science, Institute of Occupational Medicine, Edinburgh
Peter Walsh, PhD WSP | Parsons Brinckerhoff Limited, Exeter
Bethan Tuckett-Jones, PhD
WSP | Parsons Brinckerhoff Limited, Cardiff
Approved by Bethan Tuckett-Jones
Checked by (quality assurance)
Revision details
Version Date Pages
affected Comments
1.00 14/08/2015
2.00 29/09/2015

CONTENTS Page
Executive Summary 7
1 Introduction 8
1.1 Scope and Purpose 8
2 Sampling Undertaken 8
2.1 Sampling overview 8
2.2 Monitoring protocols 9
2.3 Self Reporting Questionnaire 10
2.4 Practical considerations 10
2.5 Constraints 11
2.6 Pilot Study 12
2.7 Data Analysis 16
3 Results 18
3.1 Overview 18
3.2 Prison Staff Exposure to SHS 18
3.3 Self-reported exposure to SHS 21
3.4 Exhaled CO results 22
3.5 Prison Staffs‟ salivary cotinine results 22
3.6 Ambient Concentrations of SHS 23
3.7 Prison cell SHS concentrations 24
3.8 PM2.5 Concentration Differences between Smoking and Non-Smoking Cells 26
3.9 24-hr monitoring of SHS concentrations in Prison wings 29
3.10 „Spot‟ monitoring of SHS concentrations in the prisons 29
3.11 Multi-Day Samples 30
4 Discussion 34
4.1 Prison Staff exposure to SHS 34
4.2 Discussion of ambient concentrations to SHS 36
4.3 Discussion of Weekly Samples 36
5 Conclusions and recommendation 38
6 ACKNOWLEDGEMENTS 38
References 39
Appendix A – Sample Summaries 41
Appendix B – Temporal Plots of All 30 Valid Full Shift Personal Exposure Measurements 49
Appendix C – Temporal plots of Weekly Wing Surveys 58
Appendix D – Personal Prison Staff Daily Diary 64
Appendix E – In Cell Measurements Collected using Sidepak Monitoring Devices 66
Appendix F – Comparison of Mean and Maximum PM2.5 Concentrations for Prison Cell measurements 73
Report on Second-Hand Smoke in Prisons: Final Report
SHS in Prisons Final Report Prepared by Parsons Brinckerhoff September 2015 for National Offender Management Service - 6 -
Appendix G – Mean and Maximum PM2.5 Concentrations recorded by Dylos for Individual Spot Measurements 74
Appendix H –SHS in Prisons Pilot Study 75
Tables Table 2-1 Prisons sampled as part of the SHS in Prisons sampling programme ................................... 9 Table 2-2 Samples Collected during the SHS in Prisons Study ........................................................... 14 Table 3-1 Prison Staffs‟ salivary cotinine result .................................................................................... 23 Figures Figure 2-1 Dylos & Apex Monitoring Device and tamper proof container ............................................. 11 Figure 2-2 Sealed Tamper-proof container in-situ ................................................................................ 11 Figure 2-3 Pilot Study Comparison between Sidepak and Dylos Static Landing measurement A Wing 10/02/2015 to 11/02/2015 ..................................................................................................................... 16 Figure 3-1 Boxplot of personal PM2.5 exposure of prison staff .............................................................. 19 Figure 3-2 Three typical PM2.5 exposure patterns of Prison staff across a work shift .......................... 20 Figure 3-3 Boxplot of self-reported exposure to SHS as a percentage of the work shift of prison staff .............................................................................................................................................................. 22 Figure 3-4 Typical Particulate Traces of SHS using a Dylos instrument within Cell of a Prisoner who smokes (Long Lartin) and of a non-smoking prisoner (Leyhill) ............................................................. 25 Figure 3-5 Dylos measurement of PM2.5 in a non-smoker cell occupied by a smoker, Winchester Prison .................................................................................................................................................... 26 Figure 3-6 Box plot of average PM2.5 detected in smoking cells and non-smoking cells across 6 Prisons .................................................................................................................................................. 27 Figure 3-7 Comparison of Dylos PM2.5 Concentrations in (AM) Smoker Cell and Non-Smoker Cells across all 6 prisons, indicating category of prison surveyed ................................................................. 28 Figure 3-8 Dylos measurements of PM2.5 on a wing over 24 hours, Leyhill Prison .............................. 29 Figure 3-9 Box plot of average PM2.5 detected in various locations across the 6 Prisons. .................. 30 Figure 3-10 PM2.5 Concentrations across a weekly monitoring period, Leyhill Prison ......................... 31 Figure 3-11 Diurnal variation of PM2.5 Concentrations (g/ m
3) across 5 Prison Wings ....................... 32
Figure 3-12 Diurnal Variation of PM2.5 Concentrations (g/ m3) during the week and at the weekend at
Leyhill Prison ......................................................................................................................................... 33 Figure 3-13 Diurnal Variation of PM2.5 Concentrations (g/ m
3) during the week and at the weekend at
Long Lartin Prison ................................................................................................................................. 33

EXECUTIVE SUMMARY
This document represents the final report of a study examining exposure to Second Hand
Smoke (SHS) in prisons across the prison estate of England & Wales commissioned by the
Ministry of Justice (MoJ). A mixture of methods and devices were employed to measure
concentrations of fine particulate matter (as PM2.5 – particulate matter less than 2.5 microns in
diameter) using co-located real-time direct reading instruments (Dylos DC1700 and Sidepak
AM510 Personal Aerosol Monitor) across a range of prison locations and through personal
sampling of a number of staff.
Output from a pilot study in one prison confirmed that the Dylos DC1700, Sidepak AM510
Personal Aerosol Monitor and the collection of saliva for analysis of cotinine provided an
appropriate, practical and simple method for characterising exposure to SHS in prison settings.
Biological markers of SHS exposure including exhaled Carbon Monoxide and salivary cotinine
were also gathered. Questionnaire data to determine how frequently prison staff considered
they were exposed to SHS were also obtained. There was clear evidence of SHS in smoking
cells, occasionally in non-smoking cells and all prison wing samples measured.
Measurements of personal exposure of prison staff also indicate exposure to SHS across the
work-shift, with levels varying considerably between each of the six prison establishments. In
three of the six prisons the personal exposure of the majority of prison staff measured
exceeded the World Health Organisation (WHO) guidance value for PM2.5, (25 g/m3). Overall,
approximately one-sixth of the time that prison staff spent at work involved exposure to PM2.5 at
concentrations that exceeded the WHO guidance limit. Prison staff were also found to
experience considerable short-term peak exposures with the highest 1-minute PM2.5
measurement being 1,027 g/m3. These peaks are likely to be associated with entering cells
where smoking takes place. Cross-shift salivary cotinine measurements also provided data that
indicated SHS exposure was apparent among this workforce.
Both short (approximately 15 minute) and longer-term (4-7 day) static PM2.5 measurements
made at various locations within the prisons suggest that SHS levels can be considerable in
many prison areas. SHS levels tended to be higher particularly during meal-times, periods of
association and at the weekends.
Given that there is no safe level of exposure to SHS, that SHS is a known carcinogen and that
the Control of Substances Hazardous to Health (COSHH) Regulations 2002 (as amended)
state that exposure to carcinogens must be controlled to levels as low as reasonably
practicable, the National Offender and Management Service (NOMS) should consider
implementing measures to further reduce or eliminate SHS within the prison estate.

Report on Second-Hand Smoke in Prisons: Final Report
SHS in Prisons Final Report Prepared by Parsons Brinckerhoff September 2015 for National Offender Management Service - 8 -
1 INTRODUCTION
1.1 Scope and Purpose
1.1.1 This document represents the final report of a study commissioned by the Ministry of Justice (MoJ) to quantify exposure and risk of prison staff to second-hand smoke (SHS) across 6 prisons of varying type across England and Wales.
1.1.2 The aim of the study was to achieve the following objectives:
Quantification of the extent that prison staff are exposed to SHS;
Provide data on the patterns of SHS exposure of staff;
Provide data on the variation of SHS concentrations across different types of
prison buildings and prison categories;
Provide data on the degree of SHS drift into cells of non-smoking prisoners and
to non-smoking areas within the prison;
An evaluation of the impact on SHS concentrations of 'Canteen Day' (when
inmates purchase tobacco).
2 SAMPLING UNDERTAKEN
2.1 Sampling overview
2.1.1 The sampling campaign was divided in to two phases. The first, a pilot study, was carried out over a period of seven days at Cardiff prison (a Category B Local/Training prison). On completion, and after a short period for data analysis and assimilation, the second phase was embarked upon with visits to five prisons. These included Leyhill, Long Lartin, Winchester, Gartree and Risley which span Category A to Category D (See Table 2-1). Seven days of monitoring activity was undertaken at each of the individual prisons.
2.1.2 All sampling was undertaken by suitably qualified Parsons Brinckerhoff (PB) personnel. A sampling team consisting of four staff visited prisons as team of two, taking turns to commit to the full week intensive sampling programme. All staff received training in the sampling protocol and equipment operation prior to the survey, ensuring that there was consistency between the sampling undertaken at each prison site.
2.1.3 This method was built on previous experience of the University of Aberdeen / IOM team in measuring SHS in a variety of occupational and non-occupational settings [ 1-2] with particular reference to a project to measure SHS exposure of Prison Staffs in a prison on the Isle of Man carried out in 2008 [3].
2.1.4 Previous work has been published on SHS exposure within prison settings [4-8]. These studies have used mixed methods to quantify SHS exposure in prisons in Ireland, the USA, Switzerland and New Zealand. Methods have included measurement of fine Particulate Matter (PM2.5) or nicotine in prison air or levels of Carbon Monoxide (CO) in exhaled breath of Prison Staffs‟. Some have examined changes in SHS concentrations after implementation of new rules limiting or prohibiting smoking within the prison setting. None of these studies have attempted to quantify personal exposure of Prison Staffs to SHS during their work-shift.

Table 2-1 Prisons sampled as part of the SHS in Prisons sampling programme
Prison Sample Dates
Security Category
Dominant Building Style From To
Cardiff* 09/02/2015 13/02/2015 Category B Victorian Atrium Styled Wings
Winchester 02/03/2015 06/03/2015 Category B Victorian Atrium Styled Wings
Risley 16/03/2015 20/03/2015 Category B Mixture of Victorian Atrium Styled Wings and corridor Wings
Leyhill 23/03/2015 27/03/2015 Category D Open Prison, corridor wings
Gartree 07/04/2015 10/04/2015 Category B Mixture of Modern Atrium wings and corridor wings
Long Lartin 13/04/2015 17/04/2015 Category A Modern Atrium wings
*Pilot Study Site
2.2 Monitoring protocols
Static monitoring with Dylos DC1700
2.2.1 The Dylos DC1700 counts particle numbers using photometric methods [11]. The device measures particle numbers in two size bins (>0.5 microns and >2.5 microns) every second and logs the average every 1 minute. Devices require mains electricity to run for periods beyond the 6-8 hour internal battery life. Devices were placed within a secure environment (detailed in Section 2.4.3) while ensuring adequate air flow to and within any enclosure. After devices were switched on, they automatically logged particle number concentrations for a period of approximately 6 days and 6 hours. For 7 day sampling durations, data was downloaded at least once during the period to ensure that a complete 7 day sample was collected.
2.2.2 For devices located in cells data was downloaded at the end of the 24 hour measurement period. Contextual data about the cell, (size/volume, number of inmates, smoking activity, the presence of any other fine particulate emissions sources) were recorded on exposure record sheets. A similar process was followed for the 20-30 minute „spot‟ measurements made at strategic locations. Strategic locations were visited at times when the area is in typical use and broadly matched the time of day that Prison staff would expect to be present in those areas.
Static/personal monitoring with Sidepak AM510 Personal Aerosol Monitors
2.2.3 Devices were cleaned, greased and zero calibrated prior to each use. Flow rates were set at 1.7 l/min using a TSI flowmeter as indicated in the device manual. For the 24 hour monitoring measurements Sidepaks were operated from mains electricity. Devices were set to measure every 1 second and to log every 1 minute with a calibration factor of 1.0. Care was taken to set the devices to „Logging mode‟ rather than „Survey mode‟. When used in cells the Sidepak were secured inside a small lockable box to provide security and the additional benefit of sound insulation. A short piece of Tygon ® tubing was attached from the PM2.5 inlet to the outside of this box. A similar procedure was followed for personal exposure monitoring but with the device attached to a belt or pocket of the officer wearing the instrument. For safety reasons this was secured inside the prison staffs‟ clothing. A short length of Tygon tubing was

Report on Second-Hand Smoke in Prisons: Final Report
SHS in Prisons Final Report Prepared by Parsons Brinckerhoff September 2015 for National Offender Management Service - 10 -
attached from the PM2.5 inlet to be attached to the breathing zone of the officer. Again this was inside the officers‟ uniforms and presented no mechanism for intentional injury.
Saliva samples
2.2.4 The protocol used was based on an established method used for a Bar Workers‟ Health and Exposure to Environmental Tobacco Smoke (BHETSE) study [1]. This study provided findings which assisted in the evaluation of the benefits of the smoking ban within Scotland.
2.2.5 Saliva samples were collected from a number of staff who were confirmed non-smokers (including those who wore personal samplers) at both the beginning and end of the prison staffs‟ work shift. After swabs were collected, care was taken to store them away from smoky environments. Samples were stored in a cool box for transport or fridge for no more than 7 days before they were dispatched to the Laboratory for analysis.
Exhaled CO measurement
2.2.6 A Bedmont Scientific Micro EC50 Smokerlyzer was used to monitor CO concentration in exhaled breath of prison staff. Measurements, in accordance with the device manual, were taken at the beginning and end of shift periods. Readings were given in ppm.
Time-activity data
2.2.7 Time activity data was acquired from prison staff who wore Sidepak devices in order to allow the interpretation of real-time SHS exposure information. The sole method of collecting Prison Staff time-activity available was the completion of a paper record, undertaken by PB staff during their frequent „check-in‟ with the prison staff across the course of their shift.
2.3 Self Reporting Questionnaire
2.3.1 Staff who provided saliva samples were requested to complete a self exposure questionnaire, detailing their working hours, work patterns and their own assessment of occupational exposure to SHS (sample form contained in Appendix D).
Informed consent
2.3.2 Informed consent was gained from those prison staff who agreed to take part. Informed consent was not sought from prisoners, as no personal exposure data was gathered from prison inmates and data about their environment was being gathered in much the same way as thermostatic temperature data is gathered to ensure that prisons are sufficiently heated.
2.4 Practical considerations
Cell and Wing Sampling
2.4.1 Overall the sampling methods and monitoring plan posed no major logistical problems. PB personnel. were able to gather the required data generally as planned. There was a high level of co-operation from all levels of staff within all of the prisons

surveyed. Prison staff assisted with identifying suitable sites for measurement without major difficulty.
2.4.2 Confirmation of the presence of SHS within the prison wing environment required monitoring cells both of prisoners who smoke and of those who do not smoke. Two Dylos instruments were left in cells located on the same wing, overnight of smokers and non-smokers to gather in-cell SHS concentrations. A small number of unforeseen issues led to some minor changes to the timetabling of tasks or the type of data collected. These are summarised below.
2.5 Constraints
2.5.1 Locations for where to place monitoring equipment during surveys were contrained due to access to power and risk of equipment being tampered with or damaged. This presented no major issues, with one exception. The Long Lartin wing survey was required to be located close to the wing office for security purposes, which was in close proximity to the wing kitchen used by prisoners throughout the day. Due to the strong odour of cooking present on the wing, it was anticipated that particle emissions from the wing kitchen would impact upon PM2.5 surveys readings by the Dylos.
Security
2.5.2 Due to security concerns and the paramount importance of protecting staff and prisoners from harm, all instruments were introduced into the cells within sealed tamper-proof containers (Figures 2-1 & 2-2). Care was taken to ensure that the sampling integrity of the devices was not compromised as a result of the enclosure.
2.5.3 The tamper-proof units also helped address concerns over sampling instruments being tampered with by prisoners. These safe-guards protected the sampling equipment from direct damage by prisoners. Prisoners were instructed not to tamper with samplers, though there were several incidents where samplers were interfered with (such as covering sampler inlets with blankets to reduce pump noise, or switching off power to instruments).
Figure 2-1 Dylos & Apex Monitoring Device and tamper proof container
Figure 2-2 Sealed Tamper-proof container in-situ
Cyclone sampling head Dylos sampling inlet

Report on Second-Hand Smoke in Prisons: Final Report
SHS in Prisons Final Report Prepared by Parsons Brinckerhoff September 2015 for National Offender Management Service - 12 -
2.6 Pilot Study
2.6.1 The pilot study tested the practicalities of quantifying workers‟ exposure to SHS in the prison environment and compared results from a variety of co-located devices designed to measure fine particle concentrations. This involved the collection of gravimetric respirable dust samples, analysed for tobacco-smoke specific particulate matter using UV and fluorescence analysis, following BS 15593:2001 [9]. This data was compared to results from co-located photometric devices (TSI Sidepak AM510 Personal Aerosol Monitor, fitted with a PM2.5 impactor, and Dylos DC1700 Air Quality Monitor) enabling these devices to be calibrated to tobacco-specific SHS. The SHS-specific calibration factors derived for each instrument from the pilot study were applied to data collected in the main study.
2.6.2 The pilot study informed the main sampling campaign and allowed any necessary changes to the sampling strategy to be identified and implemented. The pilot study validated the correlation of PM2.5 concentrations in prisoner cells and on prison wings with the presence of tobacco derived PM and therefore directly attributable to the presence of SHS.
2.6.3 Though the pilot study experienced a small number of sampling problems, no departure from the pilot study was necessary for the main study and so the results from all 6 prisons are combined for presentation in this report.
2.6.4 Overall there was good agreement between the various methods used to assess SHS and the data gathered are broadly comparable to those reported from other studies in prison settings.
Selection of Prison Cells to measure air quality
2.6.5 Measurement of air quality within prison cells were carried out within cells occupied by prisoners who were identified by prison staff as being trustworthy, suitably responsible and resistant to outside influence of other prisoners.
SHS Sampling Periods
2.6.6 All prison cell samples were collected across a 24hr monitoring period, all personal exposure monitoring samples were collected across a shift period of approximately 8 hrs.
2.6.7 At each prison, a single wing sample was collected across a number of days (approx. 7) to provide some understanding of the variation in SHS across a wider period. In addition to these samples, a number of „spot‟ samples were taken at various locations across each of the prisons to provide an understanding of the concentrations of airborne particulate matter across the wider prison estate. The duration of the spot samples was between 15 minutes and 2 hours.
2.6.8 A comprehensive summary of all samples collected as part of the SHS in prisons is outlined in Table 2-2 below. In total 35 prison staff assisted in gathering personal exposure to SHS samples by volunteering to wear a personal monitoring device for their entire shift over one working day. It was found that shift durations varied between 10 to 14 hours across the prisons.

Personal Sampling of Prison Staff
2.6.1 Non-smoking prisons officers were invited to participate in the study. The criteria for selecting suitable staff included being self-declared non-smokers (confirmed by an exhaled breath measurement of CO), that they were wing-based staff, and that they were working a full shift of at least 8 hours on the day that the personal exposure measurement was to be carried out.
2.6.2 The exposure of prison staff to SHS was assessed in four ways. Personal exposure to PM2.5 as a marker of SHS was assessed over the course of a full work-shift for 5-6 staff at each prison. This marker of SHS provided temporal data on the patterns of exposure across the shift and allowed identification of tasks and activities that resulted in elevated concentrations. The second method involved a brief questionnaire to gather data on Prison Staffs‟ self-reported exposure to SHS as a proportion of their working time. CO in exhaled breath was used as the third measurement of prison staffs‟ SHS exposure, and the fourth method involved the collection of salivary cotinine samples and the start and end of the shift.

Report on Second-Hand Smoke in Prisons: Final Report
SHS in Prisons Final Report Prepared by Parsons Brinckerhoff September 2015 for National Offender Management Service - 14 -
Table 2-2 Samples Collected during the SHS in Prisons Study
Prison Sampled
Prison Staff Indoor Air Samples
Personal Exposure8 hr samples
CO Sample Saliva
Sample
24hr Cell samples
Multi-day week long samples
24hr Wing Samples
Short term samples at other locations
between 15 min to 2 hrs Smoking Cell
Non-Smoking
Cells
Cardiff 6 10 10 2 2 1 1 5
Winchester 6 10 10 2 2 1 1 7
Risley 6 10 10 2 2 1 1 7
Leyhill 6 10 10 2 2 1 1 11
Gartree 5 9 9 1 1 1* 1* 8
Long Lartin 6 9 9 1 1 1 1 9
Total 35 58 58 10 10 6 6 47
*Gartree Wing Samples collected, though compromised by tampering

2.6.3 Prison staff who agreed to participate in the study were asked to supply saliva samples and have personal monitoring equipment fitted prior to embarking upon their shift. Prison staff in all six prisons began their morning shifts from 07:15hr, requiring researchers to engage with all prison staff as they entered prison at the gatehouse. This reduced the risk of the participating prison staff being exposed to SHS prior to commencing their work on the wing and allowed researchers to set-up a temporary sampling station from where all participating prison staff were equipped with personal monitoring devices, provided saliva and CO in breath samples.
2.6.4 Due to the personal samplers having a limit of 8 hour battery life, personal exposure monitoring ceased shortly after 16:00hr. Due to the variable and uncertain timing of breaks, staff were met at their assigned wing before the end of their shift, where the personal monitoring devices were switched off and removed, and once again saliva samples were collected.
2.6.5 Questionnaire data (previously outlined in the Pilot Study) were gathered from all staff taking part in the study in order to determine if they smoked, used nicotine replacement therapy or e-cigarettes, lived in a home where smoking took place or had travelled to work in a vehicle where someone smoked (all of which would increase their salivary cotinine concentrations from non-work sources). If participating staff were found to have had either direct or indirect exposure to nicotine, then they were excluded from the study. This only occurred in a single case where a candidate was a user of e-cigarettes.
2.6.6 From the 6 prisons studied, a total of 35 personal exposure measurements were made from prison staff with an saliva samples collected from 58 prison staff, including the 35 personal exposure candidates.
2.6.7 As described in the Pilot Phase Report1, a gravimetric comparison was made with the
data from the Sidepak instrument. This provided a good comparison between gravimetric and continuous monitoring methods, with Sidepak results (n=6) returning an arithmetic mean (AM) which were a factor of 0.962 of comparable gravimetric method samples. Similarly, the AM of Dylos concentrations (n=3) results returned concentrations which were a factor of 1.003 of comparable gravimetric method concentrations. This allowed a correction with a calibration factor of 0.295 prior to the analysis of Sidepak data, taking place, taking account of the lower density of combustion-derived PM2.5 compared with standard road test dust, which is the default factor applied by the Sidepak instrument. Dylos instruments required no correction factor. Therefore the continuous monitoring results were in good agreement with the gravimetric reference method as summarised within the Pilot Study (Appendix H).
2.6.8 As part of the pilot study, static wing samples were taken using co-located Sidepak and Dylos instruments. As indicated in Figure 2-3, the instruments showed generally good agreement throughout the 24 hour sample.
1 Second-Hand Smoke in Prisons: A Pilot Study to Test Methods for Measuring Exposure. Report to National Offender
Management Service. WSP| Parsons Brinckerhoff and University of Aberdeen/ Institute of Occupational Medicine. June 2015

Report on Second-Hand Smoke in Prisons: Final Report
SHS in Prisons Final Report Prepared by Parsons Brinckerhoff September 2015 for National Offender Management Service - 16 -
Figure 2-3 Pilot Study Comparison between Sidepak and Dylos Static Landing measurement A Wing 10/02/2015 to 11/02/2015
2.6.9 A previously published methodology (Repace, 2006) was used to calculate SHS-PM2.5 exposure using the cross-shift changes in salivary cotinine concentrations. This method uses the difference between the actual post-shift salivary cotinine and an expected or projected value based on the pre-shift value. This projected value is derived using data on cotinine metabolism and assumes zero SHS exposure has occurred.
2.6.10 All participating prison staff also assisted with a CO in breath test used to instantly qualify their non-smoking status.
2.6.11 Tables A1 to A6 in Appendix A, summarises the collection times of data and their measurement periods.
2.7 Data Analysis
2.7.1 Particulate data from monitoring indoor air within cells of prisoners who smoke, cells of non-smoker prisoners and prison wings were all analysed to determine the presence of SHS in the form of elevated concentrations of PM2.5. Box plots of PM2.5 concentrations in cells of prisoners who smoke and cells of non-smoking prisoners were used to provide a visual comparison between the magnitude and range of PM2.5 concentrations in each cell type.
2.7.2 Concentration data from monitoring personal exposure of prison staff to SHS, measured as PM2.5, were analysed in the form of temporal plots to identify distinct periods when elevated concentrations of SHS occur. Box plots of personal exposure to PM2.5, which has previously demonstrated to represent SHS (Pilot Study Appendix G of this report), were used to compare the magnitude in SHS exposure across the six prisons.
2.7.3 The dark line on the box plots represents the median value with the upper and lower bounds of the box representing the 75
th and 25
th percentile respectively. The whiskers
are the 5th and 95
th percentile and circles show outliers.

2.7.4 Results from multiple day monitoring of PM2.5 (4 to 8 days) were analysed as temporal plots, which provided an overview of the variation in magnitude of SHS (as PM2.5) with changes in activity and availability of tobacco across the week.
2.7.5 Reported salivary cotinine concentrations below the limit of detection (LOD) were replaced with an imputed value based on the distribution of those samples with values greater than the LOD.
2.7.6 Data analysis included a comparison of Arithmetic Mean (AM), Geometric Mean (GM), Geometric Standard Deviation (GSD), sample minimum (min) and maximum (max) concentrations as well as sample concentration medians. Data was analysed using both Microsoft Excel spreadsheets and the statistical package SPSS.
2.7.7 Measurements were compared with the World Health Organisation‟s guideline for PM2.5 averaged over 24 hours
1.

Report on Second-Hand Smoke in Prisons: Final Report
SHS in Prisons Final Report Prepared by Parsons Brinckerhoff September 2015 for National Offender Management Service - 18 -
3 RESULTS
3.1 Overview
3.1.1 The principal source of fine particulate matter (PM2.5) within a prison wing is tobacco smoke. The correlation between PM2.5 and tobacco smoke, or SHS, was examined within the pilot study preceding this report and confirmed that SHS may be reliably detected using the PM2.5 ambient monitoring methods employed in this wider study.
3.1.2 This main report concentrates on confirming the presence of SHS within the prison wing environment and the exposure of prison staff to SHS.
3.1.3 The following results are presented within this section using the following survey methods:
Section Results Topic Survey Method
3.2
Prison Staff Exposure to SHS
Sidepak PM2.5 Monitors
3.3 Self-reported exposure to SHS
3.4 Prison Staffs’ exhaled CO results
3.5 Prison Staffs’ salivary cotinine results
3.7 Monitoring of SHS concentrations in Cells
Dylos Particulate Monitors
3.8
PM2.5 Concentration Differences between Smoking and Non-Smoking Cells
Dylos Particulate Monitors
3.9 Monitoring of SHS concentrations in Prison wings
Dylos Particulate Monitors
3.10 ‘Spot’ monitoring of SHS concentrations in the prisons
Dylos Particulate Monitors
3.11 Multi-Day monitoring of SHS concentrations on Prison Wings
Dylos Particulate Monitors
3.2 Prison Staff Exposure to SHS
3.2.1 Two measurements made in Cardiff Prison were excluded as they were less than 2 hours in duration, one sample in Gartree Prison did not provide usable data due to flow interruptions, and a further measurement from Risley and from Winchester Prisons were removed from the dataset due to technical problems with downloading these data. This resulted in a total of 30 usable personal measurements for analysis. The total duration of these measurements was 13,927 minutes with the mean duration being 464 minutes (range: 357-541 minutes). Appendix C provides the PM2.5 concentration profiles from the personal exposure data gathered from each prison.
3.2.2 The overall GM PM2.5 concentration for the shift measurement across the 30 Prison
Staffs measured was 19 g/m3 (GSD 2.19). The lowest full-shift measurement was 4
g/m3, while the highest was 84 g/m
3. Twelve of the 30 shift measurements were
greater than 25 g/m3, the World Health Organisation‟s guideline for PM2.5 averaged
over 24 hours.

3.2.3 There was considerable variation in the exposure of prison staff to PM2.5 between the prisons. Figure 3-1 presents a box-plot of the measurements made in the six prisons.
The dashed green line is the WHO 24-hour guidance limit for PM2.5 (25 g/m3).
3.2.4 Median values of SHS in Cardiff Prison were highest at 55g/m3, with both Gartree
(34g/m3) and Risley Prisons (30g/m
3) also having median values above the WHO
threshold. Exposures were lower at Winchester (22g/m3), Long Lartin (12g/m
3)
and Leyhill Prisons (7g/m3).
3.2.5 Prison wing architecture may help understand the differences in SHS detected by the personal monitoring devices across the various prisons. Cardiff, Gartree, Risley and Winchester Prisons all have atrium style wings, which hold higher prisoner numbers than corridor style wings. Prison staff who patrolled wings adjacent to an atrium were observed to spend greater periods of time on the landing area compared to staff responsible for corridor cell arrangements. This provides a greater opportunity for those prison staff to be exposed to SHS produced as a result of prisoners smoking within their cells.
Figure 3-1 Boxplot of personal PM2.5 exposure of prison staff
3.2.6 Peaks in staff exposure to PM2.5 generally occurred during periods when prisoner
occupancy of wings was high, during morning cell checks, lunch times and late afternoons. Using information from corresponding daily diaries completed by prison staff that wore the Sidepak devices several illustrative examples of the changes in SHS experienced across the working day were generated. These are illustrated in Figure 3-2.

Report on Second-Hand Smoke in Prisons: Final Report
SHS in Prisons Final Report Prepared by Parsons Brinckerhoff September 2015 for National Offender Management Service - 20 -
Figure 3-2 Three typical PM2.5 exposure patterns of Prison staff across a work shift

3.2.7 During time in smoking cells, considerable PM2.5 exposures may be experienced. Peaks in PM2.5 exposure experienced by prison staff wearing personal monitors can generally be attributed to working in or around prison cells and wings during periods when they are occupied such as association periods.
3.2.8 Examining the maximum exposures experienced by the 30 staff with valid full-shift
temporal data the overall GM was 202 g/m3 (GSD: 2.41), with a range from 27 to
1,027 g/m3.
3.2.9 The percentage of the shift spent at concentrations greater than the 24hr PM2.5 WHO
guidance value of 25 g/m3 ranged from 0.2 to 97%, with a GM of 16% (GSD: 4.56)
suggesting that approximately one hour in six of the working shift of prison staff involves exposure to SHS at levels that generate PM2.5 concentrations above the WHO threshold for fine particulates. Again there was a considerable difference in this metric between prisons. Officers in Cardiff Prison spent, on average, more than three-quarters of their shift (76%) at PM2.5 concentrations above the WHO guidance value, with officers in Risley Prison (56%) and Gartree Prison (49%) spending approximately half their shift above this level. Officers in the other prisons were exposed to these concentrations for much smaller proportions of their shift: Winchester Prison (25%), Long Lartin Prison (9%) and Leyhill Prison (7%).
3.2.10 Taken as whole the exposure of Prison Staffs to SHS in the six prisons monitored is measureable and, at times, considerable. While the overall average PM2.5 exposure
is about 19 g/m3, below the WHO 24hr guidance value for PM2.5, there are three
prisons where more than half of the staff measured experienced shift exposures above the WHO guidance value.
3.3 Self-reported exposure to SHS
3.3.1 Data on self-reported exposure to SHS was also gathered in all 6 prisons. A total of 59 valid responses to the question “Approximately what percentage of your working day do you think you are exposed to other people‟s cigarette smoke?” were gathered. Responses ranged from 2-100% with an overall mean of 51% (median 50%). The results to this question are illustrated in Figure 3-3.
3.3.2 The two prisons with the highest measured exposures (Cardiff and Gartree Prisons) also have the highest median self-reported durations of exposure to SHS. Self-reported exposure provides a subjective measure of the duration of staff exposure to SHS but does not allow comparison of the intensities experienced. This may help explain the relatively high self-reported exposures in Winchester and Leyhill Prisons despite their generally lower measured values of personal exposure to SHS.

Report on Second-Hand Smoke in Prisons: Final Report
SHS in Prisons Final Report Prepared by Parsons Brinckerhoff September 2015 for National Offender Management Service - 22 -
Figure 3-3 Boxplot of self-reported exposure to SHS as a percentage of the work shift of prison staff
3.4 Exhaled CO results
3.4.1 Exhaled CO measurements were gathered from 57 self-declared non-smoking prison staff. 44 of these staff provided valid pre and post shift measurements. The GM of the 57 valid pre-shift measurements was 3.20 ppm (GSD 1.37) while the GM for the 44 post-shift values was 2.6 ppm (GSD 1.56), post-shift CO measurements were not collected from 13 prison staff during the pilot study at Cardiff prison. All measurements were in the range of 1- 6 ppm.
3.4.2 Post-shift exhaled CO concentrations were highest in Gartree Prison (GM 3.90 ppm; GSD 1.27) and lowest (GM 1.93 ppm; GSD 2.05) in Long Lartin. Leyhill (GM 2.10 ppm; GSD 1.38, Risley (GM 2.89 ppm; GSD 1.33) and Winchester (GM 2.53 ppm; GSD 1.23) provided intermediate results. There were no post-shift exhaled CO data gathered in Cardiff.
3.5 Prison Staffs’ salivary cotinine results
3.5.1 A total of 60 prison staff provided saliva samples for analysis of salivary cotinine concentrations. Forty-seven of these staff provided valid pre and post-shift samples (13 staff had one or both samples of insufficient volume for analysis).The measured values of cotinine across these samples ranged from <LOD (0.1ng/ml) to 9.4ng/ml. A summary of the data gathered from each prison is provided in Table 3-1.

Table 3-1 Prison Staffs’ salivary cotinine result
Prison Participants Valid-pre samples (N)
Valid-post samples (N)
Valid pairs of samples (N)
Results <LOD
Range (ng/ml)
Cardiff 12 10 10 10 3/20 <LOD-0.630
Gartree 10 8 8 7 10/14 <LOD -9.4
Leyhill 10 8 10 8 15/16 <LOD -1.24
Long Lartin 9 9 9 9 18/18 <LOD -0.05
Risley 10 6 8 6 8/12 <LOD -0.26
Winchester 9 7 9 7 1/14 <LOD -0.33
Total 60 48 54 47 55/94 <LOD -9.4
3.5.2 There were 48 pre-shift samples that provided valid data. Thirty-two of these were below the LOD. Values below the LOD were replaced with an imputed value based on the distribution of those samples with values greater than the LOD. The resulting GM of these pre-shift samples was 0.07 ng/ml (GSD 3.01).
3.5.3 There were 54 post-shift samples that provided valid data. Twenty-seven of these were below the LOD. Values below the LOD were replaced with an imputed value based on the distribution of those samples with values greater than the LOD. The resulting GM of these post-shift samples was 0.12 ng/ml (GSD 3.39).
3.5.4 Using only those 47 sets of data where there was both a valid pre and post-shift sample the GM (GSD) for these paired data were 0.08 (3.03) (pre-shift) and 0.11 (2.95) (post-shift) ng/ml.
3.5.5 A positive difference between the actual measured and the projected value provides an estimate of the degree of SHS exposure that has occurred and this is expressed as an SHS-PM2.5 concentration over that time.
3.5.6 Across the whole set of valid data from all six prisons this calculation indicated that
Prison Staffs work-shift exposure to SHS-PM2.5 was estimated to be 10g/m3. When
applied specifically to the values derived from the Prison Staffs at Cardiff Prison the
method suggested work-shift SHS-PM2.5 exposure of 27g/m3, while for Winchester
Prison the value was 22g/m3. Estimates were not generated for the other prisons
due to the higher number of samples <LOD (Long Lartin Prison 18/18; Gartree Prison 10/14; Risley Prison 8/12; Leyhill Prison 15/16).
3.6 Ambient Concentrations of SHS
3.6.1 Measurements using the Dylos were also made during an overnight monitoring period ranging from 14hrs to 24 hrs upon the wing landing area of the prisons visited. A
Report on Second-Hand Smoke in Prisons: Final Report
SHS in Prisons Final Report Prepared by Parsons Brinckerhoff September 2015 for National Offender Management Service - 24 -
number of „spot‟ measurements were taken at various locations using the Dylos in each of the prisons. These „spot‟ measurements were between 15 minutes and 2 hrs in duration, and aimed to provide an understanding of the concentrations of airborne articulate matter across the wider prison estate.
3.6.2 In addition, at each prison, a single wing measurement was made using the Dylos across a number of days (4 to 8 days) to provide an understanding of the variation in SHS concentrations over the week.
3.6.3 For the sake of brevity and consistency in the reporting, the results from the Dylos device are the focus in the main body of the report as this device was used across all four methods of assessing ambient SHS concentrations. The measurements collected in the prison cells using the Sidepak instrument are presented in Appendix E for completeness.
3.7 Prison cell SHS concentrations
3.7.1 Ambient measurements of PM2.5 in smoking and non-smoking cells were made in all six prisons. In total, 10 measurements were collected in smoking cells and 10 measurements in non-smoking cells. Sample durations averaged 21 hours (range 9 – 25 hours).
3.7.2 The mean and maximum PM2.5 concentrations for each of the 20 prison cell measurement periods using both the Dylos and SidePak direct reading instruments are presented in Appendix F.
3.7.3 Concentrations of PM2.5 were substantial in all 10 cells occupied by prisoners who smoked. At times, concentrations of SHS exceeded the dynamic range of the Dylos
instrument (equating to concentrations in excess of 1,000 g/m3).
3.7.4 The overall GM PM2.5 concentration for the measurements collected in the smoking
cells was 119 g/m3 (GSD 2.81). The lowest smoking cell mean measurement was 15
g/m3, while the highest was 623 g/m
3.
3.7.5 Monitoring PM2.5 in prison cells where smoking takes place provided clear evidence of the generation of SHS concentrations, followed by a decay curve as the PM2.5 settles and disperses. An illustrative PM2.5 measurement trace from a Dylos monitor can be seen in Figure 4-1. The data were gathered from a Long Larten prison cell occupied by a frequent smoker. Multiple SHS peaks are evident. During the lock-up period at night, the rate of decay of concentration is considerable slower than during the day due to the lower ventilation/air-exchange rates of the locked cell. Using the time from
the peak to 25 g/m3 as an indicator of „SHS lingering time‟ indicates that a period of
about 10-27 minutes is required during the day while the SHS lingering time is about 60 minutes in cells at night.

Figure 3-4 Typical Particulate Traces of SHS using a Dylos instrument within Cell of a Prisoner who smokes (Long Lartin) and of a non-smoking prisoner (Leyhill)
3.7.6 Evidence of SHS concentrations occurs in two broad forms. The first form is a series of discrete and frequent peaks which represent an individual period in which smoking is most likely occurring within the cell and then being dispersed (as illustrated in Figure 3-4). The second form is broader peaks in concentration which most likely represent several episodes of smoking in quick succession. The broader peaks also occur during lock-up periods (such as lunchtime and early evening) when cell ventilation and therefore dispersion of SHS is limited due to cell doors being locked.
3.7.7 In the case of one prisoner at Risley Prison who was a self-declared chain smoker (confirmed by prison staff in attendance), concentrations of PM2.5 monitored within the
cell averaged 623 g/m3, remained above 250 g/m
3 for a period of 17.5 hrs, and only
dropped below 100 g/m3 for a total period of 21 minutes within a 23.5 hour
monitoring period. Nine of the 10 smoking cell measurements had arithmetic means
greater than 25 g/m3, the WHO 24-hour guidance limit.
3.7.8 PM2.5 concentrations were also monitored within 10 cells of self-reported non-smoking prisoners across a 24hr period. The overall GM PM2.5 concentration for the
measurements collected in the non-smoking cells was 31 g/m3 (GSD 2.45). The
lowest non-smoking cell measurement was 7 g/m3; while the highest was 80 g/m
3.
6 of the 10 non-smoking cell measurements had GM greater than 25 g/m3.
3.7.9 The PM2.5 concentration profiles in the non-smoking cells are distinctly different to those of the smoking cells with lower concentrations of fine particulate matter and a limited number of PM2.5 peaks. Figure 3-4 also contains an example of a typical measurement trace from a non-smoking cell.
3.7.10 In one particular case, a non-smoking cell sample in Winchester, the cell was occupied by a smoker, who elected not to smoke in his cell, though stated that he smoked in the hallway outside. However it is evident from Figure 3-5 that SHS drifted into the cells during periods when smoking was taking place in the hallway.

Report on Second-Hand Smoke in Prisons: Final Report
SHS in Prisons Final Report Prepared by Parsons Brinckerhoff September 2015 for National Offender Management Service - 26 -
Figure 3-5 Dylos measurement of PM2.5 in a non-smoker cell occupied by a smoker, Winchester Prison
3.7.11 SHS was detected in non-smoking cells in both the Cardiff and Long Lartin prisons, though only during the limited periods when all cells were open. It is probable that other prisoners were smoking within these non-smoking cells since during periods of lock-up, no new SHS peaks were observed to occur.
3.8 PM2.5 Concentration Differences between Smoking and Non-Smoking Cells
3.8.1 A comparison of SHS in cells occupied by smokers or non-smokers is provided in
Figure 3-4. An outlier of 623 g/m3
obtained from a smoking cell was removed to allow for better visualisation of the data.

Figure 3-6 Box plot of average PM2.5 detected in smoking cells and non-smoking cells across 6 Prisons
Note outlier of 623g/m
3 from ‘smoking cell’ removed.
3.8.2 PM2.5 measurements taken from cells of non-smoking prisoners imply that smoking occasionally occurs within non-smoking cells. However, even taking this into account, the magnitude of PM2.5 (SHS) concentrations detected in cells of smokers is still approximately 4 times greater than those detected in non-smoking prisoners‟ cells
(median from cells occupied by smokers being 155 g/m3 vs. 36 g/m
3 for cells
occupied by non-smokers).
Table 3-2 Comparison of Smoker Cell and Non-Smoker Cell PM2.5 Concentrations using both Dylos and Sidepak instruments
Prison Smoker Non-Smoker
Dylos g/m3 Sidepakg/m
3 Dylos g/m
3 Sidepakg/m
3
Cardiff 217.1 317.1 59.3 30.4
Winchester 177.1 CDNC 47.4 CDNC
Risley 297.5 790.0 87.9
31.2 27.1 32.7
Leyhill 43.9 34.5 9.1 13
Gartree 35.8 171.4 22.5 CDNC
Long Lartin 41.8 58.7 80.4 62.2
Mean 135.5 (n = 10)
243.3 (n=6)
41.7 (n = 10)
33.1 (n=6)
CDNC – Comparable Data Not Collected

Report on Second-Hand Smoke in Prisons: Final Report
SHS in Prisons Final Report Prepared by Parsons Brinckerhoff September 2015 for National Offender Management Service - 28 -
3.8.3 Three of the non-smoking cells sampled, Winchester, Cardiff and Long Lartin have PM2.5 concentration peaks which appear to indicate the presence of SHS. In one particular case, a non-smoking cell sample in Winchester, the cell was occupied by a smoker who elected not to smoke in his cell, though stated that he smoked in the hallway outside. Therefore there was the potential that SHS could drift into the cell, during periods when the prisoner was smoking in the hallway.
3.8.4 In the case of both the Cardiff and Long Lartin prisons, the presence of SHS was indicated only during the limited periods when all cells were open. It is probable that this is the result of other prisoners smoking in or near the non-smoking cells and no SHS peaks were observed to occur during periods of lock-up. Lartin
3.8.5 Apart from the Long Lartin and Cardiff non-smoking cell samples mentioned above, there was no clear evidence of the indirect intrusion of SHS into cells of non-smoking prisoners from adjacent cells of prisoners who smoke.
3.8.6 Comparisons of SHS in smoker cells and non-smoker cells are illustrated in Figure 3-6 below. The data represents the arithmetic mean values of each concentration measured and concentrations differences between smoking and non-smoking cells, in prisons of differing categories.
Figure 3-7 Comparison of Dylos PM2.5 Concentrations in (AM) Smoker Cell and Non-Smoker Cells across all 6 prisons, indicating category of prison surveyed
3.8.7 It was observed from the limited surveys in smoking cells (n=10) using Dylos devices that PM2.5 concentrations were elevated in three out of the four Category B prisons, over Category A and D prisons. Gartree, a category B prison, was recorded as having lower concentrations of PM2.5 in cells of smokers. This difference between Gartree and other category B prisons, could be related the legacy of Gartrees‟ former category A status, with its operations and regime adhering to a category A rather than category B status.

3.9 24-hr monitoring of SHS concentrations in Prison wings
3.9.1 As part of the SHS in prisons study, thirty six separate measurements were carried out on the wing areas over a 24-hr period. The Dylos failed on one occasion during these surveys leaving 5 measurements of the 6 prisons available for analysis.
3.9.2 Sample durations averaged 18 hours (range 7-24 hours), as a small number of samples failed due to power interruptions.
3.9.3 The overall GM PM2.5 concentration for the 24-hr measurements collected in the
prison wing landings was 59 g/m3 (GSD 1.94). The lowest 24-hr landing mean was
30 g/m3, recorded at Leyhill prison while the highest was 123 g/m
3 at Gartree
prison.
3.9.4 All five 24-hr landing measurements had total measurement time mean
concentrations in excess of 25 g/m3.
3.9.5 Concentrations of PM2.5 in four of the six prisons measured showed considerable variation across the course of the day. Figure 3-8 is typical of a 24 hr PM2.5 concentration profile of a wing of Leyhill. Peak concentrations occurred during periods when wing occupancy was at its maximum, including evening association, between 15:30hr and 21:00hr, and breakfast and lunchtime periods.
Figure 3-8 Dylos measurements of PM2.5 on a wing over 24 hours, Leyhill Prison
3.10 ‘Spot’ monitoring of SHS concentrations in the prisons
3.10.1 Seventy „spot‟ measurements were collected in various locations in the 6 prisons. Each of the spot measurements was coded to allow comparison of the different prison environments. The eight categories used were recreation, holding cell, reception, teaching area, landing, kitchen, medical area and the gatehouse.
3.10.2 Sample durations averaged 40 minutes (range 13 – 164 minutes).
3.10.3 The mean and maximum PM2.5 concentrations recorded by the Dylos for each of the individual spot measurement periods are presented in Appendix G.

Report on Second-Hand Smoke in Prisons: Final Report
SHS in Prisons Final Report Prepared by Parsons Brinckerhoff September 2015 for National Offender Management Service - 30 -
3.10.4 The overall GM PM2.5 concentration for the 70 spot measurements was 24 g/m3
(GSD 3.46). The lowest mean was 3 g/m3, measured in the Long Lartin prison work
shop while the highest mean of 429 g/m3 was measured in the holding cell reception
in Cardiff Prison.
3.10.5 A comparison of SHS exposures measured in the various prison locations is provided in Figure 3-8.
Figure 3-9 Box plot of average PM2.5 detected in various locations across the 6 Prisons.
3.10.6 From these spot measurements it is apparent that SHS concentrations within the prison locations varied considerably. Median values of SHS were highest at
192g/m3 in the recreational areas (based on two spot measurements). Median
values exceeding the WHO threshold were also observed in the teaching area
(27g/m3, n=19), holding cell (28 g/m
3, n=7), landing (34g/m
3, n=18) and reception
(39g/m3, n=7) locations. The lowest spot measurements were recorded in the
gatehouse (6g/m3, n=7). Measurements taken at all 6 prison kitchens were very
low, due to the cooking methods (minimal frying) used and the effectiveness of the industrial-scale extract systems within the kitchens themselves.
3.11 Multi-Day Samples
3.11.1 Particulate (PM2.5) concentration was surveyed from landings at all 6 prisons using a Dylos for a period of between 4 to 7 days. The Dylos instrument was compromised during the survey at Gartree, resulting in a void sample. All 5 remaining multi-day surveys were otherwise in good order.
3.11.2 It was clear from results that concentrations of PM2.5varied widely in these settings. There are diurnal variations in PM2.5 concentrations, variations in PM2.5

concentrations between the different days surveyed and between each prison surveyed (Figure 3-9).
3.11.3 Multi-day monitoring surveys GM concentrations of 29.1 g/m3 (n = 5,15.0 to 47.8) exceeded the WHO PM2.5 24hr limits in 4 of the 5 prison wings surveyed. The AM for the individual prison surveys are contained in Table 3-3 below.
Table 3-3 Summary of PM2.5 concentrations (g/m3) in Weekly Prison Wing
samples*
Prison Mean (AM) Median Min Max
Cardiff 69.8 42.1 0.8 891.6
Leyhill 52.1 35.7 3.4 693.1
Long Lartin 27.9 12.7 0.7 657.8
Risley 35.6 31.3 9.4 158.3
Winchester 27.2 27.8 0.7 121.0
* Gartree week survey was suspected to have been compromised
3.11.4 These values do not reflect the daytime SHS concentrations upon each wing surveyed, which were generally higher during the day than at night.
3.11.5 The magnitude and duration of PM2.5 concentrations varies across the weekly sample. With high levels of PM2.5 being detected for greater durations by the static sampling device based at A-wing over weekend than during the week.
3.11.6 It can be observed from weekly PM2.5 weekly prison wing surveys that higher concentrations of SHS were detected during Friday and Saturday than during the week. The higher concentrations of SHS detected during both Friday and Saturday at Leyhill prison (Figure 3-8) corresponds with this. These high concentrations of SHS continued throughout the weekend for the majority of prison wing surveys. In contrast, there was a marked reduction in SHS concentrations on Monday detected in the week long prison wing monitoring surveys at Risley, Long Lartin and Leyhill.
Figure 3-10 PM2.5 Concentrations across a weekly monitoring period, Leyhill Prison

Report on Second-Hand Smoke in Prisons: Final Report
SHS in Prisons Final Report Prepared by Parsons Brinckerhoff September 2015 for National Offender Management Service - 32 -
3.11.7 SHS concentrations varied across the day in most establishments, with midweek concentrations significantly lower at some establishments than at other times. As the majority of Prison staffs shifts are between 06:00hr to 22:00hr, SHS concentrations were analysed for periods inside this shift period and those during the week and at the weekend (Table 3-4). There are notable differences in SHS concentrations between the midweek and all other periods. In particular, at Cardiff there was a
difference of 13.1 g/m3 between the mean SHS concentration during the week and
that across the entire period.
Table 3-4 Comparison of Mean SHS concentrations (g/m3) for varying periods,
all, daytime and mid week
Prison Mean (AM) for all periods
Mean (AM) for between 06:00 to 22:00hr
Mean (AM) for midweek periods only
Cardiff 69.8 49.8 82.9
Leyhill 52.1 70.1 39.6
Long Lartin 27.9 36.1 16.7
Risley 35.6 33.6 42.4
Winchester 27.2 30.6 27.9
3.11.8 Figure 3-9 below, a diurnal plot of PM2.5 across all 5 wing samples, broadly illustrates the variation in PM2.5 concentrations across the day in the various prisons. It is apparent that there are differences in PM2.5 concentrations between each of the prison wings surveyed. In particular, a distinctly broad peak was detected throughout the night during the survey in Cardiff, at a time when all other prison wing surveys experienced their lowest concentrations. Distinct peaks in PM2.5 concentration where also detected during the day in Long Lartin, once again, when other prisons where experiencing lower concentrations of PM2.5.
Figure 3-11 Diurnal variation of PM2.5 Concentrations (g/ m3) across 5 Prison
Wings
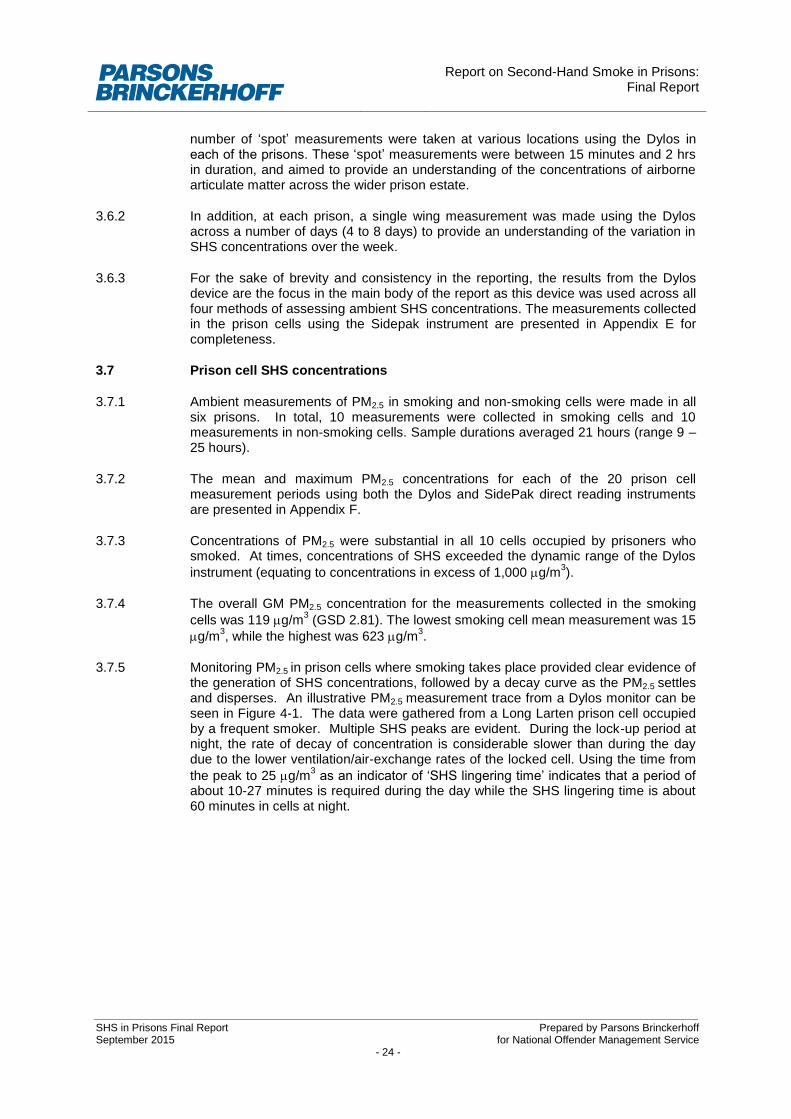
3.11.9 Two sets of weekly survey results from Leyhill prison and Long Lartin prison were compared for diurnal variations in PM2.5 concentrations between midweek and the
weekend results. It was apparent that PM2.5 concentrations at Leyhill (Figure 3-10) were higher during the week than at the weekends. Conversely, surveyed results from Long Lartin indicate at distinct and sustained PM2.5 peaks occurred during the day, which were largely absent from the midweek survey results (Figure 3-11).
Figure 3-12 Diurnal Variation of PM2.5 Concentrations (g/ m3) during the week
and at the weekend at Leyhill Prison
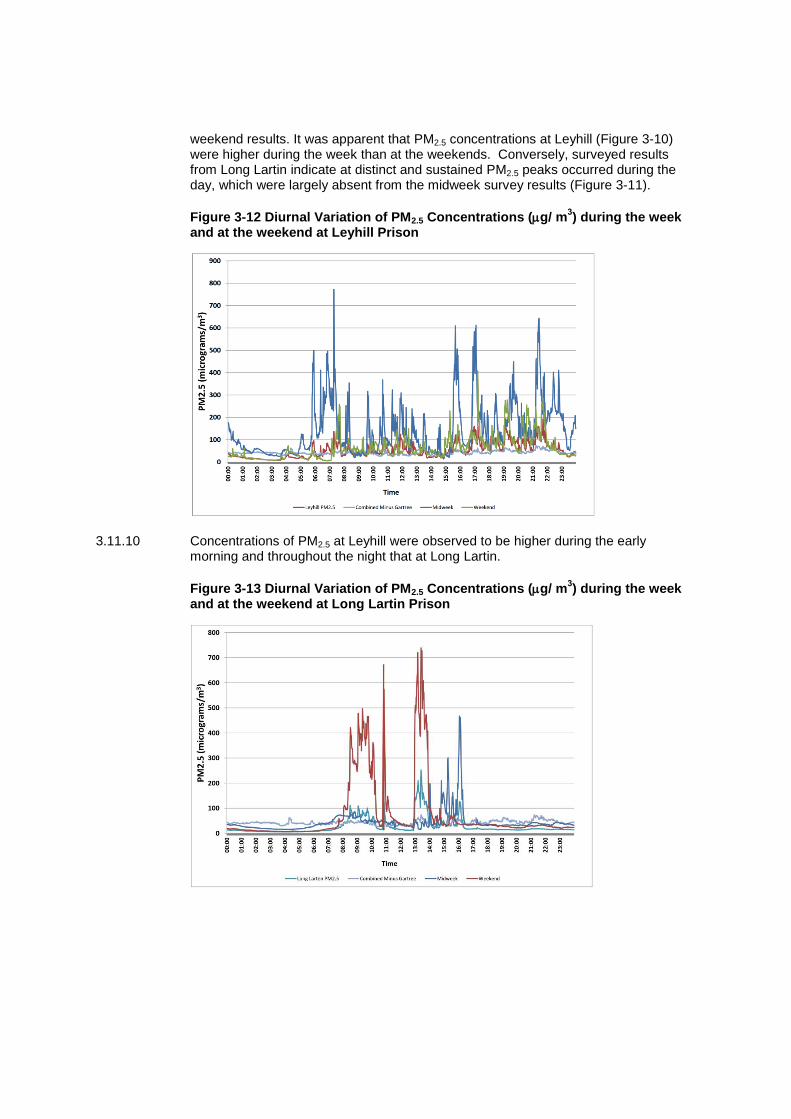
3.11.10 Concentrations of PM2.5 at Leyhill were observed to be higher during the early morning and throughout the night that at Long Lartin.
Figure 3-13 Diurnal Variation of PM2.5 Concentrations (g/ m3) during the week
and at the weekend at Long Lartin Prison

Report on Second-Hand Smoke in Prisons: Final Report
SHS in Prisons Final Report Prepared by Parsons Brinckerhoff September 2015 for National Offender Management Service - 34 -
4 DISCUSSION
4.1 Prison Staff exposure to SHS
4.1.1 This study has used the concentration of PM2.5 within the prison indoor environment, as an indicator off exposure to SHS.
4.1.2 Exposure to SHS have been proven to have significant impacts upon health of individuals. Though it is known that there are additional harmful compounds presence in the atmosphere as a result of tobacco use, no monitoring or sampling of these products has been made within this study
4.1.3 Taken as a whole these data indicate that Prison Staff in England & Wales are exposed to measurable, and in some cases significant, amounts of SHS during the course of their normal working activity. Evidence from all four methods of assessing work-shift exposure to SHS is consistent and indicates that, across this sample of workers from six prisons, average full-shift SHS-PM2.5 exposure is likely to be of the
order of 10-20 g/m3. There is evidence that some staff experience SHS exposure
that is considerably greater than this value with one full-shift measurement in Cardiff
Prison being in excess of 80 g/m3.
4.1.4 Peak exposures occur during specific activities with time spent in cells occupied by smokers likely to be linked to the highest exposure concentrations. Exposure also occurs during time spent on the wing and during activities such as escorting prisoners who smoke between prison buildings.
4.1.5 There is considerable variation in measured levels of SHS exposure across the six prisons measured. Staff at Leyhill and Long Lartin Prisons had generally low exposures while the majority of staff at Cardiff, Gartree and Risley Prisons experienced exposures that exceeded the WHO 24-hour guidance value for PM2.5. These differences are likely to reflect differences in prison design, prisoner numbers/density, prisoner smoking prevalence, and prison staff working practices.
4.1.6 Comparable data are available from a small study carried out at the Isle of Man Prison (Talabi, 2008) where valid work-shift measurements were gathered from 8
prison staff. The GM value of the full-shift PM2.5 measurements was 48 g/m3 (range
3-80 g/m3) and broadly similar to the PM2.5 data reported for Cardiff and Gartree
Prisons in the current study.
4.1.7 When comparing the data here with other occupations it is worth noting the values measured using similar methods in the hospitality industry in Scotland, England and Wales prior to smoke-free legislation in 2006/7. Semple et al. (2007), reported full-shift PM2.5 exposures of 6 bar workers in Scotland and 7 similar workers in England before smoke-free laws were implemented. The median value in Scotland was 230
g/m3, with lower values recorded in England (63 g/m
3). Measurements made in the
hospitality industry in both countries after smoke-free laws were brought in were
similar to those reported here (30 and 27 g/m3). This could be interpreted as
indicating that Prison Staffs‟ experience comparable SHS exposures to bar workers who have to enter outdoor smoking areas to collect glasses and/or are exposed to smoke-drift from smoking activity around the doors of their venue.
4.1.8 The salivary cotinine values of prison staff were generally low (GM post-shift value across all non-smoking prison staff was 0.13 ng/ml) and broadly comparable with that found in the general population of non-smoking adults in England (0.10 ng/ml; Sims et al., 2012). Prison Staffs in Cardiff had the highest post-shift salivary cotinine values

with a GM of 0.24 ng/ml. While higher than the general non-smoking population this value is less than one-tenth of the value of 2.9 ng/ml for non-smoking bar workers in Scotland prior to smoke-free laws and lower than values reported for bar workers in Scotland (0.40 ng/ml) (Semple et al., 2007) and England (0.72 ng/ml) (Semple et al., 2009) one-year after smoke-free laws were enacted in their workplaces.
4.1.9 Data on exhaled CO concentrations provide limited insight into the exposure of prison staff to SHS. While smokers and those who live with smokers have elevated exhaled CO levels it is difficult to use this biomarker of exposure at low concentrations of SHS. In addition to cigarette smoke, exhaled CO is subject to variation due to dietary factors, exercise and inflammation. While exhaled CO was generally lower at the end of the shift than the start of the shift this small change is difficult to interpret and may reflect external influences that are not related to SHS exposure (Sandberg et al., 2011).
4.1.10 Although average exposure of prison staff to SHS-PM2.5 is generally low, this report presents clear evidence that certain tasks or activities over the course of the working day lead to staff being exposed to substantial concentrations. While the risks of chronic exposure to SHS are well characterised, the acute effects of exposure are poorly understood. There is some evidence that suggests physiological cardiovascular and respiratory changes occur immediately after exposure to SHS. Otsuka et al (2001) detected endothelial (cells that line interior surface of blood vessels) cell changes in non-smokers exposed to SHS for just 30 minutes. That study suggested that these changes to coronary circulation were similar to those observed in active smokers but it is difficult to extrapolate that finding to any potential increase in risk of cardiovascular disease or heart attack.
4.1.11 Acute exposure to SHS has also been investigated in terms of lung function and chemical markers of inflammation. In a small study of 16 non-smoking adults exposed to 1 hour of SHS Flouris et al (2009) demonstrated significant decrements on lung function and marked increases in inflammatory cytokines, a group of proteins made by the immune system that act as chemical messengers. Again it is difficult to extrapolate these short-term changes to the risk of acute or chronic health events.
4.1.12 Less direct evidence is available to suggest that removal of SHS exposure reduces the risk of acute coronary events, stroke, acute respiratory infection and asthma. Longitudinal data analysing hospital admissions before and after the introduction of smoke-free laws globally have demonstrated a temporal association between the introduction of these regulations and reductions in these adverse health events. In terms of acute coronary events Mackay et al (2010) carried out a meta-analysis of 17 international studies that examined the impact of smoke-free laws that reduced population level exposure to SHS. This analysis indicated about a 10% reduction in risk of heart attacks from reducing population exposure to SHS. Mackay et al. (2010) also demonstrated a 18% reduction in child hospital admissions for asthma in Scotland after the 2006 smoke-free laws were implemented there. Similarly Been et al. (2015) found a -3.5% reduction in child hospital admissions for respiratory tract infections after the introduction of smoke-free laws in England.
4.1.13 Taking this evidence in its entirety it seems likely that prison officers who are exposed to SHS as part of their work will experience some degree of physiological change as a result. The acute effects of this are uncertain and will vary between workers but at the level of the entire prison officer population this exposure is likely to increase the overall risk of acute adverse cardiovascular and cardiorespiratory health events that are linked to exposure to SHS.

Report on Second-Hand Smoke in Prisons: Final Report
SHS in Prisons Final Report Prepared by Parsons Brinckerhoff September 2015 for National Offender Management Service - 36 -
4.2 Discussion of ambient concentrations to SHS
4.2.1 Taken as a whole these data indicate that Prison Staffs in England & Wales are exposed to variable and significant ambient concentrations of SHS in the various prison environments that they work in during the course of their shift.
4.2.2 There is considerable variation in measured levels of SHS exposure across prison areas, with smoking cells, wing landings and recreational areas showing the highest SHS concentrations.
4.2.3 Spot measurements must be treated with some caution given their short length and the fact that they are taken once at one particular time of day. They do not capture temporal variability and, if taken during a period when occupancy is particularly low or high, can present an incomplete picture of the potential exposure that may be experienced by staff at that location at other times of their shift.
4.2.4 Comparable data are available from the USA and Switzerland. Proescholdbel et al (2008) reported PM2.5 measurements gathered using the TSI Sidepak AM510 device in 22 areas across 6 prisons in the USA before/after implementation of a smoking ban. Prior to any restrictions being put in place that study reported average levels of
93 g/m3 in settings where smoking was permitted. Similar concentrations of PM10
were reported in a prison in Switzerland using the TSI Sidepak AM510 where average
levels were 110 g/m3 (Ritter et al., 2012).
4.2.5 When comparing the ambient data here with other occupations it is worth noting the values measured using similar methods in the hospitality industry in Scotland, England and Wales prior to smoke-free legislation in 2006/7. Semple et al., (2010) reported short term ambient measurements (~30 minutes) PM2.5 exposures in bars before smoke-free laws were implemented. PM2.5 levels prior to smoke-free legislation
were highest in Scotland (median 197 g/m3), followed by Wales (median 184 g/m
3)
and England (median 92 mg g/m3). All three countries experienced a substantial
reduction in PM2.5 concentrations following the introduction with the median reduction ranging from 84 to 93%. The median concentrations recorded in the recreational areas in prisons presented in this report are comparable with the pre-intervention measurements collected in the Scottish and Welsh bars whereas the median concentrations recorded in the medical, gatehouse and kitchen microenvironments were less than the hospitality measurements collected after implementation of smoke-free laws in 2006/7.
4.3 Discussion of Weekly Samples
4.3.1 Workplace concentrations of PM2.5 were found to be above WHO limits at 4 of the 5 prisons sampled for weekly PM2.5.
4.3.2 PM2.5 concentrations were found to be elevated each morning corresponding to cell doors being opened and during periods of prisoner association in the late afternoon. These are both periods when SHS is most likely to intrude from open cells onto the prison wings.
4.3.3 It has been inferred from conversations with Prison Staffs, that higher quantities of tobacco are consumed by prisoners over the weekend, than during week days, as fresh supplies of tobacco are issued each Friday (a typical canteen day), combined with the high level of day time cell occupancy, due to the fact that prisoners are not required to work from Friday afternoon, Saturday and Sunday, leading to an increase in SHS concentrations across prison wings as a whole.

4.3.4 The higher concentrations of SHS detected during Friday and Saturday at Leyhill monitoring correspond with this distribution of fresh tobacco to prisoners and greater quantities of tobacco being smoked immediately after this than at any other time.
4.3.5 The observed reduction in SHS concentrations on wings from the weekend to the week has been attributed in part to midweek periods where there is a lower cell occupancy during the day, due to prisoners being out at work or in training sessions. Whereas during the weekend periods most prisoners are on the wing and have more unstructured time than during the week.
4.3.6 Variations in PM2.5 concentrations between midweek and weekend surveys may be attributable to differences in practices between prison, due to varying routines and differences in treatment of prisoners due to wing security categories.
4.3.7 Leyhill prison – a category D prison, had a lower level of night time security on the wings, with a greater freedom of prisoners to keep cells doors open for longer periods. This, in part, may be one of the attributable factors in the high concentrations of SHS detected throughout the night at Leyhill, whereas at Long Lartin night time concentrations of SHS were very low.
4.3.8 High daytime PM2.5 concentrations detected over the weekend at Long Lartin may be attributable to activity in the wing kitchen, which was within 20 metres of the particulate sampler (site location chosen due to overriding security constraints). These prominent daytime peaks were absent in the mid- week survey results, and suggest a variation in the wings weekend and mid-week routine. Therefore the peak detected, may not necessarily be SHS, but products of partial combustion and cooking smoke.
4.3.9 The contrast between SHS concentrations across differing shifts periods may have implications on the extent to which individual officers are exposed to SHS. The majority of prison staff shifts are between 07:00hr to 18:00hr, with a lower number of prison staff on duty throughout the night. Daytime duties are also more likely to involve entering prison cells where SHS concentrations may be high. Overall it seems likely that the personal exposure of prison staff to SHS will be greater during the day than at night.
4.3.10 From the static monitoring results, it appears that SHS concentrations within the prisons sampled is likely to be influenced by, amongst others things, the cycle of tobacco rations issued via the prison canteen, smoking prisoner occupancy levels upon a wing at any time, and the movement of SHS from cells through open cell doors into the wing period during meal times and periods of association.
4.3.11 Therefore, of the three main influencing factors identified above, only two can be clearly managed: reducing SHS emissions from cells and/or restricting the supply of tobacco within prisons. The existing policy of closing prison cell doors while prisoners are smoking inside, reduces exposure to some extent but given recent evidence from households that SHS can linger at high concentrations for as long as 5 hours (>25% of homes sampled) (Semple & Latif., 2014) such a measure is likely to have limited impact. Restricting smoking to outdoor areas and/or removal of tobacco rations to prisoners are other possible options to reduce or eliminate SHS indoors. There are clearly major implications of implementing such a significant change within a population who have limited access to time outdoors. Such a policy would require careful management with particular emphasis on providing tobacco cessation expertise and assistance to smoking prisoners.
Report on Second-Hand Smoke in Prisons: Final Report
SHS in Prisons Final Report Prepared by Parsons Brinckerhoff September 2015 for National Offender Management Service - 38 -
5 CONCLUSIONS AND RECOMMENDATION
5.1.1 There is no safe level of exposure to SHS and while the full-shift exposure of Prison Staffs is generally much lower than those experienced by workers in the hospitality industry in the recent past it is now widely considered prudent that workers‟ exposure to SHS, a known carcinogen, should be limited as far as reasonably practicable.
5.1.2 The UK HSE EH40/2005 „Workplace Exposure Limits‟ document states that under the Control of Substances Hazardous to Health (COSHH) Regulations 2002 (as amended) that there is a requirement to reduce exposure to asthmagens, carcinogens and mutagens as much as is reasonably practicable. While SHS is not specifically listed in the COSHH Workplace Exposure Limit document guidance therein states that: “the absence of a substance from the list of WELs does not indicate that it is safe. For these substances, exposure should be controlled to a level to which nearly all the working population could be exposed, day after day at work, without any adverse effects on health”.
5.1.3 The majority of the UK workforce is covered by smoke-free legislation in their place of work and guidance on how to prevent or reduce SHS exposure exists for other occupational groups (e.g. NHS staff who are required to enter home settings where SHS may be present), is available.
5.1.4 In light of the scientific evidence of the health effects of exposure to SHS and the data on exposure of prison staff in England and Wales to SHS presented in this report the National Offender and Management Service (NOMS) should consider implementing measures to further reduce or eliminate SHS within the prison estate.
6 ACKNOWLEDGEMENTS
6.1.1 IOM: Dr. Andrew Apsley and Dr. Laura MacCalman for statistical analysis support and assistance. Dr. Martie van Tongeren for contributions to the sampling strategy used in the project.
6.1.2 Parsons Brinckerhoff Limited: Amritjit Parmar, Luc Porter and Christopher Squires for their support and assistance with the monitoring surveys conducted at the 6 prisons.
6.1.3 Sincere thanks to all staff at the six participating prisons and those prison officers and prisons who participated in the study.

REFERENCES
1. Semple S, Maccalman L, Naji AA, Dempsey S, Hilton S, Miller BG, Ayres JG. Bar workers'
exposure to second-hand smoke: the effect of Scottish smoke-free legislation on occupational
exposure. Ann Occup Hyg. 2007; 51:571-80.
2. Semple S, Apsley A, Azmina Ibrahim T, Turner SW, Cherrie JW. Fine particulate matter
concentrations in smoking households: just how much secondhand smoke do you breathe in
if you live with a smoker who smokes indoors? Tob Control. 2014 Oct 20. pii: tobaccocontrol-
2014-051635. doi: 10.1136/tobaccocontrol-2014-051635. [Epub ahead of print]
3. Talabi T. Workers who continue to be occupationally exposed to Second-Hand tobacco
Smoke (SHS) in the UK. M.Sc. thesis submitted to the University of Aberdeen, September
2008.
4. Hammond SK, Emmons KM. Inmate exposure to secondhand smoke in correctional facilities
and the impact of smoking restrictions. J Expo Anal Environ Epidemiol. 2005 May;15(3):205-
11.
5. Proescholdbell SK, Foley KL, Johnson J, Malek SH. Indoor air quality in prisons before and
after implementation of a smoking ban law. Tob Control. 2008 Apr;17(2):123-7.
6. Thornley S, Dirks KN, Edwards R, Woodward A, Marshall R. Indoor air pollution levels were
halved as a result of a national tobacco ban in a New Zealand prison. Nicotine Tob Res. 2013
Feb;15(2):343-7.
7. Ritter C, Huynh CK, Etter JF, Elger BS. Exposure to tobacco smoke before and after a partial
smoking ban in prison: indoor air quality measures. Tob Control. 2012 Sep;21(5):488-91.
8. McCaffrey M, Goodman P, Gavigan A, Kenny C, Hogg C, Byrne L, McLaughlin J, Young K,
Clancy L. Should any workplace be exempt from smoke-free law: the Irish experience. J
Environ Public Health. 2012;2012:545483.
9. British Standards Institute. 2001. BS ISO 15593:2001. Environmental tobacco smoke.
Estimation of its contribution to respirable suspended particles. Determination of particulate
matter by ultraviolet absorbance and by fluorescence.
10. Health & Safety Executive. MDHS 14/4. General methods for sampling and gravimetric
analysis of respirable, thoracic and inhalable aerosols. 2014.
11. Semple S, Ibrahim AE, Apsley A, Steiner M, Turner S. Using a new, low-cost air quality
sensor to quantify second-hand smoke (SHS) levels in homes. Tob Control. 2013 Sep 17. doi:
10.1136/tobaccocontrol-2013-051188. [Epub ahead of print].Feyerabend C, Russell MA. A
rapid gas-liquid chromatographic method for the determination of cotinine and nicotine in
biological fluids. J Pharm Pharmacol. 1990 Jun;42(6):450-2
12. Haw S, Gruer L. BMJ. 2007 Sep 15; 335 (7619):549. Changes in exposure of adult non-
smokers to secondhand smoke after implementation of smoke-free legislation in Scotland:
national cross sectional survey.
13. Semple, S et al. Ann. Occ. Hyg., October 1, 2007; 51(7): 571 - 580.
14. Repace J, Al-Delaimy WK, Bernert JT (2006) Correlating atmospheric and biological markers
in studies of secondhand tobacco smoke exposure and dose in children and adults. J Occup
Environ Med 48(2):181–194.
15. Semple S1, Latif N, How long does secondhand smoke remain in household air: analysis of
PM2.5 data from smokers' homes. Nicotine Tob Res. 2014 Oct;16(10):1365-70. doi:
10.1093/ntr/ntu089. Epub 2014 Jun.
16. Mackay DF, Irfan MO, Haw S, Pell JP. Meta-analysis of the effect of comprehensive smoke-free legislation on acute coronary events. Heart. 2010 Oct;96(19):1525-30. doi: 10.1136/hrt.2010.199026. Epub 2010 Aug 23

Report on Second-Hand Smoke in Prisons: Final Report
SHS in Prisons Final Report Prepared by Parsons Brinckerhoff September 2015 for National Offender Management Service - 40 -
17. Mackay D, Haw S, Ayres JG, Fischbacher C, Pell JP. Smoke-free legislation and hospitalizations for childhood asthma. N Engl J Med. 2010 Sep 16;363(12):1139-45. doi: 10.1056/NEJMoa1002861.
18. Been JV, Millett C, Lee JT, van Schayck CP, Sheikh A. Smoke-free legislation and childhood hospitalisations for respiratory tract infections. Eur Respir J. 2015 Sep;46(3):697-706. doi: 10.1183/09031936.00014615.
19. Otsuka R, Watanabe H, Hirata K, Tokai K, Muro T, Yoshiyama M, Takeuchi K, Yoshikawa J.Acute effects of passive smoking on the coronary circulation in healthy young adults. JAMA. 2001 Jul 25;286(4):436-41.