report on growth and employment - world...
TRANSCRIPT

Report No. 82538-GA
Gabonese Republic
Report on Growth and Employment
Paving the way toward inclusive growth
June 2013
Poverty Reduction and Economic Management Department 3
Africa Region
Document of the World Bank
Pub
lic D
iscl
osur
e A
utho
rized
Pub
lic D
iscl
osur
e A
utho
rized
Pub
lic D
iscl
osur
e A
utho
rized
Pub
lic D
iscl
osur
e A
utho
rized
Pub
lic D
iscl
osur
e A
utho
rized
Pub
lic D
iscl
osur
e A
utho
rized
Pub
lic D
iscl
osur
e A
utho
rized
Pub
lic D
iscl
osur
e A
utho
rized
i
Table of Contents
ACRONYMS .............................................................................................................................................. 2
ACKNOWLEMENTS ................................................................................................................................ 5
SUMMARY ................................................................................................................................................. 7
I. INTRODUCTION ............................................................................................................................ 1
II. ECONOMIC CONTEXT .............................................................................................................. 3
Gabon’s economic performance since independence ....................................................................... 3
The period of stable and steady growth: 1960-1972 ........................................................................ 4
The oil boom: 1973-1985 ................................................................................................................. 5
Decrease and failure of attempts at economic structural adjustments:1986-2002 .......................... 6
Structural reforms and macroeconomic stabilization:2003-2010 .................................................... 7
Growth Outlook ................................................................................................................................ 9
Sources of Gabonese growth .......................................................................................................... 10
On supply: an economy still dependent on oil ................................................................................ 10
On demand: the supremacy of domestic demand ........................................................................... 13
Growth accounting: overall productivity of negative factors over the last forty years .................. 14
Impact of growth on employment .................................................................................................. 15
The period of full employment: 1960-1985 .................................................................................... 15
Continued deterioration of the labor market:1986-2010 ............................................................... 16
Jobless growth 2003-2010 .............................................................................................................. 20
Chapter conclusion ......................................................................................................................... 20
III. THE GABONESE LABOR MARKET ...................................................................................... 21
Demographic context: a young and urban population .................................................................... 21
Main features of the Gabonese labor market .................................................................................. 24
Unemployment very high and rising ............................................................................................... 25
A largely urban and informal labor force ...................................................................................... 31
Relatively high labor costs ............................................................................................................. 36
Education and employability of youth and women in Gabon ........................................................ 38
Education and employability .......................................................................................................... 38
Return to education ........................................................................................................................ 39
Chapter conclusion ......................................................................................................................... 40
IV. CONSTRAINTS AND CHALLENGES IN THE GABONESE LABOR MARKET .......... 41
On supply: incompatibility between the structure of the education system and job opportunities .. 41
Poor internal efficiency of basic general education ....................................................................... 44
Insufficient and inefficient budgetary allocations to the education sector ..................................... 48
Ongoing reform of the education system ........................................................................................ 49
On demand: a restrictive investment climate ................................................................................. 52
ii
Ineffective support for private sector development ........................................................................ 53
High cost and low quality of energy ............................................................................................... 55
Low quality transport and logistics infrastructure and services .................................................... 57
Difficulties accessing credit............................................................................................................ 59
On legal and institutional framework: ............................................................................................ 60
Strict labor laws ............................................................................................................................. 60
A structurally unbalanced social security system ........................................................................... 62
Lack of a reliable information system on the job market ............................................................... 65
Labor market intermediation is limited .......................................................................................... 66
The limited impact of employment promotion programs ................................................................ 67
V.CONCLUSION: CREATE INCLUSIVE GROWTH CONDITIONS ......................................... 71
Appendix1:List of skills needing to implement PSGE mining projects ........................................... 74
APPENDIX 2: ................................................................. Several job market concepts and indicators
76
REFERENCES ..................................................................................................................................... 77
Table of Graphs
Graph 1 : GDP Evolution in Gabon1960-2010 (In constant billions of CFA Francs 2000) ......................... 3
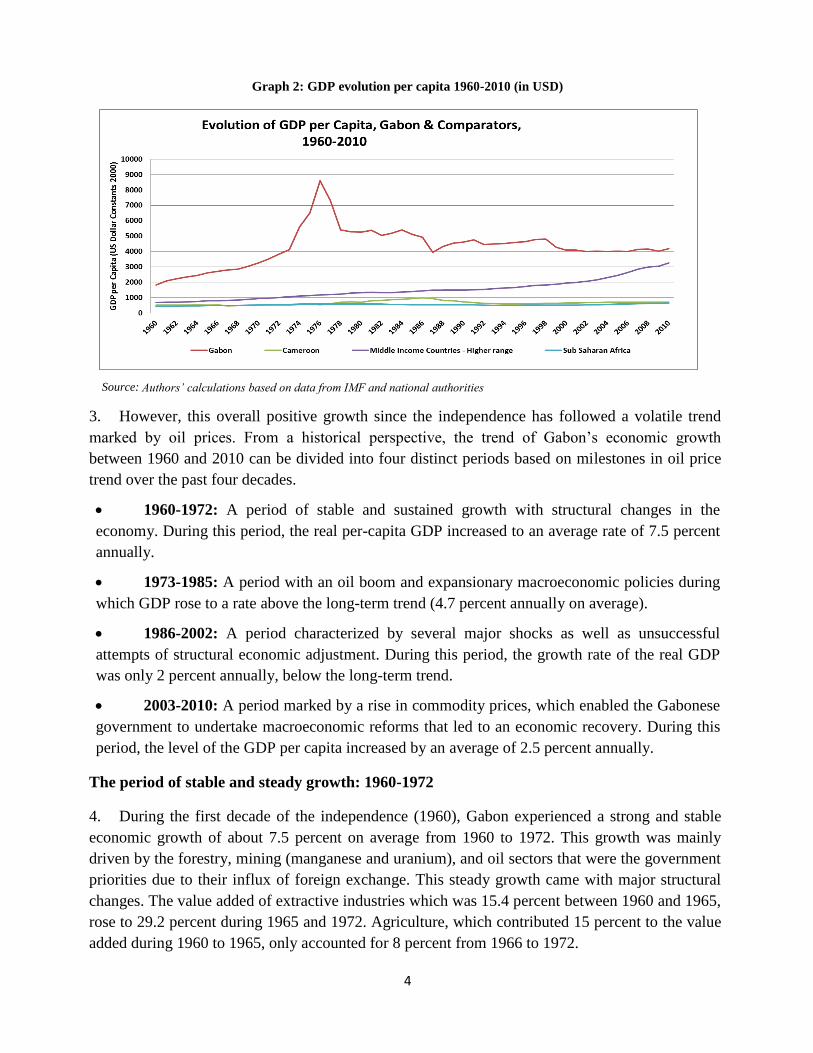
Graph 2: GDP evolution per capita 1960-2010 (In USD) ............................................................................. 4
Graph 3: Oil and non-oil GDP growth 1990-2010 (Annual variations in percentage) ................................. 7
Graph 4: Evolution of price of commodities,1960-2009 (Price index,base 100 =1960) ............................. 8
Graph 5: Evolutionof the overall fiscal balance and the non-oil primary deficit 1990-2011 ....................... 8
Graph 6: Growth outlook for the Gabonese economy 2008-2017 ............................................................. 10
Graph 7: GDP Origins, 1980-2010(In percentage of GDP) ....................................................................... 11
Graph 8: Factorial contribution to GDP growth, 1970-2010 .................................................................. 15
Graph 9: Employment trends, 1985-2010 (Number of jobs) ...................................................................... 17
Graph 10: Evolution of formal employment, 1985-2010 (Number of jobs) .............................................. 19
Graph 11: Evolutionof the relative shares of the public and private workforce in formal employment
1985-2010 (In percentage of total formal employment) ............................................................................ 19
Graph 12:Age pyramid of the Gabonese population, 2010 ........................................................................ 22
Graph 13:Structureof the Gabonese population by place of residence and gender 2010 ........................... 22
Graph 14:Demographic projections,1960-2025 ......................................................................................... 24
Graph 15:Evolution of unemployment rate(for BIT) in Gabon,1993-2010 ............................................... 25
Graph 16:Unemployment rate in Gabon and comparator countries, 2010(In percentage) ........................ 26
Graph 17:Unemployment rates in the major cities of West Africa,2010 ............................................ 26
Graph 18: Unemployment rate by province,2010 ....................................................................................... 27
Graph 19:Unemployment rate by age group,2010 ................................................................................... 28
Graph 20: Unemployment rate by education level,2010 ............................................................................. 28
Graph 21:Unemployment rate by gender and education level,2010 (In percentage) ............................. 30
Graph 22:Geographical distribution of employment in Gabon,2010 ......................................................... 32
Graph 23:Distribution of informal employment by activity sector,2010 ................................................... 33
Graph 24:Distribution of employment by institutional sector, 2010 ..................................................... 33
iii
Graph 25:Distribution of total employment by activity sector ................................................................... 34
Graph 26:Labor costs in CEMAC countries .............................................................................................. 37
Graph 27:Average monthly earnings by sector in Gabon,2010 ................................................................. 37
Graph 28:Structure of demand for skilled works in OLAM Gabon projects, 2012-2016 ........................... 43
Graph 29:Structure of the education offer in higher education, 2011 .................................................. 43
Graph 30: Primary school repetition rates in Gabon and worldwide,2008 ................................................ 44
Graph 31:Ratio of the number of students per teacher and education level in Gabon and other middle-
income countries2008 (Number of students per instructor) ....................................................................... 45
Graph 32: Availability of teaching materials and equipment in primary school classrooms,2008 ............ 46
Graph 33: School coverage in technical and vocational education in Gabon and in other countries .......... 47
Graph 34: Distribution of public expenditure on education by education levels and type, 1988 ............... 49
Graph 35:Gabon’s ranking in the 2013 Doing Business report .................................................................. 52
Graph 36: Main obstacles to private sector development,2009 .................................................................. 53
Graph 37: Percentage of paved roads,2009(In percentage of total roads) ................................................. 58
Graph 38: Interest expense rate in Gabon, in CEMAC countries, and other Middle-Income countries ...... 59
Table of Tables
Table 1: GDP use, 1980-2010 .................................................................................................................... 14
Table 2: Evolution of the workforce in the formal private sector: 1985-2010 (Number of jobs) .............. 18
Table 3: Proportion of the school population by age group,2010 .............................................................. 23
Table 4: Structure of the working population, 2010(Workforce numbers) ................................................ 24
Table 5: Satisfaction rate of employment vacancies and applications by qualification level,2010 ........... 29
Table 6:Distribution of main employment by institutional sector and socio-professional category2010
(Number of employed/Workforce numbers) .............................................................................................. 35
Table 7: Changes in average earnings by education level in Gabon (In percentage) ................................. 40
Table 8: Educational quantitative analysis –training (In percentage of work force from the group) .......... 42
Table 9: Public spending on education, Gabon and comparator countries (In percentage of GDP) .......... 48
Table 10:Electricity rates in Africa and Gabon, 2009 ............................................................................... 56
Table 11:NSSF Funding,2012(Inpercentage) ............................................................................................. 63
Table of Text Boxes
Text Box 1:National survey on employment and unemployment (ENEC) ................................................ 31
Text Box 2: Imbalance between the needs of the productive sector and the structure of the Gabonese
education system: the case of OLAM projects and Gabon......................................................................... 43
Text Box 3: An example of a Public Private Partnership in education: The Institute of Oil and Gas
(IPG) ........................................................................................................................................................... 51

iv
Gabonese Republic Currency Equivalents
Exchange Rate Effective as of October 31, 2013
Currency Unit CFA Franc USD 1.00 CFAF 455
Government Fiscal Year January 1 – December 31
Weights and Measures
Metric System
ACRONYMS
ANGT: Agence Nationale des Grands Travaux
APIEX: Agence de Promotion des Investissements et des Exportations/ Investment and Export
Investment Promotion Agency APIP: Agence de Promotion des Investissements Privés/Agency for the Promotion of Private
Investment
BEAC: Banque des Etats de l’Afrique Centrale/Bank of Central African States
BIT/ILO:Bureau International du Travail/International Labor Organization
BGD:Banque Gabonaise de Développement/Gabonese Development Bank
CEMAC: Communauté Economique et Monétaired’Afrique Centrale/Economic and Monetary
Community of Central Africa
CDD:Contrat à Durée Déterminée/Fixed-term Contract
CDE: Centre de Développement de l’Entreprise/Center for the Development of Enterprise
CNSS/NSSF: Caisse Nationale de Sécurité Sociale/National Social Security Fund
CPG: Confédération Patronale Gabonaise Gabonese Employers’ Confederation
CPI/PIC:Conseil Présidentiel de l’Investissement/Presidential Investment Council CNAMGS:Caisse Nationale d’Assurance Maladie et de Garantie Sociale/National Health
Insurance and Social Security Fund
EGEP2005:Enquête gabonaise d’Evaluation de la Pauvreté2005/Gabon Poverty Assessment
Survey 2005
ENEC2010:Enquête nationale sur l’emploi et lechômage2010/National Survey on
Employment and Unemployment 2010
FCFA/CFA franc: Francs de la Communauté Financière Africaine/Francs of the African
Financial Community
FODEX: Fonds de Développement et d’Exploitation/Development and Expansion Fund
FIR: Fond d’Insertion et de Réinsertion/Fund for Integration and Reintegration
MEEDD: Ministère de l’Economie, de l’Emploi et du Développement Durable/Ministry of
Economy, Employment, and Sustainable Development
MENETPFP: Ministère de l’Education Nationale, et de la Formation Professionnelle/Ministry
of National Education and Vocational Training
OHADA: Organisation pour l’Harmonisation en Afrique du Droit des Affaires/Organisation
for the Harmonization of Business Law in Africa
ONE: Office Nationale de l’Emploi/National Employment Office
GDP: Gross Domestic Product
RGPH 1993:Recensement Général de la Population et de l’Habitat/General Census of
Population and Housing
RESEN: Rapport d’Etat du Système Éducatif National/Status Report of the National Education System

v
ACKNOWLEMENTS
This report was prepared by a team led by Mr. Rick Emery Tsouck Ibounde (Senior
Economist, Poverty Reduction and Economic Management Department 3), who is also the
main author. The team also included Mr. Patrick Hoang-Vu (Economist, Department of
Human Development) and Mr. Fallou Dieye (Consultant, Department of Private Sector
Development). The team relied on two memorandums produced at the request of the World
Bank, one by Mr. Djima Moussilou (Engineer Statistician-Economist, Consultant) on the
analysis of results of the ENEC 2010 and Mr. Etienne Nsie (Professor of Private Law, UOB)
on social legislation in Gabon1. Mrs. Sidonie Jocktane (Executive Assistant in the Gabon
Office), Ms. Sonia Vanecia Boga (Administrative Assistant in the Gabon Office) and Ms.
Sylvie Munchep Ndze (Team Assistant in the Cameroon Office) contributed to the formatting
and editing of this report.
Ms. Ghislaine Delaine (Senior Statistician, World Bank), Mrs. Shobhana Sosale (Senior
Specialist in Education, World Bank), and Mr. Mamadou Ndione (Senior Economist, World
Bank) reviewed and provided comments on the preliminary draft report.
The team benefitted from the support and advice of Mr. Gregor Binkert (Country Director for
Gabon), Mrs. Zouera Youssoufou (Country Manager of the World Bank in Gabon), Mr.
Olivier Godron (Country Program Coordinator for Gabon), Mr. Mark Roland Thomas (Sector
Manger, AFTP3), Mr. Raju Singh (Lead Economist/Cluster Leader, AFTP3), Mr. Erik von
Uexkull (Economist, AFTP3), Mr. Gilberto de Barros (Senior Private Sector Development
Specialist, AFTFW), Mr. Jean Charles Crochet (Senior Transport Economist, AFTU2), and
Mr. Stephan Claude Frederic Garnier (Sector Leader, AFTSN).
This report is the result of a literature review, the analysis of the results from the first national
survey on employment and unemployment (ENEC 2010) conducted from December 2010 to
January 2011, and interviews with the key actors involved in employment issues (Ministry of
National Education, Technical Education and Vocational Training, Directorate General of
Human Resources at the Ministry of Employment, the National Employment Office (ONE),
the Gabonese Employers’ Confederation (CPG), the Trade Union Confederation of Gabon
(COSYGA), the National Social Security Fund (CNSS) and the National Health Insurance
Fund (CNAMGS). The team wishes to thank all the staff of these public and private
organizations for their open collaboration.
The first version of the report was discussed with the Gabonese authorities at the technical
level in November 2012, including with representatives of the Ministry of Economy and
Employment, the Ministry of National Education and Vocational Training, CNSS, CNAMGS,
and ONE. This version takes into account the comments received during this restitution
workshop. The seminar also recommended an assessment of the human resource and skills
1These two memos are: Education et Insertion des jeunes et des femmes sur le marché du travail au Gabon, June
2012,Djima Moussilou Engineer Statistician Economist and Législation du travail, système de protection sociale
des travailleurs et politiques de promotion de l’emploi a uGabon, Pfr.Etienne NSIE, Private law Associate, June
2012

vi
needs in the priority areas of the Strategic Plan for an Emerging Gabon (PSGE), as well as the
organization of a national forum so as to bring together the national and international actors
affected by the issue of employment in order to foster the sharing of experiences and agree on
a program of key priority actions that could generate inclusive growth.
vii
EXECUTIVE SUMMARY
1. This report was prepared as part of the implementation of the 2012-2016 World Bank
Country Partnership Strategy for Gabon, with competitiveness and employment as the first
pillar. Its aim is to highlight the main obstacles to job creation, in order to make
recommendations that will foster dialogue between the World Bank and the Gabonese
authorities on actions to be taken in order to make the implementation of the Strategic Plan for
an Emerging Gabon (PSGE) a more inclusive growth alternative than the previous development
strategies.
2. After presenting an analysis on the historical perspective of growth as well as its sources
and impact on employment, the report presents the main features of the Gabonese labor market
and the main challenges it faces, and then recommends reform areas that could strengthen the
impact of economic growth on employment.
I. Economic and social context: a positive long-term growth but weak job creation
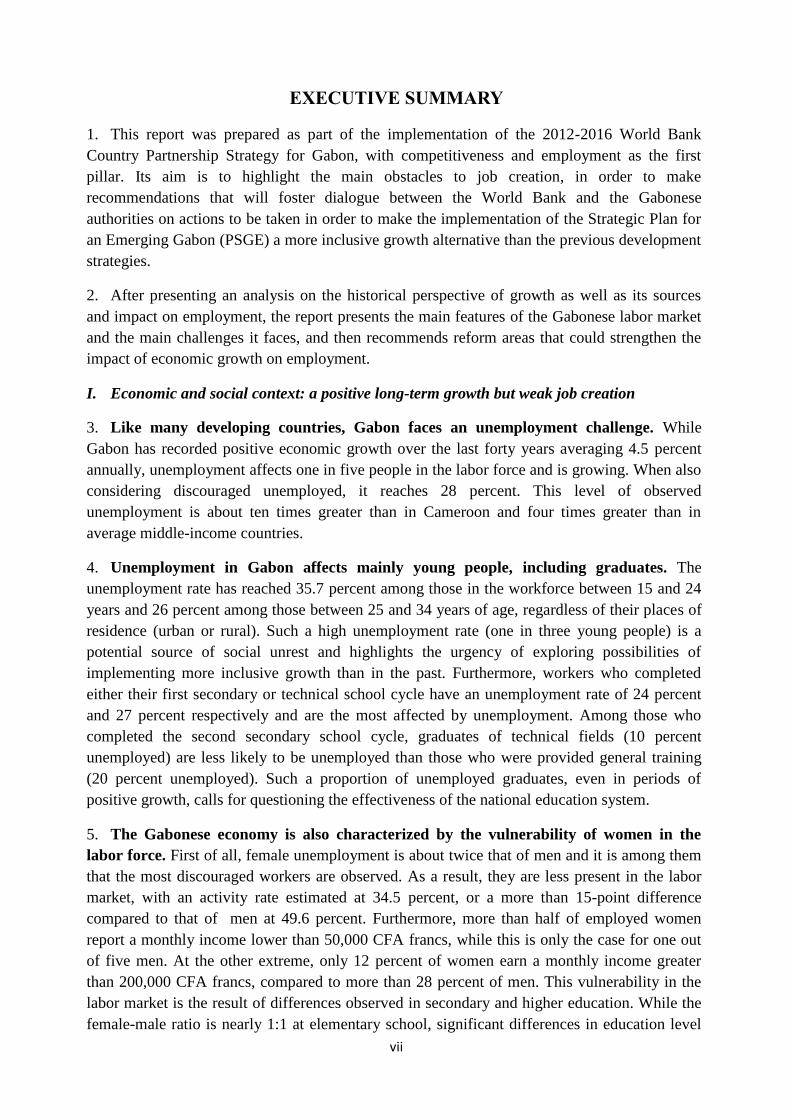
3. Like many developing countries, Gabon faces an unemployment challenge. While
Gabon has recorded positive economic growth over the last forty years averaging 4.5 percent
annually, unemployment affects one in five people in the labor force and is growing. When also
considering discouraged unemployed, it reaches 28 percent. This level of observed
unemployment is about ten times greater than in Cameroon and four times greater than in
average middle-income countries.
4. Unemployment in Gabon affects mainly young people, including graduates. The
unemployment rate has reached 35.7 percent among those in the workforce between 15 and 24
years and 26 percent among those between 25 and 34 years of age, regardless of their places of
residence (urban or rural). Such a high unemployment rate (one in three young people) is a
potential source of social unrest and highlights the urgency of exploring possibilities of
implementing more inclusive growth than in the past. Furthermore, workers who completed
either their first secondary or technical school cycle have an unemployment rate of 24 percent
and 27 percent respectively and are the most affected by unemployment. Among those who
completed the second secondary school cycle, graduates of technical fields (10 percent
unemployed) are less likely to be unemployed than those who were provided general training
(20 percent unemployed). Such a proportion of unemployed graduates, even in periods of
positive growth, calls for questioning the effectiveness of the national education system.
5. The Gabonese economy is also characterized by the vulnerability of women in the
labor force. First of all, female unemployment is about twice that of men and it is among them
that the most discouraged workers are observed. As a result, they are less present in the labor
market, with an activity rate estimated at 34.5 percent, or a more than 15-point difference
compared to that of men at 49.6 percent. Furthermore, more than half of employed women
report a monthly income lower than 50,000 CFA francs, while this is only the case for one out
of five men. At the other extreme, only 12 percent of women earn a monthly income greater
than 200,000 CFA francs, compared to more than 28 percent of men. This vulnerability in the
labor market is the result of differences observed in secondary and higher education. While the
female-male ratio is nearly 1:1 at elementary school, significant differences in education level
viii
in disfavor of women are observed for senior high school and higher education with 21 percent
vs. 16 percent and 8 percent vs. 6 percent, respectively. 23 percent of girls who dropped out of
school say that it was due to pregnancy and early marriages, and 42 percent answered that it
was because of the financial instability of their parents.
6. The level of private formal employment has been extremely limited over the last 25
years. After a period of full employment observed between 1960 and 1985 that was driven by
the government’s expansionary budget policies, the dynamics of the labor market between 1986
and 2010 was characterized by a continuous decline in formal private employment. Between
1986 and 1994, the formal private sector decreased by 30,000 jobs, or 24 percent of the 1985
workforce. It then increased slightly between 1995 and 2001 due to the economic recovery
observed after the devaluation of the CFA franc, before continuing its downward trend (at an
average of 3 percent per year) until 2010 when it reached 41,000 workers compared to 74,000
in 19852.
7. The main reason for the sharp decline in formal employment was the structural adjustment
effort between 1986 and 2002, which largely focused on cutting public investment programs
and also affected the sectors that depended on them the most (public works and civil
engineering, services, transport, etc.). Between 2003 and 2010, the decline in employment
continued despite a growth driven by the non-oil sector, mainly due to the acceleration of the
privatization program. The new owners downsized their workforce to levels compatible with
the actual production capacities of the privatized companies. The economic lay-offs related to
the privatization programs of parastatal companies led to a reduction of around 4,000 jobs
between 2004 and 2007. Gabon Telecom, which was privatized in 2007, recorded 700 lay-offs
out of a total 1,050 employees before privatization. The 2008-2009 financial crisis also had a
negative effect on employment, mainly in the forestry and mining sectors.
8. However, total employment (formal and informal) increased due to the massive recruitment
in public administration (without programming and unrelated to the actual level of needs) where
employment doubled between 1985 and 2010. The informal sector also played a buffer role,
serving as a refuge for a growing number of individuals in situations of exclusion or
precariousness looking for a job. Estimated at 98,000 in 1985, or 44 percent of the total working
population, its share in total employment in 2010 was estimated to be 57 percent, or 225,000
workers.
II. The main reasons for the low impact of growth on employment
9. Several factors contribute to the high unemployment rate and the decrease in formal
employment in Gabon, despite positive a long-term growth. The structure of the economy is
largely dependent on the oil sector, which requires a small workforce and is subject to the
fluctuations of the international market. Furthermore, the mismatch between the skills supplied
by the education sector and the needs of the productive sector does not enable a high number of
students to seize job opportunities. Additional obstacles to job creation in Gabon include a
2These figures are derived from administrative statistics (DGS and DGELF), ENEC statistics indicate a higher
number of private formal employment (66,357) but confirm a lower level than that of 1985.

ix
restrictive investment climate hindering economic diversification, rigid social legislation, and
an ineffective institutional framework for promoting employment.
Strong dependence on the oil sector
10. The high unemployment rate can be partly explained by the structure of the Gabonese
economy, which is strongly dependent on a less labor-intensive oil industry. While the oil
industry alone contributes more than 40 percent of the national value added and more than 60
percent of the government revenue, its employees represent less than 5 percent of the
workforce. Moreover, it has been observed that this sector’s workforce declined by 43 percent
between 1985 and 2000, due to the use of capital-intensive production processes and operations
that limit the use of manual labor.
11. Furthermore, inflationary pressures resulting from successive booms in the oil sector
contributed to an increase in the cost of production factors, undermining the country’s
competitiveness and boosting the foreclosure effect on highly labor-intensive industries such as
agriculture and fisheries.
12. Finally, the oil sector has very limited ripple effects on the rest of the economy, as oil
wealth is largely spread out through the state budget to the rest of the economy. Besides
recruiting in the public sector, the government encouraged job creation through the investment
budget and by developing ambitious public works programs. However, these public works
programs are themselves dependent on government oil revenue, as they are affected by the
volatility of oil prices. For example, following the sharp drop in oil prices in 1986, the public
investment program was divided by three. The immediate effect on employment was a sharp
contraction of the public works and civil engineering ‘labor force from 21,800 to 4,000, with an
induced effect on other sectors.
The mismatch between the training offered by the education system and employment
opportunities
13. In 2012, The French Development Agency (AFD) conducted a comparative analysis of the
education system leavers and the employment offered by the national economy within a
detailed diagnosis of the Gabonese education system (RESEN). It revealed that the labor market
is characterized by three main major imbalances: (i) a high proportion of workers who do not
have the minimum skills required to enter the labor market; (ii) a lack of workers with
intermediate qualifications (laborers, technicians, senior technicians) that represent over a
quarter of qualified job opportunities; (iii) at least twice the number of graduates compared to
the corresponding jobs related to their education level.
14. Moreover, a recent assessment of human resources required for the implementation of the
projects of the group OLAM inGabon over the 2012-2016 period, reveals that 75 percent of the
company’s needs for qualified workers (graduates) relate to careers in agribusiness , industrial
maintenance, and logistics, while the higher education offer shows that 63 percent of Gabonese
students are enrolled in literature studies, humanities, and economics. Clearly, much of

x
OLAM’s demand cannot be met locally. Anticipating this deficit, the Gabonese government is
prepared for the possibility of allowing the immigration of foreign labor over the next seven
years with an obligation to train nationals during the exception period.
15. The mismatch between the skills supply from the education system and the needs of the
productive sector are the result of several factors including:
16. The poor quality of the basic education system. Despite a net enrollment rate of 92
percent and parity between girls and boys estimated at 0.98 percent in elementary school, the
repeater rate is 37 percent while the African average is 15 percent. This figure is the highest of
any country in the world where this statistic is known. A high repeater rate is indicative of
inefficient management of student flows that results in overstuffed classrooms and difficult
material conditions. The teacher-student ratio in elemnetary school is 45.6, more than twice the
average for countries with a similar income. Teachers can have up to 90 students in class on any
given day.
17. Insufficient equipment also explains why there is such low quality in the education system.
Only 1 percent of second year classes and 5 percent of fifth year classes in the elementary cycle
have all necessary equipment and materials. Similarly, only half of elementary school students
have a textbook to use in class. By not having an opportunity to acquire basic knowledge, a
high proportion of young Gabonese cannot acquire professional skills and are thus
excluded from the labor market.
18. Low education coverage and low external efficiency of technical and vocational
education. The number of students enrolled in technical and professional schools is estimated
at 377 for every 100,000 inhabitants, barely above the African average (364.3) and more than
three times lower than in Cameroon and Tunisia and one and a half times less than in Mauritius.
Furthermore, the already inadequate technical and vocational training supply is generally
incompatible with business needs, mainly for the following reasons: (i) the mismatch between
the existing courses and the qualifications required by companies, (ii) the shortage of practical
vocational courses, with a reliance on more theoretical training, (iii) insufficient material
resources in training centers, (iv) facilities that are not compliant with local needs, (v) a lack of
trainers’ competence. As a result, more than 80 percent of technical and vocational education
graduates are not recruited in thefields for which they were trained, due to a lack of adequate
profiles, and only one out of three graduates finds a job.
19. Insufficient and ineffective budget allocations in the education sector. The share of the
budget allocated to education represents 13.4 percent of total expenditure or 2.7 percent of the
GDP in 2009, below the average for Sub-Saharan African countries where the average share of
the budget for education is 19 percent or nearly 5percent of the GDP. Furthermore, a high
percentage of expenditure is allocated to higher and secondary education at the expense of pre-
elementary and vocational education. The budgets assigned for spending on goods and services
and staff salaries are limited. Within the budget allocated for personnel costs, we observed that
salaries of non-teaching staff represent almost as much as those of teachers. This suggests that
there is more administrative staff than teachers, or that teachers’ salaries are too low, leading to
few incentives. In any case, this imbalance is a negative incentive for the teaching profession.
xi
20. Recognizing the challenges that the education system is facing, the government, in 2010,
initiated some reforms, and carried out some analytical work on the education system which led
to the adoption of a new organic and implementation law on education, training, and research
on the basis of the recommendations from the “national consultations on Education, Research,
and Training-Employment Matching” organized in May 2010. This new organic law introduced
several innovations, such as: (i) developing ongoing training and bridges at all levels between
general education (from primary to higher) and technical and vocational education, (ii) fostering
the promotion of public-private partnerships (PPP) in education, training, and research, (iii)
creating a national board of education, training, and research, CNEFOR, responsible for the
assessment and implementation of training provisions and of infrastructure and equipment
projects. The main challenge now is to operationalize this framework law by drawing on
the experiences of the global community.
21. At field level, changes are also observed. Some courses and training programs are
designed in consultation with companies that are actively involved in training. This is the case
for the center specializing in welding and maintenance of instruments used in the oil fields,
created with the help of Total Gabon. This is also the case of the partnership between the
Ministry of National Education, ONE, and the Compagnie minière de l’Ogooué (Comilog) in
order to train 400 young people in chemistry, electricity, and industrial mechanics so as to meet
the demand of the metallurgical complex of Moanda (C2M) that is being constructed by
COMILOG and will be operational in June 2013. The government should build on these
examples to establish a technical and vocational training system based on the needs of the
labor market.
A restrictive investment climate
22. Despite having undertaken important structural reforms in recent years, Gabon is
still perceived as a country where it is difficult to do business. It ranked 170th
out of 183
countries in the 2013 Doing Business report of the World Bank Group and is therefore one of
the 23 economies in the world where the business climate is the most difficult. In six areas,
Gabon is one of the countries in the lowest quarter (investor protection, starting a business,
transfer of ownership, insolvency management, payment of taxes and fees). For all others, it is
placed in the lower half. The 2009 World Bank survey on the investment climate revealed that
for all companies, electricity (quality and price) is by far the biggest obstacle faced, followed by
poor infrastructure quality and transport services as well as the quality of labor. These
constraints increase both the production costs of existing companies and the opportunity cost to
create new ones. In any case, this situation hinders job creation.
23. On the other hand, while the promotion of SMEs could be a powerful tool for
economic diversification, the current institutional and regulatory framework for the
private and entrepreneurship promotion has proved to be ineffective so far . The
institutional framework for the promotion of SMEs recently improved with the reform of the
Chamber of Commerce, which management was entrusted to the private sector in 2010, the
absorption of the SME Development and Expansion Fund (FODEX) and the Guarantee Fund
for SMEs by the Gabonese Development Bank (BGD), as well as the creation of a Center for
Enterprise Development (CDE) and the Agency for the Promotion of Private Investment

xii
(APIP). However, the distribution of responsibilities for investment promotion and support for
SMEs is not always evident between these institutions and agencies. The CDE, Chamber of
Commerce, and APIEX are all legally responsible for investment promotion. Similarly, CDE,
the SME promotion agency (Promo Gabon) and the Chamber of Commerce all have a
responsibility to assist and advise SMEs.
Social legislation that is inflexible and expensive for employers
24. With a desire to protect the employee, the labor law has ended up creating many
rigidities that hinder job creation. The Gabonese labor code is based on the principle of
applying the most favorable standard to the employee. According to this principle, in case of a
conflict between various labor law standards, the most favorable to the worker is applied. This
principle leads to court decisions that are often against the employer, which tends to slow
hiring. The employment termination procedure in cases of economic hardship are also very time
consuming and costly for the company. Severance pay can reach 52 months of wages.
25. The revision of the labor code in November 2010 made the labor code even more inflexible
by eliminating the possibility of a one-time renewal of a fixed-term contract (CDD).
Furthermore, legislation on hiring foreign labor, dating from 1968, states that foreign
employees cannot exceed 10 percent of a company’s workforce. This regulation is very
anachronistic in view of the current labor market characterized by a shortage of qualified labor.
26. Gabon has implemented a social protection system that is generous for workers but
costly for employers. Of about 22.5 percent of contributions levied on wages, about 20.1
percent are borne by employers and only 2.5 percent by employees. Furthermore, the national
health system’s social security fund is financed by a 10-percent levy on the turnover excluding
taxes of the mobile telephone companies operating in Gabon and 1.5 percent on all international
transactions from Gabon.
Ineffective institutional framework for employment promotion
27. The country lacks a reliable labor market information system. Statistics on employment
and unemployment are not regularly produced and the informal sector is largely unknown,
although it accounts for half of all jobs. Therefore, public intermediation in the labor market is
limited. Only 2 percent of job seekers use the National Employment Office. Moreover, the
target population of the Integration and Reintegration Fund (FIR, French acronym) is limited,
by law, to economic laid-off job seekers and young graduates. Its action is also constrained by
the weakness of the annual budget. Finally, the government has implemented a number of
specific employment programs called “second chance programs”, but they have a reduced
impact mainly due to insufficient resources.
III. Some recommendations to establish conditions for inclusive growth
28. The nature of the constraints discussed above points out the cross-disciplinary character of
combating unemployment and highlights the need for a multidimensional approach to address
it. As such, the following areas of reforms are recommended:
Progressively adapting the education system to the needs of the economy

xiii
29. In the short-term, the government’s main challenge is to reform the vocational and
technical education system in order to match its curricula to the demand of the labor market
(i.e. the current and future needs of companies). This will require reform updating and
developing new curricula, as well as training instructors. To do this, an assessment of the
professional qualifications in demand in the key priority areas of the Strategic Plan for an
Emerging Gabon (PSGE) must be started as soon as possible. Furthermore, systems of short-
term and flexible training leading to qualification based on both international experiences and
those mentioned above in Gabon should be organized in collaboration with the private sector.
30. The long-term challenge is to pragmatically operationalize the provisions of the law
21/2011 on the general approach to education, training, and research. This involves (i)
better programming to improve the management of school enrollment and reduce the repeater
and school dropout rates, (ii) improving the material conditions of teaching and (iii) building
staff capacity and motivation. These reforms can hardly be achieved without an increase in the
budgetary allocation for education or improving the efficiency of allocations within the sector.
Improving the investment climate
31. In terms of the investment climate, two reform areas seem urgent: (i) to strengthen the
dialogue between the private sector and the government, clarify the distribution of roles, and
build the operational capacity of the organizations responsible for promoting SMEs and
entrepreneurship. Strengthening the dialogue between the private sector and the government
could be accomplished by establishing a Presidential Investment Council (PIC) in charge of
defining and monitoring major reforms to promote business. The PIC would be an advisory
body composed of representatives from the private sector and government as well as workers,
chosen for their expertise, experience, and integrity, who would meet once or twice a year and
be chaired by the Head of State along with the relevant Ministers in order to define and assess
the reforms. A small team of senior experts would conduct the implementation and assessment
process of such reforms.
32. Due to the need to develop Gabonese SMEs, the second priority area is clarifying roles and
building the operational capacity of private sector development support organizations in. One
option would be as follows: (i) focus the action of the Center for the Development of Enterprise
(CDE) on the one-stop shop for the administrative formalities for business creation, (ii)
consolidate information functions on business opportunities, studies, and advisory support
services to SMEs, and investment promotion within the Chamber of Commerce and (iii) adapt
the Investment and Export Investment Promotion Agency (APIEX) to promote exports and
research international investors. In the end, once these three entities have acquired proven
experience in their respective responsibilities, they could be grouped within a single
institution.
Relax labor laws and reform the social security system
33. Labor legislation could be made more flexible by relaxing economic redundancy
conditions and reinstating the provisions of fixed-term employment contracts (CDD) in the
1994 Labor Code to facilitate job creation while protecting the worker. Moreover, the
demographic challenge in Gabon and the lack of skilled labor requires labor laws that are more

xiv
flexible towards immigrants. Rather than general provisions, the definition of a foreign worker
quota should be discussed by sector to consider its individual situation. This could be
accomplished by revising the collective agreements that have not been updated since 1986.
Strengthen and streamline the institutional framework for employment
promotion
34. Strengthening the institutional framework requires first the development of an employment
policy that sets overall government objectives and defines the appropriate institutional
framework to achieve them. The reform areas elaborated in this report could contribute to the
development of this policy. It is then essential to establish a reliable labor market information
system. An operational and strategic audit on special employment promotion programs (see
Chapter 3) in order to help providing them with adequate resources would make them more
effective. Following the audit, a performance contract could be signed between the government
and the agencies responsible for these programs.
35. The main recommendations of this report are summarized in the matrix below.

xv
MATRIX OF KEY RECOMMENDATIONS
I. Adapt the education system to the needs of the economy
Problems Recommendations Administration responsible Time frame
Low quality and inefficient basic
education system Mismatch between the technical
and professional education
system and the needs of the labor
market
• adopt a detailed and sequenced medium term action plan on rendering Law 21/2011 on the general approach to education, training, and research operational
• draw up a spending review and do a follow-up survey of
public expenditure on education
• launch an operational audit by the Ministry of National
Education, Technical Education, and Vocational
Training for Culture and Arts
• assess professional skills needs in the main priority sectors of the Strategic Plan for an Emerging Gabon (PSGE)
• extend the qualifying training experience of the
Institute of Petrol and Gas and the Partnership between ONE, the Ministry of National Education, and Comilog to other PSGE priority sectors (tourism, PUBLIC WORKS AND CIVIL ENGINEERING, agribusiness, etc.)
Ministry of National Education,
Technical Education and Vocational
Training, for Culture and Arts
(MENESTFP) MENETPFP
MENETPFP
MENETPFP
MENETPF
Short-term
Short-term
Short-term
Medium-term
Medium-term
xvi
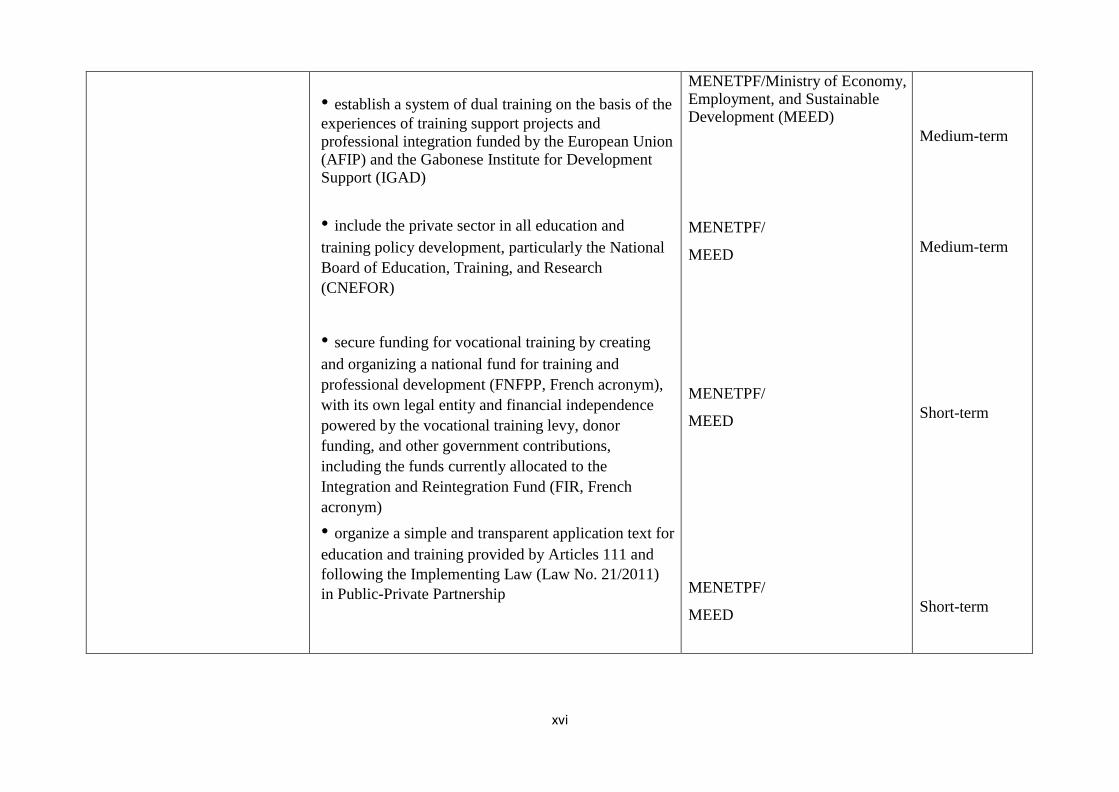
• establish a system of dual training on the basis of the
experiences of training support projects and professional integration funded by the European Union (AFIP) and the Gabonese Institute for Development Support (IGAD)
• include the private sector in all education and
training policy development, particularly the National
Board of Education, Training, and Research
(CNEFOR)
• secure funding for vocational training by creating
and organizing a national fund for training and
professional development (FNFPP, French acronym),
with its own legal entity and financial independence
powered by the vocational training levy, donor
funding, and other government contributions,
including the funds currently allocated to the
Integration and Reintegration Fund (FIR, French
acronym)
• organize a simple and transparent application text for
education and training provided by Articles 111 and
following the Implementing Law (Law No. 21/2011)
in Public-Private Partnership
MENETPF/Ministry of Economy, Employment, and Sustainable Development (MEED)
MENETPF/
MEED
MENETPF/
MEED
MENETPF/
MEED
Medium-term
Medium-term
Short-term
Short-term

xvii
II. Improve the investment climate
Low investment attractiveness
Ineffective institutional
support framework for
the private sector
• establish an action plan to implement the measures recommended by IFC under the service agreement signed by the government (business creation, sales logistics, land tenure, and building permits)
• finalize the financing plan of the 2012-2016
master plan for infrastructure in order to
accelerate its growth
clarify the roles of private sector
development agencies by:
• establishing a Presidential Investment Council
(PIC) responsible for high level dialogue
between the government and the private sector
on reforms aimed at facilitating business
• focusing the work of the Center for the
Development of Enterprises (CDE) on a
dedicated support center for the administrative
formalities of job creation
• consolidate informationfunctions on business opportunities, studies and support and advisory services for SMEs and promoting investments within the Chamber of Commerce as well as building its capacities
President/
Prime
Minister
ANGT
Ministry for Private Sector
Development/ MEED
Short-term
Short-term
Medium-term

xviii
Difficulty acces to credit
for SMEs/SMIs
High cost and low
quality of electricity
services
High cost and low quality of
transportation and logistics
services
• refocusing the role of the Gabonese
Development Bank (BGD) on SME financing
implement the reform of security adopted by OHADA
create the legal framework for credit information
bureaus
promote micro-finance
develop leasing
prepare an optimized electrical energy blueprint
that would anticipate the preparation and execution
of projects (generation and distribution) and their
highly transparent implementation according to
competitive mechanisms
based on reports produced under the service
agreements of the IFC and World Bankprepare
an action plan to improve transportation and
logistics services
Ministry of
Economy/Ministry of
Justice/BEAC
Ministry of
Economy/Ministry of
Justice/BEAC
Ministry of Petroleum, Energy,
and Water Resources
Ministry of Investment
Promotion, Public Works,
Transport, Housing and Tourism,
responsible for Territorial
Administration
Short-term Short-term
Short-term

xix
III. Relax social legislation
Rigidity of the labor code
Structural imbalance in the
social protection system
relax economic redundancy conditions;
reinstate the provisions of the fixed-term employment
contract (CDD) of the 1994 labor code to facilitate job
creation while protecting the worker;
adapt legislation on foreign labor to the current market
situation
• launch actuarial studies by CNSS and CNAMGS in
order to determine the parameters that will ensure long term sustainability of the two bodies
• negotiate changing parameters on the basis of
actuarial studies with social partners (employers, labor unions)
MEED/Parliament
MEEDD/Parliament
MEED/Parliament
PM/MEED, MBCPFP
PM/MEEDD, MBCPFP
Short-term
Short-term
Short-term
Short-term
Short-term
IV. Strengthen institutional framework and employment promotion policies
Lack of a national employment
policy
• organize a national dialogue on employment that
will bring together all concerned parties (government,
private sector, workers) and technical and financial
partners in order to share experiences and agree on a
priority reform program
• accelerate the implementation of the National
Observatory of Employment and Training
PM/MEEDD
MEED
Short-term
Medium-term

xx
Lack of comprehensive,
reliable, and regular
information on employment,
and unemployment
Lack of public intermediation
in the labor market
Low impact of second
chance programs
• develop industry statistics under the National
Strategy for the Development of Statistics with the priority areas of education, agriculture, tourism, work, infrastructure, trade, and other sectors that are identified as priorities. Use OHADA to improve the company database
• Conduct a survey of the informal sector
• Undertake regular surveys of the labor market • continue to decentralize ONE and increase its
operating budget
• create a Labor Exchange
• liberalize the job placement function
• Conduct a performance evaluation of
employment promotion programs in order to redeploy and increase their resources
MEED
MEED
MEED
MEED
MEED
MEED
MEED
Medium-term-
Short-term
Ongoing
Short-term
Short-term
Short-term
Short-term

1
I. INTRODUCTION
1. A country rich with natural resources and a per capita GDP of 11,768 USD in 2011, Gabon is
one of the few middle-income countries in Sub-Saharan Africa. Its population was estimated at 1.6
million in 2010 and is concentrated in its major urban agglomerations: Libreville, the
administrative capital;, Port-Gentil, the economic capital of and Franceville-Moanda, the mining
pole . The rest of the country has a density of less than 2 inhabitants per km2. Politically, the
country has been stable since its independence in 1960.
2. Although it has a relatively high per capita income largely deriving from the exploitation of
its raw materials (oil, magnesium, timberforest), like many other countries rich with natural
resources, Gabon has not been able to overcome the challenge of human development so far. The
available data show that a third of its population lives below the poverty line and that
unemployment affects a quarter of its workforce, mainly young people (one in three) who make up
half the population.
3. Conscious of this challenge, in 2009 the Gabonese authorities defined a new vision whose
strategic guidelines are detailed in an operational plan, the Strategic Plan for an Emerging Gabon
(PSGE) whose goal is to turn Gabon into an emerging country within one generation. PSGE
includes an ambitious public investment program to develop basic infrastructure and to create the
necessary economic environment for the emergence of a diversified economy. The major
challenge for PSGE, and how it could be different from previous development plans, will be to
become a growth model that is both sustainable and inclusive, leading to a significant
improvement in the revenue and living conditions of all Gabonese people.
4. This report is a contribution to the debate on how to achieve this goal. It was developed as
part of the implementation of a new World Bank intervention strategy in Gabon wherein
competitiveness and employment are the first pillar. It identifies the main obstacles to the low
impact of economic growth on employment in Gabon and makes recommendations that will foster
dialogue between the World Bank and the Gabonese authorities on the subject. These
recommendations could serve as inputs for the national consultation on employment that the
Government is planning to organize in the second half of 2013.
5. This analysis was difficult to conduct due to the unavailability of regular, comprehensive, and
reliable statistics. A qualitative leap has certainly been made by the Gabonese authorities in
conducting their first national survey on employment and unemployment, which produced key
data on the labor market for the first time. However, important aspects of labor market analysis
were not documented and thus its scope remains limited. Thus, as no survey on informal sector
enterprises was available and therefore no detailed analysis of this sector which accounts for
nearly half the labor force is possible. Similarly, the cost and labor productivity analysis
envisioned in this report was prevented by insufficient data.

2
6. The report is divided into three parts: (i) an analysis of Gabon’s economic performance since
the independence and its effect on employment, (ii) an analysis of the main characteristics of the
labor market and (iii) a review of the main obstacles to job creation. The conclusion recommends
some options for reforming the labor market as well as the legal and institutional framework for
employment promotion in Gabon.
3
II. ECONOMIC CONTEXT
1. This chapter focuses on the analysis of the historical perspective and sources of economic
growth between 1960 and 2010, as well as their impact on employment. Despite being generally
positive, it is shown that growth has been fragile and vulnerable as it is subject to the fluctuations
of international commodity markets. This chapter also indicates weak performance in terms of job
creation.
Gabon’s economic performance since independence
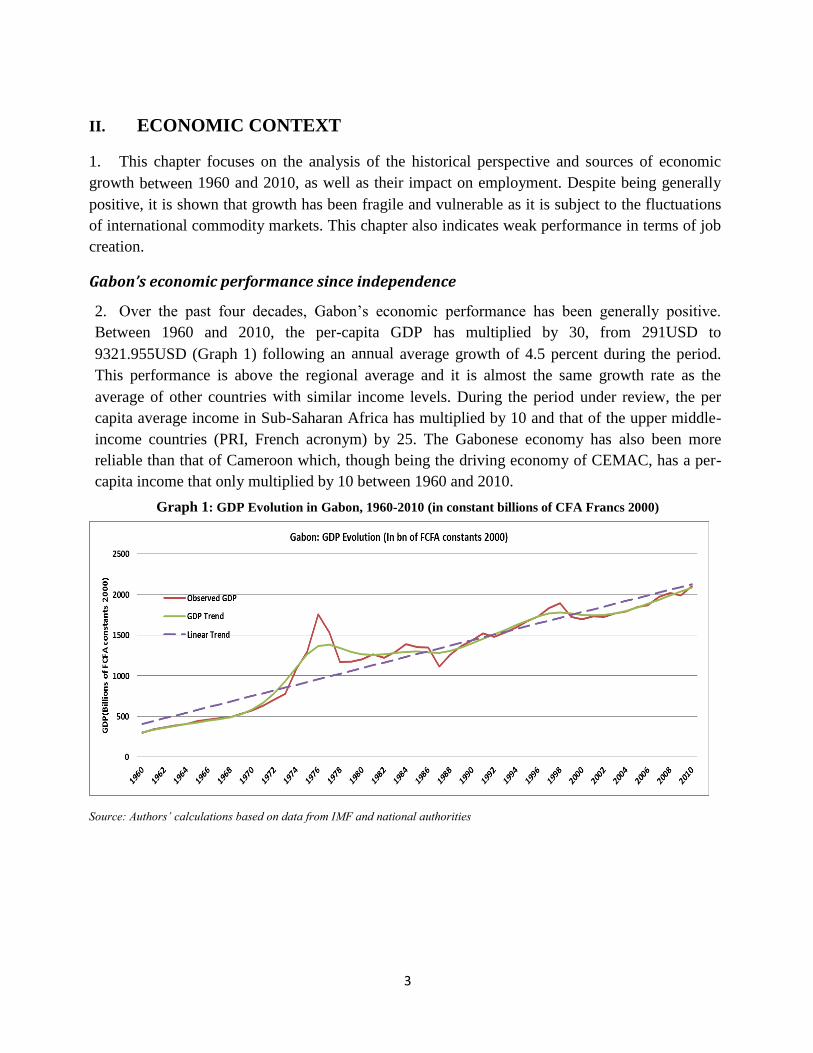
2. Over the past four decades, Gabon’s economic performance has been generally positive.
Between 1960 and 2010, the per-capita GDP has multiplied by 30, from 291USD to
9321.955USD (Graph 1) following an annual average growth of 4.5 percent during the period.
This performance is above the regional average and it is almost the same growth rate as the
average of other countries with similar income levels. During the period under review, the per
capita average income in Sub-Saharan Africa has multiplied by 10 and that of the upper middle-
income countries (PRI, French acronym) by 25. The Gabonese economy has also been more
reliable than that of Cameroon which, though being the driving economy of CEMAC, has a per-
capita income that only multiplied by 10 between 1960 and 2010.
Graph 1: GDP Evolution in Gabon, 1960-2010 (in constant billions of CFA Francs 2000)
Source: Authors’ calculations based on data from IMF and national authorities
4
Graph 2: GDP evolution per capita 1960-2010 (in USD)
Source: Authors’ calculations based on data from IMF and national authorities
3. However, this overall positive growth since the independence has followed a volatile trend
marked by oil prices. From a historical perspective, the trend of Gabon’s economic growth
between 1960 and 2010 can be divided into four distinct periods based on milestones in oil price
trend over the past four decades.
1960-1972: A period of stable and sustained growth with structural changes in the
economy. During this period, the real per-capita GDP increased to an average rate of 7.5 percent
annually.
1973-1985: A period with an oil boom and expansionary macroeconomic policies during
which GDP rose to a rate above the long-term trend (4.7 percent annually on average).
1986-2002: A period characterized by several major shocks as well as unsuccessful
attempts of structural economic adjustment. During this period, the growth rate of the real GDP
was only 2 percent annually, below the long-term trend.
2003-2010: A period marked by a rise in commodity prices, which enabled the Gabonese
government to undertake macroeconomic reforms that led to an economic recovery. During this
period, the level of the GDP per capita increased by an average of 2.5 percent annually.
The period of stable and steady growth: 1960-1972
4. During the first decade of the independence (1960), Gabon experienced a strong and stable
economic growth of about 7.5 percent on average from 1960 to 1972. This growth was mainly
driven by the forestry, mining (manganese and uranium), and oil sectors that were the government
priorities due to their influx of foreign exchange. This steady growth came with major structural
changes. The value added of extractive industries which was 15.4 percent between 1960 and 1965,
rose to 29.2 percent during 1965 and 1972. Agriculture, which contributed 15 percent to the value
added during 1960 to 1965, only accounted for 8 percent from 1966 to 1972.
5
5. The decline in agricultural value added was the result of: (i) a decrease in the workforce due
to the migration of workers to ongoing forest and mining projects, (ii) low price and production of
agricultural commodities and (iii) a lack of infrastructure (capital expenditure in the agricultural
sector accounted for less than 1 percent of total equipment spending during this period). The
contribution of an industrial sector dominated by public works and civil engineering PUBLIC
WORKS AND CIVIL ENGINEERINGand light manufacturing was stable at 14 percent between
1965 and 1972 while the tertiary sector, dominated by trade and transport activities, accounted for
7.9 percent of the GDP between 1965 and 1972.
The oil boom: 1973-1985
6. The combination of an increase in international oil prices in the 1970’s (+ 165 percent
between 1970 and 1976) and a doubling of the Gabonese oil production (5.4 million tons in 1970
and 11.3 million tons in 1976) contributed to the sharp and rapid increase in the real income that
almost doubled between 1972 and 1985, increasing from 706 billion CFA francs to 1,356 billion
CFA francs.
7. This massive and sudden influx of oil revenue enabled the government to implement an
expansionary budget policy that affected the economy through the following:
(i) An ambitious public investment program including but not limited to:
A railway of more than 600 km, whose estimated cost was 3 billion USD, was
constructed between 1973 and 1986 to connect the mining pole in the East to the
Atlantic Coast in the West of the country.
The development of a large parastatal sector including an agro-industrial sector
(palm oil, rubber, coffee, cocoa, cattle), transportation, telecommunications,
forestry, as well as electricity and water distribution services. In 1993, the
parastatal sector accounted for 12 percent of the GDP, 25 percent of employment,
and around 100 billion CFA francs in wages.
The development of social sectors including public hospitals as well as a generous
social security system.
Funding for this large public investment program was facilitated by easy access to international
capital markets that led to an increase in the stock of external debt by 1 percent of the GDP in
1986 to 39 percent in 1993.
(ii) A generous wage policy in the public and parastatal sectors enabled the redistribution of oil
revenues. The legal minimum wage (SMIG, French acronym) tripled between 1973 and 1977,
and doubled between 1979 and 1984. As a result, the average wage of the Gabonese public
service was more than three times that in Congo and two and a half times that in Cameroon.
(iii) A significant increase in social transfers and subsidies, as well as public spending on goods
and services. Social transfers and subsidies, accounting for between 6% and 10% percent of total
current expenditure between 1977 and 1983, grew rapidly in real terms, especially to support

6
public enterprises but also to fund scholarships abroad and subsidize the consumption of
commodities such as sugar, oil, and bread. Consumption of goods and services increased by 10
percent annually on average between 1973 and 1985.
8. This expansionary fiscal policy led to many distortions within the economy. Continuous
increase in public wages exerted upward pressure on the private sector and helped feeding
inflation in consumer prices. Inflation reached a rate of 28.5 percent in 1975 and consumer prices
increased on average by 11.4 percent annually between 1975 and 1985. This inflation has
subsequently increased the cost of production factors, degrading the country’s competitiveness and
enhancing the effect of crowding out non-oil activities such as agriculture. This was the first
Gabonese experience of the “Dutch disease”.
Degrowth and failed attempts of economic structural adjustment: 1986-2002
9. In 1986, international oil prices, which increased at an average of 4 percent annually between
1983 and 1985, fell by 50 percent. This sharp decline in oil prices led to a fall by 4 percent of real
GDP per capita in 1986 and 19 percent in 1987. Between 1989 and 1993, per-capita GDP
increased by an average of 4 percent annually through the resumption of oil production; especially
with the coming onstream of Rabi-Kounga offshore operations which represent the most
significant proven reserves in Gabon.
10. However, the resumption of growth driven by the exploitation of Rabi-Kounga was not
enough to reverse the downward trend of GDP growth that Gabon faced in 1986-1987. Per capita
GDP in 1993 was about 4,590 USD or 11 percent below the 1985 level, and even 37 percent
below the 1977 level. On average, between 1986 and 1993, per capita GDP declined at a rate of 1
percent annually. The effects induced by the 1986 oil shock persisted until 1993 and emphasized
the fragility and vulnerability of the Gabonese economy to external shocks while highlighting the
need for the country to diversify economically.
11. The fall in GDP per capita was accentuated by the abrupt fiscal adjustment phase following
the 1986 crisis. The fall in oil prices caused a sharp decline in fiscal revenue and pushed Gabon
to structural adjustment. Between 1986 and 1993, Gabon underwent several structural adjustment
plans supported by the IMF. Economic policies developed within adjustment programs were
mainly characterized by large cuts in the capital budget expenditure. The government’s
investment budget was divided by three between 1985 and 1987 and the share of public
investment in GDP fell from 29 percent in 1985 to 17 percent in 1993. This public investment
contraction led to a substantial decline in non-oil GDP.
12. The sharp drop in oil prices in 1985-1986 also contributed to a rapid expansion of
foreign public debt as well as an accumulation of government payment arrears. In the end of
December 1993, the accumulated arrears on external debt amounted to 1.1 billion USD and the
arrears on internal debt to approximately 450 million USD. Meanwhile, publicly guaranteed
external liabilities amounted to 3.4 million USD (96 percent of the national product) in 1994. In
1994 the external debt of Gabon, a third of which was made up of arrears, accounted for 113

7
percent of the national income, whereas it accounted for only 39 percent in 1985.
13. Moreover, since 1990 attempts to implement structural adjustment programs were weakened
by political and social unrest resulting from the transition to multiparty political system. This
change increased social demands and helped increase fiscal indiscipline. After the devaluation of
the CFA franc in 1994, the Gabonese government changed the orientation of its economic policy.
It decided to abandon direct intervention in the productive sectors of the economy and to refocus
its action on its governing powers.
Structural reforms and macroeconomic stabilization: 2003-2010
14. Between 2003 and 2010, the real GDP of Gabon grew at an average of 2.5 percent annually.
This growth has remained positive throughout the period with the exception of 2009, when Gabon
experienced negative growth following the collapse in the price of the country’s main raw
materials (oil, manganese, and timber). Additionally, and for the first time in the last three
decades, GDP growth was driven by the non-oil sector. The rate of non-oil GDP growth grew
from 2.3 percent in 2004 to 6.1 percent in 2010, reflecting a rebound in activity in the forestry and
mining sectors, rubber production, and the expansion of the agri-food and telecommunications
sectors following the privatization of telecommunications companies and the launch of production
of palm oil and rubber.
Graph 3: Oil and non-oil GDP growth 1990-2010 (annual variations in percentage)
Source: World Bank
15. This relatively good economic performance from 2003-2010 can be explained by three main
reasons:
a. Particularly high commodity prices: Rising oil prices observed after 2003 and the rise in the
price of aluminum and timber greatly helped to increase the income received by the Gabonese
government and attract FDI in both the oil and non-oil sectors. These new revenues increased
Gabon’s fiscal space and improved the country’s economic prospects.

8
Graph 4: Evolution of commodity prices, 1960-2009 (Price index, base 100 = 1960)
Source: World Bank
b. A healthier and more cautious fiscal policy with a set of pro-growth reforms. In a break
with past practice, Gabonese authorities seized the opportunity offered by the 2003 boom in oil
prices to significantly improve public finances. Oil revenues were used to repay most of the public
debt and finance a fund for future generations. Meanwhile, a major effort was made to contain the
level of current expenditure and improve the recovery rate of non-oil taxes. The fiscal balance
(cash basis) remained largely positive over the 2003-2010 period (an average of 5 percent of the
annual GDP). Gabon managed to confront the international 2008-2009 financial crisis with a
relatively sound macroeconomic position and enough fiscal space. However, the primary non-oil
deficit has deteriorated over the period, increasing from 8.2 percent of non-oil GDP in 2003 to
21.1 percent in 2010.
Graph 5: Evolution of the overall fiscal balance and the non-oil primary deficit 1990-2011
(in percentage of GDP)
Source: IMF

9
c. Considerable progress in the structural reform agenda. While between 1997 and 2003
only the Société d’Énergie et d’Eau du Gabon (SEEG) (Gabon’s Energy and Water Company, in
English) was privatized, the pace of privatization initiated in 1996 since then accelerated for
public and parastatal enterprises. In 2004, four agro-industrial companies were privatized:
Agrogabon, specialized in the production and processing of palm oil and livestock farming, as
well as the société de développement de l'hévéaculture au Gabon (HÉVÉGAB, French acronym)
(Gabonese Rubber Development Company, in English) were privatized, and both were sold to the
Belgian multinational, SIAT.
16. In 2005, the Société Gabonaise d’Exploitation du Transgabonais (SETRAG), a subsidiary of
Comilog (itself a subsidiary of the French company ERAMET), was granted a 30-year concession
to manage the national railway. The Société Meunière et Avicole du Gabon (SMAG) and the
Société Sucrière du Haut-Ogooué (SOSUHO) (Haut-Ogooué’s sugar company, in English) were
meanwhile been sold to the French group, CASTEL.
17. In January 2006, the government carried out the liquidation of Gabon Poste due to major
financial sustainability problems. This liquidation led to a restructuring of the sector. The same
year, the airline Air Gabon was also converted into a private airline, Gabon Airlines, which took
control of the holdings formerly owned by Air Gabon. Finally, in 2007, the government completed
the sale of a 51 percent of its shares in the national telecommunications enterprise Gabon Telecom
to Maroc Telecom, a subsidiary of Vivendi, for a total of 40 billion CFA francs.
Growth prospects
18. In the medium-term, the growth outlook of the Gabonese economy is favorable. This is due to
an anticipated upward trend in commodity prices, especially oil, allowing for the continuation of
the expansionary fiscal policy led by the government as part of their implementation of the
Strategic Plan for an Emerging Gabon (PSGE) whose overall objective is to make Gabon an
emerging economy by 2025.
19. PSGE is based on three pillars: (i) Gabon Vert (Green Gabon, in English) which aims to
sustainably develop 22 million hectares of forest and 800 kilometers of sea coast through the
timber industry, agriculture, and ecotourism, (ii) Gabon Industriel (Industrial Gabon, in English)
to promote the diversification of the national economy through the local processing of raw
materials and the export of products with high value added and (iii) Gabon des Services (Service-
industry Gabon, in English) whose goal is to develop infrastructure and enhance Gabonese human
resources in order to make Gabon a regional reference for financial services, new information
technologies, green economy jobs, higher education and health.
20. As part of the first phase for the implementation of the PSGE , the government has developed
an ambitious 2010-2016 infrastructure plan at a cost of 12,000 billion CFA francs whose goal is to
equip the country with infrastructure in order to render it more attractive to foreign direct
investment.

10
21. Growth projections for non-oil GDP are around 9.5 percent annually between 2013 and 2017.
In the absence of major discoveries, oil production should in turn decrease at an average of 1
percent per year. Overall, an annual growth of around 7 percent is predicted for the 2010-2017
period.
Graph 6: Growth outlook for the Gabonese economy 2008-2017
(annual variation of real GDP in percentage)
Source: IMF and Ministry of Economy, Employment, and Sustainable Development
22. Despite the decline, oil production will continue in coming years and remains the main source
of wealth in Gabon. This means that, as in the past, growth will be dependent on fluctuations in
commodity prices and that the implementation of ambitious government public infrastructure
programs will significantly depend on it. In case of a downturn, as in 1986, the end of the 1990’s
or in 2008-2009, government resources would be significantly affected and this could jeopardize
the government’s investment program. This situation suggests some caution, a tradeoff between
the need to bridge the gap in essential infrastructure and develop the non-oil sector as well as
establish reserves that may be necessary in case of poor conditions in the oil market.
Sources of Gabon’s growth
23. This section examines the various components of Gabonese GDP from three different angles.
We first examine the growth components on the supply side, and then turn towards the demand
components. Finally, after having estimated the aggregated production function inspired by Solow
(1986), we offer a factor specific growth analysis by examining the respective roles of
accumulating physical and human capital.
On the supply side: an economy still dependent on oil
24. The primary sector contributed an average of 45 percent to nominal GDP between 1980 and
2010. It consists mainly of the oil, mining, and forestry industries. The agricultural sector is
marginal and has been declining since the discovery of oil.

11
25. Oil production fell sharply between 1997 and 2010, from 18 million tons to 12.2 million tons
in 2010, but the oil sector remains Gabon’s main source of wealth. Its contribution to GDP was on
average 39 percent between 1980 and 2010. Gabon is the fifth largest oil producer in Africa south
of Sahara, with around 12.2 million tons in 2010. Proven reserves totaled 3.7 billion barrels. At
current production rates, reserves should run out around 2050-2060. After having recorded a
downward trend between 1998 and 2002 due to the declining productivity of the main field (Rabi-
Kounga), the use of new technologies has increased the performance of oil wells and operating
marginal fields have been made profitable by the increase in oil prices, helping stabilize
production around 12 million tons annually. In the medium to long-term, Gabon has deep and
ultra-deep water offshore potential, which has geological features similar to Brazil, where major
discoveries were made recently.
Graph 7: Sources of GDP, 1980-2010 (in percentage of GDP)
Source: IMF and Gabon’s National Accounts
26. Although its contribution to GDP is around 3 percent, the mining sector is a potential
source of diversification for the Gabonese economy. Gabon possesses a quarter of the world’s
manganese reserves, estimated at 200 million tons. It also has the largest untapped iron deposit in
the world, with the potential to produce up to 15 percent of the global niobium. Other mineral
resources exist, including gold, phosphate, rare earths, and alluvial diamonds that are widespread
throughout the territory.
27. Since the end of uranium mining exploitation in 1999, the mining sector has mainly been
limited to the extraction and exportation of manganese. The Compagnie minière de l’Ogooué
(Comilog), subsidiary of the French group Eramet, has been mining manganese since 1962 in the
region of Moanda (Southeast). Its production has increased sharply due to the sustained demand
for steel in the world market, mainly in China. It increased from 2.75 million tons in 2005 to 3.4
million tons of manganese in 2011.
28. The contribution of forestry to GDP has remained low (an average of 2 percent between
1980 and 2010). However, growth margins in this industry are significant. The pilot management
inventories conducted in the 1990’s revealed the presence of nearly 400 potentially exploitable

12
wood varieties in the Gabonese forest, only 80 of which are marketed. Among them is Okoumé,
which is excellent for veneer, enabling high quality plywood manufacturing.
29. The agricultural sector’s value added contribution is low despite considerable farmland
potential. Although its importance was estimated to be around 15 percent of GDP in the 1960’s,
the agricultural sector accounts for only 4 percent of national income today. Production is mainly
oriented towards food crops, such as plantains, manioc, maize, and rice. However, small volumes
of cocoa, coffee, palm oil, and peanuts are grown for export. The sector also includes large
industrial rubber and palm oil plantations. The sector’s development has been hampered by a
number of structural factors, including the rural exodus, the aging of the rural population, the poor
condition of roads, the low capacity of farms, as well as strategic choices favoring the creation of
an agro-industrial complex organized by sector (rubber, palm oil, cocoa, coffee, beef, broiler).
A nascent but growing secondary sector
30. The secondary sector is largely comprised of the agro-industry, timber industry, refining,
power generation, and public works and civil engineering industry. The agri-food industry consists
of a sugar plant, a palm oil production plant, a mineral water plant, five breweries, and a cigarette
factory. Other industries include chemical processing, construction materials, and secondary metal
processing, whose activities are mainly linked to the demand of the oil industry and public works
and civil engineering. Gabon also has a cement plant with a production capacity of 130,000 tons
annually. The generation and distribution of electricity and water is provided by the Société
d’Energie et d’Eau du Gabon (SEEG) (Gabonese Energy and Water Company, in English). The
public works and civil engineering branch has been experiencing renewed dynamism since 2010,
following the tripling of the government’s investment budget in the secondary sector, contributing
at an average of 11 percent to the generation of the GDP during the period under review.
31. The timber industry (so far focused on sawing, cutting, veneering, and carpentry), is expected
to increase its contribution to GDP in the coming years following the ban on log exports enacted
by the government in 2009 and the creation of a special economic zone near Libreville, mainly
dedicated to that industry. As the result of a partnership between the Singaporean company
OLAM and the Gabonese government, the Special Economic Zone of Nkok should have a
processing capacity of one million cubic meters of rough timber.
A dominant tertiary sector
32. On average, over the 1980-2010 period, the tertiary sector represented 30 percent of the GDP.
Services, transportation, and trade represented the core of this sector that is partly dependent on
public demand. Services grew at an average rate of 5 percent over the last decade, driven by the
expansion of mobile telephony.
33. The contribution of the tourist sector remains marginal in the economy. The number of
international arrivals in Gabon increased by 39 percent between 1990 and 2009, reaching a total of
151,000 visitors; but tourism over the same period represented only 6 percent of GDP, or 470
billion CFA francs. The goal of the Gabonese government is to make the country a world leader in
13
ecotourism and a regional leader in business tourism. To this end, in 2011 the Ministry of Tourism
finalized a 2011-2016 Sectoral Operational Plan for Tourism based on the guidelines of the
Strategic Plan for an Emerging Gabon. This plan has four pillars:
implement effective tourism governance;
remove barriers to tourism development;
develop a critical mass of tourist accommodation;
make Libreville a Central African hub.
The major objective of this program is to attract 100,000 tourists annually in the standard and
premium segments by 2020.
On the demand side: the supremacy of domestic demand
34. As for demand, final consumption is the primary source of growth in Gabon, accounting for
nearly two thirds of GDP from 1980-2010. After a double-digit growth rate during the decade
following the first oil boom, it shrank in the second half of the 1980’s following the sharp
contraction in economic activity that resulted from the first structural adjustment plans. The
growth pace then accelerated 0.8 percent annually in 1991-2003, satisfying social demands that
marked the return of multiparty system in Gabon in 1990. From 2003-2010, it continued to grow
faster (especially in the non-oil sector), at an average of 5.8 percent following economic recovery,
with the 2006 minimum wage raise and an increase in the civil service workforce.
35. Investment represented around a third of the GDP from 1980-2010. It consisted mainly of
investments in the oil and mining sectors. In terms of volume, however, investments in the oil
sector declined over the period. In contrast, public investment grew by an average of 17.7 percent
over the 2003-2010 period, due to the funding needs of the DSCRP priority program adopted in
2006, tripling the government’s investment budget in 2010.
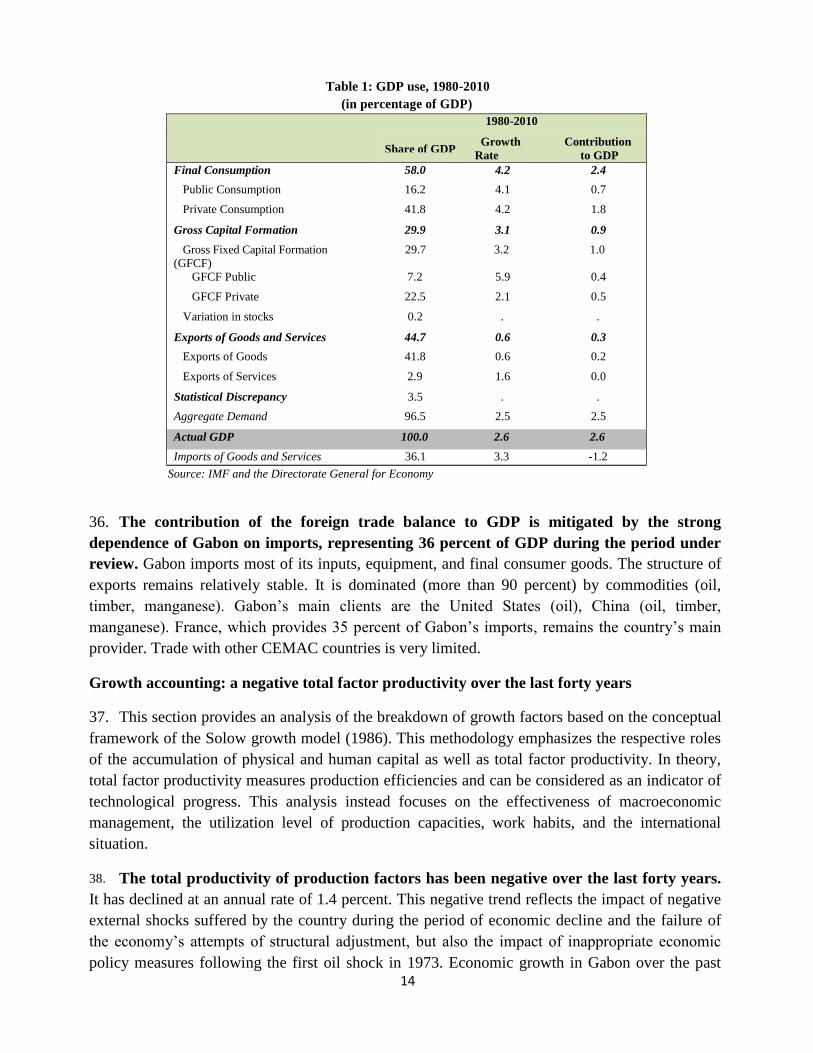
14
Table 1: GDP use, 1980-2010
(in percentage of GDP)
1980-2010
Share of GDP Growth Contribution
Rate to GDP Final Consumption 58.0 4.2 2.4
Public Consumption 16.2 4.1 0.7
Private Consumption 41.8 4.2 1.8
Gross Capital Formation 29.9 3.1 0.9
Gross Fixed Capital Formation 29.7 3.2 1.0 (GFCF)
GFCF Public 7.2 5.9 0.4
GFCF Private 22.5 2.1 0.5
Variation in stocks 0.2 . .
Exports of Goods and Services 44.7 0.6 0.3
Exports of Goods 41.8 0.6 0.2
Exports of Services 2.9 1.6 0.0
Statistical Discrepancy 3.5 . .
Aggregate Demand 96.5 2.5 2.5
Actual GDP 100.0 2.6 2.6
Imports of Goods and Services 36.1 3.3 -1.2 Source: IMF and the Directorate General for Economy
36. The contribution of the foreign trade balance to GDP is mitigated by the strong
dependence of Gabon on imports, representing 36 percent of GDP during the period under
review. Gabon imports most of its inputs, equipment, and final consumer goods. The structure of
exports remains relatively stable. It is dominated (more than 90 percent) by commodities (oil,
timber, manganese). Gabon’s main clients are the United States (oil), China (oil, timber,
manganese). France, which provides 35 percent of Gabon’s imports, remains the country’s main
provider. Trade with other CEMAC countries is very limited.
Growth accounting: a negative total factor productivity over the last forty years
37. This section provides an analysis of the breakdown of growth factors based on the conceptual
framework of the Solow growth model (1986). This methodology emphasizes the respective roles
of the accumulation of physical and human capital as well as total factor productivity. In theory,
total factor productivity measures production efficiencies and can be considered as an indicator of
technological progress. This analysis instead focuses on the effectiveness of macroeconomic
management, the utilization level of production capacities, work habits, and the international
situation.
38. The total productivity of production factors has been negative over the last forty years.
It has declined at an annual rate of 1.4 percent. This negative trend reflects the impact of negative
external shocks suffered by the country during the period of economic decline and the failure of
the economy’s attempts of structural adjustment, but also the impact of inappropriate economic
policy measures following the first oil shock in 1973. Economic growth in Gabon over the past

15
forty years has been mainly due to an accumulation of capital. However, it should be noted that
from 2003-2010, total factor productivity was less negative than in previous sub-periods,
reflecting macroeconomic stabilization efforts made possible by a good international environment
characterized by very high commodity prices.
Graph 8: Factor specific contributions to GDP growth, 1970-2010
(in percentage)
Source: Author’s calculations using data from the World Bank and IMF
Impact of growth on employment
39. The dynamics of the labor market between 1960 and 2010 can be divided into two main
periods: a period of full employment between 1960 and 1985 driven by the government’s
expansionary fiscal policy, and a long period of decline between 1986 and 2010, which was offset
by increases in informal employment and public administration staffing.
The period of full employment: 1960-1985
40. During the period of growth that preceded the oil counter shock in 1986, the
employment level followed the same trend as that of the economic activity. Between 1969 and
1977, the formal sector workforce recorded a leap of more than 122 percent, increasing from
61.781 to 137.645, due to the construction of large public works made possible by the enormous
resources from the oil boom. The main employment providing sectors were public works and civil
engineering, logging, and services. These three sectors accounted for 24 percent of GDP,
employing nearly 70 percent of the workforce in the private sector. However, despite its strong
contribution to domestic production, the oil industry contributes very little to employment. Over
the entire period, its workforce remained at less than 2 percent of the total workforce in the
modern sector.
41. Due to its small population and the obvious lack of skilled labor at the time, the country
signed skilled labor import agreements with other countries in West Africa for foreigners to work
in major public works projects, including the construction of the Transgabonais railway from 1973
to 1986 and the preparation work for the Summit of Heads of State of the OAU in 1977. In 1993,
foreign labor accounted for a little over a quarter of the employed (25.7 percent). In public works

16
and civil engineering and trade, it represented 50 percent and 68 percent of employment
respectively.
42. The workforce increase in the modern sector slowed between 1978 and 1980 following the
financial crisis in Gabon after the overheating that resulted from the implementation of
infrastructure projects undertaken as part of the preparation for the Summit of Heads of State of
the OAU. The fiscal austerity measures taken within the framework of the 1978 stabilization plan
led to a slowdown in the public investment program that resulted in a decline of orders for public
works and civil engineering enterprises. This public works and civil engineering industry
contraction spread to the services and trade industries. In total, the modern sector workforce
observed a decrease of 36 percent between 1978 and 1980.
43. Since 1980, employment has resumed its growth following the implementation of a public
investment program described in the Interim Plan for Economic and Social Development 1980-
1982 and the 5th
Economic and Social Development Plan 1984-1988. As during the next oil boom,
public works and civil engineering industry was a major source of employment in the private
sector employing 21 percent of the workforce, followed by industry (15 percent), commerce (11
percent), and transport (10 percent).
44. The full employment period was also marked by a strong increase in public administration
staff, reaching 14,800 in 1969 and 41,000 in 1985, a 275 percent increase. During this period, the
unemployment rate was around 3 percent.
Continued deterioration of the labor market: 1986-2010
45. Between 1986 and 2010, Gabon experienced a reduction of the labor market characterized by
a contraction of formal employment, a high level of unemployment, and an increase in the
informal sector.
46. Between 1986 and 1994, the formal sector declined by 30,000 jobs, representing 24 percent of
the 1985 workforce. This contraction only affected formal companies whose employment fell at an
average of 6 percent annually, while public sector employment increased 1.3 percent annually
despite the recommendations of the structural adjustment programs which called for reducing the
government’s expenses, including the limitation of its workforce.
47. After declining between 1995 and 2002 following the devaluation of the CFA franc, the level
of formal private employment continued its decline (2 percent on average) between 2003 and
2009. The increase in recruitment observed from 1995 was due to the upturn of forestry activity in
response to gains in competitiveness driven by the devaluation of the CFA franc and the
resumption of public investment programs. These were made possible by the improvement in
public finances resulting from monetary adjustment programs.

17
Graph 9: Employment trends, 1985-2010 (number of jobs)
Sources: Ministry of Labor,RGPH1993, EGEP2005, ENEC2010
48. As shown in Table 2 above, all industries in the formal sector experienced declining
workforces between 1985 and 2010. However, in the structural adjustment effort between 1986
and 2002 on the public investment program, the sectors (public works and civil engineering,
services, transportation) that depended on it the most were also the most affected. For example, the
public works and civil engineering labor force was divided by four between 1985 and 2000, falling
from 21,800 to 5,253. In 2010, it was estimated at nearly 4,000, or 1/5th
of the 1985 level.
49. In extractive industries, the workforce in the oil sector fell 43 percent between 1985 and 2000
due to the use of capital-intensive production processes that limited the use of labor. This decline
increased from 1995 onwards in relation to the decline in the production of Rabi-Kounga, the
largest field ever exploited in Gabon. Since 2003, the increase in junior company activities, made
possible by the hike in oil prices, has led to a significant increase in numbers in the oil sector even
though its contribution to employment remains low. The mining sector labor force declined from
1999 onwards following the cessation of uranium mining activities. The transport sector
workforce also observed a sharp decline since 2005 following the liquidation of Air Gabon, the
national air carrier. Declining numbers in services and trade between 1985 and 2010 were linked
to this contraction observed in other sectors.

18
Table 2: Evolution of the workforce in the formal private sector: 1985-2010 (number of jobs)
1985 1990 1995 2000 2005 2006 2007 2008 2009 2010
Agriculture 2524 2300 2201 2190 2011 2076 2149 2090 2084 2113
Oil & drilling 2636 2420 1732 1511 1547 1678 2082 1833 2337 2447
Mining 3116 2580 1842 1464 1502 1479 1498 1484 1477 1492
Agri-food and beverage
industries 4517 4464 3363 2919 1875 2203 2254 2196 3084 3120
Other industries 4677 2830 2408 2053 1790 1798 1820 1625 1817 1820
Electricity & refining 2476 2487 2022 1892 1955 1910 1918 1928 1963 2263
Public works and civil engineering 21810 3991 4343 5253 4847 4901 4941 4340 3256
3907 Transportation 11213 9562 9550 9589 11193 7032 7718 6720 7240 8302
Services 9645 7443 8689 11670 11180 11505 11896 11510 8091 9023
Trade 9084 5547 5202 5926 5732 5873 6085 3502 4741 4835
Banks & insurances 2355 2297 1995 2010 2161 2040 2081 1982 2052 2195
Total 74053 45921 43347 46477 45793 42495 44442 39210 38142 41517
Source:DGS and DGELF
50. Public employment was able to offset the downward trend of private formal
employment and stabilize the overall level of formal employment. Graphs 10 and 11 below
show the contrasting evolution of the workforce of the public and private sectors. While the share
of the private sector workforce has decreased significantly since 1986 to reach 37 percent of total
modern employment in 2009 compared to 67 percent in 1985, the public sector workforce steadily
increased throughout the period and accounted for 62 percent of the total modern sector workforce
in 2009. 2010 ENEC data show increased staffing in the modern sector in 2010 compared to 2009,
which is consistent with the government’s decision to triple the investment budget in order to
finance its ambitious infrastructure development plan. This upward trend is expected to continue at
least in the medium term.

19
Graph 10: Evolution of formal employment, 1985-2010 (number of jobs)
Source: Authors’ calculations according to data from DGS and DGELF
Graph 11: Evolution of the relative shares of the public and private workforce in formal employment 1985-2010
(in percentage of total formal employment)
Source: Authors’ calculations according to data from DGS and DGELF
51. The weight of the informal sector in the Gabonese labor market has continued to grow
since 1986. Estimated at 98,000 in 1985, or 44 percent of the working population, its share of total
employment (formal and informal), was estimated at 57 percent in 2010. The informal sector has
worked alongside Public Administration as a buffer in providing refuge to a number of people
suffering exclusion and precariousness while in search of employment. The 1986 crisis also led to
an increase in multi-activity in response to reduced employment opportunities in the modern
sector. On the corporate side, it has enabled the emergence of new forms of adjustment in the
labor market with the use of short-term contracts and the development of temporary work.

20
Jobless growth 2003-2010
52. Although growth has been positive with the exception of the year 2009 and the non-oil sector
(more labor-intensive and believed to have grown faster than the oil sector), between 2003 and
2009 the formal employment level has steadily declined at an average rate of 3 percent annually.
The decline in employment during this period can largely be explained by the restructuring of the
economy. Accelerating the timeframe of privatizing public enterprises in 2004 reduced the
number of these companies at levels consistent with their activity levels and profitability. This
resulted in a reduction of around 4,000 jobs between 2004 and 2007. Gabon Telecom, the only
company privatized in 2007, experienced 700 losses out of a total number of 1,050 employees.
The financial crisis of 2008-2009 also had a negative effect on employment, mainly in the
forestry and mining sectors. The modern private sector workforce showed a decrease of 10
percent in 2008 and 11 percent in 2009.
Chapter conclusion
53. The analysis of the trajectory and sources of economic growth in Gabon show that no
structural changes have occurred in the economy since the 1973 oil shock. Oil exploitation has
remained the main source of wealth. Due to the volatility of oil prices, the economy has remained
vulnerable to external shocks. The results of the analysis of factor-specific growth contributions
show a negative contribution of total factor productivity growth, revealing the inadequacy and/or
ineffectiveness of structural reforms by Gabonese authorities to diversify the economy. The
accumulation of capital by implementing major infrastructure programs is not enough. There
should be more of a shift in government priorities to increase human capital and improve
governance and the investment climate to the extent that these variables contribute to increasing
the economy’s productivity.
54. Another major finding is the weak impact of growth on employment. This is closely related to
the two observations made above, the strong dependence on a non-labor-intensive natural resource
sector and the failed attempts to promote a non-oil based economy. In Chapter 3, the other main
factors contributing to the low impact of growth on employment are examined.

21
III. THE GABONESE LABOR MARKET
1. This chapter is dedicated to an analysis of the main characteristics of the Gabonese labor
market. It is based on the results of the first national survey on employment and unemployment
(ENEC 2010, in French) and other written and oral sources (administrative statistics, interviews,
and various reports). The analysis of the labor market characteristics is preceded by a presentation
of Gabon’s demographic profile. Due to the vulnerability of youth and women in the labor market,
an analysis of the returns on education and the impact of education on professional integration was
undertaken for these two categories of the population.
Demographic context: a young and urban population
2. The socio-demographic characteristics of a population determine the structure of a
country’s labor market. The spatial distribution of the population (rural/urban), the weight of
youth in conjunction with the age structure, female/male relations and education levels are all
structural elements of the labor market.
3. Gabon is a sparsely populated country. Spread over an area of 267,667 km2,
ENEC3
3
estimated that the total population of Gabon in 2010 was 1,601,125 inhabitants, with a
density of 6.14 residents/km². This is one of the lowest densities in the CEMAC sub-region.
Women represent 51 percent of the population. Life expectancy is 62 years for women and 57
years for men. Gabon’s sparse population is largely due to its humid equatorial climate, favorable
to the development of endemic diseases. The level of male and female sterility has long been a
major cause of hypofertility in Gabon.
4. The Gabonese population is relatively young. Nearly 58 percent of the population is less
than 25 years of age and the average age is 24 years. 47.2 percent of the population is under 20
years and 36 percent of the population is under 15 years. The school-age population in primary
education (5-14 years) is 22.3 percent and 11.5 percent of Gabonese are between 15 and 19 years
of age. The population pyramid below shows that the age structure is roughly the same regardless
of gender.
5. The young population is both an asset and a challenge. It is an asset because it is a
potential reservoir of labor that the country will need to implement its new development vision. It
is a challenge as it represents a strong social demand that, if not met, could be a source of social
conflict. It also represents a challenge for the economy that must absorb this working population
and provide jobs for them in the present and future.
3The most recent data on population is that of ENEC 2010. The last two General Census of Population and Housing
(RGPH, French acronym) were in 1993 and 2003. The use of RGPH data from 2003 has been suspended following a
decision of the Constitutional Court. Preparations for RGPH 2013 are underway.

22
Graph 12: Age pyramid of the Gabonese population, 2010
(in thousands by age group)
Source: ENEC2010
6. Eight out of ten Gabonese live in urban areas. The two major urban centers are Libreville
and Port-Gentil, which are home to more than half of the population (51.2 percent). The entire
urban population accounts for 82 percent of the total population compared to 4.2 percent in 1960.
The rest of the population is concentrated along the road and river routes. Unique in Africa, this
situation is the result of a massive rural exodus, mainly for economic reasons. The rapid and
unanticipated growth of urban populations, especially in Libreville and Port-Gentil, has resulted in
pressure on socio-economic facilities. In contrast, the depopulation of rural areas has gradually led
to a decrease in agricultural labor and an increase in the dependent rural population (under 15 and
over 65). Finally, the uneven spatial distribution of the population poses a real threat to
development, especially in land use planning and the organization of social services.
Graph 13: Structure of the Gabonese population by place of residence and gender 2010
Structure of the rural population Structure of the urban population
(in thousands by age group) (in thousands by age group)
Source: Authors’ calculations using data from ENEC 2010

23
7. The immigrant population was estimated to be 200,000 people in 2010, or 12.5 percent
of the total population. 68 percent of immigrants come from West Africa, 22 percent from
CEMAC countries, and 7 percent from Central African countries outside of CEMAC. The main
reasons for international migration are the search for employment (52.1 percent), family
reunification (21.8 percent), and marriage (18.1 percent). More than 50 percent of total immigrants
are employed and only 3 percent are affected by unemployment. Even though immigrants have a
low average level of education, they perform well as artisans, vendors, and independent workers in
the trade, service, and agriculture sectors.
8. The population has a relatively high education level. Although decreasing with age, the
proportion of educated Gabonese is relatively high: 74 percent at secondary school first cycle, 18
percent at secondary school second cycle, and 6 percent at a higher level. Less than 1 percent of
the population has no education. When combining age and education cycle, it can be shown that
the enrollment rate is 99 percent in primary school for children aged 6-9 years, 63 percent in
secondary school first cycle for students between 15 and 19 years, 34 percent for secondary school
second cycle for students between 20 and 24 years, and 17 percent at a higher level for the 25-29
age group. By gender, the results show that 78 percent of women and 71 percent of men have
reached a level higher than secondary school. Differences in education attainment detrimental to
women were observed for the second cycle secondary levels (21 percent vs. 16 percent) and higher
education (8 percent vs. 6 percent). Urban populations have mostly reached the first cycle of
secondary school while the majority of rural populations have not progressed beyond the primary
level.
Table 3: Proportion of the school population by age group, 2010
(in percentage of total population)
Age group percent schooled percent non-
schooled
6-9years 93.7 6.3
10-14 years 98.6 1.4
15-19 years 98.2 1.8
20-24 years 96.2 3.8
25-29 years 94.3 5.7
30-34 years 94.5 5.5
35-39 years 92.9 7,1
40-44 years 92.5 7.5
45-49 years 91,8 8.2
50-54 years 86.2 13.8
55-59 years 88,1 11.9
60 years and + 49.2 50.8
Source: ENEC2010, DGRH-DGS
9. The available demographic projections indicate that the Gabonese population will reach
2.1 million by 2025 and 3.2 million by 2050. Although the proportion of young people (under
30) should gradually decline to 50 percent of the total population by 2050 compared to 68 percent

24
in 2000, the Gabonese population remains very young and will put the country in high demand for
basic social infrastructure (education, health, housing) and employment. The working age
population could represent 68 percent of the total population by 2025 and 74 percent by 2050, a
labor force of 1.4 million people by 2025 and 2.4 million by 2050.
Graph 14: Demographic projections, 1960-2025
(in thousands by age group)
Source: United Nations, Department of Economic and Social Affairs
Main features of the Gabonese labor market
10. The Gabonese working population according to the ILO was assessed by the ENEC in 2010
to be 494,183 people. Of these, the economy employed 393,440 people the same year. The labor
market therefore reached a deficit of 100,750 employees, equivalent to an unemployment rate of
20.4 percent. By incorporating discouraged workers, estimated at 49,341 people, the Gabonese
workforce reached 543,524. Aside from a high unemployment level affecting mainly young
graduates, the Gabonese labor market stands out by its urban labor force and the importance of the
public sector. However, as in other African economies, the Gabonese labor market includes a high
percentage of informal employment.
Table 4: Structure of the working population, 2010 (workforce numbers)
Total Females Males
Employed 393440 244020 149420
Unemployed 100743 41130 59613
Discouraged workers 49341 16268 33073
Total labor force
ILO definition 494183 285150 209033
Including discouraged workers 543524 301418 242106
Source: ENEC2010

25
Very high and rising unemployment
11. The unemployment level is the most striking aspect of the Gabonese labor market.
Measured at 18 percent during the 1993 general population census, Gabon’s unemployment rate
according to the ILO4 was estimated by ENEC to be 20.4 percent in 2010 with unemployment
growing (including “discouraged workers”) to 27.6 percent. It increased by five percentage points
between 2005 and 2010 as the 2005 Gabonese poverty assessment survey (EGEP) estimated it to be
16.3 percent.
Graph 15: Evolution of unemployment rate (according to ILO) in Gabon, 1993-2010
(in percentage)
Source: RGPH1993, EGEP2005, ENEC2010
12. The comparison with a number of countries and groups of countries in various world regions
where a national rate was available confirmed Gabon’s particularly high unemployment rate. The
figure 16 below shows that it is about ten times higher than in Cameroon, four times more than
average middle-income countries, and twice to three times more than in other countries selected
for comparison with the exception of South Africa and Ethiopia.
4Unemployed (according to ILO): a worker that hasn’t worked during the seven days prior to the survey, even for an
hour, and who is looking for a job and is available to start immediately. Unemployment in the broader sense: ILO
unemployed + “discouraged workers” (=non-workers who haven’t looked for a job during the seven days prior to the
survey but are still available if they were offered a job).
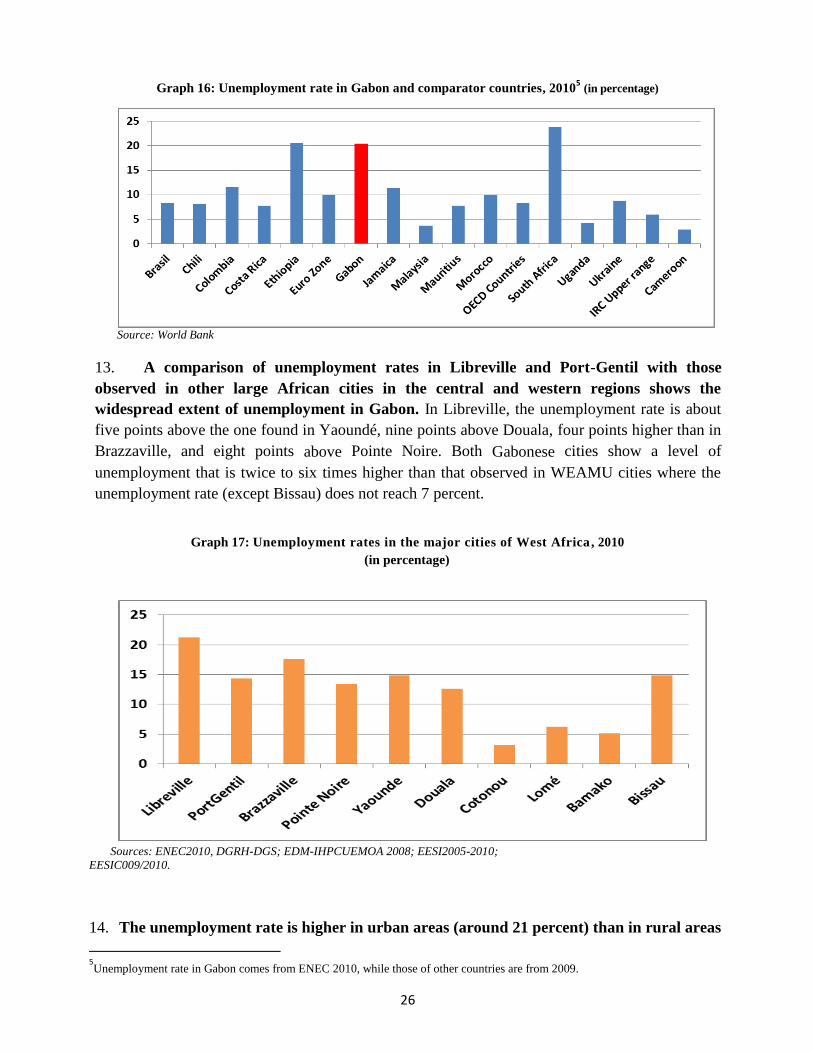
26
Graph 16: Unemployment rate in Gabon and comparator countries, 20105 (in percentage)
Source: World Bank
13. A comparison of unemployment rates in Libreville and Port-Gentil with those
observed in other large African cities in the central and western regions shows the
widespread extent of unemployment in Gabon. In Libreville, the unemployment rate is about
five points above the one found in Yaoundé, nine points above Douala, four points higher than in
Brazzaville, and eight points above Pointe Noire. Both Gabonese cities show a level of
unemployment that is twice to six times higher than that observed in WEAMU cities where the
unemployment rate (except Bissau) does not reach 7 percent.
Graph 17: Unemployment rates in the major cities of West Africa , 2010
(in percentage)
Sources: ENEC2010, DGRH-DGS; EDM-IHPCUEMOA 2008; EESI2005-2010;
EESIC009/2010.
14. The unemployment rate is higher in urban areas (around 21 percent) than in rural areas
5Unemployment rate in Gabon comes from ENEC 2010, while those of other countries are from 2009.

27
(19 percent). However, in relation to the rapid urbanization in Gabon, the large majority of
unemployed persons (nine out of ten) are in cities, especially in the two largest employment areas,
Libreville and Port-Gentil, where unemployment rates are 21.2 percent and 14.3 percent
respectively. The high level of unemployment in urban areas and the proportion of discouraged
workers highlight the potential of the non-employed workers and the need to implement measures
to enhance their employability. The provinces of Estuaire (outside Libreville), Moyen-Ogooué and
Ogooué Ivindo are the most affected by unemployment with rates of 28.5 percent (the first two)
and 23.5 percent for the latter. Woleu-Ntem has a rate of 7 percent and is the province the least
affected by unemployment.
Graph 18: Unemployment rate by province, 2010
(in percentage)
Source: ENEC2010
15. Unemployment in Gabon is long-term (six years on average). The proportion of people
unemployed for more than one year is 75 percent. On average, women spend more time
unemployed (77.9 months) than men (73.8 months). The short-term unemployed population
represents around 20 percent of first-time job seekers and around 30 percent of those who were
previously working. This unusually long duration of unemployment is mainly due to (i) the lack of
training, as it can take six years for the unemployed to be fully trained in order to seek job
opportunities; (ii) an inadequate education and training system; (iii) the inadequacy of the
institutional framework, including employment agencies, (iv) slow job creation. In the absence of
unemployment insurance, this long-term unemployment is only bearable due to traditional
solidarity mechanisms.
16. Young people are most affected by unemployment. The unemployment rate reached 35.7
percent among those aged 15 to 24 years regardless of their place of residence (urban or rural).
Young people face many difficulties in becoming professionals after leaving the education system.
Unemployment then decreases with age, at 36 percent for 25-34 year olds and 17 percent for the
34-44 year-old age group. Of course it is even lower (almost 5 percent) for senior citizens. A
significant unemployment rate among young people is a potential source of economic and social
problems and points to the urgent need to implement strong measures to encourage broad job
creation.
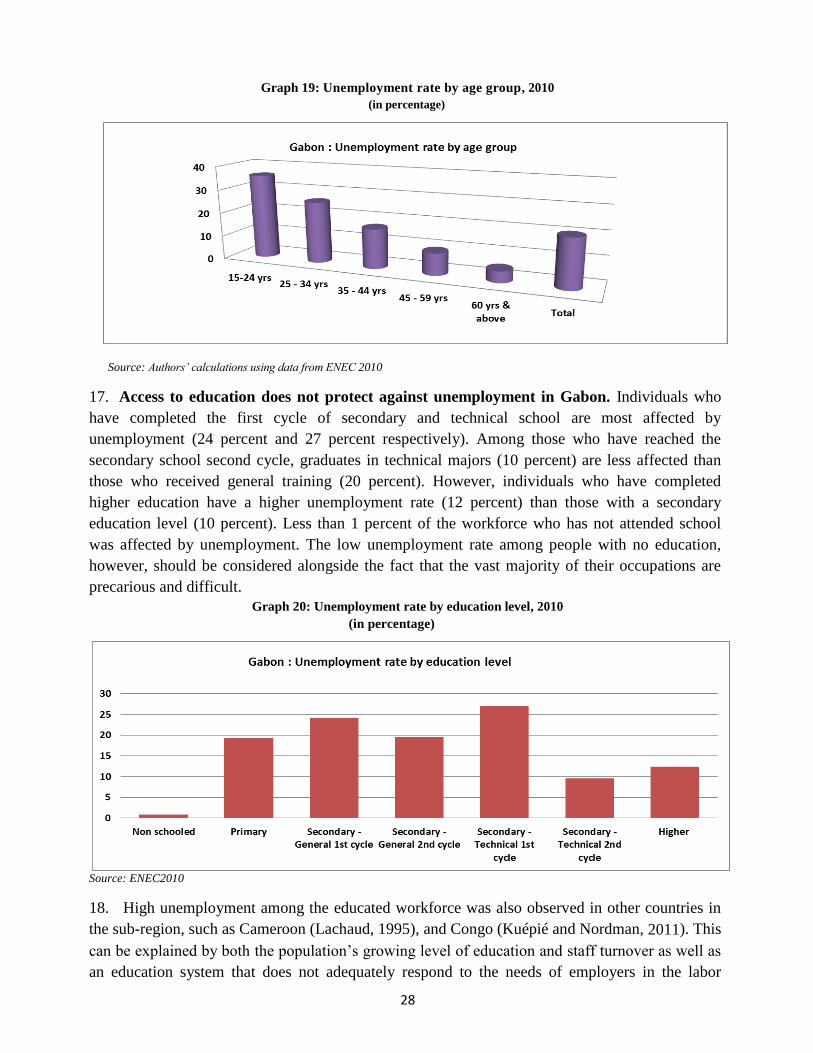
28
Graph 19: Unemployment rate by age group, 2010
(in percentage)
Source: Authors’ calculations using data from ENEC 2010
17. Access to education does not protect against unemployment in Gabon. Individuals who
have completed the first cycle of secondary and technical school are most affected by
unemployment (24 percent and 27 percent respectively). Among those who have reached the
secondary school second cycle, graduates in technical majors (10 percent) are less affected than
those who received general training (20 percent). However, individuals who have completed
higher education have a higher unemployment rate (12 percent) than those with a secondary
education level (10 percent). Less than 1 percent of the workforce who has not attended school
was affected by unemployment. The low unemployment rate among people with no education,
however, should be considered alongside the fact that the vast majority of their occupations are
precarious and difficult.
Graph 20: Unemployment rate by education level, 2010
(in percentage)
Source: ENEC2010
18. High unemployment among the educated workforce was also observed in other countries in
the sub-region, such as Cameroon (Lachaud, 1995), and Congo (Kuépié and Nordman, 2011). This
can be explained by both the population’s growing level of education and staff turnover as well as
an education system that does not adequately respond to the needs of employers in the labor

29
market who mention difficulties in employing educated young people. Entrepreneurs offer skilled
positions that the unemployed, both those who have previously worked and first time job seekers,
cannot fully qualify for.
19. Data on the investment activity of the National Employment Office shows that despite
demand that exceeds the job offer, more than two-thirds of corporate job offers are not met
with corresponding profiles. This low satisfaction rate is found across all job categories.
However, it is lower for applicants who are skilled laborers, technicians, or engineers. This
structural imbalance in the market is not a new phenomenon in Gabon. In 1978, the activity report
of the Department of Labor and Employment and the Ministry of Labor had already noted a low
absorption rate of job offers. Out of 1,338 jobs available, only 938 offers were satisfied. Similarly,
for 2,768 job applications, only 588 had been met. This imbalance can only be explained by the
mismatch between employment supply and demand, the opacity of the labor market, and the lack
of job seekers’ professional qualifications.
Table 5: Satisfaction rate of employment vacancies and applications by qualification level, 2010
(Workforce numbers)
Source: ONE
20. A lower unemployment rate among graduates of technical courses than those with general
training tends to confirm the dominance of the structural component of unemployment in Gabon
and the need for more professional and technical training paths.
21. The low unemployment rate of uneducated people is partly explained by the fact that they
have low demands in both wages and working conditions. This working class category should be
larger in the informal sector where access to employment is easier. The relatively low rate for
graduate level individuals can be explained by the fact that they are largely aimed towards the
public sector.
Job Offers Offers Satisfaction Satisfaction
applications met not met rate of rate of
offers demands
(in percent) (in percent) Managers/Engineers 971 188 64 34.0 6.6
Senior technicians 1,324 321 149 46.4 11.2
Technicians 302 217 68 31.3 22.5
Qualified laborers 1,086 82 19 23.2 1.7
Specialized laborers 835 142 67 47.2 8.0
Low-skilled laborers 142 42 25 59.5 17.6
Total 4,660 992 392 39.5 8.4

30
22. Women are very vulnerable in the labor market. First of all, 39 percent of them are
working for themselves, primarily in informal agricultural and trade jobs or performing unpaid
work compared to 27.6 percent of men. Next, female unemployment is about twice that of men,
and it is among them that more discouraged workers are found. As a result, they are less present in
the labor market with a participation rate of 34.5 percent, or a 15-point difference from men, who
stand at 49.6 percent.
23. The vulnerability of women in the labor market is mainly the result of differences
observed in secondary and higher education. While the girl/boy ratio is close to 1:1 at the
primary level, significant differences in education levels to the detriment of women were observed
for secondary school second cycle and higher with 21 percent compared to 16 percent, and 8
percent compared to 6 percent. 23 percent of young girls who stopped attending school say that
it’s because of pregnancy and early marriage and 42 percent say that it is due to their parents’
financial inability. As in most African countries, because of this, women earn lower incomes. The
EGEP results revealed in 2005 showed that more than half of employed women reported less than
50,000 CFA francs as a monthly income while only 1/5th
of men are in this situation. At the other
extreme, only 12 percent receive a monthly income of more than 200,000 CFA francs compared to
more than 28 percent of men.
Graph 21: Unemployment rate by gender and education level, 2010 (in percentage)
Source: ENEC2010
-Overall, unschooled, primary, general secondary 1st cycle, general secondary 2nd cycle, technical secondary 1st cycle, technical
secondary 2nd cycle, higher
24. High unemployment partly explains the high proportion of the dependent population.
The proportion of inactive people in Gabon is 69.1 percent in the ILO sense and 66 percent in the
broader sense, indicating a share of 3.1 percent of working people are discouraged from their
integration into the labor market. As such, they are discouraged workers. This increases both the
economic and social burden borne by the workforce. Furthermore, the dependency ratio is 1.9 in
the broad sense and 2.2 in ILO terms. Women and young people (15-24 years) bear the greatest
economic and social burden with a dependency ratio of 2.3 compared to 1.62 in the broad sense
and 2.9 compared to 1.8 in ILO terms. Among youth, the dependency ratio is 3.7 in the broad

31
sense and 4.7 in ILO terms. This shows that women and young people face much higher economic
and social burdens than the national average. This is indicative of the vulnerability of both of these
groups of people.
25. The participation rate according to age indicates relatively late entry into the workforce.
Indeed, the rate is 18.3percent for young people (15-24 years) while it is very high for the 35-44
year old age group (79.2percent). The activity level then decreases to 24.2percent for seniors (60
years and older). Generally, late entry into the workforce is due to the lengthening of the period of
education, but also the degradation of a labor market that is struggling to create jobs. The low
participation of older workers (60 and over) is due to the existence of other sources of income
such as housing rent, annuity, retirement pension, the contribution of children, and a gradual exit
from the labor market. Text
Box 1: National survey on employment and unemployment (ENEC)
The work of the National Survey on Employment and Unemployment (ENEC), based on the methodology of 1-2-3
surveys, was jointly conducted by the Directorate General of Human Resources (DGRH) and the Directorate General
of Statistics, two technical structures of the Ministry of Employment and Economy.
The 1-2-3 survey is a modular joint survey (household/enterprise) developed by DIAL researchers
(Amegashieetal.2005; Razafindrakoto and al.2009;Nordman and Roubaud, 2010). In its full version, it is a system of
three nested surveys, aimed at different statistical populations: individuals, production units, and households, and is
carried out in three phases. The first phase is a survey on employment, unemployment, and working conditions of
households and individuals. It helps document and analyze the functioning of the labor market and is used as a filter
for the second phase, where representative samples of Informal Production Units (UPI) were sampled. This was a
survey of the informal sector, which seeks to measure the main economic and productive characteristics of
production units (production, value added, investment, financing), the main difficulties encountered in activity
development, and which types of support informal sector entrepreneurs should expect from public authorities. The
third phase was a specific survey on the consumption expenditure of households. It focused on the sub-sample of
households selected in Phase 1. It allowed the weight of the formal and informal sector to be estimated for the
consumption level of households and income poverty based on expenses.
In Gabon, only Phase 1 (ENEC) was conducted in 2010. Phase 2 is planned to be conducted in the near future on the
informal sector. ENEC is a national survey and has covered a sample of 3,675 households; 2,575 urban and 1,100
rural. 12,037 individuals ten years and older (8,361 urban and 3,406 rural) were given the individual questionnaire
on employment. However, the job analysis was interested in people 15 years and older. Overall satisfactory, the
ENEC results were largely used in this study.
A largely urban and informal labor force
26. Employment is concentrated in the country’s three largest cities. Libreville, Port-Gentil,
and Franceville-Moanda (main cities of Haut-Ogooué) are home to 70 percent of the employed.
The administrative capital of Libreville is where the majority of administrative and essential non-
oil activities (services, industries, trade, etc.) are conducted while Port-Gentil and the rest of
Ogooué-Maritime concentrate on oil activities. The Franceville-Moanda region specializes in
mining, mainly manganese. The northern (Woleu-Ntem) and southern (Ngounié and Nyanga)
regions are mainly agricultural while the provinces of Moyen-Ogooué and Ogooué Ivindo harbor

32
timber operations and processing. In addition to forestry, Ogooué-Ivindo focuses on artisanal
mining activities.
Graph 22: Geographical distribution of employment in Gabon, 2010
(in percentage of total employed)
Source: ENEC2010
27. Nearly half the employed (47 percent) work for companies in the informal sector. Since
the vast majority of workers employed in households and associative businesses do not report to
the national social security fund, the proportion of informal employment is actually approaching
57 percent of overall employment. Thus, Gabon does not escape the informality that characterizes
African economies. As seen in Graph 23 below, informal employment in Gabon is dominated by
the service sector (transport, food, sewing, mechanical repairs, etc.) that represents 38 percent of
total employment in the sector compared to 29 percent in trade and 19 percent in agriculture.
Industries and public works and civil engineering (mainly construction) are 9 percent and 5
percent respectively. 6
28. Informal activities are carried out largely by a working immigrant population which is mainly
present in retail markets and shops, urban and intercity transport and agriculture. Nationals are
more visible in construction, carpentry, and services. Overall, people engaged in informal
enterprises do not have a strong education base. They generally acquire training on the job.
66The working population is around 393,000 people

33
Graph 23: Distribution of informal employment by activity sector, 2010
(in percentage of total informal employment)
Source: Authors’ estimates based on data from ENEC 2010
29. As in many other African countries, the informal sector in Gabon has developed following
the collapse of entire sections of the formal sector after the sharp decline in oil prices in 1986 that
led to a strong contraction of the formal sector workforce (see Section 2 of Chapter 1). The surplus
of labor in the formal sector is mainly in urban areas and within the informal economy. In face of
the crisis, entry into the informal sector has been the only alternative for many laid-off workers in
the formal sectors and new entrants into the labor market.
Graph 22: Distribution of employment by institutional sector, 2010
(in percentage of total working population)
Source: ENEC 2010
30. The public sector makes up 21 percent of the total employed population, or two-thirds
of formal employment, and is the country’s second largest employer. Public employment
includes permanent employees of the civil service, local government staff, and non-permanent
government workers. Social administration employees accounted for 36 percent in 2010 and
security forces were the most significant, making up about half of public employees. Estimated at
approximately 47,000 employees in 1985, public sector employment has more than doubled in 25
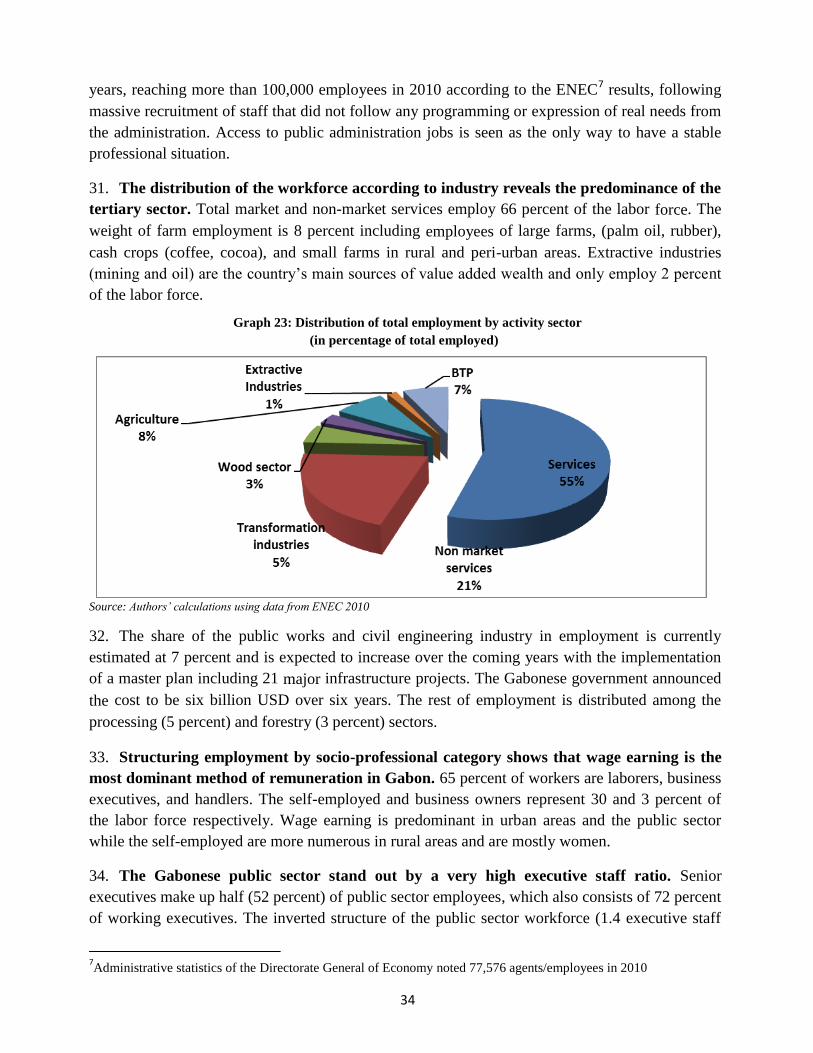
34
years, reaching more than 100,000 employees in 2010 according to the ENEC7 results, following
massive recruitment of staff that did not follow any programming or expression of real needs from
the administration. Access to public administration jobs is seen as the only way to have a stable
professional situation.
31. The distribution of the workforce according to industry reveals the predominance of the
tertiary sector. Total market and non-market services employ 66 percent of the labor force. The
weight of farm employment is 8 percent including employees of large farms, (palm oil, rubber),
cash crops (coffee, cocoa), and small farms in rural and peri-urban areas. Extractive industries
(mining and oil) are the country’s main sources of value added wealth and only employ 2 percent
of the labor force.
Graph 23: Distribution of total employment by activity sector
(in percentage of total employed)
Source: Authors’ calculations using data from ENEC 2010
32. The share of the public works and civil engineering industry in employment is currently
estimated at 7 percent and is expected to increase over the coming years with the implementation
of a master plan including 21 major infrastructure projects. The Gabonese government announced
the cost to be six billion USD over six years. The rest of employment is distributed among the
processing (5 percent) and forestry (3 percent) sectors.
33. Structuring employment by socio-professional category shows that wage earning is the
most dominant method of remuneration in Gabon. 65 percent of workers are laborers, business
executives, and handlers. The self-employed and business owners represent 30 and 3 percent of
the labor force respectively. Wage earning is predominant in urban areas and the public sector
while the self-employed are more numerous in rural areas and are mostly women.
34. The Gabonese public sector stand out by a very high executive staff ratio. Senior
executives make up half (52 percent) of public sector employees, which also consists of 72 percent
of working executives. The inverted structure of the public sector workforce (1.4 executive staff
7Administrative statistics of the Directorate General of Economy noted 77,576 agents/employees in 2010

35
for 1 qualified laborer and 4.6 executive staff for 1 unskilled worker) is indicative of the very large
income differential between managerial jobs and other positions in the public sector. These
differences prompt government officials to use various processes (administrative support,
exceptional promotions) to access the highest administrative categories as well as better paid
administrative and political positions.
35. Overall, the government absorbs the bulk of skilled labor. Two-thirds of workers with a
higher educational level work in the public administration, largely in the areas of education and
health. However, two-thirds of the uneducated and half of those with a primary education are
engaged in agriculture. Workers with intermediate levels of education are mainly found in the
sectors of forestry, construction, transport, and some manufacturing and service industries.
Table 6: Distribution of main employment by institutional sector and socio-professional category, 2010 (number
of employed/workforce numbers)
Public Sector Formal Private Totalenterprises informal
enterprises
Executives 53,498 11,223 9,514 74,235
Skilled workers and employees 37,153 31,878 45,765 114,796
Laborers 11,594 97,83 47,074 68,451
Owners/Employers 3,340 6,667 10,007
Independent workers 9,161 109,124 118,285
Apprentices 693 2,146 2,839
Caregivers 279 4,548 4,827
Total 102,245 66,357 224,838 39,3440
Source: Authors’ calculations using data from ENEC 2010
36. The high concentration of executives in the administration at the expense of the private sector
is actually the result of a higher education provision largely dominated by general education and
humanities (this issue is discussed in the next chapter) that predisposes them to enter more easily
into public work than in the private sector, where half (48 percent) of the workforce is comprised
of laborers and skilled employees. In all cases, the inverse structure of the public sector labor
force reveals inefficient management by government personnel whose recruitment corresponds
less to actual needs than the redistribution of oil revenue. Conscious of that, the government
undertook an audit of State employees in 2009 with the aim of reducing and redeploying them.
The results of this audit have not been published yet.
37. Another observation emerging from the distribution of the labor force by socio-
professional category is the high proportion of owners/employers and independent workers
in the informal sector. 67 percent of owners/employers and 92 percent of independent workers
work in the informal sector. This is consistent with the size of the informal sector. It consists of a
large number of small-business owners. A large proportion of employers and the self-employed
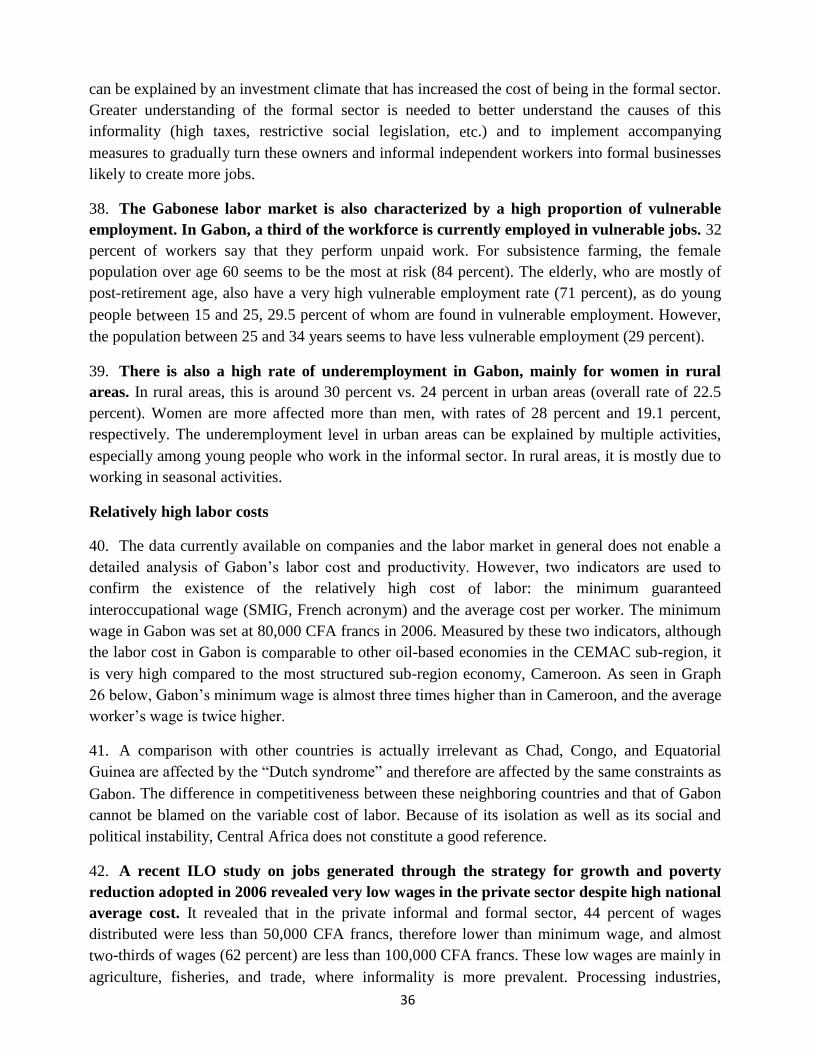
36
can be explained by an investment climate that has increased the cost of being in the formal sector.
Greater understanding of the formal sector is needed to better understand the causes of this
informality (high taxes, restrictive social legislation, etc.) and to implement accompanying
measures to gradually turn these owners and informal independent workers into formal businesses
likely to create more jobs.
38. The Gabonese labor market is also characterized by a high proportion of vulnerable
employment. In Gabon, a third of the workforce is currently employed in vulnerable jobs. 32
percent of workers say that they perform unpaid work. For subsistence farming, the female
population over age 60 seems to be the most at risk (84 percent). The elderly, who are mostly of
post-retirement age, also have a very high vulnerable employment rate (71 percent), as do young
people between 15 and 25, 29.5 percent of whom are found in vulnerable employment. However,
the population between 25 and 34 years seems to have less vulnerable employment (29 percent).
39. There is also a high rate of underemployment in Gabon, mainly for women in rural
areas. In rural areas, this is around 30 percent vs. 24 percent in urban areas (overall rate of 22.5
percent). Women are more affected more than men, with rates of 28 percent and 19.1 percent,
respectively. The underemployment level in urban areas can be explained by multiple activities,
especially among young people who work in the informal sector. In rural areas, it is mostly due to
working in seasonal activities.
Relatively high labor costs
40. The data currently available on companies and the labor market in general does not enable a
detailed analysis of Gabon’s labor cost and productivity. However, two indicators are used to
confirm the existence of the relatively high cost of labor: the minimum guaranteed
interoccupational wage (SMIG, French acronym) and the average cost per worker. The minimum
wage in Gabon was set at 80,000 CFA francs in 2006. Measured by these two indicators, although
the labor cost in Gabon is comparable to other oil-based economies in the CEMAC sub-region, it
is very high compared to the most structured sub-region economy, Cameroon. As seen in Graph
26 below, Gabon’s minimum wage is almost three times higher than in Cameroon, and the average
worker’s wage is twice higher.
41. A comparison with other countries is actually irrelevant as Chad, Congo, and Equatorial
Guinea are affected by the “Dutch syndrome” and therefore are affected by the same constraints as
Gabon. The difference in competitiveness between these neighboring countries and that of Gabon
cannot be blamed on the variable cost of labor. Because of its isolation as well as its social and
political instability, Central Africa does not constitute a good reference.
42. A recent ILO study on jobs generated through the strategy for growth and poverty
reduction adopted in 2006 revealed very low wages in the private sector despite high national
average cost. It revealed that in the private informal and formal sector, 44 percent of wages
distributed were less than 50,000 CFA francs, therefore lower than minimum wage, and almost
two-thirds of wages (62 percent) are less than 100,000 CFA francs. These low wages are mainly in
agriculture, fisheries, and trade, where informality is more prevalent. Processing industries,
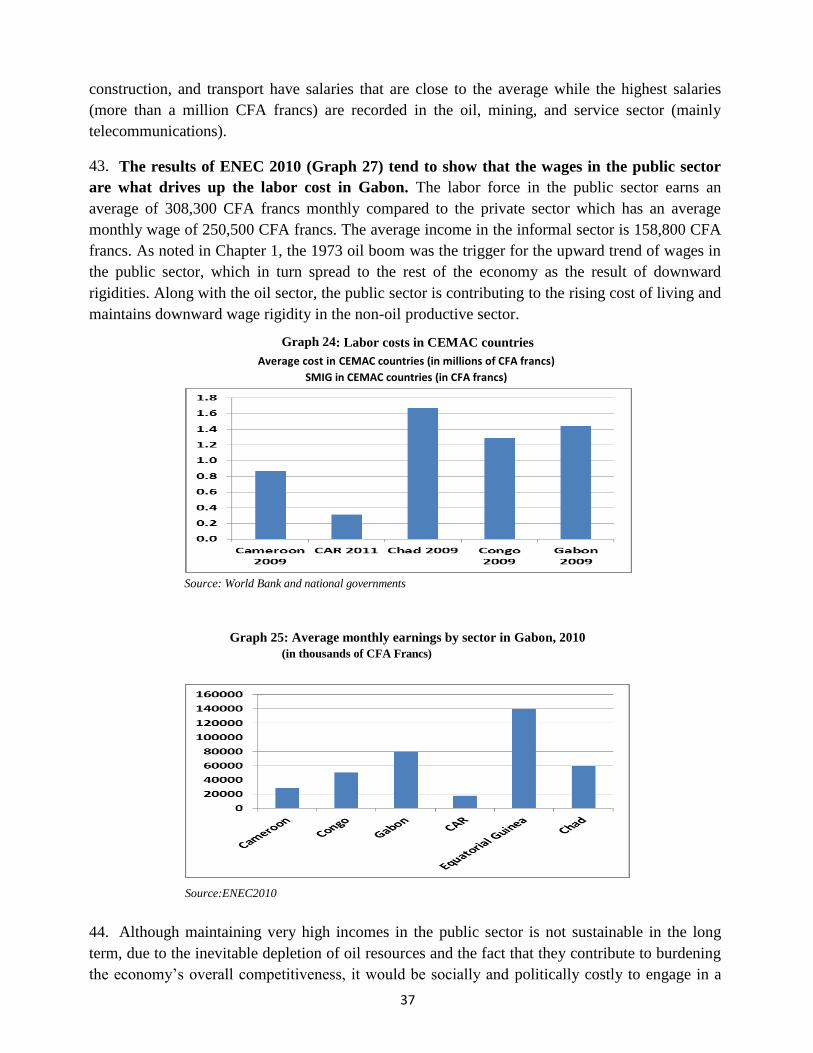
37
construction, and transport have salaries that are close to the average while the highest salaries
(more than a million CFA francs) are recorded in the oil, mining, and service sector (mainly
telecommunications).
43. The results of ENEC 2010 (Graph 27) tend to show that the wages in the public sector
are what drives up the labor cost in Gabon. The labor force in the public sector earns an
average of 308,300 CFA francs monthly compared to the private sector which has an average
monthly wage of 250,500 CFA francs. The average income in the informal sector is 158,800 CFA
francs. As noted in Chapter 1, the 1973 oil boom was the trigger for the upward trend of wages in
the public sector, which in turn spread to the rest of the economy as the result of downward
rigidities. Along with the oil sector, the public sector is contributing to the rising cost of living and
maintains downward wage rigidity in the non-oil productive sector.
Graph 24: Labor costs in CEMAC countries
Average cost in CEMAC countries (in millions of CFA francs)
SMIG in CEMAC countries (in CFA francs)
Source: World Bank and national governments
Graph 25: Average monthly earnings by sector in Gabon, 2010
(in thousands of CFA Francs)
Source:ENEC2010
44. Although maintaining very high incomes in the public sector is not sustainable in the long
term, due to the inevitable depletion of oil resources and the fact that they contribute to burdening
the economy’s overall competitiveness, it would be socially and politically costly to engage in a
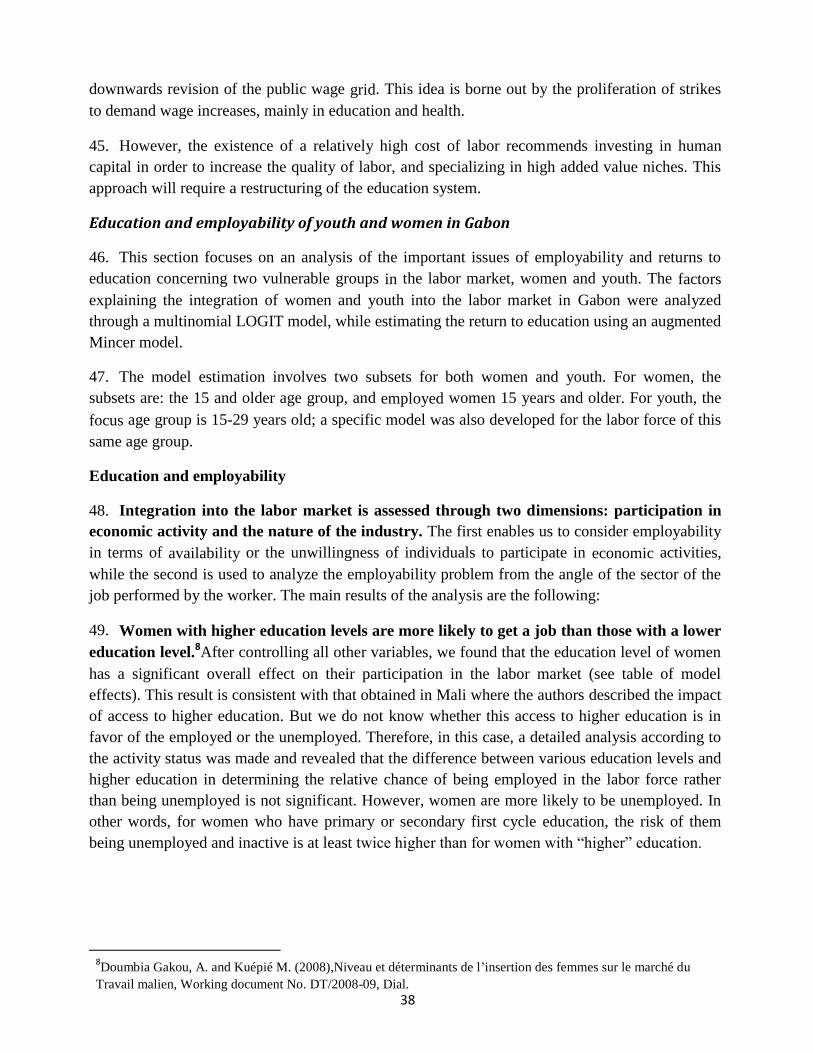
38
downwards revision of the public wage grid. This idea is borne out by the proliferation of strikes
to demand wage increases, mainly in education and health.
45. However, the existence of a relatively high cost of labor recommends investing in human
capital in order to increase the quality of labor, and specializing in high added value niches. This
approach will require a restructuring of the education system.
Education and employability of youth and women in Gabon
46. This section focuses on an analysis of the important issues of employability and returns to
education concerning two vulnerable groups in the labor market, women and youth. The factors
explaining the integration of women and youth into the labor market in Gabon were analyzed
through a multinomial LOGIT model, while estimating the return to education using an augmented
Mincer model.
47. The model estimation involves two subsets for both women and youth. For women, the
subsets are: the 15 and older age group, and employed women 15 years and older. For youth, the
focus age group is 15-29 years old; a specific model was also developed for the labor force of this
same age group.
Education and employability
48. Integration into the labor market is assessed through two dimensions: participation in
economic activity and the nature of the industry. The first enables us to consider employability
in terms of availability or the unwillingness of individuals to participate in economic activities,
while the second is used to analyze the employability problem from the angle of the sector of the
job performed by the worker. The main results of the analysis are the following:
49. Women with higher education levels are more likely to get a job than those with a lower
education level.8After controlling all other variables, we found that the education level of women
has a significant overall effect on their participation in the labor market (see table of model
effects). This result is consistent with that obtained in Mali where the authors described the impact
of access to higher education. But we do not know whether this access to higher education is in
favor of the employed or the unemployed. Therefore, in this case, a detailed analysis according to
the activity status was made and revealed that the difference between various education levels and
higher education in determining the relative chance of being employed in the labor force rather
than being unemployed is not significant. However, women are more likely to be unemployed. In
other words, for women who have primary or secondary first cycle education, the risk of them
being unemployed and inactive is at least twice higher than for women with “higher” education.
8Doumbia Gakou, A. and Kuépié M. (2008),Niveau et déterminants de l’insertion des femmes sur le marché du
Travail malien, Working document No. DT/2008-09, Dial.
39
• Women who received general training are less likely to be employed than women
with vocational training. Women who received general training only have a 54 percent better
chance of being employed than those who received vocational training. Those who received no
training have a 29 percent better chance of being employed than those with a higher education
level.
Education level furthers the employability of women in the formal sector. The
relative chance of being hired in the public sector rather than being unemployed or inactive
increases with education level. A woman who completed primary or secondary school has 20
percent chance of the one with “higher” education to be employed by the formal sector. Those
who have no education compared to those who have graduated university have no chance at
integration into the private formal market.
The probability of employment for young people decreases with education level.
Compared to the employability of a university student, young people are 2.7 times, 2.2 times, or
once more likely to be employed if they have completed primary education, secondary first cycle,
or secondary second cycle. On the other hand, youths who have no primary or secondary first
cycle education are five times and three times more at risk than university students for
unemployment.
50. Overall, the model shows that young people with a lower education level (secondary
first cycle) are more employable in the private sector (formal and informal) while the public
sector is more likely to hire better-educated young people (higher or secondary second
cycle). A brief explanation of the difference between these two sectors is that the public sector
(including civil service) ranks its recruits according to their degree level (BEPC or Bac or Bac+n,
respectively first cycle educational diploma, higher education entry certificate or higher, in
English) while the private sector recruits according to skills (no matter the degree, the key is
knowledge and/or experience).
Return on education
51. The goal of this section is to determine whether an additional level of study in technical and
vocational education and/or general education would provide additional compensation for women
and youth.
52. To verify the impact of education on remuneration, an analysis of a marginal return to
education from one cycle to another was done using a piecewise linear function. This specification
enabled the convex nature of returns to education to be highlighted. The results of the analysis
(table below) show that the last years of secondary education and higher education are the most
profitable. The same phenomenon was observed in the Congo (Kuépié and Nordman, 2011). In
the case of Gabon, the highest gains are observed in passing; (i) from primary to secondary; (ii)
from Bachelor’s degree to Graduate and iii) from graduate to Master’s. However, a lack of gain
has been noted between the uneducated and those with primary education.

40
Table 6: Changes in average earnings by education level in Gabon (in percentage)
Course of study Average remuneration Average gain over the course
of the previous study (percent) Uneducated 234,352
[227,797 – 240906]*
Primary completed 195,473
[193,392 – 197,555]* -16.6
Secondary1st
cycle
323,755
[317,419 – 330,090]* 65.6
Secondary 2nd
cycle completed
342,666 [338,828 – 346,505]*
5.8
Bachelor’s Degree 355,589 [351,527 – 359,651]*
3.8
Maîtrise Graduate 442,768 [436,426 – 449,110]*
24.5
Masters 715,522 [703,040 – 728,005]*
61.6
Doctorate 720,751 [690,802 – 750,701]*
0.7
Source: Authors’ calculations using data from ENEC 2010
53. Moreover, the analysis also showed that an additional year of education in women increases
their income by 5.3 percent in the market. This rate is 6.1 percent for women with general
education training and 4.6 percent for those who received technical and/or professional training.
For working youth (both genders) this rate is 5.8 percent with any kind of training, and 6.1 percent
for young people who were provided general training and 1 percent (but not significant) for those
who were provided technical or any other kind of training.
Chapter conclusion
54. Reducing unemployment, especially among young people, remains the biggest challenge
faced by the Gabonese government. This pressure is expected to increase in the medium and long
terms due to the increasing demographic weight of this segment of the country’s population on job
demand, mainly in the urban centers where it is concentrated.
55. Data from the National Employment Office, which shows that half the jobs offered by
companies are not met, suggests that unemployment is mainly structural. Adjusting training
profiles to the needs of the productive sector seems to be one of the ways out of this youth
unemployment trap. The growth outlook is positive in the medium to long term, which could
translate into decent jobs.
56. The weight of the informal sector (the country’s largest employer) also shows the need to
improve knowledge of this sector in order to account for its dynamic as the available fragmented
data are very old and incomplete.
41
IV. CONSTRAINTS AND CHALLENGES IN THE GABONESE LABOR
MARKET
1. The second chapter conclusion discussing the characteristics of the labor market indicates that
bringing the education system up to speed with the needs of the productive sector is a major factor to
fight unemployment in Gabon. This discrepancy is not the only factor explaining why the
unemployment rate is so high. The restrictive investment climate, rigid social legislation costly for the
employer, and the inefficiency of the institutional framework and lack of employment policy are all
obstacles to job creation in Gabon. These factors are discussed in this chapter.
On supply: incompatibility between the structure of the education system and job opportunities
2. A detailed diagnostic of the Gabonese education system (RESEN) was made by the French
Development Agency (AFD, French acronym) and presented to the Ministry of National Education in
July 2012. Based on EGEP data (the only data available), the AFD report performed an assessment of
training and employment by comparing the structure of the graduates of the Gabonese education
system over 2000-2005 with the jobs offered to young people in the national economy. The
employment structure was assessed on the basis of the status of the employee, the job held by young
people in 2005, and various experiences in the labor market.9
3. The results of this analysis are summarized in Table 3.1, showing that the relationship between
education and employment in Gabon is characterized by three major imbalances:
• A high proportion of workers do not have the minimum requirements needed to fit into the
labor market (lower part of the table): 14 percent of the workforce in the observed group did not completed primary school, and 1 percent never went to school;
• Insufficient workforce with intermediate skills (laborers, technicians, senior technicians),
which represent more than a quarter of skilled employment opportunities;
• The number of higher education graduates is at least twice higher than that of job offers
corresponding to their education level (upper part of table). While 12 percent of young school graduates completed higher education, the demand of the productive sector for managers is only 5 percent.
9The report states that these data are not mere orders of magnitude but that experiences show that this approach produces numb ers that are
reasonably close to both those obtained with more complex and specific procedures (where data exists) and reality
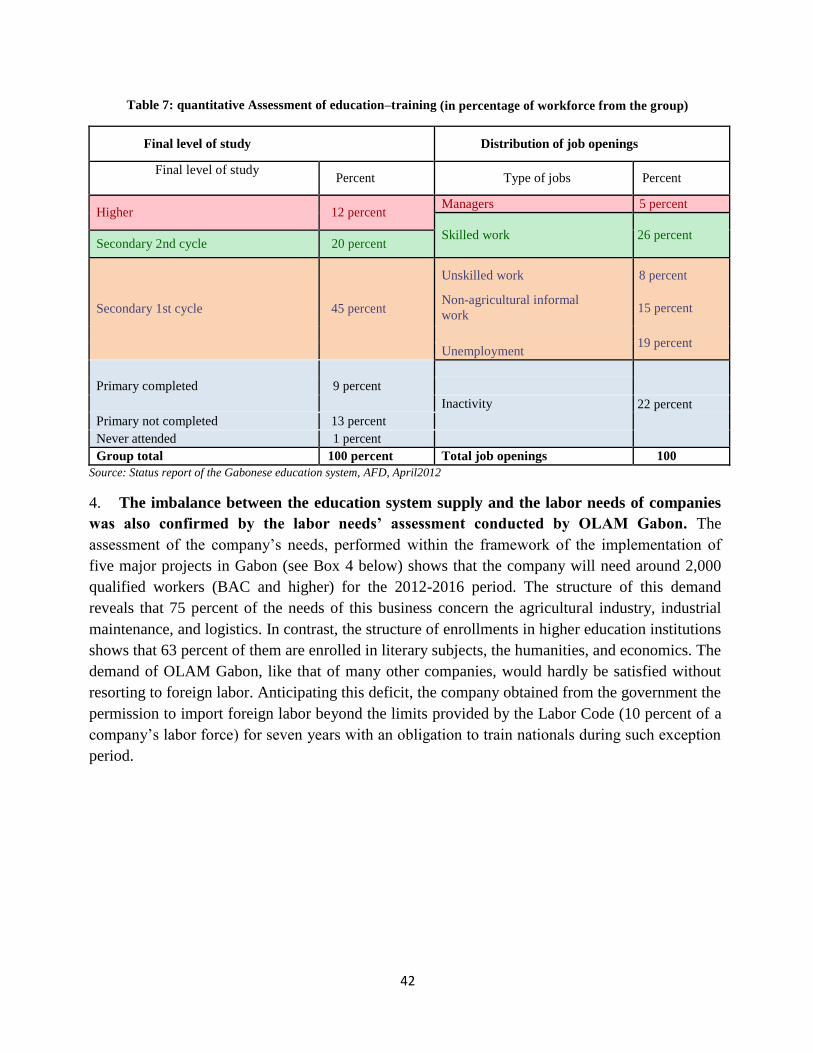
42
Table 7: quantitative Assessment of education–training (in percentage of workforce from the group)
Final level of study
Distribution of job openings
Final level of study
Percent
Type of jobs
Percent
Higher
12 percent
Managers 5 percent
Skilled work
26 percent
Secondary 2nd cycle 20 percent
Secondary 1st cycle
45 percent
Unskilled work
Non-agricultural informal
work
8 percent
15 percent
19 percent
Unemployment
Primary completed
9 percent
Inactivity 22 percent
Primary not completed 13 percent
Never attended 1 percent
Group total 100 percent Total job openings 100
percent Source: Status report of the Gabonese education system, AFD, April2012
4. The imbalance between the education system supply and the labor needs of companies
was also confirmed by the labor needs’ assessment conducted by OLAM Gabon. The
assessment of the company’s needs, performed within the framework of the implementation of
five major projects in Gabon (see Box 4 below) shows that the company will need around 2,000
qualified workers (BAC and higher) for the 2012-2016 period. The structure of this demand
reveals that 75 percent of the needs of this business concern the agricultural industry, industrial
maintenance, and logistics. In contrast, the structure of enrollments in higher education institutions
shows that 63 percent of them are enrolled in literary subjects, the humanities, and economics. The
demand of OLAM Gabon, like that of many other companies, would hardly be satisfied without
resorting to foreign labor. Anticipating this deficit, the company obtained from the government the
permission to import foreign labor beyond the limits provided by the Labor Code (10 percent of a
company’s labor force) for seven years with an obligation to train nationals during such exception
period.

43
Text Box 2: Imbalance between the needs of the productive sector and the structure of the Gabonese education
system: the case of OLAM’s projects and Gabon
As part of a strategic project with the Gabonese government, the Singaporean group OLAM launched a
2.7 billion USD investment program to develop five major projects in Gabon over 2011-2012. The five
projects are: (i) the construction of a large fertilizer plant in Port-Gentil, (ii) the development in Bitam, in
northern Gabon, of a 28,000 ha rubber plantation; (iii) an integrated logging project over 860,000 ha
(1.15 Mn Ha in time) and wood processing, (iv) the development of a palm oil plantation from Kango to
Mouila over 100,000 ha and (v) the development of a 1,125 ha multisectoral Special Economic Zone in
Nkok over 25 km from Libreville, mostly dedicated to wood processing (40% of companies).
OLAM Gabon conducted an evaluation of the workforce required to develop these projects, and
concluded on a need for 14,651 employees, with nearly 2,000 of them skilled (Bac+) during the 2012-
2016 period. The analysis of the structure of that skilled demand highlights the gap between the needs of
the productive sector and the Gabonese education offer.
The structure of OLAM’s needs (Graph 29) shows that 41% of its labor demand relates to trades specific
to agribusiness (chemists, process controllers, HSE engineers) and 27% to industrial maintenance skills.
The needs of the business administration profiles (human resources, social sciences, nursing, medicine,
marketing, etc.) and finance are in turn 18% and 7%, respectively. By comparing the structure of
OLAM’s demand and the higher education offer (Graph 29), it’s clear that foreign labor must be resorted
to for a large number of these requirements, especially those relating to agribusiness, industrial
maintenance, and logistics. The education offer is composed of 63% of students in literary fields,
humanities, and economics. The 2% of students in agronomy and forestry are in large part in the National
School of Water and Forests, who are primarily destined for Government work.
Graph 26: Structure of demand for skilled works in OLAM Gabon projects, 2012-2016
(in percentage of total demand)
Source: Authors’ calculations based on data from OLAM Gabon
Graph 27: Structure of the education offer in higher education, 2011 (in percentage of total labor
force)
Source: Ministry of National Education

44
5. On the other hand, as part of PSGE’s Industrial Gabon pillar, the Ministry of Mines and
Industry mapped the skills requirements necessary to implement the PSGE’s mining and industrial
projects. This map (found in Appendix 2) shows that the employment demand for this pillar will
consist of jobs in construction, civil engineering, logistics and transport, industrial production,
mining site exploitation, industrial maintenance and refrigeration, etc. This map confirms the need
for restructuring national education.
6. the mismatch between the education offer and the needs of the productive sector is the result
of several factors, including: (i) low internal efficiency in the general basic education system; (ii)
weak school coverage and low external output of technical and professional education and; (iii)
limited and ineffective budgetary allocations in favor of the education sector. These factors are
discussed below.
Poor internal efficiency of basic general education
7. The repeater rate is very high at all education levels and is the most obvious
manifestation of the low internal efficiency of the Gabonese education system. In primary
education, the repeater rate is the highest of any country in the world for which this statistic is
known. It reached 37 percent in 2008 (last known statistics), twice the African average.
Furthermore, less than 5 percent of students admitted to the first year complete the primary cycle
without repeating. The repeater rate in primary education is amplified by the existence of an entry
examination in the first year of secondary school that is only justified by the lack of sufficient
available places. Following a meeting of the General Assembly of Education, Research and
Training-Employment Balance held in May 2010, the government decided to eliminate the 6th
year
entry exam and replace it,at the beginning of the 2013 school year, by a weighted average of the
results obtained during the CEPE (Certificate of Primary Elementary Studies) and 5th
year grades.
Graph 28: Primary school repeater rates in Gabon and worldwide, 2008
(in percentage of the total primary school enrollment) Gabon, Francophone Africa, Anglophone Africa, Latin America, Asia, Middle East
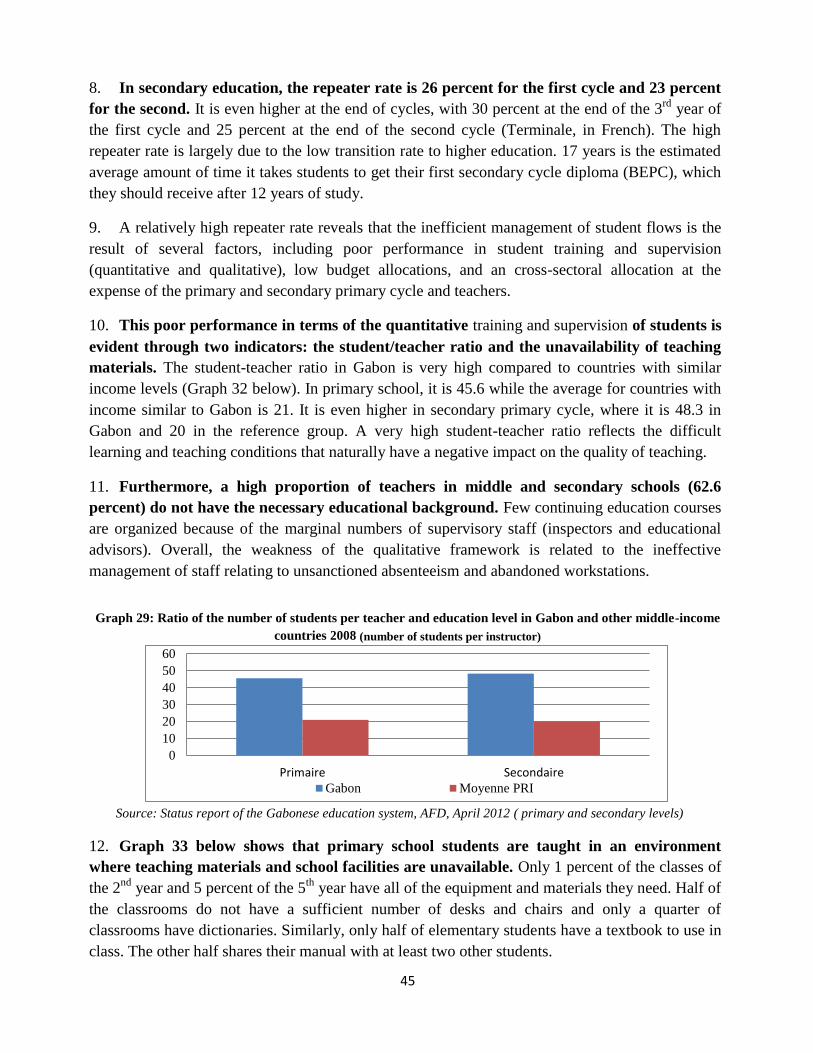
45
8. In secondary education, the repeater rate is 26 percent for the first cycle and 23 percent
for the second. It is even higher at the end of cycles, with 30 percent at the end of the 3rd
year of
the first cycle and 25 percent at the end of the second cycle (Terminale, in French). The high
repeater rate is largely due to the low transition rate to higher education. 17 years is the estimated
average amount of time it takes students to get their first secondary cycle diploma (BEPC), which
they should receive after 12 years of study.
9. A relatively high repeater rate reveals that the inefficient management of student flows is the
result of several factors, including poor performance in student training and supervision
(quantitative and qualitative), low budget allocations, and an cross-sectoral allocation at the
expense of the primary and secondary primary cycle and teachers.
10. This poor performance in terms of the quantitative training and supervision of students is
evident through two indicators: the student/teacher ratio and the unavailability of teaching
materials. The student-teacher ratio in Gabon is very high compared to countries with similar
income levels (Graph 32 below). In primary school, it is 45.6 while the average for countries with
income similar to Gabon is 21. It is even higher in secondary primary cycle, where it is 48.3 in
Gabon and 20 in the reference group. A very high student-teacher ratio reflects the difficult
learning and teaching conditions that naturally have a negative impact on the quality of teaching.
11. Furthermore, a high proportion of teachers in middle and secondary schools (62.6
percent) do not have the necessary educational background. Few continuing education courses
are organized because of the marginal numbers of supervisory staff (inspectors and educational
advisors). Overall, the weakness of the qualitative framework is related to the ineffective
management of staff relating to unsanctioned absenteeism and abandoned workstations.
Graph 29: Ratio of the number of students per teacher and education level in Gabon and other middle-income
countries 2008 (number of students per instructor)
Source: Status report of the Gabonese education system, AFD, April 2012 ( primary and secondary levels)
12. Graph 33 below shows that primary school students are taught in an environment
where teaching materials and school facilities are unavailable. Only 1 percent of the classes of
the 2nd
year and 5 percent of the 5th
year have all of the equipment and materials they need. Half of
the classrooms do not have a sufficient number of desks and chairs and only a quarter of
classrooms have dictionaries. Similarly, only half of elementary students have a textbook to use in
class. The other half shares their manual with at least two other students.
0
10
20
30
40
50
60
Primaire SecondaireGabon Moyenne PRI

46
Graph 30: Availability of teaching materials and equipment in primary school classrooms, 2008
(in percentage of total number of classes)
Source :PASEC Gabon Report,2008
Low school coverage and weak quality of technical and vocational education
system.
13. Gabon has made considerable progress in terms of access to basic general education but
access to technical and vocational education is very limited. With gross enrollment rates in
primary and secondary schools estimated at 147.3 percent and 88.8 percent respectively, Gabon
has almost achieved the goal of universal access to basic education. However, there is low
vocational training coverage. The ratio of the number of students enrolled in technical and
vocational schools out of 100,000 inhabitants is estimated at 377, or barely above the African
average (364) and more than three times lower than in Cameroon and Tunisia and one and a half
times lower than in Mauritius. Enrollment in technical and vocational education represents only 8
percent of the total workforce in the Gabonese education system. Limited access to vocational and
technical training reduces access to opportunities in the labor market, mainly in the productive
sector. There are a total of 16 technical and vocational schools, 11 vocational training centers, and
all are deemed to be under-equipped.
14. The external performance of the vocational training system is very weak. More than 80
percent of graduates of technical and vocational programs are not recruited into the sectors in
which they are trained and only one graduate out of three finds a job. Overall, the current training
supply is incompatible with the needs of companies and does not allow young Gabonese to find
employment, particularly for the following reasons: (i) inadequacy of existing training for the
skills demanded by companies, (ii) learning deficit in professional practices due to training that is
too theoretical, (iii) insufficient material resources in training centers, especially in terms of labor,
(iv) equipment that is out of touch with the realities of the situation on the ground, (v) a lack of
skilled trainers.

47
Graph 31: School coverage in technical and vocational education in Gabon and in other countries
(number of students in FTE for every 100,000)
Source: Status report on the education system, AFD and World Bank
15. Vocational training in higher education is also inadequate. The courses in universities are
designed as a core curriculum until the end of the licence 2 (2nd
year of university). Then from
licence 3 (3rd
year of university) onwards an early specialization can be chosen with the possibility
of preparing for a professional degree. 74 percent of students enrolled in higher education take
courses in humanities or social sciences and only 25 percent in science and engineering. In the 4th
year, science students make up only 12 percent of registered students. Similarly, 1st cycle students
(1st and 2
nd year) account for 67 percent of the labor force and those of the 2
nd cycle (3
rd and 4
th
year) for 25 percent of the labor force. Finally, in the 1st year, short technological training (three
years) only accounts for 8.7 percent of the labor force, which is insufficient for the needs of the
economy. The proportion of students in general education limits employment opportunities in the
public sector. It also shows that science and technology are not adequately considered in the
secondary cycle.
16. Continuing education is very underdeveloped in Gabonese higher education. Continuous
training is only provided in two institutes, the Institut National de Sciences de Gestion (National
Institute of Management Sciences, in English) (for the three BTS, Advanced Technician's
Certificate, in English) and the IST (Higher Institute of Tehchnology, in English) where the
marketing technique DUT (university diploma of technology, in English) can be completed either
in evening or as sandwich courses. Moreover, there is no Bachelor’s degree or Master’s degree in
sciences, which largely explains the lack of science teachers in basic education. In addition, the
training available for employees (in the form of continuing education or professional
development) or job seekers looking for basic training is insufficient.
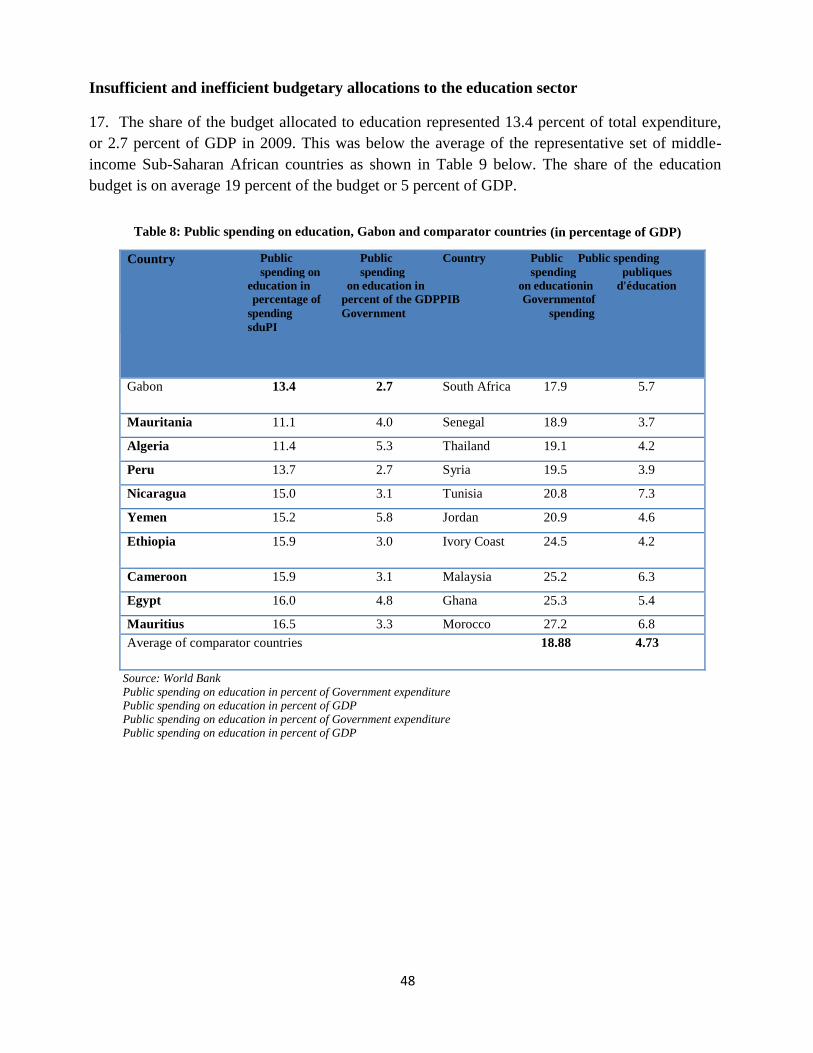
48
Insufficient and inefficient budgetary allocations to the education sector
17. The share of the budget allocated to education represented 13.4 percent of total expenditure,
or 2.7 percent of GDP in 2009. This was below the average of the representative set of middle-
income Sub-Saharan African countries as shown in Table 9 below. The share of the education
budget is on average 19 percent of the budget or 5 percent of GDP.
Table 8: Public spending on education, Gabon and comparator countries (in percentage of GDP)
Country Public Public Country Public Public spending
spending on spending spending publiques education in on education in on educationin d'éducation
percentage of percent of the GDPPIB Governmentof
spending Government spending
s duPI
Gabon 13.4 2.7 South Africa 17.9 5.7
Mauritania 11.1 4.0 Senegal 18.9 3.7
Algeria 11.4 5.3 Thailand 19.1 4.2
Peru 13.7 2.7 Syria 19.5 3.9
Nicaragua 15.0 3.1 Tunisia 20.8 7.3
Yemen 15.2 5.8 Jordan 20.9 4.6
Ethiopia 15.9 3.0 Ivory Coast 24.5 4.2
Cameroon 15.9 3.1 Malaysia 25.2 6.3
Egypt 16.0 4.8 Ghana 25.3 5.4
Mauritius 16.5 3.3 Morocco 27.2 6.8
Average of comparator countries 18.88 4.73
Source: World Bank
Public spending on education in percent of Government expenditure Public spending on education in percent of GDP
Public spending on education in percent of Government expenditure Public spending on education in percent of GDP

49
18. The structure of the allocations to the education sector reveal a high proportion of expenditure
allocated to higher and secondary education at the expense of pre-primary and vocational
education due to limited budget for spending on goods and services for the benefit of staff salaries.
19. Higher education and the second cycle account for nearly 40 percent of the education budget
compared to 6 percent for vocational training and 4 percent for pre-primary. Similarly, the
structure of expenditure by type reveals that 72 percent of the budget is allocated to staff salaries
compared to 16 percent for goods and services and 12 percent for social aid.
20. Within operating expenses, salary expenses for non-teaching staff are almost as high as
those for teachers. This means that either there is more administrative staff than teachers, or that
the salaries of non-teaching staff are on average higher than those of teachers. In both cases, this
imbalance is a negative incentive for the teaching profession. An organizational audit by the
Ministry of Education and/or a follow-up survey on expenditure in the sector could provide
relevant information on how to improve the budget efficiency of public education expenditure.
The distribution of the budget for the education sector shows that consideration should be given to
increase funding as well as a cross-sectoral reallocation of the sector’s resources.
Graph 32: Distribution of public expenditure on education by education levels and type, 1988
(in percentage of total public expenditure)
Source: Status report of the education system, AFD
Ongoing reform of the education system
21. The Government initiated a reform of the education and research system in 2010, which
led to the enactment of a law on education, training and research. This laid the foundation for
a new Gabonese school system. The law is based on the relevant conclusions of the “National
Consultation on Education, Research, and Training-Employment Match” in May 2010. It
envisages a new education system that will include several innovations, such as:
50
(i) the development of ongoing training and bridges at all levels between general education
(from primary to higher education) and technical education and vocational training;
(ii) the promotion of public-private partnerships (PPPs) in education, training, and research;
(iii) the creation of a National Council of Education, Training, and Research, CNEFOR
(Article 12), that is responsible for the implementation of training syllabus as well as
infrastructure and equipment projects. It meets once a year, with the Head of State as
chairman. It should be noted that the private sector is not a member of CNEFOR, which
could be a limitation on the definition of training syllabus.
22. At the field level, new changes are starting to happen when it comes to technical and
vocational education. Since 2010, all vocational schools were gradually turned into technical
schools. These changes were supported by the African Development Bank, which financed the
purchase of educational equipment and teaching materials. However, the delicate and recurrent
issue of specialized faculty remains to be solved.
23. As a prelude to PPP under the implementation law, cooperation between the Ministry of
Technical Education and oil companies led to the creation of the Institute of Oil and Gas (IPG,
French acronym) that provides advanced training in oil trades (Box 3). The first group of IPG
students was trained in the field of production. The Institute plans to expand its scope of activity to
other oil and gas trades.
24. The partnership between the government and the private sector also led to the creation
of a Specialization Center in Port-Gentil in association with Total Gabon. The Center recruits
candidates with a technological secondary school leaving certificate, a certificate of vocational
proficiency (BEP, French acronym), or Technician’ Certificate (BT, French acronym) to provide
them training in welding or the maintenance of equipment used in the oil industry. Another
example is the partnership between the Compagnie minière de l’Ogooué (Comilog), the Ministry
of National Education, and the National Employment Office to train 500 young people in order to
meet the human resources needs necessary for the operation of two manganese metal and
silicomanganese plants in the Moanda (C2M) metallurgical complex that will be opened in June
2013.
25. At the request of Comilog, ONE organized the selection of 400 young people who were
trained according to the mining company’s needs (in chemistry, electricity, and industrial
mechanics) over 15 months at the training and professional development center in Franceville.
Following this theoretical training, they were admitted to a three-month internship in a company.
300 of them will be recruited at the Moanda Industrial Complex. The rest will be hired by other
companies in the region. Such initiatives enable better integration of students in the company that
took an active part in their training. Olam Gabon also has a similar project that is being studied on
a larger scale for the agri-food and wood processing sectors.
26. More should be done in generalizing alternance training and apprenticeships, as done in
Germany. The main idea of reorganizing vocational training and continuing education would then

51
be to go back to basics by giving the courses taught their initial rationale. Thus, in training and
professional development or continuous training, the centers could provide bespoke training
depending on the current needs expressed by companies. This kind of custom-made training
reflects the evolution of employment. It would require the establishment of a permanent
framework for dialogue and sharing between training centers and businesses. Such an approach
would require a sufficiently wide range of trainer specializations to allow such adaptations.
27. In a similar vein, continued education provided in either public (Institut National des Sciences
de Gestion, Institut Supérieur de Technologie ou Institut Universitaire des Sciences de
l’Organisation) or private higher education institutions would be reformed in the same logic.
Unlike happening currently, they will no longer be accessible only for new graduates but also for
employees or job seekers looking for professional development or defined basic vocational
training. In both cases this would depend on the actual needs expressed by companies. Such
composition also requires the establishment of a framework of relationships and cooperation
between the relevant ministries (Labor and Employment/Higher Education/Technical Education),
companies, employee representatives, and job seekers.
28. The teams of the Ministry of National Education in charge of Technical Education and
Training are thinking about the capitalization of all these experiences. However, it is necessary to
provide them with technical assistance in engineering for the “modeling” all of these cases in
order to incorporate them in the new education system and make it operational.
Text Box 3: an example of a public private partnership in education: the Institute of Oil and Gas (IPG)
Source: Ministry of Petroleum, Energy, and Water Resources
In 2010, as part of the implementation of the PSGE, the Gabonese government, in partnership with oil
companies operating in Gabon (Total Gabon, Addax Petroleum, ENI, Perenco and Shell Gabon) and the
assistance of the French Institute of Petroleum (IFP), created the Institute of Oil and Gas in Port-Gentil ,
with the aim to build local capacities in the oil sector. With a budget of 12 million USD, the IPG can
accommodate up to 60 students per year. It provides two types of training:
-initial training: it goes over a period of 12 months and is intended for technician and engineering graduates
who completed their trainingin the required education institutions (technological university institute,
universities and/or colleges, etc.). To be eligible, each candidate must be Gabonese, at least 25 years of age,
and have a level equivalent to final year of high school (and having studied technical or vocational subjects
such as instrumentation, electricity, electromechanics, mechanics, etc.) and be successful at psycho-technical
tests and individual interviews.
- Continuing education: organized in short-term courses with 5-10 day modules in vocational (petroleum
geosciences, reservoir engineers) and management (international contracts, oil economics, project
economics, trading, oil accounting, operational environment/safety, HSE) training courses. These courses
are intended for technicians and executives working industry or public organizations seeking to improve
their training.
The IPG relies on the best experts in vocational training related to international petroleum and gas industry
and national technical, scientific and commercial training institutions.. Courses are taught by experts from
major specialized training institutions, universities, colleges, companies in the oil and gas industry, and
public service that signed an agreement with the IPG.
It is managed by two bodies: the administrative board and academic board. The academic board is the
Institute’s decision-making body. It decides on any matter relating to the purpose of the Institute. Both
bodies include representatives from the government and the oil industry.
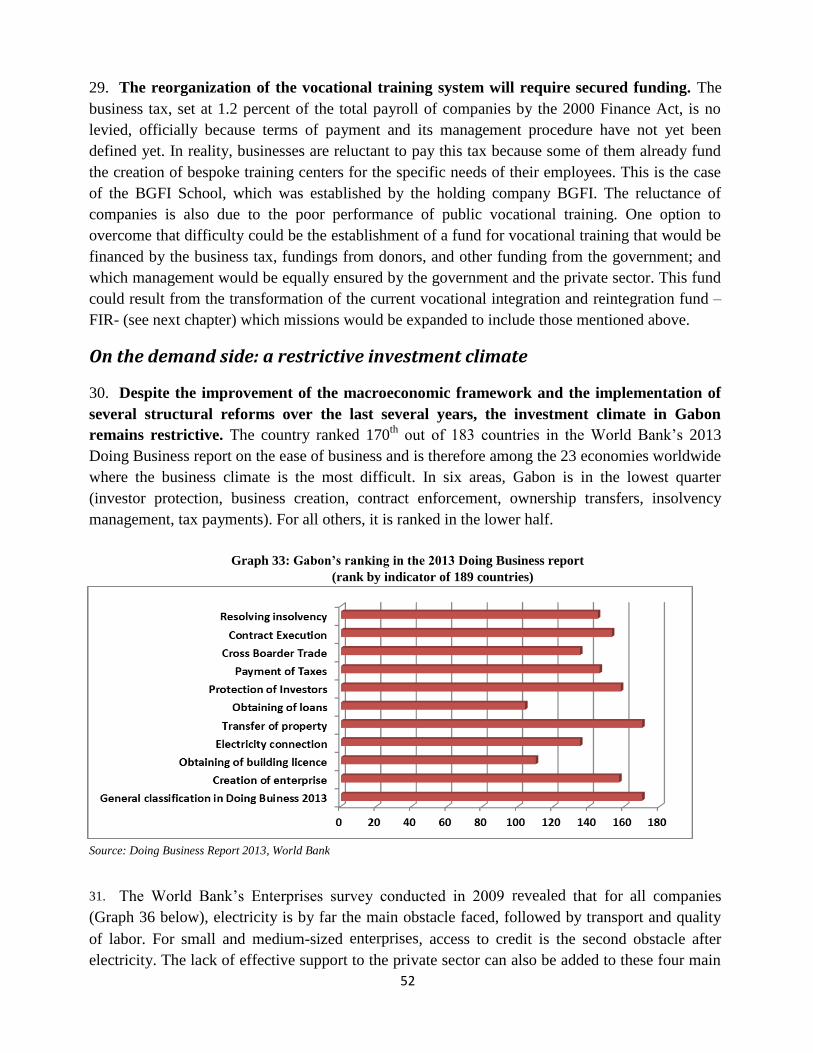
52
29. The reorganization of the vocational training system will require secured funding. The
business tax, set at 1.2 percent of the total payroll of companies by the 2000 Finance Act, is no
levied, officially because terms of payment and its management procedure have not yet been
defined yet. In reality, businesses are reluctant to pay this tax because some of them already fund
the creation of bespoke training centers for the specific needs of their employees. This is the case
of the BGFI School, which was established by the holding company BGFI. The reluctance of
companies is also due to the poor performance of public vocational training. One option to
overcome that difficulty could be the establishment of a fund for vocational training that would be
financed by the business tax, fundings from donors, and other funding from the government; and
which management would be equally ensured by the government and the private sector. This fund
could result from the transformation of the current vocational integration and reintegration fund –
FIR- (see next chapter) which missions would be expanded to include those mentioned above.
On the demand side: a restrictive investment climate
30. Despite the improvement of the macroeconomic framework and the implementation of
several structural reforms over the last several years, the investment climate in Gabon
remains restrictive. The country ranked 170th
out of 183 countries in the World Bank’s 2013
Doing Business report on the ease of business and is therefore among the 23 economies worldwide
where the business climate is the most difficult. In six areas, Gabon is in the lowest quarter
(investor protection, business creation, contract enforcement, ownership transfers, insolvency
management, tax payments). For all others, it is ranked in the lower half.
Graph 33: Gabon’s ranking in the 2013 Doing Business report
(rank by indicator of 189 countries)
Source: Doing Business Report 2013, World Bank
31. The World Bank’s Enterprises survey conducted in 2009 revealed that for all companies
(Graph 36 below), electricity is by far the main obstacle faced, followed by transport and quality
of labor. For small and medium-sized enterprises, access to credit is the second obstacle after
electricity. The lack of effective support to the private sector can also be added to these four main
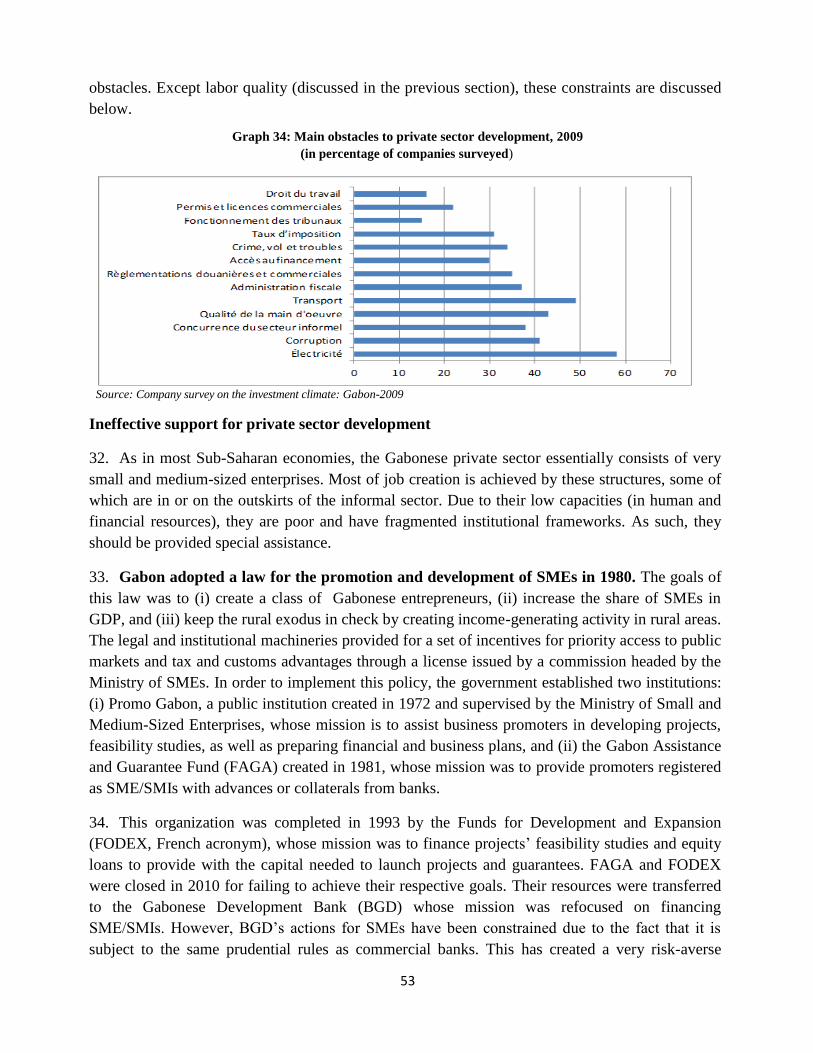
53
obstacles. Except labor quality (discussed in the previous section), these constraints are discussed
below.
Graph 34: Main obstacles to private sector development, 2009
(in percentage of companies surveyed)
Source: Company survey on the investment climate: Gabon-2009
Ineffective support for private sector development
32. As in most Sub-Saharan economies, the Gabonese private sector essentially consists of very
small and medium-sized enterprises. Most of job creation is achieved by these structures, some of
which are in or on the outskirts of the informal sector. Due to their low capacities (in human and
financial resources), they are poor and have fragmented institutional frameworks. As such, they
should be provided special assistance.
33. Gabon adopted a law for the promotion and development of SMEs in 1980. The goals of
this law was to (i) create a class of Gabonese entrepreneurs, (ii) increase the share of SMEs in
GDP, and (iii) keep the rural exodus in check by creating income-generating activity in rural areas.
The legal and institutional machineries provided for a set of incentives for priority access to public
markets and tax and customs advantages through a license issued by a commission headed by the
Ministry of SMEs. In order to implement this policy, the government established two institutions:
(i) Promo Gabon, a public institution created in 1972 and supervised by the Ministry of Small and
Medium-Sized Enterprises, whose mission is to assist business promoters in developing projects,
feasibility studies, as well as preparing financial and business plans, and (ii) the Gabon Assistance
and Guarantee Fund (FAGA) created in 1981, whose mission was to provide promoters registered
as SME/SMIs with advances or collaterals from banks.
34. This organization was completed in 1993 by the Funds for Development and Expansion
(FODEX, French acronym), whose mission was to finance projects’ feasibility studies and equity
loans to provide with the capital needed to launch projects and guarantees. FAGA and FODEX
were closed in 2010 for failing to achieve their respective goals. Their resources were transferred
to the Gabonese Development Bank (BGD) whose mission was refocused on financing
SME/SMIs. However, BGD’s actions for SMEs have been constrained due to the fact that it is
subject to the same prudential rules as commercial banks. This has created a very risk-averse

54
entity that is therefore inadequate at financing small and medium-sized enterprises.
35. The national consultation on SMEs organized in 2011 acknowledged the failure of the
SMEs promotion policy in Gabon, with different reasons depending on the interlocutors. The
authorities blame SME’s promoters for lacking inrigor and seriousness in business management,
the poor financing standing of companies, the non-execution of all or part of awarded contracts,
and the misappropriation of the funds meant for financing. SMEs complain about their lack of
incentives and government support. In any case, such a failure is indicative of two things: the lack
of entrepreneurial and management skills of the SME’s promoters and the ineffectiveness of the
institutional support system for SMEs and entrepreneurs.
36. Support for small and medium-sized enterprises and private sector promotion was
reformed in 2010 but remains fragmented and inefficient and lacks strategic direction.
Besides Promo Gabon, whose missions were presented above, the current framework for SME
support is comprised of the following three major actors:
37. The Center for the Development of Enterprises (CDE). The decree establishing the
creation of the CDE stipulates that it is a public administrative body with legal personality whose
missions include: (i) facilitating the administrative formalities required for the creation of
enterprises, the modification of their legal status, and the extension or termination of their
activities by establishing a one-stop shop; (ii) supporting and guiding promoters in their projects or
their activities eligible for the Charter of Investors and specific codes; (iii) monitoring business
activities. According to its primary mission, the CDE houses a one-stop shop for administrative
formalities that delivers various approvals and registrations mainly to small economic operators.
38. The CDE will also accommodate a one-stop shop to provide with investment support. It will
include customs services to analyze requests for exemptions, immigration services for foreign
residence permits, labor inspection to examine labor contracts, the National Social Security Fund,
as well as Gabon Telecom for internet access and the Energy and Water Company of Gabon
(SEEG) for access to electricity and water.
39. Despite the efforts made, the CDE has not yet reached the objectif set by the government:
make it possible to create a business within 48 hours. The lack of computerization and the fact that
all administrations must be present are the main reasons for this delay.
40. The Chamber of Commerce, Agriculture, Industry, and Mines of Gabon was identified
as a possible cluster to house some business consultancy services. In fact, a presidential decree
of January 2011 reorganized the structure and functioning of the Chamber of Commerce. It is now
led by a team chosen by the private sector and not appointed by the government. It contributes to
the implementation of the government’s policy for the promotion of private investment in addition
to being a representative and advisory body for the interests of all economic operators legally
operating in the country. With support from the World Bank, the Government plans to develop the
support for the private sector through the establishemnt of key services, including: (i) a center for
arbitration, mediation and conciliation to limit the use of courts (a long, costly, unpredictable
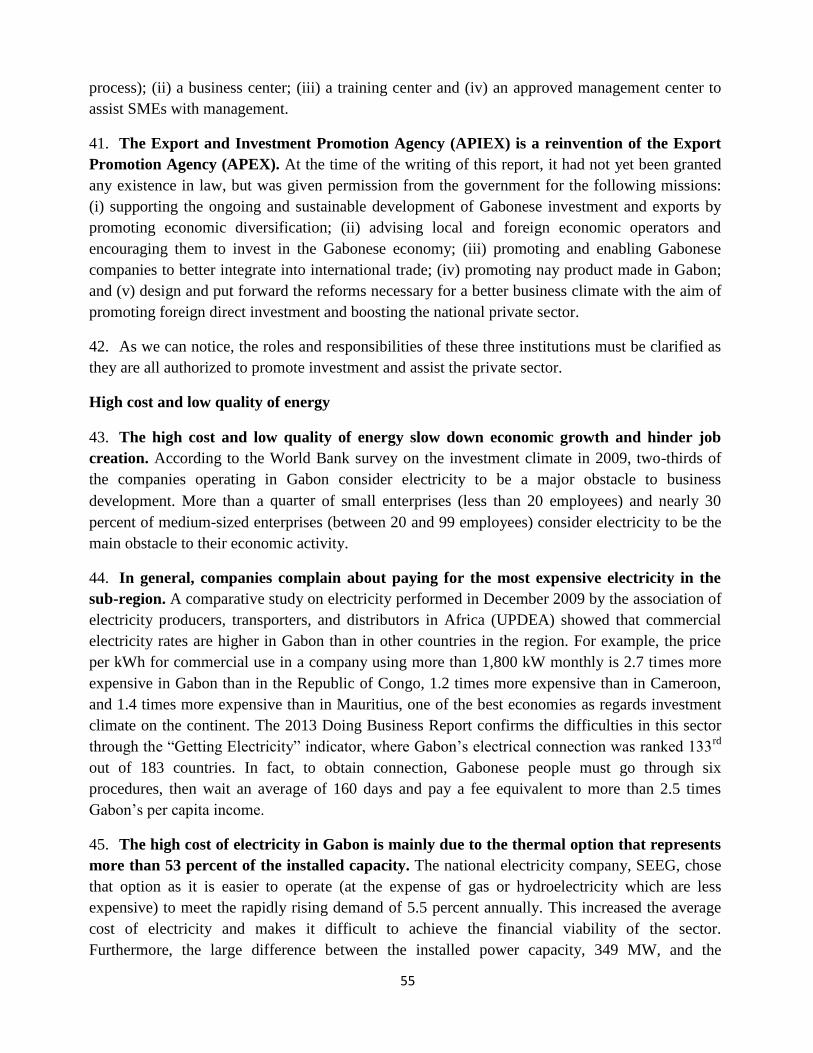
55
process); (ii) a business center; (iii) a training center and (iv) an approved management center to
assist SMEs with management.
41. The Export and Investment Promotion Agency (APIEX) is a reinvention of the Export
Promotion Agency (APEX). At the time of the writing of this report, it had not yet been granted
any existence in law, but was given permission from the government for the following missions:
(i) supporting the ongoing and sustainable development of Gabonese investment and exports by
promoting economic diversification; (ii) advising local and foreign economic operators and
encouraging them to invest in the Gabonese economy; (iii) promoting and enabling Gabonese
companies to better integrate into international trade; (iv) promoting nay product made in Gabon;
and (v) design and put forward the reforms necessary for a better business climate with the aim of
promoting foreign direct investment and boosting the national private sector.
42. As we can notice, the roles and responsibilities of these three institutions must be clarified as
they are all authorized to promote investment and assist the private sector.
High cost and low quality of energy
43. The high cost and low quality of energy slow down economic growth and hinder job
creation. According to the World Bank survey on the investment climate in 2009, two-thirds of
the companies operating in Gabon consider electricity to be a major obstacle to business
development. More than a quarter of small enterprises (less than 20 employees) and nearly 30
percent of medium-sized enterprises (between 20 and 99 employees) consider electricity to be the
main obstacle to their economic activity.
44. In general, companies complain about paying for the most expensive electricity in the
sub-region. A comparative study on electricity performed in December 2009 by the association of
electricity producers, transporters, and distributors in Africa (UPDEA) showed that commercial
electricity rates are higher in Gabon than in other countries in the region. For example, the price
per kWh for commercial use in a company using more than 1,800 kW monthly is 2.7 times more
expensive in Gabon than in the Republic of Congo, 1.2 times more expensive than in Cameroon,
and 1.4 times more expensive than in Mauritius, one of the best economies as regards investment
climate on the continent. The 2013 Doing Business Report confirms the difficulties in this sector
through the “Getting Electricity” indicator, where Gabon’s electrical connection was ranked 133rd
out of 183 countries. In fact, to obtain connection, Gabonese people must go through six
procedures, then wait an average of 160 days and pay a fee equivalent to more than 2.5 times
Gabon’s per capita income.
45. The high cost of electricity in Gabon is mainly due to the thermal option that represents
more than 53 percent of the installed capacity. The national electricity company, SEEG, chose
that option as it is easier to operate (at the expense of gas or hydroelectricity which are less
expensive) to meet the rapidly rising demand of 5.5 percent annually. This increased the average
cost of electricity and makes it difficult to achieve the financial viability of the sector.
Furthermore, the large difference between the installed power capacity, 349 MW, and the

56
consumption level, 1,752 GWH, in 2010 suggests an under-utilization of the installed capacities
and/or considerable energy losses in transport and distribution. In both cases, the consumer bears
the costs associated with the inefficient management of the electricity network.
46. The quality of electricity services has sharply declined over the last eight years. In 2011,
the audit firm, Deloitte, conducted an audit on the accounting, tariff, financial and technical
provisions of the concession agreement with SEEG on behalf of the government of Gabon. It
showed that in the interconnected network of Libreville, power cuts multiplied on average by three
between 2003 and 2010. Companies recorded an average of 5.5 power cuts per month and a power
cut lasts 5.3 hours per day. The cost of those power cuts for businesses represent an average of 2
percent of the monthly turnover. The SEEG’s audit also revealed that the voltage level distributed
to customers is not conform with the SEEG specifications and that between 2002 and 2008 the
performance of the electrical grid fell on average by 4 percent in Libreville and PortGentil, the
country’s two main cities and economic centers.
47. The degradation of electricity services is largely the result of insufficient investment in
the renewal and extension of production and transport facilities, a significant portion of
which are outdated. According to the contract signed by the government and the Energy and
Water Company of Gabon, at least 200 million USD should be invested in renewing equipment
during the concession period (1997-2017). The low electrical capacity delays or prevents the
development of large industrial and infrastructure projects in Gabon.
Table 9: Electricity rates in Africa and Gabon, 2009
(in centsUSD )
Three-phase power Semi-
industrial and Average commercial
driving force Voltage
use
(E=2500KWh)/mont
h) (E=1800kw/month) 12KW 15KW 20KW 25KW 250KW
Morocco 11.52 12.76 12.62 13.44 12.27
Tunisia 12.44 12.48 12.53 12.58 8.7
Ghana 14.61 14.61 13.22 13.22 14.06
Senegal 23.53 24.91 24.63 25.31 20.09
Rwanda 13.99 13.99 13.99 13.99 13.99
Cameroon(2009) 14.94 15.7 14.09 15 13.17
Chad(2009) 26.75 26.75 23.26 23.26 19.33
Congo, Rep. 6.40 6.40 5.64 5.64 7.60
(2009) Gabon(2009) 17.20 17.60 14.80 15.80 16.20
Mozambique 14.75 14.75 9.28 10.13 8.08
Mauritius(2009) 12.45 12.94 8.03 8.53 7.05
Source: UPDEA, Comparative study on electricity rates in Africa, December 2009
48. In order to address the energy deficit and create favorable conditions for the industrialization
of the country, the government established a 2011-2020 energy infrastructure development plan
whose main goal is to increase the national power generation to 1,200 MW in 2020 compared to

57
374 MW currently. In 2013, the national power generation capacity is expected to exceed 400
MW after the commissioning of the Poubara hydroelectric dam (160 MW) in the Haut-Ogooué
province. This dam will mainly supply the Comilog’s Moanda Metallurgical Complex. Other
projects are planned in the medium-term, including the construction of a 36 MW hydroelectric
plant in FE2 on the Okano river, southeast of Mitzic in the Woleu-Ntem province, the construction
of a 42 MW dam and plant on the Empress Eugénie waterfalls in the Ngounié river, near
Fougamou, and the construction of a hydroelectric plant (400 KW) in Iboundji in the south.
Low quality of transport and logistics infrastructure and services
49. Due to its weak links with neighboring countries, Gabon suffers from disadvantages in
the form of high costs of trade logistics for all types of transport and related services. The
results of surveys conducted to calculate the logistics performance index –Logistical Performance
Index- of the World Bank show that, compared to their experience in other countries, 40 percent of
the enterprises estimate that their rates of ground transportation, shipping, storage, and handling
are “high or very high” in Gabon; 60 percent believe the same as regards rail transport. This
percentage is 20 percent for airport fees. As for ports, airports, roads, railways, storage, handling,
and telecommunications, an additional 80 percent to 100 percent consider that the quality of
transport infrastructure is low or very low.
50. The competence of the operators and quality of infrastructure services are considered to
be very low by economic operators. As for road infrastructure, railways, storage, handling,
distribution, customs, quality and standards inspection, and hygiene and health services, they all
scored a zero from companies. Only 40 percent of the companies consider that maritime and air
transport infrastructures are of high or very high quality and only 20 percent consider that
customs, freight, and transit services are good.
51. The available quantitative data on infrastructure confirms the viewpoint of businesses. The
country has a road network that is comparatively undeveloped. Out of nearly 10,000 km of roads,
only 1,200 are asphalted. An important gap illustrates this problem: there is no road linking
Libreville to the country’s economic capital, Port-Gentil. The high prices of goods in this city are
another example as most cargo is transported by air.
52. In general, access costs are high in the country, which increases the price of produced or
consumed goods. In the hope to remove this major obstacle to growth and employment, the
government decided to carry out, from 2012 to 2016,an exceptional program consisting in
asphalting 3,6000 km of roads.This will represent 30 percent of the road network. 215 kilometers
were already asphalted for a cost of 180 million dollars in 2011.
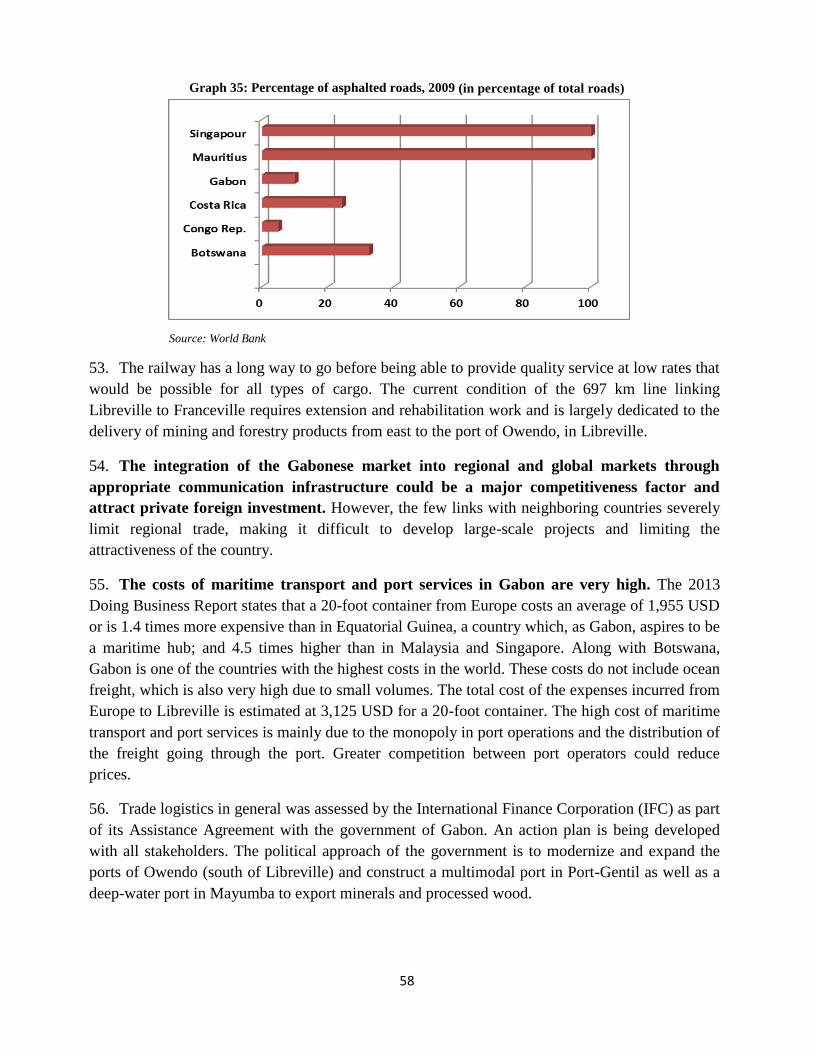
58
Graph 35: Percentage of asphalted roads, 2009 (in percentage of total roads)
Source: World Bank
53. The railway has a long way to go before being able to provide quality service at low rates that
would be possible for all types of cargo. The current condition of the 697 km line linking
Libreville to Franceville requires extension and rehabilitation work and is largely dedicated to the
delivery of mining and forestry products from east to the port of Owendo, in Libreville.
54. The integration of the Gabonese market into regional and global markets through
appropriate communication infrastructure could be a major competitiveness factor and
attract private foreign investment. However, the few links with neighboring countries severely
limit regional trade, making it difficult to develop large-scale projects and limiting the
attractiveness of the country.
55. The costs of maritime transport and port services in Gabon are very high. The 2013
Doing Business Report states that a 20-foot container from Europe costs an average of 1,955 USD
or is 1.4 times more expensive than in Equatorial Guinea, a country which, as Gabon, aspires to be
a maritime hub; and 4.5 times higher than in Malaysia and Singapore. Along with Botswana,
Gabon is one of the countries with the highest costs in the world. These costs do not include ocean
freight, which is also very high due to small volumes. The total cost of the expenses incurred from
Europe to Libreville is estimated at 3,125 USD for a 20-foot container. The high cost of maritime
transport and port services is mainly due to the monopoly in port operations and the distribution of
the freight going through the port. Greater competition between port operators could reduce
prices.
56. Trade logistics in general was assessed by the International Finance Corporation (IFC) as part
of its Assistance Agreement with the government of Gabon. An action plan is being developed
with all stakeholders. The political approach of the government is to modernize and expand the
ports of Owendo (south of Libreville) and construct a multimodal port in Port-Gentil as well as a
deep-water port in Mayumba to export minerals and processed wood.
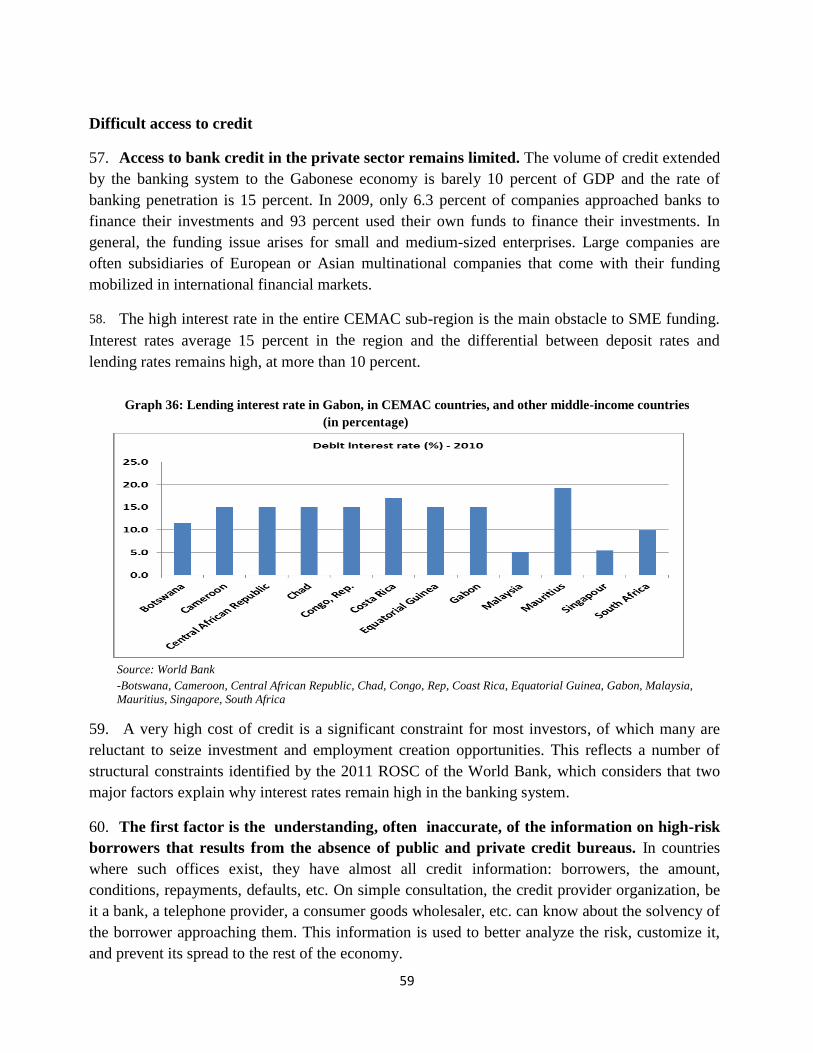
59
Difficult access to credit
57. Access to bank credit in the private sector remains limited. The volume of credit extended
by the banking system to the Gabonese economy is barely 10 percent of GDP and the rate of
banking penetration is 15 percent. In 2009, only 6.3 percent of companies approached banks to
finance their investments and 93 percent used their own funds to finance their investments. In
general, the funding issue arises for small and medium-sized enterprises. Large companies are
often subsidiaries of European or Asian multinational companies that come with their funding
mobilized in international financial markets.
58. The high interest rate in the entire CEMAC sub-region is the main obstacle to SME funding.
Interest rates average 15 percent in the region and the differential between deposit rates and
lending rates remains high, at more than 10 percent.
Graph 36: Lending interest rate in Gabon, in CEMAC countries, and other middle-income countries
(in percentage)
Source: World Bank
-Botswana, Cameroon, Central African Republic, Chad, Congo, Rep, Coast Rica, Equatorial Guinea, Gabon, Malaysia,
Mauritius, Singapore, South Africa
59. A very high cost of credit is a significant constraint for most investors, of which many are
reluctant to seize investment and employment creation opportunities. This reflects a number of
structural constraints identified by the 2011 ROSC of the World Bank, which considers that two
major factors explain why interest rates remain high in the banking system.
60. The first factor is the understanding, often inaccurate, of the information on high-risk
borrowers that results from the absence of public and private credit bureaus. In countries
where such offices exist, they have almost all credit information: borrowers, the amount,
conditions, repayments, defaults, etc. On simple consultation, the credit provider organization, be
it a bank, a telephone provider, a consumer goods wholesaler, etc. can know about the solvency of
the borrower approaching them. This information is used to better analyze the risk, customize it,
and prevent its spread to the rest of the economy.
60
61. The second factor relates to the structure of the banking system itself. Banking is highly
concentrated, with several large banks dominating the sector. In such circumstances, banks have a
strong power over the market to raise the costs of credit and lower deposit rates. One way to
address the information asymmetry is to encourage companies to produce reliable accounting
information. Alternatives to bank credit are also available, such as the development of venture
capital enabling banks to recover their debts in the event of materialization of the risk. Guarantee
funds with government support must also be established.
62. In order to improve access to credit the following reforms should be implemented:
(i) Establish a Central Credit Register within the BEAC (Bank of Central African States) in
order to better assess the risks and provide monetary policy-makers with all the
information they need as regards credit that could form their decisions;
(ii)Establish a central balance sheet register available for consultation for the banking
industry to allow access to the accounting results of companies. The Central Credit
Register (BEAC) should expand the credit monitored to companies and individuals and
set a threshold of credit taken relatively low (one million CFA francs for example);
(iii) Implement a regulatory framework that establishes and organizes private credit
information bureaus.
(iv)Apply the OHADA reform10
of December 15th
2010 on securities. This reform addressed
the legal constraints on securities.
On the legal and institutional framework:
Strict labor laws
63. By wanting to protect the employee, labor laws eventually developed many rigidities
that stifle job creation. These are mainly provisions on the termination of employment contracts,
personal protection, fixed-term contracts, redundancy, and the use of foreign labor
Termination of the employment contract
64. Strongly inspired by the French law, the labor law in Gabon is extremely protective and
concerned with the rights of employees, mainly the protection against termination of
employment contracts. Seeking to balance the unequal relationship between the employer and
the worker, the Gabonese Parliament organized the protection of employees that acts in both
directions. Firstly, article 10, paragraph 1 of the Labor Code renders null and void “any waiver,
limitation, or transfer by agreement of the recognized rights of the workers”. Secondly, the public
10
The reform of the OHADA Uniform Act on securities l (i) simplified the creation and publication of securities, (ii)
expanded the range of personal property that can be used as a security interest (in any present and future goods), (iii)
simplified procedures for the realization of security rights, (iv) relaxed the rules on mortgages, including the
authorization of future building goods and rights on buildings constructed in the public or national domain (to facilitate
infrastructure financing). Excerpt from an IFC article on Doing Business in OHADA states.

61
policy nature of the labor law is reinforced by prohibiting the dismissal of an employee who
exercises his or her rights as recognized by the law.
Personal protection
65. Regarding personal protection, the employee is protected by the provisions of the
articles 12 and 13 of the Labor Code. The first establishes the principle of the interpretation
most favorable to the employee. Under this principle, if there is doubt in the interpretation of the
law, the court must adopt the interpretation most favorable to the employee. According to this
principle, in case of conflict between various standards of labor law, the standard which is more
favorable to the worker should be applied. Thus, despite the public policy nature of the labor law,
it is possible to give the employee benefits that are higher than the legal minimum in an
employment contract or collective agreement.
These provisions mean that, in practice, the decisions of labor inspectors and judges in
labor courts never strive for balance, but are instead more favorable to the worker.
The redundancy procedure
66. The procedure for the termination of a work contract in case of economic difficulties is
long and costly for the employer. The Labor Code requires employers to implement a social plan
in the event of the redundancy of more than ten employees. The procedure is particularly long and
complicated and takes a lot of time and energy out of the company’s managing director and their
technical and administrative staff at a time when the company is in trouble. If redundancy
involves at least ten employees, the employer, in accordance with article 59 of the Labor Code, is
required to submit the staff representatives a social and financing plan developed together with the
National Employment Office (ONE) . This social plan can be developed only for the benefit of the
employees the employer demonstrated the staff representatives and the labor inspector that the
dismissal cannot be avoided. The employee in question has the choice between the social plan and
severance pay. In practice, given precedents in the public sector and confusion in the
interpretation, the employees always opt for severance pay, which varies between 28 and 52
months of wages. These difficulties partly explain the reluctance of companies to engage in a
permanent contract (CDI).
The fixed-term contract (CDD)
67. The ordinance of April 25th
2010 amended the structure of thearticle 23 of the Labor
Code by deleting the paragraph 2 which established the short-term CDD. From now on the
CDD from the article 23 is mandatory for an initial period of no less than two years, as in the
written agreement. It can be renewed once, for a total duration, including renewal, which cannot
exceed four years.
68. The amendment of provisions regarding the CDD introduced in 2010 is a step back compared
to the 1994 Code that had already introduced some flexibility. For example, it provided two types
of CDD: along-term one, initially agreed upon for two years and renewable once over the same

62
period for a total of four years; and a short-term one, which could be agreed upon and renewed
once as long as the total time period didn’t exceed two years. Tht last category of CDD was the
most used by companies, enabling them to use a labor force that could not claim the conclusion of
a CDI.
The use of foreign labor
69. The principle of priority hiring for domestic workers has led legislators to strictly regulate the
employment of foreign workers. This is what emerges from thearticle 104 of the Labor Code.
These laws condition the employment of foreign workers by the issuance of a work permit by the
Ministry of Labor. The administrative authority shall issue the authorization, in principle, if there
are no qualified nationals available in the relevant field. The Gabonese Parliament goes further by
pointing out that foreign labor shall not exceed 10 percent of a company’s total staff.
70. This limitation on the use of foreign labor can be detrimental to companies that are frequently
faced with a shortage of domestic skilled workers in both technical fields and basic trades, where
there is a deficit. For example, there is a scarcity of domestic labor in agro-industrial plantations
where the use of foreign labor is necessary for the productivity of the investment project.
Moreover, it is not uncommon for companies to evade legal provisions, for example by not
declaring their foreign labor force. It is therefore necessary to relax this provision of the 1968
Labor Code.
A structurally unbalanced social security system
71. The social security of workers is mainly provided by two social organizations, the
National Social Security Fund (NSSF) and the National Health Insurance Fund and Social
Guarantee (CNAMGS). In addition to these two public organisations, there are private health
insurance providers that companies use to supplement the provisions of public bodies.
The role of NSSF
72. A private organization responsible for the management of a public service, the NSSF bases its
actions on two major documents: the social security code and its implementation decree, dating
from 1975 and 1981 respectively. It provides family and maternity, work accident, and retirement
benefits. The health unit (with the exception of community health centers and maternal and child
welfare services) is being transferred to the CNAMGS.
73. The resources of the NSSF consist of contributions from those insured, i.e. at 22.6 percent of
the payroll. Employers contribute up to 20.1 percent and workers 2.5 percent. When the transfer of
the health unit to CNAMGS is completed, the overall contribution rate will fall to 18.5 percent as
contributions to this unit, ie.e at 4.1 percent (paid by the employer), will now be paid to the
CNAMGS.
74. Regarding expenses, NSSF has to bear the structural deficit of the pension branch despite the
raising of the retirement age to 60 years, by paying, under certain conditions, a basic retirement

63
pension of 45 percent of the average net salary of the last five years; and 1 percent for each
additional year beyond 20 years. This pension cannot be less than 80 percent of the minimum
wage, set at 80,000 CFA francs monthly, or 64,000 CFA francs. Family benefits are 21,000 CFA
francs/child/quarter with an education allowance of 20,000 CFA francs/child/year. In 2010, the
total NSSF contributions amounted to 100 billion CFA francs, with 35 billion allocated to the
payment of retirement pensions, 30 billion for family benefits and work accidents, and the
remaining 40 billion to cover operating expenses (including staff costs for the 1,600 agents11
) as
well as health and social security funds. NSSF reserves are currently below the 10 percent set by
law.
Table 10: NSSF Funding, 2012 (in percentage)
Determination of risk Salary Employer share
Share
Family allowances 8 percent
Work accidents and occupational illnesses 3 percent
Old-age pension 2,5 percent
5percent Medevac funds
0,6
percent Distribution of medicine
2percent
Hospitalization 1,5 percent
Total 2,5percent 20,1 percent
Source: NSSF
75. For several years, the NSSF has been facing a structural deficit mainly due to the
decline in employment, the increasing number of taxable persons and the non-payment of
social security contributions by many private companies. According to a recent UNICEF
study, the deficit in the pension branch is growing at an average rate of 19.25 percent annually,
mainly due to the larger increase in expenses related to technical services (retirement pensions and
survivors’ pensions) whereas contributions increase only by 6.9 percent annually.
76. In order to eliminate the structural deficit of NSSF, its management started
implementing a recovery plan that includes reorganizing and boosting the collection of the
social security contributions, redefining its activities, and reducing its costs. These efforts
resulted in a marked improvement in the financial situation of the organization, which recorded a
surplus profit of 10.9 billion CFA francs in 2010, and made it possibleto eliminate the overall
deficit of 4.2 billion recorded in 2009 . The government’s decision to pay the pension arrears
resulting from the minimum wage increase also contributed to this improvement.
77. However, these efforts are insufficient to eliminate the structural deficit of NSSF
because it results from the system configuration that ensures small contributions compared
to the generous social benefits. For example, it is shown that 20 years of contributions in part
correspond to two and a half years of retirement pensions. The internal rate of return of the NSSF
11
The government recovers the net value of the three hospitals constructed by the NSFF on equity with 900 agents

64
is estimated at 11 percent while the African average is about 3 percent to 4 percent. Furthermore,
the structural deficit is aggravated by the margin squeeze caused by a recessive job market while
the number of retirements is growing.
78. It is evident that this system sowed the seeds of its structural imbalance. Permanent resources
(already burdensome for companies) are inadequate to sustainably cover the expenses. An
actuarial study is essential and urgent. It would reconfigure the system by defining the optimal
level of contributions and reform the Social Security Code, as its provisions dating from 1962 are
now obsolete and dot not match with the NSSF’s current situation.
79. In addition to the NSSF, a compulsory health insurance system was established with the
creation of CNAMGS by ordinance No. 0022/PR/2007 of August 21st
2007. Pursuant to
thearticle 4 of this ordinance,; public officials, employees in the private and parastatal
sector, employees of the government and public administrations, self-employed
workers, annuitants or pensioners have to subscribe to the compulsory health insurance
scheme, regardless of their insurance scheme. Anyone of Gabonese nationality who does
not fall within any of these categories and self-employed foreigners may voluntarily
subscribe to the compulsory health insurance plan.
80. The creation of CNAMGS led to the dissolution of the National Social Guarantee Fund
(CNGS) and the transfer to the National Social Security Fund (NSSF) of its activities related to
hospitalization, the free distribution of drugs, and medical evacuations.
81. The benefits provided under the compulsory health insurance are: the expenses for
consultations, hospitalizations, medicines, medical and paramedical procedures, medical
evacuations, mandatory vaccines and appliances, pregnancy and childbirth. All of these benefits
are paid according to the principle of third-party payment, the participant being subject to fees
based on the principle of co-payments. Despite the magnitude of technical charges, health care is
covered at 80 percent by the paying-third system and 20 percent by the beneficiary in the form of
user fees.
82. The implementation of CNAMGS activities was a gradual process. It started with the
registration of low-income people (those with incomes below the legal minimum wage) in 2008
and 2009, then that of the public sector workers in 2010. At the time of the writing of this report,
the private sector employees and the self-employed were not yet fully registered.
83. CNAMGS funding is provided by three separate funds: (i) health insurance fund for the
government public officials, (ii) the health insurance fund for the employees of the private and
parastatal sectors, artisanal, commercial and liberal professions, and the self-employed and (iii)
the social security fund of poor Gabonese, students, and refugees. The health insurance fund for
government public officials is financed by the contributions from public sector employees. The
contribution of the workers in the private and parastatal sector comes from a levy of 6.6 percent
on the taxable earnings of each employee, including 2.5 percent paid by the employees themselves
and 4.1 percent by the employer. Retirees contribute up to 1.5 percent. The Social Guarantee Fund

65
is funded by a levy of 10 percent on the turnover excluding taxes of the mobile telephony
companies operating in Gabon and by 1.5 percent of all international transactions executed from
Gabon, with the exception of those of the government.
84. CNAMGS is a recent creation and has not yet completed the implementation of its
activities, so it is too early to comment on its long-term viability. However, one might wonder
about the sustainability of the social security fund for the poor Gabonese persons which relies
mainly on the turnovers of telecommunications companies which have been experiencing a
leveling off in the last years after a decade of growth. An actuarial study is now needed to identify
a more sustainable funding system.
85. In conclusion, social security in Gabon is very generous for workers and expensive for
the employer, which may be an obstacle to worker registration. Out of the 22.5 percent of
contributions levied on wages, employers bear 20.1 percent and employees only 2.5 percent. This
system increases the burden on companies which, in order to avoid a heavy financial burden, do
not declare their staff or prefer engaging in fixed-term contracts even for stable and permanent
jobs.
86. The long-term equilibrium of the Gabonese social security system may require greater
contributions from the workers. This issue could be incorporated into a tripartite consultation
including the employers, the government and the workers. For an increase in their contributions,
workers could be assigned responsibilities in the decision-making bodies of both funds. Sound
actuarial studies should underlie the reforms required to achieve this balance.
Lack of a reliable labor market information system
87. The institutional and regulatory framework for employment promotion is changing. The
Ministry of Labor, Employment and Social Security was suppressed in February 2012 and its
functions were transferred to the Ministry of Economy, Employment, and Sustainable
Development. An employment center incorporating the functions of the old Ministry of Labor has
was created within this new Ministry (defining and implementing the employment policy,
applying labor regulations, monitoring the labor market and industrial relations as well as
employment research).
88. The purpose of this reorganization is to make economic diversification and employment
policies more consistent. Ongoing reforms also include the development of a national employment
policy after the organization of a general assembly on employment scheduled for the second half
of 2013. With support from ADB, this reform also aims at building the institutional and technical
capacities of the employment center by defining an appropriate methodological framework for the
tasks to be carried out. Capacity building will involve equipment, training and recruiting
specialized staff in order to provide the employment center with the means necessary to
accomplish its missions. Despite these reforms, shortcomings persist.

66
89. Gabon suffers from a lack of reliable labor market information. While the informal
private sector employs nearly half of the workforce, it is not subject to any monitoring by regular
studies. The same is true for unemployment, as the only data available are those of the 1993
General Census of Population and Housing, (since that of 2003 was not validated), the 2005
Gabonese survey on poverty assessment (EGEP), and the 2010 National Survey on Employment
and Unemployment (ENEC). There is also a difference between the figures from these sources
and from the wage statements publishes by the General Directorate of Statistics.
90. Many organizations collect data on formal employment, but it is insufficient to monitor the
trends and the type of existing jobs, conduct in-depth analyses, appropriately inform potential
users, and alert public authorities for possible corrective actions. ONE data focuses on
applications and job offers and that of the national accounts, collected from the statements of the
salaries paid, are highly aggregated and concern only a part of the formal sector. NSSF could also
be an important source of employment data, but its current information system does not generate
data on sectoral distribution and qualifications. Labor inspectorates existing throughout the
country are also a potential source of information on the labor market, but they face significant
practical difficulties. In such circumstances, it is difficult to monitor the trends and type of the
existing jobs, conduct in-depth analyses, appropriately inform potential users, and alert the public
authorities on possible corrective actions.
91. Conscious of the limitations as regards labor market information, the Ministry of
Economy and Employment envisages the creation of a National Employment and Training
Observatory . This new institution will be responsible for (i) centralizing and processing data on
the employment and training situation, (ii) designing analytical tools and analyzing employment
statistics, (iii) conduct studies and employment surveys as well as measuring the impact of the
measures implemented as regards employment and training in order to provide with guidance and
policy decisions regarding employment and training policy. The establishment of such an
institution will require to first defining a clear assignment of roles so that ONE and the General
Directorate of Employment will be able to define their respective areas of responsibility. Such an
institution will also require to make the various public statistics (NSSF, labor inspections, ONE,
survey data, etc.)compatible and consistent.
92. Finally, the establishment of an observatory should be part of the national employment policy
and fall, in a consistent manner, within the national statistical system. It should not duplicate the
functions of the Directorate General of Statistics and sectoral statistics services, but fall
harmoniously within the national statistical system by implementing a system for the access and
transfer of data between agencies.
Labor market intermediation is limited
93. The National Employment Office (ONE) performs the job placement service. Created on
October 1st 1993, it is responsible for: (i) assisting people seeking employment or training to
improve their employability, (ii) assisting employers in hiring or reclassifying (internal or
external) their staff, and (iii) implementing special measures adopted by the government in favor
67
of employment. To this end, ONE collects and processes data on the labor market, meets and
guides job seekers towards available offers, selects and supervises candidates who want to create
very small businesses (self-employment) by helping them preparing their feasibility report.
Between 1994 and 2010, ONE received 57,975 job seekers and 11,411 jobs with only 5,532 direct
recruitments. ONE’s activity is limited due to its small operating budget and the fact that it is
currently present only in three provinces. in addition, the ENEC 2010 results show that job seekers
prefer relying on personal relationships (37 percent-39 percent), applying directly to employers
(20 percent-26 percent), and responding to classified ads (8 percent-14 percent), rather than using
ONE (2 percent). This analysis demonstrates the need to reconsider the role of ONE in order to
both strengthen it and deploy it nationwide.
94. Housed within ONE, the Vocational Integration and Reintegration Fund (FIR) is
managed by a management board consisting of representatives from the government,
employers, and workers. Its mission is to grant aid for young graduates looking for their first job
or for workers laid off by public or private companies and seeking for a new job. These grants are
in the form of (i) financing of all or part of training courses prepared in accordance with the
requirements of the labor market and (ii) participation in the financing of sectoral studies on
available and potential job opportunities. This type of activity is less frequent.
95. FIR’s activities are limited due to its small annual budget. In fact, 100 million CFA francs
are annually allocated to training activities carried out by FIR and this budget is often made
available late. Considering that the average cost for the training of a job seeker is between 400,000
and 500,000 CFA francs, it is understandable that the FIR cannot respond effectively and
sustainably to the training demand expressed by companies.
96. The target population of FIR is extremely limited by law. Only graduates and laid-off
employees can benefit from FIR training. However, as demonstrated in ONE statistics and ENEC
results, many job seekers have a high need for training. Furthermore, more people are dismissed
for personal reasons than for economic reasons. It is also not uncommon that this personal reason
is the result of the employee incompetence. The result is that by restricting the scope of the FIR,
the law deprives many job seekers from the training they absolutely need. At the same time as the
overall budget would be increased, all job seekers (not only graduates or laid-off workers) could
benefit from training when a company has expressed a need.
97. On the other hand, since its actual start in 1994, FIR’s activities for self-employment have
been limited. Between 1994 and 2004, they conducted only 32 awareness campaigns on self-
employment and initiated only 327 self-employment training sessions. As a result, only 251
independent jobs were created between 1994 and 2010. The reorganization of FIR could be
integrated into the broader context of the reorganization of vocational training mentioned in the
previous chapter.
The limited impact of employment promotion programs
98. in the 1990’s, in order to fight unemployment and promote self-employment, the Gabonese
68
government, with the support of technical and financial partners, started implementing specific
programs for the promotion employment called “second chance” programs.
99. The main programs are: (i) the program to Support Training and Professional Integration
(AFOP/AFIP), (ii) the National Program of Development, Control, and Public Management of
Public Interest Works for the Promotion of Entrepreneurship and Employment (PN TIPPEE), (iii)
the Program to Support the Development of Microcredit in Gabon (PADMG), (iv) the Program to
Support Young Mothers and (v) programs implemented by the Gabonese Development Support
Institute (IGAD). Except for IGAD, the impact of these programs is limited, mainly due to the
lack of resources they are allocated.
Programs of the Gabonese Development Support Institute (IGAD)
100. Established in 1992 as an association governed by the law of 1962, IGAD aims to increase
the share of agriculture in national income by focusing on the creation and development of a
suburban agricultural fabric that would fit into the context of sustainable development. To achieve
this goal, IGAD provides training in agriculture throughout the country to improve the
employability of people in precarious situations, by helping them becomimg small-scale
agricultural entrepreneurs. Since 1992, IGAD has created more than 1,200 very small agricultural
enterprises (VSE) within the nine (9) provinces in the country that have generated more than
2,000 permanent jobs.
101. Building on past IGAD results, the Gabonese government launched the Agricultural
Development and Investment Project in Gabon (PRODIAG) with the financial support of the
French Development Agency (AFD). Scheduled for five (5) years over the 2011-2015 period,
PRODIAG has a budget of 12.7 billion CFA francs resulting from a loan from AFD representing
79 percent of the project’s funding. The remaining 21 percent was financed by the Government.
102. The goal of PRODIAG is to contribute to the improvement food security, the reduction of
poverty, and to increase the share of agriculture in national wealth. More specifically, PRODIAG
is designed to support the development of the production and marketing of agricultural products.
For this reason, it is expected to generate more than 1,000 farms, 2,200 direct jobs, and 1,000
indirect jobs over five years. This project is expected to entail a significant increase in the income
level of farmers who will receive support in structuring the industry.
Project to support Vocational training and integration
103. Funded by the European Development Fund (EDF), the project to support vocational
training (AFOP) targets young people between 16 and 25 years of age who are excluded from the
educational system and who, for a reason or another (social disadvantage, insufficient education
level, geographical remoteness, lack of educational training structures or limited capacities),
cannot continue with normal schooling. The project provides them with short-term vocational
training or training leading to a qualification (3-6 months) to acquire skills in agriculture, forestry,
and construction trades. At the end of 2010, the AFOP project trained 25 apprentices-companions
in the agricultural sector, of which 15 percent - obtained a temporary job and 4 percent a stable

69
job. The limited integration of trained young people led to the project’s restructuring to take the
vocational integration component into account.
104. The follow-up project will be the project to support training and vocational integration
(AFIP) for the 2012-2015 period, which will organize short sandwich training courses leading to a
qualification within public and private training centers based on the private sector’s needs.
The National Program for the Development of Public Purchasing and Management of Works
of Public Utility for the Promotion of Entrepreneurship and Employment (PN-TIPPEE)
105. The objective of the PN-TIPPEE is to assist local small and medium-sized enterprises,
mainly those involved in construction, with access to public purchasing through the construction
of community infrastructure. The program aims to promote micro, small, and medium-sized
enterprises (MSMEs), while delivering training for the managers and executives of these
companies. It also aims to promote the employment of nationals by encouraging priority hiring of
Gabonese people from the communities benefitting from the infrastructure. Between 2006 and
2011, the project assisted 150 SMEs with the conclusion of 632 works or service contracts under a
call for tenders of CFAF 15 billion. Supported by joint funding from the World Bank and the
Gabonese government until 2011, the program was suspended due to a lack of new funding. The
beneficiaries’ satisfaction survey conducted by the National Commission of Works of Public
Interest Utility Works for the Promotion of Entrepreneurship and Employment (PN TIPPEE)
showed that people are highly interested in this program and that it would be good to conduct an
operational audit of the program to ensure sustainable and stable funding. In addition to promoting
the access of small and medium-sized enterprises to public procurement, this type of program can
also help to create jobs for unskilled workers and help people to transition from the informal to the
formal sector.
The Program to Support the Development of Microcredit in Gabon (PADMG)
106. The objective of the PADMG is to empower women by supporting their activities in fields
as diverse as agriculture, livestock farming, fishing, craftsmanship, trade, and services. This
funding, provided with the help of the United Nations Development Program (UNDP), the
Gabonese Development Bank (BGD), and the ministry of agriculture and livestock framing, is in
the form of loans to individuals between CFA francs 500,000 and 5,000,000.
107. These loans are used to build capital or acquire the equipment necessary to conduct
economic activities. They are granted at a subsidized declining rate of 4 percent per year,
including fees and commissions. The loan is subject to guarantees provided by the beneficiary.
These guarantees include direct debit, delegation of revenue, or collateral. Initially launched in the
province of Nyanga, the PADMG was extended to the provinces of Haut-Ogooué and Woleu-
Ntem. No assessment of the results achieved by the project was available at the time of this
report’s preparation.
108. However, project managers mentioned several difficulties facing the project. The most
significant is that the volume of credit may not exceed CFA francs 50 million per province. This

70
small amount contrasts with the strong demand from women in the provinces covered by the
project. Other difficulties are related to the project’s operations that require awareness-raising ,
monitoring and control missions as well as training sessions for the target audience. These
difficulties jeopardize the extension of a project that could be an important source of self-
employment throughout the entire country and significantly help to reduce poverty, especially in
rural areas.
The Program for Young Mothers
109. Early pregnancy is one of the main causes of school dropping out and the vulnerability of
women in employment. Therefore, in 2001, the Gabonese government set up a fund for low-
income young mothers. Considered needy, they often earn a monthly income below the minimum
wage. This fund financed:
110. The construction of thirteen day nurseries and community centers that hosted 2,015 children
aged three (3) to five (5) of young single mothers. Day nurseries also allow needy young mothers
working or bein engaged in a particular activity without having to watch their child.
111. Training courses leading to a qualification with minimum setting-up packages. In 2008, 95
girls benefitted from training in hairdressing, dressmaking, welding, computer and data
processing, plumbing, automitive mechanics, pre-school education, housekeeping and cooking,
and heavy equipment mechanics. Eighty single mothers who graduated from the program are no
longer in precarious situations as they found jobs or started their own businesses.
112. The managers of this program mentioned the lack of financial resources as the main
obstacle to its expansion. It should also be the subject to an operational audit in order to increase
the number of single mother beneficiaries.
113. By and large, it is desirable for Gabonese authorities to conduct an assessment of the socio-
economic impact of these various programs in order to measure their effectiveness. This impact
study would allow identifying relevant programs to be expanded to the entire national territory
after providing them with adequate resources.

71
V. CONCLUSION: CREATE INCLUSIVE GROWTH CONDITIONS
1. The analysis of the constraints and challenges to job creation showed that they are diverse
and that, particularly for young people, combating unemployment requires a multi-form approach
that affects both supply and labor demand. The most urgent task seems to be the reform of the
education system in order to improve its quality and make it more compatible with the needs of
the productive sector so that job opportunities become quality jobs. Meanwhile, the investment
climate must improve in order to increase employment opportunities.
2. It will also be necessary to relax the labor law that, today, tends to protect workers and
slows the creation of new jobs. Similarly, in order to ensure the sustainability of the social
protection system, it seems necessary to undertake actuarial studies of the two public social
security organizations. Such reforms will require faster implementation of the new institutional
framework that was launched in February 2012 by grouping the departments of Economy,
Employment, and Sustainable Development into a single ministry.
To implement these reforms, the following actions are recommended:
Adapt the education system to the needs of the economy: the challenges of education
reform in order to resolve the “training-employment match” issue are twofold: operationalizing
the framework law on education and establishing a system of training courses leading to a
qualification based on the needs of the productive sector.
3. The pragmatic and rapid operationalization of the provisions of law 21/2011 on the overall
orientation of Education, Training, and Research is the government’s long-term challenge. This
will involve (i) better programming to improve the management of school enrolments and reduce
repeater and dropping out rates, (ii) improve the material conditions of teaching, and (iii) reinforce
the capacity and motivation of staff. These reforms can hardly be achieved without an increase in
budget allocation for education and improving efficiency of the allocations within the sector. A
detailed analysis of the cross-sectoral allocations, and investigative follow-up of the education
expenses, and an organizational and performance audit of the ministry of National education and
vocational training could help with the development of a sequenced plan to operationalize the
general framework law adopted in 2011.
4. In the short-term, the government’s main challenge is to incorporate the training
experiences based on the actual demand of the labor market (i.e. the current and future needs of
companies) into the current practice of technical education and vocational training so as to design
and develop programs and train the instructors and the learners. To this end, an assessment of
professional qualifications needs must be undertaken as soon as possible in the key priority areas
of the Strategic Plan for an Emerging Gabon (PSGE) and a system of short-term and adaptable
training courses leading to a qualification must be organized in collaboration with the private
sector based on the current experiences, such as those of the Institute of Oil and Gas in Port-Gentil
and the partnership between ONE, Comilog, and the training and professional development center

72
in Franceville.
5. It also seems urgent to secure funding for vocational and technical education in order to
increase the coverage of this type of education. For this purpose, the creation of a National Fund
for Training and Professional Development (FNFPP) is recommended. The Fund would have its
own legal personality and financial independence, and be financed by the vocational training tax,
donor funding, and other contributions from the government, including funds currently allocated
to the Professional Integration Fund (FIR). In order to address the reluctance of private sector
operators to pay the business tax created in 2000 with a viewto supporting vocational education,
it is recommended that the private sector and the government co-manage this fund. It is also
recommended that the private sector be included in defining the national education policy,
especially the National Council on Education, Training, and Research (CNEFOR) as provided in
law 21/2001 on the overall orientation of education, training, and research.
Strengthen institutional support to the private sector
6. Undertaking key reforms to significantly improve the investment climate requires
permanent high-level dialogue between the public and private sectors and a clarification of the
roles within the private sector support system.
7. The dialogue between the government and the private sector could be formalized by the
establishment of a Presidential Investment Council (PIC), a body provided under the PSGE. This
body would be responsible for high-level dialogue between the public and private sectors on
reforms to facilitate business. The PIC would be an advisory body comprised of representatives of
the private sector, the government, and workers -chosen for their competence, experience, and
integrity –who would meet once or twice a year with the Head of State as chairman, along with the
ministers concerned, with the aim of defining and assessing reforms. A small team of senior
experts would organize the process for the implementation and assessment of such reforms .
Topic-specific working groups comprised of experts from the private sector and administrations
would diagnose problems, conduct required studies, and recommend reform projects. These
reforms would then be submitted to the PIC during their biannual meetings for consideration and
decision. The implementation, by the government, of the reforms adopted would be carried out
under the supervision of a monitoring committee under the authority of the Prime Minister or the
Secretary General of the government.
8. It also seems useful to clarify the roles and build the operational capacities of organizations
supporting development of the private sector as follows: (i) focus the action of the Center for the
Development of Enterprises (CDE) on the one-stop shop for the administrative formalities of
business creation and (ii) consolidate the functions of information on business opportunities,
studies, and support and advisory services to SMEs and the promotion of investment within the
Chamber of Commerce and (iii) specialize the Investment and Export Promotion Agency (APIEX)
in export promotion and the research of international investors. Eventually, once these three
entities have acquired proven experience in their respective responsibilities, they could be grouped
into a single institution.
73
Relax labor laws and reform the social security system
9. Relaxing labor laws would mainly consist in reducing the time required to obtain the
administrative authorization for dismissal as well as reducing the level of compensation for
economic lay-offs that should be set according to the financial capabilities of the enterprises in
difficulty. The provisions on the employment of foreign workers that impose a 10 percent limit of
foreign workers per company and require evidence proving that there are no Gabonese workers
available for open positions are anachronistic compared to the current market situation
characterized by a substantial deficit in national skilled labor. Rather than general provisions,
the foreign workers quota should be discussed and defined by sector in order to take their
specific situations in account. It also seems necessary to liberalize the job placement
function.
10. Regarding the social security system reform, the system’s structural deficits suggest that
two distinct actuarial studies of CNSS and CNAMGS should be conducted. These would enable a
review of the parameters of each fund, the funding method, and the rebalancing of powers in the
governance bodies. This work would be the basis for updating the Social Security Code, which
provisions from 1962 are now obsolete.
Strengthen the institutional framework of employment promotion
11. The Gabonese experience is characterized by an overall positive growth over a long period,
and an increase in unemployment confirms that the relationship between economic growth and job
creation is not automatic; and that it is necessary to have an employment policy that generate
conditions for a quality job-creating growth. It is therefore necessary that the national employment
policy (which is being developed) is defined consistently within the PSGE objectives and in
consultation with the private sector and workers. The recommendations discussed earlier and
related to education and vocational training, improving the investment climate and social
legislation could contribute to the development of this policy.
12. The implementation of this policy will require further reforms of the institutional
framework, which began as a merger between the departments of economy and employment. Such
restructuring would require both an organizational audit and an audit on the capacities of the
existing institutions and services in order to clarify their respective roles and assess the
appropriateness to maintain them and identify the needs of new services or institutions. The
organizational audit would also allow defining a program for capacity building within all of these
services and institutions.
13. Monitoring and assessing the national employment policy requires the establishment of a
labor market information system. A first step to this endcould be to establish a computerized
database within the ministry responsible for employment on education, vocational training, and
employment from the data provided by the ONE, the NSSF, the labor inspectorates, the
Directorate General for Taxes, the Directorate General for StatisticsDGS, and systematic
enterprises surveys.

74
Appendix1: List of skills needed to implement the PSGE mining projects
Skilled laborers Building, structural work, and finishing
Finishing masonry
Workers qualified in civil engineering:
Concrete formwork specialist
Façade specialist
Building painter
Plumber
Civil engineering, road and railway
Mobile crane driver
Excavator and backhoe loader driver
Scaffolding assembler
Metal construction
Lifting assembler
Welded construction assembler
Electrical equipment
Industrial equipment electrician
Building electrician
Aero-underground electrical network
assembler
Wiring assembly electrician
Yard machine repair mechanic
Logistics and transport
Heavy vehicle driver
Light vehicle driver
Metal processing
Industrial pipe-fitter
Boilermaker
Industrial sheet-metal insulator
Coated electrical arc and TIG welder
Semi-automatic MIG MAG and flux-cored
welder
Refrigeration and air-conditioning
Refrigeration and air-conditioning repairman
Vehicle and engine repair
Maintenance mechanic foreman
Automobile mechanic
Technicians and senior
technicians
Building, structural work, and finishing
Structural work team leader
Building and civil engineering quality surveyor
Concrete mixer plant driver
Finishing team leader
Drywall worker
Tiler
Civil engineering, road and railways
Civil engineering team leader
Civil engineering quality surveyor
Senior technician of metal construction studies
Wood
Carpenter, wood-setter
Carpenter, layout
Electrical equipment
Refrigeration and air-conditioning
Air-conditioning intervention and maintenance
technician
Vehicle and engine repairman
Auto body mechanic repairman
Automobile electrician
Railway equipment mechanic repairman
Heavy vehicle mechanic repairman
Thermal motor and mechanism reconstruction
technician
Automobile electrician
Railway equipment mechanic repairman
Logistics and transport
lift truck operator-warehouseman
Store clerk
Railway engine driver
Industrial production
Team leader of operators

75
Electrical engineering consultants technician
Metal processing
Technician of boiler making studies and
industrial piping
Specialists These consist of skills mobilized at any given
moment in limited quantities. The trades to be
researched will be grouped into eight sectors.
Building, structural work, and finishing
Foreman and building engineer
Structural work project manager
Building study technician
Industrial heat builder (fire bricks)
Tower crane driver
Plasterer
Civil engineering, roads and railways
Foreman and civil engineer
Civil engineering site manager
Profiling engine driver (grader)
Metal construction
Scaffolding team leader
Wood
Automated saw, sharpener driver
Cabinet-maker
Metal processing
Chief engineer of boiler making and industrial
piping
Welding technician
NDT technician
Milling setter-operator
Lathe setter-operator
Logistics and transport
Transport logistics senior technician
Industrial production
Industrial production unit foreman
Mine site operation foreman
Geologist
Mine site foreman
Source: Ministry of Mines and Industry
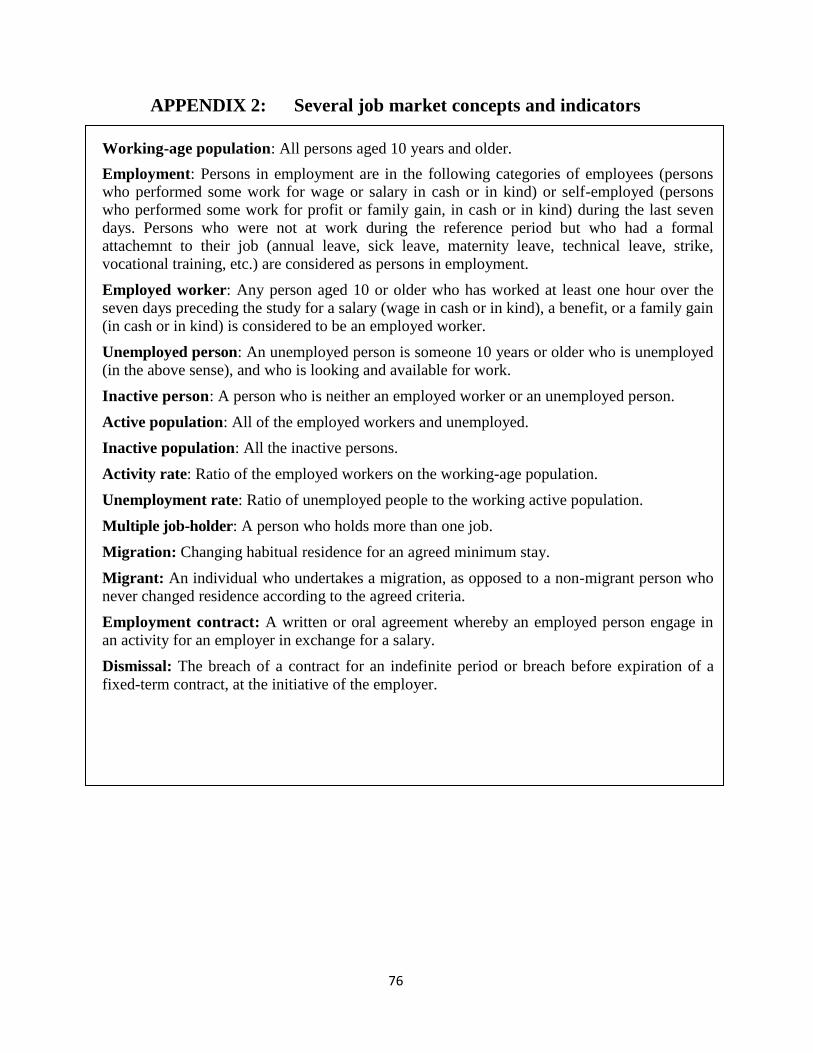
76
APPENDIX 2: Several job market concepts and indicators
Working-age population: All persons aged 10 years and older.
Employment: Persons in employment are in the following categories of employees (persons who performed some work for wage or salary in cash or in kind) or self-employed (persons who performed some work for profit or family gain, in cash or in kind) during the last seven days. Persons who were not at work during the reference period but who had a formal attachemnt to their job (annual leave, sick leave, maternity leave, technical leave, strike, vocational training, etc.) are considered as persons in employment.
Employed worker: Any person aged 10 or older who has worked at least one hour over the seven days preceding the study for a salary (wage in cash or in kind), a benefit, or a family gain (in cash or in kind) is considered to be an employed worker.
Unemployed person: An unemployed person is someone 10 years or older who is unemployed (in the above sense), and who is looking and available for work.
Inactive person: A person who is neither an employed worker or an unemployed person.
Active population: All of the employed workers and unemployed.
Inactive population: All the inactive persons.
Activity rate: Ratio of the employed workers on the working-age population.
Unemployment rate: Ratio of unemployed people to the working active population.
Multiple job-holder: A person who holds more than one job.
Migration: Changing habitual residence for an agreed minimum stay.
Migrant: An individual who undertakes a migration, as opposed to a non-migrant person who never changed residence according to the agreed criteria.
Employment contract: A written or oral agreement whereby an employed person engage in an activity for an employer in exchange for a salary.
Dismissal: The breach of a contract for an indefinite period or breach before expiration of a
fixed-term contract, at the initiative of the employer.

77
REFERENCES
1. French Development Agency (AFD), Rapport d’état du système éducatif gabonais, April 2012.
2. African Development Bank, African Development Fund, Gabonese Republic. Etude sur la
diversification des sources de la croissance économique, novembre2008.
3. African Development Bank (ADB) Gabonese Republic. Etude économique et sectorielle
développement du secteur privée, 2010.
4. World Bank, Republic of Congo (2011): Etude sur la croissance et l’emploi: de la croissance
sans emploi à la croissance inclusive. Département Réduction de la Pauvreté et Gestion
Economique 3; Région Afrique
5. World Bank. La pauvreté dans une économie de rente. Report on Gabon, volume: Summary;
volume 2: Main report, March 19th
1997.
6. Barro Chambrier, Alexandre. L’économie du Gabon: analyse des politiques d’ajustement et
d’adaptation. Economica, Paris, 1990.
7. International du Labor Office (ILO), Mohammed Bensaïd (coordinator), Aomar Ibourk,
Ayache Khellaf, Évaluation des emplois générés dans le cadre du Document de Stratégie de
Croissance et de Réduction de la Pauvreté au Gabon, Employment Sector Working Paper No.
80 on Employment.
8. Djima Moussiliou Moustapha. Education et Insertion des jeunes et des femmes sur le marché
du travail au Gabon, World Bank, June 2012.
9. C. Maldonado, B. Gaufryauet other authors, L’Economie informelle en Afrique francophone,
structure, dynamique et politique, International Labor Office, Geneva, 2001.
10. Djima Moussilou, Education et Insertion des jeunes et des femmes sur le marché du travail au
Gabon, Note préparée pour le compte de la Banque mondiale, juin 2012.
11. Etienne Nsie, Législation du travail, système de protection sociale des travailleurs et politiques
de promotion de l’emploi au Gabon, Note préparée pour le compte de la Banque mondiale, juin
2012.
12. Katy Hull, Understanding the Relationship between Economic Growth, Employment and
Poverty Reduction, World Bank.
13. Kuépié, M. et Nordman, C.(2011): Éducation et marchés du travail à Brazzaville et Pointe
Noire (Congo-Brazzaville);
14. Ministry of Development, Public Performance, Prospective and Statistics, Gabonese Republic,
Directorate General of Statistics and Economic Studies, Annuaire statistique du Gabon 2001-
2007, N°11– juillet 2009.
15. Ministry of Economy, Employment, and Sustainable Development. L’emploi, le chômage et
les conditions d’activités au Gabon, premiers résultats de l’enquête nationale sur l’emploi et
le chômage, Rapport principal, Avril2012.
16. Ministry of Economy, Finances, Budget, and Privatization. Tableaux de bord de l’économie de
1981 à 2001.
17. Ministry of Economy, Commerce, Industry and Tourism, Gabonese Republic, Directorate

78
General of Statistics, Annuaire statistique du Gabon 2004-2008 n° 12-juin 2010.
18. Ministry of Economy, Trade, Industry and Tourism, Gabonese Republic, Compte satellite du
tourisme 2008-2010
19. Ministry of Planning and Regional Development, Recensement général de la population et de
l’habitat du 1er
au31 juillet 1993: principaux résultats, July 1995.
20. Gabonese Republic, Ministry of Family, the Promotion of Women, and Protection of Widows
and Orphans (2005), Stratégie nationale d’égalité et d’équité de genre.
21. National Employment Office, Rapport d’activités 1999, March2000.
22. Audit Comptable et tarifaire, financier, technique de la convention de concession avec la
Société d’Energie et d’Eau du Gabon (SEEG), Ministère de l’Énergie et des Ressources
hydrauliques. Synthèse des contrats et recommandation (sub-mission F), January 15th
2011
23. Secretariat General, UPDEA, Etude comparative des tarifs d’électricité pratiquée en Afrique,
December2009

79