report on a vehicle - california replacement... · 30/05/2016 · for their cooperation and...
TRANSCRIPT

Report on a
Vehicle Replacement Methodology
for the
May 30, 2016
MERCURY ASSOCIATES, INC.

Mercury Associates, Inc. 7361 Calhoun Place, Suite 680 ● Rockville, MD 20855 ● 301 519 0535
May 30, 2016 Mrs. Renee Carroll, Assistant Chief Office of Fleet and Asset Management Department of General Services 1700 National Drive Sacramento, CA 95834 Dear Mrs. Carroll: Mercury Associates, Inc. is pleased to submit this draft report on our study of fleet replacement practices and costs in the State of California. We would like to express our appreciation to you and your staff in the Department of General Services, and to the officials and employees of the many other State agencies who participated in this study for their cooperation and assistance to our project team. We appreciate having been given the opportunity to assist California in this endeavor and look forward to continuing to work with the State to improve its fleet management practices, performance and cost effectiveness. Very truly yours, Randy Owen Senior Vice-President

Report on a Vehicle Replacement Methodology
TABLE OF CONTENTS EXECUTIVE SUMMARY ................................................................................................. 1
INTRODUCTION ............................................................................................................. 9
BACKGROUND ........................................................................................................ 9
OBJECTIVE ............................................................................................................ 11
PRINCIPLES OF VEHICLE REPLACEMENT COST ANALYSIS ................................. 11
FLEET REPLACEMENT ......................................................................................... 13
STUDY DATA ............................................................................................................... 17
OPTIMAL VEHICLE REPLACEMENT CYCLE ANALYSIS ........................................... 18
REPLACEMENT CYCLE ANALYSIS METHODOLOGY ........................................ 18
REGRESSION ANALYSIS ..................................................................................... 20
REPLACEMENT CYCLE ANALYSIS RESULTS .................................................... 22
FLEET-WIDE REPLACEMENT COSTS ....................................................................... 30
BASELINE RENEWAL FLEET REPLACEMENT PLAN ......................................... 31
SMOOTH RENEWAL PLAN ................................................................................... 34
ZEV RENEWAL PLAN ............................................................................................ 36
STATUS QUO REPLACEMENT PLAN .................................................................. 38
THE ECONOMIC IMPACTS OF FLEET MODERNIZATION ........................................ 41
PROJECTING FUTURE COSTS ............................................................................ 41
FLEET COSTS UNDER STATUS QUO REPLACEMENT VERSUS MODERNIZATION .................................................................................................. 42
FINANCING FLEET MODERNIZATION COSTS .................................................... 48
RECOMMENDATIONS ................................................................................................. 49
INVESTIGATE ALTERNATIVE CAPITAL FINANCING STRATEGIES ................... 49
REFINE MODERNIZATION PLANS ....................................................................... 50
DEVELOP IMPLEMENTATION PLANS ................................................................. 50
DEVELOP PLANS FOR TRUCKS AND OFF-ROAD EQUIPMENT ....................... 50
APPENDIX .................................................................................................................... 52

Report on a Vehicle Replacement Methodology
1
EXECUTIVE SUMMARY
This report presents the results of Mercury Associates, Inc.’s analysis of the costs and cost savings opportunities associated with modernizing the vehicle fleet of the State of California1. The State has been unable to allocate enough money to replace its vehicles over the past decade or so. This has resulted in a fleet whose average age of 11.2 years is much higher than optimal and a backlog of replacement spending needs that we estimate to be $605 million in FY 2017, when optimal replacement cycles we developed as part of this project are used. In comparison to a younger fleet whose assets are replaced in a consistently timely manner, an old fleet typically has higher operating costs, notably maintenance and repair, costs; lower residual values (when assets are sold at the end of their lives); and poorer asset availability and reliability and, hence, employee productivity. For these reasons, an increase in fleet replacement spending aimed at modernizing a fleet often is essential for achieving an overall reduction in fleet costs, which, in turn, increases the availability of funds to support an organization’s primary mission. The goal of this report is to show the State of California that this is precisely the situation confronting its fleet; that is, that embarking upon a fleet modernization program is an investment that will more than pay for itself over time. The report discusses three key elements of the development and implementation of an effective fleet modernization and ongoing replacement program and their application to the State’s fleet:
• The determination of optimal replacement cycles for key types of assets in a fleet, where “optimal” is defined as the best cycle or service life for minimizing the total cost of ownership of a given type or class of assets;
• The development of several long-term replacement plans that quantify future fleet replacement costs; and
• The development of a business case justification for modernizing a fleet that quantifies the cost savings that can be realized from such an initiative in comparison to the costs of not modernizing it.
Replacement Cycles
We calculated optimal replacement cycles for nine key types of vehicles in the State’s fleet using quantitative life cycle cost analysis techniques. These nine classes covered two-thirds of the vehicles in the study fleet. Results were then applied to similar types of vehicles in the fleet to develop a set of fleet-wide replacement criteria. In general, we found that the State’s existing replacement cycles to be longer than peer organizations and much longer than optimal (and it should be noted that the State has
1 Note that this study covered mostly the automotive fleet and included some highway rated trucks as well. Vocational trucks and off-road equipment were not included in the study.

Report on a Vehicle Replacement Methodology
2
not appropriated enough funds to follow these longer cycles anyway, which has greatly contributed to the advanced age of the fleet). The average existing replacement cycle for vehicle classes analyzed is 12 years and 128,000 miles. Based on our life cycle analysis, the average cycles we recommend are significantly less at 6 years and 78,000 miles. Our analysis shows that using the recommended rather than existing cycles would save the State $14 million per year through a combination of lower repair and fuel costs, and much higher revenues when the vehicles are sold at the end of their shorter life cycles (please see Exhibit 4 in the report for details on projected savings). Replacement Plans
The fleet-wide replacement criteria we developed were used to develop a series of ten-year replacement plans designed to quantify future fleet replacement funding requirements under a variety of scenarios. The most important of these plans are the Status Quo Replacement Plan (which forecasts future fleet replacements if the State did nothing and kept its existing replacement cycles and historic funding levels in place) and the ZEV Renewal Replacement Plan (which forecasts replacements using our recommended optimal replacement cycles as well as increasing the number of zero emission and hybrid vehicles in the fleet). The 27,812 vehicles included in this study have a total replacement value of $792 million. To follow its existing replacement criteria, the State would have to spend on average around $66 million per year to renew its fleet. However, average annual funding for fleet replacement has been $27.5 million over the past six years. As a result, a backlog in funding requirements totaling $486 million has developed. If the State continues to under-fund replacement of vehicles over the next ten years, the backlog in funding needs will grow to $840 million by 2027. And again, these numbers are associated with the longer than optimal existing replacement cycles that produce higher than necessary repair costs, fuel costs, and greenhouse gas emissions (as we will discuss in more detail below). The ZEV Renewal plan was developed with the following goals:
1. Forecast annual funding requirements to implement our recommended fleet replacement cycles;
2. Eliminate the backlog in funding over a 10-year period; 3. Include funds for zero-emission and hybrid vehicles to meet current mandates;
and 4. To the extent possible smooth annual funding requirements to eliminate wide
swings in budget needs. Implementation of the ZEV Renewal plan would require significantly higher capital budgets than amounts the State historical allocated to replacing vehicles (i.e. and

Report on a Vehicle Replacement Methodology
3
average of $27.5 million per year) or the amount it should be budgeting to follow existing replacement criteria (i.e. $66 million per year). The chart below shows amounts needed in each of the next ten years to fund the ZEV Renewal plan (including eliminating the current backlog in funding requirements and budgeting $54 million to fund the increased capital cost of zero emission vehicles).
Exhibit ES-1 ZEV Renewal Plan
The following exhibit provides a comparison of funding requirements and units replaced over a 10-year period for the Status Quo and ZEV Renewal plans.
Exhibit ES-2 Comparison of Status Quo and ZEV Renewal Replacement Plan Costs
Fiscal Year Assets Replaced Cost (Millions)
Status Quo ZEV Status Quo ZEV Units
Replaced/Capital Funding
7,518 49,727 $270.34
$1,688.31
Exhibit ES-3 shows the average age of the State Fleet under the Status Quo and ZEV Renewal plans. Note that the age of the fleet increases each year under the Status Quo
$164 $165 $165 $158 $152 $152
$206
$171 $178 $178
$0
$50
$100
$150
$200
$250
2017 2018 2019 2020 2021 2022 2023 2024 2025 2026
(Mill
ions
)
Fiscal Year

Report on a Vehicle Replacement Methodology
4
plan. This is because historic funding levels have not been sufficient to follow the States existing replacement cycles – even though these cycles are very long when compared to common industry practices. Moreover, the Status Quo plan does nothing to address the large backlog in replacement funding requirements that have built up over the past decade.
Exhibit ES-3 Comparison of Status Quo and ZEV Renewal Replacement Plans
Fiscal Year Average Age (Yrs)
Status Quo ZEV Renewal 2017 10.7 7.4 2018 10.9 5.4 2019 11.2 3.9 2020 11.6 3.0 2021 12.3 2.5 2022 12.7 2.5 2023 13.3 2.6 2024 13.8 2.7 2025 14.7 2.7 2026 15.3 2.8
It is difficult to assess the merits of fleet renewal in general and the ZEV Plan in particular in a vacuum. Clearly, it is predicated on replacing fleet assets more quickly than at present – every 5.9 years, on average, versus the current average replacement cycle of 12 years. This means that modernization will require a substantial (600-percent) increase in average annual fleet replacement expenditures relative to the $27.5 million per year that the State has spent on average over the past six years. In the body of our report we provide a detailed discussion of the principles of optimal vehicle replacement and the fundamental trade-off that exists between vehicle capital and operating costs. The results of the optimal replacement cycle analyses we conducted quantified these trade-offs. When an organization spends less than it should on fleet replacement (i.e., capital) costs, this usually results in higher than necessary fleet operating costs. Conversely, an increase in replacement spending typically leads to a reduction in operating costs. Rather than ask California to take our word for it that the ZEV Renewal Plan will actually save money, we forecasted total cost of ownership for the fleet under the Status Quo and ZEV Renewal plans, the results of which are described in the next section of this executive summary.

Report on a Vehicle Replacement Methodology
5
Economic Impacts of Fleet Renewal
Based on the principles of optimal vehicle replacement discussed in this report, we have reason to believe that when all significant vehicle costs are taken into account, the total cost of the State’s fleet can indeed be reduced by replacing vehicles more frequently. In order to test this hypothesis, we estimated future fleet capital and operating costs under the Status QWuo and ZEV Renewal plans and compared them with one another. Making this comparison entailed estimating the three major components of any fleet’s direct total cost of ownership (TCO): vehicle capital, maintenance and repair, and fuel costs. We also included GHG costs as described in the body of this report. We estimated the TCO over a 10-year period under each fleet replacement strategy in both economic and fiscal terms. For the purposes of the economic analysis, the annual capital cost of a vehicle or piece of equipment is defined as the change in its fair market value (FMV) from one year to the next. Many people use the term “depreciation” to describe this cost as a vehicle ages, although depreciation, technically speaking, is an accounting activity, not a type of cost. Another way to think of a vehicle’s capital cost is in terms of the diminishment of its tangible value as an asset that can be sold over time. We used regression equations developed for a number of broad categories of assets in the State’s fleet, derived from past research we have conducted in this area, to estimate the capital cost of each asset in the fleet in each year of the 10-year analysis period. For the fiscal impact analyses performed in this study, we define an asset’s capital cost as the amount of cash that needs to be spent to acquire it minus the amount of cash received when it is sold, usually many years later.2 We estimated asset purchase prices using the asset class-based replacement planning parameters described earlier and an annual purchase price inflation factor of three percent. We estimated used asset sales proceeds using different FMV regression equations for the different types of fleet assets in the fleet. As discussed in the body of the report, we performed statistical analysis of the State’s asset maintenance and repair cost data in order to develop regression equations for predicting changes in annual vehicle maintenance and repair and costs as a function of changes in vehicle age, usage, and original purchase price, for a number of broad categories of assets. We also included the cost of greenhouse gas emissions (GHG) by calculating the number of tons of GHG produced using a factor of 24 lbs. per gallon and dividing by 2,000 to convert to tons (source is the Energy Information Administration, an arm of the United States Department of Energy). Then the GHG cost was calculated using a cost of $14.46 per ton of GHG produced. The cost per ton was obtained from the California Carbon Dashboard. 2 Obviously, this definition of asset capital cost presumes that these costs are financed through the outright purchase of asset with cash paid up front. It is important to note that this type of capital financing method produces fiscal impacts that are far different in each year of an asset’s life than those associated with some other capital financing methods, such as leasing and debt financing.

Report on a Vehicle Replacement Methodology
6
Exhibits ES-4 and ES-5 summarize our comparison of these two fleet replacement scenarios, while Exhibits 20 and 21 in the body of the report provide a detailed view of the total cost of ownership of the fleet over the next 10 years under the Status Quo and ZEV Renewal replacement plans, respectively. The economic TCO, shown in present value terms in Row 14 of Exhibit 20, is $2,116 million under the Status Quo plan and $1,924 million under the ZEV Renewal plan. To fairly compare the two plans, the fair market value of the fleet at the end of Year 10 must also be considered (the value of these assets is akin to money in the bank). Specifically, the FMV of the fleet at the end of Year 10 is subtracted from the economic TCO to calculate the net economic TCO. Thus, in economic terms, the ZEV Renewal strategy produces net savings in the total cost of ownership of the fleet of $444 million in the first 10 years. These cost savings can most easily be seen in Exhibit ES-4.
Exhibit ES-4 Economic Impacts of ZEV Renewal Plan (millions in 2017 dollars)
Ten-Year Economic Savings/(Costs) from Modernization
Fiscal Year 2017 2018 2019 2020 2021 2022 2023 2024 2025 2026 Total Savings/(Costs) in
Gross TCO from Modernization
($27) ($8) $4 $14 $25 $29 $23 $35 $39 $47 $181
Increase/(Decrease) in FMV from
Modernization $71 $134 $182 $216 $233 $232 $238 $241 $249 $253
Savings/(Costs) in Net TCO from
Modernization $439
Savings/(Costs) as a Percentage of Status
Quo Costs 27.7%
The next exhibit shows our fiscal analysis of modernizing the State’s fleet:

Report on a Vehicle Replacement Methodology
7
Exhibit ES-5 Fiscal Impacts of ZEV Renewal (millions of 2017 dollars)
Ten-Year Fiscal Savings/(Costs) from ZEV Smooth Renewal
Fiscal Year 2017 2018 2019 2020 2021 2022 2023 2024 2025 2026 Total
Savings/(Costs) in Gross TCO from
Modernization ($99) ($74) ($49) ($26) $0 $21 ($4) $21 $23 $32 ($156)
Increase/(Decrease) in FMV from
Modernization $71 $135 $184 $219 $237 $238 $243 $245 $253 $258
Savings/(Costs) in Net TCO from
Modernization $102
Savings/(Costs) in Net TCO from
Modernization $4 5.4%44
While fiscal TCO analysis represents the fiscal reality that the State faces if it chooses to finance the replacement costs of its fleet through the outright purchase of assets with cash, it does not provide a true apples-to-apples comparison of the costs of owning and operating the fleet under the two replacement scenarios. We have shown clearly in the optimal fleet replacement plan section and our economic impact analysis above, that the long run costs associated with modernization are less than those of the status quo. The difference in result produced by the fiscal impact perspective is due to the fact that asset replacement costs are misaligned with the economic benefits they produce. This is because cash purchase financing requires that fleet assets be paid for (in fiscal terms) before they are used, while the operating cost savings (again, in fiscal terms) of modernizing these assets are only realized over a period of several years. In addition, the 10-year view depicts the costs of moving from an old to a new fleet, which requires replacing a large number of vehicles due to the current backlog. Nevertheless, the numbers indicate that the modernization of the State fleet not only is attractive even under the most conservative of capital financing approaches (outright cash purchase), but within the realm of affordability. In fiscal terms, the State could modernize its fleet by spending only 7.5 percent more than it is projected to spend under the Status Quo scenario (a $156 million increase in direct cash expenditures over ten years). As previously noted, this is without considering the significant rise in the value of fleet assets. Perhaps most importantly, if the State does not spend this additional amount to modernize its fleet, its total fleet replacement-spending requirement will grow each year as the backlog in replacement funding increases. In short, part of the additional $156 million cost of modernizing the fleet is to eliminate the current backlog rather than leaving it for future decision makers to deal with. Finally, it is important to note that the ZEV Renewal plan results in a fleet that is younger, cheaper to operate, worth more, produces lower GHG emissions, and requires less employee productive time to manage and operate. The savings in indirect costs such as improved fleet reliability, employee productivity, and safety are not quantified here, but clearly would provide additional benefits to the State.

Report on a Vehicle Replacement Methodology
8
Recommendations
We are confident that our analysis has demonstrated that it is overwhelming in California’s best interests to modernize its fleet – which is our primary recommendation to the State. Our other recommendations resulting from this analysis for the State are as follows: • Investigate Alternative Financing Strategies In our experience, no organization will modernize its fleet unless it believes it can afford to do so; that is, that it can commit the cash (regardless of where the cash comes from) to increase the level of spending on fleet replacement purchases. This usually requires developing an understanding of why the organization has not been willing to make such spending commitments in the past and whether a change in financing approach is needed to make it acceptable to spend more on fleet replacement. While quantifying the costs and benefits of potential capital financing methods was beyond the scope of this study, our experience indicates that leasing vehicles would be slightly more expensive in both economic and fiscal terms than would be debt financing (while both approaches would be more affordable than cash purchase financing in fiscal terms) over the next 10 years. It is important to keep in mind that investigating, let alone changing, capital financing methods is not an all-or-nothing proposition. The State could conduct a variety of pilot projects aimed at better understanding the benefits and costs of the different financing methods touched on in this report, and/or the merits of using a single alternative financing approach for certain types of fleet assets or for certain components of the fleet. • Refine Modernization Plans The plans described in this report were developed for the purpose of exploring the costs and benefits of alternative fleet replacement strategies. Annual spending allocations were developed to illustrate required budget levels. However, the ZEV renewal plan will need refinement to align with the specific operational needs of each State agency. For instance, the modernization plan was developed using algorithms that program the oldest assets in the fleet for replacement first, irrespective of their condition, mission criticality, and current level of use. Once the State has determined the funding level it is willing to allocate to replacing its aged fleet, additional work will be required to modify the ZEV Renewal plan to fit this funding. Additional work will also be required to identify the highest priority vehicles to actually be replaced once funding levels have been established. • Develop Implementation Plans The majority of State agencies utilize commercial service providers for the maintenance and repair of their vehicles. This means that they would be able to immediately start realizing vehicle operating costs savings resulting from fleet modernization. However, it

Report on a Vehicle Replacement Methodology
9
must be remembered that for some of the largest fleets in the State, such as those of Caltrans and CHP, a large part of the operating cost savings associated with modernization would come from reductions in fleet maintenance and repair resource requirements – that is, parts, sublet repair services, personnel, facilities, and equipment. These cost savings will not be realized if State agencies do not have a plan for managing these resources in concert with changes in the age of the fleet. By the same token, the modernization of the fleet will confront the State’s in-house maintenance programs with new challenges as thousands of new vehicles with modern equipment design and engineering are added to the fleet on a scale to which perhaps only CHP is accustomed. This will require more maintenance technician and operator training and, possibly, modifications to maintenance facilities and equipment. Effectively managing and realizing the benefits of the modernization of the fleet will require data based decision making, the use of robust computerized fleet management information systems and the day-to-day development and use of quantitative information. While the State has made positive steps in this direction with the creation of a statewide fleet data warehouse, much remains to be done. Based on our experience in assembling data for the conduct of this study and the previous fleet rightsizing study, several State agencies do not appear to currently possess the systems, data, and/or data analysis capabilities required to move all fleet-related decision making to an objective, data-centered model. • Develop Plans for Trucks and Off-road Equipment
This report addresses largely the light duty state fleet, with some highway rated trucks included in the scope of the project. In total, approximately fifty-five percent of the State’s fleet was included in our analysis. Vocational trucks and off-road equipment should also be assessed for the benefits of modernization. In our experience, since the unit costs of trucks and construction equipment are generally much higher than cars and pickups, the economic case for modernization of these assets can be very compelling. The State should conduct similar studies of the heavy-duty and equipment segments of its fleet to determine optimal replacement cycles and document required funding levels to produce the lowest total cost of ownership.
INTRODUCTION
BACKGROUND
The government of the State of California (State) provides a broad variety of services to 39 million residents. Many different agencies employ more than 200,000 staff to perform a wide range of functions and operations. The State currently owns a fleet of over 27,000 highway rated light duty3, medium duty and heavy duty passenger vehicles, 3 Light duty is defined as a vehicle with a gross vehicle weight rating (GVWR) of less than 8,500 lbs. Medium duty is defined as a vehicle with a GVWR of 8,501 - 26,000 lbs. Heavy duty is defined as a

Report on a Vehicle Replacement Methodology
10
vans and sport utility vehicles (SUV) to support the activities of these agencies. For the purpose of this report, the assets analyzed will be referred to as the “State Fleet.”) State agencies with the largest number of assets include the Departments of Transportation, the Department of Corrections and Rehabilitation, the Department of Parks and Recreation, and the Department of General Services. Dozens of other departments operate smaller fleets (i.e. less than 100 units) that are, albeit relatively small in size, no less important to the delivery of essential services to the residents of California. The table below shows departments with the largest number of assets included in this study:
Department Number of Vehicles
California Highway Patrol 1,317 Department of Corrections and Rehabilitation 3,285 Department of Fish and Wildlife 1,435 Department of Forestry and Fire Protection 1,565 Department of General Services 2,401 Department of Parks and Recreation 1,881 Department of Transportation 9,642 Department of Water Resources 917 Others 5,369 Total 27,8124
State departments under the Governor’s Executive Authority must adhere to policy and procedural guidelines as set forth by the Department of General Services (DGS), Office of Fleet and Asset Management (OFAM) as the oversight body. Additionally, departments must also follow various State regulations, Executive Orders, and federal requirements. Constitutional Offices and departments not under the Governor’s authority are not required to follow the above requirements, but may choose to voluntarily comply with the policy and procedures, regulations, Executive Orders and federal requirements mentioned above. As the oversight entity, OFAM coordinates the vehicle replacement program by promulgating rules and processes. During the recent economic downturn the State was unable to allocate much funding to replace vehicles. With an improved fiscal climate, DGS decided that a review of the State’s practices in the area of replacing its vehicles was in order. Accordingly, DGS contracted with Mercury Associates, Inc., a fleet management-consulting firm, to develop an optimized vehicle replacement methodology based on industry best practices and sound economic principles. This project was accomplished in a highly participatory manner with dozens of departments spending hundreds of staff hours to
vehicle with a GVWR of 26,001 lbs. or greater. The total fleet size is over 50,000 assets when including all heavy duty trucks and pieces of equipment. 4 This number represents a point in time and can fluctuate daily.

Report on a Vehicle Replacement Methodology
11
assemble the data required to conduct the analysis, participate in project steering team meetings, and provide comments on draft deliverables. Mercury has completed several projects for the State in the past. Our most recent project was completed in 2011 and involved the development of a Vehicle Allocation Methodology (VAM) to enable the State to eliminate unneeded vehicles from the fleet. This project enabled the State to eliminate approximately 7,000 mobile assets from the fleet and produced millions of dollars in one-time and recurring savings. Mercury pioneered the VAM approach to fleet rightsizing for the federal government in response to an executive order by President George W. Bush. All federal agencies are required to complete VAM studies and updates on an annual basis. OBJECTIVE
The objective of this study was to develop optimal replacement cycles based on an analysis of life-cycle costs for key State Fleet vehicle types, and to quantify the replacement costs of the State Fleet for the purposes of: 1) determining the extent to which any backlog of fleet replacement spending needs may exist; 2) identifying the average amount of money the State should expect to spend on the purchase of vehicles each year if these assets are to be replaced in a reasonably timely manner; and 3) identifying the impact of any recommended change in fleet replacement spending levels on the direct total cost of ownership (TCO) of the assets in the fleet. These objectives imply an important, overarching fleet management goal for the State: replacing its fleet assets in a timely manner. In our experience, achieving this goal is one of the most important things any organization can do to control the costs and performance of its fleet.
PRINCIPLES OF VEHICLE REPLACEMENT COST ANALYSIS
Before presenting the results of our analysis, it is useful to provide definitions for some key concepts and terms used in this report and to review the major elements of an effective fleet replacement program, as they provide the “philosophical” framework for analyzing the soundness of any organization’s fleet replacement practices Economic analysis provides a systematic approach for studying the allocation of resources to achieve an organization's objectives. In this report, economic analyses are employed to determine optimal vehicle replacement cycles and as one of two methods of examining the total cost of ownership of the State’s fleets. In performing these analyses, we focused on the two major cost components for any vehicle or fleet: capital cost and operating cost. These costs are defined as follows.
Capital costs are costs that are incurred to acquire and possess a vehicle or piece of equipment. They may be, but are not necessarily, ownership costs, since a vehicle can be possessed and used by an organization for several years through a lease agreement without actually being “owned.” A vehicle’s capital cost also is not the same thing as a “capitalized” cost. This term refers to specific

Report on a Vehicle Replacement Methodology
12
methods of financing (i.e., paying for) and/or accounting for the cost of acquiring a vehicle, where this cost is spread over multiple years. In this study, our economic analyses define the total capital cost of a vehicle or piece of equipment (or an entire fleet of such assets) as the difference between the cost of buying the vehicle at the beginning of its life and selling it at the end of its life. The annual capital cost is defined as the change in the vehicle’s fair market value (FMV) between the beginning and end of each year of its life. For instance, a vehicle that can be bought for $25,000 and sold, one year later, for $17,500, has a capital cost of $7,500. If it is sold at the end of the second year of its life for $13,000, the vehicle will have had a total capital cost of $12,000 and annual capital costs of, respectively, $7,500 in Year 1 and $4,500 in Year 2. Many people use the term “depreciation” to describe the capital cost of a vehicle as it ages, although depreciation, technically speaking, is an accounting activity not a type of cost. Depreciation is usually quantified by dividing a vehicle’s initial purchase price by an expected service life or by a pre-defined depreciation term, with 60 months being common for motor vehicles in many organizations. Thus, the capital cost of a $25,000 vehicle with a life expectancy of five years, would normally be reported as $5,000 per year for each of Years 1 through 5 and $0 thereafter. Whereas the FMV of this vehicle might be $17,500 after one year and $13,000 after two, its “book” or depreciated value would be reported as $20,000 and $15,000 respectively. In the sixth year of the vehicle’s life (assuming it is still in use), it would have a depreciation expense of $0 and an ending book value of $0, even though it might have a true capital cost of a few hundred dollars in, and an fair market value of a few thousand dollars at the end of, that year. In this study, we do not concern ourselves with a vehicle’s book depreciation or book value; only with its fair market value and changes therein from year to year. This is the true economic cost of the vehicle to the State of California, regardless of how the State might account for its capital cost in its financial management system and its financial statements. There are several different methods an organization can use to finance the capital cost of a vehicle – outright cash purchase, debt financing, and leasing, to name a few. With one exception (noted below), however, the term capital cost, as used in this report, also has nothing to do with the way the State of California finances the capital costs of the vehicles in its fleet. Operating costs are all costs other than capital costs that are incurred to acquire, possess, manage, use, and dispose of a vehicle or piece of equipment. They consist primarily of direct, variable costs such as those incurred for vehicle maintenance and repair labor and parts and vehicle fuel, but also can include fixed costs, such as vehicle insurance; indirect costs, such as statewide and/or agency overhead costs that are allocated to an in-house fleet management organization; and capital costs, such as debt service and/or depreciation costs associated with fleet maintenance and repair and fueling facilities.

Report on a Vehicle Replacement Methodology
13
In this study, the vehicle and fleet operating costs included in our analyses were vehicle maintenance, repair, and fueling costs. We also included greenhouse gas (GHG) costs by calculating emission levels under different scenarios and monitizing emissions using average costs from the California Carbon Dashboard (http://calcarbondash.org).
Fiscal impact analysis is an analysis of the financial or cash flow requirements associated with a given activity or course of action. We recognize that compelling economic arguments for taking a particular course of action – say, modernizing the State’s fleet – are largely irrelevant if they cannot be reconciled with fiscal realities. For most government jurisdictions, this means that strategies that are clearly beneficial to taxpayers over the long term must still be affordable in the short term. Otherwise, they simply will not be pursued. To this end, we explore the fiscal impacts, in addition to the economic merits, of alternative courses of action in two specific areas of investigation discussed in this report. The first and by far the most important of these relates to fleet modernization, where we compare the 10-year costs of modernizing and not modernizing the State’s fleet. Whereas in our economic analyses of these two courses of action we quantify annual fleet capital costs in terms of the sum of changes in fleet assets’ fair market values from one year to the next, in our fiscal analysis, we quantify capital costs in terms of the sum of annual vehicle purchase prices minus proceeds from the sale of used vehicles each year. Implicit in this approach to the analysis is the assumption that the State would finance all vehicle and equipment acquisitions through the outright purchase of vehicles as opposed to some kind of debt financing or leasing approach. It is important to note that the outright cash purchase method of financing vehicle capital costs produces fiscal impacts that are far different in each year of an asset’s life than those associated with some other capital financing methods. Specifically, the cash purchase method requires a large cash outlay in the first year of a vehicle’s life, a (usually) small cash inflow when the vehicle is sold several years later, and no cash flow impact in the years in between. Under some other financing approaches, the year-over-year fiscal impacts of a vehicle’s – or a fleet’s – capital costs are considerably less volatile. FLEET REPLACEMENT
In our experience, an effective fleet replacement program has five key components:
1. Vehicle replacement cycle guidelines, empirically validated where practicable using the organization’s own historical vehicle cost data, that indicate when specific types of assets generally should be replaced so as to minimize their total cost of ownership (TCO).
2. A long-term fleet replacement plan that pinpoints future replacement dates and costs of individual assets based on the application of recommended replacement

Report on a Vehicle Replacement Methodology
14
0
5
10
15
20
25
1 2 3 4 5 6 7 8 9 10 11 12
Cos
ts (0
00)
Replacement Cycle (years)
Capital, Operating and Total Cost Trendlines(Single-Axle Dump Truck)
cycles, allowing for the determination of future year-by-year fleet replacement costs and variations therein.
3. A capital financing method that facilitates securing sufficient funds each year to acquire replacement vehicles in accordance with the replacement plan.
4. A short-term replacement prioritization and earmarking process for selecting the specific vehicles and pieces of equipment to be replaced in the coming fiscal year.
5. A budgeting and funding process that enables fleet user organizations to consistently secure the necessary amount of funds to execute its replacement plan.
Each if these components is discussed in more detail below.
Empirically Validated Replacement Cycle Guidelines
Ideally, replacement cycle guidelines are based on the economic principles of asset replacement, which are illustrated in the graph at right. As an asset ages, its capital cost5 (red-line in the graph) diminishes and its operating costs increase (green-line in the graph). The combination of these two costs produces a U-shaped total cost of ownership curve (yellow-line in the graph). In most cases, these curves look much more like a salad bowl than, say, a horseshoe, meaning that there usually is not a single optimal replacement point or age but a range of ages. Ideally, a vehicle or piece of equipment should be replaced when the sum of these costs is at or near a minimum. The total cost of ownership is different for every type of asset and, indeed, for every individual asset of a given type. This variability is caused by differences in the design and engineering of different types of assets, in operating environments, in the quality of care assets receive, in the nature and amount of their use, and a variety of other factors. In recognition of this fact, most organizations develop recommended replacement cycles for a class or type of assets, which will approximate the optimal
5 As discussed previously, the annual capital cost of a vehicle or piece of equipment is defined as the change in its fair market value (FMV) from one year to the next.

Report on a Vehicle Replacement Methodology
15
replacement cycle for most of the units in that particular class. Historically this was most often accomplished in an informal manner based on discussions among fleet management and maintenance officials and drivers and operators, and a comparison of replacement cycles with peer organizations. However, best practice fleet management organizations develop these cycles empirically using life cycle cost analysis (LCA) techniques. This approach involves modeling the stream of costs associated with acquiring, operating, and disposing of a particular type of vehicle or piece of equipment over various replacement cycles, and then determining the cycle that will result in the lowest total cost of ownership. Life cycle cost analysis is valuable for examining the “hard” capital and operating costs associated with alternative replacement cycles for a given type of asset. It is important to note, however, that there often are other “soft” costs, some more easily measured than others that also increase as fleet assets age. Generally speaking, these include:
1. Reduced asset reliability and availability and the resulting need to maintain more spare vehicles;
2. Reduced employee productivity due to reductions in asset availability and reliability;
3. Reduced efficiency in the use of maintenance resources (facilities, equipment, mechanics, etc.) to perform difficult-to-predict repairs in comparison to predictable and schedulable preventive maintenance services;
4. Increased wear and tear due to diminishing employee satisfaction with asset appearance, condition, and performance’ and
5. Reduced safety because innovative features in new cars (such as anti-lock brakes, backup cameras, collision avoidance sensors, etc.) are added to the fleet at a very slow pace.
Replacement Planning
As indicated above, one of the components of effective fleet replacement program is a long-term fleet replacement plan that projects future vehicle replacement dates and purchase costs associated with the use of a given set of replacement cycle guidelines. It quantifies year-to-year, fleet-wide replacement costs and future variations therein, without which effective ongoing replacement budgeting is difficult to perform. A key benefit of a long-term replacement plan is its ability to help fleet managers educate decision makers as to the magnitude of fleet replacement costs and the inherent volatility of such costs over time. Specifically, it helps fleet management organizations and their customers clearly identify the year-to-year variance in the amount of money required for replacements.

Report on a Vehicle Replacement Methodology
16
A good fleet replacement planning process not only quantifies the costs of replacing the fleet over the long term so that management and budget decision makers can see that this is a significant, recurring, albeit variable cost of doing business. It also illustrates the consequences of underfunding replacement expenditures by translating spending shortfalls into future spikes in, and backlogs of, replacement spending needs. Replacement Financing, Budgeting, and Funding
Two of the essential elements of an effective replacement program - capital financing method and budget funding process - pertain to the manner in which an organization finances vehicle replacement costs. The best fleet replacement guidelines, policies, and plans are of no value without the financial resources required to follow them. Even during good economic times, securing sufficient funds to replace vehicles and equipment in a timely manner is a challenge for many organizations. In our experience, the vulnerability of fleet replacement funding in most organizations stems less from a lack of appreciation of the importance of vehicles or of the need to replace them on a regular basis, and more from a lack of willingness to commit sufficient funds to fleet replacement. This reluctance is greatly impacted by the large numbers of assets that may need to be replaced in some years and the inability of certain capital financing approaches to effectively deal with the resulting spikes in replacement spending needs. Many organizations do not have a good mechanism for accommodating year-to-year swings in spending requirements when the availability of funds for such expenditures is mostly static. The solution to this problem lies in pursuing one of two courses of action: eliminating the volatility in fleet replacement spending requirements, or eliminating the volatility in replacement funding requirements. While annual volatility in the replacement costs of a fleet can be managed to a certain extent over the short term it cannot be completely eliminated in a fleet comprised of many different types of assets. The year-over-year volatility of replacement funding requirements, on the other hand, can be managed quite well, depending on the method used to finance fleet replacement costs. There are essentially three ways to finance fleet capital costs: cash, savings, and debt. Each has its advantages, but the latter two methods are much better than the first one in dealing with annual peaks and valleys in replacement spending requirements. Replacement Prioritization
The final component of an effective fleet replacement program is a short-term replacement prioritization and earmarking process for designating specific vehicles and pieces of equipment to be replaced in the coming fiscal year. Such a process takes us from the data-driven model of a long-term fleet replacement plan, to the real-world review of vehicles proposed to be replaced in a given year. Because a fleet replacement plan and the replacement cycle guidelines on which it is based derive from cost and other information for the “average” or “typical” asset (of each type) in the fleet, they do not fully take into account the unique characteristics of

Report on a Vehicle Replacement Methodology
17
each individual asset in a fleet. The long-term replacement plan should serve to identify which assets are candidates for replacement each year, not which assets will definitely be replaced each year. These candidates should be scrutinized using criteria that are not limited to age and life-to-date miles or hours of use. A replacement prioritization process includes reviewing an asset’s business application(s) and recent usage to determine if it will be required long term. Best practice organizations use a structured scoring system to set priorities. The system incorporates weights and values for factors or attributes that are unique to each asset, including current utilization level; front-line or backup assignment status; recent repair history and needed repair/refurbishment costs; repair parts availability; operator perceptions of reliability, suitability, and safety; and ease of replacement. The point of this recap of replacement program elements is to give readers of this report some overall context for understanding the discussion that follows.
STUDY DATA
Conducting the types of analyses discussed in this report required a variety of data elements, including many pieces of information on each asset in the fleet. Whenever possible, we utilize historical data from the fleet being studied. However, no organization has perfect data, so we develop certain analytical results using appropriate industry data and/or information we have developed on other client engagements. Based on the above, this study started with the development and submission of a detailed request for the State Fleet inventory containing certain information on each individual asset in the fleet. DGS supplied its inventory of State vehicles, which we found to be missing some elements required for our study. Accordingly, we normalized the data to account for critical missing elements and outliers in the data and created an industry standard classification system. Developing reliable datasets for use in calculating certain regression equations and forecasting costs was a critical piece of our analytical process. In general, we aimed at generating the largest database possible using only data that appeared to be reliable and only for assets for which all needed elements were available. In addition to core fleet inventory information, such as Year, Make, Model, and In-Service Date for each asset, other data required for individual assets’ information to be usable in developing such equations included recent 12-month Maintenance and Repair Labor Hours and Costs, Recent 12-month Usage in Miles or Hours, and Recent 12-month Fuel Gallons and Costs.
Additional discussion on how we used this data is provided in later sections of this report.

Report on a Vehicle Replacement Methodology
18
OPTIMAL VEHICLE REPLACEMENT CYCLE ANALYSIS
REPLACEMENT CYCLE ANALYSIS METHODOLOGY
Earlier in this report we outlined the principles of effective fleet replacement and empirically validated replacement cycles. We explained that the industry best practice is to develop these cycles empirically using life cycle cost analysis (LCA) techniques. This approach involves modeling the stream of costs associated with acquiring, operating, and maintaining and repairing a particular type of vehicle or piece of equipment over a range of potential ages or replacement cycles, and then determining the cycle that will result in the lowest total cost of ownership. A key metric we use in determining optimal replacement cycles is equivalent annual cost (EAC). The EAC of a capital asset is a uniform dollar amount, the net present value of whose payments for a given period of time (i.e., replacement cycle) is equivalent to the net present value costs of owning and operating that asset over the course of that period. It is a useful metric for comparing the costs of alternative replacement cycles (i.e., streams of future costs of different durations) for an asset in order to determine which cycle results in the lowest total cost of ownership. While the analysis of objective data is essential for identifying optimal replacement cycles, it is important to note that there are also indirect asset costs which are impacted by an organization’s vehicle replacement policies and decisions, and that may not be easy to quantify but nonetheless should be taken into account when reviewing and interpreting empirical analysis results. These factors include:
• The predictability and, hence, manageability of asset repair costs, both of which tend to diminish as assets age;
• Maintenance and repair-related asset downtime and its impact on fleet size;
• Service disruptions resulting from unexpected asset breakdowns;
• Impacts on employee efficiency, productivity, effectiveness, and safety associated with asset availability and reliability levels;
• Reduced driver/operator confidence in and satisfaction with asset performance, and corresponding changes in asset usage decisions and practices; and
• Technological obsolescence, which impacts everything from repair parts availability to fuel consumption rates.
Our work plan for this project included conducting LCA for nine classes of vehicles. We modeled the lifecycle costs of 12 vehicle classes initially to ensure that available data would support our analysis. Subsequently we selected the nine classes that provided the best results. Our analysis was based on historical data provided by the State on vehicle utilization, maintenance and repair costs, fuel consumption, original acquisition cost, and used vehicle sale prices. State-provided data were supplemented, where

Report on a Vehicle Replacement Methodology
19
necessary, by data from various industry sources and similar analyses Mercury has performed recently for other government fleets. The determination of the equivalent annual cost of different potential replacement cycles for a given type of asset, as described above, requires modeling of two categories of cost: capital cost and operating cost. Capital cost is determined by estimating the fair market value (FMV) of an asset at the beginning and end of each year included in the analysis. The difference in this value for a given year, expressed in real dollars, is the capital cost of the asset for that year. We developed estimates of asset FMVs and capital costs through regression analysis of State data. These data included original purchase prices, used asset sale prices, and asset odometer readings and age as of the time of their sale. We also consulted several used vehicle value guides such as Kelley BlueBook for vehicle types where state auction data was insufficient (for instance when there were few data points for sale prices for late model vehicles). The asset operating costs we included in our analyses were of three types: maintenance, repair cost, and fuel cost. We developed estimates of maintenance and repair (M&R) cost through regression analysis of actual M&R data for three recent calendar years, FY 2012-14. Fuel costs were determined from actual fuel consumption rates in miles per gallon calculated from data provided by OFAM and the current cost of fuel in California, as available. We also included the cost of greenhouse gas emissions (GHG) by calculating the number of tons of GHG produced using a factor of 24 lbs. per gallon and dividing by 2,000 to convert to tons. Then the GHG cost was calculated using a cost of $14.46 per ton of GHG produced. The cost per ton was obtained from the California Carbon Dashboard and we estimated a fuel economy increase of 5% per year based on past trends for increases in corporate average fuel economy regulations and degradation of fuel systems as vehicles age. Several of the mathematical models we developed require annual vehicle miles traveled (VMT) as an input. We used the average annual VMT of each vehicle in these classes where available. As previously mentioned, we analyzed 12 classes of vehicles to provide the broadest cross-section of the State Fleet inventory. After modeling each class, we scrutinized the results to determine the reasonableness of results. After this review we selected nine of the classes that yielded the most appropriate results (i.e. most complete data set, best fit to the regression curve, fewest data outliers, etc.). The final selection represented more than 17,400 of the State Fleet vehicles – which represents two-thirds of the study fleet. Figure 1 shows key statistics for the nine types of vehicles for which Mercury determined optimal replacement cycles. The average age of current vehicles, except the Sport Utility-Emergency Services-Law Enforcement class, are quite long. Due to the fact that Sport Utility-Emergency Services-Law Enforcement are used 24 hours per day,

Report on a Vehicle Replacement Methodology
20
365 days per year, their usage is substantially higher than all other vehicle classes in the State Fleet. By comparison, the average age of like-type vehicle classes for most government fleets that we have worked with (includes 500 federal, state, and local government fleets) is below five years).
Figure 1 Key Statistics for Vehicle Types Analyzed
Vehicle Type Number of Vehicles
Average Age (years)
Average Original Purchase Price
Average Annual Miles Driven
Auto-Compact- 928 7.7 $ 25,000 10,450
Auto-Full-Size- 234 7.6 $ 16,331 10,373
Sport Utility-Emergency Services-Law Enforcement 1,536 2.1 $ 38,500 24,583
Pickup-Light Duty (LD) 10,940 11.3 $ 24,216 13,279
Pickup-Medium Duty (MD) 4x2 581 9.4 $ 47,000 11,496
Pickup-MD 4x4 117 8.3 $ 50,405 12,685
SUV-LD 4x4 1,160 9.3 $ 30,785 11,868
Truck-MD 944 7.4 $ 78,000 10,615
Van-LD-Minivan 989 10.8 $ 24,000 10,302
REGRESSION ANALYSIS
Once the key data had been identified and validated we developed mathematical models for each class using regression analysis techniques we have developed over several years. Figure 2 shows reported annual maintenance costs per mile for minivans of different ages. The data provided by DGS represented calendar years 2012, 2013, and 2014. The chart contains data for about 990 vehicles. The costs per mile for vehicles in service for less than a year ranged from less than $0.01 to more than $0.60 per mile (it is likely that some of these costs are actually for vehicle upfitting6, not maintenance and repair). Vehicles that have been in service for six years had maintenance costs ranging from $0.01 to as much as $0.74 per mile, and 3-year old vehicles had maintenance costs ranging from about $0.01 to $0.26 per mile. With such wide variation, it is difficult
6 “Upfitting” refers to customize or change something according to the buyer's or user's needs to a new vehicle. Excessively high or low cost units were normalized during our analysis to not skew the results.

Report on a Vehicle Replacement Methodology
21
to put a line or curve through these data to represent average costs per mile for vehicles of different ages. Trying to discern a pattern is nearly impossible.
Figure 2 Actual Annual M&R Costs for 990 Minivans, CY 2012, 2013, 2014
In order to deal with “noisy” data of the type in the above chart, the data for minivans were aggregated into “bins,” with 20 vehicles in each bin. Average values were then calculated for each bin, including age and cost per mile. The resulting chart in Figure 3 shows a pattern that was barely discernible in the previous chart. Fitting a line eye suggests that maintenance costs increase from about $.05 per mile at Age 1 to about $.21 cents per mile by Age 11. The reason for increased clarity is that the 990 data points in the previous chart (Figure 2) were collapsed into only 22 points.

Report on a Vehicle Replacement Methodology
22
Figure 3 Average Annual M&R Costs for Minivans, CY 2012, 2013, 2014
Bin Size = 20 vehicles
In this report, bins were used to smooth the M&R cost data for all nine types of vehicles being analyzed. The practice of using bins to smooth noisy data has been used by statisticians for decades. To determine the depreciation regression equation, we employed several techniques, including the standard approach of using all data points, binning as described above, and two variable equations which incorporate age and miles as criteria for determining residual value. REPLACEMENT CYCLE ANALYSIS RESULTS
The current average and optimal replacement cycle (in years) and the estimated operating cost savings for each type of asset included in our analysis are shown in Exhibit 4. As can be seen, the average replacement cycles that result from the State’s current and recent fleet replacement spending levels are considerably longer than the recommended cycles. Overall, current cycles are, on average, 100 percent longer than the recommended cycles. The optimal replacement cycles we identified in this study are similar to those we have found in numerous other studies of this type that we have performed for public-sector fleets over the last 15 years. Note the State’s current replacement cycle guidelines are entirely usage based, as listed below:

Report on a Vehicle Replacement Methodology
23
a) Law Enforcement and Emergency Vehicles: 100,000 miles b) Light Duty Vehicles: 120,000 miles c) Medium/Heavy Duty Trucks: 150,000 miles d) 4-Wheel Drive Vehicles: 150,000 miles
It is important that fleets have both a time and a usage based replacement criteria as capital costs are primarily driven by time (i.e. months in service) and operating costs by use (i.e. miles driven). These criteria should be used in an “Or” fashion rather than an “And” fashion. This means that, if a class has a replacement cycle of 8 years or 110,000 miles, it should be replaced when it reaches 8 years old or if the odometer reaches 110,000 miles, whichever comes first. Without this stipulation some vehicles would have replacement cycles that are impractical. For example, if you have a unit averaging 6,000 miles per year it would take 18 years to reach the 110,000-mile criterion. Conversely, if you have a unit averaging 20,000 miles per year, it would be at 160,000 miles when it finally reached 8 years old. Moreover, since we have endeavored to provide both age and mileage replacement criteria that will produce the lowest total cost of ownership for the State, keeping vehicles in service above either the age or use criterions would, by definition, result in higher overall costs. With this in mind, we developed age thresholds using the current mileage replacement criteria and an average annual use. Meaning that we divided the mileage threshold by the average use to arrive at an estimated replacement age. As summarized in Exhibit 4 on the following page, the results of our analysis show the State could reduce the equivalent annual costs of all of the assets of these nine types in its fleet by approximately $14 million per year (in 2017 dollars) if it were to replace them in accordance with the recommended replacement cycles rather than the current cycles identified here.7
7 It is important to note the capital cost values used in determining optimal replacement cycles are economic rather than fiscal impact (i.e., cash) values. In a later section of this report we estimate the fiscal impact of implementing more rational replacement cycles.

Report on a Vehicle Replacement Methodology
24
Exhibit 4 Current and Recommended Replacement Cycles and Associated Equivalent Annual Cost Savings
(All costs in 2017 dollars)
Asset Type Number of Units
Current Avg Age (years)
Current Cycle (years)
Recom-mended Cycle (years)
Current Usage Cycle
Recom-mended Usage Cycle
EAC Under Current Cycle
EAC Under Recomm. Cycle
EAC Savings per Vehicle
EAC Savings per Vehicle
Total EAC Savings
(%) Auto-Compact 928 8 11 6 120,000 65,000 $7,390 $6,821 $569 8% $528,315 Auto-Full-Size 234 8 12 5 120,000 50,000 $6,020 $5,231 $789 13% $184,624 Sport Utility-Emergency Services-Law Enforcement
1,536 2 4 4 100,000 100,000 $16,228 $16,228 $0 0% $0
Pickup-LD 10,940 11 11 5 120,000 65,000 $7,588 $6,697 $891 12% $9,749,428 Pickup-MD 4x2 581 9 14 6 120,000 70,000 $14,300 $12,119 $2,182 15% $1,267,715 Pickup-MD 4x4 117 8 14 6 150,000 75,000 $16,310 $13,469 $2,842 17% $332,491 SUV-LD 4x4 1,160 9 13 7 150,000 85,000 $8,557 $7,698 $859 10% $996,397 Truck-MD 944 7 14 11 150,000 115,000 $15,305 $15,080 $225 1% $212,438 Van-LD-Minivan 989 11 14 8 120,000 80,000 $7,617 $6,795 $821 11% $812,320 Total/Average 17,429 12 6 127,778 78,333 $14,083,728

Report on a Vehicle Replacement Methodology
25
Cost savings could be further increased by applying the recommended replacement cycles to other similar classes of vehicles in the fleet. As can be seen in Exhibit 4, the largest differences between current and recommended cycles are for the Pickup-MD 4x2 and Pickup-MD 4x4 classes. Below are the details of our optimal replacement cycle analysis for two types of assets: Auto-Compact and Pickup-Light duty. Details for the remaining classes of assets can be found in the appendix to this report. Sample Optimal Replacement Cycle Analysis Results – Auto-Compact
The key assumptions and inputs we used for the Auto-Compact replacement cycle analysis included the following:
1. New vehicle purchase price: $25,000 2. Average annual usage (miles): 10,450 3. Fuel economy rate (MPG): 13.6 4. Fuel cost per gallon: $2.83 5. Annual fuel efficiency degradation rate8: 5 percent 6. Annual inflation rate for M&R and fuel costs: 3 percent 7. Discount rate: 6 percent 8. Residual values by vehicle age and accumulated mileage, expressed as a
percentage of current vehicle purchase price, obtained from an analysis of used vehicle sales data provided by the State.
9. Maintenance and repair cost projections based on regression analysis of State of California data, as described in detail in the appendix to this report.
The average age of all the compact sedans currently in the fleet is 7.7 years, and the current stated replacement cycle appears to be 11 years. There are compact sedans as old as 17 years in the fleet. The results of our analysis, shown in Exhibit 5, indicate that these vehicles’ total cost of ownership (indicated by the equivalent annual cost – EAC – shown in the bottom row of the table) is, strictly speaking, at a minimum under a replacement cycle of 6 years. Comparing the equivalent annual cost of this type of vehicle under a 6-year cycle and the current 11-year cycle, it can be seen that the State would save an estimated $569 or 8 percent per vehicle per year by replacing these vehicles every 6 years. Based on the total number of compact sedans in the fleet, this translates into nearly $528,315 in EAC savings per year. 8 The annual average decrease in a vehicle’s fuel efficiency rating.

Report on a Vehicle Replacement Methodology
26
It also should be noted that this savings amount does not include any of those indirect costs of aging vehicles noted earlier, notably the growing unpredictability of repair costs. For example, our life cycle cost analysis (Exhibit 5) shows that predicted annual maintenance and repair costs increase by more than $3,834 or 43 percent between Age 6 and Age 11, with most if not all of this increase being attributable to increased repair requirements, which are generally unscheduled and thus cannot be performed as efficiently as can scheduled services.

Report on a Vehicle Replacement Methodology
27
Exhibit 5 Optimal Replacement Cycle Analysis for Auto-Compact
Replacement Cycle (years) 1 2 3 4 5 6 7 8 9 10 11
Year-End Odometer Reading 10,450 20,900 31,350 41,800 52,250 62,700 73,150 83,600 94,050 104,500 114,950
CAPITAL COST9 Year-End Fair Market Value % 66.3% 57.9% 50.7% 44.3% 38.8% 33.9% 29.7% 25.9% 22.7% 19.8% 17.4%
Year-End Fair Market Value $16,564 $14,487 $12,671 $11,082 $9,692 $8,477 $7,414 $6,485 $5,671 $4,960 $4,338 Annual Capital Cost $8,436 $2,139 $1,927 $1,736 $1,564 $1,409 $1,269 $1,143 $1,030 $928 $836
OPERATING COSTS
Annual M&R Cost $531 $585 $644 $710 $782 $861 $949 $1,045 $1,151 $1,268 $1,397 Annual Fuel Cost $2,240 $2,428 $2,633 $2,855 $3,095 $3,356 $3,638 $3,945 $4,277 $4,637 $5,027
Annual GHG Cost $119 $125 $132 $139 $146 $154 $162 $170 $179 $189 $199 Total Annual Operating Cost $2,890 $3,233 $3,617 $4,046 $4,528 $5,067 $5,670 $6,346 $7,103 $7,951 $8,900
TOTAL COST
Annual Total Cost $11,326 $5,372 $5,544 $5,782 $6,092 $6,475 $6,939 $7,489 $8,133 $8,878 $9,736
Equivalent Annual Cost $11,326 $8,393 $7,471 $7,067 $6,884 $6,821 $6,836 $6,909 $7,030 $7,191 $7,390
9 The annual capital cost of a vehicle or piece of equipment is defined as the change in its fair market value (FMV) from one year to the next.

Report on a Vehicle Replacement Methodology
28
Sample Optimal Replacement Cycle Analysis Results – Pickup-LD
The key assumptions and inputs we used for the light-duty pickup replacement cycle analysis included the following:
1. New vehicle purchase price: $24,216 2. Average annual usage (miles): 13,216 3. Fuel economy rate (MPG): 18.5 4. Fuel cost per gallon: $2.83 5. Annual fuel economy degradation rate: 5 percent 6. Annual inflation rate for M&R and fuel costs: 3 percent 7. Discount rate: 6 percent 8. Residual values by vehicle age, and accumulated mileage, expressed as a
percentage of current vehicle purchase price, obtained from an analysis of used vehicle sales data provided by the State and by industry value guides.
9. Maintenance and repair cost projections based on regression analysis of State of California data, as described in detail in the appendix to this report.
The average age of all the light-duty pickups currently in the fleet is 11.3 years, and the stated replacement cycle appears to be 11 years. There are pickups as old as 25 years currently in the fleet. The results of our analysis, shown in Exhibit 6, indicate that these vehicles’ total cost of ownership (indicated by the equivalent annual cost – EAC – shown in the bottom row of the table) is, strictly speaking, at a minimum under a replacement cycle of 5 years. Comparing the equivalent annual cost of this type of vehicle under a 5-year cycle and the current 11-year cycle, it can be seen that the State would save an estimated $891 or 12 percent per vehicle per year by replacing these vehicles every 5 years. Based on the total number of light-duty pickups in the fleet, this translates into nearly $9.8 million in EAC savings per year. Again, this savings amount does not include any of the indirect costs of aging vehicles discussed earlier.

Report on a Vehicle Replacement Methodology
29
Exhibit 6 Optimal Replacement Cycle Analysis for Light-Duty Trucks
Replacement Cycle (years) 1 2 3 4 5 6 7 8 9 10 11
Year-End Odometer Reading 13,200
26,400
39,600
52,800
66,000
79,200
92,400
105,600
118,800
132,000
145,200
CAPITAL COST10 Year-End Fair Market Value % 80.0% 68.3% 58.3% 49.8% 42.5% 36.3% 31.0% 26.5% 22.6% 19.3% 16.5%
Year-End Fair Market Value $19,362 $16,532 $14,116 $12,053 $10,291 $8,787 $7,503 $6,406 $5,470 $4,671 $3,988 Annual Capital Cost $4,854 $2,915 $2,563 $2,254 $1,983 $1,744 $1,533 $1,349 $1,186 $1,043 $917
OPERATING COSTS
Annual M&R Cost $757 $843 $939 $1,045 $1,164 $1,296 $1,443 $1,606 $1,789 $1,992 $2,218 Annual Fuel Cost $2,080 $2,255 $2,445 $2,651 $2,874 $3,116 $3,378 $3,663 $3,971 $4,306 $4,668
Annual GHG Cost $110 $116 $122 $129 $136 $143 $150 $158 $166 $175 $184 Total Annual Operating Cost $2,947 $3,311 $3,719 $4,179 $4,697 $5,280 $5,936 $6,675 $7,507 $8,445 $9,502
TOTAL COST
Annual Total Cost $7,801 $6,225 $6,283 $6,434 $6,680 $7,023 $7,469 $8,024 $8,693 $9,488 $10,419 Equivalent Annual Cost $7,801 $7,025 $6,785 $6,701 $6,697 $6,747 $6,842 $6,974 $7,144 $7,348 $7,588
10 The annual capital cost of a vehicle or piece of equipment is defined as the change in its fair market value (FMV) from one year to the next.

Report on a Vehicle Replacement Methodology
30
FLEET-WIDE REPLACEMENT COSTS
Determining the costs and benefits of modernizing the State Fleet entailed developing several long-term fleet replacement plans that project future replacement dates and costs by asset over a 10-year period. Developing these plans requires two basic types of inputs: a fleet inventory containing certain information on each individual asset in the fleet, and a set of parameters or assumptions for each type or class of asset in the fleet. These parameters include a recommended replacement cycle (in months), the asset purchase price in today’s dollars, and an annual purchase price inflation rate. The data used in developing the four replacement plans discussed below were provided by OFAM in September 2015 and are assumed to be reasonably accurate (e.g., in terms of fleet size, composition, and asset age) as of that month. We developed planning parameters based on statistical analyses of original purchase price data that were included in several of the datasets we received from the State along with input from the major user departments. The parameters were established for 55 types or classes of vehicles and equipment found in the State’s fleet. As the upfitting costs vary from department to department, each of the major eight departments have individual pricing in the parameters. A list of the parameters we used can be found in the appendix to this report, and in each of the Replacement Planning Excel workbook files submitted under separate cover. Mercury uses a proprietary computer program called CARCAP™ (Capital Asset Replacement Cost Analysis Program™) to develop fleet replacement plans and analyze various fleet asset costs and other outcomes associated with their implementation. This program allows us to project the remaining life, and future replacement dates, replacement costs, residual values, ages, book and fair market values, book and effective depreciation costs of each individual asset in a fleet, which can then be rolled up into department, fund, and jurisdiction-wide totals for fleet cost analysis purposes. CARCAP™ generates a replacement plan by: 1) comparing the current age and odometer or hour meter reading of each individual asset in the fleet against recommended replacement criteria in age, miles, or engine hours for that type of asset that are stored in the program’s Planning Parameter Table; 2) projecting when each asset will reach each applicable criterion or threshold for replacement; and 3) estimating the purchase price of the asset in the year in which it will reach whichever threshold (age or accumulated usage) comes first. We used this program to develop three different replacement plans for the State’s fleet. In the following sections we discuss the replacement plans we developed for the State, their purpose and use in this project, and a summary of their analytical results. These plans include the Baseline Renewal Fleet Replacement Plan, Smooth Renewal Plan, ZEV (zero emission vehicle) Plan and the Status Quo Replacement Plan.

Report on a Vehicle Replacement Methodology
31
BASELINE RENEWAL FLEET REPLACEMENT PLAN
We refer to the first plan that we developed as a Baseline Renewal Fleet Replacement Plan. It is for a fleet of 27,81211 vehicles and projects future fleet replacement costs, beginning in FY 2017, based on the application of the recommended replacement cycles shown in the appendix.12 Employing these guidelines, which range for individual asset classes from 4 to 11 years, would result in a weighted average replacement cycle for all the assets in the fleet of 5.9 years. Our analysis indicates that the estimated replacement cost of the State’s Fleet, in today’s dollars, is $792 million. The future costs of replacing the assets in the State’s fleet in strict adherence to our recommended replacement cycles are shown in Exhibit 7 below.
11 This is the number of assets included in the State Fleet study group. 12 It should be noted that all of the replacement plans and costs discussed in this report do not take into account any fleet asset replacements that occurred or will occur between the dates that DGS and several individual State agencies provided to Mercury in September 2015 fleet inventory datasets and the Fiscal Year 2017 start date of July 1, 2016.

Report on a Vehicle Replacement Methodology
32
Exhibit 7 Baseline Renewal Fleet Replacement Plan
The current average age of the assets in the State Fleet is 11.2 years. If the assets in a fleet are normally distributed by age, their average age will be one-half of their average replacement cycle. We can infer from this that the current average replacement cycle for the assets in the fleet is no more than two times 11.2, or 22.4 years. For reasons discussed earlier, it is probably marginally shorter than this. Nevertheless, this current average replacement cycle is considerably longer than the 5.9 year weighted average recommended cycle that results from applying the recommended replacement cycles by asset type (shown in the appendix) to the fleet inventory. In short, due to a lack of funds available to replace vehicles as well as other reasons, the State Fleet is old. Exhibit 8 shows a comparison of the current and recommended replacement cycles (on which future replacement costs in the baseline renewal replacement plan are based) for selected types of assets in the fleet. The full list has been provided in the appendix to this report.
$639
$19 $52 $55
$103
$284 $289
$114 $142
$49
$0
$100
$200
$300
$400
$500
$600
$700
2017 2018 2019 2020 2021 2022 2023 2024 2025 2026
(Mill
ions
)
Fiscal Year
Report on a Vehicle Replacement Methodology
33
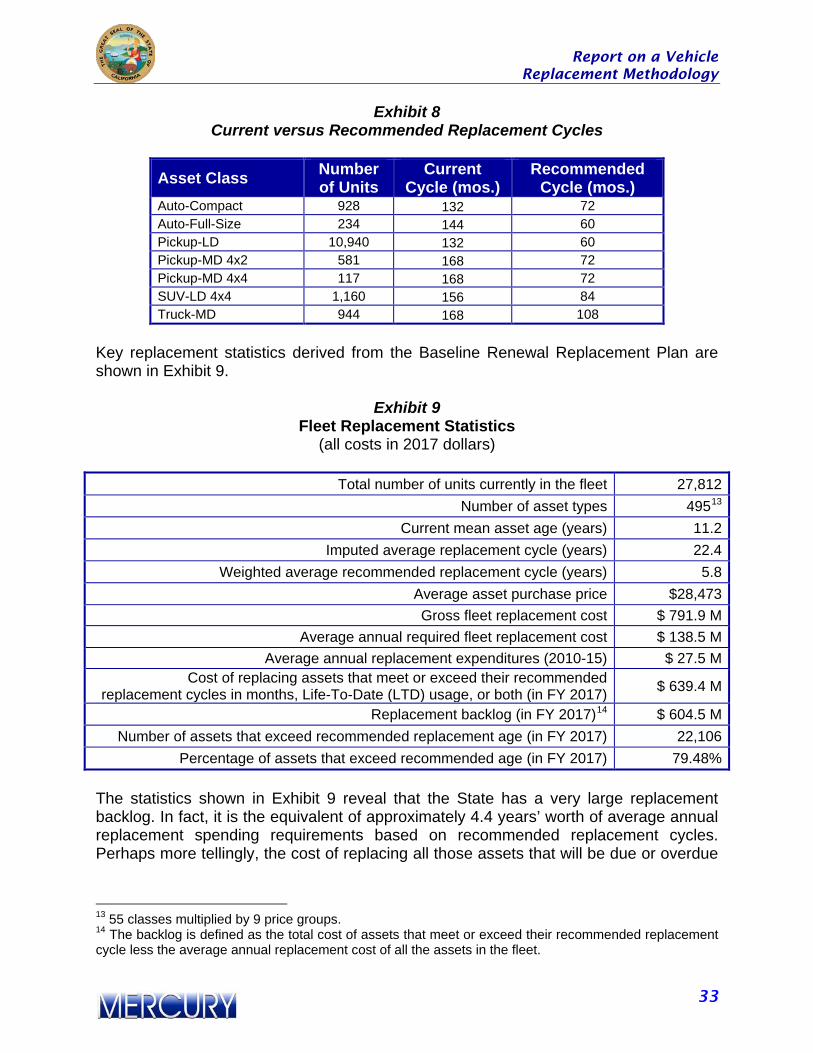
Exhibit 8 Current versus Recommended Replacement Cycles
Asset Class Number of Units
Current Cycle (mos.)
Recommended Cycle (mos.)
Auto-Compact 928 132 72 Auto-Full-Size 234 144 60 Pickup-LD 10,940 132 60 Pickup-MD 4x2 581 168 72 Pickup-MD 4x4 117 168 72 SUV-LD 4x4 1,160 156 84 Truck-MD 944 168 108
Key replacement statistics derived from the Baseline Renewal Replacement Plan are shown in Exhibit 9.
Exhibit 9 Fleet Replacement Statistics
(all costs in 2017 dollars)
Total number of units currently in the fleet 27,812 Number of asset types 49513
Current mean asset age (years) 11.2 Imputed average replacement cycle (years) 22.4
Weighted average recommended replacement cycle (years) 5.8 Average asset purchase price $28,473 Gross fleet replacement cost $ 791.9 M
Average annual required fleet replacement cost $ 138.5 M Average annual replacement expenditures (2010-15) $ 27.5 M
Cost of replacing assets that meet or exceed their recommended replacement cycles in months, Life-To-Date (LTD) usage, or both (in FY 2017) $ 639.4 M
Replacement backlog (in FY 2017)14 $ 604.5 M Number of assets that exceed recommended replacement age (in FY 2017) 22,106
Percentage of assets that exceed recommended age (in FY 2017) 79.48%
The statistics shown in Exhibit 9 reveal that the State has a very large replacement backlog. In fact, it is the equivalent of approximately 4.4 years’ worth of average annual replacement spending requirements based on recommended replacement cycles. Perhaps more tellingly, the cost of replacing all those assets that will be due or overdue
13 55 classes multiplied by 9 price groups. 14 The backlog is defined as the total cost of assets that meet or exceed their recommended replacement cycle less the average annual replacement cost of all the assets in the fleet.

Report on a Vehicle Replacement Methodology
34
for replacement in FY 2017 is more than 22 times the average annual dollar value of the fleet assets that the State placed in service between calendar years 2010 and 2015. Even if it had the financial wherewithal to do so, we would not recommend that the State attempt to replace 80 percent of the assets in its fleet in a single year. There are a number of reasons for this, the two most important of which are 1) the logistical challenges of accomplishing it, such as the impact on operations of procuring, commissioning, decommissioning, and disposing of this many assets; and 2) ripple effects in future fleet replacement costs that would result from many of the assets replaced in the first year of the plan coming due for replacement simultaneously in future years. The existing replacement backlog did not arise overnight and there is no reason to think that it can or should be eliminated overnight. In short, the baseline renewal replacement plan is a very valuable benchmarking tool, but not a practical plan for modernizing the State fleet. SMOOTH RENEWAL PLAN
In light of these concerns, the next step in this study was to develop a realistic Smooth Renewal Plan. This plan is based on all of the same assumptions and parameters as the Baseline Renewal Plan with one exception: we manually adjusted the initial replacement dates of many of the assets that will meet the criteria for replacement in FY 2017 so that the total fleet replacement costs over the first several years are reasonably close to the average annual replacement cost (i.e. funding requirement) of the fleet shown in Exhibit 9, $138.5 million. In other words, we developed a plan that would provide for the elimination of the current replacement backlog over several years and for the timely replacement of all fleet assets (i.e., in accordance with the recommended replacement cycles) thereafter. The costs of the Smooth Renewal Plan are shown in Exhibit 10. The increased year-over-year consistency of fleet replacement costs under this plan is obvious.

Report on a Vehicle Replacement Methodology
35
Exhibit 10 Smooth Renewal Plan
$161 $161 $159 $151 $146 $145
$204
$166 $172 $168
$0
$50
$100
$150
$200
$250
2017 2018 2019 2020 2021 2022 2023 2024 2025 2026
(Mill
ions
)
Fiscal Year

Report on a Vehicle Replacement Methodology
36
ZEV RENEWAL PLAN
Another aspect of this study was to look at the impact of incorporating battery electric vehicles (BEVs) and plug in electric vehicles (PHEVs. Executive Order B-16-12 (ZEV mandate) requires that 10 percent of all state fleet acquisitions of light duty vehicles be zero-emission vehicles by 2015. Additionally, at least 25 percent of all state fleet light duty acquisitions must be ZEVs by 2020. Consequently, a modified replacement plan needed to be created to incorporate the State’s goals for ZEV models. DGS provided a table of the number of total ZEV vehicles to be replaced each year. The total replacements of ZEV sedans and SUVs were spread over the replacement cycle for each eligible class (six years for sedans and eight years for SUVs) including a ramp up at the beginning. All other sedan and SUV replacements each year were assumed to be replaced in kind. The shaded areas of the chart represent when second replacements will begin.
Exhibit 11 Planned Phase in of BEVs, PHEVs, and Hybrids by Year
2017 2018 2019 2020 2021 2022 2023 2024 Total
Sedans BEVs 48 71 95 119 119 119 571
PHEV 92 139 185 231 231 231 1,109 SUVs PHEVs 4 7 9 11 13 16 18 20 98
Total 144 217 289 361 363 366 18 20 1,778
This plan is based on all of the same assumptions and parameters as the Smooth Renewal Plan with one exception: we manually selected vehicles for each year of the plan to be replaced with a BEV or PHEV in order to best approximate the desired count. In other words, we developed a plan that would provide for the phase in of the ZEVs (BEVs and PHEVs) over several years and for the continued replacement with ZEVs thereafter. Applying the methodology described above, the resulting replacement counts can be seen in Exhibit 12 below. As shown, the ZEV sedans follow the projected schedule with only a few minor variations. The ZEV SUVs follow the schedule until year six. It was not possible to schedule any new SUV replacements that year because all units scheduled to be replaced that year were all second replacements.

Report on a Vehicle Replacement Methodology
37
Exhibit 12 Actual Phase in of BEVs, PHEVs, and Hybrids by Year
2017 2018 2019 2020 2021 2022 2023 2024 Total
Sedans BEVs 48 71 95 119 129 119 48 71 700 PHEV 92 140 186 232 232 232 49 190 1353 SUVs PHEVs 144 218 290 362 374 367 97 265 2,117 ZEV Total 180 92 140 186 232 232 232 49 190
Conventional Fuel 5,304 5,133 4,884 4,452 4,238 4,482 5,484 4,469 38,446 Grand Total 5,448 5,351 5,174 4,814 4,612 4,849 5,581 4,734 40,563 The costs of the ZEV Smooth Renewal Plan are shown in Exhibit 13.
Exhibit 13 ZEV Renewal Plan
For comparison purposes, the next exhibit shows the comparative gross replacement costs of assets that would be replaced under the Smooth (Exhibit 10) and ZEV (Exhibit 13) renewal replacement plans in each year over the next 10 years. The number of vehicles replaced will be the same for both plans as the ZEV Smooth Renewal Plan simply changes the type of vehicle purchased at replacement and does not make any changes to scheduling.
$164 $165 $165 $158 $152 $152
$206
$171 $178 $178
$0
$50
$100
$150
$200
$250
2017 2018 2019 2020 2021 2022 2023 2024 2025 2026
(Mill
ions
)
Fiscal Year

Report on a Vehicle Replacement Methodology
38
Exhibit 14
Comparison of Smooth and ZEV Renewal Replacement Plans
Fiscal Year Cost (Millions) Smooth ZEV Renewal
2017 $161.36 $163.50 2018 $161.21 $165.15 2019 $159.14 $164.52 2020 $151.27 $158.00 2021 $146.44 $152.20 2022 $145.22 $151.78 2023 $204.26 $206.32 2024 $165.72 $170.85 2025 $171.63 $178.07 2026 $168.28 $177.92 Total $1,634.54 $1,688.31
As can be seen in the figure above, there is an increased gross replacement cost of $54 million associated with implementing the ZEV mandate. This is due to the capital cost of these types of vehicles being higher than conventionally fueled models. As the State is committed to reducing its carbon footprint, the ZEV Plan is the replacement-funding forecast that we recommend using as the roadmap for future fiscal years. Funding requirements for the first four years of the plan by department are provided in the Appendix to this report. STATUS QUO REPLACEMENT PLAN
It is difficult to assess the merits of fleet renewal in general and the ZEV Plan in particular in a vacuum. Clearly, it is predicated on replacing fleet assets more quickly than at present – every 5.9 years, on average, versus the current average replacement cycle of 12 years. This means that modernization will require a substantial (600-percent) increase in average annual fleet replacement expenditures relative to the $27 million per year that the State has spent on average over the past 6 years. Our earlier discussion of the principles of optimal vehicle replacement cycle determination described the fundamental trade-off that exists between vehicle capital and operating costs. The results of the optimal replacement cycle analyses we conducted quantified these trade-offs. When an organization spends less than it should on fleet replacement (i.e., capital) costs, this usually results in higher than necessary fleet operating costs. Conversely, an increase in replacement spending typically leads to a reduction in operating costs.

Report on a Vehicle Replacement Methodology
39
Rather than ask California to take our word for it that the ZEV Renewal Plan will actually save money, we developed a third fleet replacement plan for the State’s fleet whose costs and other outcomes (e.g., average vehicle age) could serve as a baseline against which to compare the ZEV Plan and its outcomes. We refer to this third plan as a Status Quo Fleet Replacement Plan. In order to develop this plan using CARCAP, we placed upper limits on the total cost of asset replacements in each of the first 10 years and used the State’s current replacement cycles. For assets placed in service in years 2010 through 2015, the State spent on average $27.5 million per year on fleet replacement (in 2017 dollars). In developing the Status Quo replacement plan, therefore, we capped annual fleet replacement costs at roughly $27.5. The resulting plan is shown in Figure 15. As is apparent, after 10 years of status quo spending on replacements, a large backlog of replacement needs would still exist. In fact, with the status quo level of spending the fleet would continue to age and the funding backlog would grow to over 800 million.
Exhibit 15 Status Quo Replacement Plan
Exhibit 16 shows the number and gross replacement cost of vehicles that would be replaced under the ZEV Renewal and Status Quo replacement plans for comparison purposes.
$27 $27 $27 $26 $27 $27 $29 $27 $27 $27
$840
$0
$100
$200
$300
$400
$500
$600
$700
$800
$900
2017 2018 2019 2020 2021 2022 2023 2024 2025 2026 2027
(Mill
ions
)
Fiscal Year

Report on a Vehicle Replacement Methodology
40
Exhibit 16 Comparison of Status Quo and ZEV Renewal Replacement Plan Costs
Fiscal Year Assets Replaced Cost (Millions)
Status Quo ZEV Status Quo ZEV 2017 827 5,448 $27.03 $163.50 2018 923 5,351 $26.67 $165.15 2019 829 5,174 $26.68 $164.52 2020 834 4,814 $26.30 $158.00 2021 666 4,612 $27.15 $152.20 2022 754 4,849 $26.84 $151.78 2023 751 5,581 $29.17 $206.32 2024 661 4,734 $26.87 $170.85 2025 526 4,712 $26.76 $178.07 2026 747 4,452 $26.86 $177.92 Total 7,518 49,727 $270.34 $1,688.31
Exhibit 17 shows the average age of the State Fleet under the Status Quo and ZEV Renewal plans. Note that the age of the fleet increases each year under the Status Quo plan. This is because historic funding levels have not been sufficient to follow the States existing replacement cycles – even though these cycles are very long when compared to common industry practices. Moreover, the Status Quo plan does nothing to address the large backlog in replacement funding requirements that have built up over the past decade.
Exhibit 17 Comparison of Status Quo and ZEV Renewal Replacement Plans
Fiscal Year Average Age (Yrs)
Status Quo ZEV Renewal 2017 10.7 7.4 2018 10.9 5.4 2019 11.2 3.9 2020 11.6 3.0 2021 12.3 2.5 2022 12.7 2.5 2023 13.3 2.6 2024 13.8 2.7 2025 14.7 2.7 2026 15.3 2.8

Report on a Vehicle Replacement Methodology
41
THE ECONOMIC IMPACTS OF FLEET MODERNIZATION
PROJECTING FUTURE COSTS
We used each Status Quo Replacement Plan and ZEV Renewal Plan as the foundation for an analysis of the potential cost savings associated with modernizing the State’s fleet, incorporating ZEV and hybrid replacements, and maintaining an effective fleet replacement program in the future. The goal of this analysis was to determine whether or not the total cost of ownership of the fleet could be reduced by replacing assets in accordance with our recommended replacement cycles, which would require a substantial increase in replacement spending, rather than with the replacement cycles the State currently uses. Based on the principles of optimal vehicle replacement discussed earlier in this report, we have reason to believe that when all significant vehicle costs are taken into account, the total cost of the State’s fleet can indeed be reduced by replacing vehicles more frequently. In order to test this hypothesis, we estimated future fleet capital and operating costs under the two replacement strategies and compared them with one another. Making this comparison entailed estimating the three major components of any fleet’s direct total cost of ownership (TCO): vehicle capital, maintenance and repair, and fuel costs. We also included GHG costs as described previously in this report. We estimated the TCO over a 10-year period under each fleet replacement strategy in both economic and fiscal terms. For the purposes of the economic analysis, the annual capital cost of a vehicle or piece of equipment is defined as the change in its fair market value (FMV) from one year to the next. Many people use the term “depreciation” to describe this cost as a vehicle ages, although depreciation, technically speaking, is an accounting activity, not a type of cost. Another way to think of a vehicle’s capital cost is in terms of the diminishment of its tangible value as an asset that can be sold over time. We used regression equations developed for a number of broad categories of assets in the State’s fleet, derived from past research we have conducted in this area, to estimate the capital cost of each asset in the fleet in each year of the 10-year analysis period. For the fiscal impact analyses performed in this study, we define an asset’s capital cost as the amount of cash that needs to be spent to acquire it minus the amount of cash received when it is sold, usually many years later.15 We estimated asset purchase prices using the asset class-based replacement planning parameters described earlier and an annual purchase price inflation factor of three percent. We estimated used asset sales proceeds using different FMV regression equations for the different types of fleet assets in the fleet.
15 Obviously, this definition of asset capital cost presumes that these costs are financed through the outright purchase of asset with cash paid up front. It is important to note that this type of capital financing method produces fiscal impacts that are far different in each year of an asset’s life than those associated with some other capital financing methods, such as leasing and debt financing.

Report on a Vehicle Replacement Methodology
42
As discussed previously, we performed statistical analysis of the State of California asset maintenance and repair cost data in order to develop regression equations for predicting changes in annual vehicle maintenance and repair costs as a function of changes in vehicle age, usage, and original purchase price, for a number of broad categories of assets. To estimate the cost of fueling assets under the alternative replacement strategies, we calculated a starting level of fuel efficiency in miles per gallon by type of asset and applied fuel economy deterioration and improvement factors, as appropriate. Recently promulgated EPA fuel economy standards require that vehicle (including truck) manufacturers produce more fuel-efficient models over time at a more rapidly increasing rate than in the past. Keeping vehicles in a fleet for a long time deprives fleet owners of these gains in fuel efficiency, in addition to the fact that vehicles become less fuel efficient as they age due to the cumulative effects of wear and tear. Accordingly, we used a fuel efficiency reduction factor of 5 percent for light duty vehicles and 3 percent for medium duty vehicles per year as an asset ages. We added an annual fuel price inflation rate of 3 percent to the 2015 regional average cost per gallon of fuel ($2.83 for gasoline) as reported by the US Energy Information Administration to arrive at the final fuel cost estimates for the fleet under each replacement plan. We also included the cost of greenhouse gas emissions (GHG) by calculating the number of tons of GHG produced using a factor of 24 lbs. per gallon and dividing by 2,000 to convert to tons (source is the Energy Information Administration, an arm of the United States Department of Energy). Then the GHG cost was calculated using a cost of $14.46 per ton of GHG produced. The cost per ton was obtained from the California Carbon Dashboard. In the next section, we utilize the ZEV Renewal and Status Quo replacement plans discussed earlier to illustrate how we compared the total cost of ownership of the State’s fleet under these two alternative replacement strategies. FLEET COSTS UNDER STATUS QUO REPLACEMENT VERSUS MODERNIZATION
Exhibits 18 and 19 summarize our comparison of these two fleet replacement scenarios, while Exhibits 20 and 21 provide a detailed view of the total cost of ownership of the fleet over the next 10 years under the Status Quo and ZEV Renewal replacement plans, respectively. The economic TCO, shown in present value terms in Row 14 of Exhibit 20, is $2,116 million under the Status Quo plan and $1,924 million under the ZEV Renewal plan. To fairly compare the two plans, the fair market value of the fleet at the end of Year 10 must also be considered (the value of these assets is akin to money in the bank). Specifically, the FMV of the fleet at the end of Year 10 is subtracted from the economic TCO to calculate the net economic TCO. Thus, in economic terms, the ZEV Renewal strategy produces net savings in the total cost of ownership of the fleet of $444 million in the first 10 years. These cost savings can most easily be seen in Exhibit 18. Recall from the introduction to this report that

Report on a Vehicle Replacement Methodology
43
whereas in our economic analysis we quantify annual fleet capital costs in terms of the sum of changes in fleet assets’ fair market values from one year to the next, in our fiscal analysis we quantify capital costs in terms of the sum of annual vehicle purchase prices minus proceeds from the sale of used vehicles each year.
Exhibit 18 Economic Impacts of ZEV Renewal Plan
(millions in 2017 dollars)
Ten-Year Economic Savings/(Costs) from Modernization
Fiscal Year 2017 2018 2019 2020 2021 2022 2023 2024 2025 2026 Total Savings/(Costs) in
Gross TCO from Modernization
($27) ($8) $4 $14 $25 $29 $23 $35 $39 $47 $181
Increase/(Decrease) in FMV from
Modernization $71 $134 $182 $216 $233 $232 $238 $241 $249 $253
Savings/(Costs) in Net TCO from
Modernization $439
Savings/(Costs) as a Percentage of Status
Quo Costs 27.7%
Other key information shown in Exhibits 20 and 21 include the following:
• 39,594 more assets are replaced under the ZEV Renewal plan than under the Status Quo Replacement plan.
• The average age (shown in Row 3 of each exhibit) of the assets in the modernized fleet is 2.8 by 2026; under status quo replacement the average age is 450 percent greater than this (15.2 years).
• In each year, maintenance and repair costs (Row 9), fuel costs (Row 10), and GHG costs (Row 11) are lower under the ZEV Renewal plan.
• The net asset purchase costs (replacement cost less sales proceeds, as displayed in Row 7) and the asset capital costs (change in FMV from previous year, shown in Row 8) are higher under ZEV Renewal, due to the significantly greater number of assets purchased under this plan.
Rows 17-20 in Exhibits 20 and 21, shaded in gray, show the fiscal impact of each scenario. The sum of net purchase, maintenance, fuel, and GHG costs that must be expended in each year– the fiscal TCO of the fleet – is displayed in present value dollars in Row 18 of each of these exhibits. When the FMV of the fleet is taken into consideration, net fiscal TCO is lower under the ZEV Smooth Renewal than under the Status Quo scenario. This can best be seen in Exhibit 19 which indicates that the fiscal impacts of modernizing the fleet are savings of $113 million over a 10-year period. .

Report on a Vehicle Replacement Methodology
44
Exhibit 19 Fiscal Impacts of ZEV Renewal
(millions of 2017 dollars)
Ten-Year Fiscal Savings/(Costs) from ZEV Smooth Renewal
Fiscal Year 2017 2018 2019 2020 2021 2022 2023 2024 2025 2026 Total
Savings/(Costs) in Gross TCO from
Modernization ($99) ($74) ($49) ($26) $0 $21 ($4) $21 $23 $32 ($156)
Increase/(Decrease) in FMV from
Modernization $71 $135 $184 $219 $237 $238 $243 $245 $253 $258
Savings/(Costs) in Net TCO from
Modernization $102
Savings/(Costs) in Net TCO from
Modernization $4 5.4%44
While fiscal TCO analysis represents the fiscal reality that the State faces if it chooses to finance the replacement costs of its fleet through the outright purchase of assets with cash, it does not provide a true apples-to-apples comparison of the costs of owning and operating the fleet under the two replacement scenarios. We have shown clearly in the optimal fleet replacement plan section and our economic impact analysis above, that the long run costs associated with modernization are less than those of the status quo. The difference in result produced by the fiscal impact perspective is due to the fact that asset replacement costs are misaligned with the economic benefits they produce. This is because cash purchase financing requires that fleet assets be paid for (in fiscal terms) before they are used, while the operating cost savings (again, in fiscal terms) of modernizing these assets are only realized over a period of several years. In addition, the 10-year view depicts the costs of moving from an old to a new fleet, which requires replacing a large number of vehicles due to the current backlog. Nevertheless, the numbers indicate that the modernization of the State fleet not only is attractive even under the most conservative of capital financing approaches (outright cash purchase), but within the realm of affordability. In fiscal terms, the State could modernize its fleet by spending only 7.5 percent more than it is projected to spend under the Status Quo scenario (a $156 million increase in direct cash expenditures over ten years). As previously noted, this is without considering the significant rise in the value of fleet assets. Perhaps most importantly, if the State does not spend this additional amount to modernize its fleet, its total fleet replacement-spending requirement will grow each year as the backlog in replacement funding increases. In short, part of the additional $156 million cost of modernizing the fleet is to eliminate the current backlog rather than leaving it for future decision makers to deal with. Finally, it is important to note that the ZEV Renewal plan results in a fleet that is younger, cheaper to operate, worth more, produces lower GHG emissions, and requires less employee productive time to manage and operate. The savings in indirect costs

Report on a Vehicle Replacement Methodology
45
such as improved fleet reliability, employee productivity, and safety are not quantified here, but clearly would provide additional benefits to the State.

Report on a Vehicle Replacement Methodology
46
Exhibit 20 Fleet Total Cost of Ownership under Status Quo Replacement Plan
(All costs in millions)
*Assumes replacement vehicles are purchased outright with cash.
2017 2018 2019 2020 2021 2022 2023 2024 2025 2026 Total
Number of Assets in the Fleet 27,812 27,812 27,812 27,812 27,812 27,812 27,812 27,812 27,812 27,812
Number of Assets Replaced 827 923 829 834 666 754 751 661 526 747 7,518
Average Asset Age (years) 10.7 10.9 11.2 11.6 12.3 12.7 13.3 13.8 14.7 15.3
2025 Replacement Cost (2025$) $840.28
Gross Replacement Costs $27.03 $26.67 $26.69 $26.31 $27.14 $26.84 $29.17 $26.87 $26.76 $26.87 $270.35
Used Asset Sales Proceeds $0.57 $0.40 $0.66 $0.63 $4.97 $1.90 $3.09 $2.02 $7.57 $4.74 $26.54
Net Asset Purchase Costs (Replacement Cost less Sales Proceeds) $26.47 $26.27 $26.03 $25.67 $22.17 $24.95 $26.08 $24.85 $19.18 $22.13 $243.81
Asset Capital Costs (change in FMV from prior year) $37.80 $29.53 $29.82 $29.40 $29.41 $28.36 $28.08 $27.47 $27.08 $26.14 $293.08
Asset M&R Costs $92.44 $93.19 $96.54 $100.01 $106.79 $111.74 $117.71 $123.80 $133.74 $142.00 $1,117.97
Asset Fuel Costs $77.99 $80.69 $84.36 $88.11 $93.22 $97.75 $102.71 $107.99 $114.96 $121.07 $968.86
Asset GHG Costs $4.78 $4.80 $4.87 $4.95 $5.07 $5.17 $5.28 $5.38 $5.56 $5.69 $51.55
Ending Asset FMV $164.31 $161.06 $157.26 $153.52 $146.27 $142.86 $139.37 $136.75 $128.84 $124.83
Economic Asset TCO $213.02 $208.21 $215.59 $222.47 $234.50 $243.02 $253.77 $264.64 $281.34 $294.90 $2,431.46
Economic TCO (2015$) $213.02 $202.14 $203.21 $203.59 $208.35 $209.63 $212.53 $215.18 $222.09 $226.02 $2,115.77
Ending FMV (2015$) $164.31 $156.37 $148.23 $140.49 $129.96 $123.24 $116.72 $111.19 $101.71 $95.67
Ten-Year Economic Net TCO (2015$) $2,020.09
Fiscal Asset TCO* $201.68 $204.95 $211.79 $218.75 $227.26 $239.61 $251.78 $262.02 $273.44 $290.90 $2,382.18
Fiscal TCO (2015$) $201.68 $198.98 $199.63 $200.18 $201.92 $206.69 $210.86 $213.05 $215.86 $222.95 $2,071.80
Ending FMV (2015$) $164.31 $156.37 $148.23 $140.49 $129.96 $123.24 $116.72 $111.19 $101.71 $95.67
Ten-Year Fiscal Net TCO (2015$) $1,976.13
Fiscal Year
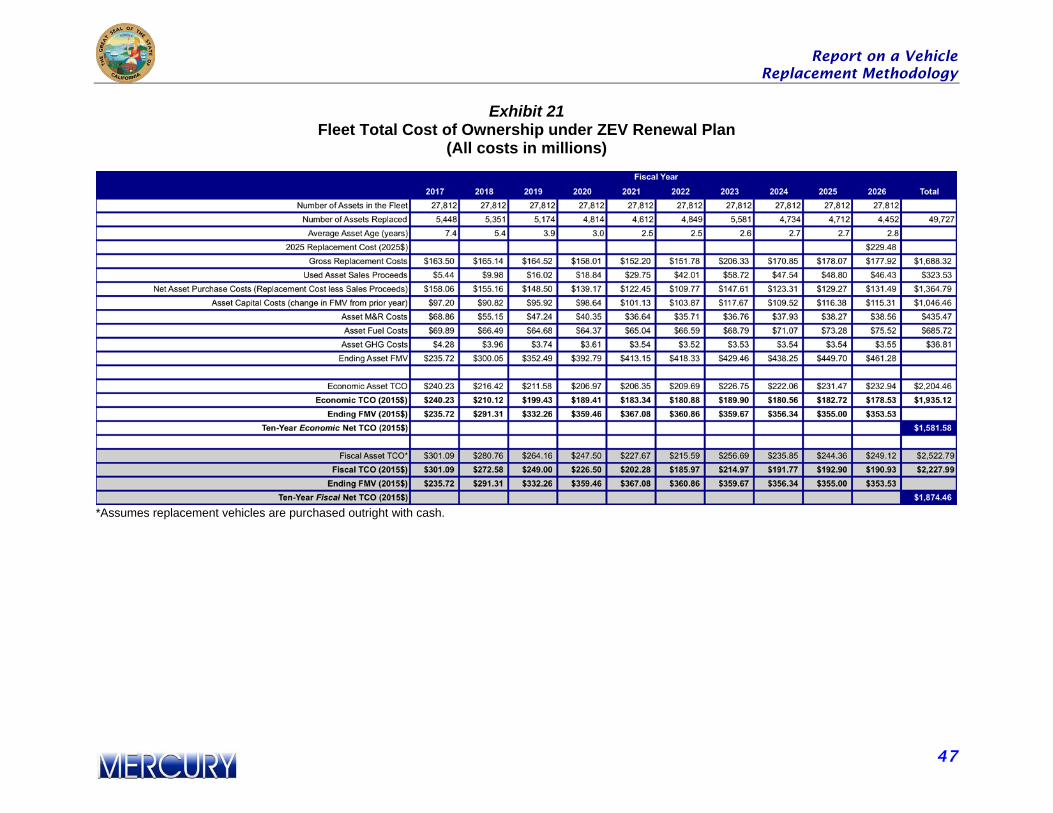
Report on a Vehicle Replacement Methodology
47
Exhibit 21 Fleet Total Cost of Ownership under ZEV Renewal Plan
(All costs in millions)
*Assumes replacement vehicles are purchased outright with cash.

Report on a Vehicle Replacement Methodology
48
FINANCING FLEET MODERNIZATION COSTS
The option of performing a detailed analysis of financing alternatives to fund fleet modernization was not included in the scope of this study. However, we thought it would be useful to share some basic concepts. States such as California generally use one (or a combination) of the following methods for financing fleet capital costs:
• Purchase with cash using funds appropriated on an ad hoc (year-to-year) basis;
• Purchase with cash accumulated in a sinking or reserve fund, usually accompanied by a cost-charge back system that collects funds from fleet user organizations incrementally to defray the costs of the fleet assets they use;
• Purchase with funds borrowed from financial institutions (e.g., an equipment loan, a master “lease-purchase” agreement, a line of credit, etc.) and/or investors (e.g., certificates of participation, general obligation bonds, etc.); and/or
• Leasing from leasing companies (e.g., ARI, Penske, Element, Ryder, Wheels, etc.) or the financial arms of vehicle and equipment manufacturers (e.g., Ford Credit, GM Financial, Caterpillar Financial Services, etc.). Leasing programs come in many flavors, including finance only (“dry”) and full-service (“wet”) leases and open-end operating leases (the norm for large fleets in the US) and closed-end operating leases (the norm for all fleet leases in Europe and for retail leases in the US).
Historically, many state governments financed most of their fleet asset acquisitions using the first of these methods. Given the large replacement backlogs identified in this report, we would assume that the primary capital financing method used is outright purchase with cash from annual appropriations. Organizations that use this financing method, in both the public and private sector, almost always have old fleets in our experience. In the case of outright cash purchase financing, the fiscal impact (i.e., funding requirement) associated with replacing a fleet asset is its purchase price less its residual value. For this analysis we assume 100 percent of the purchase price is paid in the year the asset is replaced and proceeds from the sale of the asset at the end of its life are received in the year in which it is disposed of. In the case of debt financing and leasing, the funding requirement is a payment amount based on a financing period that is (or should be) less than or equal to the replacement cycle of the asset, a fixed, market-competitive interest rate, and proceeds from the sale of the asset at the end of its life, which are assumed to be received in the year in which it is replaced. The fiscal impact of using a replacement reserve fund and charge-back system is similar to that of debt financing and leasing. We refer to these three financing methods

Report on a Vehicle Replacement Methodology
49
as “pay-as-you-go” methods because they all allow the fleet owner to pay for the capital costs of an asset while it is being used. (Outright cash purchase, in contrast, is a pay-before-you-go financing method in that the entire capital cost of the asset must be paid before the asset is used.) However, the amount of cash required to capitalize a new fleet replacement fund usually makes this the costliest fleet replacement financing method, in fiscal terms, to implement. A final point to consider about these alternative financing approaches is that the comparisons we have made of the fiscal impacts of modernizing and not modernizing the State fleet (shown in the gray shaded area of Exhibits 20 and 21) assume that fleet assets would be purchased outright with cash, which is the most expensive way to modernize a fleet. Under a debt financing approach, the amount of funds that the State would need to budget for fleet modernization (i.e., projected gross purchase prices less projected used vehicle sale proceeds would be far less than the amount shown in in Rows 5 and 6 of Exhibit 21.
RECOMMENDATIONS
INVESTIGATE ALTERNATIVE CAPITAL FINANCING STRATEGIES
In our experience, no organization will modernize its fleet unless it believes it can afford to do so; that is, that it can commit the cash (regardless of where the cash comes from) to increase the level of spending on fleet replacement purchases. This usually requires developing an understanding of why the organization has not been willing to make such spending commitments in the past and whether a change in financing approach is needed to make it acceptable to spend more on fleet replacement. While quantifying the costs and benefits of potential capital financing methods was beyond the scope of this study, our experience indicates that leasing vehicles would be slightly more expensive in both economic and fiscal terms than would be debt financing (while both approaches would be more affordable than cash purchase financing in fiscal terms) over the next 10 years. Operating fleet replacement reserve funds, on the other hand, would likely be more expensive in fiscal terms than outright cash purchase (because additional money is required to fully capitalize such funds) and thus is probably not a viable option for the State to consider. It is important to keep in mind that investigating, let alone changing, capital financing methods is not an all-or-nothing proposition. The State could conduct a variety of pilot projects aimed at better understanding the benefits and costs of the different financing methods touched on in this report, and/or the merits of using a single alternative financing approach for certain types of fleet assets or for certain components of the fleet.

Report on a Vehicle Replacement Methodology
50
REFINE MODERNIZATION PLANS
The plans described in this report were developed for the purpose of exploring the costs and benefits of alternative fleet replacement strategies. Annual spending allocations were developed to illustrate required budget levels. However, the ZEV renewal plan will need refinement to align with the specific operational needs of each State agency. For instance, the modernization plan was developed using algorithms that program the oldest assets in the fleet for replacement first, irrespective of their condition, mission criticality, and current level of use. Once the State has determined the funding level it is willing to allocate to replacing its aged fleet, additional work will be required to modify the ZEV Renewal plan to fit this funding. Additional work will also be required to identify the highest priority vehicles to actually be replaced once funding levels have been established. DEVELOP IMPLEMENTATION PLANS
The majority of State agencies utilize commercial service providers for the maintenance and repair of their vehicles. This means that they would be able to immediately start realizing vehicle operating costs savings resulting from fleet modernization. However, it must be remembered that for some of the largest fleets in the State, such as those of Caltrans and CHP, a large part of the operating cost savings associated with modernization would come from reductions in fleet maintenance and repair resource requirements – that is, parts, sublet repair services, personnel, facilities, and equipment. These cost savings will not be realized if State agencies do not have a plan for managing these resources in concert with changes in the age of the fleet. By the same token, the modernization of the fleet will confront the State’s in-house maintenance programs with new challenges as thousands of new vehicles with modern equipment design and engineering are added to the fleet on a scale to which perhaps only CHP is accustomed. This will require more maintenance technician and operator training and, possibly, modifications to maintenance facilities and equipment. Effectively managing and realizing the benefits of the modernization of the fleet will require data based decision making, the use of robust computerized fleet management information systems and the day-to-day development and use of quantitative information. While the State has made positive steps in this direction with the creation of a statewide fleet data warehouse, much remains to be done. Based on our experience in assembling data for the conduct of this study and the previous fleet rightsizing study, several State agencies do not appear to currently possess the systems, data, and/or data analysis capabilities required to move all fleet-related decision making to an objective, data-centered model. DEVELOP PLANS FOR TRUCKS AND OFF-ROAD EQUIPMENT
This report addresses largely the light duty state fleet, with some highway rated trucks included in the scope of the project. In total, approximately fifty-five percent of the State’s fleet was included in our analysis. Vocational trucks and off-road equipment should also be assessed for the benefits of

Report on a Vehicle Replacement Methodology
51
modernization. In our experience, since the unit costs of trucks and construction equipment are generally much higher than cars and pickups, the economic case for modernization of these assets can be very compelling. The State should conduct similar studies of the heavy-duty and equipment segments of its fleet to determine optimal replacement cycles and document required funding levels to produce the lowest total cost of ownership.

Report on a Vehicle Replacement Methodology
52
APPENDIX COUNT OF FLEET ASSETS BY CLASS
OPTIMAL VEHICLE REPLACEMENT CYCLE ANALYSIS RESULTS REPLACEMENT PARAMETERS
REPLACEMENT PLANNING COSTS FUNDING REQUIREMENTS BY DEPARTMENT

Report on a Vehicle Replacement Methodology
53
COUNT OF FLEET ASSETS BY CLASS
Class Code
Description Number of Assets
1310 < 8500 GVW-Automobile-Subcompact 7 1320 < 8500 GVW-Automobile-Compact 1,076 1325 < 8500 GVW-Automobile-Compact-Hybrid 626 1326 < 8500 GVW-Automobile-Compact-Plug-in Hybrid 0 1327 <8500 GVW-Automobile-Compact-ZEV 0 1330 < 8500 GVW-Automobile-Intermediate 376 1334 < 8500 GVW-Automobile-Intermediate-Hybrid 233 1336 < 8500 GVW-Automobile-Intermediate-PHEV/ZEV 11 1338 < 8500 GVW-Automobile-Intermediate-Law Enforcement 63 1339 < 8500 GVW-Automobile-Intermediate-PlugIn Hybrid 0 1340 < 8500 GVW-Automobile-Full Size 1,512 1341 <8500 GVW-Automobile-Full Size-Plug In Hybrid 0 1343 < 8500 GVW-Automobile-Full Size-Station Wagon 13 1348 < 8500 GVW-Automobile-Full Size-Law Enforcement 1,317 1418 < 8500 GVW-Van-Window-Mini 1,125 1420 < 8500 GVW-Van-Cargo 344 1510 < 8500 GVW-Pickups-Compact 2,508 1520 < 8500 GVW-Pickups-Half Ton-4x2 4,699 1525 < 8500 GVW-Pickups 4X4 0 1530 < 8500 GVW-Pickups-3/4 Ton-4x2 3,236 1535 < 8500 GVW-Pickups-4x4 0 1548 < 8500 GVW-Pickups-Emergency Services-Law Enforcement 672 1620 < 8500 GVW-Sport Utility-Half Ton 1,035 1621 < 8500 GVW-Sport Utility-4X4 0 1622 < 8500 GVW-Sport Utility-Half Ton-4 Passenger 3 1624 < 8500 GVW-Sport Utility-Half Ton-Hybrid 35 1625 < 8500 GVW-Sport Utility-PHEV/ZEV 0 1630 < 8500 GVW-Sport Utility-3/4 Ton 619 1632 <8500 GVW-Sport Utility 4X4 0 1635 < 8500 GVW-Sport Utility-3/4 Ton-Hybrid 2 1648 < 8500 GVW-Sport Utility-Emergency Services-Law Enforcement 282 2420 8501-10,000 GVW-Van-Cargo 369 2430 8501-10,000 GVW-Van-Cargo-4X4 0 2510 8501-10,000 GVW-Pickups-One Ton 2,974 2515 8501-10,000 GVW-Pickup-4X4 0

Report on a Vehicle Replacement Methodology
54
Class Code
Description Number of Assets
2540 8501-10,000 GVW-Pickups-Emergency Services 1 2548 8501-10,000 GVW-Pickups-Emergency Services-Law Enforcement 2 2610 8501-10,000 GVW-Sport Utility-One Ton 2 2611 8501-10,000 GVW-Sport Utility-4X4 0 2648 8501-10,000 GVW-Sport Utility-Emergency Services-Law Enforcement 40 2710 8501-10,000 GVW-Straight Trucks-General Purpose 31 3421 10, 001-14,000 GVW-Van-Cargo-Standard Van 2,017 3426 10, 001-14,000 GVW-Van-Cargo-Cutaway Ambulance 1 3510 10, 001-14,000 GVW-Pickups-Super Duty 966 3548 10, 001-14,000 GVW-Pickups-Emergency Services-Law Enforcement 110 3700 10, 001-14,000 GVW-Straight Trucks 73 3715 10, 001-14,000 GVW-Straight Trucks-4X4 0 4411 14,001-16,000 GVW-Van-Window-General Purpose 47 4422 14,001-16,000 GVW-Van-Cargo-Step Van 8 4511 14,001-16,000 GVW-Pickups-General Purpose-Regular Cab 6 4700 14,001-16,000 GVW-Straight Trucks 231 5422 16,001-19,500 GVW-Van-Cargo-Step Van 14 5710 16,001-19,500 GVW-Straight Trucks-General Purpose 452 6422 19,501-26,000 GVW-Van-Cargo-Step Van 4 6710 19,501-26,000 GVW-Straight Trucks-General Purpose 670 Grand Total
27,812

Report on a Vehicle Replacement Methodology
55
OPTIMAL VEHICLE REPLACEMENT CYCLE ANALYSIS RESULTS

Report on a Vehicle Replacement Methodology
56
Optimal Replacement Cycle Analysis for Auto-Compact
Replacement Cycle (years) 1 2 3 4 5 6 7 8 9 10 11
Year-End Odometer Reading 10,450 20,900 31,350 41,800 52,250 62,700 73,150 83,600 94,050 104,500 114,950
CAPITAL COST16 Year-End Fair Market Value % 66.3% 57.9% 50.7% 44.3% 38.8% 33.9% 29.7% 25.9% 22.7% 19.8% 17.4%
Year-End Fair Market Value $16,564 $14,487 $12,671 $11,082 $9,692 $8,477 $7,414 $6,485 $5,671 $4,960 $4,338 Annual Capital Cost $8,436 $2,139 $1,927 $1,736 $1,564 $1,409 $1,269 $1,143 $1,030 $928 $836
OPERATING COSTS
Annual M&R Cost $531 $585 $644 $710 $782 $861 $949 $1,045 $1,151 $1,268 $1,397 Annual Fuel Cost $2,240 $2,428 $2,633 $2,855 $3,095 $3,356 $3,638 $3,945 $4,277 $4,637 $5,027
Annual GHG Cost $119 $125 $132 $139 $146 $154 $162 $170 $179 $189 $199 Total Annual Operating Cost $2,890 $3,233 $3,617 $4,046 $4,528 $5,067 $5,670 $6,346 $7,103 $7,951 $8,900
TOTAL COST
Annual Total Cost $11,326 $5,372 $5,544 $5,782 $6,092 $6,475 $6,939 $7,489 $8,133 $8,878 $9,736
Equivalent Annual Cost $11,326 $8,393 $7,471 $7,067 $6,884 $6,821 $6,836 $6,909 $7,030 $7,191 $7,390
16 The annual capital cost of a vehicle or piece of equipment is defined as the change in its fair market value (FMV) from one year to the next.

Report on a Vehicle Replacement Methodology
57
Optimal Replacement Cycle Analysis for Auto-Fullsize
Replacement Cycle (years) 1 2 3 4 5 6 7 8 9 10 11 12
Year-End Odometer Reading 10,373 20,746 31,119 41,492 51,865 62,238 72,611 82,984 93,357 103,730 114,103 124,476 CAPITAL COST17
Year-End Fair Market Value % 78.0% 65.0% 54.1% 45.0% 37.5% 31.2% 26.0% 21.7% 18.0% 15.0% 12.5% 10.4% Year-End Fair Market Value $12,738 $10,608 $8,834 $7,356 $6,126 $5,102 $4,249 $3,538 $2,946 $2,454 $2,043 $1,702
Annual Capital Cost $3,593 $2,194 $1,882 $1,614 $1,385 $1,188 $1,019 $874 $750 $643 $551 $473
OPERATING COSTS
Annual M&R Cost $119 $125 $132 $139 $146 $154 $162 $170 $179 $189 $198 $209 Annual Fuel Cost $2,223 $2,410 $2,613 $2,834 $3,072 $3,331 $3,611 $3,915 $4,245 $4,603 $4,990 $5,411
Annual GHG Cost $118 $124 $131 $138 $145 $153 $161 $169 $178 $187 $197 $208 Total Annual Operating Cost $2,460 $2,740 $3,051 $3,398 $3,785 $4,216 $4,697 $5,233 $5,830 $6,496 $7,238 $8,066
TOTAL COST
Annual Total Cost $6,053 $4,934 $4,933 $5,012 $5,170 $5,404 $5,716 $6,107 $6,580 $7,139 $7,790 $8,539 Equivalent Annual Cost $6,053 $5,502 $5,318 $5,245 $5,231 $5,257 $5,317 $5,406 $5,522 $5,663 $5,829 $6,020
17 The annual capital cost of a vehicle or piece of equipment is defined as the change in its fair market value (FMV) from one year to the next.

Report on a Vehicle Replacement Methodology
58
Optimal Replacement Cycle Analysis for Sport Utility-Emergency Services-Law Enforcement
Replacement Cycle (years) 1 2 3 4 5 6 7 8 9 10
Year-End Odometer Reading 24,583 49,166 73,749 98,332 122,915 147,498 172,081 196,664 221,247 245,830 CAPITAL COST18
Year-End Fair Market Value % 68.5% 52.9% 40.9% 31.6% 24.4% 18.9% 14.6% 11.3% 8.7% 6.7% Year-End Fair Market Value $26,360 $20,371 $15,743 $12,166 $9,402 $7,266 $5,615 $4,340 $3,354 $2,592
Annual Capital Cost $12,140 $6,169 $4,910 $3,908 $3,111 $2,476 $1,971 $1,569 $1,249 $994
OPERATING COSTS
Annual M&R Cost $1,399 $1,717 $2,109 $2,589 $3,179 $3,904 $4,794 $5,886 $7,227 $8,875 Annual Fuel Cost $5,874 $6,368 $6,904 $7,486 $8,116 $8,800 $9,541 $10,344 $11,215 $12,160
Annual GHG Cost $312 $328 $346 $364 $383 $403 $424 $447 $470 $495 Total Annual Operating Cost $7,584 $8,666 $9,929 $11,407 $13,144 $15,194 $17,623 $20,510 $23,958 $28,091
TOTAL COST
Annual Total Cost $19,724 $14,835 $14,839 $15,315 $16,255 $17,671 $19,594 $22,079 $25,207 $29,085 Equivalent Annual Cost $19,724 $17,315 $16,514 $16,228 $16,233 $16,455 $16,865 $17,451 $18,215 $19,163
18 The annual capital cost of a vehicle or piece of equipment is defined as the change in its fair market value (FMV) from one year to the next.

Report on a Vehicle Replacement Methodology
59
Optimal Replacement Cycle Analysis for Pickup-LD
Replacement Cycle (years) 1 2 3 4 5 6 7 8 9 10 11
Year-End Odometer Reading 13,200 26,400 39,600 52,800 66,000 79,200 92,400 105,600 118,800 132,000 145,200 CAPITAL COST19
Year-End Fair Market Value % 80.0% 68.3% 58.3% 49.8% 42.5% 36.3% 31.0% 26.5% 22.6% 19.3% 16.5% Year-End Fair Market Value $19,362 $16,532 $14,116 $12,053 $10,291 $8,787 $7,503 $6,406 $5,470 $4,671 $3,988
Annual Capital Cost $4,854 $2,915 $2,563 $2,254 $1,983 $1,744 $1,533 $1,349 $1,186 $1,043 $917
OPERATING COSTS
Annual M&R Cost $757 $843 $939 $1,045 $1,164 $1,296 $1,443 $1,606 $1,789 $1,992 $2,218 Annual Fuel Cost $2,080 $2,255 $2,445 $2,651 $2,874 $3,116 $3,378 $3,663 $3,971 $4,306 $4,668
Annual GHG Cost $110 $116 $122 $129 $136 $143 $150 $158 $166 $175 $184 Total Annual Operating Cost $2,947 $3,311 $3,719 $4,179 $4,697 $5,280 $5,936 $6,675 $7,507 $8,445 $9,502
TOTAL COST
Annual Total Cost $7,801 $6,225 $6,283 $6,434 $6,680 $7,023 $7,469 $8,024 $8,693 $9,488 $10,419 Equivalent Annual Cost $7,801 $7,025 $6,785 $6,701 $6,697 $6,747 $6,842 $6,974 $7,144 $7,348 $7,588
19 The annual capital cost of a vehicle or piece of equipment is defined as the change in its fair market value (FMV) from one year to the next.

Report on a Vehicle Replacement Methodology
60
Optimal Replacement Cycle Analysis for Pickup-MD 4x2 Replacement Cycle
(years) 1 2 3 4 5 6 7 8 9 10 11 12 13 14
Year-End Odometer Reading 11,496 22,992 34,488 45,984 57,480 68,976 80,472 91,968 103,464 114,960 126,456 137,952 149,448 160,944 CAPITAL COST20
Year-End Fair Market Value % 75.8% 66.7% 58.8% 51.8% 45.6% 40.2% 35.4% 31.2% 27.4% 24.2% 21.3% 18.7% 16.5% 14.5% Year-End Fair Market Value $35,620 $31,372 $27,630 $24,335 $21,432 $18,876 $16,625 $14,642 $12,896 $11,358 $10,003 $8,810 $7,759 $6,834
Annual Capital Cost $11,380 $4,376 $3,969 $3,601 $3,267 $2,963 $2,688 $2,439 $2,212 $2,007 $1,820 $1,651 $1,498 $1,359
OPERATING COSTS
Annual M&R Cost $2,162 $2,282 $2,408 $2,541 $2,682 $2,830 $2,987 $3,152 $3,326 $3,510 $3,704 $3,909 $4,125 $4,353 Annual Fuel Cost $3,161 $3,428 $3,716 $4,029 $4,368 $4,736 $5,135 $5,567 $6,036 $6,545 $7,096 $7,693 $8,341 $9,044
Annual GHG Cost $168 $177 $186 $196 $206 $217 $228 $240 $253 $266 $280 $295 $311 $327 Total Annual Operating Cost $5,492 $6,063 $6,695 $7,394 $8,167 $9,023 $9,971 $11,019 $12,181 $13,467 $14,891 $16,469 $18,217 $20,154
TOTAL COST
Annual Total Cost $16,872 $10,439 $10,664 $10,995 $11,434 $11,986 $12,659 $13,458 $14,393 $15,474 $16,712 $18,120 $19,715 $21,513 Equivalent Annual Cost $16,872 $13,703 $12,720 $12,307 $12,143 $12,119 $12,189 $12,332 $12,535 $12,791 $13,097 $13,451 $13,852 $14,300
20 The annual capital cost of a vehicle or piece of equipment is defined as the change in its fair market value (FMV) from one year to the next.

Report on a Vehicle Replacement Methodology
61
Optimal Replacement Cycle Analysis for Pickup-MD 4x4 Replacement Cycle
(years) 1 2 3 4 5 6 7 8 9 10 11 12 13 14
Year-End Odometer Reading 12,685 25,370 38,055 50,740 63,425 76,110 88,795 101,480 114,165 126,850 139,535 152,220 164,905 177,590 CAPITAL COST21
Year-End Fair Market Value % 70.7% 62.2% 54.8% 48.3% 42.5% 37.5% 33.0% 29.1% 25.6% 22.5% 19.8% 17.5% 15.4% 13.6% Year-End Fair Market Value $35,621 $31,373 $27,631 $24,336 $21,433 $18,877 $16,626 $14,643 $12,896 $11,358 $10,004 $8,810 $7,760 $6,834
Annual Capital Cost $14,784 $4,376 $3,970 $3,601 $3,267 $2,963 $2,688 $2,439 $2,212 $2,007 $1,821 $1,652 $1,498 $1,359
OPERATING COSTS
Annual M&R Cost $2,226 $2,413 $2,615 $2,835 $3,073 $3,331 $3,610 $3,913 $4,242 $4,598 $4,984 $5,403 $5,856 $6,348 Annual Fuel Cost $3,488 $3,782 $4,100 $4,446 $4,820 $5,226 $5,666 $6,143 $6,661 $7,222 $7,830 $8,489 $9,204 $9,979
Annual GHG Cost $185 $195 $205 $216 $227 $239 $252 $265 $279 $294 $309 $326 $343 $361 Total Annual Operating Cost $5,899 $6,581 $7,342 $8,192 $9,139 $10,197 $11,377 $12,695 $14,165 $15,805 $17,636 $19,680 $21,961 $24,506
TOTAL COST
Annual Total Cost $20,683 $10,957 $11,312 $11,793 $12,406 $13,160 $14,066 $15,133 $16,377 $17,812 $19,457 $21,332 $23,459 $25,865 Equivalent Annual Cost $20,683 $15,892 $14,410 $13,784 $13,525 $13,469 $13,546 $13,725 $13,986 $14,320 $14,721 $15,187 $15,716 $16,310
21 The annual capital cost of a vehicle or piece of equipment is defined as the change in its fair market value (FMV) from one year to the next.

Report on a Vehicle Replacement Methodology
62
Optimal Replacement Cycle Analysis for SUV-LD, 4x4 Replacement Cycle
(years) 1 2 3 4 5 6 7 8 9 10 11 12 13
Year-End Odometer Reading 11,868 23,736 35,604 47,472 59,340 71,208 83,076 94,944 106,812 118,680 130,548 142,416 154,284 CAPITAL COST22
Year-End Fair Market Value % 56.8% 49.1% 42.3% 36.5% 31.5% 27.2% 23.5% 20.3% 17.5% 15.1% 13.0% 11.2% 9.7% Year-End Fair Market Value $15,349 $13,245 $11,430 $9,864 $8,512 $7,345 $6,339 $5,470 $4,720 $4,073 $3,515 $3,033 $2,618
Annual Capital Cost $11,651 $2,167 $1,926 $1,712 $1,521 $1,352 $1,202 $1,068 $950 $844 $750 $667 $593
OPERATING COSTS
Annual M&R Cost $805 $864 $927 $995 $1,068 $1,146 $1,229 $1,319 $1,415 $1,519 $1,629 $1,748 $1,876 Annual Fuel Cost $2,291 $2,484 $2,693 $2,920 $3,166 $3,432 $3,721 $4,035 $4,375 $4,743 $5,142 $5,575 $6,045
Annual GHG Cost $122 $128 $135 $142 $149 $157 $166 $174 $183 $193 $203 $214 $225 Total Annual Operating Cost $3,218 $3,581 $3,984 $4,433 $4,933 $5,489 $6,109 $6,799 $7,567 $8,422 $9,374 $10,434 $11,614
TOTAL COST
Annual Total Cost $14,869 $5,747 $5,910 $6,145 $6,454 $6,842 $7,311 $7,867 $8,516 $9,266 $10,124 $11,101 $12,207 Equivalent Annual Cost $14,869 $10,376 $8,931 $8,265 $7,924 $7,757 $7,698 $7,717 $7,796 $7,924 $8,096 $8,308 $8,557
22 The annual capital cost of a vehicle or piece of equipment is defined as the change in its fair market value (FMV) from one year to the next.

Report on a Vehicle Replacement Methodology
63
Optimal Replacement Cycle Analysis for Truck-MD
Replacement Cycle (years) 1 2 3 4 5 6 7 8 9 10 11
Year-End Odometer Reading 13,200
26,400
39,600
52,800
66,000
79,200
92,400
105,600
118,800
132,000
145,200
CAPITAL COST23 Year-End Fair Market Value % 80.0% 68.3% 58.3% 49.8% 42.5% 36.3% 31.0% 26.5% 22.6% 19.3% 16.5%
Year-End Fair Market Value $19,362 $16,532 $14,116 $12,053 $10,291 $8,787 $7,503 $6,406 $5,470 $4,671 $3,988 Annual Capital Cost $4,854 $2,915 $2,563 $2,254 $1,983 $1,744 $1,533 $1,349 $1,186 $1,043 $917
OPERATING COSTS
Annual M&R Cost $757 $843 $939 $1,045 $1,164 $1,296 $1,443 $1,606 $1,789 $1,992 $2,218 Annual Fuel Cost $2,080 $2,255 $2,445 $2,651 $2,874 $3,116 $3,378 $3,663 $3,971 $4,306 $4,668
Annual GHG Cost $110 $116 $122 $129 $136 $143 $150 $158 $166 $175 $184 Total Annual Operating Cost $2,947 $3,311 $3,719 $4,179 $4,697 $5,280 $5,936 $6,675 $7,507 $8,445 $9,502
TOTAL COST
Annual Total Cost $7,801 $6,225 $6,283 $6,434 $6,680 $7,023 $7,469 $8,024 $8,693 $9,488 $10,419 Equivalent Annual Cost $7,801 $7,025 $6,785 $6,701 $6,697 $6,747 $6,842 $6,974 $7,144 $7,348 $7,588
23 The annual capital cost of a vehicle or piece of equipment is defined as the change in its fair market value (FMV) from one year to the next.

Report on a Vehicle Replacement Methodology
64
Optimal Replacement Cycle Analysis for Van-LD-Minivan
Replacement Cycle
(years) 1 2 3 4 5 6 7 8 9 10 11 12 13 14
Year-End Odometer Reading 10,302 20,604 30,906 41,208 51,510 61,812 72,114 82,416 92,718 103,020 113,322 123,624 133,926 144,228 CAPITAL COST24
Year-End Fair Market Value % 64.1% 51.1% 40.8% 32.5% 26.0% 20.7% 16.5% 13.2% 10.5% 8.4% 6.7% 5.3% 4.3% 3.4% Year-End Fair Market Value $15,383 $12,271 $9,789 $7,809 $6,229 $4,969 $3,964 $3,162 $2,523 $2,012 $1,605 $1,281 $1,022 $815
Annual Capital Cost $8,617 $3,205 $2,633 $2,164 $1,778 $1,461 $1,200 $986 $810 $666 $547 $449 $369 $303
OPERATING COSTS
Annual M&R Cost $667 $727 $791 $861 $938 $1,021 $1,112 $1,210 $1,318 $1,435 $1,562 $1,700 $1,851 $2,016 Annual Fuel Cost $1,854 $2,010 $2,179 $2,362 $2,561 $2,777 $3,011 $3,265 $3,539 $3,838 $4,161 $4,511 $4,891 $5,303
Annual GHG Cost $98 $104 $109 $115 $121 $127 $134 $141 $148 $156 $164 $173 $182 $192 Total Annual Operating Cost $2,619 $2,925 $3,267 $3,648 $4,074 $4,550 $5,082 $5,677 $6,341 $7,083 $7,912 $8,838 $9,873 $11,029
TOTAL COST
Annual Total Cost $11,236 $6,130 $5,900 $5,812 $5,852 $6,011 $6,283 $6,663 $7,151 $7,748 $8,459 $9,287 $10,242 $11,333 Equivalent Annual Cost $11,236 $8,721 $7,808 $7,331 $7,053 $6,892 $6,812 $6,795 $6,830 $6,910 $7,031 $7,190 $7,386 $7,617
24 The annual capital cost of a vehicle or piece of equipment is defined as the change in its fair market value (FMV) from one year to the next.

Report on a Vehicle Replacement Methodology
65
REPLACEMENT PARAMETERS
Asset Class Code Description
Curent Cycle
in Months
Current Cycle in Miles or Hours
Recom-mended Cycle in Months
Recom-mended Cycle in Miles or Hours
Purchase Price
Inflation Rate (%/yr.)
1310 < 8500 GVW-Automobile-Subcompact 132 120,000 72 65,000 3% 1320 < 8500 GVW-Automobile-Compact 132 120,000 72 65,000 3% 1325 < 8500 GVW-Automobile-Compact-Hybrid 132 120,000 72 65,000 3% 1326 < 8500 GVW-Automobile-Compact-Plug-in Hybrid 132 120,000 72 65,000 3% 1327 <8500 GVW-Automobile-Compact-ZEV 132 120,000 72 65,000 3% 1330 < 8500 GVW-Automobile-Intermediate 132 120,000 72 65,000 3% 1334 < 8500 GVW-Automobile-Intermediate-Hybrid 132 120,000 72 65,000 3% 1336 < 8500 GVW-Automobile-Intermediate-PHEV/ZEV 132 120,000 72 65,000 3% 1338 < 8500 GVW-Automobile-Intermediate-Law Enforcement 48 100,000 48 100,000 3% 1339 < 8500 GVW-Automobile-Intermediate-PlugIn Hybrid 132 120,000 72 65,000 3% 1340 < 8500 GVW-Automobile-Full Size 144 120,000 84 85,000 3% 1341 <8500 GVW-Automobile-Full Size-Plug In Hybrid 132 120,000 60 50,000 3% 1343 < 8500 GVW-Automobile-Full Size-Station Wagon 144 120000 84 85000 3% 1348 < 8500 GVW-Automobile-Full Size-Law Enforcement 48 100,000 48 100,000 3% 1418 < 8500 GVW-Van-Window-Mini 144 120000 96 80000 3% 1420 < 8500 GVW-Van-Cargo 108 120,000 60 65,000 3% 1510 < 8500 GVW-Pickups-Compact 108 120,000 60 65,000 3% 1520 < 8500 GVW-Pickups-Half Ton-4x2 108 120,000 60 65,000 3% 1525 < 8500 GVW-Pickups 4X4 144 150,000 72 75,000 3% 1530 < 8500 GVW-Pickups-3/4 Ton-4x2 120 120,000 60 65,000 3% 1535 < 8500 GVW-Pickups-4x4 144 150,000 72 75,000 3% 1548 < 8500 GVW-Pickups-Emergency Services-Law Enforcement 48 100,000 48 100,000 3% 1620 < 8500 GVW-Sport Utility-Half Ton 120 120,000 84 85,000 3% 1621 < 8500 GVW-Sport Utility-4X4 156 150,000 84 85,000 3% 1622 < 8500 GVW-Sport Utility-Half Ton-4 Passenger 120 120,000 84 85,000 3% 1624 < 8500 GVW-Sport Utility-Half Ton-Hybrid 120 120,000 84 85,000 3% 1625 < 8500 GVW-Sport Utility-PHEV/ZEV 120 120,000 84 85,000 3% 1630 < 8500 GVW-Sport Utility-3/4 Ton 108 120,000 60 50,000 3% 1632 <8500 GVW-Sport Utility 4X4 156 150,000 84 85,000 3% 1635 < 8500 GVW-Sport Utility-3/4 Ton-Hybrid 120 120,000 84 85,000 3% 1648 < 8500 GVW-Sport Utility-Emergency Services-Law Enforcement 48 100,000 48 100,000 3%

Report on a Vehicle Replacement Methodology
66
Asset Class Code Description
Curent Cycle
in Months
Current Cycle in Miles or Hours
Recom-mended Cycle in Months
Recom-mended Cycle in Miles or Hours
Purchase Price
Inflation Rate (%/yr.)
2420 8501-10,000 GVW-Van-Cargo 108 120,000 60 65,000 3% 2430 8501-10,000 GVW-Van-Cargo-4X4 156 150,000 60 65,000 3% 2510 8501-10,000 GVW-Pickups-One Ton 132 120,000 72 70,000 3% 2515 8501-10,000 GVW-Pickup-4X4 168 150000 72 70000 3% 2540 8501-10,000 GVW-Pickups-Emergency Services 132 120,000 72 70,000 3% 2548 8501-10,000 GVW-Pickups-Emergency Services-Law Enforcement 48 100,000 48 100,000 3% 2610 8501-10,000 GVW-Sport Utility-One Ton 108 120,000 84 85,000 3% 2611 8501-10,000 GVW-Sport Utility-4X4 156 150,000 84 85,000 3% 2648 8501-10,000 GVW-Sport Utility-Emergency Services-Law Enforcement 48 100,000 48 100,000 3% 2710 8501-10,000 GVW-Straight Trucks-General Purpose 132 120000 84 85000 3% 3421 10, 001-14,000 GVW-Van-Cargo-Standard Van 168 150,000 72 70,000 3% 3426 10, 001-14,000 GVW-Van-Cargo-Cutaway Ambulance 168 150,000 72 70,000 3% 3510 10, 001-14,000 GVW-Pickups-Super Duty 168 150,000 72 70,000 3% 3548 10, 001-14,000 GVW-Pickups-Emergency Services-Law Enforcement 48 100,000 48 100,000 3% 3700 10, 001-14,000 GVW-Straight Trucks 168 150,000 72 70,000 3% 3715 10, 001-14,000 GVW-Straight Trucks-4X4 168 150,000 72 70,000 3% 4411 14,001-16,000 GVW-Van-Window-General Purpose 168 150,000 72 70,000 3% 4422 14,001-16,000 GVW-Van-Cargo-Step Van 168 150,000 72 70,000 3% 4511 14,001-16,000 GVW-Pickups-General Purpose-Regular Cab 168 150,000 72 70,000 3% 4700 14,001-16,000 GVW-Straight Trucks 168 150,000 72 70,000 3% 5422 16,001-19,500 GVW-Van-Cargo-Step Van 168 150,000 132 115,000 3% 5710 16,001-19,500 GVW-Straight Trucks-General Purpose 168 150,000 132 115,000 3% 6422 19,501-26,000 GVW-Van-Cargo-Step Van 168 150,000 132 115,000 3% 6710 19,501-26,000 GVW-Straight Trucks-General Purpose 168 150,000 132 115,000 3%

Report on a Vehicle Replacement Methodology
REPLACEMENT PLANNING COSTS
Class Description CALTRANS CHP CDCR DPR DGS DFW CALFIRE DWR All Others
1310 < 8500 GVW-Automobile-Subcompact $24,438 $18,000 $23,952 $23,040 $22,212 $21,070 $18,000 $24,446 $18,000 1320 < 8500 GVW-Automobile-Compact $20,060 $14,775 $19,661 $18,912 $16,311 $23,960 $14,775 $20,066 $14,775
1325 < 8500 GVW-Automobile-Compact-
Hybrid $26,620 $19,607 $26,091 $25,097 $22,790 $28,730 $19,607 $26,628 $19,607
1326 < 8500 GVW-Automobile-Compact-Plug-
in Hybrid $40,722 $29,994 $39,913 $38,392 $35,530 $35,110 $29,994 $40,735 $29,994 1327 <8500 GVW-Automobile-Compact-ZEV $35,558 $26,190 $34,851 $35,000 $39,772 $39,772 $26,190 $35,569 $26,190 1330 < 8500 GVW-Automobile-Intermediate $22,034 $16,229 $21,596 $20,773 $19,243 $19,243 $16,229 $22,041 $16,229
1334 < 8500 GVW-Automobile-Intermediate-
Hybrid $31,335 $23,080 $30,712 $29,542 $25,943 $27,017 $23,080 $31,345 $23,080
1336 < 8500 GVW-Automobile-Intermediate-
PHEV/ZEV $39,739 $29,270 $38,949 $37,466 $31,571 $34,263 $33,890 $39,752 $29,270
1338 < 8500 GVW-Automobile-Intermediate-
Law Enforcement $38,326 $28,229 $37,564 $46,000 $34,835 $33,044 $28,229 $38,338 $28,229
1339 < 8500 GVW-Automobile-Intermediate-
PlugIn Hybrid $41,924 $30,879 $41,090 $39,525 $28,743 $36,146 $30,879 $41,937 $30,879 1340 < 8500 GVW-Automobile-Full Size $24,723 $18,210 $24,232 $23,309 $19,676 $21,316 $20,000 $24,731 $18,210
1341 <8500 GVW-Automobile-Full Size-Plug In
Hybrid $33,548 $24,710 $32,881 $31,629 $30,492 $30,492 $24,710 $33,559 $24,710
1343 < 8500 GVW-Automobile-Full Size-
Station Wagon $24,723 $18,210 $24,232 $23,309 $22,471 $22,471 $18,210 $24,731 $18,210
1348 < 8500 GVW-Automobile-Full Size-Law
Enforcement $41,016 $26,925 $40,200 $43,000 $24,150 $35,363 $30,210 $41,028 $30,210 1418 < 8500 GVW-Van-Window-Mini $27,595 $20,325 $27,046 $26,016 $22,493 $23,792 $20,325 $27,603 $20,325 1420 < 8500 GVW-Van-Cargo $25,784 $18,991 $25,271 $24,308 $21,954 $22,231 $18,991 $25,792 $18,991 1510 < 8500 GVW-Pickups-Compact $25,304 $18,638 $24,801 $23,857 $23,000 $29,300 $18,638 $25,312 $18,638 1520 < 8500 GVW-Pickups-Half Ton-4x2 $23,814 $23,068 $23,340 $22,451 $21,608 $22,200 $17,540 $23,821 $17,540 1525 < 8500 GVW-Pickups 4X4 $29,077 $21,417 $28,499 $27,414 $22,996 $30,150 $21,417 $29,087 $21,417 1530 < 8500 GVW-Pickups-3/4 Ton-4x2 $27,564 $29,081 $27,016 $25,987 $23,138 $31,000 $20,302 $27,572 $20,302 1535 < 8500 GVW-Pickups-4x4 $31,075 $38,295 $30,457 $29,297 $26,611 $33,000 $22,888 $31,084 $22,888

Report on a Vehicle Replacement Methodology
Class Description CALTRANS CHP CDCR DPR DGS DFW CALFIRE DWR All Others
1548 < 8500 GVW-Pickups-Emergency
Services-Law Enforcement $47,367 $34,888 $46,425 $48,000 $43,052 $45,000 $28,600 $47,382 $34,888 1620 < 8500 GVW-Sport Utility-Half Ton $26,069 $19,201 $25,551 $28,000 $23,694 $22,476 $19,201 $26,077 $19,201 1621 < 8500 GVW-Sport Utility-4X4 $24,691 $35,325 $24,200 $27,000 $42,493 $23,560 $18,186 $24,698 $18,186
1622 < 8500 GVW-Sport Utility-Half Ton-4
Passenger $24,691 $18,186 $24,200 $23,278 $22,442 $35,000 $18,186 $24,698 $18,186 1624 < 8500 GVW-Sport Utility-Half Ton-Hybrid $37,082 $27,313 $36,345 $34,961 $33,705 $33,705 $27,313 $37,094 $27,313 1625 < 8500 GVW-Sport Utility-PHEV/ZEV $45,056 $33,186 $44,160 $42,478 $40,952 $40,952 $33,186 $45,070 $33,186 1630 < 8500 GVW-Sport Utility-3/4 Ton $36,570 $26,936 $35,844 $34,478 $33,239 $33,239 $26,936 $36,582 $26,936 1632 <8500 GVW-Sport Utility 4X4 $40,187 $29,600 $39,389 $37,888 $36,527 $36,527 $29,600 $40,200 $29,600 1635 < 8500 GVW-Sport Utility-3/4 Ton-Hybrid $60,285 $44,403 $59,087 $56,836 $54,794 $54,794 $44,403 $60,304 $44,403
1648 < 8500 GVW-Sport Utility-Emergency
Services-Law Enforcement $56,480 $29,044 $55,357 $53,248 $30,146 $48,696 $30,000 $56,497 $41,600 2420 8501-10,000 GVW-Van-Cargo $28,165 $20,745 $27,605 $26,554 $28,346 $24,284 $24,583 $28,174 $20,745 2430 8501-10,000 GVW-Van-Cargo-4X4 $34,953 $25,745 $34,259 $32,954 $31,770 $30,137 $25,745 $34,964 $25,745 2510 8501-10,000 GVW-Pickups-One Ton $31,934 $23,521 $31,299 $30,107 $29,025 $36,000 $23,521 $31,944 $23,521 2515 8501-10,000 GVW-Pickup-4X4 $38,722 $28,521 $37,953 $36,507 $35,195 $42,000 $24,322 $38,735 $28,521
2540 8501-10,000 GVW-Pickups-Emergency
Services $48,226 $35,521 $47,268 $49,000 $43,833 $43,833 $29,244 $48,241 $35,521
2548 8501-10,000 GVW-Pickups-Emergency
Services-Law Enforcement $48,226 $35,521 $47,268 $50,000 $43,833 $43,833 $33,561 $48,241 $35,521 2610 8501-10,000 GVW-Sport Utility-One Ton $42,855 $31,565 $42,003 $40,403 $38,952 $38,952 $31,565 $42,869 $31,565 2611 8501-10,000 GVW-Sport Utility-4X4 $56,547 $41,650 $55,423 $53,312 $51,397 $51,397 $41,650 $56,565 $41,650
2648 8501-10,000 GVW-Sport Utility-
Emergency Services-Law Enforcement $59,147 $43,565 $57,972 $58,000 $53,760 $53,760 $43,565 $59,166 $43,565
2710 8501-10,000 GVW-Straight Trucks-
General Purpose $31,854 $23,462 $31,221 $33,000 $28,952 $28,952 $23,462 $31,864 $23,462
3421 10, 001-14,000 GVW-Van-Cargo-
Standard Van $35,495 $26,144 $34,790 $33,464 $32,262 $32,262 $26,144 $35,506 $26,144
3426 10, 001-14,000 GVW-Van-Cargo-
Cutaway Ambulance $54,307 $40,000 $53,228 $51,200 $49,361 $49,361 $40,000 $54,324 $40,000 3510 10, 001-14,000 GVW-Pickups-Super Duty $39,386 $29,010 $38,603 $40,000 $35,799 $42,900 $29,010 $39,399 $29,010

Report on a Vehicle Replacement Methodology
Class Description CALTRANS CHP CDCR DPR DGS DFW CALFIRE DWR All Others
3548 10, 001-14,000 GVW-Pickups-
Emergency Services-Law Enforcement $55,678 $41,010 $54,572 $56,000 $50,607 $48,006 $41,010 $55,696 $41,010 3700 10, 001-14,000 GVW-Straight Trucks $48,999 $36,090 $48,025 $46,195 $44,536 $44,536 $36,090 $49,014 $36,090 3715 10, 001-14,000 GVW-Straight Trucks-4X4 $55,787 $41,090 $54,678 $52,595 $50,706 $50,706 $41,090 $55,805 $41,090
4411 14,001-16,000 GVW-Van-Window-
General Purpose $44,803 $33,000 $43,913 $42,240 $40,722 $38,629 $33,000 $44,817 $33,000
4422 14,001-16,000 GVW-Van-Cargo-Step
Van $52,950 $39,000 $51,897 $49,920 $48,126 $45,653 $39,000 $52,966 $39,000
4511 14,001-16,000 GVW-Pickups-General
Purpose-Regular Cab $55,665 $41,000 $54,558 $55,000 $50,595 $47,994 $41,000 $55,682 $41,000 4700 14,001-16,000 GVW-Straight Trucks $52,264 $38,495 $51,225 $51,000 $47,503 $47,503 $49,724 $52,280 $38,495
5422 16,001-19,500 GVW-Van-Cargo-Step
Van $38,623 $28,448 $37,856 $36,413 $35,105 $33,301 $28,448 $38,635 $28,448
5710 16,001-19,500 GVW-Straight Trucks-
General Purpose $52,264 $38,495 $51,225 $49,274 $47,503 $52,135 $38,495 $52,280 $38,495
6422 19,501-26,000 GVW-Van-Cargo-Step
Van $60,410 $44,495 $59,209 $56,954 $54,907 $52,085 $44,495 $60,429 $44,495
6710 19,501-26,000 GVW-Straight Trucks-
General Purpose $56,246 $41,428 $55,128 $53,028 $51,123 $48,495 $41,428 $56,264 $41,428

Report on a Vehicle Replacement Methodology
REPLACEMENT FUNDING REQUIREMENTS BY DEPARTMENT
Department 2017 2018 2019 2020 California Highway Patrol $11,443,414 $11,203,492 $11,295,954 $10,838,030 Department of Corrections and Rehabilitation
$44,826,249 $6,419,750 $18,929,861 $33,910,877
Department of Fish and Wildlife $7,183,936 $12,140,533 $4,841,221 $4,109,458 Department of Forestry and Fire Protection
$5,630,854 $3,827,227 $6,184,982 $6,681,206
Department of General Services $4,218,916 $6,566,060 $11,198,295 $15,594,121 Department of Parks and Recreation $8,388,656 $9,288,645 $14,217,815 $11,247,345 Department of Transportation $45,777,443 $92,255,807 $67,321,187 $47,859,630 Department of Water Resources $5,287,752 $3,398,598 $6,353,391 $6,898,476 Others $30,764,298 $18,467,702 $21,855,646 $18,210,169 Total $163,521,518 $163,567,814 $162,198,352 $155,349,312