report of the scientific committee on food on the revision ... · european commission health and...
TRANSCRIPT
EUROPEAN COMMISSIONHEALTH and CONSUMER PROTECTION DIRECTORATE-GENERAL
Directorate C - Scientific OpinionsC2 - Management of scientific committees; scientific co-operation and networks
Scientific Committee on Food
SCF/CS/NUT/IF/65 Final18 May 2003
Report of the Scientific Committee on Food
on the Revision of Essential Requirements of Infant Formulae and Follow-on Formulae
(adopted on 4 April 2003)
B-1049 Bruxelles/ Brussels - Belgium Telephone: direct line (+32-2) 29 581.10/659.48/648.70, exchange 299.11.11. Fax: (+32-2) 299.48.91
Telex: COMEU B 21877. Telegraphic address: COMEUR Brussels.http://europa.eu.int/comm/food/fs/sc/scf/index_en.html
Contains a corrigendum made on 17/09/2007 on page 60, chapter 4.7.2 Carnitine

2
TABLE OF CONTENTS
LIST OF ABBREVIATIONS................................................................................................ 10
TERMS OF REFERENCE AND BACKGROUND ........................................................... 12
Terms of Reference ................................................................................................................ 12
Background............................................................................................................................. 12
Acknowledgements................................................................................................................. 12
I. INTRODUCTION AND GENERAL ASPECTS..................................................... 13
1. General aspects of infant feeding .................................................................. 13
2. Breast-feeding ................................................................................................. 13
3. Infant formulae and follow-on formulae ...................................................... 14
4. General principles adopted in the Committee’s scientific review onrequirements of infant formulae and follow-on formulae .......................... 14
II. ENERGY CONTENT ................................................................................................ 17
1. Current requirements concerning minimum and maximum energy contentin infant formulae and follow-on formulae marketed in the EU ............... 17
2. Comments on the existing requirements concerning energy in infantformulae and follow-on formulae in the Infant Formulae Directive ......... 172.1. Energy density of human milk.............................................................. 17
2.2. Growth of breast-fed and formula-fed infants ...................................... 17
2.3. Energy requirements of infants............................................................. 19
2.4. Energy expenditure: comparison between breast-fed and formula-fedinfants.................................................................................................... 20
2.5. Feeding in early childhood and later growth, and nutritional status..... 22
3. Minimum and maximum energy content in infant formulae and follow-onformulae........................................................................................................... 22
4. Conclusion and recommendation.................................................................. 25

3
III. PROTEIN CONTENT ............................................................................................... 26
1. Introduction .................................................................................................... 26
2. General considerations on protein in formulae ........................................... 262.1. Protein composition of infant formulae and human milk ..................... 26
2.2. Protein composition of follow-on formulae.......................................... 31
2.3. Effects of processing on nutritional value ............................................ 33
2.4. Recommendation .................................................................................. 34
3. Current requirements concerning protein in infant formulae and follow-on formulae in the Infant Formulae Directive ............................................. 343.1. Calculation of protein ........................................................................... 34
3.2. Sources of protein ................................................................................. 34
3.3. Protein content ...................................................................................... 35
3.4. Protein quality....................................................................................... 35
3.5. Amino acid pattern of the reference proteins human milk and cows’milk casein ............................................................................................ 36
4. Comments on the existing requirements for protein................................... 374.1. Calculation of protein content............................................................... 37
4.1.1. Calculation from nitrogen content ......................................................37
4.1.2. Protein determination..........................................................................38
4.1.3. Protein as sum of amino acids.............................................................39
4.1.4. Conclusion and recommendation........................................................40
4.2. Protein sources ...................................................................................... 414.2.1. Proteins permitted ...............................................................................41
4.2.2. Other milks..........................................................................................414.2.2.1. Protein and amino acids...................................................................414.2.2.2. Digestibility .....................................................................................424.2.2.3. Allergenicity ....................................................................................424.2.2.4. Bioavailability of nutrients ..............................................................42
4.2.3. Plant proteins (vegetables and legumes) ............................................ 424.2.3.1. Soy protein-based infant formulae...................................................424.2.3.2. Protein and amino acids, digestibility, bioavailability of nutrients,
allergenicity of other plant proteins .................................................45
4.2.4. Recommendation ................................................................................45
4.3. Protein hydrolysates.............................................................................. 454.3.1. Conclusion and recommendation........................................................48

4
4.4. Protein content ...................................................................................... 484.4.1. The model of human milk...................................................................48
4.4.2. Protein requirements from studies with infant formulae compared tothe human milk model ........................................................................48
4.4.3. The minimum protein content in infant formulae ...............................50
4.4.4. The minimum protein content in follow-on formulae.........................51
4.4.5. The maximum protein content in infant formulae ..............................53
4.4.6. The maximum protein content in follow-on formulae........................53
4.5. Protein quality...................................................................................... .534.5.1. Amino acid score ................................................................................54
4.5.2. Protein Efficiency Ratio (PER) and Net Protein Utilisation (NPU) .. 54
4.5.3. Other qualifying factors for protein ....................................................54
4.6. Amino acids in reference proteins ........................................................ 554.6.1. Comparison to the FAO/WHO/UNU scoring pattern.........................55
4.6.2. Other scoring patterns .........................................................................56
4.6.3. Recommendation ................................................................................59
4.7. Taurine, carnitine, nucleotides, choline and other nitrogen-containingcompounds ............................................................................................ 594.7.1. Taurine ................................................................................................59
4.7.2. Carnitine..............................................................................................60
4.7.3. Nucleotides and nucleosides ...............................................................60
4.7.4. Choline................................................................................................64
4.7.5. Other nitrogen-containing compounds................................................65
5. Summary of all conclusions and recommendations .................................... 65
6. Recommendations for future work ............................................................... 68
IV. FAT CONTENT ......................................................................................................... 69
1. Introduction .................................................................................................... 69
2. Total fat ........................................................................................................... 702.1. Structured triglycerides......................................................................... 71
2.2. Medium-chain triglycerides (MCT)..................................................... 72
2.3. Phospholipids........................................................................................ 72
2.4. Inositol .................................................................................................. 73

5
3. Fatty acids ....................................................................................................... 73
3.1. Saturated fatty acid ............................................................................... 73
3.2. Trans fatty acids.................................................................................... 743.2.1. Conjugated linoleic acid (CLA)..........................................................74
3.3. Polyunsaturated fatty acids (PUFA) ..................................................... 75
3.3.1. Linoleic acid (LA) and �-linolenic acid (ALA)..................................75
3.3.2. Arachidonic acid (AA) and docosahexaenoic acid (DHA)................ 76
3.3.3. Erucic acid ..........................................................................................78
4. Summary of all recommendations ................................................................ 78
V. CARBOHYDRATES ................................................................................................. 81
A. MOSTLY DIGESTIBLE CARBOHYDRATES ..................................................... 81
1. Introduction .................................................................................................... 81
2. Current requirements concerning minimum and maximum carbohydratecontent and type of digestible carbohydrate in infant formulae and follow-on formulae marketed in the EU................................................................... 812.1. Amounts of carbohydrate...................................................................... 81
2.2. Types of carbohydrates ........................................................................ 82
3. Comments on the existing requirements of the Infant FormulaeDirective........................................................................................................... 823.1. General comments on the carbohydrate content of formulae and human
milk ....................................................................................................... 82
3.2. Hereditary disorders of metabolism or transport of sugars................... 84
3.3. Total carbohydrates in infant formulae................................................. 85
3.4. Total carbohydrates in follow-on formulae .......................................... 85
3.5. Type of carbohydrate in infant formulae and follow-on formulae ....... 863.5.1. Lactose in infant formulae ..................................................................86
3.5.2. Lactose in follow-on formulae............................................................87
3.5.3. Saccharose (and fructose) in infant formulae .....................................87
3.5.4. Saccharose (and fructose) in follow-on formulae ...............................87
3.5.5. Maltose in infant formulae and follow-on formulae ...........................88
3.5.6. Maltodextrins and corn-starch syrup solids in infant formulae ..........88
3.5.7. Maltodextrins and corn-starch syrup solids in follow-on formulae ....88
3.5.8. Glucose in infant formulae and follow-on formulae...........................88
3.5.9. Starches in infant formulae .................................................................88

6
3.5.10. Starches in follow-on formulae...........................................................89
B. MOSTLY NON-DIGESTIBLE CARBOHYDRATES ........................................... 89
1. Introduction .................................................................................................... 89
2. European legislation and previous Committee’s statements on the contentof non-digestible carbohydrates in infant formulae and follow-onformulae........................................................................................................... 90
3. Non-digestible carbohydrates ........................................................................ 913.1. Gums..................................................................................................... 91
3.1.1. Locust bean gum.................................................................................91
3.1.2. Guar gum ............................................................................................92
3.1.3. Pectins .................................................................................................93
3.2. Oligosaccharides ................................................................................... 933.2.1. Effects of oligofructosyl-saccharose (FOS) and oligogalactosyl-
lactose (GOS) on the faecal flora........................................................95
3.2.2. Health benefits of FOS and GOS in children......................................96
3.3. Fructans other than FOS ....................................................................... 97
3.4. Carrageenan .......................................................................................... 97
VI. LIPID-SOLUBLE VITAMINS ................................................................................. 99
1. Introduction .................................................................................................... 99
2. Vitamin A ........................................................................................................ 992.1. Vitamin A deficiency............................................................................ 99
2.2. Vitamin A excess ................................................................................ 100
2.3. Intake with human milk ...................................................................... 100
2.4. Desirable intakes................................................................................. 100
2.5. Recommendation ................................................................................ 100
3. Vitamin D ...................................................................................................... 1013.1. Description of vitamin D .................................................................... 101
3.2. Hypovitaminosis D ............................................................................. 101
3.3. Hypervitaminosis D ............................................................................ 102
3.4. Desirable intakes................................................................................. 103
3.5. Recommendation ............................................................................... 103
7
4. Vitamin E....................................................................................................... 1044.1. Vitamin E deficiency .......................................................................... 104
4.2. Vitamin E excess ................................................................................ 105
4.3. Desirable intakes................................................................................. 105
4.4. Recommendation ............................................................................... 105
5. Vitamin K ...................................................................................................... 1055.1. Intake with human milk ...................................................................... 106
5.2. Vitamin K deficiency.......................................................................... 106
5.3. Vitamin K excess ................................................................................ 106
5.4. Desirable intakes................................................................................. 106
5.5. Recommendation ................................................................................ 107
VII. WATER-SOLUBLE VITAMINS ........................................................................... 108
1. Introduction .................................................................................................. 108
2. Thiamine, B1.................................................................................................. 111
3. Riboflavin, B2 ................................................................................................ 113
4. Niacin, B3 ....................................................................................................... 114
5. Pantothenic Acid, B5..................................................................................... 116
6. Pyridoxine, B6................................................................................................ 117
7. Folates ............................................................................................................ 119
8. Cobalamin, B12 .............................................................................................. 121
9. Ascorbic acid, vitamin C .............................................................................. 123
10. Biotin.............................................................................................................. 124
VIII. MINERALS AND TRACE-ELEMENTS .............................................................. 127
A. Iron............................................................................................................................. 127
1. Introduction .................................................................................................. 127
2. Iron requirements in infancy....................................................................... 1272.1. Determinants of iron stores at birth .................................................... 127
2.2. Requirements for growth .................................................................... 128
2.3. Iron stores at birth affect requirements after birth .............................. 128
3. Addition of iron to infant formulae............................................................. 128

8
4. Iron in breast milk and infant formulae..................................................... 129
5. Absorption of iron from breast milk and infant formulae ....................... 130
6. From what ages is iron addition to formula needed?............................... 131
7. Clinical studies on different contents of iron ............................................. 1327.1. Haematologic outcome ....................................................................... 132
7.2. Neurodevelopmental outcome ............................................................ 133
7.3. Growth ................................................................................................ 133
8. Potential negative effects of added iron...................................................... 1348.1. Mineral absorption.............................................................................. 134
8.2. Infections ............................................................................................ 134
8.3. Other adverse effects .......................................................................... 134
9. Conclusion ..................................................................................................... 135
10. Recommendation .......................................................................................... 136
B. Calcium...................................................................................................................... 136
C. Phosphorus................................................................................................................ 137
D. Magnesium ................................................................................................................ 139
E. Sodium, potassium and chloride ............................................................................. 140
F. Copper ....................................................................................................................... 141
G. Zinc ............................................................................................................................ 142
H. Chromium ................................................................................................................. 145
I. Manganese................................................................................................................. 146
J. Molybdenum ............................................................................................................. 147
K. Fluoride ..................................................................................................................... 148
L. Iodine ......................................................................................................................... 150
M. Selenium .................................................................................................................... 152
IX. PROBIOTICS........................................................................................................... 154
1. Introduction .................................................................................................. 154
2. Legislation ..................................................................................................... 1542.1. Legislation on bacteria in infant formulae .......................................... 154
3. Scientific reports on the use of probiotic bacteria in foods....................... 1553.1. General reports.................................................................................... 155
3.2. AFSSA report on the use of probiotic foods in infants....................... 157

9
4. Comments and conclusions.......................................................................... 1584.1. Use of probiotics in infant formulae and follow-on formulae ............ 158
4.2. Requirements for the use of probiotic bacteria in follow-onformulae .............................................................................................. 158
4.3. Labelling requirements for follow-on formulae with added probioticbacteria................................................................................................ 159
X. COMMENTS ON THE PRESENTATION OF INFANT FORMULAE ANDFOLLOW-ON FORMULAE .................................................................................. 160
XI. MODIFICATION OF THE COMPOSITION OF INFANT FORMULAE ORFOLLOW-ON FORMULAE BEYOND THE ESTABLISHEDSTANDARDS............................................................................................................ 162
XII. REFERENCES ......................................................................................................... 165
Annex. SUMMARY TABLE OF RECOMMENDATIONS ON THE COMPOSITIONOF INFANT FORMULAE AND FOLLOW-ON FORMULAE.......................... 209

10
LIST OF ABBREVIATIONS
AA arachidonic acidADI acceptable daily intakeALA α-linolenic acidAMP adenosine 5’-monophosphateATP adenosine triphosphateBSSL Bile salt stimulated lipaseCFM cereal-fruit mealCFR code of federal regulations (USA)CFU colony forming unitsCLA conjugated linoleic acidCMP cytidine 5’-monophosphateDBP vitamin D binding proteinDHA docosahexaenoic acidDHGLA dihomo-�-linolenic acidDNA deoxyribonucleic acidECF extra-cellular fluidEGRAC erythrocyte glutathione reductase activityEPA eicosapentaenoic acidEU European UnionFA fatty acidsFAD flavin adenine dinucleotideFMN flavin mononucleotideFNB Food and Nutrition BoardGMP guanosine 5’-monophosphate GRAS generally recognized as safeHDL high-density lipoproteinHiB Haemophilus influenzae type B ID iron deficiencyIDA deficiency anaemiaIMP inosine 5’-monophosphateLA linoleic acidLCPUFA long-chain polyunsaturated fatty acidsLCT long-chain triglyceridesLDL low-density lipoproteinLSRO Life Sciences Research OfficeMCM milk-cereal mealMCT medium-chain triglyceridesMCV medium corpuscular volumeMM molecular massMRI magnetic resonance imagingMUFA monounsaturated fatty acidsNAD nicotine adenine dinucleotideNE niacin equivalentsNPN non-protein nitrogenNPR net protein ratioNPU net protein utilisationPC phosphatidyl cholinePE phosphatidyl ethanolaminePER protein efficiency ratio

11
PGA pteroyl glutamic acidPI phosphatidyl inositolPRI population reference intakePS phosphatidyl serine PTH parathyroid hormonePUFA polyunsaturated fatty acidsRAAR relative amino acid ratingRAST radio allergen sorbent testRDA recommended dietary allowancesRE retinol equivalentsRNA ribonucleic acidRNIs reference nutrient intakesSAFA saturated fatty acidsSAM S-adenosyl methionineSD standard deviationTE tocopherol equivalentsTN total nitrogenTPD true protein digestibility UHT ultra-high temperature UL tolerable upper intake levelUMP uridine 5’-monophosphateUSA United States of AmericaVLDL very low-density lipoproteinVMM vegetable-meat meal1,25(OH)2D 1,25-dihydroxy-vitamin D25(OH)D 25-hydroxy-vitamin D

12
TERMS OF REFERENCE AND BACKGROUND
Terms of Reference
The Committee was asked to revise the essential requirements of infant formulae and follow-on formulae intended for the feeding of infants and young children.
Background
The Community had adopted harmonised rules on the composition of infant formulae andfollow-on formulae (Directive 91/321 EEC, amended by Directive 96/4/EC, hereinafterreferred to as the Infant Formulae Directive) in 1991 and 1996. Such rules include essentialrequirements for these products. These essential requirements were based on a number ofopinions of the Committee (SCF, 1983, 1989, 1991, 1993a, and 1995). It was considerednecessary to review and update the scientific basis of the above Community legislation takinginto account scientific and technical developments. In addition, an updated scientific basiswas also expected to contribute to the ongoing process of the Codex Alimentarius in revisingthe existing Codex standard on infant formulae (CAC, 2002). In the context of its review, theCommittee was also requested to address specifically the issue of nucleotide content and ofthe content of fructo-oligosaccharides (FOS) and galacto-oligosaccharides (GOS) in theseproducts.
Acknowledgements
The present opinion was prepared on the basis of a draft prepared by a working groupcomposed of Prof. Dr. B. Koletzko as rapporteur (Kinderklinik und Kinderpoliklinik Dr. vonHaunesches Kinderspital, München, Germany), and Prof. Dr. W. Saris (OnderzoeksinstituutNutrim, Maastricht, The Netherlands) as the chair of the working group. Other members ofthe working group were Prof. A. Flynn (Faculty of Food Science and Technology, UniversityCollege Cork, Cork, Ireland), Prof. A. Palou (Universitat de les Illes Balears, Palma deMallorca, Spain) and Dr. JM. Wal (Institute Nacionale de la Reserche Agronomique, Gif surYvette Cedex, France), and ad hoc experts were Prof. O. Hernell (Department of ClinicalScience, Paediatrics Umeå University, Umeå, Sweden), Prof. A. Jackson (Institute of HumanNutrition, Southampton, United Kingdom), Prof. Dr. H. Przyrembel (Bundesinstitut fürRisikobewertung, Berlin, Germany) and Prof. D. Turck (Université de Lille, Lille, France).

13
I. INTRODUCTION AND GENERAL ASPECTS
1. GENERAL ASPECTS OF INFANT FEEDING
The adequate supply of nutrients through the provision of safe foodstuffs with a balancedcomposition is even more important for infants than for healthy children and adults duringany other period of the life. The very rapid rate of growth of healthy infants born at full term,who double their weight in only 4-5 months after birth, results in relatively high requirementsof energy and nutrients per kilogram body weight. In addition to meeting maintenancerequirements, infants must cover the energy and substrate needs for the synthesis anddeposition of newly formed tissues. The resulting large metabolic requirements contrast withthe limited capacity of young infants to compensate for an unbalanced nutrient supply due tosmall body stores of nutrients and immature homeostatic mechanisms. For example, theactivity of some metabolic pathways and the renal capacity to concentrate urine is still low ininfants during the first 3-4 months of life (Koletzko, 2003; Wharton and Scott, 1996). Younginfants may be unable to synthesize sufficient amounts of certain substrates otherwiseconsidered non-essential or dispensable, because the limited capacity of specific metabolicsynthesis pathways would not always suffice to match high requirements. Some substratesconsidered dispensable in adults or older children may become conditionally indispensablesubstrates for infants that should be supplied with the diet.
In addition to immediate consequences of infant feeding on growth, body composition, healthand well-being, a number of recent studies have also provided indications that the quantityand quality of nutrient supply during infancy has important long-term consequences on organdevelopment and function, health and disease risks as well as cognitive ability in later life.This phenomenon has been referred to as early metabolic programming or metabolicimprinting of long-term health and development (Barker, 1994; Lucas, 1998).
In consideration of the particular risk of infants to experience untoward effects by diets withproviding either too low or too high supplies of specific substrates (Fomon, 2001), and thefact that during the first months after birth usually one sole milk source must meet all theinfant’s dietary requirements, special efforts are required to secure an adequate dietarycomposition for infants.
2. BREAST-FEEDING
The Committee strongly supports breast-feeding as the ideal way of feeding infants born atterm, and it recommends that efforts are made to continue to promote and support breast-feeding in the European Union. In most cases breast-feeding provides an adequate supply ofnutrients to support healthy growth and development of infants, it provides anti-infectiveprotection, and it forms a unique biological and emotional basis for the health and well-beingof both mother and child (WHO, 1986; Kunz et al., 1999; Koletzko et al., 2000). Comparativestudies in affluent countries have indicated important advantages of breast-feeding overformula-feeding for the recipient infants, such as lower incidence rates of gastrointestinal andrespiratory infections (Forsyth, 1995), reduced rates of later juvenile type diabetes (Hypponenet al., 1999) and obesity (von Kries et al., 1999; Toschke et al., 2002), as well as better long-term cognitive achievements (Anderson et al., 1999; Mortensen et al., 2002).
14
Considering the many benefits of breast-feeding, the Committee fully supports therecommendations of the Fifty-Fourth World Health Assembly (2001) to promote and supportexclusive breast-feeding for six months as a public health recommendation for populations.The Committee is also in agreement with the conclusions of the WHO expert consultation onthe optimal duration of exclusive breast-feeding that some infants, for example infants withhigh requirements of specific nutrients such as iron, may benefit from the introduction ofnutrient sources other than breast milk prior to the age of 6 months (WHO, 2001b;ESPGHAN, 2002).
3. INFANT FORMULAE AND FOLLOW-ON FORMULAE
Infants who cannot be fed at the breast, or should not receive breast milk, or for whom breastmilk is not available, require breast milk substitutes of high quality (Thirty-Ninth WorldHealth Assembly, 1986). Standards for such breast milk substitutes, namely infant formulaemanufactured from cows’ milk or soya, have been established in the European Union by theInfant Formulae Directive. This Directive was based upon the following documents: 1) Firstreport on the essential requirements of infant formulae and follow-up milks based on cows’milk proteins (SCF, 1983); 2) The minimum requirements for soya-based infant formulae andfollow-up milks (SCF, 1989); 3) First addendum to the aforementioned reports (SCF, 1991);4) Report on infant formulae claimed to be “hypoallergenic” or “hypoantigenic”, and Secondaddendum concerning the essential requirements of infant formulae and follow-up milksbased on cows’ milk proteins and the minimal requirements for soya-based infant formulaeand follow-up milks (SCF, 1993a); and 5) Report on essential requirements for infantformulae and follow-on formulae (SCF, 1995).
According to the Infant Formulae Directive, “infant formulae” means foodstuffs intended forparticular nutritional use by infants during the first four to six months of life and satisfying bythemselves the nutritional requirements of this category of persons, whereas “follow-onformulae” means foodstuffs intended for particular nutritional use by infants aged over fourmonths and young children and constituting the principal liquid element in a progressivelydiversified diet of this category of persons.
4. GENERAL PRINCIPLES ADOPTED IN THE COMMITTEE’S SCIENTIFICREVIEW ON REQUIREMENTS OF INFANT FORMULAE AND FOLLOW-ON FORMULAE
The Committee adopted the following principles:
1. All infant formulae must be safe and meet the normal nutritional requirements ofinfants born at term when used as the sole source of nutrition during the first monthsof life. Infant formulae may also continue to be used during the later part of infancy aspart of a progressively diversified diet.
2. All follow-on formulae must be safe and meet the normal nutritional requirements ofgenerally healthy infants and young children, when used as the principal liquidelement in a progressively diversified diet after the timely introduction ofcomplementary foods.
3. The formulation of infant formulae and of follow-on formulae must be based on sound

15
medical and nutritional principles. Their use should have been demonstrated, byscientific evidence, to be safe and beneficial in meeting the particular nutritionalrequirements and to promote normal growth and development of the infants for whomthey are intended (ESPGHAN, 2000; Koletzko et al., 2002).
4. Although the composition of human milk of healthy, well-nourished women canprovide some guidance for the composition of infant formulae and follow-onformulae, gross compositional similarity is not an adequate determinant or indicator ofthe safety and nutritional adequacy of dietary substitutes in infants (ESPGHAN, 2000;COMA, 1996). The composition of human milk is remarkable for its variability, as thecontent of many nutrients changes during lactation, or throughout the day, or differsamong women (Kunz et al., 1999; Rodriguez et al., 1999). Moreover, there areconsiderable differences in the bioavailability and metabolic effects of similar contentsof many specific nutrients in human milk and formulae, respectively. Thus,conclusions on the suitability and safety of nutrient contents in infant formula cannotbe simply based on its similarity to human milk composition.
5. A more useful approach to evaluate the adequacy of infant formula composition is thecomparison of physiological (e.g. growth patterns), biochemical (e.g. plasma markers)and functional (e.g. immune response) outcomes in infants fed formulae with those inpopulations of healthy infants who have been exclusively breast-fed for four to sixmonths (ESPGHAN, 2001; COMA, 1996; Koletzko et al., 2002).
6. Although the feeding of infant formulae and follow-on formulae has a history ofapparently safe use, the outcomes of formula-fed infants are not equal to those ofbreast-fed populations (Koletzko et al., 2000; Forsyth, 1995; Hypponen et al., 1999;von Kries et al., 1999; Toschke et al., 2002; Anderson et al., 1999; Mortensen et al.,2002). Therefore, it is unreasonable to assume that the range of infant and follow-onformulae that have been in use so far would represent the optimal composition thatmight be achieved.
7. Infant formulae and follow-on formulae should only contain components in suchamounts that serve a nutritional purpose or other benefit. A documented safety ofcomponents in particular amounts in adults or older children does not establish theirsafety in infants. The inclusion of unnecessary components may put a burden onmetabolic and other physiologic functions of the infant. Those components taken inthe diet which are not utilised or stored by the body have to be excreted, often assolutes in the urine. Since water available to form urine is limited and the infant’sability to concentrate urine is immature during the first months of life, the need toexcrete any additional solutes will reduce the margin of safety, especially underconditions of stress, such as fever, diarrhoea or during weight loss.
8. The goal of establishing minimum and maximum values of nutrients is to provide safeand nutritionally adequate infant formula products that meet the normal nutritionalrequirements of healthy babies. Minimum and maximum values should be based onadequate scientific data that establish the needs for practically all infants in the targetpopulations, and the absence of adverse effects (ESPGHAN, 1997). In the absence ofan adequate scientific evaluation, minimum and maximum values should at least bebased on an established history of apparently safe use. The establishment of minimumand maximum values also should take into account where possible other factors suchas bioavailability and losses during processing and shelf-life. Minimum and maximum

16
values refer to total nutrient contents of infant formulae and follow-on formulae asprepared ready for consumption according to the instructions of the manufacturer. TheCommittee recognises the importance of the quality of the water that is used forreconstituting powdered formulae.
When establishing minimum and maximum values of nutrients per 100 kcal, withconsideration of reference nutrient intakes established by the Committee (SCF, 1993b)and other scientific bodies, calculations are based on a reference infant with a weightof 5 kg consuming per day an amount of infant or follow-on formula with an energycontent of 500 kcal (100 kcal/kg body weight per day).
9. The general considerations and the suggested values for minimum and maximumlevels of nutrients described here for infant formulae and follow-on formulae may alsoserve as the basis for defining revised compositional criteria for foods for specialmedical purposes for infants, unless the disease conditions for which such foods forspecial medical purposes are to be used necessitate other compositional aspects.
10. As part of the review on the requirements of infant formulae and follow-on formulae,the Committee reviewed the scientific basis for the current European standards for thepresentation of such products (Directive 91/321/EEC, Article 9) and recommends thatsome of these claims should be reconsidered (cf. chapter X). The Committee alsorecommends that mechanisms and criteria should be developed for the communicationnot only of relevant compositional properties, but possibly also of a limited number ofselected other effects of infant formulae or follow-on formulae if they have beendemonstrated beyond doubt in rigorous studies with adequate scientific standards, andthe evidence has been accepted by an independent scientific body reviewing such data.
11. The Committee recommends that the addition of new ingredients to infant formulae orfollow-on formulae, or of established ingredients in newly determined amounts,beyond the established standards on formula composition, should be made possible iftheir benefit, suitability and safety for particular use by infants have been establishedby generally accepted scientific data. The Committee notes the absence of clearguidance on the nature and extent of the information that should be submitted insupport of the suitability and safety of modifications to be introduced. This makes itdifficult for interested manufacturers to design and undertake studies for this purpose.Thereby, a real need to establish general guidelines is identified. As part of this report,the Committee proposes general principals for such evaluations (see chaper XI) andrecommends that the scientific evidence to support modifications of infant formulaeand follow-on formula beyond the established standards is overseen and evaluated byan independent scientific body prior to the introduction of such products to the market.
17
II. ENERGY CONTENT
1. CURRENT REQUIREMENTS CONCERNING MINIMUM AND MAXIMUMENERGY CONTENT IN INFANT FORMULAE AND FOLLOW-ONFORMULAE MARKETED IN THE EU
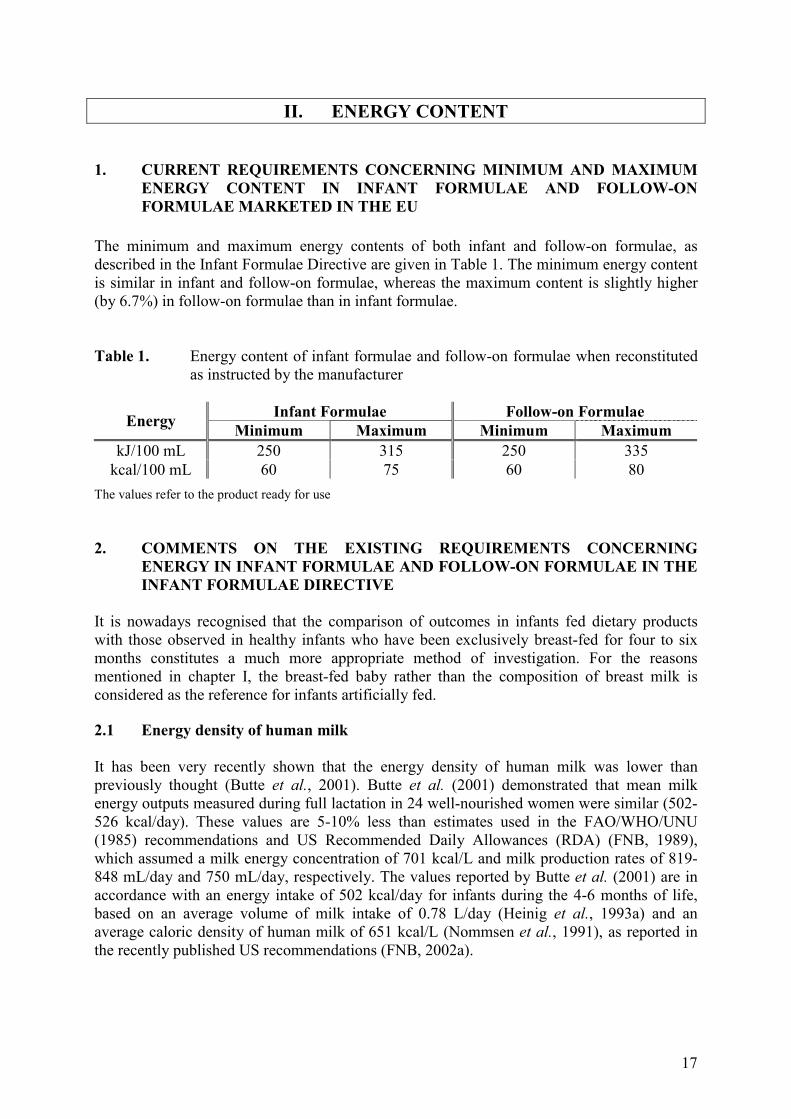
The minimum and maximum energy contents of both infant and follow-on formulae, asdescribed in the Infant Formulae Directive are given in Table 1. The minimum energy contentis similar in infant and follow-on formulae, whereas the maximum content is slightly higher(by 6.7%) in follow-on formulae than in infant formulae.
Table 1. Energy content of infant formulae and follow-on formulae when reconstitutedas instructed by the manufacturer
Infant Formulae Follow-on FormulaeEnergy Minimum Maximum Minimum MaximumkJ/100 mL 250 315 250 335
kcal/100 mL 60 75 60 80The values refer to the product ready for use
2. COMMENTS ON THE EXISTING REQUIREMENTS CONCERNINGENERGY IN INFANT FORMULAE AND FOLLOW-ON FORMULAE IN THEINFANT FORMULAE DIRECTIVE
It is nowadays recognised that the comparison of outcomes in infants fed dietary productswith those observed in healthy infants who have been exclusively breast-fed for four to sixmonths constitutes a much more appropriate method of investigation. For the reasonsmentioned in chapter I, the breast-fed baby rather than the composition of breast milk isconsidered as the reference for infants artificially fed.
2.1 Energy density of human milk
It has been very recently shown that the energy density of human milk was lower thanpreviously thought (Butte et al., 2001). Butte et al. (2001) demonstrated that mean milkenergy outputs measured during full lactation in 24 well-nourished women were similar (502-526 kcal/day). These values are 5-10% less than estimates used in the FAO/WHO/UNU(1985) recommendations and US Recommended Daily Allowances (RDA) (FNB, 1989),which assumed a milk energy concentration of 701 kcal/L and milk production rates of 819-848 mL/day and 750 mL/day, respectively. The values reported by Butte et al. (2001) are inaccordance with an energy intake of 502 kcal/day for infants during the 4-6 months of life,based on an average volume of milk intake of 0.78 L/day (Heinig et al., 1993a) and anaverage caloric density of human milk of 651 kcal/L (Nommsen et al., 1991), as reported inthe recently published US recommendations (FNB, 2002a).
18
2.2 Growth of breast-fed and formula-fed infants
It is well documented that the pattern of growth of formula-fed infants differs from that ofbreast-fed infants (Powers, 2001). The Euro-Growth study collected anthropometric data from319 infants who were exclusively breast-fed according to the 1995 WHO recommendationsfor at least 4 to 5 months, and compared them to anthropometric data of infants who were fedby other modes (Haschke et al., 2000). The pattern of growth of the former children showedhigher weight during the first 2 to 3 months of life and lower weight and length from 6 to 12months. Breast-fed infants tend to gain less weight and usually are leaner than are formula-fedinfants in the second half of the first year of life (Dewey, 2001). The difference in averageattained weight at 12 months is approximately 600 to 650 grams. Butte et al. (2000b) alsoclearly showed that intakes of energy, protein, fat, and carbohydrate were lower in breast-fedthan in formula-fed infants at 3 and 6 months and were positively correlated with weight gainand Fat Free Mass (FFM) gain, but not with Fat Mass (FM) gain. No differences in nutrientintakes were observed at 12 and 24 months.
This difference of growth pattern between breast- and formula-fed infants seems to be theresult of differences of composition between the two diets, but may be also due to differencesin infant self-regulation of energy intake. There is evidence that breast-fed infants self-regulate their energy intake at a lower level than do formula-fed infants (Heinig et al., 1993a).When solid foods are introduced, the breast milk intake declines spontaneously (Heinig et al.,1993b). The mechanisms of self-regulation of energy intake in formula-fed infants are notknown and the risk of overfeeding seems to be higher in this population. An importantquestion is why breast-fed infants achieve a greater metabolic efficiency for the energyconsumed than formula-fed infants. Body temperature and minimal observable metabolic rateare lower in breast-fed than in formula-fed infants, which may be part of the explanation(Dewey, 1998a).
Evidence to date suggests that there are no apparent adverse consequences associated with thelower intake and slower weight gain of breast-fed infants: compared to formula-fed infants,they do not differ in activity level, and they experience less illness and appear to haveenhanced cognitive development (Anderson et al., 1999; Angelsen et al., 2001; Dewey,1998a; Mortensen et al., 2002; Rao et al., 2002). It might be more appropriate to raise thequestion why formula-fed infants consume more energy than breast-fed infants. Butte et al.(1990) have suggested that the higher protein content of infant formula may alter the infant’shormonal status and drive higher energy intake. More information is needed on the balancebetween water and energy requirements. The Committee suggests that research in this areashould be encouraged.
The comparison between breast-fed and formula-fed infants is much less consistent withregard to linear growth, with more than half of the published studies showing no difference byfeeding mode (Dewey, 1998a). When differences in length gain were detected, the magnitudeof the percentage gap between breast-fed and formula-fed infants was considerably less thanthe percentage gap in weight gain. Growth in head circumference is not related to feedingmode. New growth charts based on infants breast-fed throughout the first year of life areneeded and are being developed by WHO (Dewey et al., 1995; Dewey, 1998b; Garza and DeOnis, 1999).
The Euro-Growth study also showed that between 12 and 36 months of age, anthropometricdifferences between infants breast-fed for at least 4 to 5 months and infants fed by othermodes were small and clinically non relevant (Haschke et al., 2000). At 24 months of age, the
19
219 children who had been fed according to WHO recommendations during infancy hadlower length and weight (each by 0.12 z-score). This difference is not significant. Such adifference corresponds to a difference in length of approximately 3 millimetres and adifference of weight of 150 grams. These differences were smaller than the usualmeasurement errors for length (6 millimetres) and weight (239 grams) at that age. The USNational Health and Nutrition Examination Survey (1988-1994) also showed that thedifferences in growth status observed at 8-11 months of age between breast- and formula-fedbabies had dissipated by 12-23 months of age; there were no significant differences up to 5years of age (Hediger et al., 2000). 2.3 Energy requirements of infants
The energy requirements of infants and young children are the energy intakes that willbalance Energy Expenditure (EE) at a Physical Activity Level (PAL) consistent with normalgrowth and development and allow for deposition of tissues at a rate consistent with health. Inolder children, adolescents and adults, energy requirements are based on Basal MetabolicRates (BMR) and an allowance for PAL. Because it was not possible at that time to specifywith any confidence the allowance for a desirable PAL in infants and young children, the1985 FAO/WHO/UNU recommendations for the energy intake from birth to 10 years of agewere derived from the observed intakes of healthy, thriving children (FAO/WHO, 1985).Energy requirements of infants were based on energy intakes compiled by Whitehead et al.(1981) from the literature predating 1940 and up to 1980; 5% was added to compensate forunderestimation of intake. Implicit in this approach is the assumption that ad libitum intakesreflect desirable intakes. However, energy intakes are not inherently constant but areinfluenced by external factors. For instance, downward secular trends in the energy intakes ofinfants have been attributed to changes in breast-feeding rates, the formulation of infantformula, and the timing of food supplementation (Whitehead et al., 1981).
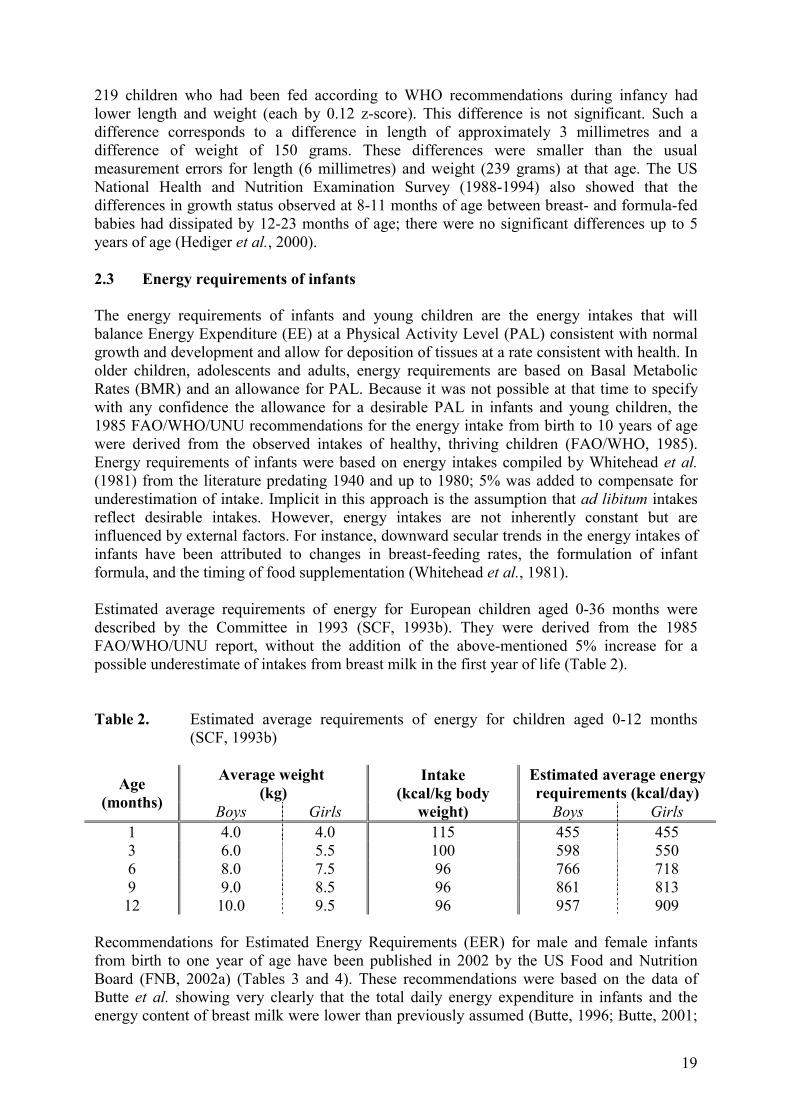
Estimated average requirements of energy for European children aged 0-36 months weredescribed by the Committee in 1993 (SCF, 1993b). They were derived from the 1985FAO/WHO/UNU report, without the addition of the above-mentioned 5% increase for apossible underestimate of intakes from breast milk in the first year of life (Table 2).
Table 2. Estimated average requirements of energy for children aged 0-12 months(SCF, 1993b)
Average weight (kg)
Estimated average energyrequirements (kcal/day)Age
(months) Boys Girls
Intake(kcal/kg body
weight) Boys Girls1 4.0 4.0 115 455 4553 6.0 5.5 100 598 5506 8.0 7.5 96 766 7189 9.0 8.5 96 861 81312 10.0 9.5 96 957 909
Recommendations for Estimated Energy Requirements (EER) for male and female infantsfrom birth to one year of age have been published in 2002 by the US Food and NutritionBoard (FNB, 2002a) (Tables 3 and 4). These recommendations were based on the data ofButte et al. showing very clearly that the total daily energy expenditure in infants and theenergy content of breast milk were lower than previously assumed (Butte, 1996; Butte, 2001;

20
Butte et al., 2000a). These data are detailed above in section 2.1 (Energy density of humanmilk) and below in section 2.4 (Energy expenditure: comparison between breast-fed andformula-fed infants). Taking into account these important data, the Committee supports theuse of the 2002 Food and Nutrition Board recommendations, which are more appropriate fordetermining the energy intake of formula-fed infants and the minimum and maximum energycontent of infant and follow-on formulae than the 1993 SCF recommendations. With theexception of male infants at the age of 1 month, the EER for male and female infantspublished by the Food and Nutrition Board in 2002 are lower than the estimated averagerequirements published by the SCF in 1993. At 1, 3, 6, 9 and 12 months of age, thedifferences between 1993 SCF and 2002 FNB recommendations for male infants are asfollows: - 3.6%; + 4.4%; + 15.6%; + 13.4%; +11.8%. At 1, 3, 6, 9 and 12 months of age, thedifferences between 1993 SCF and 2002 FNB recommendations for female infants are asfollows: + 3.6%; + 5.3%; + 17.4%; +16.6%; +15.5%.
2.4 Energy expenditure: comparison between breast-fed and formula-fed infants
Deriving energy requirements on the basis of energy expenditure and deposition has becomepossible with available data on Total Daily Energy Expenditure (TDEE), growth and bodycomposition (Prentice et al., 1988) and has a better scientific basis than the observationalapproach. The opportunity now exists to compare current recommendations withmeasurements of TDEE obtained via the Doubly Labelled Water (DLW) technique. TheDLW technique is now accepted as the best method available in infants up to 12 months ofage since physical activity does not vary as markedly as in older children, adolescents andadults. The use of the DLW technique is strengthened given the limitations of availablepredictive equations for BMR, which are problematic since many of the underlyingmeasurements were made under conditions such as sedation which influence BMR. Providedthat the diet is appropriate to meet the infants’ nutritional requirements, energy deposition,which is the synthetic energy cost of growth, can be derived from Total Body Fat (TBF) andFFM gains as measured by body composition assessment techniques.
Table 3. Estimated Energy Requirement (EER) for boys from birth to one year of age(FNB, 2002a)
Age(months)
Referenceweight
(kg)
TDEE(kcal/day)
EnergyDeposition (kcal/day)
EER(kcal/day)
1 4.4 292 180 4722 5.3 372 195 5673 6.0 434 138 5724 6.7 496 52 5485 7.3 550 46 5966 7.9 603 42 6457 8.4 648 20 6688 8.9 692 18 7109 9.3 728 18 74610 9.7 763 30 79311 10.0 790 27 81712 10.3 817 27 844
*TDEE = Total Daily Energy Expenditure

21
Several studies aimed at measuring TDEE and energy deposition have been recentlypublished. They showed that TDEE of breast-fed infants is lower than TDEE of formula-fedinfants. The mean percentage difference from formula-fed infants is as follows: 12% at 3months, 7% at 6 months, 6% at 9 months, 3% at 12 months, and 1% at 18 months,respectively.
Table 4. Estimated Energy Requirement (EER) for girls from birth to one year of age(FNB, 2002a)
Age(months)
Referenceweight
(kg)
TDEE(kcal/day)
EnergyDeposition(kcal/day)
EER(kcal/day)
1 4.2 274 164 4382 4.9 336 164 5003 5.5 389 132 5214 6.1 443 65 5085 6.7 496 57 5536 7.2 541 52 5937 7.7 585 23 6088 8.1 621 22 6439 8.5 656 22 67810 8.9 692 25 71711 9.2 719 23 74212 9.5 745 23 768
*TDEE = Total Daily Energy Expenditure
De Bruin et al. (1998) investigated prospectively in 46 healthy, full-term infants the effect ofat least 4 months of formula-feeding compared with exclusive breast-feeding onmacronutrient and energy intake, TDEE, energy deposition, and growth. MetabolizableEnergy Intake (MEI) was assessed from macronutrient intake by Test Weighing (MEI-TW)and from the sum of TDEE and energy deposition (MEI-Pred). At 1-2, 2-4, 4-8, and 8-12months of age, MEI-Pred averaged 103�9, 94�8, 89�8, and 85�5 kcal/kg/day for boys, and96�14, 90�6, 80�8, and 78�4 kcal/kg/day for girls, respectively. No significant differencebetween formula-fed and breast-fed infants was found with respect to weight, length, headcircumference, TBF, FFM, and TDEE at all ages, or for gain in length, weight, TBF, andFFM. MEI-TW was significantly different between feeding groups at 1-4 months of age(formula-fed being greater than breast-fed, p <0.005). This feeding effect, however, was notsignificant for MEI-Pred (kcal/day). MEI-TW differed from MEI-Pred only in breast-fedinfants aged 1-4 months (p <0.05 at 2-4 months). De Bruin et al. concluded from their studythat energy requirements in infants are lower than the recommendations in guidelinescurrently in use.
Butte had also suggested in 1996 the need to revise energy requirements in infants and youngchildren (Butte, 1996; Torun et al., 1996). Current recommendations were considered toohigh for children aged less than 2 years. However, an unresolved issue pertinent to therevision of energy recommendations was whether differences in energy utilization observedbetween breast-fed (BF) and formula-fed (FF) infants in early infancy persist into the secondyear of life. TDEE, sleeping metabolic rate, anthropometry, and body composition weremeasured in 76 infants (Butte et al., 2000a). Average total energy requirements were 533,620, 711, 809, 890, and 993 kcal/day at 3, 6, 9, 12, 18 and 24 months, respectively. Energy

22
deposition (in kcal/day) decreased significantly over time (p=0.001) and was lower in BF thanin FF infants (p=0.01). Energy requirements were ~80% of current recommendations (Davies,1998). Energy requirements differed by age (p=0.001), feeding group (p=0.03), and sex(p=0.03). Adjusted for weight or fat-free mass and fat mass, energy requirements still differedby feeding group but not by age or sex. Mean National Center for Health Statistics weight-for-age and weight-for-length z-scores did not differ by feeding group (Hamill et al., 1979).
2.5 Feeding in early childhood and later growth, and nutritional status
Recent data strongly suggest that the type of feeding and rate of growth during infancy andearly childhood may play a role for an increased risk of overweight later in life. A pattern ofrapid weight gain during the first 4 months of life seems to be associated with an increasedrisk of overweight status at age 7 years, independent of birth weight and weight attained atage 1 year (Stettler et al., 2002). In a population survey of 848 full term singletons from a10% random sample of the Avon longitudinal study of pregnancy and childhood, childrenwho showed catch-up growth between zero and two years were fatter and had more central fatdistribution at age five years than other children (Ong et al., 2000). Moreover, infants whowere fed breast milk more often than infant formula, or who were breast-fed for longerperiods, had a lower risk of being overweight during older childhood and adolescence(Armstrong and Reilly, 2002; Butte, 2001; Gillman, 2001; Martorell et al., 2001; Toschke etal., 2002; von Kries, 1999). Early introduction of dairy products in young infants before theage of 2 months has also been shown to be associated with an increased risk of insulindependent diabetes mellitus in later life (Virtanen et al., 1993).
3. MINIMUM AND MAXIMUM ENERGY CONTENT IN INFANT FORMULAEAND FOLLOW-ON FORMULAE
The Committee proposes the following levels of energy contents of infant formulae andfollow-on formulae:
- For infant formula a minimum of 60 kcal/100 mL (no change from the InfantFormulae Directive) and a maximum of 70 kcal/100 mL (instead of 75 kcal/100mL).
- For follow-on formula a minimum of 60 kcal/100 mL (no change from the InfantFormulae Directive) and a maximum of 70 kcal/100 mL (instead of 80 kcal/100 mL).
The Committee is not aware of data describing the actual energy intake from infant or follow-on formulae from birth to 7 months of age, in the presence or absence of complementaryfeeding from the 5th to 7th months of age. Therefore, a model calculation was performed todemonstrate the effect of changes in energy content of both infant and follow-on formulae onthe energy intake in infants between 4 and 7 months of age. For this calculation therecommended feeding regimen for the first year of life was used, which has been developedby the German Research Institute for Child Nutrition (Kersting et al., 1994). This has theadvantage that the recipes of the complementary meals in addition to formula are fixed andtheir energy content has been estimated.
It has to be kept in mind that the model described by Kersting et al. (1994) is not the result ofobservational studies but has been designed to check whether the progressive introduction ofcomplementary feeding recommended by the Research Institute of Child Nutrition atDortmund was in accordance with the recommendations of the German Society of Nutrition.

23
The energy content of the complementary meals has been added to the energy content of theformula [minimum and maximum energy limits of the formula expressed in kcal/100 mL - asdefined in the Infant Formulae Directive (present infant formula and present follow-onformula) and by the new proposal (proposed infant formula and follow-on formula) -multiplied by the amount of formula known to be consumed by the infant].
According to this regimen infants are fed exclusively on breast milk or formula for the firstfour to six months of life. A Vegetable Potato-Meat Meal (VPMM) is introduced at theearliest at the beginning of the 5th month, about four weeks later a Cow’s Milk-Cereal Meal(CMCM) is added and again about one month later a Cereal-Fruit Meal (CFM) while breastmilk (or formula) is continued in decreasing amounts. Infant formulae at present provide 60 to75 kcal/100 mL whereas follow-on formulae provide 60 to 80 kcal/100 mL. Infant andfollow-on formulae modified according to the new proposal would provide 60 to 70 kcal/100mL.
In the absence of complementary food
During the 5th to 7th months of life an infant is assumed to consume 870 mL of formula perday. The recommended energy intake at that age is 670 to 770 kcal per day (SCF, 1993b),whereas the estimated energy requirements for boys ranges from 596 to 668 kcal/day and theestimated energy requirements for girls ranges from 553 to 608 kcal/day for girls, accordingto FNB (FNB, 2002a), respectively. The calculated energy intakes are shown in Table 5.
In the presence of complementary food
� During the 5th month of life at the earliest an infant is assumed to consume 600 mL offormula and a VPMM, which provides 200 kcal. The recommended energy intake atthat age is 650 to 690 kcal/day for the SCF while the EER is 598 kcal/day for formula-fed boys and 553 kcal/day for formula-fed girls according to FNB. The calculatedenergy intakes are shown in Table 5.
� During the 6th month of life an infant is assumed to consume 400 mL of formula, aVPMM providing 194 kcal and a CMCM providing 216 kcal. The recommendedenergy intake is 720-760 kcal/day for the SCF while the EER is 645 kcal/day forformula-fed boys and 593 kcal/day for formula girls according to FNB. The calculatedenergy intakes are shown in Table 5.
� During the 7th month of life an infant is assumed to consume 240 mL of formula perday and a VPMM providing 225 kcal, a CMCM providing 216 kcal and a CFMproviding 183 kcal. The recommended energy intake is between 770 and 810 kcal/dayfor the SCF while the EER is 668 kcal/day for formula-fed boys and 608 kcal/day forformula-fed girls according to FNB. The calculated energy intakes are shown in Table5.
The minimum and maximum energy intake from the different types of formula (present infantformula, present follow-on formula and proposed infant formula and follow-on formula), withor without complementary feeding, have been compared to the estimated averagerequirements (SCF, 1993b) and to the EER (FNB, 2002a) (Table 6).
In the absence of complementary feeding, the new proposal of an upper energy limit of 70kcal/100 mL leads to a decrease of the energy intake, representing 7% of the recommended

24
energy intake of the Committee as compared to the present infant formula.
Table 5. Energy intake (minimum-maximum) in kcal/day from the 5th to the 7th monthsof age, arising from formula alone [present infant formula (IF), present follow-on formula (FOF), proposed IF and FOF] or formula + complementary feeding
AgePresence of
complementaryfeeding
Type of formulaEnergy intake from
formula alone(minimum-maximum)
Energy intake fromformula + complementary
feeding(minimum-maximum)
5th-7th
months - Present IFProposed IF
522-653522-609
--
5th
month +Present IF
Present FOFProposed IF and FOF
360-450360-480360-420
560-650560-680560-620
6th
month +Present IF
Present FOFProposed IF and FOF
240-300240-320240-280
650-710650-730650-690
7th
month + Present FOFProposed IF and FOF
144-192144-168
768-816768-792
Table 6. Percentage of the estimated average energy requirements (SCF, 1993b) and theEER (FNB, 2002a) represented by the minimum and maximum energy intakefrom present infant formula (IF), present follow-on formula (FOF) andproposed IF and FOF, with or without complementary feeding.
Percentage of the estimatedaverage energy
requirements (SCF, 1993b)
Percentage of the EER(FNB, 2002a)
Minimumenergy intake
Maximum energyintake
AgePresence of
complementaryfeeding
Type of formulaMinimum
energy intakeMaximum
energy intake Boys Girls Boys Girls
5th-7th
months - Present IFProposed IF 68-78 85-97
79-95 78-88 86-94 98-110 91-102
107-118100-110
5th
month +Present IF
Present FOFProposed IF and FOF
81-8694-10099-10590-95
94 101109114104
118123112
6th
month +Present IF
Present FOFProposed IF and FOF
86-9093-99
96-10191-96
101 110110113107
120123116
7th
month + Present FOFProposed IF and FOF 95-100 101-106
98-103 115 126 122119
134130
The decrease of energy intake represents 7 to 8% of the EER (FNB, 2002a) for both boys andgirls as compared to the present infant formula.
It should be emphasised that an energy intake below the recommended intake does not meanthat individually this intake is deficient and can be harmful for the subject. Moreover, whileno change is proposed for the lower energy limit as compared to the Infant FormulaeDirective, the model calculation leads to a low energy intake, representing a surprising 68-78% of the recommended energy intake of the SCF in the absence of complementary feeding,

25
whatever the formula (present and proposed infant formula). This could suggest aninsufficient lower limit of energy content in formulae but is completely contradictory with thefact that infant formulae have been satisfactorily used for the growth and development ofinfants within the European Union from birth to one year of age since 1994, when the InfantFormulae Directive was implemented. The figure is higher when the lower energy intake iscompared to the EER (FNB, 2002a): 78-88% for boys and 86-94% for girls, respectively.
The model calculation gives no matter of debate for the 7th month of life. While no change hasbeen proposed for the lower energy limit, the model calculation leads again to a surprisinglylow energy intake in infants receiving complementary feeding, representing 81-86% of therecommended energy intake of the SCF for the 5th month and 86-90% for the 6th month,whatever the formula (present infant formula, present follow-on formula and proposed infantand follow-on formulae). In comparison, the lower energy intake represents 94-101% of theEER (FNB, 2002a) for the 5th month and 101-110% for the 6th month, respectively.
This strongly suggests, as already discussed in section 3.4 (Energy expenditure), that the 1993recommendations of the SCF for energy intake in infants from birth to one year of age arehigher than the actual energy requirements of infants.
4. CONCLUSION AND RECOMMENDATION
Based on the reviewed data showing that the total daily energy expenditure in infants and theenergy content of breast milk are lower than previously assumed, the Committee proposes toreduce the maximum energy content of both infant formulae and follow-on formulae ascompared to the limits defined by the Infant Formulae Directive. There is no evidence tojustify a differentiation in minimum and maximum energy levels between infant formulae andfollow-on formulae. Therefore, the Committee proposes the following energy contents of theproduct as prepared ready for use for both infant formulae and follow-on formulae:
Minimum 60 kcal/100 mL 250 kJ/100 mL
Maximum 70 kcal/100 mL 295 kJ/100 mL

26
III. PROTEIN CONTENT
1. INTRODUCTION
The protein content and quality of infant formula and follow-on formula is regulated in theInfant Formulae Directive.
In 1993, the Committee accepted the use of partial hydrolysates of protein as the proteinsource of infant formula (SCF, 1993a). In 1995, an additional report abolished thedifferentiation between modified and unmodified cows’ milk protein (SCF, 1995).
For both kinds of formulae only cows’ milk protein and soy bean protein isolate and, forinfant formula, partially hydrolysed protein are identified as sources of protein. Accordingly,infant formulae on the market can be divided into three categories, which differ by theirprotein source and minimum protein content. The minimum content required is higher forpartially hydrolysed and soy protein-based infant formula to account for a potentially lowerbiological value.
Follow-on formulae with all kinds of protein sources have the same requirements for theprotein content.
The presently available infant and follow-on formulae and their permitted protein contents aregiven in Table 1.
The protein contents in g/100 mL are calculated from the permitted energy values (60 to 75kcal/100 mL and 60 to 80 kcal/100 mL for infant formulae and follow-on formulae,respectively).
Table 1. Types of formulae and their protein contents in the EU
Infant formula Follow-on formulaProtein source minimum maximum minimum maximum
Cow’s milk g/100 kcalg/100 mL
1.81.08
3.02.25
Partially hydrolysedprotein
g/100 kcalg/100 mL
2.251.35
3.02.25
Soy protein isolate g/100 kcalg/100 mL
2.251.35
3.02.25
2.25 g/100 kcal1.35 g/100 mL
4.5 g/100 kcal3.6 g/100 mL
2. GENERAL CONSIDERATIONS ON PROTEIN IN FORMULAE
2.1 Protein composition of infant formula and human milk
The protein content of an infant formula must provide both for the need of nitrogen and ofindispensable amino acids for maintenance of the body and for growth i.e. protein deposition.
27
The percentage of indispensable amino acids of total amino acids required for maintenance islower (20-30%) than that required for growth (40%). Snyderman et al. (1962) have shown,that while providing sufficient indispensable amino acids in the diet of infants, the intake of“unessential nitrogen” could become limiting for growth and that growth could be restored byadding such nitrogen either as glycine or urea. They could show that N15 from labelledammonium chloride and urea was incorporated into plasma proteins and haemoglobin underconditions of a low protein diet.
The definition of indispensable amino acid as “one which cannot be synthesised by the animalorganism out of materials ordinarily available to the cells at a speed commensurate with thedemand for normal growth” (Borman et al., 1946) implies that for the synthesis ofdispensable amino acids precursors must be available and that in certain circumstances theneed for these amino acids may become greater than the synthesising capacity. Of thedispensable amino acids only glutamate and serine are synthesised de novo, the otherconditionally indispensable amino acids all need precursors. Glycine which is low in humanmilk can become limiting in premature infants when serine synthesis is inadequate (Jackson etal., 1981).
In addition, consumption of any amino acid in functional pathways other than for proteinsynthesis will detract from the available amino acid pool and either has to be replaced by thediet or by endogenous synthesis (Reeds, 2000).
The quantity of nitrogen in human milk changes dramatically, especially during the first daysof life, from about 400 mg/100 mL in colostrum to about 180 mg/100 mL in mature milk.Expressed as a percentage of the energy content protein accounts for 17% in colostrum andfor 7% in mature human milk (Räihä, 1994b). More important, the concentration of differentproteins changes with duration of lactation: the whey-casein ratio is 90:10 in colostrum andbecomes 55:45 in mature milk and 50:50 in late lactation. The decrease in total proteincontent is due mainly to a decrease in secretory immunglobulin A (sIgA) and in lactoferrin.These two bioactive proteins, which, together with lysozyme, comprise about 30% of the totalprotein in mature human milk, are resistant to low pH-values and to digestive proteolyticenzymes. Between 3 and 10% of the milk proteins are considered to be nutritionallyunavailable to infants as sources of amino acids (Picone et al., 1989b).
In addition, human milk contains between 20 to 25% of its total nitrogen as non-proteinnitrogen (NPN). Up to 50% of the NPN-fraction is urea-nitrogen. Both breast-fed andformula-fed infants retained about 13% of 15N labelled urea (Lönnerdal, 1994a). The ability tosalvage both endogenous and dietary urea hydrolysed in the gut decreases after the age of sixweeks in breast-fed infants and is probably dependent on the actual nitrogen requirement(Steinbrecher et al., 1996). If and how much of the urea-nitrogen is available for net de novosynthesis of amino acids and body proteins, mainly through bacterial metabolism in the colon,is not precisely known (Fuller and Reeds, 1998). The composition of NPN of human milk andinfant formula is given in Table 2. The amount and composition of NPN in infant formuladepends on the processing of the protein sources. It is higher in ion-exchange andelectrodialysed whey (26% and 14 to 18%, respectively) than in ultrafiltrated whey (6 to 8%)and in skim milk powder (6 to 7%). In formula based on soy protein isolates it can varybetween 1 and 25% of the total nitrogen, dependent on whether or not the protein source hasbeen partly hydrolysed (Donovan and Lönnerdal, 1989b)
Nitrogen from peptides in infant formula can be higher than in human milk. Nitrogen fromfree amino acids is more variable in infant formula than in human milk and depends in part on

28
additions of amino acids. Both peptide and amino acid nitrogen which contribute 5 to 7% ofthe total nitrogen in human milk and between 2 to 8% of the total nitrogen in infant formulawill be available for protein synthesis.
Table 2. Nitrogen in mature human milk and cows’ milk-based infant formula (Lönnerdal,1994a; Miera, 1998)
Mature human milk Infant formulamg/100 mL % mg/100 mL %
Total nitrogen 148-195 100 230-300 100Non-protein nitrogen 35-50 20-25=100 14-43 8-17=100Nitrogen in peptides 9 20 5-17 20-30Nitrogen in free-aminoacids 4 10 0-1 4-15
Urea nitrogen 9-23 25-50 4-19 20-40Creatine N 0.4 0.8-2 4-8Creatinine N 0.2-0.8 0.1-0.5 1-2Ammonia N 0.2-0.3 - 1-10Orotic acid N - 0.2-2 1-3Uric acid N 0.4-0.5 0-0.2 0-1Carnitine N 0.05-0.1 0.1-0.2 < 0.5Sialic acid N 1-8 1.5 0.3-1Nucleotides N 0.3 -Polyamines N 0.02 -Choline N 0.3 -
Taurine is the predominant free amino acid in human milk (4 to 5 mg/100 mL or 0.3 to 0.4mmol/L) (Agostoni et al., 2000). In infant formula it is only present if added.
Subtracting non-nutritional proteins and the NPN-fraction from the total crude protein content(nitrogen x 6.38), one arrives at a minimal protein content of 0.85 g/100 mL in human milk(about 1.27 g/100 kcal) (Räihä, 1985).
Available quantities of amino acids from human milk do not correspond to the quantities andpatterns of amino acids determined after hydrolysis, because of the partial unavailability ofsome digestion-resistant proteins. It has been shown, that the pattern of nutritionally availableamino acids remains essentially the same throughout lactation, while the total concentrationsin human milk change considerably (Harzer and Bindels, 1987).
A simple imitation of the amino acid pattern of human milk is therefore not sufficient indevising infant formula. Feeding ten healthy term infants each an isocaloric cows’ milk-basedformula with protein contents (total N x 6.38; 9% non-protein N) of 1.12, 1.33 and 1.48 g/100mL (corresponding to 1.63, 1.95 and 2.18 g/100 kcal) for 12 weeks and comparing growthdevelopment, serum total protein, prealbumin, urea nitrogen, albumin and plasma amino acidsand urinary sulphate excretion with the values from 10 infants breast-fed exclusively, showedthat despite an amino acid pattern of the formula close to that of human milk (with theexception of lower contents of tryptophan, tyrosine and arginine per g of protein) andcomparable protein intakes per kg body weight and day between infants fed formula 1.33 and1.48 and human milk at 4 weeks, between formula 1.12 and human milk fed infants at weeks8 and 12, there were significant differences in the plasma amino acids of formula and breast-

29
fed infants at all times. Infants fed the highest protein containing formula had higher ureanitrogen serum levels and sulphate excretion than breast-fed infants at all times. There wereno significant differences in other blood parameters and there was normal growthdevelopment in all four feeding groups (Picone et al., 1989b). The aim to be achieved isoptimal growth and development of body composition, body functions and body metabolismby supplying sufficient nitrogen and (non-dispensable) amino acids in available form.However, “optimal” growth and development is not a well-defined criterion. Dewey et al.(1996) have described and discussed the five principal possibilities to determine the proteinrequirements of infants (and children):
A. The model of the fully breast-fed infant. This was applied in the FAO/WHO/UNUreport (1985) under the assumption that fully breast-fed infants thrive and therefore,that the protein and amino acid intake per kilogram body weight calculated fromconcentration multiplied by volume intake corresponded to the requirement. New dataon breast-fed infants from 1 to 6 months of age and taking into account an only partialmetabolic availability of NPN (46-61%) resulted in revised (10-26%) lower proteinintakes of breast-fed infants than in 1985 (see Table 3).
Table 3. Revised estimates (Dewey et al., 1996) for nitrogen and protein intakes of breast-fed infants (taken from Table 29 of the 1985 FAO/WHO/UNU report on energyand protein requirement)
Age Breastmilk intake Weight Total nitrogen intake Crude protein
(N x 6.25/1000)Adjusted* protein
intakemonths
ng/day kg mg/day mg/kg/day g/day g/kg/day g/day g/kg/day
1 37 794 4.76 1723 362 10.8 2.26 9.3-9.7 1.95-2.042 40 766 5.62 1486 264 9.3 1.65 7.9-8.3 1.41-1.483** 37 764 6.3 1406 233 8.8 1.46 7.5-7.9 1.19-1.253*** 61 812 6.24 1472 236 9.2 1.48 7.9-8.3 1.27-1.334 41 782 6.78 1408 208 8.8 1.3 7.5-7.8 1.11-1.166 12 881 7.54 1486 197 9.3 1.23 8.0-8.4 1.05-1.11
* Based on milk protein concentration plus 46-61% of the NPN (protein = 6.25 x nitrogen)** From Butte et al., 1984*** From Heinig et al., 1993a
To achieve the same crude protein intake an infant of one month of age would have toconsume 210 mL/kg/day of an infant formula with the presently lowest permittedprotein content of 1.08 g/100 mL, whereas a six months old infant would have toconsume 116 mL/kg/day.
B. The factorial approach, taking into account estimates of the nitrogen requirements formaintenance and for growth, efficiency of conversion from dietary protein into bodyprotein, and epidemiological data. Again the nitrogen needs for maintenance whichhad been defined as 120 mg/kg/day can be revised according to new data to 90mg/kg/day and availability of growth data for breast-fed infants allow to calculateprotein gain more precisely. Additions to the calculated required nitrogen incrementfor growth to account for individual variation are no longer proposed. Theinterindividual coefficient of variation for nitrogen needs also revision, whereas the70% efficiency of conversion of dietary protein to body protein is retained in the newestimate (Dewey et al., 1996) (see Table 4). By definition the level of protein intake

30
adequate for formula-fed infants is higher than the observed protein intake of breast-fed infants.
Table 4. Revised estimates (Dewey et al., 1996) for adequate level of protein intake forinfants according to revised factorial approach (CV = Coefficient of Variation)
Adequate levelAge Nitrogen Protein (N x 6.25)months
CV (%)growth
CV (%)total mg/kg/day g/kg/day
0-1 24 17.6 431 2.691-2 24 15.9 326 2.042-3 25 14.4 245 1.533-4 26 13.9 219 1.374-5 29 14.2 200 1.255-6 32 14.6 190 1.196-9 34 14.2 175 1.099-12 46 15.6 163 1.02
To achieve the adequate level of crude protein intake, a one month old infant wouldhave to consume 250 mL/kg/day, a six months old infant 112 mL/kg/day of an infantformula with the lowest permitted protein content in the EU.
C. A direct approach through controlled clinical studies. Because formula-feeding cannotrely on the empirical safety and adequacy of breast-feeding in which the compositionand intake cannot voluntarily be influenced, prospective study designs for formulaeunder controlled conditions and with defined end points are to be preferred. It isimportant to test the nutritional value of proteins in formulae under strictly controlledenergy intakes and intakes of other nutrients, including micronutrients.
D. The operational approach by using protein-energy ratios. This approach requires boththe knowledge of the safe level of protein intake and the mean requirement for energyat all ages. Both are difficult to estimate and the results are based on assumptions. Forexclusively breast-fed infants protein-energy ratios at age 3 to 4 months are 8 to 8.5%,when the protein concentration is 9.6 to 10 g/L (true protein including 46% utilisationof the NPN fraction), energy density is 670 kcal/L and a conversion factor of 5.65 kcalper g of protein is applied (Dewey et al., 1996). For older infants extrapolation wouldrequire several more assumptions. The present European regulation prescribes proteinenergy ratios from 7.2 to 12% for infant formula and from 10 to 18% for follow-onformula.
E. An approach via the determination of the metabolic needs for individual amino acids.This requires the knowledge of the need for amino acids both for growth andmaintenance. Whereas the need for growth can be assumed from the amino acidpattern of body proteins the needs for maintenance are essentially not known and canbe calculated in different ways. Dewey et al. (1996) recommend retaining the aminoacid pattern of human milk. Table 5 shows amino acid requirements for infants 3 to 4months old based on observed intakes that supported satisfactory growth (FAO/WHO,1985), data from infants between 8 and 112 days of age studied by Fomon et al.(1973) and the minimum required values calculated for infants 0 to 6 months of age byDewey et al. (1996).

31
Table 5. Requirement of indispensable and some conditionally indispensable amino acidsby infants from three different published sources (Dewey et al., 1996;FAO/WHO, 1985; Fomon et al., 1973) in mg/kg body weight/day
Dewey et al., 1996Fomon et al.,
1973[8-112 days]
FAO/WHO,1985
[3-4 months]
0-1 months[bw 3.6 kg]
1-3 months[bw 4.7 kg]
3-6 months[bw 6.3 kg]
Histidine 26 28 - - -Isoleucine 66 70 59 43 32Leucine 132 161 109 75 54Lysine 101 103 116 85 63Cystine 23 - - - -Methionine 24 - - - -Cystine + methionine - 58 64 37 27Phenylalanine 57 - - - -Tyrosine - - - - -Phenylalanine +tyrosine - 125 114 88 60
Threonine 59 87 63 45 34Tryptophan 16 17 22 16 11Valine 83 93 72 51 38
2.2 Protein composition of follow-on formula
The higher protein content that is presently required for follow-on formula corresponds to themixture of two parts cows’ milk plus one part water (3.7 g protein/100 kcal) that hastraditionally been used for older infants in Europe. The Committee considered a higherprotein content acceptable because of a matured renal function and metabolic interconversionsystem after the age of 4 months without stressing a need for it (SCF, 1983).
A high protein content of follow-on formula is justified when available complementary foodis low or deficient in protein (Wharton, 1994). This is not the case in Europe. Withintroduction of complementary food, which is regulated to have a high protein content in theEuropean Union (at least 3 g/100 kcal or 12% of energy in all kinds of baby foods) the totaldietary protein intake increases significantly. There are indications that an excessive proteinintake in infancy and young childhood not only constitutes an unnecessary stress onmetabolism and kidney function but also has undesirable effects on long-term health byincreasing the risk of overweight. Nielsen et al. (1998) described in a retrospective study of339 Danish infants that the median protein intake at about 10 months of age was 3.9 g/kg/day(10th percentile 2.7; 90th percentile 5.4), the highest protein intake corresponding to more than16% of the energy intake. Infants breast-fed for more than 7 months gained 200 g less inweight and 7 mm less in length from age 5 to 10 months. Infants with the highest proteinintake (>16% of energy) gained 260 g more weight in 10 months, than infants with lowerintakes.
Healthy Swedish and Italian infants studied between three and 12 months of age receivedeither of three infant formulae (1.3; 1.5; 1.8/2.0 g protein/100 mL) from age 3 or 5 monthsonwards and in addition complementary (weaning) food after termination of breast-feeding,ready-to feed in Sweden and home-prepared in Italy. Total protein intake was higher in Italian

32
than in Swedish infants both at age 6 and 12 months: 6 months Italy 3.5 to 3.8 g/kg/day,Sweden 1.9 to 2.2 g/kg/day; 12 months Italy 3.7 g/kg/day (18% of energy), Sweden 2.6g/kg/day (11% of energy). Growth for weight and length was normal in both groups andcomparable. Serum urea was higher in Italian infants (4.9 mmol/L) than in Swedish infants(3.8 mmol/L) at 12 months of age (Åkeson et al., 2000).
In a longitudinal study on 354 German infants and children protein intake was 1.6 and 1.4g/kg/day in breast-fed boys versus 2.5 g/kg/day in formula-fed boys at ages 3 and 6 months(corresponding to 7 and more than 10% of energy intake). Protein intake increased thereafterto a maximum at 12 months of age (3 g/kg/day, corresponding to more than 13% of theenergy intake). Similar findings were reported for girls. The median protein intake aspercentage of energy intake remained between 13 and 14% until the age of 3 years (Alexy etal., 1999).
One detailed prospective cohort study of 40 infants breast-fed for 4 months and 36 infantsformula-fed for 4 months demonstrated that early feeding mode does influence the bodycomposition in early infancy but that these differences do not persist into the second year oflife. Energy and protein intakes were lower in breast-fed infants at 3 and 6 months of age,thereafter no differences were observed until 24 months. Weight and length of formula-fedinfants was higher at 3 and 6 months, thereafter up to the age of 24 months no differencesbetween feeding groups were observed. Daily intakes of energy, protein, fat, carbohydratewere positively correlated with weight and fat free mass, but not with fat mass or percent fatmass at 3, 6 and 12 months of age. The percentage of energy intake as protein was positivelycorrelated to weight gain and fat free mass gain at 3 and 6 months, but not to fat mass (Butteet al., 2000b). This study seems to imply that a comparable intake of both energy and proteinafter the period of exclusive breastmilk or formula-feeding does not result in groupdifferences for weight gain and body composition.
Very high protein intakes at 2 years of age were observed in 112 French children followedfrom 10 months to 8 years of age and measured for weight and length and skinfold thickness(two sites) at 10 months, 2, 4, 6 and 8 years of age. Protein intake as percentage of energyintake was <14.8 in the lowest quartile, 14.8 to 18% in the next two quartiles and more than18% in the highest quartile. There was a statistically significant correlation between thepercentage of protein at two years of age with the body mass index and subscapular skinfoldthickness at 8 years of age after adjustment for energy intake at 2 years of age and parentalbody mass index. Moreover, the percentage of protein at 2 years of age was negativelyassociated with age at adiposity rebound. This has been interpreted as a risk for obesity inlater life by high protein intake in early life (Rolland-Cachera et al., 1995). Similar resultswere reported in 150 Italian children, followed from birth to 5 years of age. Children with aBMI above the 90th percentile at 5 years had a higher protein intake at one year than thosewho were not overweight (<90th percentile). The protein intake both in the overweight and inthe non-overweight group was very high, 22 and 20% of energy, respectively (Scaglioni et al.,2000). In the latter study there was also a tendency of breast-feeding to protect against obesitylater in life.
Dorosty et al. (2000) have attempted to reproduce the results of Rolland-Cachera byfollowing a cohort of 889 British children born in 1991 and 1992 from birth to 5 years of age.Ten anthropometric measurements were performed in 5 years and two 3-day dietary recordswere taken at 8 and 18 months of age. Protein intakes as percentage of energy intake were14.6�2.2% at 18 months. They were not correlated with age of adiposity rebound. Onlyparental body mass index or obesity were significantly correlated to an early adiposity

33
rebound, which is considered as predictive of future adiposity (Rolland-Cachera et al., 1984).
The lower protein content of human milk, as compared to infant formula, has been consideredto possibly reduce the risk of later obesity (Koletzko and von Kries 2001; FAO/WHO,2002a). A review of 18 published studies comparing breast fed and formula fed populations(six retrospective studies, ten prospective, one cohort, one case control) between 1945 and1999 and involving in total nearly 20,000 subjects found a positive relationship betweenbreast-feeding and later obesity in two studies, a negative (protective) relationship in fourstudies and no effect in ten studies (Butte et al., 2001). A protective effect of breast-feedingwas seen in a large retrospective cross-sectional study on almost 10,000 children at the age of5 years in Bavaria (von Kries et al., 1999), in a survey of 15,000 adolescents whose mothersparticipated in the Nurses’ Health Study II (Gillman et al., 2001), and in a large cohort of32,000 Scottish children, 27% of whom were breast-fed when seen at the age of 6 to 8 weeks,and who were reinvestigated at the age of 39 to 42 months (Armstrong and Reilly, 2002).2500 children examined at the age of 3 to 5 years in the course of the third National Healthand Nutrition Examination Survey (NHANES III) were found to be at a decreased risk ofbeing overweight at the age of 3 to 5 years if ever breast-fed (Hediger et al., 2001). A schoolbased study in the Czech Republic in some 33,000 children found breast feeding associatedwith a 20% risk reduction of both overweight and obesity until the age of 14 years (Toschkeet al., 2002). From these studies the question remains open if it is breast-feeding per se or thelower protein intake connected with breast-feeding, which protect against overweight in laterlife, or if simply any excessive protein intake during infancy (three times the recommendedintake and more or more than 14% of the energy intake) predisposes to later adiposity andrelated diseases and, if so, by what means (Martorell et al., 2001; Metges, 2001). High proteinintakes can have impact on glomerular filtration rate and will increase the renal solute load,they can lead to elevations of certain plasma amino acid levels with metabolic effects on thehormone system (stimulation of insulin and insulin-like growth factor type 1 secretion) andthe production of neurotransmitters, which are not sufficiently investigated (Michaelsen et al.,2002). As excessive protein intakes do not appear to have beneficial effects on the health ofthe child they should be avoided.
2.3 Effects of processing on nutritional value
The nutritional value of protein is influenced by its amino acid composition, by proteinhydrolysis but also by heat-treatment, especially in the presence of iron, vitamin C and lactosein these products. Sarwar et al. (1989) have demonstrated in rats that heat treatment (122-132°C for 5 to 8 minutes) applied in the manufacture of ready-to-feed liquid infant formulaereduces the apparent and true digestibility of protein (74 to 76%; 88 to 90%) compared topowder forms of infant formula (79 to 83%; 93 to 97%) and that the true digestibility oflysine, methionine and cystine in liquid products was 5 to 13% lower than in powderproducts. Rats fed liquid products during two weeks showed decreased plasma lysine levels.Bioavailability of tryptophan in rats was reduced from two commercial heat-treated liquidproducts (83 to 84%) compared to powdered products (90 to 95%) but not impaired from twoothers (92 to 95%). The concentration of bioavailable tryptophan was generally lower inliquid products (Sarwar and Botting, 1999).
Infant formulae both in powdered and liquid forms contain furosine and hydroxymethyl-furfural as indicators of early Maillard reactions and liquid products contain double theamount of advanced Maillard reaction products. This results in a reduction of available lysineand is accompanied by a 30% reduction of tryptophan in soluble proteins (Birlouez-Aragon,1999). In powdered infant formula (n=44) 5% of total lysine was destroyed, 8% inactivated,
34
in liquid sterile infant formula (n=23) the respective values were 9 and 10%, measured asfurosine, the acid hydrolysis product of fructoselysine containing proteins (Erbersdobler andHupe, 1991). Prolonged heat treatment under alkaline conditions promotes lysinoalanineformation in soy protein and reduces its digestibility (Liener, 1994). A recent analysis of ninecommercial powdered formulae (one infant formula and eight follow-on formulae, three ofthe latter were based on soy protein isolate) and 12 commercial liquid formulae (six infantformulae and six follow-on formulae) demonstrated that lysinoalanine as indicator of thermaldamage to the protein was below the detection limit (0.5 µg/g protein) in powdered products.Liquid infant formulae had lower contents of lysinoalanine than liquid follow-on formulae.Among these the highest concentrations were found in in-can sterilised products (�300 µg/gprotein), whereas ultra-high temperature (UHT) treated liquid follow-on formulae hadintermediary values (D’Agostina et al., 2003).
Ultra-high temperature treated (142° for 2 to 3 seconds) liquid formulae based onelectrodialysed whey-casein mixtures (1.3 and 1.5 g protein/100 mL) fed to healthy full-terminfants until the age of 6 months resulted in comparable growth, haemoglobin, ferritin, zincand copper levels as in breast-fed infants or infants fed powdered whey-casein formula (1.3 gprotein/100 mL). Plasma amino acid levels of the infants fed the lower-protein UHT-formulawere most similar to breast-fed infants. Blood urea nitrogen was lowest in breast-fed infantsand highest in the infants fed the UHT-formula with the higher protein content and similar tothe values of infants fed the powder formula (Lönnerdal and Hernell, 1998). In 12 prematureinfants fed for five days each UHT-treated and in-can sterilised formulae with knownlactulosyllysine and lysinoalanine contents in a cross-over design, no effects of the in-cansterilised product compared to the UHT treated product with respect to creatinine clearance,electrolyte excretion or signs of renal tubular damage were found (Langhendries et al., 1992),Even if these data seem to indicate that human infants tolerate these compounds better thanrats, their contents in infant formula and follow-on formula should be kept as low astechnically possible.
2.4 Recommendation
The Committee proposes there should be a requirement for adequate clinical testing before thecommercialisation of all formulae which contain protein sources or protein hydrolysateswhich have no established use in infant formulae and/or to which processing technologieshave been applied that can affect the bioavailability of nitrogen compounds (cf. chapter XI).
3. CURRENT REQUIREMENTS CONCERNING PROTEIN IN INFANTFORMULAE AND FOLLOW-ON FORMULAE IN THE INFANT FORMULAEDIRECTIVE
3.1 Calculation of protein
The protein content is calculated from the total nitrogen content by multiplying with a factorof 6.38 in the case of cows’ milk protein and with a factor of 6.25 in the case of soy proteinisolate and partial hydrolysates of protein for both infant formula and follow-on formula.
3.2 Sources of protein
For infant formula only cows’ milk protein - unmodified or increased in whey protein - soyprotein isolates and protein partial hydrolysates are permitted. Neither the protein source of

35
the partial hydrolysates nor the degree of hydrolysation are explicitly specified. Infant formulabearing a claim for “adapted protein” must have a whey protein to casein ratio of at least one.
For follow-on formula only cows’ milk protein and soy protein isolates are permitted. The useof partially hydrolysed protein is not explicitly excluded. L-Amino acids may only be addedto both infant and follow-on formulae for the purpose of improving the nutritional value ofthe protein. Taurine must be added to infant formula based on protein hydrolysates inamounts to achieve at least 5.25 mg/100 kcal (42 µmol/100 kcal) and L-carnitine must beadded to infant formulae based on protein hydrolysates and soy protein isolates to achieve acontent of at least 1.2 mg/100 kcal (7.5 µmol/100 kcal).
Nucleotides (CMP, UMP, AMP, GMP and IMP) may be added to infant and follow-onformulae in total amounts of 5 mg/100 kcal.
Choline and inositol may be added to infant and follow-on formulae in unspecified amounts.
3.3 Protein content
The minimum and maximum protein density values are given in Table 1.
The maximum protein content of an infant formula bearing a claim for “adapted protein” is2.5 g/100 kcal.
3.4 Protein quality
The Infant Formulae Directive defines the chemical index of a protein as the lowest of theratios between the quantity of each indispensable amino acid of the test protein and thequantity of each corresponding amino acid of the reference protein. Reference protein forinfant formula is human milk protein as defined in section 3.5. Reference proteins for follow-on formula are casein (from cows’ milk) and human milk protein.
The chemical index is not used to determine the quality of protein in infant formula based oncows’ milk protein and protein partial hydrolysates. Soy protein isolate in infant formula hasto have a minimal chemical index of 80% in comparison to human milk protein.
Protein in follow-on formula must have a chemical index of at least 80%, with reference tocasein or human milk protein.
Infant formula based on cows’ milk protein and based on partially hydrolysed protein has tocontain per energy value at least the same available quantity of each indispensable and someconditionally indispensable amino acid as human milk protein. However, methionine andcystine may be added in that calculation. Infant formula based on soy protein isolate mustcontain the same amount of available methionine per energy value as human milk. For infantformula made with partially hydrolysed protein a PER (protein efficiency ratio) and NPU (netprotein utilisation) value at least identical to casein is also requested.
Follow-on formula manufactured from cows’ milk protein or from or with soy protein isolatehas to contain the same amount of available methionine per energy value as human milk.

36
3.5 Amino acid pattern of the reference proteins human milk and cows’ milk casein
The amino acid pattern is given in Annex VI of the Infant Formulae Directive. These datawere taken from FAO Nutritional Studies No 24 (1970). They are based on 8 casein sampleswith a mean nitrogen content of 2.08 g/100 g from which a crude protein content of 13.3g/100 g by multiplication with the factor 6.38 was calculated and on 35 samples of humanmilk with a mean nitrogen content of 0.19 g/100 g from which a crude protein content of 1.2g/100 g (factor 6.38) was calculated.
Annex VI of 91/321/EEC: The amino acid composition of casein and human milk protein(g/100 g protein)
Casein Human milkArginine 3.7 3.8Cystine 0.3 1.3Histidine 2.9 2.5Isoleucine 5.4 4.0Leucine 9.5 8.5Lysine 8.1 6.7Methionine 2.8 1.6Phenylalanine 5.2 3.4Threonine 4.7 4.4Tryptophan 1.6 1.7Tyrosine 5.8 3.2Valine 6.7 4.5
The values of Annex V were obtained by multiplying the amino acid concentrations inmg/100 mL from the FAO report by the coefficients 0.36 or 1.5. These coefficients wereobtained by dividing the true protein content (�-amino N x 6.38) by the energy density.
Annex V of 91/321/EEC: Indispensable and conditionally indispensable amino acids inhuman milk (mg/100 kJ or mg/100 kcal)
per 100 kJ per 100 kcalArginine 16 69Cystine 6 24Histidine 11 45Isoleucine 17 72Leucine 37 156Lysine 29 122Methionine 7 29Phenylalanine 15 62Threonine 19 80Tryptophan 7 30Tyrosine 14 59Valine 19 80
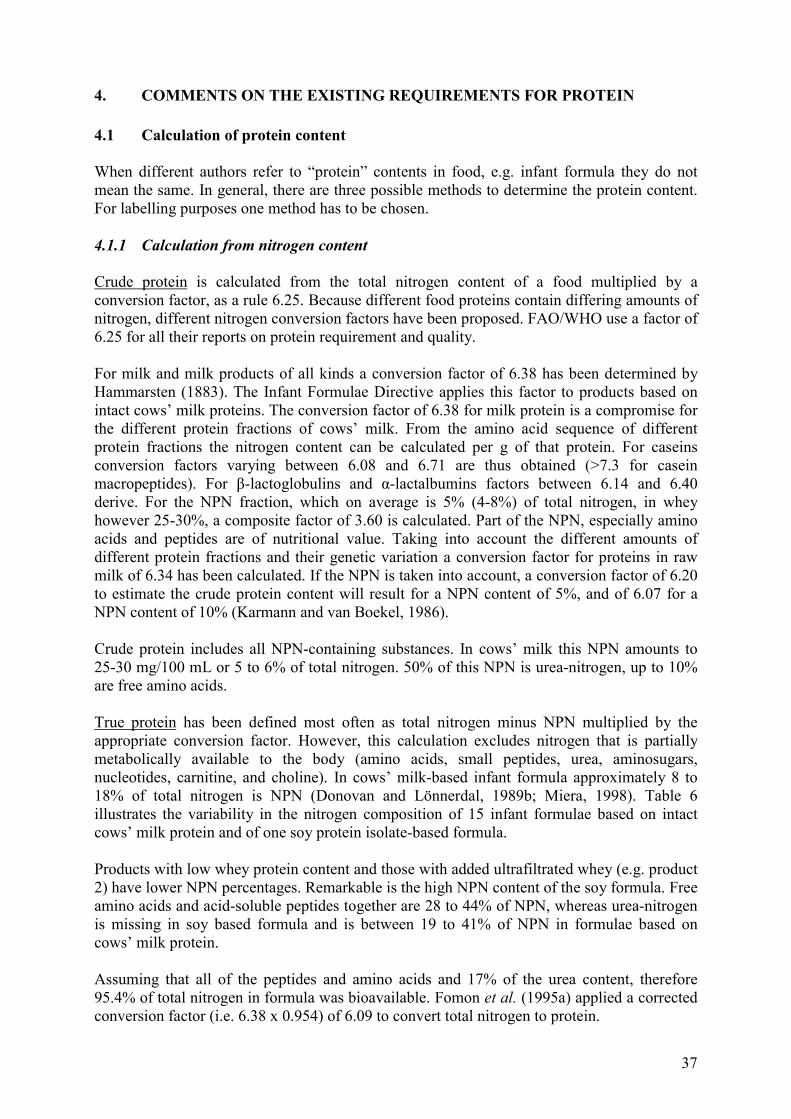
37
4. COMMENTS ON THE EXISTING REQUIREMENTS FOR PROTEIN
4.1 Calculation of protein content
When different authors refer to “protein” contents in food, e.g. infant formula they do notmean the same. In general, there are three possible methods to determine the protein content.For labelling purposes one method has to be chosen.
4.1.1 Calculation from nitrogen content
Crude protein is calculated from the total nitrogen content of a food multiplied by aconversion factor, as a rule 6.25. Because different food proteins contain differing amounts ofnitrogen, different nitrogen conversion factors have been proposed. FAO/WHO use a factor of6.25 for all their reports on protein requirement and quality.
For milk and milk products of all kinds a conversion factor of 6.38 has been determined byHammarsten (1883). The Infant Formulae Directive applies this factor to products based onintact cows’ milk proteins. The conversion factor of 6.38 for milk protein is a compromise forthe different protein fractions of cows’ milk. From the amino acid sequence of differentprotein fractions the nitrogen content can be calculated per g of that protein. For caseinsconversion factors varying between 6.08 and 6.71 are thus obtained (>7.3 for caseinmacropeptides). For β-lactoglobulins and α-lactalbumins factors between 6.14 and 6.40derive. For the NPN fraction, which on average is 5% (4-8%) of total nitrogen, in wheyhowever 25-30%, a composite factor of 3.60 is calculated. Part of the NPN, especially aminoacids and peptides are of nutritional value. Taking into account the different amounts ofdifferent protein fractions and their genetic variation a conversion factor for proteins in rawmilk of 6.34 has been calculated. If the NPN is taken into account, a conversion factor of 6.20to estimate the crude protein content will result for a NPN content of 5%, and of 6.07 for aNPN content of 10% (Karmann and van Boekel, 1986).
Crude protein includes all NPN-containing substances. In cows’ milk this NPN amounts to25-30 mg/100 mL or 5 to 6% of total nitrogen. 50% of this NPN is urea-nitrogen, up to 10%are free amino acids.
True protein has been defined most often as total nitrogen minus NPN multiplied by theappropriate conversion factor. However, this calculation excludes nitrogen that is partiallymetabolically available to the body (amino acids, small peptides, urea, aminosugars,nucleotides, carnitine, and choline). In cows’ milk-based infant formula approximately 8 to18% of total nitrogen is NPN (Donovan and Lönnerdal, 1989b; Miera, 1998). Table 6illustrates the variability in the nitrogen composition of 15 infant formulae based on intactcows’ milk protein and of one soy protein isolate-based formula.
Products with low whey protein content and those with added ultrafiltrated whey (e.g. product2) have lower NPN percentages. Remarkable is the high NPN content of the soy formula. Freeamino acids and acid-soluble peptides together are 28 to 44% of NPN, whereas urea-nitrogenis missing in soy based formula and is between 19 to 41% of NPN in formulae based oncows’ milk protein.
Assuming that all of the peptides and amino acids and 17% of the urea content, therefore95.4% of total nitrogen in formula was bioavailable. Fomon et al. (1995a) applied a correctedconversion factor (i.e. 6.38 x 0.954) of 6.09 to convert total nitrogen to protein.
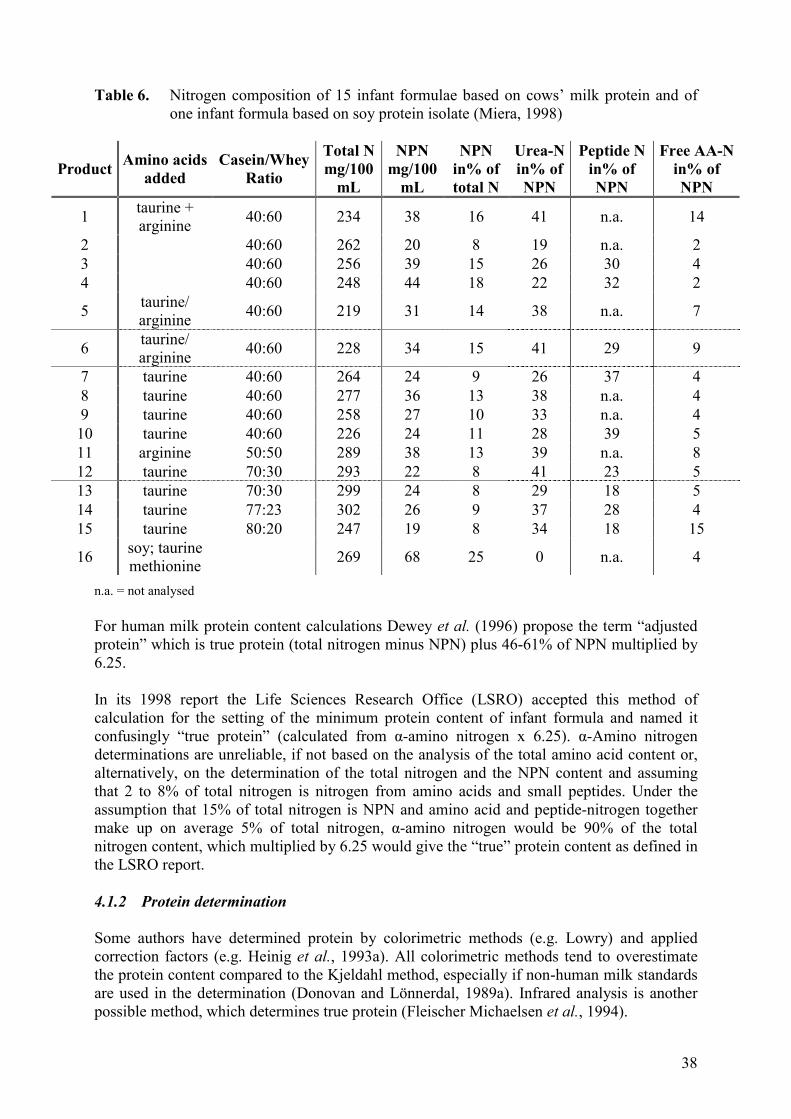
38
Table 6. Nitrogen composition of 15 infant formulae based on cows’ milk protein and ofone infant formula based on soy protein isolate (Miera, 1998)
Product Amino acidsadded
Casein/WheyRatio
Total Nmg/100
mL
NPNmg/100
mL
NPNin% oftotal N
Urea-Nin% ofNPN
Peptide Nin% ofNPN
Free AA-Nin% ofNPN
1 taurine +arginine 40:60 234 38 16 41 n.a. 14
2 40:60 262 20 8 19 n.a. 23 40:60 256 39 15 26 30 44 40:60 248 44 18 22 32 2
5 taurine/arginine 40:60 219 31 14 38 n.a. 7
6 taurine/arginine 40:60 228 34 15 41 29 9
7 taurine 40:60 264 24 9 26 37 48 taurine 40:60 277 36 13 38 n.a. 49 taurine 40:60 258 27 10 33 n.a. 410 taurine 40:60 226 24 11 28 39 511 arginine 50:50 289 38 13 39 n.a. 812 taurine 70:30 293 22 8 41 23 513 taurine 70:30 299 24 8 29 18 514 taurine 77:23 302 26 9 37 28 415 taurine 80:20 247 19 8 34 18 15
16 soy; taurinemethionine 269 68 25 0 n.a. 4
n.a. = not analysed
For human milk protein content calculations Dewey et al. (1996) propose the term “adjustedprotein” which is true protein (total nitrogen minus NPN) plus 46-61% of NPN multiplied by6.25.
In its 1998 report the Life Sciences Research Office (LSRO) accepted this method ofcalculation for the setting of the minimum protein content of infant formula and named itconfusingly “true protein” (calculated from α-amino nitrogen x 6.25). α-Amino nitrogendeterminations are unreliable, if not based on the analysis of the total amino acid content or,alternatively, on the determination of the total nitrogen and the NPN content and assumingthat 2 to 8% of total nitrogen is nitrogen from amino acids and small peptides. Under theassumption that 15% of total nitrogen is NPN and amino acid and peptide-nitrogen togethermake up on average 5% of total nitrogen, α-amino nitrogen would be 90% of the totalnitrogen content, which multiplied by 6.25 would give the “true” protein content as defined inthe LSRO report.
4.1.2 Protein determination
Some authors have determined protein by colorimetric methods (e.g. Lowry) and appliedcorrection factors (e.g. Heinig et al., 1993a). All colorimetric methods tend to overestimatethe protein content compared to the Kjeldahl method, especially if non-human milk standardsare used in the determination (Donovan and Lönnerdal, 1989a). Infrared analysis is anotherpossible method, which determines true protein (Fleischer Michaelsen et al., 1994).

39
4.1.3 Protein as sum of amino acids
Another possibility, which again excludes urea, is to calculate protein as the sum ofanhydrous amino acids quantitatively determined after hydrolysis of the sample. This is,however, very demanding on analytical procedures (Donovan and Lönnerdal, 1989a; Sarwaret al., 1996).
The following Table 7 compares the contents of total nitrogen to the sum of amino acidnitrogen after hydrolysis and to the calculated α-amino nitrogen (total nitrogen minus NPN +peptide N + free amino acid N) in 16 infant formulae (Miera, 1998).
Table 7. Total nitrogen content, nitrogen content from total amino acids and calculated α-amino nitrogen
Totalnitrogen Total amino acid nitrogen
Formulamg/100 mL mg/100
mL % of total nitrogen
Calculated α-amino nitrogen
mg/100 mL% of TN
1 234 191 82 - -2 262 242 92 - -3 256 208 81 231 90.14 248 197 79 223 90.05 219 182 83 - -6 228 192 84 211 92.67 264 222 84 234 -8 277 223 80 - -9 258 225 87 - -10 226 197 87 209 92.511 289 222 77 - -12 293 256 87 271 92.413 299 275 92 293 98.014 302 267 88 283 93.815 247 219 89 231 93.416 269 245 91 - -
The sum of the anhydrous amino acids (g/100 mL) (corrected for analytical losses) is lowerthan the crude protein content (total nitrogen x 6.38) by 6 to 13%. Using the conversion factor6.25 it is still lower by 4 to 11%. By dividing the sum of anhydrous amino acids (g/100 mL)by total nitrogen (g/100 mL) a median conversion factor of 5.9 (range 5.55-5.99) results. Acalculation of the amino acid-true protein content by multiplying the total nitrogen content by5.90 resulted in protein content values which differed maximal by 6% from the sum ofanhydrous amino acids and determined it within 1.5% in six of nine formulae.
The resulting “protein” contents (g/100 mL) from different calculation models are given in thefollowing Table 8 for comparison. The crude protein content calculated with the conversionfactor of 6.25 is between 2 and 3% lower than when it is calculated with the factor 6.38. Thetrue protein content (TN minus NPN multiplied by factor) is between 7 and 17% lower thanthe crude protein content.
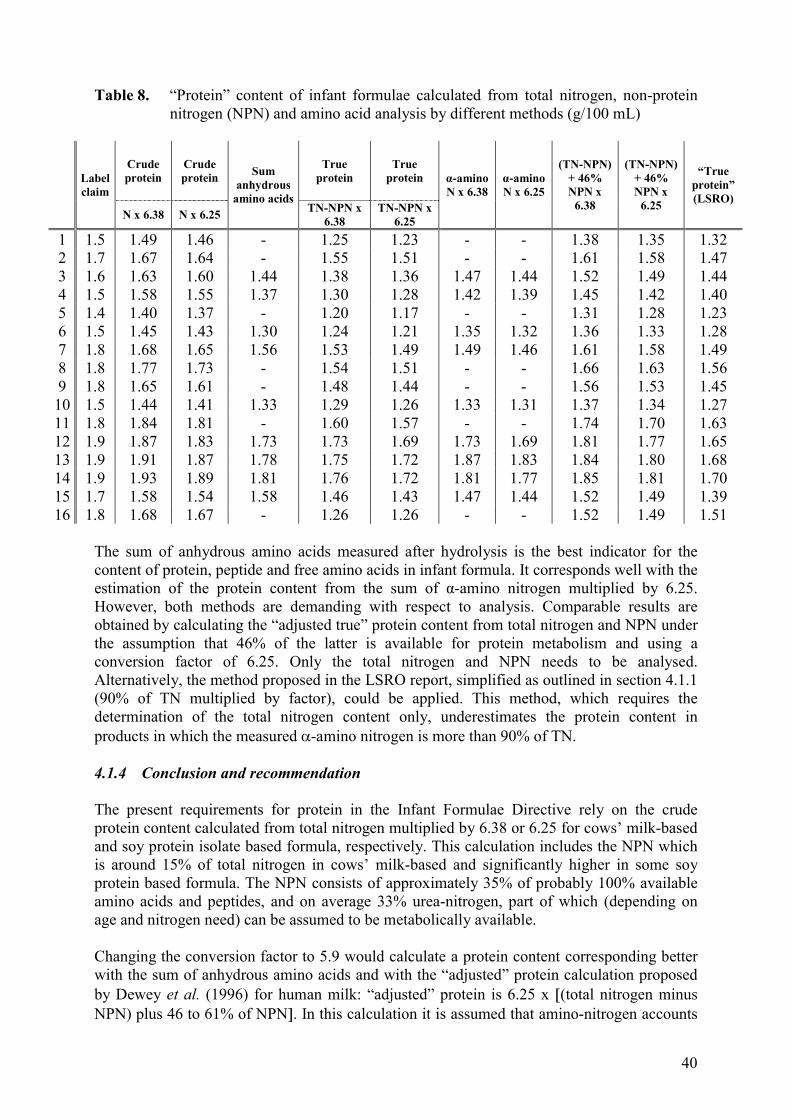
40
Table 8. “Protein” content of infant formulae calculated from total nitrogen, non-proteinnitrogen (NPN) and amino acid analysis by different methods (g/100 mL)
Crudeprotein
Crudeprotein
Trueprotein
TrueproteinLabel
claim
N x 6.38 N x 6.25
Sumanhydrous
amino acidsTN-NPN x
6.38TN-NPN x
6.25
α-aminoN x 6.38
α-aminoN x 6.25
(TN-NPN)+ 46%NPN x
6.38
(TN-NPN)+ 46%NPN x
6.25
“Trueprotein”(LSRO)
1 1.5 1.49 1.46 - 1.25 1.23 - - 1.38 1.35 1.322 1.7 1.67 1.64 - 1.55 1.51 - - 1.61 1.58 1.473 1.6 1.63 1.60 1.44 1.38 1.36 1.47 1.44 1.52 1.49 1.444 1.5 1.58 1.55 1.37 1.30 1.28 1.42 1.39 1.45 1.42 1.405 1.4 1.40 1.37 - 1.20 1.17 - - 1.31 1.28 1.236 1.5 1.45 1.43 1.30 1.24 1.21 1.35 1.32 1.36 1.33 1.287 1.8 1.68 1.65 1.56 1.53 1.49 1.49 1.46 1.61 1.58 1.498 1.8 1.77 1.73 - 1.54 1.51 - - 1.66 1.63 1.569 1.8 1.65 1.61 - 1.48 1.44 - - 1.56 1.53 1.4510 1.5 1.44 1.41 1.33 1.29 1.26 1.33 1.31 1.37 1.34 1.2711 1.8 1.84 1.81 - 1.60 1.57 - - 1.74 1.70 1.6312 1.9 1.87 1.83 1.73 1.73 1.69 1.73 1.69 1.81 1.77 1.6513 1.9 1.91 1.87 1.78 1.75 1.72 1.87 1.83 1.84 1.80 1.6814 1.9 1.93 1.89 1.81 1.76 1.72 1.81 1.77 1.85 1.81 1.7015 1.7 1.58 1.54 1.58 1.46 1.43 1.47 1.44 1.52 1.49 1.3916 1.8 1.68 1.67 - 1.26 1.26 - - 1.52 1.49 1.51
The sum of anhydrous amino acids measured after hydrolysis is the best indicator for thecontent of protein, peptide and free amino acids in infant formula. It corresponds well with theestimation of the protein content from the sum of α-amino nitrogen multiplied by 6.25.However, both methods are demanding with respect to analysis. Comparable results areobtained by calculating the “adjusted true” protein content from total nitrogen and NPN underthe assumption that 46% of the latter is available for protein metabolism and using aconversion factor of 6.25. Only the total nitrogen and NPN needs to be analysed.Alternatively, the method proposed in the LSRO report, simplified as outlined in section 4.1.1(90% of TN multiplied by factor), could be applied. This method, which requires thedetermination of the total nitrogen content only, underestimates the protein content inproducts in which the measured �-amino nitrogen is more than 90% of TN.
4.1.4 Conclusion and recommendation
The present requirements for protein in the Infant Formulae Directive rely on the crudeprotein content calculated from total nitrogen multiplied by 6.38 or 6.25 for cows’ milk-basedand soy protein isolate based formula, respectively. This calculation includes the NPN whichis around 15% of total nitrogen in cows’ milk-based and significantly higher in some soyprotein based formula. The NPN consists of approximately 35% of probably 100% availableamino acids and peptides, and on average 33% urea-nitrogen, part of which (depending onage and nitrogen need) can be assumed to be metabolically available.
Changing the conversion factor to 5.9 would calculate a protein content corresponding betterwith the sum of anhydrous amino acids and with the “adjusted” protein calculation proposedby Dewey et al. (1996) for human milk: “adjusted” protein is 6.25 x �(total nitrogen minusNPN) plus 46 to 61% of NPN�. In this calculation it is assumed that amino-nitrogen accounts

41
for about 35% of NPN and is 100% available and that 17 to 40% of the remaining NPN canbe utilised, overall 46 to (61%) of NPN. In Table 8 the more conservative percentage of 46%has been chosen in the calculation of the “adjusted” protein content. This calculation methodis technically easy and relies on two determinations, total nitrogen and NPN. When themodified LSRO method, which requires the determination of the total nitrogen content only,is applied (see section 4.1.1), the minimum permitted crude protein content of infant formulain the EC of 1.8g/100 kcal converts to a “true” protein content of 1.59 g/100 kcal. In order toachieve the same “adjusted” protein intake as a breast-fed child (see Table 3), a one-monthold infant would have to consume 585 to 610 kcal/day or 123 to 128 kcal/kg body weight/dayof an infant formula with the minimum permitted protein content in the EU. This wouldrequire a volume between 164 to 213 mL/kg/day, depending on the energy content of theformula (at present 75 or 60 kcal/100 mL).
Although the Committee is not aware of data that indicate problems in the supply of adequatelevels of intake of protein from infant formula under the present regulation which relies on thecrude protein content of such formulae, the Committee cannot exclude that this is mainly dueto the fact that manufacturers of infant formula generally aim at intermediary levels of thepermitted protein contents (2 to 2.25 g of protein/100 kcal). The Committee considers ittherefore advisable to request that the NPN content be taken into account and be not higherthan 15% of the total nitrogen content, in order to guarantee a minimum amount of aminonitrogen available for protein synthesis.
The Committee proposes to determine the crude protein content of all types of infant formulaand follow-on formula (total nitrogen x 6.25). In addition, the NPN content must not behigher than 15% of the total nitrogen content in formula based on intact proteins.
The label information on crude protein allows calculating the total nitrogen content andthereby provides useful information on the potential renal solute load of a formula which ispredominantly determined by the nitrogen content.
4.2 Protein sources
4.2.1 Proteins permitted
At present, only cows’ milk protein and soy bean protein isolate are identified as proteinsources in formulae in the EU (in addition hydrolysates of protein of unspecified degree ofhydrolysis and of unspecified origin). The restriction to these sources was made because onlythese kinds of products were manufactured and marketed at the time of the opinions of theCommittee.
There have been requests to permit, like in the Codex standard for infant formula, otherprotein sources both from milk from other animals and from plants.
4.2.2 Other milks
4.2.2.1 Protein and amino acids
Milk from goats, sheep and horses have a higher protein content than human milk. Totalconcentration of amino acids (g/L) (without tryptophan) was determined to be 33.6 in themilk of cows, 25.7 in goats, 54.1 in sheep and 15.8 in horses (Davis et al., 1994). All milkswere most abundant in glutamate plus glutamine, leucine and proline, which were

42
approximately 20%, 10% and 10%, respectively of the total amino acids. The percentage ofindispensable amino acids (except tryptophan) on a weight base to total amino acids wasabout 43% in cows’, goat’s and sheep’s milk and 38% in horse’s milk (human milk 40%), thepercentage of branched chain amino acids around 20% in the first three and 18% in the latter.The percentage of total sulphur amino acids was the same as in human milk (around 3.5%),however, the cystine percentage was lower (around 0.8% in cow, goat and sheep, 1.1% inhorse versus 2.0% in human milk) while the methionine percentages were correspondinglyhigher. The methionine to cystine ratio was higher in all four animal milks (2 to 3.8)compared to human milk (1.1) (Davis et al., 1994). Whereas there are significant differencesin the amino acid pattern of animal milk compared to human milk, cows’ milk does notappear to be more advantageous with regard to the amino acid pattern than other milk(Urbiené et al., 1997).
4.2.2.2 Digestibility
No systematic studies on the digestibility of these other milks were available to theCommittee apart from the data by FAO (1970), neither does it has reason to suppose it to bedifferent from that of cows’ milk.
4.2.2.3 Allergenicity
An increased or decreased allergenicity of milk other than cows’ milk has not beendemonstrated. The high incidence of cows’ milk protein allergy is most probably theconsequence of a predominance of cows’ milk in infant feeding. Cross reactivity to goat andsheep milk has been shown in children with cows’ milk allergy never having received goat orsheep milk (Gjesing et al., 1986; Dean et al., 1993). These authors consider goats’ andsheep’s milk as the least suitable alternatives in children with cows’ milk protein intolerance.
4.2.2.4 Bioavailability of nutrients
Bioavailability of zinc was found to be lowest in sheep’s milk compared to cows’ and goats’milk (which were both lower than human milk). Calcium availability was similar in differentmilks (Shen et al., 1995).
4.2.3 Plant proteins (vegetables and legumes)
4.2.3.1 Soy protein-based infant formulae
Infant formula based on soy protein isolate may be used as as a breast-milk substitute for non-breast-fed vegetarian infants, as an alternative for cows’ milk protein intolerant infants and,because of the absence of lactose, it is suitable for lactose-intolerant and galactosaemicinfants. [It is normally produced from soy protein isolate (minimum protein content 65% ofthe dry extract), practically free of galactooligosaccharides (carbohydrate content less than0.5%). Soy protein isolate still contains phytate (between 1 and 2%), which can inhibit theabsorption of iron and zinc. Phytate can be decreased by treatment with phytases (Lönnerdalet al., 1999), however, this technique appears not to be applied by European manufacturers.The Committee requested in its 23rd report (SCF, 1989) that every effort should be made toreduce the concentrations of trypsin inhibitors, lectins, goitrogenic substances andphytooestrogens by controlled heat treatment and/or extraction (Liener, 1994).
Early reports on negative effects of soy-based infant formulae on growth, enhanced morbidity

43
and decreased immunologic reactivity were done with formulae made from soy flour (Zoppiet al., 1982 and 1979), whereas recent studies with soy protein isolate-based formulae (2.45 gprotein/100 kcal) with and without the addition of nucleotides indicate that the recipientinfants have normal immune development (Ostrom et al., 2002).
Fomon et al. (1973) fed 13 infants ad libitum a formula based on methionine supplementedsoy protein isolate containing 1.1 g of protein (N x 6.25) and 67 kcal/100 mL (1.64 g/100 kcalor 6.6% energy) for 28 days exclusively and thereafter combined with some complementaryfood (7.7 and 6.15% of total energy and protein intake, respectively) up to 112 days. Theyshowed that these infants did not differ from normal breast-fed infants in gains in length andweight and albumin levels in serum and had similar nitrogen balance data. However, intake ofenergy was slightly higher than in infants fed a cows’ milk-based formula with 1.77 g ofprotein/100 kcal. In a study designed to estimate the requirement of sulphur amino acids ofinfants up to the age of 112 days a beneficial effect of L-methionine supplementation (7.5mg/100 kcal) with respect to nitrogen balance was only seen at a protein content of the soy-based formula of 1.8 g/100 kcal. However, with respect to weight gain and/or serumconcentrations of urea nitrogen and albumin, a beneficial effect of methioninesupplementation could be demonstrated at protein concentrations of the formula of 2.2 and 2.6g/100 kcal in 19 and 15 infants, respectively (Fomon et al., 1986).
The Committee decided in 1989 to base the minimum protein requirement for infant formulabased on soy protein isolate fortified with L-methionine (32 mg/100 kcal) on growth studiesin infants fed a formula providing 9% of energy as protein (Fomon et al., 1979). Although itis suggested, that the protein content of soy infant formula need not be higher than that ofcows’ milk-based infant formula when providing the same amounts of available amino acidsno studies of sufficient power with such formulae have been performed (Churella et al.,1994).
The nucleotide content of soy protein based formulae is much higher (about 310 mg/L) thanin either human milk (68 to 72 mg/L) or cows’ milk-based infant formula (8 to 72 mg/L)(Kuchan et al., 2000).
Soy protein is rich in isoflavones which can for example bind to oestrogen receptors andinteract with enzyme systems influencing oestrogenic activity (Setchell, 2001). The totalcontent in ready-for-use products in the USA was determined to be 20-47 µg/mL (Murphy etal., 1997; Setchell et al., 1998; Johns et al., 2003), mainly the glycosides of genistein (65%)and daidzein. A four-month old infant fed such soy formula will receive 22 to 45 mg per dayor 6 to 11 mg/kg body weight per day. Accordingly, plasma levels of daidzein and genisteinin infants fed soy formula were significantly higher (654-1775 ng/mL), than in infants fedcows’ milk formula (9.4�1.2 ng/mL) after 4 months or human milk (4.7�1.3 ng/mL) (Setchellet al., 1998). It is noted that adverse effects of soy-based formulae on reproduction,development, carcinogenesis and immunology have been observed in animals (Badger et al.,2002; Essex, 1996; Newbold et al., 2001; Setchell et al., 1998; Yellayi et al., 2002). To date,despite the wide-spread use of soy-based formulae for example in the USA, there are onlylimited data addressing the safety of soy-based infant formulae and follow-on formulae, otherthan noting the absence of case reports of adverse effects in those fed soy-based infantformulae. The limited epidemiological data available are described below.
Strom et al. (2001a) performed telephone interviews in 811 adults aged between 20 and 34years who had participated as infants during the years 1965 to 1978 in feeding trials with soy-based formula (n=248; 120 males) or cows’ milk formula (n=563; 295 males). Data were

44
collected in adulthood for self-reported height, weight, body mass index, pubertal maturation,menstruation, reproduction and education levels. Female subjects of the original soy grouphad a higher rate of regular use of antiasthmatic and antiallergic drugs (18.8% vs. 10.1%,p=0.047), while males showed a similar but non-significant trend (15.8% vs. 10.2%, p=0.08).Females previously fed on soy formulae had a lower prevalence of sedentary activities(8.9+3.4 hours/week vs 9.6+3.5 hours/week, p=0.05) while there was no group difference formales. There were no differences in height, weight, incidence of thyroid disease (Strom et al.,2001b) or pubertal development between the groups previously fed the two types of formuale.Duration of menstruation was slightly longer (by 0.37 days) and more painful in the soy-fedgroup. Pregnancies were reported by 42% of women fed soy-formula and by 48% of womenin the cows’ milk formula group. Outcomes of pregnancies were not different, neither werethere differences in the occurrence of cancer, hormonal disorders, sexual orientation or birthdefects in the offspring between the groups. No conclusions can be drawn on possible effectson fertility in men previously exposed to soy-based formula, considering their relativelyyoung age at the time of the follow-up study. The Committee notes, however, that thepotential effects of exposure to oestrogenic substances during infancy on subsequent malefertility need to be evaluated.
A retrospective epidemiological study by Fort et al. (1990) found that children withautoimmune thyroid disease were significantly more likely to have been fed soy formulae ininfancy: the frequency of previous feedings with soy based formulae in infancy was 31% in59 patients with autoimmune thyroid disease, but only 12% in their 76 healthy siblings(p<0.01) and 13% in healthy nonrelated controls (p<0.02). There was no group difference inthe frequency and duration of breast feeding. The aglucons of genistein and daidzein weredemonstrated to inhibit the activity of thyroid peroxidase purified from porcine thyroid glandswhen present at concentrations of 1 to 10 µM, resulting in iodinated isoflavone compounds.Four months old infants fed soy protein formulae were shown to have plasma levels ofisoflavones in the range of 1 to 4 µM/L (Setchell et al., 1998). The presence of at least 150µM of iodine per litre in the incubation mixture completely protected against the isoflavonemediated thyroid peroxidase inactivation (Divi et al., 1997).
A preliminary report in abstract form did not indicate any oestrogenic hormonal effects inchildren fed soy formula (Businco et al., 2000).
In infants at risk for atopic diseases there was no difference in the cumulative incidence ofatopic diseases after 5 years between children fed on soy or cows’ milk-based formula(Chandra, 1997). In fourty-nine children with a history of peanut allergy identified in a cohortstudy of 13,971 preschool children there was a significant independent association with theintake of soy infant formula or soy milk (odds ratio 2.6; 95 percent confidence interval, 1.3 to5.2) (Lack et al., 2003).
Both cows’ milk protein and soy protein isolate may be regarded as nutritionally adequate ininfant formula. However, in view of some remaining uncertainties on the short- and the long-term effects of a high isoflavone intake in infancy and on the potential to influence allergicand autoimmune disease, the Committee is of the opinion that soy-based formula should bereserved for specific situations only and that cows’ milk-based formula should be the standardchoice.

45
4.2.3.2 Protein and amino acids, digestibility, bioavailability of nutrients, allergenicity ofother plant proteins
The same considerations as for alternative milks and for soy protein isolate have to be made.It is well known that some indispensable amino acids are deficient in plant proteins and thatthe digestibility of these proteins is significantly less than that of milk proteins.
The increased phytic acid content of plant proteins, that can inhibit the availability of mineralsand trace elements, has to be considered and adequately tested for. If necessary, the contentsof minerals whose absorption is impaired have to be adapted (Lönnerdal et al., 1984).Reduction of phytate content increased the absorption and availability of zinc and copper inrhesus monkeys and rats and of iron in infants (Davidsson et al., 1994a; Lönnerdal et al.,1999). Moreover, phytochemicals like flavonoids occur in plant proteins and their effects onhealth have to be assessed before the use of the plant protein in the manufacture of formula.
4.2.4 Recommendation
The Committee concludes that at present there is no documented benefit in the choice of otheranimal milk proteins or of plant proteins over cows’ milk protein in the manufacture of infantformula. If other protein sources are to be used, their suitability and safety must be assessedbefore commercialisation. Data required are amino acid contents and availability,allergenicity, digestibility and technical processing, and constitutuents other than protein andnitrogenous compounds. Controlled clinical studies are needed to assess the nutritional safetyand nutritional value.
4.3 Protein hydrolysates
Hydrolysed protein is permitted in the manufacturing of infant formula intended for healthynon-breast-fed infants at risk for atopic diseases. The method and extent of hydrolysis andprocessing must be documented but are not regulated. The minimum protein level is 2.25g/100 kcal. The protein content is calculated with a conversion factor of 6.25 and both taurine(42 µmoles/100 kcal) and L-carnitine must be added (7.5 µmoles/100 kcal).
The amount of immunoreactive protein must be less than 1% of nitrogen containingsubstances in the formulae to substantiate a claim on reduced antigen content. Objective andscientifically verified data as proof to the claimed properties must be available. The methodsfor verification are mentioned in the report of the Committee from 1993: molecular propertiesof the hydrolysate, assessment of the actual reduction of antigenicity compared with theoriginal protein by in vitro as well as by in vivo (animal) tests. However, from recent studieson the clinical effectiveness in preventing or delaying the manifestation of atopic diseases ininfants at risk, it appears that data on the degree of hydrolysation and the residual antigenicityof a hydrolysate do not predict clinical effectiveness.
Moreover, the Committee proposed in 1993 that the nutritional efficacy of all products shouldbe demonstrated by a longitudinal study on weight and height development over at least 3months, involving at least 20 babies born at full term and aged less than one month at thebeginning of the study, which should include, if necessary, data on plasma levels of albuminand short half-life proteins, and on the plasma amino acid profile.
The results of clinical studies depend on the type of protein hydrolysed (milk protein, soyprotein, serum albumin, collagen), and the extent and method of hydrolysation, and of

46
processing (Rudloff and Kunz, 1997). Rigo et al. (1989) demonstrated that feeding a wheyhydrolysate formula (1.6 g protein/100 mL; N x 6.38) to 11 term infants during the first sixdays of life resulted in higher concentrations of the sum of indispensable amino acids and ofthe ratio of indispensable amino acids to total amino acids in plasma than in 10 breast-fedinfants and nine infants fed a whey-predominant conventional formula (1.5 g protein/100mL). The threonine level in plasma was more than double the level in breast-fed infants. Thesame changes were observed in 13 term infants receiving the whey hydrolysate formula for 33days. Whereas gain in weight, length, head circumference and the serum levels of retinolbinding protein, prealbumin, transferrin and IgG were comparable to those of breast-fedinfants, there was less gain in skinfold thickness and a lower total protein level in serum in theinfants fed the hydrolysate formula (Rigo et al., 1994a). The plasma levels of tyrosine, prolineand phenylalanine were significantly decreased, the threonine level increased in the formulagroup.
In a further study the same authors evaluated the effects on growth, serum proteins, andplasma amino acids of five different protein hydrolysate formulae (protein content N x 6.38)fed to 71 infants during the first month of live in comparison to 23 breast-fed infants. Threeformulae were based on whey-hydrolysate and produced roughly comparable disturbances ofthe plasma amino acid pattern: elevation of threonine, isoleucine, lysine and citrulline anddecrease of tyrosine. However, whereas the gain in weight, length and head circumferencewas comparable to breast-fed infants with two of the formulae (1.6 g protein/100 mL), thefeeding of one whey-hydrolysate formula (1.7 g protein/100 mL) resulted in a reduction ofweight, length and head circumference gain by 50%, 15% and 30%, respectively. Two otherhydrolysate formulae (1.5 g protein/100 mL) based on soy/collagen (50:50) and a whey/casein(50:50) mixture also resulted in impaired growth, reduced serum transferrin levels and plasmaamino patterns reflecting their amino acid composition (Rigo et al., 1994b). Metabolicbalance studies were performed in ten infants receiving the suspect whey-hydrolysate formulaand 5 infants on the whey-casein-hydrolysate formula and compared to twelve infants onhuman milk and 86 infants on conventional infant formulae. Nitrogen absorption in infantsreceiving the whey hydrolysate was significantly lower than in those on conventional formula,but was similar to that observed in the group of breast-fed infants. However, nitrogenutilisation (nitrogen retained/nitrogen absorbed) was significantly lower (62%) than both inconventional formula (66%) and human milk (77%) fed infants. Fat absorption, calcium,phosphorus and magnesium absorption and retention were similar to those infants fedconventional formulae. The infants fed the whey-casein-hydrolysate formula absorbed only72% of nitrogen, 38% of fat, 27% of calcium, 75% of phosphorus and 30% of magnesium,which is significantly lower than the values observed in infants fed human milk orconventional formula. Nitrogen utilisation was reduced to 55% (Rigo et al., 1995).
Vandenplas et al. (1993) compared the nutritional value of a whey hydrolysate formula (1.5 gprotein/100 mL; 2.2 g protein/100 kcal) and a whey-predominant formula (1.4 g protein/100mL; 2.1 g protein/100 kcal) based on whole protein in 20 and 25 healthy infants from birth to3 months of age. (For both formulae the protein content was calculated as N x 6.25.) In spiteof a significantly lower volume intake in the hydrolysate group, there were no differences inweight gain and length. Blood urea levels and urine urea excretion were significantly higherin the group fed the hydrolysate. Serum zinc and iron binding capacity were significantlyhigher in the hydrolysate group. All other haematologic and blood chemistry values weresimilar.
A recent study evaluated the effects of feeding three different extensively hydrolysed proteinformulae to healthy term infants from 6 weeks to 6 months of age on growth, plasma amino

47
acids, haematology and trace elements in comparison to breast-fed infants and to infantsreceiving a whey-predominant standard formula for the same length of time. The two casein-hydrolysate formulae (true protein (α-amino nitrogen x 6.25) content 1.9 g/100 mLcorresponding to 2.8 and 2.7 g/100 kcal) differed from the whey-hydrolysate formula (1.6 gprotein/100 mL, 2.3 g/100 kcal) in fat, calcium and iron content. The conventional formulacontained less protein (1.3 g/100 mL; 2 g/100 kcal), less calcium, iron and copper. There wereno differences in weight and length and weight/length gain in the five feeding groups. Theinfants receiving the casein-hydrolysates demonstrated the highest blood urea nitrogen levels.All hydrolysate formulae increased the plasma levels of threonine, valine, phenylalanine,methionine, tryptophan and branched-chain amino acids above values seen in breast-fedinfants, with tryptophan and threonine level highest in infants fed the whey-hydrolysate.Tyrosine levels in infants fed the casein-hydrolysate were lowest. Haemoglobin andtransferrin receptor concentrations were similar in all feeding groups, ferritin levels werelowest in infants fed the casein-hydrolysates. Serum zinc and copper concentrations did notshow differences, confirming earlier studies on zinc absorption (Hernell and Lönnerdal,2003). Extensively hydrolysed protein formulae, however, are at present not covered by theInfant Formulae Directive.
In an unselected population of more than a thousand infants the feeding of a partiallyhydrolysed-whey formula (1.64 g protein/100 mL or 2.25 g protein/100 kcal; protein N x6.38) instead of or supplementing breast-feeding did not show a difference in growthparameters at three and six months compared either to exclusively breast-fed or partiallybreast-fed infants supplemented with cows’ milk protein formula or that formula alone (Exl etal., 2000).
Infant formula with a reduced antigen content due to partial hydrolysis of their protein sourceare intended as (prophylactic) formulae for non-breast-fed healthy infants at risk of atopicdiseases. More antigen-reduced formulae due to extensive hydrolysis of their protein sourceand suitable for the treatment of infants with demonstrated protein allergy are not infantformula but foods for special medical purposes and shall not be discussed further. However,compositional and nutritional differences between partial-hydrolysates exist. This concernsthe molecular weight pattern of the hydrolysed protein and the eventual presence ofpotentially active peptides, due to different enzymes employed in hydrolysis and subsequentultrafiltration, different heat treatment, etc. These differences will have effects on thenutritional value and on the intended action of preventing sensitisation and inducing oraltolerance. Pre-clinical testing of formulae based on protein hydrolysates with respect to theirphysicochemical properties (extent of hydrolysis, size exclusion chromatography, peptideweights) and to their immunological properties (residual antigenicity; in vitro and in animalmodels, immunogenicity in animal models) by standardised and validated methods shouldprecede clinical tests (Leary, 1992). Whereas the effects of some hydrolysate formulae havebeen evaluated in numerous published studies, others are put on the market without competentclinical testing of their nutritional safety. This is unacceptable and is illustrated by theexamples cited above.
Ingestion of hydrolysed protein accelerates gastric emptying compared to intact proteins, itinduces faster and higher total amino acid, indispensable amino acid and branched-chainamino acid increases in plasma in combination with higher insulin levels and higherinsulin/glucagon ratios. This effect could be stimulatory for protein synthesis but could alsoresult in increased amino acid oxidation (Calbet and MacLean, 2002).

48
4.3.1 Conclusion and recommendation
Infant formula based on hydrolysed proteins are insufficiently characterised by declaring theprotein source and amount and by designating them as low-degree (partial) or high-degree(extensive) hydrolysates with respect to their nutritional value.
Hydrolysis of proteins and protein mixtures is done with different enzymes, the hydrolysatecan be processed in different ways and the resultant “protein” is insufficiently characterisedby the declared protein value alone, even if it fulfils the regulatory criteria concerning aminoacid patterns and contents. However, the dossiers on the nature of the hydrolysate and the dataon eventually performed clinical studies are not readily available. It appears difficult toidentify products already on the market from published literature. Moreover, additionalcompositional variations in infant formulae containing hydrolysates that have already beenstudied can modify the nutritional value of the formula and clinical outcome parameters. Thishas been clearly demonstrated by the examples cited. Whereas it has been demonstrated thathydrolysates of whey-casein mixtures with low protein contents similar to formula with intactproteins can lead to normal growth and plasma amino acid patterns comparable to breast-fedinfants, it has been shown for some products that they were nutritionally inadequate. It isunknown if such products were removed from the market. The inherent claim thathydrolysates result in less allergic diseases cannot be deduced from technical data alone andneeds substantiation in clinical trials. Surprising is the total lack of clinical studies publishedon follow-on formulae based on partially hydrolysed proteins.
The Committee proposes there should be a requirement for adequate clinical testing beforecommercialisation of protein hydrolysate-based formulae.
4.4 Protein content
4.4.1 The model of human milk
It is customary to state that infant formula - to a lesser degree follow-on formula - because ithas to substitute for human milk in non-breast-fed infants, should be as similar as possible tohuman milk. Although it can be assumed that human milk provides adequate amounts ofenergy and nutrients for growth and development of infants breast-fed exclusively by well-nourished mothers during the first months of life (except for vitamins D and K), this does notmean that copying the composition of human milk as far as possible will guarantee the sameeffect on growth and development. Instead breast-milk substitutes have to be designed with aview to create similar nutritional and physiological effects as breast-milk feeding.
Moreover, human milk is a food of changing composition during the lactational period,during 24 hours and during one meal, whereas an infant formula is a product of constantcomposition and, therefore, must be a compromise on the safe side, both as to the amount ofprotein as to the quality of the protein. Protein requirements of formula-fed infants may begreater than requirements of infants receiving human milk due to differences in utilisation ofthe proteins.
4.4.2 Protein requirements from studies with infant formulae compared to the humanmilk model
The protein intake of breast-fed infants was recalculated by Dewey et al. (1996) on the basisof “true or adjusted protein” (�-amino nitrogen x 6.25) (see Table 3).

49
Assuming an energy density of human milk of 67 kcal/100 mL and the measured volumeintakes one arrives at protein energy ratios of 1.7 to 1.84 g/100 kcal at one month of age andof 1.28 to 1.34 g/100 kcal at age two months. It further declines thereafter.
Fomon et al. (1995a) tested in 15 male infants a formula with 1.56 g/100 kcal at ages 8 to 27days thereafter gradually decreasing in protein density to 1.25 g/100 kcal at 84 days of age.This formula was fed from day 84 to 111. A control group of 13 infants received formula with2.14 g protein/100 kcal. A group of 261 infants fed formulae with protein densities between1.98 to 2.67 g/100 kcal served as reference. Gains in length and levels of serum urea nitrogenwere significantly less in the experimental group, whereas gains in weight and serum albuminlevels did not differ between the three groups. The authors concluded that the protein energyratio of the experimental formula was below the safe level of intake, and that the proteinenergy ratio in the control formula was higher than the safe dietary intake.
Protein in this study was calculated from nitrogen content multiplied by 6.09. Applying thefactor 6.38 as requested in the Infant Formulae Directive the protein energy ratios would havebeen 1.63 to 1.31 g/100 kcal for the experimental formulae, 2.24 g/100 kcal for the controlformula and 2.07 to 2.8 g/100 kcal for the reference formulae.
Räihä et al. (1986) compared the effects on weight, length, head circumference development,on serum albumin, blood urea nitrogen and urinary nitrogen excretion of breastmilk, low-protein infant formula (1.8 g/100 kcal) and “normal” protein infant formula (2.2 g/100 kcal)fed ad libitum in 10 infants each for three months. There were no significant differences inweight, length, head circumference and serum albumin. However, during the first four weeksof life blood urea nitrogen and nitrogen excretion were lower in the low-protein formulagroup. Thereafter they were similar to the breast-fed group. The “true protein” calculatedfrom amino acids in the formulae was 1.6 and 2.14 g/100 kcal, respectively. The proteinintake in the low-protein formula group was lower than in breast-fed infants during the firstmonth of life. Räihä (1994a) recommended formulae with a crude protein content of 2.2 gprotein/100 kcal during the first month of life, 2.0 g/100 kcal in the second month, 1.8 g/100kcal in the third month and 1.6 g/100 kcal in the fourth month.
Fomon et al. (1999) tested a cows’ milk-based formula from day 8 to 112 of life in 16 maleinfants that contained 1.7 g protein/100 kcal or 1.15 g protein/100 mL. Protein was calculatedas total nitrogen x 6.11(according to the crude protein calculation in the EU this correspondsto 1.2 g protein/100 mL or 1.8 g protein/100 kcal) and compared it to earlier data from infantsfed cows’ milk formula (1.8 to 2.7 g/100 kcal) and breast-fed infants. Infants receiving theexperimental formula gained more weight and had higher body mass indices. Serum urea wassimilar to the breast-fed group. However, because energy intakes were significantly higher inthe ad libitum fed group on the experimental formula, the authors concluded that the proteinenergy ratio of the experimental formula was not “safe” although the protein intake wasjudged to be adequate between one and 8 weeks of age.
Räihä et al. (2002) compared three whey modified cows’ milk-based formulae in 29 infantseach, two with 1.9 g protein/100 kcal (protein = total nitrogen x 6.38) and the other with 2.3 gprotein/100 kcal, which were fed from birth to the age of 4 months. The NPN content was10% of TN in all three formulae. The “adjusted” protein [(TN - NPN + 40% NPN) x 6.38]content was given as 1.8 and 2.2 g/100 kcal, respectively. Nitrogen retention (117 mg/kg/day)did not differ in the infants receiving the low- versus the higher-protein formula. The aminoacid pattern of the formulae with a protein content of 1.8 g/100 kcal was remarkably similar to

50
the pattern of human milk after correction of the human milk pattern given in the publicationfor nitrogen. There was no difference in gains of weight and length, or in serum albuminlevels. Serum urea concentrations were higher in the higher-protein formula-fed group. Thelower-protein formulae were judged to meet needs of normal infants. In another study twowhey-predominant formulae with protein contents of 1.83 g/100 kcal and 2.24 g/100 kcalwere compared in 8 normal infants between 28 and 128 days of age in a cross-over design.Despite the lower protein intake with the low-protein formula nitrogen retention was similarin both groups (Ziegler, 2002).
These studies indicate that, depending on protein quality, whey adaptation and processing, aformula with a crude protein content of 1.9 g/100 kcal is safe in infants especially over theage of two months.
4.4.3 The minimum protein content in infant formulae
At present the Infant Formulae Directive requests at least 1.8 g of crude protein/100 kcal forcows’ milk-based formula and 2.25 g/100 kcal for soy protein and partially hydrolysedprotein formula. Protein is calculated as crude protein with a factor of 6.38 for the first andwith a factor of 6.25 for the two latter.
A content of 1.8 g crude protein according to the Directive corresponds to 1.76 g crudeprotein calculated with a factor of 6.25, to 1.72 g “true” protein according to Fomon et al.(1995a), to 1.62 g “adjusted” protein according to Dewey et al. (1996), and 1.66 g accordingto Miera (1998) and 1.59 g according to the the simplified LSRO method (see section 4.1.1).The Expert Panel of the LSRO (1998) stresses the necessity to calculate the “true” minimumprotein content for all kinds of formula from α-amino nitrogen to avoid unusual amounts ofnon-available nitrogen to be included into the protein content calculation. This report suggests1.7 g “true protein”/100 kcal (�-amino nitrogen x 6.25) as the minimum protein level for allkinds of protein sources. Expressed as crude protein (N x factor 6.25) this corresponds to 1.87g/100 kcal.
From the data in section 4.4.2 it appears that a crude protein content of 1.8 g/100 kcal in aninfant formula is marginal for normal growth in young infants. The Committee does,therefore, not recommend feeding a formula with a crude protein content of 1.8 g/100 kcal toyoung infants. However, the Committee proposes to retain the present minimum level for therange of crude protein levels to be provided by infant formula, because it does not recognisean urgent necessity to increase the crude protein content of infant formula presently on themarket and because an increase in the minimum level would be likely to lead to anunnecessary increase in the average protein content of infant formula.
The higher minimum levels for crude protein set in the Infant Formulae Directive for infantformula with intact proteins other than intact cows’ milk protein, i.e. soy protein isolate, aimsto correct for potentially less digestibility and therefore availability of the “protein” comparedto intact cows’ milk protein. There are insufficient data to justify a change in the minimumprotein level (2.25 g/100 kcal) in soy formulae.
Any protein source which has not yet been evaluated should be clinically tested before beingused in the manufacture of infant formula for its capability to support normal growth incomparison to infants either breast-fed or fed a reference formula.
To our knowledge there are no systematic studies to assess growth and biological parameters

51
of infant formulae with partially hydrolysed protein to determine the minimal safe proteincontent. Therefore, the Committee does not propose a change in the minimum protein content(2.25 g/100 kcal).
4.4.4 The minimum protein content in follow-on formulae
The minimum protein content required for follow-on formulae in the EU is no longer justified(see section 2.2). It is even discussed that the resultant protein intake of 13 to 20% of theenergy intake in infants drinking follow-on formula and eating (protein-rich) complementaryfood (Schöch and Kersting, 1996; Nielsen et al., 1998; Alexy et al., 1999) could programthese children for disease such as obesity in adult life, apart from inherent negative effects ofa high protein intake on renal function and water balance. The weakness of most humanstudies in that field is that they are retrospective and do not provide data on absolute proteinintake apart from protein-energy-ratios. Prospective longitudinal studies are needed to providemore conclusive information (Metges, 2001).
The Committee proposes to reduce the minimum crude protein content for follow-onformulae to 1.8 g/100 kcal. If the energy content of follow-on formula remained at 60 to 80kcal/100 mL this would result in crude protein contents between 1.08 g and 1.44 g/100 mL.Changing the energy content of follow-on formula to 60 to 70 kcal/100 mL will result inminimum protein concentrations of 1.08 to 1.26 g/100 mL.
In analogy to infant formula, the Committee proposes to retain the minimum crude proteincontent (TN x 6.25) of follow-on formula based on soy protein isolate and protein hydrolysate(2.25 g/100 kcal).
A model calculation was performed to demonstrate the effect of changes in energy andprotein contents of both infant and follow-on formulae based on intact cows’ milk protein onthe intake of protein in infants between 4 and 7 months of age. For this calculation therecommended feeding regimen for the first year of life was used, which has been developedby the German Research Institute for Child Nutrition (Kersting et al., 1994). This has theadvantage that the recipes of the complementary meals in addition to formula are fixed andtheir nutrient and energy content has been estimated.
According to this regimen infants are fed exclusively on breast-milk or infant formula for thefirst four to six months of life. A vegetable-potato-meat meal is introduced at the earliest atthe beginning of the 5th month, about four weeks later a milk-cereal meal is added and againabout one month later a cereal-fruit meal, while formula (or breast-milk) is continued indecreasing amounts.
Infant formula at present provides 60 to 75 kcal and 1.1 to 2.25 g crude protein/100 mL.Follow-on formula provides at present 60 to 80 kcal and 1.4 to 3.6 g crude protein/100 mL.Infant and follow-on formulae modified according to the new proposals would provide 1.08 to2.1 g crude protein/100 mL.
A. During the 5th to 7th months of life an infant is assumed to consume 870 mL of infantformula per day. The recommended protein intake at that age is 14 g per day (SCF,1993a).
The calculated intakes are given in the following Table in g per day.
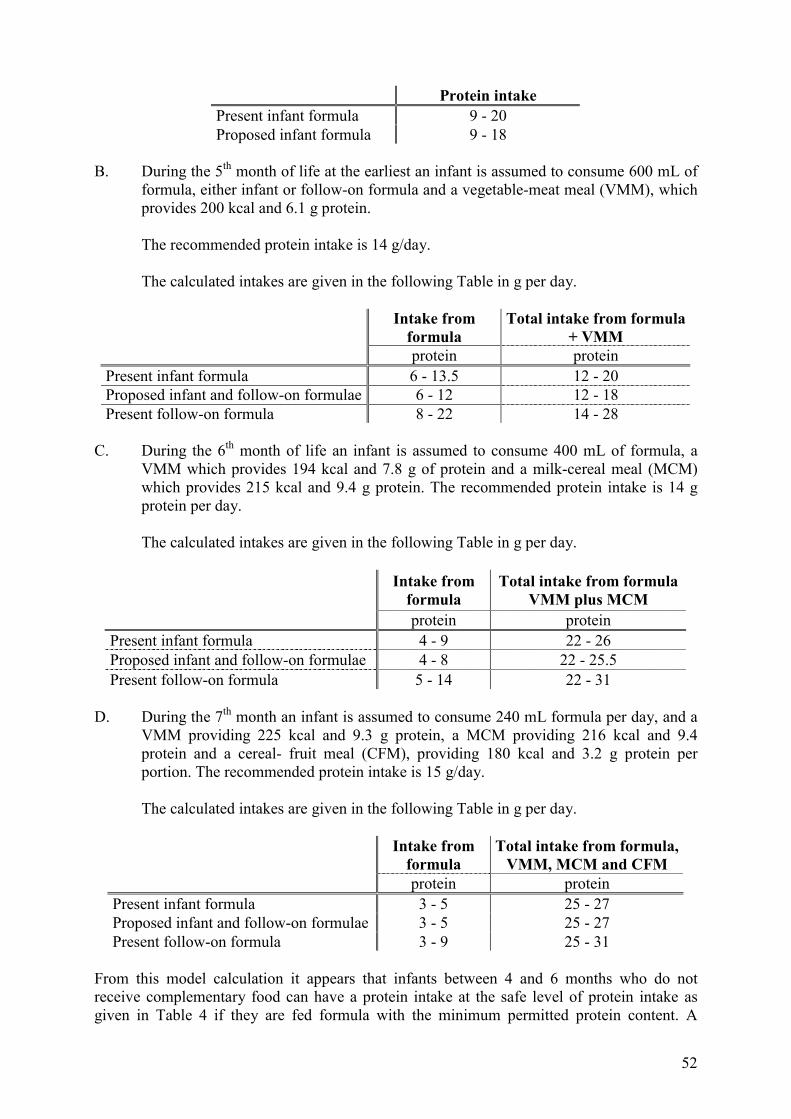
52
Protein intakePresent infant formula 9 - 20Proposed infant formula 9 - 18
B. During the 5th month of life at the earliest an infant is assumed to consume 600 mL offormula, either infant or follow-on formula and a vegetable-meat meal (VMM), whichprovides 200 kcal and 6.1 g protein.
The recommended protein intake is 14 g/day.
The calculated intakes are given in the following Table in g per day.
Intake fromformula
Total intake from formula+ VMM
protein proteinPresent infant formula 6 - 13.5 12 - 20Proposed infant and follow-on formulae 6 - 12 12 - 18Present follow-on formula 8 - 22 14 - 28
C. During the 6th month of life an infant is assumed to consume 400 mL of formula, aVMM which provides 194 kcal and 7.8 g of protein and a milk-cereal meal (MCM)which provides 215 kcal and 9.4 g protein. The recommended protein intake is 14 gprotein per day.
The calculated intakes are given in the following Table in g per day.
Intake fromformula
Total intake from formulaVMM plus MCM
protein proteinPresent infant formula 4 - 9 22 - 26Proposed infant and follow-on formulae 4 - 8 22 - 25.5Present follow-on formula 5 - 14 22 - 31
D. During the 7th month an infant is assumed to consume 240 mL formula per day, and aVMM providing 225 kcal and 9.3 g protein, a MCM providing 216 kcal and 9.4protein and a cereal- fruit meal (CFM), providing 180 kcal and 3.2 g protein perportion. The recommended protein intake is 15 g/day.
The calculated intakes are given in the following Table in g per day.
Intake fromformula
Total intake from formula,VMM, MCM and CFM
protein proteinPresent infant formula 3 - 5 25 - 27Proposed infant and follow-on formulae 3 - 5 25 - 27Present follow-on formula 3 - 9 25 - 31
From this model calculation it appears that infants between 4 and 6 months who do notreceive complementary food can have a protein intake at the safe level of protein intake asgiven in Table 4 if they are fed formula with the minimum permitted protein content. A

53
protein intake below the safe level of intake, by definition, does not mean that in individualsthis intake would be deficient.
The use of infant or follow-on formulae with the minimum protein amount can result in totalprotein intakes in infants fed formula exclusively or in infants with little complementary foodto critically low levels.
From this model calculation the lowering of the maximum protein content of follow-onformula appears to be desirable.
These model calculations also indicate that an increasing number of complementary mealstend to reduce the contribution of formula to the protein intake.
4.4.5 The maximum protein content in infant formulae
The Infant Formulae Directive sets a maximum value of 3.0 g crude protein/100 kcal for alltypes of formulae. For formulae based on intact cows’ milk this is calculated with a factor of6.38, for all others with 6.25.
This is lower than the maximum level proposed in the LSRO report (1998): 3.4 g crudeprotein/100 kcal (calculated from total nitrogen x 6.25).
There is no justification on nutritional grounds for a higher value than the current one.Formulae providing more than 12% of energy as protein are not needed by healthy infants.They increase the potential renal solute load of a formula which is predominantly determinedby the protein content. Infants with extra water losses in the course of illnesses could becomeendangered by hypertonic dehydration.
4.4.6 The maximum protein content in follow-on formulae
The considerations and model calculations under section 4.4.4 lead the Committee to proposea reduction of the crude protein content of follow-on formula based on intact proteins and onhydrolysed protein to 3.0 g/100 kcal.
4.5 Protein quality
All calculations of protein requirements have to consider the protein quality. Determinationsof protein requirements from measured protein intakes of breast-fed infants, by the factorialmethod or by nitrogen balances are valid only for the protein consumed. This is especiallytrue during infancy with its rapid growth and the ressulting high needs for protein synthesis.
The Infant Formulae Directive requires protein quality to be assessed by the “chemical index”or amino acid score with human milk as the reference protein for both cows’ milk and soyprotein based formula and formula with hydrolysed protein and for follow-on formula. Forfollow-on formula alternatively casein can be used as the reference protein.
In addition, the protein efficiency ratio (PER) and net protein utilisation (NPU) for partialhydrolysates of protein must be similar to casein.

54
4.5.1 Amino acid score
The Infant Formulae Directive has converted the amino acid pattern of human milk protein(mg/1 g protein) (Annex VI) into minimum amino acid amounts that will have to be providedby an infant formula per 100 kcal, by multiplication of the pattern of Annex VI by theminimum protein content of 1.8 g/100 kcal in infant formula. A formula with a higher proteincontent can, therefore, compensate for possible deficits in the amino acid pattern of theprotein used by providing more of that protein.
Not the quality of the protein per se as to its amino acid pattern in comparison to human milk(or casein) is assessed but the amounts of single amino acids per energy value in comparisonto human milk.
This is named amino acid rating. This is, of course, only valid if the protein content of bothformula and human milk is calculated in the same way and corrected for by digestibility (trueprotein digestibility - relative amino acid rating, TPD - corrected RAAR).
It has been shown in pig models, that the digestibility corrected amino acid pattern of humanmilk differs from the amino acid pattern of the protein (Darragh and Moughan, 1998). Thesame can be expected for proteins in infant formula. However, as long as there are no reliabledata, the present requirements as to protein quality will have to suffice as the bestcompromise.
For formulae based on soy protein isolates the requirements for protein quality as determinedby amino acid score rating should be the same as for other infant formulae.
The pattern given in Annexes V and VI of the Infant Formulae Directive will be discussed insection 4.6.
4.5.2 Protein Efficiency Ratio (PER) and Net Protein Utilisation (NPU)
PER and NPU are routinely determined in rats. There are some doubts as to the usefulness ofthese tests to assess protein quality for humans: rats require higher amounts of sulphur aminoacids than humans, weanling rats cannot tolerate lactose, the standardised application of 10%protein in the feed for PER is not achieved with infant formulae, there is poor reproducibilityand the costs are high. For protein hydrolysates a PER and NPU are required whichcorresponds to that of casein as a minimum.
While the determination of PER or NPU or NPR (net protein ratio) can give valuableinformation in preclinical testing of newly introduced protein sources (Sarwar et al., 1989),these methods are not sufficient to characterise the nutritional value and to substitute forclinical testing. The Committee proposes that the obligatory request for PER and NPU in theInfant Formulae Directive is not necessary, and that it should be replaced by a requirement forclinical testing of any proteins that have not been evaluated before for use in infant formulae.
4.5.3 Other qualifying factors for protein
Methionine and cyst(e)ine cannot substitute completely for each other. Infants have a basicneed for both. It should be considered not to allow the sum of both to be used in amino acidrating (this is the current rule). Whereas the methionine to cystine ratio on a weight basis is1.1 in human milk, it is almost 3 in cows’ and goat’s milk. Ratios of 2 and more should not be

55
accepted in infant formula without clinical testing. Also the ratio of phenylalanine to tyrosine,which is about 1 in human milk should not be lower than 0.5 in infant formula.
For soy protein-based infant formula there is already a requirement in the Directive to providethe same amount of methionine per energy value as human milk. The Committee proposes torequest complete amino acid rating as for the other types of infant formula.
If a specified taurine content is considered to be relevant logically this should not be restrictedto formula with hydrolysed protein, but the addition should be permitted irrespective of theprotein source.
4.6 Amino acids in reference proteins
4.6.1 Comparison to the FAO/WHO/UNU scoring pattern
The Infant Formulae Directive applies the amino acid pattern for human milk proteindeveloped from a FAO report (1970) not the pattern suggested by FAOWHO/UNU in 1985and not replaced since. In addition to the nine amino acids in the 1985 pattern (histidine,isoleucine, leucine, lysine, methionine plus cystine, phenylalanine plus tyrosine, threonine,tryptophan, and valine), the Infant Formulae Directive contains values for arginine and listscystine and methionine, and phenylalanine and tyrosine separately.
The 1970 pattern makes reference to crude protein calculated with the factor 6.38, theFAO/WHO/UNU pattern from 1985 to crude protein calculated with the factor 6.25. If onecorrects for this difference the following values result:
Table 9. Amino acid content of human milk (g/100 g crude protein)
FAO, 1970 FAO/WHO, 1985protein = N x 6.38 protein = N x 6.25 protein = N x 6.38
Arginine 3.9 - -Cystine 1.3 - -Histidine 2.5 2.6 2.55Isoleucine 4.1 4.6 4.51Leucine 8.8 9.3 9.11lysine 6.8 6.6 6.47Methionine 1.6 - -Methionine plus cystine - 4.2 4.11Phenylalanine 3.5 - -Threonine 4.5 4.3 4.21Tryptophan 1.7 1.7 1.67Tyrosine 3.3 - -Phenylalanine plus tyrosine - 7.2 7.05Valine 4.5 5.5 5.39
The differences are small. It must be considered if the reliability of values determined before1970 is still acceptable. The same criticism could be offered for the 1985 values.
The Committee proposes to delete arginine from the scoring pattern in Annex V and AnnexVI to of the Directive. There is no scientific evidence to prove that healthy full-term infants

56
need a specified amount of dietary arginine. The presently valid request for a minimumarginine content of 69 mg/100 kcal in infant formula has led to the addition of free arginine to4 of 15 infant formulae analysed, whereas 5 of these 15 products did not comply with therequirement for arginine (Miera, 1998).
4.6.2 Other scoring patterns
The report of the LSRO from 1998 has combined and calculated the means of amino acidcontents in human milk of more recent date (Davis et al., 1994; Janas et al., 1987; Sarwar etal., 1996; Picone et al., 1989a). However, one of these publications is on transitional milk(Sarwar et al., 1996), and only one has analysed complete 24-hour collections of human milk(Davis et al., 1994). These values are referenced to “true protein” (α-amino nitrogen x 6.25)and would therefore have to be corrected to become comparable to the FAO values. Inconverting these values to mg/100 kcal methionine and cystine and phenylalanine andtyrosine have been added, however, under the precautionary statement that their ratios shouldnot exceed 2:1 or 1:2, respectively.
The LSRO report recommends the setting of maximum values per 100 kcal for each of thelisted amino acids (two times the minimum values) to avoid the use of proteins withimbalanced amino acid patterns.
The Food and Nutrition Board of the Institute of Medicine (FNB, 2002a) has proposed amodified amino acid pattern of human milk, based on 4 references (Darragh and Moughan,1998; Davis et al., 1994; Heine et al., 1991; Villalpando et al., 1998). However, again thereference unit in the different sources is not the same although expressed in mg amino acidper g protein. For example “protein” is the sum of total anhydrous amino acids (Davis et al.,1994, Heine et al., 1991) or total nitrogen multiplied by 6.38 (Darragh and Moughan, 1998)or total nitrogen minus NPN multiplied by an unknown factor (Villalpando et al., 1998). Toavoid this problem it seems to be advisable to refer the individual amino acid content to thenitrogen content to avoid confusion about the nature of the protein calculation. This has beendone for published studies on the amino acid content of human milk which reportmeasurements of the total nitrogen content and/or the calculation method for the proteincontent (Table 10).
The studies listed in this Table cover milk samples from about 120 women from 4 weeks oflactation to late lactation and from pooled human milk bank samples. The Committee decidednot to consider the data of FAO (1970) and of FAO/WHO/UNU (1985) and the studies byDonovan and Lönnerdal (1989b) and by Sarwar et al. (1996) because of a small sample sizeand because of early or unstated sampling periods.
Table 11 compares the amino acid pattern according to Annex VI of the Infant FormulaeDirective (recalculated for one gram total nitrogen content by dividing protein by the factor6.38), of the FNB (2002a) and the mean values from the studies listed in Table 10.
The main differences between the FNB values and the mean values in Table 11 compared toAnnex VI concern significantly higher values for cysteine, isoleucine, leucine, phenylalanine,tyrosine and valine. The Committee proposes to revise Annex VI. Starting from the meanvalues in Table 11 and recalculating them with reference to crude protein (total nitrogen x6.25) and taking into account the Committee’s proposal to delete arginine from the scoringpattern the following pattern results (Table 12).

57
The values for indispensable and conditionally indispensable amino acids in human milkexpressed as mg/100 kJ or 100 kcal given in Annex V of the Infant Formulae Directive willhave to be revised based on the proposed amino acid pattern in Table 12 and a minimumcrude protein content of 1.8 g/100 kcal.
Table 10. Amino acid content of human milk, expressed as mg per gram of nitrogen
Lönnerdaland Forsum
(1985)
Darragh andMoughan
(1998)
Bindels andHarzer(1985)
Janas et al.(1987)
Villalpando et al.(1998)
Räihä et al.(2002) mod.
Nayman et al.(1979)
N milk bank 20 10 10 Mexico40
Houston40 milk bank
Stage of lactation 4-16 weeks 10-14 weeks 5 weeks 8 weeks 4-6 m >1 m
Sampling pooled bankmilk
over 20 days,pooled 24 h, pooled 24 h, pooled 24 h, pooled pooled bank milk
Arginine 157 200 281 184 168 184 172Cystine (half) 111 173 108 101 167 134 133Histidine 111 156 255 112 112 108 122Isoleucine 242 333 376 306 292 331 300Leucine 457 598 713 611 528 541 572Lysine 314 406 522 365 366 408 361Methionine 78 90 89 73 99 76 83Phenylalanine 153 243 344 183 440 439 217Threonine 217 316 344 251 248 242 256Tryptophan n.a. n.a. 172 79 112 89 111Tyrosine 201 241 369 191 292 299 233Valine 253 327 376 267 286 331 317Methionine + cystine 289 - - - - - -Phenylalanine + tyrosine 354 - - - - -
Total N mg/L 2070 1800 1760 1800 1610/1570 1800
n.a. = not analysed
Table 11. Amino acid content of human milk expressed as mg per gram of nitrogen fromdifferent sources
Annex VI91/321/EEC
FNB2002a*
Mean valueof data in Table 10
Arginine 242 n.a. 192Cysteine 83 140 132Histidine 159 146 139Isoleucine 255 363 311Leucine 542 643 574Lysine 427 439 392Methionine 102 102 84Phenylalanine 217 255 288Threonine 281 299 268Tryptophan 108 115 113Tyrosine 204 299 261Valine 287 357 308* Protein converted to nitrogen by dividing by 6.38
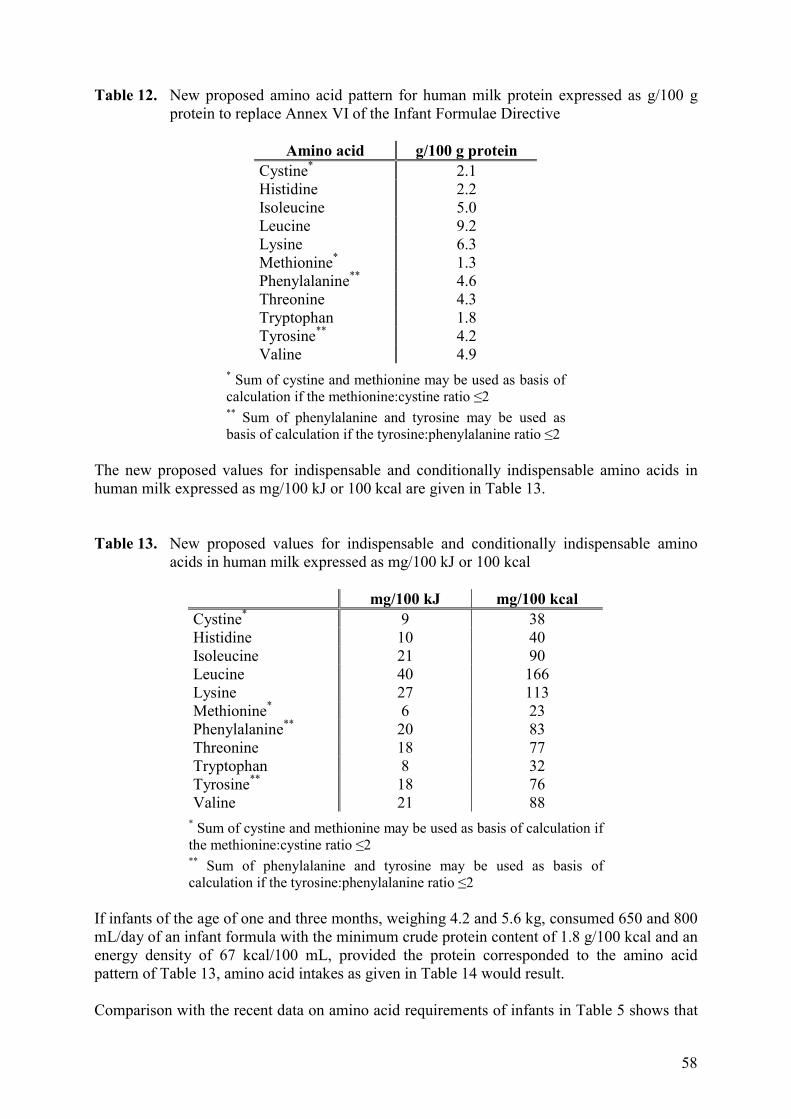
58
Table 12. New proposed amino acid pattern for human milk protein expressed as g/100 gprotein to replace Annex VI of the Infant Formulae Directive
Amino acid g/100 g proteinCystine* 2.1Histidine 2.2Isoleucine 5.0Leucine 9.2Lysine 6.3Methionine* 1.3Phenylalanine** 4.6Threonine 4.3Tryptophan 1.8Tyrosine** 4.2Valine 4.9
* Sum of cystine and methionine may be used as basis ofcalculation if the methionine:cystine ratio ≤2** Sum of phenylalanine and tyrosine may be used asbasis of calculation if the tyrosine:phenylalanine ratio ≤2
The new proposed values for indispensable and conditionally indispensable amino acids inhuman milk expressed as mg/100 kJ or 100 kcal are given in Table 13.
Table 13. New proposed values for indispensable and conditionally indispensable aminoacids in human milk expressed as mg/100 kJ or 100 kcal
mg/100 kJ mg/100 kcalCystine* 9 38Histidine 10 40Isoleucine 21 90Leucine 40 166Lysine 27 113Methionine* 6 23Phenylalanine** 20 83Threonine 18 77Tryptophan 8 32Tyrosine** 18 76Valine 21 88
* Sum of cystine and methionine may be used as basis of calculation ifthe methionine:cystine ratio ≤2** Sum of phenylalanine and tyrosine may be used as basis ofcalculation if the tyrosine:phenylalanine ratio ≤2
If infants of the age of one and three months, weighing 4.2 and 5.6 kg, consumed 650 and 800mL/day of an infant formula with the minimum crude protein content of 1.8 g/100 kcal and anenergy density of 67 kcal/100 mL, provided the protein corresponded to the amino acidpattern of Table 13, amino acid intakes as given in Table 14 would result.
Comparison with the recent data on amino acid requirements of infants in Table 5 shows that

59
these requirements are met.
Table 14. Amino acid intake in one- and three-month old infants (body weight 4.2 and 5.6kg, respectively) consuming 650 and 800 mL of an infant formula with a crudeprotein content of 1.8/100 kcal with an energy density of 67 kcal/100 mL and theamino acid pattern proposed in Table 13
One month old infant Three months old infantmg/day mg/kg/day mg/day mg/kg/day
Cysteine 166 39 204 36Histidine 174 42 214 38Isoleucine 392 93 482 86Leucine 724 172 890 159Lysine 493 117 606 108Methionine 100 24 123 22Phenylalanine 362 86 444 79Threonine 336 80 413 74Tryptophan 140 33 172 31Tyrosine 331 79 407 73Valine 384 91 472 84
4.6.3 Recommendation
The Committee proposes new values for the amino acid pattern of the reference proteinhuman milk as given in Tables 12 and 13.
The Committee proposes that for all types of infant formulae and follow-on formulae the perenergy value the amount of indispensable and conditionally indispensable amino acids shouldat least correspond to the values in human milk as shown in Table 13. The Committee is ofthe opinion that the sum of methionine and cystine contents may be used as the basis forcalculation if the methionine:cystine ratio does not exceed 2, and the sum of phenylalanineand tyrosine may be used if the tyrosine:phenylalanine ratio does not exceed 2.
4.7 Taurine, carnitine, nucleotides, choline and other nitrogen-containing compounds
4.7.1 Taurine
Taurine is a non-protein amino acid that is found in most tissues and in human milk at alllactational stages (3.4 to 8.0 mg/100 mL or 5.1 to 11.9 mg/100 kcal). It is practically absent inmature cows’ milk (Rassin et al., 1978) and formula based on cows’ milk protein and soyprotein isolates. It is added to many infant formulae without adverse effects and little evidenceof benefit and mostly because it is found in human milk.
It has recognised functions in bile acid conjugation. Other roles of taurine in the scavengingof hypochlorous acid produced by activated neutrophils and macrophages during therespiratory burst (Cunningham et al., 1998), in the detoxification of retinol, iron andxenobiotics and in calcium transport, myocardial contractility, osmotic regulation and in thecentral nervous system have been shown mostly in in vitro or animal experiments (Gaull,1989). Taurine is found in high concentrations in foetal and neonatal human brain (Sturman,1988). Infants fed parenterally developed low levels of taurine in plasma and urine and

60
changes in electroretinography which could be corrected by taurine supplementation (Sturmanand Chesney, 1995).
Infants fed a taurine-supplemented (6 mg/100 mL) infant formula with a protein content of 2g/100 mL (2.9 g/100 kcal) showed the same growth development from 2 to 12 weeks of ageas infants breast-fed or receiving the same formula without taurine. However, blood ureanitrogen levels at 12 weeks were significantly lower than in infants fed the taurine-freeformula and similar to breast-fed infants, as were the concentrations of indispensable aminoacids in plasma and urine (Räihä et al., 1996). The mechanism of this effect is unclear.
As previously noted (in section 4.5.3) if a specified taurine content is considered to berelevant logically this should not be restricted to formula with hydrolysed protein. TheCommittee considers that the requirement for a minimum content of taurine in formulaemanufacturered from hydrolysed protein is not necessary.
The Committee proposes that, when added, taurine addition to any type of infant formulashould be not exceeding 12 mg/100 kcal.
4.7.2 Carnitine
The addition of L-carnitine to infant formula based on soy protein isolate and hydrolysedprotein to give a content of at least 7.5 �moles/100 kcal (1.2 mg/100 kcal) is required in theEU and the Committee does not propose a change. This value is similar or somewhat higherthan in human milk (0.9 to 1.2 mg/100 kcal) because of a presumed reduced bioavailabilityfrom formula (Warshaw and Curry,1980). Cow’s milk is rich in carnitine (around 5 mg/100 kcal*)compared to human milk, therefore carnitine addition to cows’ milk-based formula is notnecessary. Carnitine is synthesised in the human body at a rate of approximately 0.3mg/kg/day from lysine and using methionine as methyl donor (Rebouche and Seim, 1998). Itis considered an indispensable nutrient for newborn infants (Rebouche, 1992) because of atemporarily compromised synthesising capacity. Its function is the transport acrossmembranes of carboxylic acids that have been activated to the co-enzyme A level, therebydelivering substrates for oxidation and removing toxic compounds.
Infants receiving unsupplemented soy formula for 112 days showed lower serum levels ofcarnitine, higher levels of free fatty acids and an increased excretion of medium-chaindicarboxylic acids (Olson et al., 1989). The minimal dietary carnitine requirement of anewborn infant has been estimated to be 1.7 mg/kg/day due to a practically absentendogenous synthesis (Scholte and de Jonge, 1987).
The Committee considers the addition of carnitine to follow-on formula is not necessary.Supply from appropriate complementary food and from endogeneous synthesis should besufficient in older infants. Only the liver butyrobetaine hydroxylase, the last enzyme incarnitine biosynthesis, shows age-dependent low activity in young infants. The activity of thekidney enzyme and the other three biosynthetic enzymes in the liver and other tissues are notage-dependent (Vaz and Wanders, 2002)
4.7.3 Nucleotides and nucleosides
Nucleosides contain a nitrogenous base and a pentose, but no phosphate group. Nucleotidescontain a nitrogenous base, a pentose and one or more phosphate groups. Nucleotides arefound primarily intracellularly. They are the structural components of DNA and RNA.
*The figure has been changed from "50 mg/100kcal" to "5 mg/100kcal" following a corrigendum sent by EFSA notifying the Commission of the typing mistake (letter of 22/08/2007).

61
Nucleotides such as adenosine triphosphate (ATP) transfer chemical energy. Othernucleotides are involved in the synthesis of proteins, lipids and carbohydrates (e.g. nicotineadenine dinucleotide, NAD; flavin adenine dinucleotide, FAD).
Human milk contains free ribonucleosides and ribonucleotides (Gil and Sanchez-Medina,1982; Topp et al., 1993; Leach et al., 1995; Schlimme and Schneehagen, 1995) (Table 15). Inaddition, human milk contains RNA and DNA, of which the major part is located within cells.Leach et al. (1995) reported data for “total potentially available nucleosides” released frompreviously frozen human milk samples after sequential treatment with sodium hydroxide,nuclease, pyrophosphatase, phosphatase and phosphoric acid. This method should detect alsonucleotides hydrolysed from polymeric ribonucleotides (RNA and DNA) and adducts, andincludes intracellular nucleosides. Leach and coworkers reported markedly higherconcentrations of “total potentially available nucleosides”, as compared to the reportedamounts of free ribonucleosides and ribonucleotides (Table 15). Of the “total potentiallyavailable nucleosides”, 48�8% were reported to be polymeric nucleotides, 36�10%monomeric nucleotides, 8�6% nucleosides and 9�4% adducts (nucleoside-phosphate-phosphate-X, e.g. uridine diphosphate galactose or NAD) (Leach et al., 1995). However, it isnot known which proportion of the “total potentially available nucleosides” in human milk isutilised by the breast fed infant in vivo. While human milk nucleotides might exert beneficialeffects in the breast-fed infant, it is also possible that nucleotides and nucleosides, RNA andDNA might occur in human milk only as a by-product of milk formation that reflectmetabolic activity of the mammary gland tissue, shedding of somatic cells and occurrence ofmicroorganisms, without having a specific function for the infant. Accordingly, higherconcentrations of ribonucleosides in colostrum than in mature milk have been interpreted as aconsequence of the high metabolic activity of the mammary gland during the first dayspostpartum, along with higher contents of cellular components (Schlimme et al., 2000).
Table 15. Reported mean contents of ribonucleosides, ribonucleotides, and so-called “totalpotentially available ribonucleosides” in mature human milk (mg/L)
Adenine Cytosine Guanine Uracil TotalRibonucleotides1 7.8 7.0 1.2 4.8Ribonucleosides2 0.4-1.8 1.0-1.2 0.1-0.3 0.1-1.7“Total potentially availablenucleotides”3 10.6 29.3 6 12.6 67.2-67.5
1 Gil and Sanchez-Medina, 19822 Topp et al., 1993; Leach et al., 1995; Schlimme and Schneehagen, 19953 Leach et al., 1995
Nucleotides and nucleosides are synthesised de novo in human metabolism, and nucleotidesliberated during nucleic acid catabolism can be reutilized via a salvage pathway. Hencenucleotides and nucleosides are considered to be dispensable nutrients. In breast-fed infantsthe dietary intake of preformed nucleotides accounts for only a minor fraction of therequirement. Uauy et al. (1994) estimated that only about 2% of nucleotide accretion ingrowing tissues of the infant is covered by the ingestion of nucleotides with breast milk. Evenif the sum of nucleotides and nucleic acids in breast milk could be utilized by the infant theywould account for only about 15% of nucleotide accretion (Uauy et al., 1994). Thus, theinfant must be capable of effectively synthesing nucleotides. Moreover, the assumption thatthe sum of nucleotides and nucleic acids in breast milk could be utilized may not be correct.

62
In human adults, the effect of ingested free nucleotides on urinary uric acid excretionindicates practically complete absorption of purines from such sources, whereas dietary RNAincreases urinary uric acid excretion to a lesser extent, hence dietary RNA is not fullyabsorbed and utilised (PAG Ad hoc Working Group, 1975). The effect of DNA on uric acidlevels is only about half of that of RNA (PAG Ad hoc Working Group, 1975). Human infantsfed a formula based on soybean protein isolate, which contains relatively large amounts of soyRNA, were reported to have serum uric acid concentrations near the upper end of thereference range, suggesting that infants utilise soy RNA at least in part (Kuchan et al., 2000).However, a systematic evaluation on the relative utilisation of free nucleotides, RNA andDNA in infants, for example with a comparison of their effects on uric acid excretion, is notavailable. In any case based on the quantitative considerations cited above it is unlikely thatthe nucleotide supply provided with human milk has marked effects on tissue accretion.
Even if dietary nucleotides, nucleosides, RNA and DNA would have little systemic effects,they may be utilised by some tissues such as intestinal mucosa cells. It should also be notedthat the addition of nucleotides to the food provides an added source of NPN, and ofphosphorus, which under certain circumstances might have relevant metabolic effects.
Several clinical trials have been presented that aim at evaluation of effects of nucleotideaddition to formula in infants, but only two of the trials have studied formulae with nucleotidelevels of 72 mg/L (Pickering et al., 1998, Lasekan et al., 1999).
Carver et al. (1991) studied 15 healthy term infants randomised to a formula without and 13infants to a formula with 33 mg/L free nucleotides, as well as a reference group of 9 breast fedbabies. There were no differences in clinical outcomes such as growth or infection rates.Natural killer cell activity and interleukin 2 production of peripheral blood mononuclear cellsin vitro was significantly higher in infants fed formula with nucleotides than the controlformula at the age of 2 months, but not at 4 months. The clinical relevance of this differenceis not known.
Brunser et al. (1994) studied infants from a lower socioeconomic group in Chile fed formulaewithout (n=148) and with (n=141) 14.2 mg free nucleotides/100 g powder, which would yielda nucleotide concentration of about 2 mg/100 mL product as ready to feed. During the studyperiod of 3 months, the group fed formula with nucleotides experienced a significantly lowernumber of first episodes of diarrhoea (74 vs. 102). No difference in the spectrum ofenteropathogens found in stools and in growth parameters was found.
Martínez-Augustín et al. (1997 a and b) evaluated formula supplementation with about 11.6mg nucleotides/L relative to a control diet in preterm infants. Lactose/mannitol ratiosindicating intestinal permeability as well as serum concentrations of β-lactoglobulin were notdifferent. Serum IgG antibodies to β-lactoglobulin on day 30 were higher in the nucleotidesupplemented group, whereas antibodies to alpha-casein did not differ. The clinical relevanceof this difference is not known.
Cosgrove (1998) studied infants born small for gestational age fed a formula with about 33mg nucleotides/L (n=39) or a control formula without added nucleotides (n=35).Supplemented infants showed a greater gain in weight, length and head circumferencebetween birth and 2 months, as well as between birth and 6 months (e.g. weight gain 0-6months 80.1 vs. 71.8 g/week and kg weight at baseline, p=0.05).

63
Pickering et al. (1998) performed a multi-center trial with one year duration in term infants.The study was completed by 101 infants fed formula with 72 mg/L nucleotide, 107 infants feda control formula, and 124 infants fed human milk. There were no differences between theformula groups with respect to indicators of growth and tolerance. Infants fed nucleotidesupplemented formula had higher antibody titres to HiB and diphtheria at 7 months of age.Data on the incidence of diarrhoea were monitored only at 2 of the 13 study sites. Theevaluation of the data from these two sites indicated a lower number of infants that sufferedfrom at least one episode of diarrhoea (15 vs. 41%, p<0.05).
Lasekan et al. (1999) followed infants fed formula with 72 mg/L nucleotides (n=138) orunsupplemented control (n=147), of which about 80% completed the one year study. Therewere no group differences in growth, tolerance, adverse effects, the incidence of diarrhea,illness visits to physicians, antibiotic prescription, and antibody responses after vaccination toHiB and diphtheria, but anti polio virus type 1 titres were higher in the nucleotide group.Immune phenotype analysis showed an increased proportion of memory lymphocytes and areduced proportion of naive lymphocytes in the supplemented group. The clinical relevance ofthese differences is not known.
The available studies show some indication for a possible modulation of immune phenotypesand antibody responses to vaccination by the addition of free nucleotides to infant formulae inhealthy term babies. There are some indications for a potential protective effect againstdiarrhoea in compromised, and possibly also in healthy infants. An enhancing effect ongrowth has only been reported in infants born small for gestational age, in comparison to acontrol formula apparently not matched in nitrogen and phosphorus contents. No dose effectbetween nucleotide concentrations used and outcomes has been shown. There are noindications for relevant adverse effects of nucleotide addition in the concentrations tested.
The Infant Formulae Directive has approved the addition of nucleotides to infant formulaeand follow-on formulae in concentrations up to 1.5 mg/100 kcal 5’-AMP, 2.5 mg 5’-CMP/100kcal, 0.5 mg 5’-GMP/100 kcal, 1.75 mg 5’-UMP/100 kcal, 1.00 mg 5’-IMP/100 kcal, and atotal concentration of up to 5 mg/100 kcal, which is similar to reported data for freeribonucleotides in human milk (about 4-6 mg/100 kcal).
The Protein-Calorie Advisory Group of FAO/WHO has recommended an upper limit of 2g/day for the addition of nucleic acids to the diet of human adults (PAG Ad hoc WorkingGroup 1975). Based on 70 kg body weight, this amount would be equivalent to an intake ofabout 28.6 mg/kg. In infants consuming a formula intake providing 100 kcal per kg and daywith the current maximum level of 5 mg/100 kcal would thus be equivalent to a maximaldaily nucleotide intake of 5 mg/kg. If the maximum level would be increased to 16 mg/100kcal, the estimated daily nucleotide intake of an infant fed such formula would be 16 mg/kgand thus rather close to the recommended adequate level of intake set for adults. However,there are no data to indicate that this level of intake would have adverse effects in infants. Nostudies are available that evaluate a dose-response relationship between the concentrations ofnucleotides in infant formula and relevant outcomes in infants. Thus, there is no adequatescientific basis at present to conclude that the addition of nucleotides in higher concentrationsthan presently permitted for infant formula would provide additional benefits.
In the absence of evidence of benefit of increasing the levels of added nucleotides permitted atpresent in infant formulae, the Committee recommends that the content of nucleotides, ifadded to infant formulae and in follow-on formulae, should not exceed 5 mg/100 kcal. Ifadded the maximum nucleotide contents should be: cytidine 5’-monophosphate (CMP) 2.5

64
mg/100 kcal, uridine 5’-monophosphate (UMP) 1.75 mg/100 kcal, adenosine 5’-monophosphate (AMP) 1.50 mg/100 kcal, guanosine 5’-monophosphate (GMP) 0.50 mg/100kcal, inosine 5’-monophosphate (IMP) 1.00 mg/100 kcal. Formula based on soy proteinisolates should be excluded from the option of further addition of nucleotides because of theirhigh natural contents.
4.7.4 Choline
Choline is a quaternary amine which is ubiquitously distributed in tissues. It can be producedin the body and is widely available in the diet. The extent to which it is a required dietaryconstituent under normal circumstances is not clear, although when the needs are increased, orthe ability to form adequate choline impaired, then it is considered to be conditionallyindispensable. Choline status may in part be determined by the availability of thosecompounds with which it shows close metabolic interaction: serine, methionine, folate,vitamin B12 and betaine.
Choline serves as the precursor for the synthesis of phosphatidyl choline (PC), the mainphospholipid in brain, liver and other tissues. PC plays a role in normal membranecomposition and signalling processes, the transport of cholesterol and lipid in blood, andnormal brain development. Choline is oxidised to betaine, a major source of methyl groupsfor the conversion of homocysteine to methionine, and the subsequent formation of S-adenosyl methionine (SAM), and hence all methylation reactions (Zeisel, 1994). Choline is asubstrate for the synthesis of the neurotransmitter, acetylcholine (Wecker, 1990).
In the newborn the plasma concentration of free choline is significantly greater than in adultsfalling to adult levels by one year. Newborn levels of phospholipid bound choline in plasmaare substantially lower than for adults (Buchman et al., 2001). In adults given parenteralfeeding devoid of choline or in people fed choline deficient diets, there are decreased plasmaconcentrations of choline, evidence of liver dysfunction, including a propensity towards fattyinfiltration (Zeisel, 1981; Buchman et al., 1993; Zeisel 1994). These changes can be reversedwith supplemental choline (Buchman et al., 1992; Buchman et al., 1995). Patients onparenteral nutrition developed hepatic steatosis which was reversed following 1 to 4 g/day ofcholine chloride for 6 weeks (Buchman et al., 1995).
Choline is present in a number of different forms in milk, and the relative proportions of thesediffer amongst human- and cows’ milk and soya-derived formula. Mature human milkcontains 200 µmol/L (3.1 mg/100 kcal), but additional choline in PC and sphingomyelinmight increase the total potentially available to 12.6 mg/100 kcal (Zeisel, 1994; LSRO, 1998).The choline content of human milk doubles during the first week after birth. The cholinecontent of most formulae was comparable with that in colostrum, but below that of maturemilk (Holmes et al., 2000).
There is no requirement for choline identified within the Infant Formulae Directive.Requirements for infant formulae in the USA indicate a minimum of 7 mg/100 kcal for non-milk-based formulae (FDA, 1985). Codex Alimentarius (1994) has specified a minimum levelof 7 mg/100 kcal for infant formulae in general. The Department of National Health andWelfare Canada (1995) established that choline content of formula be no less than 12 mg/100kcal. The Food and Nutrition Board (FNB, 2000b) has set an Adequate Intake for choline forinfants from 0 to 6 months of age as 125 mg/day (about 18 mg/kg/day). Doses of choline inthe region of 8 to 20 g/day in adults have been associated with abnormal odour, hypotension,hepatic toxicity and gastrointestinal upsets (LSRO, 1998).
65
LSRO Expert Panel (1998) has recommended a minimum content of choline in infant formulaof 7 mg/100 kcal, based upon limited information of lower content in human milk. Amaximum content of choline in infant formula has been set at 30 mg/100 kcal, based uponextrapolation from adult data on the safe level of intake and allowing for potential agedifferences in metabolism.
The Committee proposes a minimum content of choline in infant formula of 7 mg/100 kcaland a maximum content of choline in infant formula of 30 mg/100 kcal.
4.7.5 Other nitrogen-containing compounds
In the absence of adequate scientific data no recommendations can be made on sialic acid,which is lower in infant formula than in human milk (Wang et al., 2001), on amino-sugars,urea, orotic acid, creatine, creatinine, polyamines at present.
5. SUMMARY OF ALL CONCLUSIONS AND RECOMMENDATIONS
On the basis of additional information which has become available since the last report of theSCF in 1995 on protein in infant formula and follow-on formula, the Committee proposes thefollowing changes:
I. INFANT FORMULAE AND FOLLOW-ON FORMULAE
1. Calculation of protein content
The Committee proposes to determine the crude protein content of all types of infant formulaand follow-on formula (total nitrogen x 6.25). In addition, the NPN content must not behigher than 15% of the total nitrogen content in formula based on intact proteins.
2. Sources of protein
In view of some remaining uncertainties on the short- and the long-term effects of a highisoflavone intake in infancy and on the potential to influence allergic and autoimmunediseases, the Committee is of the opinion that soy-based formula should be reserved forspecific situations only and that cows’ milk-based formula should be the standard choice.
The Committee concludes that at present there is no documented benefit of milk proteins fromanimals other than cows, or of plant proteins, over cows’ milk protein in the manufacture ofinfant formula. If other protein sources are to be used, their suitability and safety must beassessed before commercialisation. Data required are amino acid contents and availability,allergenicity, digestibility and technical processing, and constituents other than protein andnitrogenous compounds. Controlled clinical studies are needed to assess the nutritional safetyand nutritional value.
3. Protein quality
The Committee proposes to require for all types of infant formula and follow-on formula thatper energy value the amount of indispensable and conditionally indispensable amino acids

66
should at least correspond to the values in human milk as shown in Table 13. The Committeeproposes to replace the amino acid values of Tables 13 and 12 for the values used in Annex Vand VI, respectively, of the Infant Formulae Directive. Arginine should not be included inthese tables. The Committee is of the opinion that the sum of methionine and cystine contentsmay be used as the basis for calculation if the methionine:cystine ratios does not exceed 2,and the sum of phenylalanine and tyrosine may be used if the tyrosine:phenylalanine ratiodoes not exceed 2.
The Committee proposes that the obligatory request for determining of Protein Efficient Ratio(PER) and Net Protein Utilisation (NPU) of protein hydrolysates in the Directive is notnecessary, and that it should be replaced by a requirement for clinical testing of any proteinsthat have not been evaluated before in the manufacturing of formula. The Committee howeveremphasizes the importance of pre-clinical testing of new protein sources, hydrolysates andapplied new technologies, which may include the evaluation of PER and NPU.
With respect to protein hydrolysates used in infant formulae and follow-on formulae, theCommittee proposes that the source of protein or proteins on which hydrolysates are basedshould be declared. The Committee proposes to all formulae which contain new proteinsources or protein hydrolysates which have no established use in infant formulae and/or towhich processing technologies have been applied that can affect the bioavailability ofnitrogen compounds should be clinically tested before their commercialisation. TheCommittee concludes that claims on a reduction of allergic disease risk by proteinhydrolysates cannot be deduced from technical data alone but need substantiation in clinicaltrials.
4. Other requirements
The Committee supports the optional addition of taurine up to 12 mg/100 kcal to all types offormula without setting a minimum value.
The optional addition of nucleotides to infant formulae and follow-on formulae based oncows’ milk protein or cows’ milk protein hydrolysates should be maintained, while formulaebased on soy protein isolates should be excluded from the option of further addition ofnucleotides. If added, the maximum content of nucleotides should not exceed 5 mg/100 kcal,and that of individual nucleotides should not exceed: cytidine 5’-monophosphate (CMP) 2.5mg/100 kcal, uridine 5’-monophosphate (UMP) 1.75 mg/100 kcal, adenosine 5’-monophosphate (AMP) 1.50 mg/100 kcal, guanosine 5’-monophosphate (GMP) 0.50 mg/100kcal, inosine 5’-monophosphate (IMP) 1.00 mg/100 kcal.
II. INFANT FORMULAE
1. Calculation of protein content
The percentage of non-protein nitrogen (NPN) from total nitrogen in infant formulae based onintact proteins should not be higher than 15. The Committee proposes to determine the crudeprotein content of all types of infant formula and follow-on formula (total nitrogen x 6.25). Inaddition, the NPN content must not be higher than 15% of the total nitrogen content informula based on intact proteins.

67
2. Protein content
The Committee proposes no change in the minimum crude protein content of 1.8 g/100 kcalfor infant formula based on intact cows’ milk protein. However, the Committee recommendsthat infant formula with this minimum protein content should be subjected to adequateclinical testing of its nutritional adequacy.
The Committee proposes no change in the minimum crude protein content of 2.25 g/100 kcalfor infant formula based on soy protein isolates and hydrolysed protein, and no change in themaximum crude protein content (3.0 g/100 kcal) of infant formula based on all types ofprotein sources is proposed.
3. Protein quality
Infant formulae based on intact cows’ milk protein, on soy protein isolate and on proteinhydrolysates should provide per energy value the same amounts of each indispensable andconditionally indispensable amino acid as the reference human milk (Table 13). The sums ofmethionine and cystine contents and of phenylalanine and tyrosine contents may be usedunder the conditions described above.
4. Other requirements
The obligatory requirement for a minimum carnitine content of 1.2 mg/100 kcal in infantformulae based on soy protein isolates and protein hydrolysates should be maintained.
The Committee proposes to require a minimum choline content of 7 mg/100 kcal for all typesof infant formula. The maximum choline content should not exceed 30 mg/100 kcal.
III. FOLLOW-ON FORMULAE
The Committee proposes to determine the crude protein content of all types of infant formulaand follow-on formula (total nitrogen x 6.25). In addition, the NPN content must not behigher than 15% of the total nitrogen content in formula based on intact proteins.
1. Protein content
The Committee proposes for follow-on formulae the same minimum and maximum crudeprotein contents as for infant formula.
2. Protein quality
The Committee proposes no changes to the existing requirements for amino acid scoring(chemical index of at least 80% of the reference protein human milk as modified in table 13).

68
6. RECOMMENDATIONS FOR FUTURE WORK
The Committee underlines the necessity to generate reliable analytical data on the amino acidpattern of human milk protein.
The Committee acknowledges gaps in the knowledge of protein requirements of infants in thesecond half of the first year of life and recommends appropriate studies to fill these gaps.

69
IV. FAT CONTENT
1. INTRODUCTION
Dietary lipids are indispensable for normal growth and development. The dietary fat (i.e.predominantly triglyceride or triacylglycerol) is the predominant source of fuel energy forbreast-fed and formula-fed infants. Oxidation of 1 g fat yields about 38 kJ (9 kcal) of energy,or twice as much as protein and carbohydrate. Besides energy, dietary lipids provideindispensable fatty acids and fat-soluble vitamins to the organism and are also necessary forefficient absorption of the fat-soluble vitamins, carotenoids and cholesterol. Furthermore, fatsare carriers of flavours in the diet and contribute to its satiety value (Carey and Hernell,1992).
Lipids in the form of triglycerides are stored in the adipose tissue as an energy reserve, whileother lipids, i.e. phospholipids and cholesterol, are integral structural components ofbiological membranes, and thereby modulate important physiological functions such asfluidity, permeability, activity of membrane bound enzymes and receptors and electricalresponse to excitation (ESPGHAN, 1991). Fatty acids also play a direct role in generegulation (Clarke and Jump, 1996).
Most of the naturally existing fats are mixtures of triglycerides. A triglyceride is composed ofone molecule of glycerol to which three fatty acid molecules are esterified. The fatty acids(FA) account for more than 90% of the molecular weight. The effects of FA depend on thelength of the carbon chain, degree of saturation, the number, structure and position of thedouble bonds, and to some extent also on their position in the triglyceride molecule (Small,1991; Hunter, 2001). The unsaturated FA are characterised by the number of double bonds.Monounsaturated fatty acids (MUFA) have only one double bond, typically located betweencarbons 9 and 10 (calculated from the methyl end) of the acyl chain, e.g. oleic acid (C18:1 n-9) has 18 carbons and one double bond in that position. Polyunsaturated FA (PUFA) have 2 to6 double bonds. The human organism is capable of synthesising saturated FA (SAFA) andMUFA from acetate, which is in contrast to the n-6 (-6) and n-3 (-3) PUFA, which must beprovided by the diet. Linoleic acid (LA, 18:2 n-6) and α-linolenic acid (ALA, 18:3 n-3),which are the major dietary constituents of the n-6 and n-3 PUFA, respectively compete forthe same enzyme systems (desaturases and elongases) as they are metabolised further in theorganism to long-chain polyunsaturated fatty acids (LCPUFA) with a chain length of 20 ormore carbons (Sprecher et al., 1995).
Naturally occurring unsaturated fatty acids in plants and free-living fish are mainly cis-fattyacids. They can however be transformed into trans-isomers chemically by partialhydrogenation of vegetable and fish oils, or through the action of bacteria in the fore-stomachof ruminants. Small amounts of trans fatty acids, mainly 11-trans vaccenic acid, are found inthe milk and meat of cow, sheep and goat. Industrially hydrogenated oils contain varyingamounts of various trans isomers of fatty acids. The main sources of dietary trans fatty acidsare deep-fried and industrially produced fatty foods and dairy products (ESPGHAN, 1994;FNB, 2002b).
A particular group of trans fatty acids are conjugated linoleic acids (CLA) that are formed bybacteria in the rumen and by desaturation of trans MUFA in the organism. The cis-9, trans -11 CLA, which is the predominant isomer in milk fat, has anti-carcinogenic properties in

70
experimental animal studies (Ip et al., 1999) and the less abundant trans-10, cis-12 isomer hasbeen found to reduce abdominal fat mass in adult humans (Risérus et al., 2001), although italso seems to increase insulin resistance (Risérus et al., 2002).
In addition to triglycerides, phospholipids and cholesterol are also part of a normal mixed dietand of human milk (Jensen, 1999). The most common dietary phospholipid is lecithin, whichis often used as emulsifier of dietary lipids but also as a source of LCPUFA in infantformulae. Cholesterol is found in foods of animal origin including milk fat. Phospholipids andcholesterol are also synthesised in the human organism and the capacity for synthesis seemsto be well developed at birth (Wong et al., 1993; Bayley et al., 1998). Plants contain smallamounts of plant sterols, mainly sitosterol and campesterol, which are poorly absorbed (5-15%) from the intestine, but interfere with the absorption of cholesterol. The absorption of thecorresponding saturated sterols sitostanol and campestanol is only 1-3% (Gylling andMiettinen, 1999; Igel et al., 2002).
In the gastrointestinal tract the dietary lipids are hydrolysed by lipases to less water-insolubleconstituents (i.e. mainly monoglycerides, free fatty acids, lysophospholipids, unesterifiedcholesterol and fat soluble vitamins), which together with bile salts form mixed micelles orunilamellar vesicles from which the products of fat digestion are absorbed into the enterocytesof the small intestinal mucosa (Staggers et al., 1990; Hernell and Bläckberg, 1997). Afterreassembly to triglycerides, phospholipids and cholesterol- and fat-soluble vitamin esters inthe enterocytes, the absorbed lipids form lipoprotein particles, allowing their transportin theblood for distribution to the various tissues. Medium-chain saturated fatty acids (C8:0 andC10:0), and to a lesser extent lauric acid (C12:0) are less dependent on a mixed micellar phasefor absorption and may be transported as unesterified fatty acids bound to albumin directly tothe liver via the portal vein (Carey and Hernell, 1992). The core of the lipoproteins is formedby triglycerides and esterified cholesterol while the surface coat is composed of freecholesterol, phospholipids, and proteins. The lipoproteins are commonly divided into fourclasses according to density: triglyceride-rich chylomicrons and VLDL (very low-densitylipoprotein), originating in the intestine and liver, respectively and LDL (low-densitylipoprotein) and HDL (high-density lipoprotein). LDL contains two-thirds of circulatingcholesterol and is an important risk factor of arteriosclerosis. A high HDL-cholesterolconcentration and a high HDL/LDL cholesterol ratio reduce the risk of arteriosclerosis(ESPGHAN, 1994).
2. TOTAL FAT
The maximum and minimum fat intakes that are physiologically tolerable by healthy, terminfants are not well defined. It seems that the maximum tolerable intake is limited by theminimum requirements of protein, carbohydrate and micronutrients. In fact, it is not clear ifthere is a minimal metabolic requirement of dietary fat in early life besides that required tocover the needs for indispensable fatty acids and fat-soluble vitamins, including the provisionof a vehicle for their absorption from the diet (Koletzko, 1999). A practical lower limit is setby the provision of an adequate energy density of infant formulae, simultaneously keeping theosmotic and metabolic burdens of the infant low (ESPGHAN, 1991). Breast-fed infantsreceive about half of their total energy from the energy-rich triglycerides, which constituteabout 98% of the lipids in human milk. With the high fat content of human milk as the model,the Infant Formulae Directive recommends that the total fat content in infant formulae shouldnot provide less than 40% and not more than 55% of the total energy in infant formulae, or1.05-1.5 g/100 kJ (4.4-6.5 g/100 kcal). These figures are the same as the ESPGHAN

71
recommendation from 1991 and almost identical to the LSRO report from 1998. There are nonew data to support a change of this recommendation.
The Infant Formulae Directive specifies for follow-on formulae a fat content of 30-59% of theenergy or 0.8-1.5 g/100 kJ (3.3-6.5 g/100 kcal). In view of the fact that complementaryfeeding may be low in fat it seems prudent to increase the lower level to 35% of the energy or0.9 g/100 kJ (4.0 g/100 kcal). On the other hand there is no reason to allow a highermaximum level than for infant formulae and 55% of total energy or 1.4 g/100 kJ (6.0 g/100kcal) is therefore recommended. These levels are the same as the ESPGHAN recommendationof 1991.
Sesame oil and cottonseed oil have not been used in infant formulae and follow-on formulae.Sesame oil contains sesamolin and sesamin, which both have been identified as causingagents in contact dermatitis (Hayakawa et al., 1987). Cottonseed may contain cyclopentenicfatty acids, which may have negative effects on fatty acid metabolism, e.g. desaturation offatty acids (Phelps et al., 1965). It seems prudent that these oils remain excluded from use ininfant formulae and follow-on formulae.
2.1 Structured triglycerides
Besides overall fatty acid composition, the stereospecific distribution of fatty acids in aparticular fat should be considered when effects of fatty acids are evaluated. Fatty acids canoccupy any of the three positions on the glycerol backbone, designed as sn-1, sn-2 and sn-3,where “sn” denotes “stereospecific numbering”. Different types of animal or vegetable fatsoften have saturated or unsaturated fatty acids in certain sn positions. For example bovinemilk fat and pork fat (lard) contain mainly a saturated fatty acid in the sn-2 position, whereastallow contains saturated fatty acids mainly in the sn-1 and sn-3 positions. Soybean oil andcocoa butter contain unsaturated fatty acids primarily in the sn-2 position and saturated fattyacids primarily in the sn-1 and sn-3 positions. The stereospecific position of fatty acids ontriglycerides does affect the functionality of fats in food products.
It is technically possible by use of lipases or chemicals to synthesize triglycerides with agiven fatty acid in a given sn-position of the triglyceride molecule, i.e. structuredtriglycerides. With a similar fatty acid composition the coefficient of fat absorption is higherfrom human milk than from infant formulae. Likely explanations for this are the uniquestructure of human milk triglycerides (Tomarelli et al., 1968; Filer et al., 1969) and thepresence of the bile salt-stimulated lipase in human milk (Hernell and Bläckberg, 1997;Bernback et al., 1990), but its absence from cows’ milk used as the protein source in milk-based formulae. In human milk triglycerides 70% of the saturated fatty acid palmitic acid(16:0), which accounts for about 20-25% of total fatty acids in the milk, is esterified in the sn-2 position (Jensen, 1999). This position is relatively resistant to hydrolysis by colipase-dependent pancreatic lipase (Mattson and Volpenhein, 1964). Hence a major fraction of thepalmitic acid in the milk triglycerides will not be released as free fatty acid but absorbed assn-2 monoglyceride. Because free palmitic acid is prone to form insoluble calcium soaps(Tomarelli et al., 1968), which are not readily absorbed but lost in the stool (Quinlan et al.,1995) a large proportion of palmitic acid in the sn-2 position would, according to theory,improve fat absorption. There is some evidence to support this both in experimental animals(Tomarelli et al., 1968; Mattson and Volpenhein, 1964) and in preterm (Carnielli et al., 1995)as well as term infants (Lucas et al., 1997; Carnielli et al., 1996a). Absorption of bothpalmitic acid and calcium were more efficient from a formula with a structured, synthetictriglyceride yielding 66-76% of the palmitic acid in the sn-2 position as compared to a

72
formula based on vegetable oils with about 13% of the palmitic acid in that position (Carnielliet al., 1996a). However, the effect on overall fat absorption was less (Lucas et al., 1997;Carnielli et al., 1996a). During reassembly of the sn-2 monoglycerides, which occurs mainlyvia the sn-2 monoacylglycerol pathway, a major fraction of the palmitic is retained in the sn-2position of the newly formed triglyceride (Innis et al., 1995). Hence, there are some data tosupport a beneficial physiological effect of one specific structured triglyceride on fat andcalcium absorption. However, effects on other metabolic functions need to be further studied.There is virtually no information on physiological effects in infants of other structuredtriglycerides or their long-term safety (Hunter, 2001).
2.2 Medium-chain triglycerides (MCT)
Medium-chain triglyceride (MCT) oil is usually prepared from coconut oil and contains amixture of fatty acids with varying chain length, usually C6:0 (1-2%), C8:0 (65-75%), C10:0(25-35%) and C12:0 (1-2%) (Bach and Babayan, 1982). Compared to long-chain triglycerides(LCT), MCT are more rapidly hydrolysed by the gastrointestinal lipases and the hydrolysisproducts are less dependent on a mixed micellar phase for their absorption. Hence, underconditions where fat absorption is a limiting factor MCT fat improves fat absorption.However, there is no clear evidence of an improved energy balance of dietary MCT ascompared to LCT typical of human milk, in preterm and healthy term infants (Brooke, 1980;Whyte et al., 1986). MCT has provided as much as 50% of total fat in some formulaeintended for preterm infants, which is considerably higher concentration than the 8-10%medium-chain fatty acids present in average human milk, of which less than 2% of total fattyacids is C8:0 and C10:0 (Jensen, 1989). Although, MCT may have a positive effect in preterminfants on the calcium balance and may reduce the occurrence of hypoglycaemia (Chapell etal., 1986; Sulkers et al., 1990; Sann et al., 1988) higher intakes may have adverse effects(Whyte et al., 1986). The predominant metabolic pathway for MCT is oxidation and there is alinear association between the intake of MCT and ketone bodies in serum and excretion ofdicarboxylic acids (Wu et al., 1993). Furthermore, the energy density of MCT is lower thanfor LCT. There is no evidence of a benefit of the addition of MCT oils to infant formulaeintended for healthy, term infants or to follow-on formulae.
2.3 Phospholipids
Phospholipids constitute less than 1% of the dietary lipids in a normal diversified diet. Inhuman milk the milk fat globule membrane stabilising the milk fat globule is rich insphingomyelin, which is the major phospholipid accounting for almost 40% of totalphospholipids, while phosphatidyl choline (PC), ethanolamine (PE), serine (PS), and inositol(PI) account for 28, 20, 9 and 6%, respectively. After the first few days the concentration ofphospholipid, on average 0.5% (0.2%-1%) of total lipids, or 0.15-0.20 g/L) as well as theclass distribution is remarkably constant irrespective of length of gestation and duration oflactation (Jensen, 1989; Bitman et al., 1984).
Phospholipids may be used as a food additive, mainly because of its emulsifying properties.More recently, phospholipids, e.g. PC, which typically has a polyunsaturated fatty acid in thesn-2 position, has been used as a source of LCPUFA added to infant formulae. However,although the relative concentration of LCPUFA may be high in the phospholipid fraction ofhuman milk, the major part of these fatty acids are supplied by the milk triglycerides. Bearingin mind that besides being important to membrane structure and function metabolites ofsphingomyelin and glycerophospholipids, e.g. PC, have key functions in signal transductionaffecting important cell functions (Cockcroft, 2001), it is proposed that formulae should not

73
contain phospholipids at substantially higher levels than present in human milk until thesafety of such formulae for infants and young children have been properly documented.Directive 95/2/EC on food additives permits the addition of phospholipids to a maximumlevel of 1 g/L. Based on current knowledge the Committee proposes that the maximum levelof phospholipid in infant formulae and follow-on formulae remains as 1 g/L, whether theaddition is for technological or nutritional purposes, e.g. to be a source of LCPUFA.
2.4 Inositol
The most common form of inositol in mammalian tissues and cells is myoinositol, a sixcarbon cyclic sugar related alcohol. It is found in the free form as phosphorylated lipidderivatives, phosphoinositides, and in membranes as glycosyl-phosphatidyl inositol where itplays an important structural and functional role in signal transduction and metabolicregulation (Aukema and Holub, 1994; LSRO, 1998). Physiologically, inositol is an essentialgrowth factor, which is readily synthesised in the body, but may need to be provided in thediet under certain conditions. The form in which inositol occurs most commonly in plants isas phytate, and when phytate is taken in the diet it may limit the bioavailability of mineralswith which it forms complexes, such as iron, copper and zinc.
Inositol is present in high concentration in human milk, and decreases over the course oflactation. The reported concentrations range from 22 to 48 mg/100 kcal (Bromberger andHallman, 1986; Ogasa et al., 1975; Pereira et al., 1990). Inositol levels in blood are high inneonates, leading to the suggestion that it plays an important role in early development. Overa three week period the serum concentration of myoinositol increased in infants receivinghuman milk, but not in those receiving formulae (Pereira et al., 1990). A possible role hasbeen suggested for the formation of surfactant and lung development (Anceschi et al., 1988;Hallman et al., 1992), the prevention of the development of retinopathy of prematurity(Friedman et al., 2000), and necrotising enterocolitis (Carlson et al., 1998). There are nostudies on the effect of inositol on growth and development, nor on its safety.
In the USA, inositol needs to be added to non-milk-based formula at 4 mg/100 kcal (FDA,1985).
The LSRO Expert Panel (1998) recommended that the minimum content of myoinositolshould be 4 mg/100 kcal, and the upper level should be 40 mg/100 kcal, which is around theupper level reported for human milk.
The Committee proposes a minimum content of myoinositol of 4 mg/100 kcal and amaximum content of myoinositol of 40 mg/100 kcal for infant formulae, while no limits aresuggested for follow-on formulae.
3. FATTY ACIDS
3.1 Saturated fatty acids
The Infant Formulae Directive set an upper limit of 15% each of total fatty acids for lauricacid (C12:0) and myristic acid (C14:0) because of their marked hypercholesterolaemic andatherogenic effects, which is more pronounced than for other saturated fatty acids. Although,there is no proof that the total fat intake and fat composition in infancy confers increased riskfor coronary heart disease later in life, there are no studies that have properly evaluated the

74
possible hypercholesterolaemic effect of lauric and myristic acids in infant formulae andfollow-on formulae, or the long term effects of unnecessarily high consumption of these fattyacids during infancy. It therefore seems appropriate to apply a cautious approach untilconvincing evidence on the long-term safety of higher levels are presented. It should be notedhowever that the harmful effect of saturated fatty acids on serum cholesterol has recently beenquestioned (Samuelson et al., 2001).
Until this issue has been clarified it is proposed that the sum of myristic acid and lauric aciddo not exceed 20%. The same maximum level is set for infant formulae and follow-onformulae. Although, the concentration of these fatty acids in the milk varies between mothersand is influenced by maternal diet the now proposed maximum level is still above that foundin milk of most European mothers (Koletzko et al., 1992).
3.2 Trans fatty acids
Trans fatty acids are unsaturated fatty acids that contain at least one double bond in the transconfiguration. The trans configuration results in a greater bond angle than that of the cisconfiguration, which makes the carbon chain of a trans fatty acid more extended than that ofthe corresponding cis fatty acid, and with properties more comparable to a saturated fattyacid. Hence, in adults there is a positive linear trend between trans fatty acids intake and totaland LDL cholesterol, and therefore increased risk of coronary heart disease (FNB, 2002b).The trans isomers of oleic acid (18:1n-9) and linoleic acid (18:2n-6), that are formed duringpartial hydrogenation of unsaturated vegetable oils have been suggested to have potentialadverse effects on foetal and infant growth and development, possibly through inhibition ofdesaturation of the parent n-6 and n-3 fatty acids, linoleic acid (18:2n-6) and �-linolenic acid(18:3n-3), respectively to their respective LCPUFA metabolites (Koletzko, 1992; Sugano andIkeda, 1996; Decsi et al., 2001; Elias and Innis, 2001). In preterm infants inverse correlationsbetween the exposure to trans fatty acids and body weight as well as indispensable fatty acidsconversion were observed (Koletzko, 1992). In contrast, studies in term infants found norelation between trans fatty acids and length of gestation, birth weight or birth length (Eliasand Innis, 2001). An inverse association between plasma phospholipid trans fatty acids andarachidonic acid was reported in children aged 1 to 15 years (Decsi and Koletzko, 1995). Forthese reasons the trans fatty acid content of formulae should be as low as practically feasible.This led in the Infant Formulae Directive to a maximum level of 4% of total fatty acids.
Considering that the concentration of trans fatty acids in bovine milk varies, that formulaewith as much as 40% of the fat as milk fat are not unusual, and also taking the view that theuse of hydrogenated oils in infant and follow-on formulae should be discouraged thecommittee sees a lower maximum level of trans fatty acids justified. The maximum level isnow proposed to be 3% of total fatty acids. The maximum level should be the same in infantformulae and follow-on formulae.
3.2.1 Conjugated linoleic acid (CLA)
CLA is a collective term for a group of geometric and positional isomers of linoleic acid inwhich the trans/cis double bonds are conjugated, i.e. they are located without an interveningcarbon not part of a double bond. Out of several identified isomers in food only two, cis-9,trans-11 (rumenic acid) and trans-10, cis-12, possess biological activity (Pariza et al., 2001).The former has anticarcinogenic effects in animals while the latter seem to reduce fatdeposition both in animals and humans (Risérus et al., 2001), although it also seems toincrease resistance to insulin in human adults (Risérus et al., 2002), reduces milk fat content

75
(Masters et al., 2002) and suppress the desaturation of linoleic and α-linolenic acids incultured cells (Eder et al., 2002). CLA is a natural constituent of dairy products and ruminantmeats as a consequence of biohydrogenation in the rumen. While the cis-9, trans-11 isomermay be synthesized also from vaccenic acid (trans-11, octadecenoic acid) by mammalian cellsby delta-9 desaturase endogenous production of trans-10, cis-12 does not occur becausemammalian cells do not possess the delta-10 desaturase enzyme (Pariza et al., 2001; Adlof etal., 2000). These two isomers are present in both bovine and human milk at similarconcentrations (about 0.5% of the fatty acids), with the cis-9, trans-11 isomer accounting forthe major part (Pariza et al., 2001; Jensen and Lammi-Keefe, 2001). It was recently shownthat the concentration in the milk increases if the mother consumes supplements with CLA,while the fat content of the milk decreases (Pariza et al., 2001). There are virtually no studieson the effects of CLA in infants (Elias and Innis, 2001).
Until more is known of the effect of CLA on the growing infant, there should be no voluntaryaddition of CLA to infant formulae and follow-on formulae, except for the natural contentscontributed by the natural fat ingredients of the formulae.
3.3 Polyunsaturated fatty acids (PUFA)
3.3.1 Linoleic acid (LA) and α-linolenic acid (ALA)
Indispensable fatty acids are comprised of two separate families of fatty acids, the n-6 and then-3 family, respectively. Mammals, including man, do not possess enzyme systems to insert adouble bond at either the n-3 or n-6 positions of a fatty acid and therefore depend on dietarysupply. Linoleic acid (LA, 18:2 n-6) and α-linolenic acid (ALA, 18:3n-3) are the trueindispensable fatty acids from which the respective metabolites of the n-6 and n-3 series offatty acids are synthesized by shared endogenous enzyme systems. The most importantmetabolites of LA are dihomo-�-linolenic acid (DHGLA, 20:3n-6) and arachidonic acid (AA,20:4 n-6) and of ALA are eicosapentaenoic acid (EPA, 20:5 n-3) and docosahexaenoic acid(DHA, 22:6 n-3). DHGLA, AA and EPA are precursors of the biologically active eicosanoids.AA and the eicosanoids are important factors in second-messenger systems and areindispensable for normal cell function. AA and DHA are major components of specificmembrane phospholipids (Lauritzen et al., 2001).
For LA (as glycerides) the Infant Formulae Directive allows a range in infant formulae from70 mg/100 kJ (300 mg/100 kcal) to 285 mg/100 kJ (1200 mg/100 kcal), or 7-20% of totalfatty acids, which is in the same order as found in average human milk, although theconcentration varies considerably with the mother’s diet. The minimum level is well abovewhat is required to prevent deficiency (around 1% of energy) and the maximum level tookinto account that too high intakes of LA may have adverse effects on several functions, e.g.lipoprotein metabolism, immune functions, eicosanoid balance, and lipid peroxidation(ESPGHAN, 1991; LSRO, 1998; Lauritzen et al., 2001).
The minimum level of LA is the same as the Codex standard of 1981, but lower than theESPGHAN recommendation of 1991 [(120 mg/100 kJ (500 mg/100 kcal)], the LSRO reportof 1998 (350 mg/100 kcal) and the British Nutrition Foundation (BNF) recommendation of1992 (4% of energy, or 280-1130 mg/kg/day). While the Codex standard gives no maximumlevel for LA, the Infant Formulae Directive is in accord with the ESPGHAN recommendation[290 mg/100 kJ (1200 mg/100 kcal)], but lower than the LRSO recommendation (2240mg/100 kcal).
76
Because it seems prudent to achieve a balance between saturated, monounsaturated andpolyunsaturated fatty acids in infant formulae and follow-on formulae similar to what isconsidered healthy in children and adults it is now proposed that the minimum level of LA isincreased to 120 mg/100 kJ (500 mg/100 kcal) while keeping the maximum level unchanged.Thus LA will account for 4.5 to 10.8% of the total energy in infant formulae and follow-onformulae.
For ALA a minimum level of 12 mg/100 kJ (50 mg/100 kcal) is allowed, but the InfantFormulae Directive does not state a maximum level. Rather the maximum level is regulatedby the balance between n-6 and n-3 PUFA. The Directive allows a ratio range of linoleic acidto α-linolenic acid of 5 to 15. ALA typically contributes 0.5-1% of total fatty acids in humanmilk (Jensen, 1999).
The minimum level of ALA is now proposed to be set at 12 (24) mg/100 kJ or 50 (100)mg/100 kcal corresponding to 1 (2)% of total fatty acids. The concentration of ALA is furtherregulated by a proposed ratio between LA to ALA of 5-15 (20) to ascertain a proper balancebetween the precursors of the respective n-6 and n-3 fatty acid series, which is justified bytheir use of common enzymes for their metabolism to LCPUFA of the respective n-6 and n-3series (Lauritzen et al., 2001). The higher minimum level should be used in infant formulae towhich no LCPUFA has been added (see below), while the lower level is appropriate informulae containing at least 0.2% of the fatty acid as DHA. In such formulae the moregenerous ratio of 5-20 between linoleic and �-linolenic acid should suffice, while it isproposed that a ratio of 5-15 be applied for formulae containing less than 0.2% of the fattyacids as DHA.
While the Infant Formulae Directive set the same minimum level of LA for follow-onformulae as for infant formulae, no maximum level was set, and no limitation of the ratiobetween LA and ALA was set. It is now proposed that the minimum and maximum levelsshould be the same in follow-on formulae and infant formulae, i.e. 120 mg/100 kJ and (0.5g/100 kcal) and 285 mg/100 kJ (1.2 g/100 kcal), respectively. It is further proposed that thesame minimum and maximum levels of ALA as in infant formulae apply also for follow-onformula, i.e. 12 mg/100 kJ (50 mg/100 kcal) and 24 mg/100 kJ (100 mg/100 kcal),respectively. The ratio of LA to ALA should be 5-15 (or up to 20 if the formula contains atleast 0.2% of fatty acids as DHA) applying the same principles as for infant formulae.
3.3.2 Arachidonic acid (AA) and docosahexaenoic acid (DHA)
Although the capacity to synthesize LCPUFA from LA and ALA, respectively may be higherin preterm infants than in term infants there is considerable interindividual variation in bothpreterm and term infants (Carnielli et al., 1996b; Uauy et al., 2000) and evidence to suggestthat the capacity is still insufficient to meet the needs of all preterm infants (ESPGHAN,1991; LSRO, 1998). The concentration of DHA is higher in plasma, erythrocyte membranesand even in the brain in infants that are fed human milk or infant formulae with added DHAas compared to infants fed formulae containing only the precursors LA and ALA but noLCPUFA (Martínez, 1992; Jørgensen et al., 1996; Farquharson et al., 1992; Makrides et al.,1994; Jamieson et al., 1994). This difference is considered a major reason for differences inneurodevelopmental and visual function (Lauritzen et al., 2001; Jensen and Heird, 2002;Clandinin et al., 1980b). Indeed, AA and DHA are the major n-6 and n-3 fatty acids of neuraltissues (Martínez, 1992; Clandinin et al., 1980 a and b) and DHA is a dominating fatty acid inphospholipids of the photoreceptor cells of the retina (Martínez, 1992; Rodríguez de Turco etal., 1999). The evidence of causality is greater for preterm infants than for term infants

77
(Willatts and Forsyth, 2000), although the lack of consensus for term infants may beexplained by the power of the studies (SanGiovanni et al., 2000a and b), the concentration ofALA in the control formula (LSRO, 1998; Lauritzen et al., 2001; Arbuckle et al., 1994;Suerwald et al., 1996), the level of DHA in human milk (Jørgensen et al., 2001), or theformula under study (Lauritzen et al., 2001) and the limitation of the tests used to assessfunctional outcome at these ages (Willatts and Forsyth, 2000; Carlson and Neuringer, 1999).Indeed, the supply of LA and ALA in the diet modulates the synthesis of AA and DHA.However, it seems as if the contribution of endogenous synthesis of DHA from ALA to tissuepools of infants does not match that of diets containing DHA (Farquharson et al., 1992;Clandinin et al., 1989). Similarly, neither dietary LA, nor its metabolite ALA, contributes toplasma AA to the extent that AA itself does (Gibson et al., 2000; Jørgensen et al., 1998).
From the current literature one can conclude that DHA has a potential benefit on visual acuitybut there is yet no consensus that DHA or AA, or both, are indispensable nutrients for terminfants, nor that an exogenous supply is truly beneficial, at least not after the first few monthsof life (LSRO, 1998; Lauritzen et al., 2001; Jensen and Heird, 2002; Lucas et al., 1999).However, there is no evidence to suggest that concentrations within the range found in humanmilk are harmful. A recent expert panel reviewed the literature and recommended that infantformulae for term infants should contain at least 0.2% of the fatty acids as DHA and 0.35% ofthe fatty acids as AA and concluded that these levels are at the lower end of the range ofhuman milk DHA content world wide (Koletzko et al., 2001). In contrast, the recent LSROreport gave no recommendation on addition of LCPUFA to formulae for term infants, norwere minimum or maximum levels set (LSRO, 1998). The FNB report of 1992 recommendeda lowest daily intake of 20 mg/kg/day for each of AA and DHA and the FAO/WHO 40mg/kg/day for AA and 20 mg/kg/day for DHA (FAO/WHO, 1994). Clearly, there is a need oflarger, properly designed and controlled studies with longer follow-up with respect tofunctional outcomes in relation to intake levels of LCPUFA in term infants.
According to the Infant Formulae Directive, infant formulae for term infants do not need tocontain fatty acids of longer chain length than 18 carbons. However, if such fatty acids areadded to the formulae this is regulated by maximum levels because too high concentrationsare not beneficial and may have harmful effects. The maximum level was set at 2% of totalfatty acids for the n-6 and at 1% for the n-3 long-chain polyunsaturated fatty acids. Thesemaximum levels were set using the concentration in breast milk of European women asreference (Koletzko et al., 1992), and were the same as recommended by ESPGHAN in 1991for preterm infants. Furthermore, if added there should be a proper balance between n-6 andn-3 PUFA and the concentration of EPA should not exceed that of DHA.
Having reviewed the available literature the Committee sees the evidence insufficient to set aminimum level of LCPUFA. The Committee considers that a statement relating to thepresence of DHA in a formula should only be made if the content of DHA is not less than0.2% of the total fatty acids. The proposed level is based on the available studies on effects ofDHA in infants and the fact that the level is at the lower end of the range of human milk DHAcontent worldwide. To avoid relative deficiency of AA, which may have negative effects ongrowth (Innis et al., 2002), and also to keep a proper balance between n-6 and n-3 LCPUFAfor other reasons (Lauritzen et al., 2001) the concentration should not be lower than that ofDHA, and should not exceed 1% of total fatty acids. It is proposed that the concentration of n-6 LCPUFA should not exceed 2% of total fatty acids and that of n-3 LCPUFA 1% of totalfatty acids.

78
3.3.3 Erucic acid
The Infant Formulae Directive allows a maximum level of erucic acid of 1% total fatty acids.It is proposed that this maximum is unchanged.
4. SUMMARY OF ALL RECOMMENDATIONS
4.1 Total fat content
For infant formulae the Committee proposes to maintain the current recommendation that theminimum fat content is 4.4 g/100 kcal and the maximum content 6.0 g/100 kcal, whichcorrespond to 40-55% of the total energy content.
For follow-on formulae the Infant Formulae Directive requires a total fat content of 3.3-6.5g/100 kcal or 30-59% of the energy. Recognising that complementary feeding may be low infat the Committee sees it prudent to increase the lower level to 4.0 g/100 kcal (35% of theenergy). On the other hand there is no reason to recommend a higher maximum level than ininfant formulae, and 6.0 g/100 kcal (55% of the energy) is therefore proposed as themaximum level of fat also in follow-on formulae.
Sesame oil and cottonseed oil should remain excluded from use in infant formula and follow-on formula unless their suitability and safety are adequately demonstrated.
4.1.1 Phospholipids
Being aware of that phospholipids have key functions in signal transduction affectingimportant cell functions the Committee takes the view that until the safety for infants andyoung children have been properly documented formulae should not contain phospholipids atsubstantially higher levels than present in human milk. Directive 95/2/EC on food additivespermits the addition of phospholipids to a maximum level of 1 g/L. Based on currentknowledge the Committee proposes that the maximum level of phospholipid in infantformulae and follow-on formulae remain as 1 g/L, whether the addition is for technological ornutritional purposes e.g. to be a source of LCPUFA.
4.1.2 Inositol
The Committee proposes a minimum content of myoinositol of 4 mg/100 kcal and amaximum content 40 mg/100 kcal for infant formulae, while no limits are suggested forfollow-on formulae.
4.2 Individual fatty acids
4.2.1 Saturated fatty acids
Noting that the potential negative effect of lauric acid and myristic acid on serum cholesterolconcentration early in life is not known, it is proposed that the sum of myristic acid and lauricacid do not exceed 20% of total fatty acids. The same maximum level is set for infantformulae and follow-on formulae. Although, the concentration of these fatty acids in the milkvaries between mothers and is influenced by maternal diet the now proposed maximum levelis above that found in milk of most European mothers on a normal diet

79
4.2.2 Monounsaturated fatty acids (MUFA)
No minimum or maximum level for total monounsaturated fatty acids is proposed. Therecommendation that erucic acid (C22:1 n-9) should account for at most 1% of the total fattyacids is maintained.
4.2.3 Polyunsaturated fatty acids (PUFA)
Linoleic acid (18:2 n-6) and �-linolenic acid (18:3n-3) are the true essential fatty acids fromwhich the respective metabolites of the n-6 and n-3 series of fatty acids the long-chainpolyunsaturated fatty acids (LCPUFA) are synthesized by shared endogenous enzymesystems. The most important metabolites of linoleic acid are dihomo-�-linolenic acid andarachidonic acid and of �-linolenic acid eicosapentaenoic acid (20:5 n-3) anddocosahexaenoic acid (22:6 n-3).
4.2.3.1 Linoleic acid
For both infant formulae and follow-on formulae a minimum level of 500 mg/100 kcal and amaximum level of 1200 mg/100 kcal (4.5-10.8% of the total energy content) is proposed. Theminimum level is well above that required to prevent deficiency and the proposed range willallow a reasonable balance between saturated, monounsaturated and polyunsaturated fattyacids in formulae.
4.2.3.2 α- Linolenic acid
For both infant formula and follow-on formula it is proposed to set a minimum level of 50mg/100 kcal (1% of total fatty acids) for formulae which are supplemented with long-chainpolyunsaturated fatty acids (LCPUFA), i.e. arachidonic acid and docosahexaenoic acid,provided that the concentration of docosahexaenoic acid is at least 0.2% of total fatty acids(see below). For infant formulae and follow-on formulae, which are not supplemented withLCPUFA a minimum concentration of 100 mg/100 kcal (2% of total fatty acids) is proposed.
To ascertain a balance between the metabolites of linoleic acid and �-linolenic acid in therecipient infant it is recommended that the ratio of linoleic acid to α-linolenic acid should be5-15 in infant formula and follow-on formula, which are not supplemented with long-chainpolyunsaturated fatty acids. For formulae supplemented with long-chain polyunsaturated fattyacids (docosahexaenoic acid content 0.2% of all fatty acids) a more generous ratio of 5-20 isrecommended.
4.2.4 Long-chain polyunsaturated fatty acids (LCPUFA, 20-22 carbons)
Having reviewed the available literature the Committee sees the evidence insufficient to set anobligatory minimum level of LCPUFA. The Committee considers that a statement relating tothe presence of DHA in a formula should only be made if the content of DHA is not less than0.2% of the total fatty acids. The proposed level is based on the available studies on effects ofDHA in infants and the fact that the level is at the lower end of the range of human milk DHAcontent worldwide. To avoid relative deficiency of arachidonic acid, which may havenegative effects on growth, and also to keep a proper balance between n-6 and n-3 LCPUFAfor other reasons the concentration of n-6 LCPUFA should not be lower than that of DHA inall types of formulae with added LCPUFA.
80
It is proposed for both infant formulae and follow-on formulae that n-6 LCPUFA should notexceed 2% of total fatty acids and that of n-3 LCPUFA 1% of total fatty acids. Arachidonicacid should not contribute more than 1% of total fatty acids. The ratio betweeneicosapentaenoic acid and docosahexaenoic acid should be <1.
4.2.5 Trans fatty acids
Considering that trans fatty acids may have adverse effects on plasma lipoproteins, onmetabolism of polyunsaturated fatty acids and possibly on growth, that the concentration oftrans fatty acids in bovine milk varies, that formulae with as much as 40% of the fat as milkfat are not unusual, and also taking the view that the use of hydrogenated oils in infant andfollow-on formulae should be discouraged the Committee proposes to lower the maximumlevel of trans fatty acids to 3% of total fatty acids. The maximum level should be the same ininfant formulae and follow-on formulae.
4.2.6 Conjugated linoleic acid (CLA)
Until more is known about the effects of CLA on the growing infant, except for the CLA thatis naturally present in the fat ingredients of the formula, there should be no voluntary additionof CLA to infant formula and follow-on formula.

81
V. CARBOHYDRATES
A. MOSTLY DIGESTIBLE CARBOHYDRATES
1. INTRODUCTION
Human breast-milk contains both digestible and indigestible carbohydrates. For infantformulae and follow-on formulae, on the contrary, only digestible carbohydrates are requiredand regulated in the Infant Formulae Directive, based on the Reports of the SCF (SCF, 1983;1989; 1993a and 1995).
2. CURRENT REQUIREMENTS CONCERNING MINIMUM AND MAXIMUMCARBOHYDRATE CONTENT AND TYPE OF DIGESTIBLECARBOHYDRATE IN INFANT FORMULAE AND FOLLOW-ONFORMULAE MARKETED IN THE EU
2.1 Amounts of carbohydrate
The minimum and maximum amounts of digestible carbohydrates are given in table 1.
Table 1. Minimum and maximum amounts of digestible carbohydrates
Minimum Maximum
Infant formula g/100 kcalg/100 mL
74.2
1410.5
Follow-on formula g/100 kcalg/100 mL
74.2
1411.2
Table 2 lists the minimum and maximum requirements for some individual carbohydrates.
Table 2. Regulation of the minimum and maximum content of specific carbohydrates
Infant formula Follow-on formulaLactose*
[g/100 kcal]minimummaximum
3.5-
1.8-
Saccharose**
[in % of total carbohydrates]minimummaximum
-20%
-20%
Precooked/gelatinatinised starch
[in % of total carbohydrates][in g/100 mL]
minimum
maximum
-
30%2
-
--
* Not applicable to formulae with >50% of protein as soy protein isolate** In follow-on formula in addition to saccharose also fructose and honey

82
2.2 Types of carbohydrates
For infant formulae only lactose, maltose, saccharose, maltodextrins, corn-syrup solids, pre-cooked and gelatinised starch are permitted. Starches must be free of gluten by nature.
For follow-on formulae certain conditions apply to the use of lactose, saccharose, fructose andhoney. Other digestible carbohydrates can be used provided they are free of gluten.
3. COMMENTS ON THE EXISTING REQUIREMENTS OF THE INFANTFORMULAE DIRECTIVE
3.1 General comments on the carbohydrate content of formulae and human milk
Digestible carbohydrates serve as essential sources of energy in the diet and moreover providestructural elements for the synthesis of glycolipids and glycoproteins. Disaccharides andpolysaccharides from the diet are hydrolysed to monosaccharides which after absorption inthe upper small intestine are converted to glucose in the liver. The human brain has a highneed of energy, especially in infants, and there is an obligatory need for glucose, althoughketones can partly substitute for glucose (Kraus et al., 1974). On the basis of estimatedglucose utilisation rates of the newborn brain of 27 �mol (4.9 mg)/100 g brain/min, whichconverts to 8 to 12 g glucose/kg body weight/day, the experts of the Life Science ResearchOffice (1998) recommended a minimum total carbohydrate content of infant formula of 9g/100 kcal.
Human milk contains predominantly lactose (galactose-�(1�4)-glucose), 55 to 70 g/L or 8.2to 10.4 g/100 kcal, and in addition oligosaccharides, about 20 g/L in colostrum and 10 to 13g/L in mature milk (Coppa et al., 1994); according to other authors the concentration isbetween 5 to 8 g/L (Kunz et al., 2000), whereas the content of monosaccharides is only about1% of total carbohydrates (Coppa et al., 1994). Human milk does not contain saccharose orfructose.
The more than 130 different oligosaccharides in human milk identified so far consist ofglucose, galactose, N-acetylglucosamine fucose and sialic acid (N-acetylneuraminic acid) andin most cases lactose at their reducing end (Kunz et al., 2000). They are for the most part notbroken down by digestive enzymes of the human intestinal tract. In vitro studies with isolatedacidic and neutral oligosaccharides from human milk showed that they were not hydrolysed(less than 5%) by human salivary amylase, human and porcine pancreatic amylase and brushborder-membranes prepared from human and porcine duodenum (Engfer et al., 2000; Gnothet al., 2000). These oligosaccharides are for a small part absorbed intact by the breast-fedchild and excreted in the urine, minimally hydrolysed in the small intestine, and the majorityreaches the colon and are substrates for bacterial hydrolysis and fermentation (Kunz et al.,2000). Cows’ milk contains only traces of oligosaccharides (0.03 to 0.06 g/L), mostlysialylated derivatives. Infant and follow-on formulae based on cows’ milk protein cantherefore contain sialylated oligosaccharides. From the sialic acid content in different formulafractions it was calculated that formula-fed infants consumed 28% of the amount of sialic acidcontaining oligosaccharides consumed by breast-fed infants (Sánchez-Díaz et al., 1997).
Lactose, the predominant carbohydrate of human and cows’ milk, is not completelyhydrolysed in the small intestine either, although the enzyme lactase (a �-galactosidase) of thebrush border of small-intestinal epithelial cells is fully active at birth and should enable the
83
hydrolysis of up to 62 g lactose/day (Auricchio et al., 1965). Unhydrolysed lactose reachingthe colon is salvaged by bacteria, resulting in the preferential growth of bifidobacteria andlactobacilli. While colonic bacteria from formula-fed infants preferentially producepropionate and butyrate, bifidobacteria and lactobacilli preferentially produce lactate andacetate that increase colonic water absorption, and lower the pH of the chymus (Parrett andEdwards, 1997).
It has been speculated that the �-lactose added to infant formula, under the influence of anionsof acids such as phosphate and citrate, would be converted by mutarotation to its anomer �-lactose for which the KM of �-galactosidase (lactase) is lower, and that therefore lactose ininfant formula would be hydrolysed and absorbed to a greater extent than lactose in humanmilk. This would appear not to be of practical relevance in modern formulae with a lowprotein and phosphorus content (Zunft and Schulze, 1991). Lactose escaping hydrolysis in thesmall intestine is not the only factor responsible for the bacterial population typical for thebreast-fed infant.
A specific need for lactose of the young infant has not been proven. The effects ofmonosaccharide absorption in the small intestine on absorption of water and sodium and ofcalcium by passive non-saturable diffusion are not restricted to lactose. Fractional calciumabsorption was measured by a multitracer stable-isotope technique in 18 full-term healthynewborns who were fed from the age of 8 to 12 weeks in a cross-over design an isocaloricformula based on hydrolysed whey which contained 34 g carbohydrates/L, consisting of 70%lactose and 30% corn maltodextin (percent of calcium absorbed 67�12%) or 70% cornmaltodextrins and 30% corn syrup solids (percent of calcium absorbed 56�15%). Theabsolute amount of calcium absorbed per day was 60 mg higher from the lactose-containingformula. The amount of absorbed calcium from both formulae was higher than from humanmilk because of an almost double calcium concentration in the formulae (Abrams et al.,2002). There was no effect on zinc absorption in this study.
The disaccharidases that hydrolyse maltose, saccharose, maltodextrins (sucrose-isomaltase,maltase-glucoamylase) in the brush-border membrane of the small intestinum are all fullyactive at birth (Auricchio et al., 1965). In contrast, �-amylase activity is practically nil in theduodenal fluid of premature infants and term infants at birth (Lebenthal and Lee, 1980).Therefore, starch (amylopectin) hydrolysis is incomplete in infants below 6 months of age ifdextrin units contain more than 30 glucose units. Nonetheless, one month-old infants fed 45g/m2/day (corresponding to 2.6 g/kg body weight/day) of corn starch utilised 99.8% of theingested starch based on the analysis of glucose and starch in faeces (De Vizia et al., 1975).Low-birth-weight infants (birth weight 1880 to 2700 g) utilised 88% of 3.5 g/kg bodyweight/day of corn starch (Senterre, 1980). However, these studies did not consider thepossibility of colonic bacterial degradation of non-absorbed carbohydrate. Shulman et al.,(1983) compared the effects of feeding glucose, glucose polymers and precooked corn starchwhich were substituted for saccharose in the basal diet for one meal at a dose of 1 g/kgbodyweight in 16 healthy infants aged between 3 and 4 weeks on breath 13CO2, breathhydrogen and stool 13C abundance taking into account the natural 13C abundance in thedifferent formulae. The calculated oxidation rate was comparable for the differentcarbohydrates. Mean peak hydrogen production was highest for starch and significantlyhigher with starch and polycose than with glucose. Starch derived carbon (3.7 and 13.1% ofthe ingested load) was detected in stools of two of four infants in whom it was measured. Theauthors concluded that 4-week old infants can utilise part of ingested cereal as source ofenergy which they do not absorb completely, that bacterial fermentation plays an important
84
role in utilisation, and that the capacity for bacterial fermentation can be exceeded by highintakes (Shulman et al., 1983).
Also the chain length of glucose polymers influences their absorption and oxidation by younginfants. Twelve infants aged 3 to 4 weeks fed either glucose, short-chain (3 to 8 glucose units)or long-chain (average length 43 units) glucose polymers naturally rich in 13C at a dose of 2g/kg in one meal of their usual formula oxidised comparable percentages as measured byincreases in breath 13CO2. They absorbed less long-chain glucose polymers, and with greaterindividual variation, than glucose or short-chain glucose polymers (Shulman et al., 1986).
Salivary amylase and low pancreatic amylase activity may be sufficient to partly digest smallamounts of starch and long-chain glucose polymers, and the mucosal glucoamylase may playan important role in spite of its optimal suitability for the hydrolysis of oligomers smaller than10 glucose residues (Kelly and Alpers, 1981).
3.2 Hereditary disorders of metabolism or transport of sugars
Congenital deficiency of lactase (McKusick 223000) is a rare disease with an almost totallack of lactase in jejunal biopsy material at birth, lactose intolerance and severe diarrhoeawhen breast-fed. It has predominantly been reported in Finland.
Even less frequent is congenital lactose intolerance (McKusick 150220), a disorder ofunknown aetiology, more serious than congenital lactase deficiency and with additionalsymptoms of lactosuria, renal tubular acidosis, hyperaminoaciduria, liver damage andcataracts.
Adult lactase deficiency or non-persistence of lactase activity (McKusick 223100) is notmanifest in infancy.
Disaccharide intolerance I or sucrase-isomaltase deficiency (McKusick 222900) is acongenital disorder that manifests in non-breast-fed infants fed formulae which containglucose polymers and/or saccharose. Homozygote frequency in Inuits is 4 to 10%. Glucose-galactose malabsorption (McKusick 606824) is a rare disease and clinically similar tocongenital lactase deficiency.
Hereditary fructose intolerance (aldolase B or fructose-1-phosphate aldolase deficiency)(McKusick 229600) is a potentially fatal disease in infants fed fructose or saccharosecontaining formulae leading to hypoglycaemia, vomiting, malnutrition and liver cirrhosis. Itsincidence in Switzerland may be as high as 1:20,000.
Incomplete fructose absorption of amounts higher than 0.5 to 1 g/kg bodyweight occurs intwo of three children, leading to bloating, pain and watery diarrhoea. However, symptoms donot occur when glucose and galactose are simultaneously given.
Classical galactosaemia (galactose-1-phosphate uridyltansferase deficiency) (McKusick230400) is a fatal disorder of infancy if unrecognised, with liver failure, failure to thrive,hyperbilirubinaemia, cataract and renal Fanconi syndrome. Its incidence is between 1:35,000to 60,000.
Galactokinase deficiency (McKusick 230200) leads to cataracts if untreated. Its incidence isunknown.

85
The manifestation of these disorders depends on the carbohydrate present in their diet andtheir treatment consists in the elimination of the respective harmful sugar compound.
3.3 Total carbohydrates in infant formulae
In human milk lactose provides about 40% of the energy value. Under the present regulation,carbohydrates in infant formula may theoretically contribute between 28% and 56% of theenergy, or 26% to 53% if one applies the energy conversion factor of 3.75 kcal/g carbohydrateproposed in the 14th report of the Scientific Committee on Food. However, taking intoaccount both the minimum required contents of protein (1.8 and 2.25 g/100 kcal for cows’milk based formula and formula based on soy protein isolate and protein hydrolysate,respectively) and of fat (4.4 g/100 kcal) the carbohydrate content will provide for up to 51 to53% of the total energy content (12.8 to 13.3 g/100 kcal). Assuming that a formula containsthe maximum permitted amounts of protein (3 g/100 kcal) and fat (6.5 g/100 kcal)carbohydrates could provide 29.5% of the total energy content (7.3 g/100 kcal).
If, however, the permitted energy content for infant formula is limited to 60 to 70 kcal/100mL, the permitted crude protein content remains at 1.8 to 3.0 g/100 kcal for formula based oncows’ milk protein, and at 2.25 to 3.0 g/100 kcal for formula based on soy protein isolate andfor formulae based on protein hydrolysates and the fat content is limited to 4.4 to 6 g/100kcal, the carbohydrate contents given in table 3 would be possible. According to this table theminimum carbohydrate content would be 8.5 g/100 kcal providing 34% of energy, and themaximum carbohydrate content would be 13.5 g/100 kcal, providing 54% of energy.
Table 3. Potential carbohydrate content of infant formula composed according to the newproposals for energy, protein and fat content
60 kcal/100 mL 70 kcal/100 mLEnergy content Minimum Maximum Minimum MaximumFat g/100 kcal 4.4 6.0 4.4 6.0Protein
intact cows’ milkprotein g/100 kcal 1.8 3.0 1.8 3.0 1.8 3.0 1.8 3.0
Carbohydrateg/100 kcalg/100 mL% of energy
13.38.05533
12.17.34488
9.955.74400
8.55.13344
13.39.35533
12.18.54488
9.957.04400
8.56.03344
Soy protein +protein isolate g/100 kcal 2.25 3.0 2.25 3.0 2.25 3.0 2.25 3.0
Carbohydrateg/100 kcalg/100 mL% of energy
12.97.75522
12.17.34488
9.35.63377
8.55.13344
12.99.05522
12.18.54488
9.36.53377
8.56.03344
The Committee proposes the total digestible carbohydrate content to be between 9.0 and 14.0g/100 kcal.
3.4 Total carbohydrates in follow-on formulae
The carbohydrate content required for follow-on formula is derived from the proposed energy,protein and fat contents as given in table 4.

86
Table 4. Potential carbohydrate content of follow-on formula composed according to thenew proposals for energy, protein and fat content
60 kcal/100 mL 70 kcal/100 mLEnergy content Minimum Maximum Minimum MaximumFat g/100 kcal 4.0 6.0 4.0 6.0Protein
intact cows’ milkprotein g/100 kcal 1.8 3.0 1.8 3.0 1.8 3.0 1.8 3.0
Carbohydrateg/100 kcalg/100 mL% of energy
14.28.55577
13.07.85522
9.956.04400
8.55.13344
14.29.95577
13.09.15522
9.957.04400
8.56.03344
Soy protein +protein isolate g/100 kcal 2.25 3.0 2.25 3.0 2.25 3.0 2.25 3.0
Carbohydrateg/100 kcalg/100 mL% of energy
13.758.35555
13.07.85522
9.255.63377
8.55.13344
13.759.65555
13.09.15522
9.256.53377
8.56.03344
The present upper limit of 14 g carbohydrates/100 kcal is sufficient, whereas the minimumamount of 7 g/100 kcal is below the content that is required according to the new proposalsfor composition.
The Committee proposes a minimum carbohydrate content of 9.0 g/100 kcal and a maximumcontent of 14 g/100 kcal for follow-on formula.
3.5 Type of carbohydrate in infant formulae and follow-on formulae
3.5.1 Lactose in infant formulae
There is no firm evidence for an absolute need of lactose for infants. UDP-galactose neededfor the formation of glycolipids, glycoproteins and oligosaccharides can be formed fromglucose via glucose-1-phosphate and UDP-glucose by galactose-4-epimerase. However, othercarbohydrates offer no advantage over the use of lactose in infant formula. The lactose fromhuman milk can be sufficiently hydrolysed. Higher lactose contents than 10 g/100 kcal,however, could exceed the capacity for absorption but would be salvaged by colonic flora(MacLean et al., 1983).
The Committee is of the opinion that lactose should be the preferred carbohydrate in infantformula, except for formula based on soy protein isolate. The Committee proposes that for allinfant formulae, except for those based on based on soy protein isolate, one should maintainthe present requirement that at least 50% of the total minimum carbohydrate content (4.5g/100 kcal) should be lactose. A partial substitution of other carbohydrates for lactose may beadvisable for reasons of osmolality of selected products.
The Committee is of the opinion that formulae based only on soy protein isolate may be freeof lactose, which is naturally not present in soy bean. Lactose-free formula based on soyprotein isolate is the rule at present. Minimal lactose amounts resulting from contamination ofingredients in such formulae cannot be excluded.
The Committee proposes qualifying the permitted claim “free of lactose” for products whichcontain less than 10 mg of lactose per 100 kcal. This proposal is based on the empirical

87
guidance values for a galactose (both free and �-glycosidic) intake of 50 (to 200) mg/day forinfants with classical galactosaemia (Arbeitsgemeinschaft Pädiatrische Stoffwechsels-törungen, 1997).
3.5.2 Lactose in follow-on formulae
Considering that lactose confers some benefits, e.g. on calcium absorption (Abrams et al.,2002) also to the older infant, the Committee proposes the same requirements for lactose infollow-on formula as in infant formula.
3.5.3 Saccharose (and fructose) in infant formulae
Both saccharose and fructose are sweeter than lactose, glucose, maltose and glucosepolymers.Because of sweetness infants fed ad libitum tend to consume more volume of a formulacontaining saccharose compared to lactose. Fourteen infants fed from the 8th day until the112th day of life isocaloric formulae based on soy protein isolate which contained either 6.8 gsaccharose or 6.8 g corn starch hydrolysate per 100 mL for alternating periods of 4 weekseach had a higher volume and energy intake during the saccharose periods. However, therewere no significant differences in weight gain and in weight gain per 100 kcal consumedbetween the feeding regimes. Because of the shortness of alternating feeding periods it couldnot be proven that the consumption of a sweeter formula would lead to greater weight gain(Fomon et al., 1983). There is no proof that consumption of sweeter formulae by infantswould promote a preference for sugar in later life. There is some evidence to show that dietaryfructose (20% in the diet) impairs copper absorption in human adults (Reiser et al., 1985).
Saccharose and fructose from infant formula can lead to life-threatening illness in infants withfructose intolerance, while offering no benefit for normal infants. The Committee considersthe risk for infants with this metabolic disorder as serious and avoidable. More than 20different mutations of the aldolase B gene have been described. The severity of the diseasedoes not depend on the type of the mutation. The most common mutation A149P in WesternEurope and Northern America has a heterozygote frequency of 1.3% in the UK, from which itcan be calculated that 0.02% of all newborns would be homozygous and at risk of developingthe symptoms of fructose intolerance if exposed to fructose (Kullbergh-Lindh et al., 2002).Symptoms are more severe in young infants and occur at smaller doses of fructose. Fructoseintake restriction to 10 mg/kg body weight/day has been necessary in patients of about 4 to 5years of age to normalise growth velocity and serum urate levels (Mock et al., 1983).
The Committee acknowledges, however, that saccharose may be helpful in camouflaging thebitter taste of protein hydrolysates.
In conclusion the Committee proposes to delete saccharose (and fructose) from the permittedcarbohydrates for use in infant formula based on intact proteins.
The Committee suggests accepting the use of saccharose in formula based on proteinhydrolysates in amounts of up to 20% of the total carbohydrate content. The label should thenclearly state the presence of saccharose.
3.5.4 Saccharose (and fructose) in follow-on formulae
Although saccharose (and fructose) offers no advantage over other carbohydrates in follow-onformula, the Committee considers the use acceptable, because at the earliest age of

88
introduction of follow-on formula (4 months) many infants are introduced to complementaryfood and presumably to saccharose. The sum of fructose, saccharose (and honey) should benot more than 20% of the total carbohydrate content.
3.5.5 Maltose in infant formulae and follow-on formulae
In both types of formula maltose can be accepted without stating minimum or maximumlevels.
3.5.6 Maltodextrins and corn-starch syrup solids in infant formulae
Maltodextrins have the advantage of causing a lower osmolality in products than mono- ordisaccharides. Because of the chain-length specificity of intestinal glucoamylaseglucosepolymers with 5 to 9 glucose units should be preferred. At present the type ofglucosepolymers is not regulated. This is reflected in the variable pattern of distribution of thedegree of polymerisation in 7 commercial formulae containing maltodextrin which rangedfrom 1 to 30 (Coppa et al., 1994).
3.5.7 Maltodextrins and corn starch syrup solids in follow-on formula
No recommendations on the chain length of maltodextrins are considered necessary.
3.5.8 Glucose in infant formulae and follow-on formulae
Glucose should not voluntarily be added to infant or follow-on formula based on intactproteins, because its osmotic activity is higher than that of di-, oligo- und polysaccharides (1 gof glucose per 100 mL adds 58 mOsmol/kg).
In nine commercially available infant formulae labelled to contain lactose only small amountsof glucose (0.2 to 0.3 g/l) were found. In all infant formulae that contained maltodextrinsthere were also small amounts of glucose (0.15 to 1.2 g/l) (Coppa et al., 1994).
Glucose additions to formulae based on hydrolysed protein for reasons of taste should berestricted to not more than 2.0 g/100 kcal in order to keep the osmolality of the product readyfor consumption within reasonable limits.
3.5.9 Starches in infant formulae
Unmodified starches are made of long chains of glucose polymers forming amylose oramylopectin (Filer, 1988). Unmodified starches are considered unsatisfactory for some fooduses because they lose desirable thickening properties when cooled and stored. Two methodsused to modify starches are cross-linking and stabilization. Cross-linking prevents swollenstarch granules from rupturing by bridging one starch molecule to another with eitherphosphate or adipic acid. Through the process of stabilization, acetyl groups are used tomodify and stabilize the starch (Christian et al., 1999). Modified food starches arepredominantly used in baby foods. The Joint FAO/WHO Codex Alimentarius Commission(CAC, 1994) stipulated that soy-based infant formulae and soy-based follow-on formulaeshould contain no more than 0.5 g of distarch phosphate, acetylated distarch phosphate, andphosphated distarch phosphate, used singly or in combination, per [100 mL] of a ready-to-drink product. The Infant Formulae Directive stated that only pre-cooked starch andgelatinized starch (naturally free of gluten) can be used as modified food starches in infant

89
formulae. No more than 2 g of pre-cooked starch and gelatinized starch should be added in[100 mL] of formula and these starches should provide no more than 30% of the totalcarbohydrate content. As described in Part 4 of Annex VI of the Directive 98/72/ECamending Directive 95/2/EC, starch sodium octenyl succinate (E 1450) is permitted at amaximum level of 20 g/L in infant formulae and follow-on formulae.
There are no biological and nutritional data to define a minimum level of modified foodstarches in infant and follow-on formulae. The total amount of modified food starches,precooked starch and gelatinized starch (naturally free of gluten) should not be above 2 g/100mL and should not represent more than 30% of the total carbohydrate content of the formulae.
3.5.10 Starches in follow-on formulae
The Committee proposes to retain the present rules for starches in follow-on formula, that is,only precooked and gelatinised starches naturally free of gluten are permitted and norestriction is made for the starch content besides the one resulting from the requirement forlactose.
B. MOSTLY NON-DIGESTIBLE CARBOHYDRATES
1. INTRODUCTION
Non digestible carbohydrates (NDC) are a heterogeneous group of dietary substances that arederived principally from plants. The principle groups of dietary non digestible carbohydratescomprise fibre and non-starch polysaccharides, a certain proportion of dietary starches that arenot digested and absorbed in the small intestine of healthy individuals, a certain proportion ofdisaccharides such as lactose that may be incompletely digested in the small intestineespecially in young infants, oligo- and polysaccharides, and synthetic and modified complexcarbohydrates such as thickening agents (ESPGHAN, 2003b).
The physiological effects of dietary NDC are at least partly related to their mechanical andphysicochemical properties as they pass down the gut, including the retention of water,minerals and organic compounds. Moreover, NDC serve as a substrate for bacterialfermentation in the colon. These effects and the interactions of NDC with other dietarycomponents can have nutritional and other physiological consequences which have beeninvestigated largely in adults, while only few studies have been carried out in infants andchildren (ESPGHAN, 2003b). While diets rich in NDC may have marked benefits forgastrointestinal physiology and health, they may potentially also reduce energy intake orreduce the availability, digestion and absorption of fat, carbohydrates, minerals and othernutrients and increase faecal water losses. Faecal loss of energy may increase with increasingNDC intake by infants and young children (Hamaker et al., 1991), and adverse effectsthrough malabsorption and fermentative diarrhoea have been reported by high NDC intakes ofinfants during the weaning period (Rowland, 1986). Diarrhoea can also be caused by a highintake of fructose exceeding the capacity for absorption, and other NDC (Cole et al., 1999).Therefore, the possible addition of NDC to infant formulae or follow-on formulae needs to beassessed with regard to potential nutrional and other physiological effects.
Non digestible carbohydrates may be added to formulae, follow-on formulae or to foods forspecial medical purposes for infants primarily for technological reasons, e.g. as stabilizers,

90
texturizers, or thickening agents, or as a source of fermentable substrates for the gutmicroflora.
Here the Committee attempts to review the current knowledge on non digestiblecarbohydrates that might be added to infant and follow-on formulae, to comment on theavailable knowledge on their suitability and safety for use in infant and follow-on formulae,and to assess whether limitations on the contents of non digestible carbohydrates, if added toinfant and follow-on formulae, should be recommended. Included in this review are locust(carob) bean gum, guar gum, pectins, oligosaccharides (oligogalactosyl-lactose [GOS],oligofructosyl-saccharose [FOS]), other fructans, and carrageenan.
2. EUROPEAN LEGISLATION AND PREVIOUS COMMITTEE´SSTATEMENTS ON THE CONTENT OF NON-DIGESTIBECARBOHYDRATES IN INFANT FORMULAE AND FOLLOW-ONFORMULAE
The use of guar gum (E 412) is permitted for inclusion in infant formulae for infants in goodhealth for technological reasons, at a maximum level of 1 g/L, where the liquid productcontains hydrolysed proteins (part 1 of Annex VI of Directive 95/2/EC of 20 February 1995)and is in conformity with the conditions set in Annex IV of Directive 91/321/EEC, asamended by Directive 96/4/EC.
Follow-on formulae may contain, for technological reasons, carrageenan (E 407) at amaximum level of 0.3 g/L, locust bean gum (E 410) at a maximum level of 1 g/L, and guargum (E 412) at a maximum level of 1g/L (Part 2 of Annex VI of Directive 95/2/EC). If morethan one of these three substances is added to a follow-on formula, the maximum levelestablished for each of those substances is lowered with that relative part as is present of theother substances together.
The Committee has previously commented on the use of oligofructosyl-saccharose andoligogalactosyl-lactose in infant formulae and in follow-on formulae (SCF, 2001d). TheCommittee had no major concerns of adding up to 0.8 g/100 mL of a combination of 90%oligogalactosyl-lactose and 10% high molecular weight oligofructosyl-saccharose in infantformulae and follow-on formulae, but recommended that further information is collected onthe suitability and safety of the inclusion of digestion-resistant short chain carbohydrates ininfant formulae and follow-on formulae. The Committee did not draw any conclusions onpotential beneficial effects of resistant short chain carbohydrates in infant formulae andfollow-on formulae.
The Committee has recently commented on the use of carrageenan in dietetic products forinfants (SCF, 2003d). In the absence of any further information on possible absorption ofcarrageenan by the immature gut in the very young infant, the Committee reaffirmed itsearlier view (SCF, 1999a) that it remains inadvisable to use carrageenan in infant formulaethat are fed from birth, including those in the category of foods for special medical purposes.The Committee had no objection to the use of carrageenan, for technological reasons, in foodsfor older infants, such as follow-on formulae (SCF, 1983) and weaning foods.

91
3. NON-DIGESTIBLE CARBOHYDRATES
3.1 Gums
3.1.1 Locust bean gum
Locust (carob) bean gum (E 410) is refined from the endosperm of the carob tree, Ceratoniasiliqua. It contains tannins and the carbohydrate component is a galactomannan polymerconsisting of linked D-mannose units with side chains of D-galactose. Locust bean gum iswidely used as a thickening agent.
The Committee has previously stated that no conclusive information was available on thepotential deleterious effets of thickening agents on the bioavailability of dietary nutrients andgrowth in infants (SCF, 1999a). Using an in vitro model, Bosscher et al. showed in twostudies that bioavailability of calcium, iron and zinc was decreased by thickening formulaewith locust bean gum and guar gum whereas no detrimental effect on mineral absorption wasobserved by thickening formulae with added starch (Bosscher et al., 2000; Bosscher et al.,2001). In some, but not all animal studies, the addition of locust bean gum to the dietdecreased growth (Vohra et al., 2000). A recent review did not reveal any deleterious effecton mineral absorption of soluble non digestible carbohydrates (specifically pectins, gums,resistant starches, lactulose, oligofructose and inulin) (Greger, 1999).
Sievers and Schaub reported an increased frequency of defecation and the occurrence ofmetabolic acidosis in premature infants after the introduction of formula thickened with locustbean gum (Sievers and Schaub, 2003).
Allergy to locust bean gum has been documented in a 5-month-old girl fed a formulathickened with locust bean gum to improve regurgitation, who developed explosive vomiting,urticaria and a facial rash (Savino et al., 1999). Rhinitis and asthma have been reported inadults exposed to locust bean flour at their workplaces (Scoditti et al., 1996; van der Bremptet al., 1992).
Data assessing the efficacy of thickening formulae for infants with gastroesophageal refluxdisease (GERD) are scarce. In a recent review, Carroll et al. concluded that no studydemonstrated a significant reflux-reducing benefit of thickened infant foods compared withplacebo (Carroll et al., 2002). One study reported a significant benefit of a formula thickenedwith locust bean gum, as compared with formula with rice flour (Borrelli et al., 1997) on thelowering of intraesophageal acid exposure and a decrease of both symptom score and numberof emesis episodes. In an open evaluation, formula thickened with locust bean gum seemed toinduce clinical improvement of regurgitation and emesis in infants with GERD (Vandenplasand Sacré, 1986). However, although the number of acid reflux episodes was reduced duringpH-monitoring, there was also an increase of the duration of the longest episode and nochange in the total duration of acid exposure of the oesophageal mucosa, presumably becauseof slower clearance of the thickened refluxate from the esophagus. Orenstein et al. reported anincreased incidence of coughing in infants receiving a thickened formula which has beenattributed to decreased acid reflux clearance (Orenstein et al., 1992).
The ESPGHAN Committee on Nutrition concluded that the thickening of formulae withlocust bean gum, starch or other thickening agents may be beneficial in a limited number ofselected infants, such as infants in who repeated possetting leads to a marked loss of energy
92
and induces failure to thrive. However, the ESPGHAN Committee recommended that thewidespread use of thickened formula for infants with repeated possetting without any risk forhealth or well being should be discontinued (ESPGHAN, 2002b).
In conclusion, the Committee reaffirms its earlier view that it “is not persuaded that it isnecessary to give thickened infant formulae to infants in good health”, and that theinformation available on the potential effects on the bioavailability of dietary nutrients andgrowth in young infants is not conclusive (SCF, 1999a). It is therefore recommended that theuse of locust bean gums should not be acceptable for use in infant formulae.
The Committee recommends maintaining the current maximum level of the use of locust beangums in follow-on formulae of 1 g/L. The Committee further recommends maintaining theconcept that if more than one of the three substances locust bean gum, guar gum orcarrageenan are added to a follow-on formula, the maximum level established for each ofthose substances is lowered with that relative part as is present of the other substancestogether.
The Committee accepts that there is a case of need for use of locust bean gums in dietaryfoods for special medical purposes for therapeutic use in a small number of infants withgastro-oesophageal reflux disease under medical supervision, and the Committee considers itsuse in these products up to a maximum level of 10g/L acceptable.
3.1.2 Guar gum
Guar gum (E 412) is used as a stabiliser, thickener and texturiser. Although viscous gumsmay enhance the viscosity of luminal contents in the upper gastrointestinal tract, guar gumseems not to impair the bioavailability or utilisation of dietary nitrogen (Mariotti et al., 2001).A double-blind controlled study in volunteers found that partially hydrolyzed guar gum didnot affect intestinal absorption of carbohydrates, protein and fat, and that insulin release andexocrine pancreatic function were not affected (Alam et al., 1998). Guar gum has been widelyused in adults with the intention to induce body weight-reduction, although a recent meta-analysis of randomized trials suggested that guar gum is not effective in this regard (Pittlerand Ernst, 2001). The most frequently reported adverse effects of guar gum were abdominalpain, flatulence, diarrhoea, and cramps. Gastric emptying and intestinal transit were delayedby the addition of guar gum to the diet of human volunteers, and duration of postprandialmotor activity in the small bowel was markedly prolonged (Schonfeld et al., 1997). A recentstudy reported that addition of guar gum to a semi-solid, low energetic meal had no effect oneither the gastric emptying rate or rate of intestinal transit (van Nieuwenhoven et al., 2001).
The Committee recommends guar gum should not be used in infant formulae. Consideringthat guar gums have been used for quite some time in follow-on formulae without theappearance of reports on adverse events, the Committee finds it acceptable to maintain thecurrent maximum level of the use of guar gums in follow-on formulae of 1 g/L. TheCommittee further recommends maintaining the concept that if more than one of the threesubstances locust bean gum, guar gum or carrageenan are added to a follow-on formula, themaximum level established for each of those substances is lowered with that relative part as ispresent of the other substances together.

93
3.1.3 Pectins
Pectins (E 440) are soluble polysaccharides, the main sugar moieties of which are D-galacturonic acid and D-galacturonic acid methylester. Pectins are used as stabilisers andthickeners, and as texturisers. They are present in cell walls of all plant tissues. Foods forspecial medical purposes for infants to be used under medical supervision may contain pectinsup to a maximum level of 10 g/L (Part 4 of Annex VI of the Directive 98/72/EC).
The Committee recommends that pectins should not be used in infant formulae and follow-onformulae in view of limited information on their potential effects in infants.
The Committee has no objections against the continued use of pectins up to a maximum levelof 10 g/L in dietary foods for special medical purposes for infants to be used under medicalsupervision.
3.2 Oligosaccharides
Oligosaccharides are defined as molecules containing a small number (3 to about 10) ofmonosaccharide residues connected by glycosidic linkages (IUPAC-IUBMB JointCommission on Biochemical Nomenclature, 1982). The number of monosaccharide residuesdefines the degree of polymerisation (DP). Some oligosacharides that are resistant to digestionin the human intestinal tract may promote the growth of bifidobacteriae and lactobacilli in thecolon and thus induce prebiotic effects (Salminen et al, 1998; Cummings et al, 2001). ABifidus-dominated flora is also typically found in breast fed infants, but in addition to humanmilk oligosaccharides also other human milk factors such as the relatively lower protein andphosphorus concentrations, the lactose content and the effects on the composition of colonicmucins appear to be relevant for the bifidogenic effects of human milk (Yoshioka et al., 1983;Walker, 2000). The promotion of a Bifidus-dominated flora might have beneficial effects ininfants, such as some protection against enteric infections. However, at this time there is littleconclusive evidence on the relationship between a bifidobacteriae dominated flora andrelevant outcomes on health and well-being in infants.
Human milk contains a complex mixture of more than 130 different oligosaccharidescomprising a total concentration of 15-23 g/L in colostrum and 8-12 g/L in transitional andmature milk (Kunz et al, 1999; Kunz et al., 2000). The carbohydrate chains of almost alloligosaccharides in human milk isolated so far contain lactose at the reducing terminal. Othermonosaccharides are glucose, galactose, fucose, N-acetylglucosamine and sialic acid.Synthesis of oligosaccharides starts mainly from lactose moieties by means oftransglycosyltransferases. Recently, human milk oligosaccharides were shown to be resistantto enzymatic digestion in the upper gastrointestinal tract (Engfer et al., 2000). Among otherfunctions human milk oligosaccharides may serve as substrates for colonic fermentation. Ithas been shown that human milk oligosaccharides induce an increase in the number ofBifidobacteria of colonic flora in breast-fed infants, accompanied with a significant reductionin the number of potentially pathogenic bacteria (Kunz et al., 2000). Complexoligosaccharides have the ability of inhibiting the binding of pathogens to cell surfacesbecause they act as competitive receptors on the host cell surface, thereby preventingadhesion of a number of bacterial and viral pathogens.
Because of the variety, variability, complexity and polymorphism of their structure, it iscurrently not feasible to add a similar oligosaccharide composition as contained in human

94
milk to infant and follow-on formulae (Erney et al., 2000). Alternatively, the addition of otheroligosaccharides to infant formulae and to follow-on formulae has been proposed.
Oligofructosyl-saccharose (oligofructose; fructooligosaccharides, FOS) and oligogalactosyl-lactose (oligogalactose; galactooligosaccharides, GOS) have been used in dietetic products forinfants. Oligofructose is produced from chicory roots and contains one molecule ofsaccharose to which between 1 and >60 fructose molecules are added. Oligofructose is notfound in human milk. Oligofructosyl-saccharose naturally occurs in food (chicory, onion,artichoke, asparagus, and banana) but can be incorporated into beverages, confectionary, dairyproducts and other foods. Oligogalactose is produced from lactose with the help of a bacterialß-galactosidase, contains one molecule of glucose and typically between 1 and 7 molecules ofgalactose. Oligogalactose is found only in trace amounts in human milk. Many fermentedmilk products contain oligogalactosyl-lactose obtained from lactose by �-galactosidases oflactic bacteria. Lactose-free formulae may also contain trace amounts of oligogalactosyl-lactose. In addition to oligogalactose, the preparation used in dietetic products for infantscontains some 40% (wt/wt) of mono- and disaccharides. Oligofructose has a sweet tasteconsidered to be about 0.3 times as sweet as saccharose (Wiedmann and Jager, 1997). Thepreparations of oligosaccharides under discussion here are partly digestable and hence cannotbe considered as dietary fibre. It has been proposed that the utilisable caloric value of theseoligosaccharides is in the order of 1.5 kcal/g (Carabin and Flamm, 1999).
Although it has been said that oligogalactosyl-lactose has been used as an ingredient in infantand follow-on formulae in Japan for some 15 years, studies of the safety and the effects onfaecal flora in infants receiving these oligogalactosyl-lactose enriched formulae published inpeer-reviewed journals are lacking.
The occurence of repeated anaphylactic reactions to inulin and oligofructose has beenreported in one human adult (Gay-Crosier et al., 2000).
No conclusive data are available on direct or indirect measures of water balance. Some studiesin non-pregnant and in pregnant rats fed diets with added oligofructose showed a dose-dependent induction of loose and watery stools, and a reduced body weight (Carabin andFlamm, 1999). The effects on body weight might be related either to an interference withsubstrate absorption, or water homeostasis, or a combination of both. In a further feedingstudy, 50 male and 50 female rats received diets providing 0, 0.34-0.42, 0.85-1.0, or 2.2-2.7g/kg per day of oligofructose. Male rats fed diets with oligofructose showed significantelevations of serum concentrations of sodium and chloride, and in some cases showedpathological changes of the kidneys, including degeneration of proximal tubular epithelialcells. Only the male rats receiving 0.85 g/kg also showed a significant increase of serumcreatinine as well as increased mortality (Carabin and Flamm, 1999). In two studies in ratsexposed to dietary oligofructose, also swelling of the appendices was noted (Carabin andFlamm, 1999). Although conclusions cannot be directly extrapolated from these observationsto infants, they illustrate possible adverse effects of dietary oligofructose and oligogalactoseon water balance.
In infants, oligosaccharides increased stool frequency and reduced stool consistency in a dosedependant manner. For measures of both these parameters, significant differences were foundbetween the two concentrations of 0.4 g/100 mL or 0.8 g/100 mL of the mixture of 90%oligogalactose and 10% oligofructose. In one open study in term infants, infants with a meanage of 7 weeks fed a formula diet with 0.8 g/100 mL oligosaccharides, as well as modifiedprotein, fat and lactose contents, showed watery or fluid stools in 27%, compared to 12% in a

95
control group fed regular infant formula (Veitl et al., 2000). Although stools with lowconsistency are common in breast fed infants, human milk has a far lower renal solute loadthan infant formula. In a controlled trial in term infants, lower serum concentrations ofprealbumin were reported in infants fed a formula diet with 0.8 g/100 mL oligosaccharidescompared to the control group, which may or may not be related to a modulation of nitrogenretention. Some data on effects of dietary products with added oligosaccharides on growth areavailable, but the data are limited and include only short term observations.
The Committee considered whether the addition of oligosaccharides in a dosage that increasesstool frequency and reduces stool consistency might induce a risk of inadequate water balanceparticularly in infants during the first months of life with renal immaturity and a poor abilityto concentrate urine, especially if an additional stress on water balance is induced, forexample by fever, hyperventilation resulting from pulmonary disorders, infectious diarrhoea,high dietary renal solute loads, or refusal of the infant to accept appropriate quantities offluids (SCF, 2001a). Young infants have a very high water turnover, in the order of 200mL/kg and day during the first two months of life (Goellner et al., 1981). Interference withwater balance may put young infants at risk of hypernatriaemic dehydration, as is exemplifiedby the relationship between dietary renal solute load and incidence rates of hypernatriaemicdehydration observed in the United Kingdom in the 1970s (Arneil and Chin, 1979;Sunderland and Emery, 1979; Manuel and Walker-Smith, 1980; Davies et al, 1979).However, the information available to the Committee, in particular with respect to effects ongrowth and markers of water balance, does not demonstrate adverse effects from the use of aformulae with up to 0.8 g/100 mL of a combination of 90% oligogalactosyl-lactose and 10%high molecular weight oligofructosyl-saccharose (SCF, 2001b).
3.2.1 Effects of oligofructosyl-saccharose (FOS) and oligogalactosyl-lactose (GOS) on thefaecal flora
The ability of many bacterial strains of the colonic flora to metabolize oligofructosyl-saccharose and oligogalactosyl-lactose has been extensively studied in in vitro and in vivoanimal studies. These results have been confirmed in healthy adult humans. Fermentation bythe colonic microflora has been shown, both in vitro and in vivo, by the production ofmetabolites, gas, short chain fatty acids and microbial enzymes (Bouhnik et al., 1999;Cummings et al., 2001; Salminen et al., 1998).
The ingestion of oligofructosyl-saccharose and oligogalactosyl-lactose can lead to an increaseof the faecal population of Bifidobacteria in adult humans. The intensity of this bifidogeniceffect is inversely correlated to the initial amount of Bifidobacteria in the faeces (Van Loo etal., 1999). It has also been shown in adults that the ingestion of oligogalactosyl-lactose couldgive rise to an increase of Lactobacilli in faeces and to a decrease of potentially detrimentalbacteria such as Bacteroides, Clostridium and Enterobacteriacae (Williams et al., 1994). Thestudies reported in adults have been performed for short-term duration (usually 10-30 days)and realised with different prebiotic substances and a very wide range of dailysupplementation.
The only randomised controlled study related to the addition of oligofructosyl-saccharose inan infant formula failed to find significant effects on bifidobacteriae counts in stools (studiedwith classical bacteriological methods) nor any stool pH lowering with daily doses of 1, 2 andup to 3 g of oligofructosyl-saccharose (Guesry et al. 2000). These results are contradictorywith the well-known bifidogenic effect of FOS in adults (Van Loo et al., 1999).

96
The use of a mixture of 10% oligofructosyl-saccharose (high molecular weight fractionobtained by hydrolysis of inulin extracted from chicory roots) and 90% oligogalactosyl-lactose (derived from lactose by the action of a bacterial �-galactosidase) in infant formulawas recently studied in randomised clinical trials performed during the first weeks of life,with a follow-up of 4 to 12 weeks. Preterm and healthy term infants were given an infantformula supplemented with 0.4, 0.8 or 1 g/100 mL of the oligofructosyl-saccharose /oligogalactosyl-lactose mixture (Boehm et al., 2002; Moro et al., 2002; Rigo et al., 2001;Schmelzle et al., 2003). Bacteriological analysis of the stools was either performed usingclassical microbiological methods or the fluorescent in situ hybridisation (FISH) technique. Asignificant increase of total faecal bifidobacteria and/or a significant increase of theproportion of faecal bifidobacteria as a percentage of total faecal micro-organisms wereobserved in these studies. This effect was dose dependent, with a concentration of theoligofructosyl-saccharose/oligogalactosyl-lactose mixture of 0.8 g/100 mL of formulaassociated with a higher increase of the bifidogenic flora than the concentration of 0.4 g/100mL (Moro et al., 2002). In one of the 2 studies where this parameter was assessed, an increaseof Lactobacilli in faeces was also demonstrated (Boehm et al., 2002; Moro et al., 2002). Inthe study performed in preterm infants, no significant change was observed as regardspotentially harmful components of the faecal flora, particularly Bacteroides, Clostridiumspecies, Escherichia coli, Enterobacter, Citrobacter, Proteus, Klebsiella, and Candida(Boehm et al., 2002). It is difficult to draw firm conclusions since there were differences inthe composition of the formula used in the different studies as regards the amount ofoligofructosyl-saccharose and oligogalactosyl-lactose (0.4, 0.8 and 1.0 g/100mL) as well asthe nature of lipid and protein contents of the enriched formula in 2 studies [presence of �-palmitate (total palmitic acid: 0.6 g/100 mL; 41% in sn-2 position) and partially hydrolysedwhey protein] (Rigo et al., 2001; Schmelzle et al., 2003). 3.2.2 Health benefits of FOS and GOS in children
Modifications of the faecal microflora per se do not demonstrate the prebiotic nature of aningredient, which by definition includes the demonstration of a beneficial effect on hosthealth. Data on potential health benefits of oligofructosyl-saccharose and oligogalactosyl-lactose in infants are rare.
In a dose dependent manner, the use of oligofructosyl-saccharose and oligogalactosyl-lactosein infant formulae was associated with an increase of stool frequency and a reduction of bothstool pH and stool consistency in infants, with the induction of more watery stools. Both stoolfrequency and stool consistency differed significantly with the use of two concentrations of0.4 g/100 mL or 0.8 g/100 mL, respectively, of the mixture of 10% oligofructosyl-saccharoseand 90% oligogalactosyl-lactose (Moro et al., 2002). Similar observations were made inpreterm infants supplemented with 1g/L of the same oligosaccharide mixture (Boehm et al.,2002). The increase of osmolarity of the formula due to the presence of the short chaincarbohydrate mixture was very low and estimated to be less than 5 mOsm/L (Boehm et al.,2002). Increased stool frequency and softer stool consistency may provide a relevant benefitin those subgroups of infants that suffer from hard stools and constipation. No information isavailable as to whether or not the supplementation of infant and follow-on formulae witholigofructosyl-saccharose and/or oligogalactosyl-lactose may have a preventive effect on theincidence of infectious and allergic disorders. Potential clinical benefits of oligofructosyl-saccharose and oligogalactosyl-lactose in young infants need to be further assessed.
In conclusion, the Committee reaffirms its previous statement that is has no major concernson the inclusion of up to 0.8 g/100 mL of a combination of 90% oligogalactosyl-lactose and

97
10% high molecular weight oligofructosyl-saccharose to infant formulae and follow-onformulae. It also reaffirms its previous comment that further information should be gatheredon safety and benefits of this combination as well as other forms of oligosaccharides in infantformulae and follow-on formulae.
3.3 Fructans other than FOS
Fructans encompass both inulin and oligofructosyl-saccharose. Fructans are important storagecarbohydrates in many plant families, each having its own fructan profile, but are alsoproduced by algae, fungi and bacteria. Fructan molecules consist of monosaccharide units,usually one glucosyl unit and a varying number of fructosyl units. The most importantcommercially available types of fructans are inulin (mainly 2-60 units of fructose) andoligofructosyl-saccharose (Nordic Committee of Ministers, 2000). The absence ofdigestibility of these oligosaccharides has been demonstrated by in vitro and animal studies,as well as human studies.
Inulin-type fructans have been reported to stimulate calcium absorption in both experimentalanimals and in humans (Scholz-Ahrens et al., 2002). There are preliminary indications of ahypotriglyceridemic effect of inulin-type fructans in humans with mild hypertriglyceridemia(Jackson et al., 1999), which might point to a possible interference with lipid absoption. Nostudy on fructans other than oligofructosyl-saccharose as an ingredient of infant formulae orfollow-on formulae has been reported.
Young infants have an immature gut barrier and are considered at increased risk for allergicsensitisation. In view of a report on anaphylactic reactions to inulin and oligofructosyl-saccharose in a single 39-year old man after ingestion of vegetables (salsify, artichoke) andprocessed food containing inulin, the potential of sensitisation should be monitored in futureevaluations (Gay-Crosier et al., 2000).
The Committee concludes that based on the data available at this time, fructans other thanoligofructosyl-saccharose should not be included in infant formulae and follow-on formulae.
3.4 Carrageenan
Carrageenan (E 407), a seaweed extract, is a high-molecular weight hydrocolloid (molecularweight 1.5-20 * 106). It is widely used as a thickener, stabiliser, and texturiser in a variety ofprocessed foods in the Western diet. In 1959, carrageenan was granted GRAS (GenerallyRecognized as Safe) status in the United States. The Committee has previously established anacceptable daily intake (ADI) of 0-75 mg/kg body weight (SCF, 2003).
Carrageenan as a component of a barium enema solution produced positive skin prick test andRAST results in a patient with an anaphylactic reaction during a barium enema (Tarlo et al.,1995). The patient had suffered from gastrointestinal symptoms which disappeared when adiet free of carrageenan was followed. Since carrageenan is widely distributed in commonfoods, it might account for the occurrence of allergic reactions to foods containingcarrageenan, including milk products and formulae for infants (Tarlo et al., 1995). In itsrecent comment on carrageenan, this Committee concluded that the data available do notsupport the hypothesis that breast cancer may be causally related to intakes of caraagenan(SCF, 2003).
The Committee reaffirms its view that infant formulae should not contain carrageenan, but

98
that it has no objection to the use of carrageenan in follow-on formulae up to a maximumlevel of 0.3 g/L. The Committee further recommends maintaining the concept that if morethan one of the three substances locust bean gum, guar gum or carrageenan are added to afollow-on formula, the maximum level established for each of those substances is loweredwith that relative part as is present of the other substances together.

99
VI. LIPID-SOLUBLE VITAMINS
1. INTRODUCTION
The vitamins A, E, D and K are lipid soluble; hence their absorption from infant formulae isrelated to the efficacy formula fat absorption. The lipid-soluble vitamins are stored in body fatdepots, such as adipose tissue, and high intakes over longer periods of time may lead to theirtissue accumulation. In addition to dietary intake, also their transplacental supply duringpregnancy determines an infant’s stores of lipid soluble vitamins at birth, which may varyconsiderably within populations and may modulate the dietary requirements during the firstmonths of life.
2. VITAMIN A
A group of natural and synthetic substances with the vitamin activity of all trans retinol iscalled vitamin A. Retinol and retinyl esters are found in animal products, such as liver, butter,egg yolk and ocean fish, as well as other foods enriched with vitamin A. Retinol sources usedin infant formulae and follow-on formulae are retinol, retinyl palmitate and retinyl acetate(Infant Formulae Directive). The biological value of substances with vitamin A activity isexpressed as retinol equivalent (RE) with 1 RE equal to 1 µg all trans retinol.
The yellow pigment β-carotene found in plants is considered a provitamin of vitamin A sincehumans and other mammals are able to convert ß-carotene into retinol. The amount of 6 µg β-carotene is generally regarded to be equivalent to 1 µg RE (SCF, 1993b). However, recentstable isotopes studies in healthy human adults question this assumption (Tang et al., 2000;Hickenbottom et al., 2002). Hickenbottom et al. (2002) reported that the mean absorption oforally supplied β-carotene is only about 2%, and that only a mean 0.03 mol retinol are formedfrom one mol of β-carotene. The data available indicate a very large inter-individual variation.The rate of absorption of β-carotene and its bioequivalence to retinol in infants is unknown,thus a reliable equivalence factor for the vitamin A activity of β-carotene cannot be derivedfor infants.
Vitamin A modulates the growth and differentiation of epithelial and bone cells, serves in theform of 11-cis-retinal as an essential chromophor in retinal photoreceptors, and is required forreproduction, testosterone synthesis and the integrity of various immune functions (SCF,1993b; Dawson, 2000; Stephensen, 2001; Clagett-Dame and De Luca, 2002). After cellularuptake and binding to specific cytosolic proteins, retinol acts as the ligand and activator ofseveral nuclear receptors (retinoid A receptors alpha, beta and gamma, retinoid X receptorsalpha, beta and gamma). Thereby, retinol modulates gene expression and regulates thesynthesis of enzymes and other proteins.
2.1 Vitamin A deficiency
The first clinical sign of vitamin A deficiency is prolonged visual dark adaptation, which mayprogress to night blindness. Further clinical findings in severe vitamin A deficiency includexerosis of the conjunctiva, Bitot spots, keratomalacia and blindness, mucosal damage, dryskin and hyperkeratosis, microcytic anemia, growth failure, and increased intracranialpressure. A series of epidemiological and intervention studies in children living under poor
100
conditions have clearly documented a relationship between poor vitamin A supply andincreased rates and severity of infections as well as mortality related to infectious diseasessuch as measles (D’Souza and D’Souza, 2002).
2.2 Vitamin A excess
Signs of chronic hypervitaminosis A in infants are reported as loss of appetite, dermaldryness, loss of hair, fissuring of the corners of the mouth, bone pain, hepatomegaly,increased intracranial pressure, and failure to thrive (Fomon, 1993). Toxicity has beenreported in infants receiving daily intakes in the order of 7,200-36,000 µg per day over weeksand months (Woodard et al., 1961; Perrsson et al., 1965; Tunell et al., 1965; Mahoney et al.,1980). One death of an infant given approximately 27,000 µg retinol equivalents per day over11 days was reported (Bush and Dahms, 1984).
The tolerable upper intake level recommended by the Committee for preformed vitamin A(retinol and retinyl esters) for children 1 to 3 year old is 800 µg RE/day. The tolerable upperlevel for children is based on the value of 3000 �g RE/day for adults (the LOAEL forteratogenicity), with correction for differences in basal metabolic rate compared to adultsusing scaling according to body surface area (body weight0.75) (SCF, 2002b).
2.3 Intake with human milk
Human milk contains retinol and retinyl esters, which are effectively hydrolysed in the infantgut by the action of human milk bile salt stimulated lipase (BSSL) and pancreatic enzymes(Hernell and Blackberg, 1994). The total concentrations of preformed vitamin A in maturemilk have been reported as about 150-1100 µg/L (Gebre-Medhin et al., 1976; Jensen, 1995).Based on an assumed mean energy content of 680 kcal/L, a human milk content of preformedvitamin A of 150-1100 µg/L is equivalent to about 22-160 µg/100 kcal.
2.4 Desirable intakes
A Population Reference Intake (PRI) of 350 µg RE/day for infants 6-11 months wasrecommended by the SCF (SCF, 1993b) and some recent national recommendations (FSAI,1999; CSH, 2000; AFSSA, 2001). Recently, also higher reference intakes of 500 µg RE/dayfor infants aged 0-4 months and of 600 µg RE/day for infants aged 4-12 months have been putforward (D-A-CH Referenzwerte, 2000). There are no indications that the use of formulaecontaining vitamin A levels according to the Infant Formulae Directive would provide aninadequate vitamin A supply.
In view of the existing uncertainties as to the relative equivalence of β-carotene and retinol ininfants, the vitamin A activity in infant formulae and in follow-on formulae should beprovided by retinol or retinyl esters, while any content of carotenes should not be included inthe calculation and declaration of vitamin A activity. In this regard, the Committee notes thatthe respective regulation in the Commission Directive 96/5/EC on processed cereal-basedfoods and baby foods for infants and young children should be reconsidered.
2.5 Recommendation
The following ranges of preformed retinol or retinyl esters in infant formulae and follow-onformulae are recommended:

101
60-180 µg RE*/100 kcal
14-42 µg RE*/100 kJ* RE = retinol equivalent, 1 µg RE = 1 µg all trans retinol.It must be provided in the form of retinol or retinyl esters.
3. VITAMIN D
3.1 Description of vitamin D
The term vitamin D refers to a group of substances with anti-rachitic activity. Vitamin D3(cholecalciferol) is of animal origin and can both be supplied with the diet and be synthesisedendogenously from 7-dehydrocholesterol (provitamin D3) in the skin under exposure toultraviolet light (SCF, 1993b; Bässler et al., 2002). Vitamin D2 (ergocalciferol) is of plantorigin. Vitamin D3 and vitamin D2 have generally been considered to have equal biologicalpotency, but recent data indicate that vitamin D2 has less biological activity than vitamin D3(Trang et al., 1998; Finch et al., 1999). No data are available that would allow to calculate thebioequivalence of vitamins D3 and D2 in infants.
Vitamin D is hydroxylated primarily in the liver to 25-hydroxy-vitamin D3 (25[OH]D) whichis released into the circulation. Most of the circulating vitamin D is bound to an alpha-2globulin with a molecular weight of 60,000, vitamin D binding protein (DBP). In the kidney,25(OH)D is further hydroxylated to 1,25-dihydroxy-vitamin D (1,25[OH]2D), the biologicallymost active vitamin D metabolite which is responsible for most the effects of vitamin D,particularly with respect to calcium metabolism. The concentration of 1,25(OH)2D is subjectto various regulatory mechanisms. The synthesis and concentration in plasma are enhanced bypoor availability of calcium and phosphorus and by high concentrations of parathyroidhormone (PTH), while they are reduced by calcium and phosphorus sufficiency and by1,25(OH)2D itself. In addition to the concentration of unbound 1,25(OH)2D, the biologicaleffects are influenced by the expression of a nuclear vitamin D receptor which is modulatedby various factors, including genetic polymorphisms in the population (Jurutka et al., 2001;Rizzoli et al., 2001; Csaszar and Abel, 2001).
The major function of free 1,25(OH)2D is to increase the intestinal absorption of calcium andphosphorus, which to some extent is also achieved by 25(OH)D. In addition, 1,25(OH)2Dstimulates tubular reabsorption of calcium and phosphorus in the kidney. Thus, vitamin Dsufficiency is of particular importance during phases of rapid growth and bone mineralization,as is the case in infancy.
Vitamin D intakes are reflected by plasma or serum concentrations of 25(OH)D. Low plasmaconcentrations of 25(OH)D indicate a poor vitamin D availability, and high 25(OH)D plasmaconcentrations a high vitamin D availability or an availability that is exceeding requirements.Therefore, it is generally accepted to use 25(OH)D plasma concentrations as a marker fordefining a range of adequate vitamin D supply (endogenous and exogenous).
3.2 Hypovitaminosis D
Vitamin D deficiency causes markedly reduced intestinal absorption and renal reabsorption ofcalcium and phosphate and induces the clinical syndrome of rickets. Recently, an increasingrate of rickets in infants and young children has been reported in Europe (Pal and Shaw, 2001;

102
Brunvand and Brunvatne, 2001) and in the USA (Welch et al., 2000; Tomashek et al., 2001;Rowe, 2001; McCaffree, 2001).
3.3 Hypervitaminosis D
Signs and symptoms of hypervitaminosis D include hypercalcaemia and its consequences,such as hypercalciuria, nausea, vomiting, irritability, muscle weakness, polydipsia andpolyuria, and failure to thrive. Vitamin D is deposited in body fat stores, and overdoses canlead to prolonged liberation of high amounts from adipose tissue into the circulation (Bässleret al., 2002). Hypervitaminosis D has been observed with the bolus administration of veryhigh doses of vitamin D (Evliyaoglu et al., 2001) that had been previously used for ricketsprevention in some parts of Europe, for example until about 1990 in East Germany. However,at the current level of intakes with milk and complementary foods and with daily vitamin Dsupplements, no reports on hypervitamonosis D or toxic effects in European infants have beenfound in a literature search from 1995 to 2002.
The occurrence of hypercalcemia and hypercalciuria has been used as markers of excessivevitamin D intakes in populations. For example, surveys of the British Paediatric Association(BPA, 1956 and 1964) showed a high incidence rate of hypercalcaemia that were reported ona voluntary basis by British paediatricians, at a time when infants received vitamin D intakesin the order of 100 µg/day (4000 IU/day) (Fomon, 1993). From 1960 onwards a decline in thereported number of cases with infantile hypercalcaemia was noted, in some lose associationwith a reduction of vitamin D supply, while at the same time the reported number of caseswith rickets increased particularly in the immigrant population. The report of the BritishPaediatric Association, however, concludes: “Unfortunately the results of these surveys do notprovide a positive answer to the question of the part played by excessive intake of vitamin Din the pathogenesis of infantile hypercalcaemia nor do they indicate precisely the optimaldaily requirement of vitamin D during the first years of life” and further “It remainsspeculative whether the decrease in hypercalcaemia noted from 1960 is a consequence ofreduced vitamin D intake”.
An important consideration here is that the occurrence of hypercalcaemia and in part also ofhypercalciuria are not specific markers of vitamin D toxicity, because hypercalcaemia is notentirely due to vitamin D intake and metabolism. Hypercalcaemia may result from a variety ofother conditions, such as abnormalities of genetic (e.g. idiopathic infantile hypercalcaemia,hypocalciuric hypercalcaemia, Williams’ syndrome, metaphyseal dysplasia, adiponecrosissubcutanea, Morbus Jansen), endocrine (e.g. hyperparathyroidism, multiple endocrineneoplasia types I and II, thyroid disorders, adrenal insufficiency), pathophysiological (e.g.physical inactivity, malignant tumour) and nutritional nature (e.g. inadequate phosphorusintake). Therefore, individual case reports of hypercalcaemia, or epidemiological studies onthe occurrence of hypercalcaemia, do not allow any firm conclusions on the causal effects ofgiven vitamin D intakes and do not suffice as a basis for establishing an adequate upper level. Some systematic clinical observations of the presence or absence of adverse effects of highvitamin D intakes in infants are available that give indications on the dimension of thevitamin D dosage that may induce adverse effects in infants. Jeans and Stearns (1938)reported retarded growth in infants supplemented with 45-112 µg vitamin D/day, in additionto dietary intake. In contrast, Fomon et al. (1966) observed no adverse effects in infants ongrowth nor on serum calcium concentrations provided with 34.5-54.3 µg vitamin D/day,suggesting that the threshold for adverse clinical effects in infants might be somewhere abovean intake of 50 µg/day. In a controlled trial, Hövels et al. (1983) measured similar serum25(OH)D concentrations with supplements of either 500 (12,5 µg) or 1000 IU (25 µg) vitamin

103
D3 per day, in addition to dietary vitamin D intakes. Similarly, Houhala et al. (1985) reportedno signs of hypercalcemia or other adverse effects in infants supplemented with either 10 or25 µg vitamin D/day, in addition to dietary intakes. Vervel et al. (1997) did not find anincrease of hypercalcemia in infants receiving 25 µg vitamin D/day in addition to vitamin D-fortified formulae, relative to infants receiving 12.5 µg vitamin D/day.
Thus, no adverse effects were found in controlled studies found in infants at vitamin D intakes>25 µg/day to 54.3 µg/day (Hövels et al., 1983; Ala-Houhala et al., 1985; Vervel et al., 1997;Fomon et al., 1966), while adverse effects on growth occurred in some infants at 45-112 µgvitamin D/day in addition to dietary intake (Jeans and Stearns, 1938).
3.4 Desirable intakes
Reported levels of vitamin D in human milk are reported to be in the order of 4-110 IU/L(0,015-0,4 µg/100 kcal), with up to 10-fold higher values in the summer than in the winter(Fomon, 1993; Jensen, 1995). However, numerous case reports indicate that the human milkcontent of vitamin D does not provide full protection against the occurrence of rickets (Biser-Rohrbaugh and Hadley-Miller, 2001; Tomashek et al., 2001; Mughal et al., 1999).
The Committee determined the PRI for vitamin D for infants aged 6-11 months as 10-25µg/day (SCF, 1993b). Recent national reference intakes for infants are in the range of 7µg/day (FSAI, 1999), 5-10 µg/day (Gezondheidsraad, 2000), 10 µg/day (D-A-CHReferenzwerte, 2000), 10-15 µg/day (CSH, 2000) to 20-25 µg/day (AFSSA, 2001). Aninfant’s vitamin D supply with infant formulae and follow-on formulae in Europe currently isin the order of 7-20 µg vitamin D3/day or 280-800 IU/day. In addition to the supply withhuman milk, infants in Europe are often also supplemented with vitamin D3 as an additionalmeasure for rickets prevention, frequently with a daily dose of the supplement of 10-12.5 µgvitamin D3/day or 400-500 IU/day.
The tolerable upper intake level recommended by the Committee for infants 0-24 months ofage is 25 µg vitamin D/day. Two endpoints are used in the derivation of this value, namelyhypercalcaemia, which can be considered an adverse effect, and the serum concentration of25(OH)D greater than the upper reference level (SCF, 2002c).
The Committee is aware that vitamin D supply may become particularly critical in somepopulations of infants during the second part of the first year of life, when the volume offormula consumed as part of a progressively diversified diet is considerably lower than duringthe first months after birth. Therefore, the Committee considered it appropriate to set a highermaximum value for vitamin D contents in follow-on formulae than in infant formulae.
No conclusive evidence has come to the attention of this Committee that would allow acomparative assessment of the biological activity of dietary vitamin D3 and vitamin D2 ininfants. Therefore, it is recommended to continue to use vitamin D3 in infant formulae andfollow-on formulae, rather than vitamin D2, until such comparative data might becomeavailable.
3.5 Recommendation
The following ranges of vitamin D in infant formulae and follow-on formulae arerecommended:

104
Infant Formulae Follow-on Formulae1-2.5 µg vitamin D*/100 kcal 1-3 µg vitamin D*/100 kcal
40-100 IU vitamin D*/100 kcal 40-120 IU vitamin D*/100 kcal0.25-0.6 µg vitamin D*/100kJ 0.25-0.6 µg vitamin D*/100kJ
* Vitamin D should be supplied the form of vitamin D3 (cholecalciferol) of which 10µg is equal to 400 IU of vitamin D.
4. VITAMIN E
Vitamin E denotes all natural and synthetic derivates of tocol and tocotrienol that have thebiological activity of RRR-α-tocopherol, which differ in the position of the methyl groups intheir side chains. Vitamin E acts as a chain-breaking antioxidant in tissues and is consideredessential for the protection of unsaturated lipids in biological membranes against oxidativedamage (Traber and Sies, 1996).
The d-stereoisomer of α-tocopherol, RRR-α-tocopherol, has a high biological activity and isthe principal isomer occurring in animal tissues. Since the free alcohol form of α-tocopherol isrelatively unstable, more stable tocopherol esters are commonly used in the production ofinfant food products. Compared to 1 mg of RRR-α-tocopherol (= 1 mg α-tocopherol-equivalent, α-TE; 100% activity), the relative activity of 1 mg RRR-α-tocopherylacetate isconsidered as 91%, RRR-α-tocopheryl-hydrogensuccinate 81%, all-rac-α-tocopherol 74%,all-rac-α-tocopheryl-acetate 67%, all-rac-α-tocopheryl-hydrogensuccinate 60%, RRR-β-tocopherol 57%, RRR-�-tocopherol 10%, and RRR- -tocopherol 1% (Bässler et al., 2002).
Dietary vitamin E is absorbed in the small intestine after uptake into mixed micelles, whichrequires the presence of bile acids and pancreatic enzymes to form monoglycerides that areincorporated into micelles. Prior to absorption, vitamin E-esters need to be hydrolysed by theaction of human milk bile salt stimulated lipase or pancreatic lipolytic activity (Hernell andBlackberg, 1994). Vitamin E absorption appears to be a passive, non-saturable processwithout a specific carrier. The efficacy of absorption is reported to be in the range of 25-60%and is related to the efficacy of fat absorption (Fomon, 1993; Bässler et al., 2002). Afterabsorption, tocopherols are incorporated into triglyceride rich lipoproteins, chylomicrons andVLDL. Following triglyceride lipolysis, most circulating vitamin E is found in the cholesterolrich lipoproteins, LDL and HDL, which allow the uptake into tissues. Requirements arerelated to the number of double bonds in unsaturated lipids that are to be protected againstperoxidation (ESPGHAN, 1998). Vitamin sufficiency is considered at plasma α-tocopherolconcentrations >0.6 mg α-tocopherol/100 mL plasma or >0.7 mmol α-tocopherol/mol plasmalipids (Tsang et al., 1997).
4.1 Vitamin E deficiency
Vitamin E deficiency induces increased lipid peroxidation and elevated peroxide levels inblood and tissues. A functional test that indicates vitamin E deficiency is an increased red cellhaemolysis after exposure to hydrogen peroxide in vitro. Infants with reduced vitamin Elevels show enhanced haemolysis of red blood cells exposed to hydrogen peroxide, anaemiaand increased exhalation of ethane and pentane (Fomon, 1993; Socha et al., 1997; vanZoeren-Grobben et al., 1998). Chronic vitamin E deficiency in children with fatmalabsorption or with a genetic defect in a transfer protein induces severe and irreversibleneurological damage with spinocerebellar ataxia and muscle dysfunction (Sokol 1994; Socha

105
et al., 1997; Ouahchi et al., 1995).
4.2 Vitamin E excess
The toxicity of very high vitamin E intakes is very low (SCF, 1993b). At daily intakes ofabout 800-1200 mg vitamin E in adults, an antagonistic action against vitamin K andanticoagulative effects has been observed (Corrigan and Marcus, 1974; Elmadfa and Bosse1985; Meydani et al., 1998). At high concentrations vitamin E may act as a pro- rather than anantioxidant, which has been observed at daily intakes of 1050 mg D-α-tocopherol in humanadults (Brown et al., 1997; Kontush et al., 1996; Alessi et al., 2002). No toxicity studies areavailable in healthy term infants, although hepatic and renal lesions have been reported inpreterm infants after administration of a parenteral vitamin E preparation with additionalcomponents (Bell, 1989). On the basis of the dosages provided to preterm infants and theassumption that term infants are not more susceptible to adverse effects than preterm babies,Bell suggested that a vitamin E content of 10 mg/100 kcal in infant formula might beconsidered to induce no adverse effects (Bell, 1989).
4.3 Desirable intakes
Mature human milk contents of vitamin E are approximately 2-5 mg/L (about 0.5-1.6 mg α-TE/g PUFA) (Fomon, 1993; Jensen, 1995). The SCF set the Population Reference Intake(PRI) for infants aged 6-11 months at 0.4 mg α-TE/g PUFA (SCF, 1993b). Recent nationalreference intakes for infants are 4 mg/day (D-A-CH Referenzwerte, 2000; AFSSA, 2001) or0.6-0.8 mg/g PUFA (CSH, 2000).
4.4 Recommendation
The Committee recommends that the minimum vitamin E content should be 0.5 mg α-TE/gpolyunsaturated fatty acid expressed as linoleic acid, but in no case less than 0.1 mg per 100kJ (0.5 mg/100 kcal).
Since vitamin E requirements are considered to increase with the number of double bondscontained in the dietary fatty acid supply (SCF, 1997; ESPGHAN, 1998), the followingfactors of equivalence should be used to adapt the minimal vitamin E content to the formulafatty acid composition:
0.5 mg α-TE/1 g linoleic acid (18:2n-6)0.75 mg α-TE/1 �-linolenic acid (18:3n-3)1.0 mg α-TE/1 g arachidonic acid (20:4n-6)1.25 mg α-TE/1 g eicosapentaenoic acid (20:5n-3)1.5 mg α-TE/1 g docosahexaenoic acid (22:6n-3)
A maximum content of 5 mg α-TE/100 kcal is recommended for infant formulae and follow-on formulae.
5. VITAMIN K
Vitamin K1 (phylloquinone) is formed in the chloroplasts of green plants and found in greenplants and their fruits. Various forms of vitamin K2 (menaquinones with different side chains)are synthesised by some microorganisms, such as the gut bacteria Escherichia coli and

106
Bacteroides fragilis (SCF, 1993b). However, it is not clear to which extent vitamin Ksynthesised by the colonic microflora are absorbed and utilised by the human host organism(Suttie, 1996).
Phylloquinones and menaquinones are incorporated into mixed micelles, a process thatdepends on the availability of bile salts and lipases. They are then absorbed in the jejunum bya saturable, energy dependant mechanism. Absorption increases at lower pH-values. Theabsorption rate in newborn infants is estimated as only about 30%, in contrast to about 60-80% in adults (Bässler et al., 2002). After absorption, vitamin K is incorporated intochylomicrons and VLDL and distributed to tissues.
Vitamin K is an essential cofactor for the microsomal carboxylation of glutamyl residues to �-carboxyglutamic acid. Gamma-carboxyglutamic acid is needed for the synthesis ofprothrombin, the plasma proteins C, S and Z as well as proteins in bone, such as osteocalcin,and proteins in various other tissues (Lipkin and Kowdley, 2002).
5.1 Intake with human milk
Human milk contains low concentrations of vitamin K provided mostly by phylloquinone.These low concentrations are difficult to analyze precisely, and only limited data areavailable. Vitamin K concentrations between about 0.6 and 10 µg/L have been reported (vonKries et al., 1987; Fomon, 2001). There is general agreement that the supply with human milkdoes not suffice to meet the requirements of all young infants. Therefore, vitamin Ksupplementation in addition to the supply with breast milk is generally recommended in earlyinfancy.
5.2 Vitamin K deficiency
In newborn and young infants, vitamin K deficiency may induce a severe coagulopathy withneonatal haemorrhagic disease or a late onset bleeding, which can lead to intracranialbleeding, permanent damage, and death (Sutor et al., 1999). Infants who have an increasedrisk for vitamin K deficiency bleeding are breast fed infants, who get a far lower dietaryvitamin K supply than infants fed current formulae, and infants with lipid malassimilationeven in mild and subclinical forms (Greer, 2001).
5.3 Vitamin K excess
There is little toxicity of very high intakes of vitamin K1 and vitamin K2 (Fomon, 1993). Veryhigh vitamin K concentrations may induce DNA damage in mammalian cells in experimentalsettings (Webster et al., 2000; Morgan, 1995). Parenteral administration of pharmacologicaldoses (1-2 mg vitamin K) has been associated with a possible increase of malignancies in laterchildhood, but the evidence for an association between administration of phylloquinone toneonates and childhood cancer is not convincing (von Kries, 1998; SCF, 2003a). No adverseeffects of enteral vitamin K supply in term infants have been observed. Given that there is noevidence for risk associated with high intakes of phylloquinone in adults, no numerical uppersafe level of intake for phylloquinone has been set by the Committee (SCF, 2003a).
5.4 Desirable intakes
The Committee concluded that the human vitamin K requirement is about 5 µg/kg per day butno specific population reference intake for infants was defined (SCF, 1993b). National

107
reference intakes for infant have recently been set at 5-10 µg/day (CSH, 2000; AFSSA 2001)and at 4 µg/day for young infants 0-4 months and of 10 µg for older infants (D-A-CHReferenzwerte, 2000).
In view of the serious and life-threatening consequences of vitamin K deficiency, throughoutEurope the provision of vitamin K supplements to young infants is recommended, for infantsfed breast milk and partly also for infants fed formulae. Different forms and dosages ofadministration are used. The daily supplementation of 25 µg vitamin K2 to breast fed infantshas been found to be effective in preventing vitamin K deficiency bleeding withoutindications of any adverse effects (Cornelissen et al., 1997). The amount of vitamin Krequired to normalise prothrombin levels in newborns has been estimated as 3-5 µg/day(Olson, 1984). The levels of vitamin K supplied with current infant formulae (4 µg/100 kcal)suffice to provide an effective protection against vitamin K deficiency, while there are noindications of adverse effects (Suzuki et al., 2001).
5.5 Recommendation
The following ranges of vitamin K in infant formulae and follow-on formulae arerecommended:
4-20 µg vitamin K1/100 kcal
1-5 µg vitamin K1/100 kJ
108
VII. WATER-SOLUBLE VITAMINS
1. INTRODUCTION
1.1 Objective
To provide a minimum level of each vitamin in the formula, which when consumed in normalamounts will ensure that the infant is able to grow and develop normally and not be at risk ofdeveloping an inadequate nutritional status.
To ensure that the maximum level of each vitamin in the formula, which when consumed innormal amounts will ensure that the infant is not exposed to the risk of an excess.
1.2 Background
In the First Report on the Essential Requirements on Infant Formulae and Follow-up Milksbased on cows’ milk protein (SCF, 1983) minimal composition requirements were defined forwater-soluble vitamins, but no maximal levels were set. However, it was determined that thefood for neonates and young infants should not only supply them with all the materials andenergy needed for growth and for the development of various tissues, but also be capable ofbeing metabolized and anything given in excess to be eliminated. A reasonable safety marginshould be selected to allow for further possible reduction in their tolerance in the event ofillness and possible errors made by the parents in the preparation of bottle feeds. The averagecomposition of human milk was taken as determining the composition of breast-milksubstitutes, allowing for the variability in composition, but no allowance was made for thevariability in the needs amongst infants. Where maximal levels were defined they werechosen to be 2 to 3 times the minimum values. A Table of minimum values was drawn up,and this has remained unchanged since.
Values for Population Reference Intakes (PRI) for nutrient and energy intakes for theEuropean Community were published in 1993, as part of a more general determination of theenergy and nutrient needs of the population (SCF, 1993b). This document contained estimatesof the amounts of vitamins which would need to be consumed by the general population inorder to cover the needs of the majority of the population. This document included PRI forinfants. Thus the PRI are greater than the average needs of the population by a margin(usually in the region of plus 2 SD) to allow for those with especially high needs.
The current document has drawn upon the data available in the literature, together withreviews and interpretations (Dietary Reference Values for food energy and nutrients for theUnited Kingdom, 1991; Nutrient and Energy intakes of the European Community, 1993b;Bates and Prentice, 1994; LSRO, 1998). To a considerable extent all of these reports draw onthe same base of information which is generally inadequate. They adopt varying approachesto their interpretation of these data.
The amount of a nutrient available from a formula should be adequate to prevent a deficiencyand at least equivalent to that normally present in human milk. In the absence of alternativeapproaches, most usually the content of water-soluble vitamins in human milk has been usedin making a judgement on the needs of the infant, based upon the intake of infants beingbreast-fed by normal mothers of adequate nutritional status. Although it may be desirable to

109
be able to identify other functional outcomes of direct relevance to health, the data are seldomavailable to enable this assessment. The composition of human milk is variable and dueaccount has to be made of intrinsic biological factors which contribute to this variability, andalso analytical factors which vary amongst studies. The biological availability may vary,depending upon whether the nutrient is bound or free, and the particular form in which thenutrient is normally present in human milk.
Given the intrinsic difference amongst women and their infants, it remains unclear whetherthe minimum content of infant formula should represent the mean for a population (Beaton,1985) or the approach adopted in the derivation of PRI, for example, in which some notionalvalue is selected which is adequate to cover the presumed needs of the entire population(mean +2 SD). If the value selected for the minimum content of infant formula was equivalentto the mean consumption observed within a population of infants being fed human milk, thenthose infants which normally consume milk from their own mother with a higher nutrientcontent would, while consuming an infant formula, be receiving less than they would havefrom human milk. It is possible that their needs were not being met. Therefore, in order toensure that no infant received less of a nutrient than they would if they were consuming themilk from their own mother it would be necessary to provide an amount greater than themean. This is the approach adopted in setting the PRI. Therefore, the minimum content ofwater-soluble vitamins present in a formula should be, at least, the PRI for that nutrient (notthe average content in human milk).
The LSRO (1998) identified an upper desirable limit for the vitamin content of infant formula.This upper desirable limit was selected as the maximum content of any particular vitaminfrom those formulations which were currently available on the market (often up to 4 times theminimum). One important factor which will determine the upper level of a vitamin within anyinfant formula is the level of that vitamin in the cows’ milk from which the formula has beenderived (Fomon and Ziegler, 1989). This approach to setting an upper desirable limit does nothave any sound biological basis, but is based upon a history of apparently safe use. There maybe considerable difference in the water-soluble vitamin content of human milk compared withcows’ milk, by a factor as high as 10 fold, for example for riboflavin (Wharton, 1989). Thus,basing the recommendation of a maximum level on what is currently observed in marketedproducts is not of itself a secure basis for setting an upper limit. As human milk is superior toinfant formula as a source of nourishment for young infants (Howie et al., 1990; Forsyth etal., 1993), it should not be presumed that improvements cannot be made to the currentcomposition of formulae. Therefore, it is suggested that if an arbitrary approach is to beadopted it should err on the side of caution.
Those components taken in the diet which cannot be utilised or stored by the body have to beexcreted, often as solutes in the urine. In the infant, the water available to form urine islimited, and therefore the need to excrete any additional solutes will reduce the margin ofsafety, especially under conditions of stress, such as during fever or diarrhoea or especiallyduring weight loss (Fomon and Ziegler, 1989). As there is no particular physiologicalrequirement for excessive amounts of water-soluble vitamins for infants and young children,any excess would have to be excreted. For infant formula, a differentiation should be drawnbetween the natural presence of a nutrient and that which is added either for technologicalreasons or to allow for losses incurred during shelf life. For most nutrients the evidence is notstrong with which to enable a judgement on the upper limit which would carry an increasedrisk. Tolerance will vary amongst individuals, with age and other circumstances. However,once adequate allowance has been made to ensure that the normal requirements have beenmet, a reasonable margin of safety based upon the amount normally present, would not be

110
expected to require an intake in excess of two to five times the requirement, unless there isclear evidence to justify an alternative. Nutrients added for technological reasons would notbe expected to be present in amounts greater than five times the requirement, without clearevidence to justify an alternative.
The effect of the previous considerations would be to increase the minimum level from thatwhich is currently set. For some water-soluble vitamins there is no strong evidence to indicatea special risk in providing greater amounts in the diet than those required for normalphysiological function. However, the risk of any adverse effects will increase if intakes inexcess of the physiological needs are continued over time, although the intake at which agiven individual might develop adverse effects can not be known with certainty. As there isno known health benefit in providing a substantial excess and there are no scientificevaluations in infants, an upper limit between three and five times the requirement has beenproposed for those vitamins where there is reasonable evidence of potential adverse effects,via niacin, pyridoxal, folic acid and ascorbic acid. For these four vitamins an estimate wasmade of the intake for an infant with a weight of 5 kg consuming a formula with an energycontent of 500 kcal (100 kcal/kg body weight per day). This was compared with a judgementof the daily upper limit for that vitamin, based upon the daily upper limit which has beendefined for 1-3 year olds (for niacin, pyridoxal and folic acid: SCF, 2002a, 2000a and 2000b;and for ascorbic acid: FNB, 2000a), on the assumption that for an infant up to 6 months of agethe upper limit would be one third that for a 1 to 3 year old. Thus, although an upper limit offive times the requirement falls below the estimated safe upper limit for niacin and pyridoxal,this is not so for folic acid and ascorbic acid. Using these criteria for folic acid and ascorbicacid, an upper limit of two to three times the requirement would be more appropriate. For theothers it would be undesirable for the product to contain more than five times the requirementas a matter of course.
There are a number of approaches which have been used for assessing the adequacy of avitamin (Fidanza, 1991):
- Under normal circumstances the absorption of water-soluble vitamins through thegastrointestinal tract is effective. For most, there are only modest, or no reserveswithin the body. Thus levels of consumption in excess of requirements are usuallyabsorbed with any excess appearing in the urine. Therefore, the level of excretion ofan oral load in urine is often used to assess body status. If a substantial proportion ofan administered dose is retained then it is presumed that the body was previouslydeficient in that vitamin. Conversely, if a substantial proportion is excreted then it ispresumed that the body is replete. These conclusions assume a normal capability toabsorb, metabolise and excrete the vitamin.
- Measurement of the concentration of vitamin in a transport pool in the bloodcompartment, usually in plasma or serum, but sometimes in red cells or white cells.
- If there is a storage pool which can be sampled, an assessment of the reserves.
- Many, if not all, water-soluble vitamins have metabolic functions which include actingas cofactors for enzyme catalysed reactions. An assessment of the activity of the holoenzyme, and its stimulation by the addition of the exogenous cofactor, can be used as afunctional measure of vitamin status. For example, the activity of erythrocyteglutathione reductase activity (EGRAC) with and without added exogenous riboflavinhas been used to assess functional riboflavin status.

111
- For any of these measures the response to a loading test with the vitamin, gives ameasure of the extent to which the concentration might be increased or functionenhanced in the presence of additional vitamin.
There is evidence that a number of the water-soluble vitamins can be synthesised by thenormal metabolic activity of the colonic microflora. The extent to which any vitaminsynthesised in this way might be available to the host, thereby contributing to overall status, isnot clear and generally it has been assumed that this potential route is unlikely to be offunctional significance.
In this chapter the following approach has been used:
- There is a brief overview of each vitamin;
- There is a comment on Assessment of Nutrient Requirements for Infant Formulae(ANRIF) (LSRO, 1998); and
- There is a brief review of recent literature in relation to the PRI.
A recommendation is made on the minimum level in infant formula and a maximum levelexpressed as the prudent guidance level in g/100 kcal (g/100 kJ). The figures proposed arebased upon an infant of 5 kg, with an energy intake of 500 kcal/day, that is a volume of intakeof 750 mL/day of a formula containing 67 kcal/mL.
2. THIAMINE, B1
Thiamine is a water-soluble compound made up of pyrimidine and thiazole nucleus linked bya methylene bridge (relative molecular mass, MM, 300.84). It is heat stable, but is destroyedrapidly at pH <5.5. It is available as the mononitrate and hydrochloride.
As the body stores are low a regular intake is required. Large doses are poorly absorbed, andberi-beri develops when habitual intake is less than 0.2 mg/1000 kcal.
Status has been assessed by:
- activation coefficient of erythrocyte transketolase (EGRAC);
- urinary excretion before and after loading dose; and
- blood levels.
Thiamine is well absorbed in the jejunum through a saturable, carrier mediated system, andintracellular phosphorylation leads to metabolic trapping. At high concentrations absorptionmay take place at a slower rate through passive diffusion with a maximum rate of absorptionof 8-15 mg/day.
At high intakes any excess is rapidly cleared by the kidney and excreted in urine.
In its active co-enzyme form thiamine pyrophosphate plays an integral part in carbohydrate

112
metabolism, specifically, the oxidative decarboxylation of α-keto acids and pyruvate and theactivity of transketolase in the pentose pathway. It is also involved in decarboxylation ofbranched chain amino acids, and possibly has a direct effect in nerve conduction.
Deficiency may present as infantile beri-beri. Thiamine deficiency has also associated withsudden infant death syndrome and megaloblastic anaemia.
2.1 Milk content
Classical beri-beri has not been reported for infants of healthy well nourished mothers andtherefore it can be assumed that the thiamine content of human milk from healthy women isadequate for an otherwise healthy term infant.
In human milk, Fomon and McCormick (1993) report that for mature milk thiamine content is154 to 328 µg/L (23 to 35 µg/100 kcal). In their review of 8 human studies Bates and Prentice(1994) report 170 µg/L (25 µg/100 kcal) for milk from healthy women. The thiamine contentduring early lactation has been reported as 20-133 µg/L (3 to 20 µg/100 kcal) (Nail et al.,1980; Dostalova et al., 1988), and for mature milk as 200 µg/L (30 µg/100 kcal) (Picciano,1995). Fomon and McCormick estimate mean ±1SD was 112-217 µg/L (for many infantsintake less than 160 µg/day [32 µg/100 kcal]).
The thiamine content of pasteurized whole cows’ milk has been reported to be 370-460 µg/L(55 to 68 µg/100 kcal) (LSRO, 1998).
2.2 Existing regulations and recommendations
There have been few studies to establish the requirements for thiamine during infancy.Balance studies were carried out in 7 infants aged 1 to 10 months at ranges of intake from 140to 200 µg/day, and no evidence of deficiency was identified (Holt et al., 1949).
In 1985 the Center for Food Safety specified that infant formulae should not contain less than40 µg/100 kcal of thiamine (FDA, 1985). For an infant up to six months of age, the RDA forthiamine is 300 µg/day (60 µg/100 kcal for a 5 kg infant consuming 100 kcal/kg/day) (FNB,1989).
The LSRO Expert Panel recommended a minimum thiamine content in infant formulae of 30µg/100 kcal. The LSRO Expert Panel considered the adequacy of thiamine intakes byexclusively breast-fed term infants as the primary evidence to support its recommendations.The Expert Panel based its recommendations on the knowledge that thiamine concentrationsincrease from the early stages of lactation to a mean of 200 µg/L (30 µg/L, range 23 to 35µg/L) in mature milk and on the absence of evidence to indicate that thiamine deficiencyoccurs in exclusively breast fed infants from well nourished mothers. An intake of 0.75 L/dayof human milk containing 200 µg/L of thiamine would provide a thiamine intake of about 150µg/day which is equivalent to 30 µg/100 kcal for the 5 kg infant consuming 500 kcal/day. TheLSRO Expert Panel found no reason to suspect that the formula-fed infant has a greaterthiamine requirement than the infant fed human milk.
There is no clearly defined toxicity from excess consumption of thiamine. The LSRO ExpertPanel recommended a maximum content of thiamine in infant formula of 200 µg/100 mLbased on the 90th centile of FDA analysis of currently marketed infant formulae.

113
Within the EU the Infant Formula Directive specifies that the minimum thiamine content ofinfant formulae should be 40 µg/100 kcal. No maximum has been set.
For infants aged 6-11 months the PRI set by the Committee is 0.3 mg/day (SCF, 1993b). Dueto the lack of systematic oral dose-response studies and the low toxicity, the Committee didnot set a numerical tolerable upper intake level (SCF, 2001b).
2.3 Recommendation
The Committee makes the following recommendation on the thiamine content of infantformulae and follow-on formulae: minimum 60 µg/100 kcal, maximum 300 µg/100 kcal.
3. RIBOFLAVIN, B2
Riboflavin is a water-soluble vitamin that functions primarily as a component of two flavinco-enzymes flavin mononucleotide (FMN) and flavin adenine dinucleotide (FAD) (MM376.36). It is widely distributed in nature, and is a permitted food colour. Riboflavin is stablewhen dry but deteriorates rapidly in alkaline solution, with deterioration being accelerated bylight. It leaches into cooking water, and with pasteurization the losses are about 20%.
Riboflavin is readily absorbed from small intestine, through a special transport mechanisminvolving phosphorylation to flavin mononucleotide. Little riboflavin is stored in the body,and urinary excretion reflects recent dietary intake and saturation of tissue stores.
FMN and FAD have widespread role in range of biochemical reactions, as components ofseveral enzymes that catalyse many oxidation/reduction reactions in numerous metabolicpathways. They are required for lipid degradation, synthesis of steroids and glycogen,metabolism. They help maintain integrity of mucous membranes, skin, eyes and nervoussystem. They have important interactions with iron metabolism.
A deficiency of riboflavin leads to symptoms which are widespread, but non-specific. There isdegradation of riboflavin when newborns are exposed to phototherapy, and in prematureinfants the absorptive capacity is reduced and stores are especially low at birth.
Virtually non-toxic when given orally, excess excreted in urine.
Assess status: EGRAC, blood or urine concentration.
3.1 Milk content
The reported riboflavin content of mature human milk varies widely, from 274 to 580 µg/L(41 to 87 µg/100 kcal) (Thomas et al., 1980; Nail et al., 1980; Dostalova et al., 1988;Roughead and McCormick, 1990). Bates and Prentice (1994), calculate a mean of 380 µg/L(57 µg/100 kcal), from 10 studies in Western countries. Methodological problems withanalyses may lead to under-estimate, and using state of the art methodologies for the totalriboflavin content of human milk Roughead and McCormick (1990), estimate mean 570 µg/L(85 µg/100 kcal). Picciano (1995) suggest typical values for human milk are likely to bearound 400 to 600 µg/L (60 to 90 µg/100 kcal).
The riboflavin content of cows’ milk is variable with season, breed etc. For pasteurised milk,

114
a value of 914 µg/L (136 µg/100 kcal) is considered typical, but values as high as 1,900 µg/Lhave been reported (LSRO, 1998).
Greene et al. (1990) compared biochemical indices of term (68) and pre-term (14) infants fedhuman milk or infant formula. Serum riboflavin concentrations of human milk fed infantswere lower at all time periods (up to 112 days postpartum) compared with those fed formula.It cannot be determined whether there were any functional implications associated with thisdifference. Bamji et al. (1991) provided biochemical evidence of impaired riboflavin status ofexclusively breast fed infants. Of 55 infants fed only human milk, 19 (35%) had elevatedEGRAC index. The riboflavin concentrations in the milk were at the lower end of the rangereported in the literature (221 µg/L, 33 µg/100 kcal: methodologically may have been anunderestimate in women of low socio-economic group.)
3.2 Existing regulations and recommendations
In 1985, in the USA the Code of Federal Regulations specified a lower limit for riboflavin of60 µg/100 kcal (FDA, 1985). In 1989 the RDA for riboflavin was set at 400 µg for infants upto 6 months of age (80 µg/100 kcal for a 5 month old infant consuming 100 kcal/kg/day).Based upon this the recommended minimum riboflavin content in infant formulae is 80µg/100 kcal.
The LSRO Expert Panel concluded a maximum riboflavin content in infant formulae of 300µg/100 kcal based on the 90th centile of the FDA analyses of infant formula.
Within the EU the Infant Formulae Directive specifies that the minimum riboflavin content ofinfant formulae should be 60 µg/100 kcal. No maximum has been set.
The PRI for infants aged 6-11 months set by the Committee for riboflavin is 0.4 mg/day(SCF, 1993b). The Committee did not set a numerical tolerable upper intake level (SCF,2000c).
3.3 Recommendation
The Committee makes the following recommendation on the riboflavin content of infantformulae and follow-on formulae: minimum 80 µg/100 kcal, maximum 400 µg/100 kcal.
4. NIACIN, B3
Niacin is the generic form for nicotinic acid (pyridine 3-carboxylic acid), nicotinamide(nicotinic acid amide) and the co-enzyme forms of the vitamin (NAD and NADP). Pyridinenucleotides activate many dehydrogenases and are essential for electron transport and othercellular respiratory reactions. Niacin is stable in foods and is not destroyed by heat orprolonged storage.
Humans are able to synthesise niacin de novo from tryptophan, therefore the niacin content offoods is expressed as niacin equivalents (preformed niacin plus 1/60th of amount oftryptophan).
Niacin is rapidly absorbed by carrier mediated mechanism at low concentrations and bypassive diffusion at higher concentrations. It circulates in plasma in a bound form and enters

115
tissues by passive diffusion, where it is fixed as pyridine nucleotides. It is taken into red cellsby an anion-transport system and accumulates at high concentration.
A deficiency of niacin leads to characteristic skin changes, known as pellagra; and mayinclude gastrointestinal symptoms and central nervous symptoms. In adults nicotinic acid hasbeen used in the treatment of hypercholesterolaemia and dose related adverse effects havebeen reported. Flushing is the most common side effect and can occur at relatively low doses(Rader et al., 1992). Chronic toxicity, in the form of hepatotoxicity, hyperglycaemia,hyperuricaemia and adverse ophthalmological effects, has been reported frequently, followingtherapy with nicotinic acid over extended periods of time. There are no reports of acutetoxicity with nicotinamide, but high doses over longer periods of time have been associatedwith liver dysfunction.
4.1 Milk content
The concentration of niacin in human milk is much higher than in cows’ milk. The FNB givethe typical daily secretion of preformed niacin as being 1.0 to 1.3 mg in 750 mL (FNB, 1989).Picciano (1995) cited a range of 1100 to 2300 µg/L of niacin (164 to 343 µg/100 kcal). About70% of NEs in human milk are derived from tryptophan (Schanler, 1989). The total niacin incows’ milk (preformed plus NE from tryptophan), is in the range 710 to 1300 µg/L (106 to194 µg/100 kcal) (Jensen, 1995). There are no studies which provide specific data from whichniacin requirements might be derived.
4.2 Existing regulations and recommendations
As recommended by the Committee on Nutrition of the American Academy on Pediatrics inits 1983 report to the FDA (1985), the USA Code of Federal Regulations specifies that infantformula contain a minimum level of 250 µg preformed niacin/100 kcal: no maximum value isspecified. The 1989 RDA for niacin is expressed in niacin equivalents: 5 mg NE/day for theinfant from birth to 6 months of age (1 mg/100 kcal for a 5 kg infant consuming 100kcal/kg/day) (FNB, 1989).
The LSRO Expert Panel recommended a minimum niacin content in infant formulae of 550µg/100 kcal. The Expert Panel recommended a maximum niacin content in infant formulae of2000 µg/100 kcal based on the 90th centile of the FDA analyses of infant formulae.
Within the EU the Infant Formulae Directive specifies that the minimum niacin content ofinfant formulae should be 800 µg/100 kcal. No maximum has been set.
The PRI for niacin for infants aged 6-11 months set by the Committee is 5 mg/day (SCF,1993b). The Committee choose a tolerable upper intake levels for children 1-3 years of 2mg/day for nicotinic acid and of 150 mg/day for nicotinamide (SCF, 2002a).
4.3 Recommendation
The Committee makes the following recommendation on the naicin content of infant formulaeand follow-on formulae: preformed niacin as nicotinamide, minimum 300 µg/100 kcal,maximum 1200 µg/100 kcal.

116
5. PANTOTHENIC ACID, B5
Pantothenic acid is formed from pantoic acid and β-alanine. It is a biological component ofCo-enzyme A, and widely found in virtually all living cells. Pantothenic acid is freely solublein water, stable in neutral solution, but unstable to acids, bases and heat. Supplements ofpantothenic acid are available as the calcium salt or the alcohol, which are more stable, highlysoluble in water and rapidly converted to the free acid in the body.
Pantothenic acid is absorbed through a saturable sodium dependent mechanism, and bypassive diffusion at higher concentrations. Its biological availability from food might be only50% that of pure vitamin based upon patterns of urinary excretion (Tarr et al., 1981). It istransported around body to tissues primarily as bound forms in erythrocytes.
Pantothenic acid is essential for the function of Co-enzyme-A and the majority of tissuestransport the compound into cells through an active sodium co-transport mechanism. Itperforms multiple roles in cellular metabolism and in the synthesis of many essentialmetabolites. Urinary excretion is highly correlated with dietary intake.
A deficiency of pantothenate is said to be extremely rare, but deficiency has been associatedwith burning feet syndrome.
Pantothenate appears to have important interactions with other nutrients.
Supplementation with thiamine (5 mg) or riboflavin (5 mg) might increase mean serum andurinary excretion of pure pantothenic acid in adults (Koyangi et al., 1969).
Animal studies suggest a possible sparing action of B12 on the basis that they may share acommon carrier mediated transport system in a number of tissues.
In guinea pigs there may be a beneficial interaction with ascorbic acid.
5.1 Milk content
The mean concentration of pantothenic acid in human milk has been reported as 6.7 mg/L (1mg/100 kcal) (Johnston et al., 1981); the mean minus 1 SD as 1.9 mg/L (284 ug/100 kcal)(Song et al., 1984); and the range as 2 to 2.5 mg/L (269 to 552 µg/100 kcal) (Picciano, 1995);and 0.48 to 2.45 mg/L (269 to 552 µg/100 kcal) (Plesofsky-Vig, 1996). The differences havebeen attributed to maternal dietary variation, or analytical approaches.
For pasteurized whole cows’ milk the range has been reported as 3100 to 3600 µg/L (465 to530 µg/100 kcal (Jensen, 1995).
Other than the content in milk, there is no other basis for deriving an estimate of the dietaryrequirement for pantothenic acid as there are no satisfactory indices of pantothenate status.Urinary excretion reflects dietary intake, and for adults an excretion below 1 mg/day has beenconsidered inadequate. Therefore best estimates have been based on consumption of breastfed infants, because there are no reports of deficiency in infants who are breast-fed byadequately nourished mothers.

117
5.2 Existing regulations and recommendations
Infant formulae in the USA should contain a minimum level of 300 µg/100 kcal ofpantothenic acid (FDA, 1985). The estimated safe and adequate daily dietary intake asestablished by the FNB is 2000 µg/day (400 µg/kg or 400 µg/100 kcal for the 5 kg infantconsuming 500 kcal/day).
The LSRO Expert Panel recommended maintaining the minimum content of pantothenic acidin infant formulae at 300 µg/100 kcal. Based on mean minus 1SD for levels in human milk(1.9 mg/L, 284 µg/100 kcal), which was rounded off to 300 µg/100 kcal.
The LSRO Expert Panel recommended a maximum content of 1200 µg/100 kcal based on the90th centile of the FDA analyses of infant formulae.
Within the EU the Infant Formulae Directive specifies that the minimum pantothenate contentof infant formulae should be 300 µg/100 kcal. No maximum has been set.
The Committee did not set a PRI for pantothenate (SCF, 1993b). Owing to the lack ofsystematic oral dose response studies and the very low toxicity of pantothenic acid, theCommittee did not derive a numerical tolerable upper intake level (SCF, 2002d).
5.3 Recommendation
The Committee makes the following recommendation on the pantothenic acid content ofinfant formulae and follow-on formulae: minimum 400 µg/100 kcal, maximum 2,000 µg/100kcal.
6. PYRIDOXINE, B6
Pyridoxine embraces a group of chemically related compounds including pyridoxamine andpyridoxal which are found in animal products and pyridoxine which is found in plants. Allforms are taken up from small intestine and converted to pyridoxal phosphate in tissues. Aproportion of vitamin B6 in plant-based foods is biologically unavailable because it is presentas pyridoxine glycosides that are not hydrolysed by intestinal enzymes. All three forms arereadily soluble in water, light sensitive and relatively heat stable in acid medium, but heatlabile in alkaline medium. Pyridoxine hydrochloride, the most heat stable form, is used tofortify infant formulae.
Pyridoxine requires riboflavin, zinc and magnesium for its normal function. Pyridoxinedeficiency may result in low blood levels of vitamin C, increased excretion of calcium, zincand magnesium, and reduced copper absorption.
Vitamin B6 stored in liver with about 50% being present in muscle bound to glycogenphosphorylase. Pyridoxal phosphate acts as a co-enzyme in the metabolic transformation ofamino acids, decarboxylation, transamination and racemization, the metabolism of lipids andnucleic acids and in glycogen metabolism. The metabolism of vitamin B6 is strongly alteredin premature infants (Zempleni, 1995).
Pyridoxine is primarily absorbed in the jejunum by a non-saturable, passive process and istransported in the plasma bound to albumin.

118
The dietary requirement for pyridoxine varies in relation to the dietary consumption of protein(Hansen et al., 1996).
There was an outbreak of pyridoxine related convulsive seizures in early 1950’s, which wasassociated with an hypochromic microcytic anaemia, vomiting, diarrhoea, failure to thrive,listlessness, hyper-irritability, seizures. The concentration of pyridoxine in the formulaassociated with the symptoms was on average 62 µg/L (9.2 µg/100 kcal; 4.1 µg/g protein),compared with 92 µg/L (13.7 µg/100 kcal; 5.6 µg/g protein) in the formula that was notassociated with symptoms (Borschel, 1995).
6.1 Milk content
The pyridoxine content of milk increases as the maternal intake of the vitamin increases andcorrelates with measures of pyridoxine status, which in turn is affected by stage of lactation,length of gestation and oral contraceptive use. The pyridoxine content of human milkincreases over the course of lactation (LSRO, 1998). In mature milk the concentration mayvary from 70 to 310 µg/L (10.4 to 46.3 µg/100 kcal), and in their summary Bates and Prentice(1994) estimated that for 17 studies in unsupplemented women the pyridoxine content was150 µg/L (22 µg/100 kcal). The primary form of pyridoxine is pyridoxal, 81%, and pyridoxalphosphate, 7%.
For cows’ milk the range is range 400 to 650 µg/L (60 to 97 µg/100 kcal), of which pyridoxalis 80% and pyridoxamine 20% (LSRO, 1998).
The possibility that breast fed infants might have marginal, poor of deficient pyridine status isreviewed in LSRO (1998). Indices of pyridoxine status tend to be lower in breast-fed thanformula-fed infants. Biochemical evidence of marginal pyridoxine status has been reported ininfants breast-fed by mothers having intakes less than 2 mg/day, and whose milk providedless than 100 µg/day. The pyridoxine content of mother’s milk, and the intakes of infants,parallelled the level of maternal supplementation from 2 to 27 mg/day. Infants of motherswho take daily supplements containing 10 to 27 mg pyridoxine hydrochloride, have intakes of160 to 280 µg/day (24 to 42 g/100 kcal), and appear to have adequate pyridoxine status, withincreased levels of pyridoxal phosphate in plasma and a decrease in the stimulation index forerythrocyte alanine amino transferase (Kang-Yoon et al., 1992; Kang-Yoon et al., 1995). Theprotein content of mature human milk is about 10.6 g/L. A pyridoxine intake of 50 µg/dayshould be adequate in preventing deficiency symptoms in most exclusively breast fed infantsbelow 6 months of age, based upon minimum pyridoxine intake of 5.56 µg/g protein and anaverage milk consumption of 0.75 L/day (Borschel, 1995).
A formula providing 5.56 µg pyridoxine/g protein was sufficient in preventing convulsions inmost young infants, whereas 4.13 µg/g protein was not sufficient in preventing deficiencysymptoms in all infants (Borschel, 1995). Most standard formulae provide 14.2 to 18.0 g/Lprotein, with some formulae providing up to 22 g/L. Based on the highest level of protein andan average formula intake of 0.75 L/day, a pyridoxine intake of 104 µg/day should besufficient in maintaining optimal pyridoxine status in these infants (Borschel, 1995). Thepyridoxine content of most infant formulae is around 400 µg/L, or higher (~60 µg/100 kcal).Therefore, formula-fed infants consuming 0.75 L/day would consume greater than 300 µg/daypyridoxine (Borschel, 1995).
It has been concluded that a pyridoxine intake of 50 µg/day by breast-fed infants or 104

119
µg/day by formula-fed infants appears to prevent biochemical indicators of reduced status,according to Borschel (1995). However, an intake of 160 µg/day may be needed to reducebiochemical evidence of marginal pyridoxine status for most infants aged four to six months,based upon the evidence of Kang-Yoon et al. (1992). On this basis the mother would have tohave an intake greater than 10 mg/day, to ensure that the infant fed human milk achieved apyridoxine intake of 100 µg/day.
Although pyridoxine toxicity has not been reported for infants, there is some evidence foradverse effects in adults taking higher doses in the region of 150 to 200 mg/day.
6.2 Existing regulations and recommendations Based on the Committee on Nutrition of the American Academy on Pediatricsrecommendations (1985), the USA Code of Federal Regulations specifies that infant formulacontain no less than 35 µg/100 kcal of pyridoxine, but does not specify a maximum level(FDA, 1985). Further, because pyridoxine is involved in protein metabolism, and therequirement is related directly to the level of protein in the diet, pyridoxine should be presentat a level of at least 15 µg for each g protein in excess of 1.8 g protein per 100 kcal of infantformula. Thus, the minimum content recommended for pyridoxine in infant formulae is 30µg/100 kcal.
Although deficiency manifestation have not been reported in infants fed formulae providing100 µg pyridoxine per L (15 µg/100 kcal for a 5 kg infant consuming 100 kcal/kg/day), anintake of 130 µg/day (26 µg/100 kcal for a 5 kg infant consuming 100 cal/kg/day), may berequired to achieve adequate pyridoxine status. The value of 26 µg/100 kcal was rounded to30 µg/100 kcal. At the recommended maximum protein content in infant formulae (3.4 g/100kcal) a pyridoxine content of 30 µg/100 kcal results in an intake level of 8.8 µg pyridoxine/gprotein, which is well above 5.6 µg/g estimated as necessary to prevent deficiency.
The LSRO Expert Panel recommended a maximum content of pyridoxine in infant formulaeof 130 µg/100 kcal based on the 90th centile of the FDA analyses of infant formulae.
Within the EC the Infant Formulae Directive specifies that the minimum pyridoxine contentof infant formulae should be 35 µg/100 kcal. No maximum has been set.
The PRI for infants aged 6-11 months set by the Committee for pyridoxine is 0.4 mg/day(SCF, 1993b). However, as noted above there are data which indicate that a lower intake isacceptable for normal function. For children aged 1-3 years, the Committeed has set atolerable upper intake level of 5 mg/day (SCF, 2000a).
6.3 Recommendation
The Committee makes the following recommendation on the pyridoxine content of infantformulae and follow-on formulae: minimum 35 µg/100 kcal, maximum 165 µg/100 kcal.
7. FOLATES
Folate is a general term for compounds that have a common vitamin activity and includes thesynthetic form of the vitamin folic acid (pteroyl glutamic acid, PGA) and a wide variety ofderivatives. Folic acid, the synthetic form, is not present in nature and has about twice the
120
activity of natural folates.
Pteroyl glutamic acid consists of three subunits, pteridine, p-aminobenzoic acid and glutamicacid, and has a molecular mass of 441. It is odourless and tasteless, and is virtually insolublein water, alcohol, acetone, chloroform, and ether; but is soluble in hydrochloric acid andsulphuric acids. The disodium salt is freely soluble. Aqueous solutions are heat sensitive anddecompose rapidly in the presence of light. The derivatives of PGA are predominantly presentin the body and foods as reduced folates, with variable numbers of glutamate residues.
Folate-deficiency has not been identified in breast-fed infants, even in those with folatedeficient mothers.
The majority of folate is absorbed within the proximal small intestine, following hydrolysis ofpolyglutamates to monoglutamate. Folate monoglutamates are transported by energydependent carrier mediated processes. Non-saturable, passive diffusion occurs at highintraluminal concentrations. Folate monoglutamates are the main circulating and transportforms, with polyglutamates being the main intracellular forms.
Folate is functionally important for one carbon transfer reactions, including those involved inamino acid metabolism (serine/glycine and homocysteine/methionine interconversion), purineand pyrimidine synthesis, and the formation of the primary methylating agent, S-adenosylmethionine (SAM).
Folate deficiency is associated with a reduction in de novo DNA biosynthesis and thusimpairment of cellular replication: recognised haematologically as macrocytic anaemia. Poorfolate status in the periconceptual period has been associated with increased risk of neuraltube defects in the offspring. Poor folate status may lead to hyperhomocysteinaemia, whichhas been associated with and increased risk of vascular disease.
Excess dietary folate tends to be excreted in the urine rather than stored in the body.Consumption of high levels of folic acid has been associated with increased risk ofneurological damage in older adults caused by masking B12 deficiency.
7.1 Milk content
A wide range of folate concentrations have been reported in human milk, from 24-141 µg/L(3.8 to 20.9 µg/100 kcal) (LSRO, 1998), in part due to the difficulties in reliably determiningthe folate content of milk, uncertain storage methods, in part due to sampling differences andpossibly to inherent differences amongst women (Bates and Prentice, 1994). For pasteurizedcows’ milk, the folate concentration has been reported to range from 50 to 60 µg/L (8.0 to 9.5µg/100 kcal) (LSRO, 1998).
Salmenpera et al. (1986) followed 200 infants of healthy well-nourished mothers, all of whomwere given a folate supplement (0.1 mg/day). In infants fed a formula containing 35 µg/L (5µg/100 kcal, FAO/WHO recommended level), 69 to 94% had plasma folate levels below thelowest levels for the breast-fed infants. Those infants weaned earliest had the lowesthaemoglobin concentrations and highest MCV at 9 months of age. The authors concluded thatinfants fed the recommended level were at risk of developing folate deficiency.

121
7.2 Existing regulations and recommendations
The folate requirement established by the Joint FAO/WHO Expert Group (1970) was 5 µg/kgbody weight, but was based on very limited data.
The regulations in the USA specified the minimum folic acid in infant formulae as 4 µg/100kcal (FDA 1985), based upon the Committee on Nutrition of the American Academy onPediatrics (1985). There was no maximum identified.
The recommendation that the minimum content of folic acid in infant formula be 11 µg/100kcal, was based on the most reliable and valid data on total folic acid levels in human milk forwhich the mean minus 1SD value was taken as 71 µg/L or 10.6 µg/100 kcal by LSRO. Therecommendation that the maximum content of folic acid in infant formulae be 40 µg/100 kcalwas based on the 90th centile of the FDA analyses of infant formulae.
Within the EU the Infant Formulae Directive specifies that the minimum folate content ofinfant formulae should be 4 µg/100 kcal. No maximum has been set.
The PRI for infants aged 6-11 months set by the Committee for folate is 50 µg/day (SCF,1993b). For children aged 1-3 years, the Committee set a tolerable upper intake level for folicacid of 200 µg/day (SCF, 2000b).
7.3 Recommendation
The Committee makes the following recommendation on the folate content of infant formulaeand follow-on formulae: as folic acid, minimum 10 µg/100 kcal, maximum 30 µg/100 kcal.
8. COBALAMIN, B12
Cobalamin is a water-soluble vitamin and a member of a family of related molecules knownas corrinoids which contain a corrin nucleus made from a tetrapyrrolic ring structure. Thecentre of the tetrapyrrolic ring nucleus contains a cobalt ion that can be attached to a methyl,deoxyadenosyl, hydroxy, or cyano groups.
Cobalamin is present in all or most animal tissues, but ultimately derived from bacteria, fungior algae. Yeasts fruit and vegetables do not contain cobalamin. Populations on strictvegetarian diets have the lowest dietary intakes of cobalamin. The major form which is usedin food fortification is cyanocobalamin.
Heating food can result in losses of cobalamin activity from 10 to 90%.
Cobalamin absorption in the lower ileum is mediated by intrinsic factor secreted in thestomach (1.5-2.0 µg/day), but a low level of absorption can also take place by diffusion whichis not mediated by intrinsic factor (about 1.2% exposure). Cobalamin enters cells mainlythrough receptor-mediated endocytosis.
Cobalamin is stored in the liver and at birth the liver of a full-term infant contains 25-30 µgcobalamin with the total body content being 30-40 µg. There is no, or only a limited, increasein the concentration of cobalamin in breast milk following supplementation of replete women.
122
Cobalamin is excreted in urine and faeces, with entero-hepatic recycling through bile (up to0.2% pool/day, up to 10 µg, with all but ~1 µg being reabsorbed, and <1 µg excreted inurine).
Cobalamin is involved in the synthesis of DNA, the synthesis and transfer of single-carbonunits such as methyl groups and in the synthesis of methionine and choline. It is a cofactor formethionine synthase (pivotal in one carbon metabolism), and methylmalonyl CoA mutase(even chained fatty acid synthesis).
Those at risk of cobalamin deficiency are strict vegans and those with gastrointestinalpathology. Deficiency may give rise to hyperhomocysteinaemia, and leads to macrocyticanaemia, and a demyelinating neuropathy.
8.1 Milk content
Bates and Prentice (1994) report a mean of 10 studies from developed countries as 0.51 µg/L.The range of values for milk from unsupplemented mothers is 0.16 to 0.64 µg/L (0.02 to 0.09µg/100 kcal). The wide range of values may reflect analytical difficulties rather than intrinsicbiological variability (Picciano, 1995). The concentration is relatively stable up to 12 weeks,with a progressive decrease to about 50% by 27 to 35 weeks post-partum.
The cobalamin content of pasteurized whole cows’ milk is 3 to 5 µg/L (0.4 to 0.7 µg/100 kcal(Jensen, 1995).
Deficiency of cobalamin is rare in infants, although it can occur with a congenital deficiencyof intrinsic factor, or as the result of an inadequate intake from human milk of mothersconsuming a strict vegetarian or vegan diet, or rarely infants given goat’s milk. When adeficiency has been reported in infants fed human milk, the cobalamin content of the milk hasbeen 0.03 to 0.09 µg/L (0.004 to 0.013 µg/100 kcal). Formula-fed infants had highercobalamin concentrations and lower urinary methyl malonic acid excretion than breast-fedinfants (Specker et al., 1990a and b). At intakes of 0.37 µg/day (RDA 0.3 µg/day) urinarymethyl malonic acid excretion became inversely related to intake. Herbert (1996) suggestedthat an oral dose of cobalamin 0.1 µg/day corrects deficiency.
Oral doses of cobalamin up to 100 g/day are said to be non-toxic, with excessive amountsbeing excreted in the urine.
8.2 Existing regulations and recommendations
Based on the Committee on Nutrition of the American Academy on Pediatrics (1985),regulations in the USA require that infant formula contain no less than 0.15 µg/100 kcal ofcobalamin (FDA, 1985). A maximum is not specified.
The LSRO Expert Panel recommended a minimum content of cobalamin in infant formulae of0.08 µg/100 kcal (0.54 µg/L; 0.4 µg/day). This is based on the mid range of mean cobalaminlevels in human milk and represents an intake above that reported to be associated withbiochemical evidence of deficiency (i.e. <0.37 µg/day). This amount of cobalamin willprovide a sufficient intake to meet the RDA from birth to 6 months (0.3 µg/day; 0.06 µg/100kcal) for a 5 kg infant consuming 100 kcal/kg/day and provides an additional margin ofsafety.

123
The LSRO Expert Panel recommended a maximum content of cobalamin in infant formulaeof 0.7 µg/100 kcal based on the 90th centile of the FDA analyses of infant formulae.
Within the EU the Infant Formulae Directive specifies that the minimum cobalamin content ofinfant formulae should be 0.1 µg/100 kcal. No maximum has been set.
The Committee set the PRI for cobalamin for infants aged 6-11 months as 0.5 µg/day (SCF,1993b). No numerical tolerable upper intake level has been set, since there are no clearlydefined adverse effects produced by vitamin B12 that can be used to define a LOAEL orNOAEL (SCF, 2000d).
8.3 Recommendation
The Committee makes the following recommendation on the cobalamin content of infantformulae and follow-on formulae: minimum 0.1 µg/100 kcal, maximum 0.5 µg/100 kcal.
9. ASCORBIC ACID, VITAMIN C
L-ascorbic acid is a six carbon compound structurally related to glucose. L-ascorbic acid has amolecular mass of 176 and is a strong reducing agent. Its oxidised derivative is L-dehydroascorbic acid and both forms have biological activity and are interconvertible by anoxidation/reduction reaction. Most tissue ascorbic acid exists in the reduced form (90%).
Most plants and animals synthesise ascorbic acid, but humans and guinea pigs lack hepatic L-glulono-gamma-lactone oxidase, which is necessary for the conversion of 2-keto-L-gulonolactone to L-ascorbate.
L-ascorbic acid decomposes rapidly in water, due to rapid oxidation with atmosphericoxygen, but there is no evidence of heat degradation.
L-ascorbic acid is absorbed by a sodium dependent, active transport process, with efficiencybeing up to 98% at low doses. L-ascorbic acid is transported in plasma as the free anion and isprimarily lost to the body through urinary excretion.
L-ascorbic acid acts as a strong reducing agent, and has diverse biochemical functions, beinginvolved in the synthesis of collagen, neurotransmitter formation, carnitine synthesis, andenhancing iron absorption.
A clinical deficiency of L-ascorbic acid leads to a clinical condition identified as scurvy.
9.1 Milk content
Bates and Prentice (1994) estimated the mean L-ascorbic acid content of human milk from 11studies of unsupplemented women from western countries, as 55 mg/L. However, there iswide variation, from 30 to 100 mg/L (4.5 to 15 mg/100 kcal), with a progressive decreaseduring the course of lactation (LSRO, 1998).
The L-ascorbic acid concentration in cows’ milk is lower, about 8 to 20 mg/L (1.3 to 3.3mg/100 kcal) (LSRO, 1998).

124
9.2 Existing regulations and recommendations
Based on recommendation of the Committee on Nutrition of the American Academy onPediatrics (1985), the regulations in the USA set a minimum level for L-ascorbic acid ininfant formulae as 8 mg/100 kcal, while no maximum level is specified (FDA 1985).
The LSRO Expert Panel recommended a minimum content of L-ascorbic acid in infantformulae of 6 mg/100 kcal, which is consistent with RDA of 30 mg (equivalent to meanconcentration in human milk of 40 mg/L assuming consumption of 0.75 L/day) and isequivalent to 6 mg/100 kcal for a 5 kg infant consuming 100 kcal/kg/day.
The Expert Panel recommended a maximum content of L-ascorbic acid in infant formulae of15 mg/100 kcal. This would results in an intake of 15 mg/kg/day for an infant consuming 100kcal/kg/day (on a body weight basis equivalent to 1 g/kg/day in 70 kg adult man (NOAEL).The Expert Panel recommended that research be undertaken to establish NOAEL for vitaminC in infancy.
Within the EU the Infant Formula Directive specifies that the minimum L-ascorbic acidcontent of infant formulae should be 8 mg/100 kcal. No maximum has been set.
The PRI for L-ascorbic acid set by the Committee is 20 mg/day (SCF, 1993b). However, thisis now considered to be low, and a number of countries have set higher levels based uponnewer evidence.
9.3 Recommendation
The Committee makes the following recommendation on the ascorbic acid content of infantformulae and follow-on formulae: minimum 10 mg/100 kcal, maximum 30 mg/100 kcal.
10. BIOTIN
D-Biotin is a water-soluble and has a bicyclic ring structure, one of which contains sulfur. All biotin is formed from micro-organisms and it is widely distributed in foods at low levels.It is usually present as biocytin, covalently bound to enzymes, and is relatively rich in liver,yeast, egg yolk, soy flour and cereals.
The preferred methods for assessing status are the urinary excretion of 3-hydroxyisovalericacid, or biotin itself (Zempleni, 1995).
The biotin present in a bound form in food is by biotinidase in pancreatic secretions. Biotin isabsorbed directly by a highly specific transporter and by non-specific peptide transporters. Itis synthesised by the colonic microflora and probably absorbed, although the extent is notknown. Some anticonvulsant drugs and alcohol may inhibit absorption. Unabsorbed biotin is excreted in faeces and absorbed excreted in urine. Steroid hormones andsome anticonvulsant drugs may accelerate catabolism and excretion (Mock, 1996).
Its function is as co-enzyme for several carboxylases, where it acts as a carrier for activebicarbonate: pyruvate carboxylase, methyl crotonyl carboxylase, propionyl Co-enzyme-A

125
carboxylase, acetyl Co-enzyme-A carboxylase. Therefore plays important role in metabolismof carbohydrates, fats and amino acids. Biotin may have a role in the regulation of geneexpression. A clearly characterised deficiency syndrome has been demonstrated following prolongedconsumption of large amounts of egg whites (biotin bound by avidin and not available forabsorption), during parenteral nutrition for intestinal failure, and in some infants on specialformulae. Deficiency has generally been considered to be rare, but there is recent evidence ofbiochemical deficiency during pregnancy. Signs of deficiency include erythematousseborrhoeic dermatitis, alopecia, conjunctivitis and abnormalities of the central nervoussystem (hypotonia, lethargy and developmental delay). Toxicity is not thought to be aproblem because of biotin is relatively insoluble in water, which limits its availability forabsorption. Up to 60 mg/day for a period of 6 months was not associated with any adverseeffects (Dakshinamurti, 1994), and 5-10 mg/day was given to infants as part of theirparenteral nutrition without adverse effect (Fomon McCormick, 1993). 10.1 Milk content Biotin in human milk is nearly all free and water-soluble. The average content is 6 µg (24nmol/L) and the range 5-9 µg/L (0.75-1.3 µg/100 kcal) (Salmenpera et al., 1985; Hirano etal., 1992; Bates and Prentice, 1994; Picciano, 1995). Estimate consumption between 0-6months is about 5 µg/day. In pasteurized cows’ milk there is 20-47 µg/L (3-7 µg/100 kcal) (LSRO, 1998). There is no evidence of dietary deficiency in breast-fed or formula-fed infants. Infants on 0.75L/day, with 5-9 µg/L (0.75-1.34 µg/100 kcal) would obtain 3.8-6.8 µg/day. Mean minus 1SDbreast-fed infant, 5 µg/L; for model infant 0.75 µg/100 kcal, suggest at or above requirements. There is no RDA. The FNB considered 10 µg/day safe and adequate dietary intake for 0-6months of age (large safety factor built in). 10.2 Existing regulations and recommendations
The LSRO report recommended a minimum content of 1 µg/100 kcal, based on mean minus 1SD contents of human milk, 0.5-0.75 µg/100 kcal, rounded to 1. A maximum content of 15µg/100 kcal was recommended, based on the 90th centile of FDA analyses of infant formulae. Within the EU the Infant Formulae Directive specifies that the minimum biotin content ofinfant formulae should be 1.5 µg/100 kcal (0.4 µg/100kJ) while no maximum level has beenset.
The Committee set no PRI for biotin (SCF, 1993b). The Committee also concluded that itcould not derive a numerical tolerable upper intake level due to the lack of systematic oralintake dose-response studies (SCF, 2001c).
10.3 Recommendation
The Committee makes the following recommendation on the biotin content of infant formulaeand follow-on formulae: minimum 1.5 µg/100 kcal, maximum 7.5 µg/100 kcal.

126
Table 1. Requirements of water-soluble vitamins of infants (in mg or µg per day)
EU PRI USA DRIs, 2001Adequate Intake (AI)
FAO/WHO, 2001aRecommended Nutrient
Intake (RNI)Vitamin
(6-11 months) (0-6 months) (0-6 months)
B1, thiamine 0.3 mg 0.2 mg 0.2 mg
B2, riboflavin 0.4 mg 0.3 mg 0.3 mg
B3, niacin 5 mg NE 2 mg preformed 2 mg preformed
B5, pantothenate - 1.7 mg 1.7 mg
B6, pyridoxal 0.4 mg 0.1 mg 0.1 mgFolate, as folic acid 50 µg 65 µg 80 µg
B12, cobalamin 0.5 µg 0.4 µg 0.4 µg
Biotin - 5 µg -
C, L-ascorbate 20 mg 40 mg 25 mg
Table 2. Current requirements for water-soluble vitamins in infant formulae and follow-on formulae and recommended levels (in µg or mg per 100 kcal)
Infant FormulaeDirective USA (LSRO) SCF recommendation
VitaminMinimum Minimum Maximum Minimum Maximum*
B1, thiamine 40 µg 30 µg 200 µg 60 µg 300 µg
B2, riboflavin 60 µg 80 µg 300 µg 80 µg 400 µg
B3, niacin 800 µg NE 550 µg 2000 µg 300 µgpreformed**
1,200 µgpreformed**
B5, pantothenate 300 µg 300 µg 1200 µg 400 µg 2,000 µg
B6, pyridoxal 35 µg 30 µg 130 µg 35 µg 165 µgFolate, as folic acid 4 µg 11 µg 40 µg 10 µg 30 µg
B12, cobalamin 0.1 µg 0.08 µg 0.7 µg 0.1 µg 0.5 µg
Biotin 1.5 µg 1 µg 15 µg 1.5 µg 7.5 µg
C, L-ascorbate 8 mg 6 mg 15 mg 10 mg 30 mg* The recommended maximum level has been set at five times the minimum where there is no evidence that thislevel might be associated with any adverse effect. For niacin and pyridoxal the maximum recommended is below theestimate of the safe upper level estimated from an extrapolation of the daily upper limit determined for 1-3 years oldchildren (SCF, 2002a and 2000a). For folic acid and ascorbic acid the recommended maximum has been set at threetimes the minimum, and for each this value is close to an estimate of the safe upper level estimated from anextrapolation of the daily upper limit determined for 1-3 year old children (for folic acid: SCF, 2000b; for ascorbicacid FNB, 2000a): see text.** As nicotinamide

127
VIII. MINERALS AND TRACE ELEMENTS
A. IRON
1. INTRODUCTION
Iron is essential for virtually every living organism. The dominating function of iron in thehuman body is as the oxygen-binding core of haemoglobin, the red pigment of bloodtransporting oxygen from the lungs to all tissues. During the progress of iron deficiency (ID),haemoglobin synthesis in the bone marrow is restricted resulting in anaemia. Anaemia causedby ID is called iron deficiency anaemia (IDA), distinguishing this condition from other causesof anaemia, such as infection, inflammation, haematological disorders and other nutritionaldeficiencies.
IDA is the most common micronutrient deficiency in the world with about 600 millionindividuals affected (DeMaeyer and Adiels-Tegman, 1985). Rapid growth makes infants andyoung children a particular risk group for IDA. In 1980, the WHO estimated the worldwideprevalence of anaemia in children below 4 years of age to be 43%, with a higher prevalence indeveloping regions (51%) than in industrialized countries (12%) (Fairweather-Tait, 1996). Arecent WHO communication reports for the same age group 20% for children in industrializedcountries and 39% in non-industrialized countries (WHO, 2002).
Human milk has unique properties, making exclusive breast-feeding a superior form ofnourishment for infants during the first half of infancy. In affluent populations, exclusivebreast-feeding prevents IDA during the first half of infancy in healthy term infants (Pisacaneet al., 1995; Siimes et al., 1984). However, in socio-economically disadvantaged populationsinfants may be at risk of developing ID or even IDA if exclusively breast-fed beyond 4months (Calvo et al., 1992; Domellöf et al., 2001). In affluent societies, healthy term infantsfed infant formulae unfortified with iron seldom develop IDA before 4 months of age, but areat higher risk than are breast-fed infants after that age (Moffatt et al., 1994; Pizarro et al.,1991). For this reason, most infant formulae are fortified with iron, but the optimal level ofadded iron is still an open question.
2. IRON REQUIREMENTS IN INFANCY
2.1 Determinants of iron stores at birth
The term newborn infant has a total body iron content averaging about 75 mg/kg body weight(Widdowson and Spray, 1951), which can be compared with 55 mg/kg for an adult. Although,placental iron transport is negligible during the first two trimesters, it rises progressively toabout 4 mg daily towards the end of the third trimester (Lukens, 1995). Consequently, bothbirth weight and gestational age are major determinants of total body iron content at birth.The amount of circulating haemoglobin at birth is a function of the haemoglobinconcentration and the blood volume. The average haemoglobin concentration of cord bloodfrom normal term infants is 170 g/L (range 135 to 210 g/L) (Lukens, 1995). The averageblood volume at birth is 85 mL/kg, depending mostly on birth weight but to some extent alsoon timing of umbilical cord clamping (Brugnara and Platt, 1998). Thus, for infants withsimilar birth weights, individual variations in haemoglobin concentration and blood volume at

128
birth are major causes of differences in body iron content.
2.2 Requirements for growth
In adult humans, there is little exchange of iron between the body and the environment, sincebody iron is recycled and physiological iron losses are small. In the infant, however, therecycling yields a deficit since a substantial part of iron turnover is diverted to growingtissues. In a 6-month old infant ~0.5 mg iron/day is needed for expansion of the blood massand 0.1 mg/day for growth of muscle and other tissues. Since iron requirements excludinggrowth would equal iron losses (0.15 mg/day), infant growth increases iron requirements 5-fold to approximately 0.75 mg/day. As a consequence of reduced haemoglobin concentrationand redistribution of iron to storage sites, the infant is able to double its birth weight withoutexhausting its reserves, independent of external iron (Lukens, 1995). For the term, normalinfant this occurs at about 5 months of age and, soon thereafter, iron utilization from the dietbecomes critical for maintenance of iron balance (Oski, 1993). In proportion to body weightthe need for dietary iron is greater during late infancy than during any other period of life(Dallman, 1992). Based on certain assumptions, such as total body iron at birth and basal ironlosses Oski estimated the average requirement for absorbed iron during the first year of life tobe 280 mg, averaging 0.8 mg/day (Oski, 1993). Such intake is virtually impossible to achievewith unmodified complementary foods, suggesting that additional iron is needed, either asiron addition to foodstuffs or as separate iron supplements to cover the estimated needs(WHO, 1998).
2.3 Iron stores at birth affect requirements after birth
A randomised trial of iron supplementation of Swedish and Honduran infants of normal birthweight, in which the infants were all exclusively breast-fed until 6 months of age, showedsignificant differences in iron status between the Swedish and Honduran infants already at 4months of age. At 9 months, when the infants were partially breast-fed, the proportion of IDAwas <3% in the unsupplemented Swedish infants, suggesting that the iron requirements ofthese infants are lower than previously assumed. In contrast, 28% of the unsupplementedHonduran infants were classified as IDA at 9 months, suggesting a higher iron requirement insocioeconomically disadvantaged populations (Domellöf et al., 2001).
3. ADDITION OF IRON TO INFANT FORMULAE
Despite the documented preventive effect on ID of adding iron to infant formulae, IDA ininfancy is still a major public health problem, not only in developing countries (Haschke andMale, 1996; ESPGHAN, 2002a), but also in certain populations in industrialized countries,among whom non-fortified formulae and unmodified cows’ milk are still widely used (Daly etal., 1996; Freeman et al., 1998). In the United States 13% of 1-year olds fulfil the criteria ofID (Looker et al., 1997). A recent prospective, multi-centre cohort study from 11 Europeanareas (the Euro-Growth study) showed in the same age group an overall prevalence of 7.2%ID and 2.3% IDA, using multiple criteria to define ID (Male et al., 2001). The prevalence ofanaemia was 9.4% of which more than 40% was associated with normal iron status, and anincreased frequency of recent infections. Data from the Swedish cohort of the Euro-Growthstudy further illustrates the difficulty to interpret such prevalence data. Of the healthy, well-nourished Swedish infants (61% were breast-fed at 6 months and 91% received iron-fortifiedcereal and milk-based follow-on formulae), 26% had serum ferritin values <12 �g/L at 12months, indicating ID, and 13% haemoglobin concentrations <110 g/L, indicating anaemia

129
(Persson et al., 1998). This could suggest that the phytate-rich complementary food causedimpaired iron status due to poor bioavailability despite sufficient iron intake. However, theproportion of infants with low haemoglobin and low serum ferritin values did not differbetween Euro-Growth countries (Haschke and Male, 1996). Furthermore, also in this cohortonly a few infants had both low haemoglobin and low serum ferritin, which casts doubt on thevalidity of the reference values used for haemoglobin and ferritin in infancy (ESPGHAN,2002a; Emond et al., 1996). Breast feeding, addition of iron to infant foods includingformulae, and the avoidance of unmodified cows’ milk in the diet of young children are keymeasures in combating IDA (ESPGHAN, 2002a; AAP, 1999).
4. IRON IN BREAST MILK AND INFANT FORMULAE
The concentration of iron in human milk is ~0.3 mg/L, which is approximately the same as incows’ milk, but the difference in bioavailability is reported to be at least five-fold in favour ofhuman milk. The iron content of commercially available infant formulae varies widely,ranging from about 1 mg/L in unfortified formula to as much as 15 mg/L in some iron-fortified formulae. Table 1 shows the various iron levels recommended by differentauthorities for use in infant formulae. It is obvious that there is no consensus with respect tothe fortification level (Table 1).
Table 1. Recommended iron contents of infant formulae
Year Authority Minimum(mg/L)
Maximum(mg/L)
1977 ESPGHAN 7 -1981 Codex Alimentarius Commission 1 mg/100 kcal -1991 European Commission 3 111998 Life Science Research Office 1.3 111999 American Academy of Pediatrics 4 12
In 1977, the European Society for Pediatric Gastroenterology and Nutrition recommended 7mg/L as the minimal level, but no upper level for iron was set, nor was the use of unfortifiedformulae (0.7-1.4 mg/L) explicitly discouraged (ESPGHAN, 1977). The current CodexAlimentarius Commission standard is a lowest level of 1 mg iron/100 kcal and no upper levelset (CAC, 2002). The European Commission currently recommends an iron content of 3-11mg/L (Directive 91/321/EEC), and the Life Science Research Office Report 1998, preparedfor the USA Food and Drug Administration, recommends a minimal iron content of 0.2mg/100 kcal (corresponding to ~1.3 mg/L) and a maximal level of 11 mg/L. The most recentrecommendation from the American Academy of Pediatrics is to avoid all use of unfortifiedformulae, and to provide iron-fortified formulae containing 4-12 mg/L to all infants who arenot breast-fed or are partially breast-fed throughout the first year of life (AAP, 1999).
In the United States, most formulae on the market are fortified at the upper level of the currentrecommendations, i.e. 10-12 mg elemental iron/L. However, low-iron and unfortifiedformulae still account for 9 -30% of the market share (AAP, 1999), whereas in Europe, infantformulae are generally fortified at lower levels (4-7 mg/L), although, as in the United States,unfortified formulae are still available and used (AAP, 1999; Ruiz et al., 1996).

130
5. ABSORPTION OF IRON FROM BREAST MILK AND INFANT FORMULA
The iron concentration in human milk is low (0.2-0.4 mg/L). This is thought partlycompensated by its high bioavailability, often cited as 50% (Saarinen et al., 1977). However,the fractional absorption of iron from human milk is highly variable and it was shownrecently that it changes with infant age and total dietary iron intake (Domellöf et al., 2002).Conversely, reported iron absorption from infant formulae and cows’ milk ranges from 2 to19%, with an average ~10% (ESPGHAN, 1977). The reason for this difference is not fullyunderstood. Cows’ milk contains almost four times more calcium and 6 times morephosphorus than mature human milk. Hallberg et al. (1992) studying iron bioavailability fromhuman and cows’ milk in healthy adults, suggested that >70% of the variation in ironbioavailability could be explained by differences in calcium content. The clinical relevance ofthis is uncertain, as calcium and phosphorus fortification of formula seem to have no effect onthe iron status of infants (Dalton et al., 1997). In mature human milk, the relation betweenwhey protein and casein is about 60:40, whereas in cows’ milk, it is 20:80. The effects of thisdifference in protein composition on iron absorption were studied by Hurrell et al. (1989),who found that both bovine casein and whey protein hampered iron absorption, an effect mostprobably reflecting the iron-binding properties of these proteins.
Ascorbic acid is a known enhancer of iron absorption. Cows’ milk is much lower in ascorbicacid than is human milk, which may be another reason for more efficient absorption of ironfrom the latter (Lönnerdal, 1997). However, this difference is met by routinely generouslyfortifying modern formulae with ascorbic acid.
Finally, human breast milk, in contrast to cows’ milk, contains a high concentration of theiron-binding whey protein lactoferrin, which may facilitate absorption of iron from humanmilk. Lactoferrin has a reasonably high affinity for iron, is fairly stable against intestinalproteolytic digestion, and binds to species-specific receptors in human intestinal mucosa(Hernell and Lönnerdal, 2002). The concentration of these receptors changes with age, and ishighest during infancy. Several studies have failed to demonstrate that addition of bovinelactoferrin to infant formulae improve iron absorption, or iron status (Lönnerdal and Hernell,1994; Hernell and Lönnerdal, 2002; Fairweather-Tait et al., 1987; Schulz-Lell et al., 1991;Chierici et al., 1992). Using cross-over design, Davidsson et al. (1994b) studied the effect ofhuman lactoferrin. Eight infants were randomised to receive breast milk from their ownmothers. Infants were fed the milk untreated or after treatment to remove the lactoferrin. Themilks also were extrinsically labelled with a stable iron isotope, allowing quantification of theamount of iron absorbed. Unexpectedly, iron absorption was higher from the lactoferrin-reduced milk. Thus a promoting effect of lactoferrin on iron absorption remains to bedocumented.
Assuming a daily intake of 800 mL breast milk and an iron concentration of 0.3 mg/L, ofwhich 50% is absorbed, an exclusively breast-fed 4-month old infant would absorb 0.12mg/kg/day of iron daily. This is approximately sufficient for covering the estimated basal ironlosses (20 �g/kg/day) (Oski, 1993) but does not allow for net gain of iron. To achieve thesame iron absorption from formula (assuming that 10% is absorbed), the iron content offormulae would need to be fivefold higher than that in human milk, or 1.5 mg/L.
Atkinson et al. (1996) compared iron status in infants fed formulae fortified with iron to 1.5,7, or 12 mg/L, respectively, and found lower serum ferritin at 6 months in the 1.5 mg group.In a study of healthy term Swedish infants, there was no significant difference in haemoglobinand iron status at 6 months between infants fed a formula containing 2 mg iron/L from age 1

131
month as compared with those fed the same formula containing 4 mg iron/L, or exclusivelybreast-fed infants (Hernell and Lönnerdal, 2002). This suggests that during the first half ofinfancy, a fortification level of 2 mg/L is sufficient for healthy term infants in an affluentsociety such as Sweden.
Using different assumptions (that is, 7% absorption and an iron requirement of 0.06mg/kg/day [Hokama, 1994]), the American Academy of Pediatrics Committee on Nutritionconcluded that a formula containing 12 mg iron/L was necessary, although theirrecommended iron content is 4-12 mg in formulae intended for use throughout infancy andthey also conclude that there is little or no advantage of iron fortification at a level greaterthan 1.2 mg/100 kcal, or 8 mg/L (AAP, 1999).
Obviously, it is difficult to make recommendations on iron contents based only on theoreticalcalculations from absorption figures and estimates of iron requirements. Carefully designedand controlled clinical studies with sufficient statistical power carried out in different strata ofthe infant population are essential to verify the adequacy of the iron level suggested from theavailable absorption and requirement studies.
6. FROM WHAT AGE IS IRON ADDITION TO FORMULA NEEDED?
Directly after birth, there is a sudden increase in tissue oxygen tension, which is reflected by amarked decrease in plasma erythropoietin, in turn leading to virtual cessation oferythropoiesis and haemoglobin synthesis during the first 6-8 weeks of life. (Lukens, 1995;Brugnara and Platt, 1998). Coincident with the ensuing decline in haemoglobin is a shift ofiron from the circulating haemoglobin mass to storage sites. It is not until the haemoglobinlevel falls from the 170 g/L to about 120 g/L that erythropoiesis resumes. After the rapiddecrease in haemoglobin during the first months of life, there is a slow decrease until a nadiris reached at about 8-18 months of age, when mean haemoglobin is usually 110- 20 g/L. After2 years of age mean haemoglobin slowly increases to 135-140 g/L at 12 years of age (Guest etal., 1938; Dallman and Siimes, 1979). Isotope studies have shown that iron from dietarysources does not appear in the circulating red cells in appreciable amounts until the age of 4-6months (Smith et al., 1955), which supports that the infant is not in need of exogenous ironuntil after that age. Thus the addition of iron to infant formulae intended for term, normalinfants would not be necessary before age 4 months. This is supported by a recent study.Comparing breastfed infants with infants fed unfortified infant formula (<1 mg iron/L) or afortified formula (5 mg iron/L) from birth to 3 months of age. Tuthill et al. (2002) found nodifference in haemoglobin or iron status (MCV, ferritin) at either 3 or 12 months of age.
Contrasting with this however, it has been shown that infants do absorb iron tracer already atage 2 months, or even before, which has been interpreted as if also breast-fed infants neediron supplementation from early age (Fomon et al., 1995b; Garby and Sjölin, 1959).Furthermore, although earlier studies showed that infants fed high-level iron-fortifiedformulae from the first few weeks of life increased their haemoglobin from ages 3-4 months(Marsh et al., 1959; Andelman and Sered, 1966), more recent studies with lower but differentiron levels have not confirmed this (Lönnerdal and Hernell, 1994; Hernell and Lönnerdal,2002). There are, however, indications that infants have immature regulation of ironabsorption and haemoglobin synthesis during the first 6 months (Domellöf et al., 2001 and2002). If so, absorption of tracer iron and the haemoglobin response to iron supplementationmay not necessarily reflect a true need for exogenous iron.

132
As mentioned above and (Sturgeon, 1956) the amount of total body iron at birth may varyconsiderably, depending on birth weight and other factors. To allow for such variation ininitial iron stores between individuals within the same population and also betweenpopulations of different socio-economic situations (Domellöf et al., 2001), taking intoconsideration that IDA is the latest stage of iron deficiency, it seems clearly justified torecommend the addition of iron to infant formulae intended for use also before 4 months ofage.
7. CLINICAL STUDIES OF DIFFERENT IRON CONTENTS IN FORMULAE
Even severe IDA in infancy may pass unnoticed, as symptoms such as paleness, fatigue, anddevelopmental or behavioural disturbances are quite subtle. Impaired neurodevelopment andgrowth have been suggested as markers of iron deficiency or mild iron-deficiency anaemia,which can be assessed and quantified in addition to the common haematological andbiochemical determinants of iron status in clinical studies of infants and children. 7.1 Haematologic outcome
In the early American studies on the effect of iron contents in infant formulae, an ironconcentration of 12.7 mg/L was generally used (Marsh et al., 1959; Andelman and Sered,1966). Such formulae effectively prevented development of ID and IDA throughout infancy(Moffatt et al., 1994; Walter et al., 1993). Saarinen and Siimes (1978) showed that feeding aformula with 11 mg iron/L from early infancy resulted in significantly higher levels of serumferritin at 6-12 months compared with feeding an unfortified, home-prepared cows’ milkformula. Concentrations of 1.1 and 12.8 mg iron/L were compared in a study on Canadianterm infants from very low-income families. The lower iron level gave significantly lowerhaemoglobin and iron status at 6 months (Moffatt et al., 1994).
As formulae have become increasingly adapted - modified to resemble human milk moreclosely - several investigators have challenged the need for such high iron levels. Bradley etal. (1993) compared the effect of formulae fortified with 12.7 or 7.4 mg of elemental iron/Lfed from early infancy to age 12 months, and showed no significant difference in growth or iniron status, except for a small but significant difference in ferritin in favour of the 12.7 mggroup at 12 months. The authors concluded that the lower iron level could safely be usedwithout risking development of iron deficiency. Haschke et al. (1993) compared lower ironlevels (i.e. 3 vs. 6 mg iron/L) from age 3 months in healthy term infants with those in a breast-fed control group. There was no difference in iron status at 9 months between the two formulagroups. Low serum ferritin (<10 �g/L) was slightly more common in the breast-fed group atages 6 and 9 months.
Two Swedish studies compared haemoglobin values and iron status in healthy term infantsreceiving exclusively infant formula, with varying iron levels, with that of exclusively breast-fed infants during the first 6 months of life. In the first study, a formula containing 4 mgiron/L was compared with one containing 7 mg/L (Lönnerdal and Hernell, 1994), and in thesecond study, a formula with 2 mg iron/L was compared with one containing 4 mg/L (Hernelland Lönnerdal, 2002). There was no significant difference in haemoglobin levels or ironstatus between groups at 6 months in either of these studies.

133
7.2 Neurodevelopmental outcome
Several studies have shown impaired development and behavioural disturbances in infantswith iron-deficiency anaemia (Roncagliolo et al., 1998; Lozoff et al., 1998), and in infants aswell as in school children, iron deficiency can have adverse effects on cognition that arereversible with iron treatment (Idjradinata and Pollitt, 1993; Bruner et al., 1996).
Moffatt et al. (1994), in their study of infants from very low income families, also comparedthe effect of feeding iron-fortified (12.8 mg/L) or unfortified formula (1.1 mg/L) ondevelopmental status. The results indicated that, apart from a difference in anaemia and IDfrom age 6 months, psychomotor development assessed by the Bayley scales of infantdevelopment differed at ages 9 and 12 months in favour of the group fed iron-fortifiedformula. This difference had, however, disappeared at age 15 months, although by that time,46% of the original cohort had been lost to follow-up. With a similar design, Williams et al.(1999) randomised 100 infants at age 6 to 9 months, whose mothers had already chosen tofeed them with unmodified cows’ milk, to either iron-fortified cows’ milk formula (12 mg/L)or unmodified cows’ milk up to the age of 18 months, after which both groups returned tounmodified cows’ milk until age 24 months. Both groups experienced a decrease in age-specific developmental scores as measured by the Griffith scales, but the decline was greaterin the group receiving unmodified cows’ milk; the difference reached statistical significanceat age 24 months but not at age 18 months. Daly et al. (1996) reported the haematologicaloutcome of the same subjects, showing that the group receiving iron-fortified milk hadsignificantly better iron status at all time points (i.e. ages 12, 18, and 24 months) despiteswitching back to the original milk at age 18 months.
Morley et al. (1999) randomised 493 infants at age 9 months to continuing cows’ milk orreceiving a formula containing 0.9 or 12 mg iron/L. The infants were followed up until age 18months, when iron status and development were assessed. Although the infants fed the iron-fortified formula also had the highest serum ferritin, the authors could not show anydifference in developmental score measured with the Bayley test.
Various studies have thus been performed using neurodevelopment outcome to assess ironrequirement in infancy, but so far, the results have been inconclusive. The fact that differentpopulations have been studied at different ages with different developmental tests makes itdifficult to compare the studies. In socio-economic deprived populations in particular, IDAmay merely be a marker of other nutritional deficiencies, which confuse the picture (Lozoff etal., 1998). However, it also is possible that an early neurodevelopment insult caused by iron-deficiency anaemia may not result in detectable psychomotor delay during infancy, butsymptoms such as deficits in attention and school performance may appear later.
7.3 Growth
Several studies have addressed the issue of whether iron supplementation affects growth, butthe results have been contradictory. Iron supplementation to anaemic (Aukett et al., 1986) ormalnourished children (Angeles et al., 1993; Morais et al., 1993) has resulted in improvedgrowth; in the latter case, possibly because of reduced morbidity. Some studies have shownno effect of iron intake on growth, although a higher intake affected iron status (Moffatt et al.,1994; Daly et al., 1996; Morley et al., 1999), indicating that iron deficiency was not a growth-limiting factor in the infants studied. Two studies have in fact shown a negative effect onbody growth when iron supplements were give to iron sufficient infants (Idjradinata et al.,1994; Dewey et al., 2002). It seems as if iron replete infants may be more susceptible to this

134
complication, although the mechanism is unknown.
8. POTENTIAL NEGATIVE EFFECTS OF ADDED IRON
While there are no indications that large iron stores confer a benefit to the individual, a highdaily intake of iron may in fact have negative consequences. Besides infections and thepossible adverse effect on growth mentioned above these include competition with respect toabsorption of other minerals (Solomons, 1986), prooxidant effects (Schneider and Leibolod,2000) and aggravating symptoms in diseases in which iron absorption is increased (Lynch,1995).
8.1 Mineral absorption
There has been concern that the iron used to fortify formulae could compete with otherdivalent cations during absorption. A high iron/zinc molar ratio (i.e. >2:1) in the diet,especially where the total amount of ionic species is >25 mg, has been implicated as a causeof impaired zinc absorption (for review, see Solomons, 1986). The recent discovery of thedivalent metal transporter 1 (DMT1) (Einstein and Blemings, 1998; Andrews, 1999) explainswhy there is a competition between absorption of iron and divalent cations. Those of mostrelevance for infants and young children are copper and zinc. There are indications fromclinical studies in infants that infant formulae with high iron content (7 mg/L or higher) mayhave negative effect of copper absorption (Lönnerdal and Hernell, 1994; Haschke et al.,1993), while the evidence for zinc from such studies are lacking (Bradley et al., 1993;Haschke et al., 1986).
8.2 Infections
Iron is a known trophic factor for several pathogenic bacteria, and there has also been concernthat iron supplementation in breast-fed infants might saturate human milk lactoferrin, thusdiminishing its anti-infective properties (Andersson et al., 2000). Parenteral iron treatment hasbeen associated with the exacerbation of malaria and with neonatal sepsis (Oppenheimer,1989). For these reasons, it has been suggested that iron supplementation, or the addition ofiron to infant formulae, might increase the incidence of gastroenteritis and other infections ininfants. However, several studies have failed to confirm this theory for iron-fortifiedformulae. One study even showed that added iron provided a small but significant protectionagainst diarrhoea (Scariati et al., 1997).
8.3 Other adverse effects
Because of its pro-oxidant effects, excess iron has been implicated as a potential risk factorfor cancer (Stevens et al., 1994), as well as for coronary heart disease (Ascherio et al., 1994).While several recent studies suggest an association between dietary iron intake and increasedrisk of colorectal cancer in the adult population (Deneo-Pellegrini et al., 1999; Kato et al.,1999; Wurzelmann et al., 1996) a recent meta-analysis did not find support for the theory thatiron intake is associated with coronary heart disease (Danesh and Appleby, 1999). Thesestudies all were performed in adults, and data are scarce on the effects of ironsupplementation or fortification of formulae on oxidative stress in infants.
Hereditary haemochromatosis is a common genetic disorder, especially in individuals ofEuropean origin, affecting as many as 1 in 300 people (Merryweather-Clarke et al., 1997).

135
Infants and children with this disorder most often have not yet been diagnosed, andunnecessary iron supplementation or iron containing formulae might theoretically aggravatetheir iron overload.
We have found no conclusive proof so far that iron-containing infant formulae conferimportant adverse effects. However, to minimize this risk, it seems prudent to keep therecommendded level of iron content as low as considered adequate to secure an appropriateiron supply.
9. CONCLUSION
The risk for an infant to develop ID depends on socio-economic conditions, maternalnutritional status during pregnancy, birth weight, postnatal growth, duration of breast feeding,quality of complementary feeding, and the age at which complementary feeds are introduced.For the healthy, term infant the risk of developing IDA is low before the age of 4-6 months,but increases thereafter and probably reaches its peak between 12 and 18 months of age.Promotion of breast-feeding and use of iron-fortified complementary foods seems an efficientstrategy to prevent ID during infancy.
When breast-feeding is not possible, iron-fortified infant formulae should be used, and whenbreast-feeding is discontinued iron-fortified infant formulae or follow-on formulae should beused rather than cows’ milk or formulae not fortified with iron. However, based on presentknowledge it seems prudent to keep the fortification level of infant formulae and follow-onformulae as low as possible, as long as iron deficiency is prevented, also taking differences inbioavailability of the fortification iron into account.
The lower level of added iron to an infant formula is not critical during the first few months,but becomes important after 4-6 months when iron stores begin to be depleted. This isparticularly true when the formula (or follow-on formula) constitutes a major part of theinfant’s diet, or when the infant consumes only small amounts of iron from other dietarysources. In populations at low risk of developing IDA, a fortification level of 0.3 mg/100 kcal(2 mg iron/L) for cows’ milk-based infant formulae seems to suffice, at least during the first 6months of life. In populations at high risk of developing IDA, it seems prudent to provide ahigher level of iron fortification during the first half of infancy, not only to prevent IDAduring this early period but also to prevent non-anaemic ID - that is, depleted iron stores. Amaximum level of 1.3 mg/100 kcal (8 mg/L) is proposed.
The current recommendation of iron content in follow-on formulae, intended for use from thefifth month of life as the liquid part of a diversified diet, is 1-2 mg/100 kcal, or 6-16 mg/L(Infant Formulae Directive). These levels appear unnecessary high with respect to currentknowledge (reviewed above), and therefore a minimum level of 0.6 mg/100 kcal (4 mg/L) anda maximum level of 1.7 mg/100 kcal (10 mg/L) is now proposed. Although there is no reasonthat the upper level should exceed that of infant formulae intended for use after the first halfof infancy. Soy protein isolates used in infant- and follow on formulae contain phytic acid (myoinositolhexaphosphate [IP6] and other inositol phosphates), which is an inhibitor of iron and zincabsorption (Hurrell et al., 1992). This is the reason for the current proposal of 50 to 100%higher iron levels in infant- and follow-on formulae based on soy protein than in those basedon cows’ milk protein (Infant Formulae Directive). The bioavailability of iron from a soy

136
protein-based formula can be increased to the level of cows’ milk protein-based formulae.This can be achieved by considerably reducing the phytate content, or by increasing the ratioof ascorbic acid to iron molar ratio in the formula (Davidsson et al., 1994a). Hertrampf et al.(1986) concluded from a study on bioavailability of iron in soy-based formulae that it washigher than expected. However, since the majority of soy-protein based formulae on theEuropean market is not considerably reduced in phytic acid, and in the absence of sufficientdata on the long term (several months) effect on iron status of feeding exclusively soy protein-based formulae with different iron levels it is proposed that the minimum and maximumfortification level in soy-protein based infant formulae and follow-on formulae is 1.5 timeshigher than in the cow milk protein-based formulae.
The iron contents of infant formulae or follow-on formulae intended for use after age 6months must take into account the iron intake from other dietary sources, which variesbetween countries and populations. A higher iron content is needed in formulae intended afterthe first 6 months of infancy, particularly if the amount of iron provided by other dietarysources is low.
10. RECOMMENDATION
The Committee makes the following recommendations for the iron content of infant formulaeand follow-on formulae:
Iron contentType of Formulae mg/100 kcal mg/100 kJCows’ milk-based infant formula 0.3 - 1.3 0.07 - 0.32Soy protein-based infant formula 0.45 - 1.9 0.11 - 0.48Cows’ milk-based follow-on formula 0.6 - 1.7 0.13 - 0.40Soy protein-based follow-on formula 0.9 - 2.5 0.20 - 0.60
B. CALCIUM
At birth about 99% of the calcium in the body is part of the structural matrix of bone, with theremainder being physiologically active as a free calcium pool within cells and theextracellular fluid. Within cells, calcium acts as a second messenger, modulating thetransmission of hormonal signals, and regulating enzyme function. It is involved in bloodcoagulation, nerve conduction, muscle contraction and reproductive functions.
Although net calcium absorption and calcium retention may be related to the calcium intake,there are a range of other factors either in the diet (lactose and phytate), or related tometabolic regulation which influence the absorption, around 30 to 50% of dietary calcium,and retention of calcium (Arnaud and Sánchez, 1996). Thus calcium status represents theintegration of the absorption of calcium within the gastrointestinal tract, the deposition andresorption of calcium in bone and the excretion or retention of calcium in the kidney.Hormonal factors, such as calcitonin, parathyroid hormone and vitamin D, play a clear role inthis integrated function, but the metabolic handling of other nutrients such as sodium,phosphorus, iron, zinc and magnesium are also known to exert an influence. In this regard theintake and metabolism of phosphorus is of particular importance, as effective calcium

137
retention requires that adequate phosphorus is available. For this reason the ratio of calcium tophosphorus within formula should be specified.
The calcium content of human milk decreases over the course of lactation, and a summary ofthe data from 24 studies gave a range between 194 and 268 mg/L (29 to 40 mg/100 kcal),(Atkinson et al., 1995; LSRO, 1998). The calcium content of cows’ milk is much higher withabout 1246 mg/L (186 mg/100 kcal) (LSRO, 1998). The calcium content of cows’ milkprotein based infant formula is between 63 and 82 mg/100 mL, and of soy-protein basedformula is around 105 mg/100 kcal, although for each absorption may be lower than forhuman milk (LSRO, 1998). The ratio of calcium to phosphorus in human milk is about 2:1and in most infant formulae is between 1.3:1 and 1.5:1 (Steichen and Koo, 1992).
Although previously, a lower limit had been specified for the calcium content of formula, anda ratio of calcium to phosphorus, no upper limit for calcium content had been specified. TheLSRO (1998) recommended a minimum calcium content of 50 mg/100 kcal. The mean minus1 SD concentration of the mineral in human milk, which is often used as a first guidance fordefining adequate concentrations in formulae, is estimated at 220 mg/L or about 33 mg/100kcal. Mean absorption from human milk is about 58%, and from cows’ milk about 38% ofintake. Therefore to achieve a calcium absorption equivalent to that from human milk (basedon mean minus 1 SD contents), formula content must be at least 50 mg/100 kcal. LSROrecommended a maximum calcium content of 140 mg/100 kcal which is less than the 90th
centile of currently available formula.
The PRI for calcium is 50 mg/100 kcal for infants 6-11 months (SCF, 1993b). The InfantFormulae Directive sets a minimum for calcium in infant formula of 50 mg/100 kcal while nomaximum is set, and the calcium/phosphorus ratio shall be not less than 1.2 nor greater than2.0.
Recommendation
The minimum calcium content in infant formulae should be maintained at 50 mg/100 kcal,and the maximum level should be 140 mg/100 kcal. The ratio of calcium to availablephosphorus (based on measured bioavailability, or calculated as 80% of total phosphorus incows’ milk protein based formulae and as 70% of total phosphorus in soy protein basedformulae) should be not less than 1.0 nor greater than 2.0. This recommendation also appliesto follow-on formulae.
C. PHOSPHORUS
Phosphorus is an integral part of the inorganic matrix of bone, has an important homeostaticfunction as a metabolic buffer, and is an integral part of a range of compounds which playcentral roles as structural cellular components and in intermediary metabolism (phospholipidsand phosphoproteins, nucleic acids and adenosine triphosphate). Therefore during growth theretention of phosphorus is determined by the rate of bone growth and the rate of lean tissueaccumulation. The ratio of calcium to phosphorus retention will vary with the relativeproportions of bone and lean tissue growth.
Phosphorus is absorbed in the small intestine by diffusion and by active transport, and theoverall body content is determined by varying the tubular reabsorption of phosphorus in the

138
kidney. At low intakes phosphorus retention is mediated by parathyroid hormone and vitaminD.
The phosphorus content of human milk have been reported to range from 107 to 164 mg/L(16 to 24 mg/100 kcal) (Fomon and Nelson, 1993), peaking in early lactation and decreasingas lactation progresses (Atkinson et al., 1995; Fomon and Nelson, 1993). Motil et al. (1997)reported average concentration falling from 184�16 (SD) mg/L (27�2.4 mg/100 kcal) at 6weeks of lactation to 155�17 mg/L (23�2.5 mg/100 kcal) at 24 weeks. About 85% of thephosphorus in human milk is absorbed.
Conventional cows’ milk protein-based infant formulae currently marketed in the USAcontain 310-420 mg phosphorus/L (about 46 to 63 mg/100 kcal) (LSRO, 1998). Thephosphorus content of soy-based formula may be much higher, because the phytic acidcontained in the formula binds phosphorus, about 28% of the mass of phytic acid. Phytic acidmay represent 1.5% of soy-protein by weight. Therefore a significant proportion of thephosphorus contained in soy formulae may be unavailable.
In the past a minimum content but no maximum content for phosphorus had been specified.Phosphorus metabolism is closely linked with calcium metabolism. During early life anexcessive intake of phosphorus may be associated with hypocalcaemia, because of the relativesensitivity of the maturing kidney and increased renal losses. The hypocalcaemia may besymptomatic and may be associated with bone changes of osteopaenia, which if severe canmanifest as rickets. The currently available formulae might result in higher blood levels ofphosphorus or increased renal excretion, but differences in bone mineral content have notbeen attributed to this finding (LSRO, 1998). Given the potential for these interactionsconsideration has been given to defining an upper limit for phosphorus.
The LSRO (1998) Expert Panel recommended a minimum for available phosphorus of 20mg/100 kcal and a maximum for available phosphorus of 70 mg/100 kcal. These values aregiven as available and apply to all formulae, including those which contain appreciableamounts of phytate. FDA analysis of 90th centile of infant formulae is 97 mg/100 kcal: on theassumption that phytate phosphorus accounts for 30% of the total in isolated soy-proteinbased formulae, the 90th centile for available phosphorus would be 70 mg/100 kcal.
Concerns expressed by the LSRO Expert Panel that hyocalcaemia in the neonatal periodmight occur as a result of consuming a formula which contained the minimum calcium (50mg/100 kcal), with the maximum phosphorus to give a calcium to phosphorus ratio of 0.71 to1. Therefore, the Expert Panel added the recommendation that the ratio of calcium tophosphorus should not be less than 1.1 to 1.
The Infant Formulae Directive sets a minimum for phosphorus in infant formulae of 25mg/100 kcal, and a maximum of 90 mg/100 kcal. The PRI for phosphorus for 6-11 months is300 mg/d (SCF, 1993b). If it is assumed that a 6 month old weighs 8 kg, then the PRI forphosphorus for a 5 kg infant consuming 100 kcal/kg/d, would be 37.5 mg/100 kcal.
Recommendation
The minimum for bioavailable phosphorus should be 20 mg/100 kcal, and the maximum 70mg/100 kcal. The proportion of bioavailable phosphorus content may either be based onmeasured data in the respective formula, or be based on a mean phosphorus absorption of
139
about 80% from cows’ milk protein-based formulae and about 70% from soy protein isolate-based formulae, which results in the following recommended minimum and maximum levels:
Cows’ milk protein-based and protein hydrolysates only infant formulae and follow-onformulae: minimum 25 mg/100 kcal, maximum 90 mg/100 kcal.
Soy protein based infant formulae and follow-on formulae: minimum 30 mg/100 kcal,maximum 100 mg/100 kcal.
D. MAGNESIUM
The metabolism of magnesium is tightly regulated. It is an integral constituent of bonemineral and as the second most abundant intracellular cation plays a fundamental role inmany aspects of intermediary metabolism, as a cofactor for many different enzymes and as amodulator of physiological processes. Status is hard to define as plasma concentrations aremaintained within narrow limits. It is absorbed in the distal ileum and colon, through aregulated process which may involve vitamin D and is influenced by the presence and bodystatus of sodium, potassium and calcium. The plasma concentration and its availability tometabolism are regulated through a combination of gastrointestinal absorption, bonedeposition and resorption and renal excretion. Gastro-intestinal absorption may be enhancedby lactose. Renal handling is influenced by parathyroid hormone, calcitonin, glucagon, insulinand probably vitamin D.
The bioavailability of dietary magnesium is high. The concentration in human milk appears tobe regulated within narrow limits, 31.4 to 35.7 mg/L (Atkinson et al., 1995) or 17-28 mg/d(Lönnerdal, 1997). Cows’ milk may contain 120 to 130 mg/L (18-19 mg/100 kcal) (Atkinsonet al., 1995; Greer, 1989; Lönnerdal, 1995). Formulae have been reported to contain 40-70mg/L (6-12 mg/100 kcal) (LSRO, 1998).
High doses of magnesium are toxic, and untoward effects have been reported in newborninfants treated with antacids or whose mothers were treated with magnesium sulphate forhypertensive disorders of pregnancy (Brand and Greer, 1990; Tsang, 1972). Magnesiumtoxicity from formulae has not been reported.
The LSRO Expert Panel recommended a minimum magnesium content of 4 mg/100 kcal,based on mean minus 1 SD contents in human milk of 26 mg/mL or 4 mg/100 kcal, and amaximum of 17 mg/100 kcal.
For children 1-3 years, no numerical tolerable upper intake level has been set for magnesiumby the Committee (SCF, 2001d). The Infant Formulae Directive sets a minimum formagnesium of 5 mg/100 kcal, and a maximum of 15 mg/100 kcal. A PRI for magnesium hasnot been set, but for adults the acceptable range of intakes is 150-500 mg/day (SCF, 1993b).Guidance for children is given, and for infants 6-11 months this is 7 mg/kg/day (7 mg/100kcal), slightly higher than the intake from breast milk at 6 months.
Recommendation
The minimum level for magnesium in infant formulae and follow-on formulae should be 5mg/100kcal, and the maximum 15 mg/100 kcal.
140
E. SODIUM, POTASSIUM AND CHLORIDE
Sodium is the principal cation in extracellular fluid and is present in the body mainly in theionised form, which represents around 96%. The amount and concentration of sodiumdetermines the volume of extra-cellular fluid (ECF). Potassium is the major intracellularcation, contributes to the intracellular osmotic activity and in part determines the intracellularfluid volume. Sodium and potassium are lost from the body by extra renal routes, but the bodycontent of both cations is regulated predominantly by renal excretion. The exchange ofsodium for potassium across the cell membrane provides an energy gradient which enablesnutrient uptake through membrane transport processes and is fundamental for the propagationof the action potential in nerves and muscles. Chloride is the principal anion in the ECF andtogether with sodium contributes more than 80% of the osmotic activity. It is an essentialcomponent of the membrane transport systems.
Dietary requirements are based upon the need to match inevitable losses through renal andextra-renal routes, and to meet the needs for net tissue deposition. Intakes which exceed thecapacity of the kidney for excretion are associated with adverse effects in the short and longerterm. Minimum and maximum criteria were defined in 1983, and have not been changedsince.
Wack et al. (1997) have recently suggested that intermittently the electrolyte content of breastmilk might be less than optimal. Thus although on average the concentration of electrolytesmay remain constant, there is variation within and between women, which they speculatemight impact upon infant nutrition, and lead to deficiencies on occasion (Asnes et al., 1982;Hill and Bowie, 1983; Shaffer and Feretti, 1990). Wack et al. (1997), in breast milk fromthirty mothers, reported the average sodium concentration to be 0.87�0.45 (SD) mEq/100 kcalbetween 60 and 240 days, potassium concentration to be 1.65�0.27 mEq/100 kcal, andchloride concentration to be 1.68�0.69 mEq/100 kcal. Motil et al. (1997) reported thecomposition of breast milk from eleven adults and eleven adolescents between 6 and 24weeks postpartum. The concentration of potassium was 1.92�0.24 mEq/100 kcal, and sodiumconcentrations were 0.50�0.14 mEq/100 kcal in adults or 0.80�0.23 mEq/100 kcal inadolescent mothers.
It should be noted that the mineral content of water may vary widely depending upon itssource (Rottoli et al., 1997; Willershausen et al., 2000; Pomeranz et al., 2002), and if used tore-constitute a powdered formula can influence the characteristics and composition of theresulting preparation. The balance of water and solutes such as sodium consumed by theinfant is important if adverse effects are to be avioded in the short and longer term (Campfieldet al., 1994; Eke and Nte, 1996; Bruce and Kliegman 1997; Pomeranz et al., 2002).
The LSRO (1998) recommended a minimum sodium content of 25 mg/100 kcal. Because ofthe high variation of sodium contents reported for human milk, there is reluctance to followthe concept of using mean levels minus 1 SD in human milk as a guidance for infant formulacontents. Moreover, it is noted that recently there are increasingly reports on hypernatraemicdehydration in infants if lacatation and breast-feeding are not well established. Therefore theminimum sodium content should be based upon the RDA of 120 mg/day for infant less thansix months. The maximum level for sodium recommended by LSRO was 50 mg/100 kcal,based on the 90th centile of FDA analyses of infant formula.
For potassium, LSRO proposed a minimum content of 60 mg/100 kcal, based on mean minus1 SD contents in mature human milk of 400 mg/L or 60 mg/100 kcal. The proposed
141
maximum level was 160 mg/100 kcal based upon 90th centile of FDA analysis of infantformula (LSRO, 1998).
For chloride, the minimum recommended level was 50 mg/100 kcal, based on mean minus 1SD contents in human milk of 320 mg/L or 48 mg/100 kcal, rounded to 50 mg/100 kcal. Theproposed maximum content was 160 mg/100 kcal based upon the 90th centile of FDA analysisof infant formula (LSRO, 1998).
The Infant Formulae Directive sets for infant formulae a minimum for sodium 20 mg/100kcal, and a maximum of 60 mg/100kcal, a minimum for potassium of 60 mg/100 kcal, and amaximum of 145 mg/100 kcal: a minimum for chloride of 50 mg /100 kcal, and a maximumof 125 mg/100 kcal.
There is no PRI set for sodium or for chloride (SCF, 1993b). The PRI for potassium wasestimated factorially and for infants aged 6-11 months was set at 800 mg/d or 20 mmol/d, oraround 4 mEq/100 kcal. The PRI for potassium is similar to the maximum recommended forinfant formula by LSRO (1998) of 4.1 mEq/100 kcal, and by the Committee (SCF, 1993b),3.8 mEq/100 kcal. For breast milk the mean potassium content plus 2 SD would be 2.2 to 2.4mEq/100 kcal (Motil et al., 1997; Wack et al., 1997). The mean � 2SD for the chloridecontent of breast milk would be 3.05 mEq/100 kcal (Wack et al., 1997)
Recommendation
It is proposed that for sodium the minimum content of infant formulae should be 20 mg/100kcal and the maximum 60 mg/100 kcal, unchanged from the present. This recommendationapplies also to follow-on formulae.
It is proposed that for potassium the minimum content of infant formulae and follow-onformulae should be 60 mg/100 kcal, and the maximum 160 mg/100 kcal.
It is proposed that for chloride the minimum content of infant formulae and follow-onformulae should be 50 mg/100 kcal and the maximum 160 mg/100 kcal.
F. COPPER
Copper is required as an essential dietary trace element. It is required for cellular metabolismin enzymatic and non-enzymatic systems. It is absorbed from the diet in the upper jejunum byactive and passive processes, stored in the liver and kidney and excreted in the bile to be lostin faeces. Copper status is not easy to determine, and the homeostatic mechanisms whichcontrol copper distribution and metabolism are incompletely understood. However, severedeficiency may manifest with abnormal collagen and bone development, sideroblasticanaemia and neutropaenia. Newborns have a high liver content of copper which is drawnupon for growth during the first six months of life.
The copper content of human milk is not directly influenced by maternal dietary intake ofcopper, and is generally higher than cows’ milk. In the 1980s the concentration of copper ininfant formulae was reported to vary very widely, with some milks having almostundetectable amounts (Lönnerdal et al., 1983). Copper interacts with other divalent cations,such as iron and zinc, for gastrointestinal absorption. Absorption and availability may beinfluenced by the carbohydrate content of the diet, with reduced availability from phytate

142
containing diets, or diets containing fructose. Diets which contain excess copper have beenreported to lead to toxicity and liver damage during childhood (O’Neill and Tanner, 1989;Lönnerdal, 1998), and the levels of copper in the tap water delivered through copper pipes hasbeen reported to lead to toxicity, associated with levels in infant formula between 9 to 26.4mg/L (Eife et al, 1999; Dieter et al. 1999).
The LSRO Expert Panel recommended a minimum content of 60 �g/100 kcal (0.4 mg/L),based on published report as mean - 1SD of human milk during first three months (220 �g/L,33 �g/100 kcal). Based on 90th centile of infant formula, the recommended maximum is 160�g/100 kcal.
The Infant Formulae Directive sets for infant formulae a minimum for copper of 20 �g/100kcal, and a maximum of 80 �g/100 kcal. The PRI for copper is set at 37.5 �g/100 kcal (SCF,1993b). For children 1-3 years, this Committee set a tolerable upper intake level for copper of1 mg/day (SCF, 2003b).
Recommendation
The minimum copper content of infant formulae and follow-on formulae should be 35 �g/100kcal, and the maximum 100 �g/100 kcal.
G. ZINC
Zinc is essential for growth and development. Zinc is a constituent of more than 200metalloenzymes and plays a key role in the synthesis of genetic material and the regulation ofgene expression as well as in cell division, epithelial integrity, cellular immunity and sexualmaturation.
The young infant has a high zinc requirement to support the very rapid growth of earlyinfancy. Symptoms of zinc deficiency include impaired growth and altered cognition inchildren, loss of appetite and taste sensitivity, eye and skin lesions, alopecia, diarrhoea,susceptibility to infections, delayed healing of wounds and reproductive failure (FAO/WHO,2002b).
Prolonged use of high doses of zinc results in a reduction of copper absorption, as it has beenshown in patients with Wilson’s disease (Yuzbasiyan-Gurkan et al., 1992). Ironsupplementation could decrease zinc absorption (O’Brien et al., 2000). However, at levelspresent in food and at realistic supplementation levels, zinc absorption appears not besignificantly affected by iron and copper (FAO/WHO, 2002b). Phytate, which is present insignificant amounts in plant-based foods, particularly grains and legumes, reduces zincabsorption from the gastrointestinal tract through complexation and precipitation (Oberleas etal., 1966).
A large variability of zinc concentration in human milk (from 0.5 to 4.7 mg/L) has beenshown during the course of lactation and among individuals. Zinc supplementation does notinfluence zinc concentrations of human milk in well-nourished lactating women (Krebs et al.,1995). Milk zinc concentration declines sharply over the early weeks of lactation. Indeed,concentrations of zinc in human milk decrease from ~4 mg/L at 2 weeks to ~3 mg/L at 1month, ~2 mg/L at 2 months, ~1.5 mg/L at 3 months and ~1.2 mg/L at 6 months (Krebs et al.,

143
1995). With an estimation of milk intake of 0.78 L/day, calculated daily zinc intake is ~2.2mg at 1 month, ~1.6 mg at 2 months, ~1.2 mg at 3 months, and ~0.9 mg at 6 months (FNB,2001). Mean measured daily zinc intake of exclusively breast-fed infants was 2.3 mg at 2weeks, 1 mg at 3 months, 0.8 mg at 5 months and 0.5 mg at 7 months (Krebs et al., 1994).Zinc deficiency is very rare in breast-fed term infants during the first 6 months of life inindustrialised countries (Krebs and Westcott, 2002). However, concerns have been raised onthe consequences of marginal intakes of zinc on growth of older exclusively breast-fed infants(Walravens et al., 1992). The zinc concentration of cows’ milk ranges from 3 to 5 mg/L(Lönnerdal et al., 1981). A stable isotope study of zinc absorption from different milks andformulae performed in healthy adults showed the following results: human milk: 41�9%;cows’ milk: 28�15%; cows’ milk formula: 31�7%; soy protein formula: 14�4% (Sandströmet al., 1983). The low availability of zinc from soy protein formula has been attributed to itshigh phytate content (Lönnerdal, 1994b). Using infant Rhesus monkeys and suckling rat pupsas animal models, Lönnerdal et al. showed that the bioavailability of human milk in monkeyswas 65% compared to 54% for monkey milk, 46% for casein-based infant formulae, 60% forwhey-predominant formula, and only 27% for soy formula (Lönnerdal et al., 1988). Incontrast, zinc absorption from dephytinized soy formula was 45%. In suckling rats, zincabsorption from conventional soy formula was only 16% versus 47% for dephytinized soyformula. These results show that the low bioavailability of zinc from soy formula can beovercome by the removal of phytate. In a recent study, Abrams et al. (2002) showed that theabsorption of zinc in a partially hydrolysed whey infant formula containing 6.7 mg/L of zincwas 32�11%. In a Japanese study, the zinc concentration of erythrocytes was not different ininfants fed a formula containing 1.0-1.5 mg/L of zinc and in breast-fed infants (Hatano et al.,1985). Longitudinal zinc balances have been performed in breast-fed and formula-fed infants(Sievers et al., 1992). In view of the urinary and faecal zinc losses measured, a daily intake of0.3-0.5 mg zinc/kg body weight is considered to be sufficient to ensure a zinc retentionequivalent to breast-fed infants. This requires a zinc concentration of 2-3 mg/L dpending onmilk volume intake. For breast-fed infants, zinc absorption increases with the decrease in milkzinc content over the course of lactation (Krebs and Hambidge, 1986).
The zinc content of infant and follow-on formulae has been defined in the Infant FormulaeDirective (Tables 4 and 5).
Table 4. Zinc content of infant formulae and follow-on formulae containing cows’ milkprotein only as defined in the Infant Formulae Directive
Infant Formulae Follow-on FormulaeZinc Minimum Maximum Minimum Maximummg/100 kcal 0.5 1.5 0.5 -
Table 5. Zinc content of infant formulae and follow-on formulae containing soy proteinas defined in the Infant Formulae Directive
Infant Formulae Follow-on FormulaeZinc Minimum Maximum Minimum Maximummg/100 kcal 0.75 2.4 0.75 -

144
The Expert Panel of LSRO recommended a minimum zinc content of 0.4 mg/100 kcal and amaximum zinc content of 1 mg/100 kcal in infant formulae containing either cows’ milkprotein only or soy protein (LSRO, 1998).
Daily Reference Nutrient Intakes (RNIs) of zinc proposed by different bodies are shown inTable 6.
Table 6. Daily Reference Nutrient Intakes (RNIs) of zinc proposed by different bodies
Reference RNI (mg/day) Age groupSCF, 1993b 4.0 6-12 months
AFSSA, 2001 --
0-6 months7-12 months
Spanish Dietetic and FoodScience Association 3.0 0-1 year
COMA, 1991 4.05.0
0-6 months7-12 months
CSH, 20004.04-55.0
0-3 months4-5 months6-11 months
D-A-CH, 2000 1.0*
2.00-4 months5-12 months
FNB, 2001 2.02.5
0-6 months7-12 months
FAO/WHO, 2002b
HB1 1.1a
0.8a 2.5d
MB2
2.8b -
4.1
LB3
6.6c -
8.4
0-6 months7-12 months7-12 months
* Estimated value.1HB: high bioavailability diet.2MB: moderate bioavailability diet.3LB: low bioavailability diet.a Human milk infants receiving maternal milk only.b Formula-fed infants.c Formula fed-infants receiving a phytate-rich vegetable protein-based formula.d Not applicable to infants consuming human milk only.
The UL of zinc intake has been set by the FNB to 40 mg/day for an adult man (FNB, 2001)and to 45 mg/day by the FAO/WHO Joint Expert Consultation (FAO/WHO, 2002b). TheFAO/WHO Joint Expert Consultation also suggested an extrapolation in relation to basalmetabolic rate for children and other age groups, meaning an UL of zinc intake of 23-28mg/day for children, which is close to what has been used in some of the zincsupplementation studies. The UL of zinc intake has been set from a single study by the FNBto 4 mg/day for infants 0-6 months and 5 mg/day for infants 7-12 months (Walravens andHambidge, 1976; FNB, 2001). The Committee recently set a tolerable upper intake level forzinc of 25 mg/day for adults and of 7 mg/day for children from 1 to 3 years of age (SCF,2003c).
The following proposals can be made for formulae containing cows’ milk protein only. Sincezinc absorption from human milk, whey-predominant and casein-predominant infant formulae
145
has been shown to be similar, a minimum zinc content of 0.5 mg/100 kcal would allow to a 5kg cows’ milk formula-fed infant consuming 100 kcal/kg to achieve the RNI recentlyestablished by the FNB for zinc (2.0 mg/day) (FNB, 2001). The same minimum zinc contentcan be set for follow-on formulae since complementary feeding brings an additional amountof zinc sufficient to cover the RNI established from 7 to 12 months by the FNB (2.5 mg/day)(Krebs, 2000; FNB, 2001). A maximum zinc content of 1.5 mg/100 kcal would allow the zincintake of a 5 kg-formula-fed infant not to markedly exceed the upper tolerable level of zincintake established by the FAO/WHO Joint Expert Consultation (FAO/WHO, 2002b) and theupper level of tolerable zinc intake of 7 mg/day established by this Committee for childrenaged 1-3 years (SCF, 2003c).
The following proposals can be made for formulae containing soy protein. Since zincabsorption from soy formula is low (~25%), a minimum zinc content of 0.75 mg/100 kcalwould allow a 5 kg-soy formula-fed infant consuming 100 kcal/kg to fulfil his requirements.A maximum zinc content of 2.4 mg/100 kcal would allow the zinc intake of a 5 kg-soyformula-fed infant to be under the UL of zinc intake established by the FAO/WHO JointExpert Consultation (FAO/WHO, 2002b).
Recommendation
The minimum zinc content should be 0.5 mg/100 kcal for infant and follow-on formulaecontaining cows’ milk protein and protein hydrolysates only. The maximum zinc contentshould be 1.5 mg/100 in both infant formulae and follow-on formulae containing cows’ milkprotein and protein hydrolysates only.
The minimum zinc content should be 0.75 mg/100 kcal for infant and follow-on formulaecontaining soy protein. The maximum zinc content should be 2.4 mg/100 kcal in both infantformulae and follow-on formulae containing soy protein.
H. CHROMIUM
Chromium potentiates the action of insulin both in vitro and in vivo, and thereby influencescarbohydrate, lipid and protein metabolism. Chromium deficiency has only been described inpatients on long-term parenteral nutrition deficient in chromium, presenting withhyperglycemia, weight loss, ataxia and peripheral neuropathy, as well as in infants withsevere malnutrition (Brown et al., 1986; Hopkins et al., 1968).
Human milk has an average concentration of trivalent chromium of 0.25 µg/L (FNB, 2001).Thus, mean intake of trivalent chromium in a breast-fed infant is estimated to be 0.15-0.2µg/day. The mean concentration of trivalent chromium in cows’ milk and infant formulae wasreported to be 0.83 and 4.84 µg/L, respectively (Cocho et al., 1992). There are no data on thebioavailability of chromium in infant formulae.
No specification is made regarding a minimum and maximum content of chromium in infantand follow-on formulae in the Infant Formulae Directive. The Expert Panel of LSRO did notrecommend minimum or maximum chromium contents for infant formulae (LSRO, 1998).
The Committee on Medical Aspects of Food Policy (COMA) has set no Reference NutrientIntakes (RNIs) and suggested that the adequate level of intake (AI) was 0.1-1 µg/kg/day forchildren and adolescents (COMA, 1991). AI reflects the observed mean chromium intake of

146
infants fed mainly or exclusively breast milk. Since data on the essentiality and metabolism ofchromium were so sparse, the Committee and the French Food Safety Agency (AFSSA) wereunable to specify any requirements (SCF, 1993b; AFSSA, 2001). The FNB did not define aswell a recommended dietary intake (RDA) for chromium and proposed an AI of 0.2 µg/day ininfants from birth to 6 months based on consumption of chromium from human milk. Sincethe chromium content of a well balanced diet has been estimated to be 13.4 µg/1,000 kcal, anAI of 5.5 µg/day has been proposed in infants from 7 to 12 months based on consumption ofchromium from human milk and complementary feeding (FNB, 2001). Germany, Austria andSwitzerland proposed an AI of 1-10 µg/day and 20-40 µg/day in infants 0-4 months and ininfants 4-12 months, respectively (D-A-CH Referenzwerte, 2000). Because of the very fewadverse effects associated with a high chromium intake originating from food, a tolerableupper intake level (UL) could not be determined (FNB, 2001).
Recommendation
There are no biological or nutritional data to define a minimum and maximum content ofchromium in infant formulae and follow-on formulae.
I. MANGANESE
Manganese is involved in the formation of bone and in amino acid, cholesterol, andcarbohydrate metabolism. Manganese is a component of many enzymes. Glycosyltransferases are specifically activated by manganese. Manganese deficiency is associated inanimals with growth retardation, impaired glucose tolerance and skeletal malformations(Keen et al., 1994). Data on manganese deficiency in humans are very scarce and limited toexperimental conditions. Main symptoms were scaly dermatitis, hair depigmentationassociated with hypocholesterolemia and reduced vitamin K-dependent clotting proteins(FNB, 2001). Manganese toxicity has been demonstrated for people who inhale manganesedust. The most prominent effect is central nervous system pathology, especially in the extrapyramidal motor system. Neurotoxicity can also be observed after ingestion of manganese.The effects could be more severe in the developing brain. Manganese toxicity has been shownin children receiving long-term parenteral nutrition (Fell et al., 1996), and plays a role incholestasis as well as in nervous system abnormalities in these children, as assessed by MRIstudies (Fok et al., 2001; Quaghebeur et al., 1996). It has been recently shown that dietaryexposure to high levels of manganese during infancy can be neurotoxic to rat pups and resultin developmental deficits (Tran et al., 2002).
Average manganese content of human milk has been estimated as 3.5 µg/L, with a slightdecrease over the course of lactation (Casey et al., 1985). Thus, manganese intake of a breastfed infant is estimated to be 2.5-3 µg/day. The concentration of manganese in soy formula(200-300 µg/L) and in cows’ milk is much higher (25-100 µg/L) than in human milk(Lönnerdal et al., 1981; Lönnerdal et al., 1983; Lönnerdal, 1994b). A large range of values(10-200 µg/100 kcal) has been reported for manganese content of various formulae (Stastny etal., 1984). At 3 months, human milk fed infants received significantly less manganese (0.42µg/kg/day) than formula fed infants (183 µg/kg/day). However, mean serum manganeseconcentrations of infants receiving human milk or formula were similar with mean values of4.4 and 4.7 µg/L, respectively. The absorption of manganese from human milk (8.2 � 2.9%) issignificantly higher than from soy formula (0.7 � 0.2%), cows’ milk (2.4 � 1.7%) and wheypredominant cows’ milk formula (3.1 � 2.8%) (Davidsson et al., 1989). In a Japanese study,the manganese concentration of erythrocytes was significantly higher in formula-fed than in

147
breast-fed infants at 1 to 5 weeks of age, but this difference was no longer present between 6and 52 weeks of age (Hatano et al., 1985).
No specification is made regarding a minimum and maximum content of manganese in infantand follow-on formulae in the Infant Formulae Directive. In the Commission Directive1999/21/EC of 25 March 1999 on dietary foods for special medical purposes (FSMPs), theminimum and maximum content of manganese in nutritionally complete foods intended foruse by infants have been set to 50 and 200 µg/100 kcal, respectively. The Expert Panel ofLSRO recommended a minimum manganese content of 1 µg/100 kcal and a maximummanganese of 100 µg/100 kcal for infant formulae (LSRO, 1998).
According to the population intake, the Committee considered it preferable to give a safe andacceptable range of 1-10 mg/day (SCF, 1993b). The COMA was unable to set a RNI formanganese (COMA, 1991). However, a safe intake was defined above 16 µg/kg/day in infantsand children. The safe intake was judged to be the level or range of intake at which there is norisk of deficiency, and below a level where there is a risk of undesirable effects (COMA,1991). The Belgian High Council of Hygiene set an AI of 0.3-0.6 mg/day in infants <6months and of 0.6-1.0 mg/day in infants 7-12 months (CSH, 2000). In the D-A-CH referencevalues, no AI was set for infants <4 months and an AI of 0.6-1.0 mg/day was set for infants 4-12 months (D-A-CH Referenzwerte, 2000). No RDA was set for manganese by the FNB(FNB, 2001). AI of manganese reflects the observed mean manganese intake of infants fedprincipally breast milk. AI was set at 0.003 mg (3 µg)/day in infants from birth to 6 months.In view of the much higher concentration of manganese in foods other than human milk, theAI was set at 0.6 mg/day in infants 7-12 months by the FNB.
Due to the limitation of human data and the lack of information from animal studies, the SCFcould not recommend an UL neither for children over 1 year nor for adolescents or adults(SCF, 2000e). Although neurotoxicity has been described in animals and in humanschronically exposed to a high dose of manganese, the FNB estimated that it was not possibleto establish an UL for infants aged 0-12 months. However, the source of intake should befrom food and formula only (FNB, 2001). The UL was set at 2 mg/day in children 1-3 yearsand at 11 mg/day in adults. The SCF recommended in 1999 an upper level of manganeseconcentration of 0.5 mg/L in natural mineral waters (SCF, 1999b).
Based on the mean content of manganese in human milk of 3-4 �g/L (~0.5 �g/100 kcal) andon the lower absorption of manganese in cows’ milk and in soy-formula, the minimummanganese content should be 1 �g/100 kcal. In spite of the absence of a well identified UL formanganese in infants, there is increasing evidence of the neurotoxicity of high exposure tomanganese. Therefore, a maximum manganese content of 100 �g/100 kcal is proposed, whichis below the estimated LOAEL in adults for manganese contents in water (4.2 mg/L).
Recommendation
The minimum manganese content should be 1 �g/100 kcal and the maximum manganesecontent should be 100 �g/100 kcal for both infant formulae and follow-on formulae.
J. MOLYBDENUM
Molybdenum acts as a cofactor of 3 enzymes in humans: xanthine oxidase, aldehyde oxidaseand sulfite oxidase. While molydenum deficiency has never been observed in healthy humans,

148
it has been described in a single patient on long-term parenteral nutrition deficient inmolybdenum, presenting with night blindness, tachycardia and amino acid intolerance(Abumrad et al., 1981).
Molybdenum has an average concentration of 2 �g/L in human milk (FNB, 2001). Thus,molybdenum intake of a breast fed infant is estimated to be 1.5-2 �g/day. Mean concentrationof molybdenum in cows’ milk and soy milk is much higher (50 �g/L) than that of human milk(Tsongas et al., 1980). The concentration of molybdenum in infant formulae ranges from 2 to30 �g/L (Picciano, 1985). There are no data available on the bioavailability of molybdenum incows’ milk and infant formulae.
No specification is made regarding a minimum and maximum content of molybdenum ininfant and follow-on formulae in the Infant Formulae Directive. The Expert Panel of LSROdid not recommend a minimum or maximum molybdenum content for infant formulae(LSRO, 1998).
There are no reliable estimates of human requirements for molybdenum and no recommendedintake has been established by this Committee or by AFSSA (SCF, 1993b; AFSSA, 2001).The COMA has not set a RNI value for molybdenum (COMA, 1991), nor did the FNB set aRDA for infants aged 0-1 year (FNB, 2001). The COMA set an AI of 0.5-1.5 �g/kg/day ininfants, children and adolescents, whereas the FNB set an AI of 2 �g/day in infants from birthto 6 months based on consumption of molybdenum from human milk, and an AI of 3 �g/dayin infants from 7 to 12 months by extrapolation from the AI of 0-6 months infants. In the D-A-CH reference values, an AI of 7 �g/day and 20-40 �g/day is set for infants <4 months andinfants 4-12 months, respectively (D-A-CH Referenzwerte, 2000). The Belgian High Councilof Hygiene proposed an AI of 15-30 �g/day and 20-40 �g/day in infants 0-6 months and ininfants 7-12 months, respectively (CSH, 2000). Because of the lack of data on adverse effectsof a high molybdenum intake in infants aged 0-1 year, the UL could not be established in thisage group. However, the only source of intake for young infants should be from food andformula, in order to prevent high levels of intake (FNB, 2001).
Recommendation
There are no biological or nutritional data to define a minimum and maximum content ofmolybdenum in infant formulae and follow-on formulae.
K. FLUORIDE
The primary role of fluoride is improving caries resistance. It has also been suggested thatfluoride may play a role in bone mineralisation and maintenance of peak bone mass, as wellas for normal growth in humans (Bergmann and Bergmann, 1991). Fluoride deficiency isassociated with an increase of the prevalence of dental caries. The main adverse effects of achronic excessive fluoride intake are enamel (dental) and skeletal fluorosis.
Mean fluoride content of human milk ranges from 0.007 to 0.011 mg/L (FNB, 1997). Thus,mean fluoride intake of a breast-fed infant is estimated to be 0.005-0.01 mg/day. Meanfluoride concentration in cows’ milk is 0.022�0.007 mg/L (Koparal et al., 2000). Most of thefluoride contained in the diet of a formula-fed infant comes from the water used in dilutingconcentrated liquid or powdered formulae. Fluoride intake may rise if the water source is

149
fluoridated. Fluoridation of water is widely practised in the USA and Canada, as well as insome European countries. The fluoride concentration of ready-to-feed formulae ranges from0.1 to 0.2 mg/L in the USA and from 0.15 to 0.3 mg/L in Canada. A recent survey showedthat the mean fluoride content of soy-based ready-to-feed formulae was higher (0.26 mg/L)than that of cows’ milk protein-based ready-to-feed formulae (0.17 mg/L) (Van Winkle et al.,1995). In the USA, the average dietary fluoride intake by children living in optimallyfluoridated communities (i.e. associated with a high degree of protection against caries and alow prevalence of the milder forms of enamel fluorosis) is around 0.05 mg/kg/day, rangingfrom 0.02 to 0.10 mg/kg/day (FNB, 1997). In many industrialized countries, asupplementation of fluoride of 0.25 mg/day is provided to infants lower than 2 years living incommunities with drinking water concentration under 0.3 mg/L of fluoride. In two studiesperformed in Germany and Turkey, mean fluoride concentration in infant formulae wasestimated to be 0.029 � 0.014 mg/L and 0.022 � 0.007 mg/L, respectively (Bergmann andBergmann, 1991; Koparal et al., 2000). Latifah and Razak (1989) reported that fluoride inseveral brands of infant formulae approximated the mg/L level in the water used for thepreparation of the formulae. An infant consuming 600-700 mL/day of formula would be fed0.23 to 0.27 mg/day of fluoride. Most foods have fluoride concentrations well below 0.05mg/100 g (Taves, 1983). The SCF recommended in 1999 an upper limit of fluorideconcentration of 1.5 mg/L in natural mineral waters (SCF, 1999b).
No minimum and maximum contents of fluoride in infant and follow-on formulae arespecified in the Infant Formulae Directive. The Directive on Foods for Special MedicalPurposes did not set a minimum content of fluoride and recommended a maximum content offluoride of 200 µg/100 kcal (Directive 1999/21/EC). The Expert Panel of LSROrecommended a minimum level of zero and a maximum level of 60 �g/100 kcal for thefluoride content of infant formulae (LSRO, 1998).
No specific recommendations have been made by the Committee since there appeared to beno specific physiological requirements of fluoride (SCF, 1993b). No RNIs or UL weredetermined by the COMA (COMA, 1991). However, the COMA defined a safe intake offluoride of 0.22 mg/kg/day in infants under 6 months and 0.12 mg/kg/day in children from 6months to 6 years. No RDA was set by the FNB for fluoride. According to the mean contentof fluoride in human milk, AI was established at 0.01 mg/day for infants from birth to 6months. Based on the relationship described above between prevalence of caries, prevalenceof enamel fluorosis, and fluoride intake, AI was set at 0.5 mg/day for infants from 7 to 12months. Since a chronic fluoride intake of less than 0.10 mg/kg/day has been shown to beassociated with a low prevalence of enamel fluorosis, the FNB stated an UL of 0.7 mg/day ininfants from birth to 6 months and an UL of 0.9 mg/day from 7 to 12 months (FNB, 1997).
Recommendation
There is no need for defining a minimum level for the fluoride content of both infant formulaeand follow-on formulae. Based on the aforementioned data and considering that infants maybe exposed to an additional intake from fluoride containing water or fluoride supplements, themaximum fluoride content in both infant formulae and follow-on formulae should be 100�g/100 kcal.

150
L. IODINE
Iodine is an essential component of the thyroid hormones thyroxine (T4), containing 65% byweight of iodine, and its active form triiodothyronine (T3), containing 59% by weight ofiodine. Therefore, the dietary requirement of iodine is determined by normal T4 production bythe thyroid gland without stressing the thyroid iodide trapping mechanism or raising TSHlevels. Thyroid hormones are involved in the maintenance of metabolic rate and cellularmetabolism. Thyroid hormones are also necessary for the development of the nervous systemin the fœtus and infant. Iodine deficiency disorders include mental retardation, cretinism,hypothyroidism, goiter and growth impairment (Delange, 1994). Severe iodine deficiency is amajor cause of mental retardation worldwide, with more than 10 million cases of cretinism.Mild deficiency is associated with goitre in 5-20% of schoolchildren. A meta-analysis of 18studies has shown that iodine deficiency alone may reduce the mean IQ scores by 13.5 points(Bleichrodt and Born, 1994). Excess iodine may disrupt thyroid function and secondarily leadto the induction of hypothyroidism with or without goitre, hyperthyroidism (thyrotoxicosis)and changes in the incidence and types of thyroid malignancies (Braverman, 1994).
Iodine content of human milk varies markedly as a function of the iodine intake of thepopulation. It ranges from 10-20 �g/L to more than 300 �g/L in Europe and from 30 to 490�g/L in the USA (FNB, 2001). Thus, mean iodine intake of a breast fed infant can beestimated to 60 �g/day in Europe and 120 �g/day in the USA. Iodine is also present in cows’milk (average level: 150 �g/kg) probably as a result of the use of supplemented cattle feedsand iodophores as teat sterilants. Iodine content of cows’ milk varies from whole cows’ milk(27-47 �g/kg) to summermilk (90 �g/kg) and wintermilk (210 �g/kg) (SCF, 2002d).
The iodine content of infant and follow-on formulae has been defined in the Infant FormulaeDirective (Table 1).
Table 1. Iodine content of infant formulae and follow-on formulae as defined in theInfant Formulae Directive
Infant Formulae Follow-on FormulaeIodine Minimum Maximum Minimum Maximum�g/100 kcal 5 - 5 -
The Expert Panel of LSRO recommended a minimum iodine content of 8 �g/100 kcal and amaximum iodine content of 35 �g/100 kcal in infant formulae (LSRO, 1998). TheCommission Directive on FSMPs set a minimum and maximum iodine content innutritionally complete foods intended for use by infants of 5 and 35 µg/100 kcal, respectively.
Daily RNIs of iodine proposed by different bodies are shown in Table 2.
The FNB could not establish an UL for infants 0-12 months (FNB, 2001). The UL was 200�g/day of iodine in children 1-3 years for the FNB as well as for the SCF (SCF, 2002d).FAO/WHO Joint Expert Consultation set probable safe upper limits of 150 and 140 �g/kg/dayin infants 0-6 months and 7-12 months, respectively (FAO/WHO, 2002b). However, thereport also states that the upper limit probably should be one that provides a daily iodineintake of no more than 100 �g/kg.
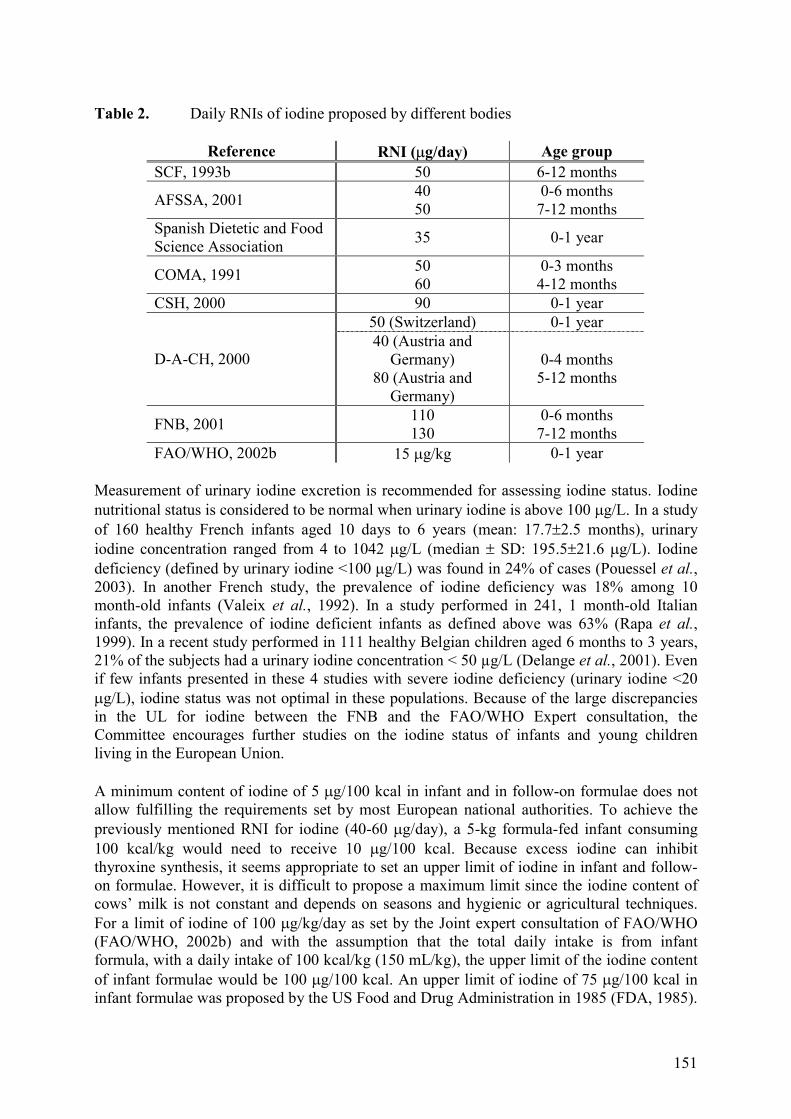
151
Table 2. Daily RNIs of iodine proposed by different bodies
Reference RNI (�g/day) Age groupSCF, 1993b 50 6-12 months
AFSSA, 2001 4050
0-6 months7-12 months
Spanish Dietetic and FoodScience Association 35 0-1 year
COMA, 1991 5060
0-3 months4-12 months
CSH, 2000 90 0-1 year50 (Switzerland) 0-1 year
D-A-CH, 200040 (Austria and
Germany)80 (Austria and
Germany)
0-4 months5-12 months
FNB, 2001 110130
0-6 months7-12 months
FAO/WHO, 2002b 15 �g/kg 0-1 year
Measurement of urinary iodine excretion is recommended for assessing iodine status. Iodinenutritional status is considered to be normal when urinary iodine is above 100 �g/L. In a studyof 160 healthy French infants aged 10 days to 6 years (mean: 17.7�2.5 months), urinaryiodine concentration ranged from 4 to 1042 �g/L (median � SD: 195.5�21.6 �g/L). Iodinedeficiency (defined by urinary iodine <100 �g/L) was found in 24% of cases (Pouessel et al.,2003). In another French study, the prevalence of iodine deficiency was 18% among 10month-old infants (Valeix et al., 1992). In a study performed in 241, 1 month-old Italianinfants, the prevalence of iodine deficient infants as defined above was 63% (Rapa et al.,1999). In a recent study performed in 111 healthy Belgian children aged 6 months to 3 years,21% of the subjects had a urinary iodine concentration < 50 µg/L (Delange et al., 2001). Evenif few infants presented in these 4 studies with severe iodine deficiency (urinary iodine <20�g/L), iodine status was not optimal in these populations. Because of the large discrepanciesin the UL for iodine between the FNB and the FAO/WHO Expert consultation, theCommittee encourages further studies on the iodine status of infants and young childrenliving in the European Union.
A minimum content of iodine of 5 �g/100 kcal in infant and in follow-on formulae does notallow fulfilling the requirements set by most European national authorities. To achieve thepreviously mentioned RNI for iodine (40-60 �g/day), a 5-kg formula-fed infant consuming100 kcal/kg would need to receive 10 �g/100 kcal. Because excess iodine can inhibitthyroxine synthesis, it seems appropriate to set an upper limit of iodine in infant and follow-on formulae. However, it is difficult to propose a maximum limit since the iodine content ofcows’ milk is not constant and depends on seasons and hygienic or agricultural techniques.For a limit of iodine of 100 �g/kg/day as set by the Joint expert consultation of FAO/WHO(FAO/WHO, 2002b) and with the assumption that the total daily intake is from infantformula, with a daily intake of 100 kcal/kg (150 mL/kg), the upper limit of the iodine contentof infant formulae would be 100 �g/100 kcal. An upper limit of iodine of 75 �g/100 kcal ininfant formulae was proposed by the US Food and Drug Administration in 1985 (FDA, 1985).

152
This upper limit is above the current upper range of iodine concentration in cows’ milk as ithas been described above.
Recommendation
The minimum iodine content should be 10 �g/100 kcal and the maximum iodine contentshould be 50 �g/100 kcal for both infant formulae and follow-on formulae.
M. SELENIUM
Selenium is necessary for the activity of glutathion peroxydase, which protects againstoxydative damage in intracellular structures. At least 15 other selenoproteins have beencharacterised, as iodothyronine deiodinases, which are essential for the conversion oftetraiodothyronine (T4) to its physiologically active form, triiodothyronine (T3). Between 60and 80% of selenium in human plasma is accounted for by selenoprotein P, which hasantioxidant activity and may be involved in selenium transport (FAO/WHO, 2002b).Biochemical evidence of selenium depletion, i.e. a decline in blood glutathion peroxydaseactivity, has been observed in patients on long-term parenteral or enteral feeding. In humans,selenium deficiency is mainly associated with Keshan disease, an endemic cardiomyopathyoccurring in young children and women of child-bearing age in different regions of China,and possibly with Kashin-Beck disease, a musculoskeletal disorder (Yang and Xia, 1995).Both Keshan disease and Kashin-Beck disease occur in areas where the availability of soilselenium is low. The available studies show that the development of chronic seleniumpoisoning, or selenosis, is associated with selenium intakes over 0.85 mg/day (14 µg/kg bodyweight for a 60 kg adult). Selenosis is characterised by skin lesions and neurologicalabnormalities such as hypoaesthesia and hyperreflexia (FNB, 2000a).
The wide range of breast milk selenium concentrations depends on selenium consumed innatural foods, which reflects the content of the soils where they are grown. Seleniumprophylaxis, either through soil selenium fertilisation or maternal supplements, is effective inraising breast milk selenium concentration (Dorea, 2002). In general, the selenium content ofhuman milk is highest in colostrum (Ellis et al., 1990). In spite of wide variation, the medianselenium concentration from studies worldwide are 26, 18, 15, and 17 µg/L in colostrum (0-5days), transitional milk (6-21 days), mature milk (1-3 months) and late lactation (>5 months),respectively (Dorea, 2002). In a recent Australian study, mean concentration of selenium incows’ milk varied from 20.6 � 4.8 to 23.8 � 4.7 µg/L and was close to that of human milk(Tinggi et al., 2001). The mean selenium concentration in 24 brands of commercial infantformulae was 49.0 � 11.6 µg/L, with a range from 26 to 68 µg/L (al-Saleh and al-Doush,1997). Infants fed a soy formula supplemented with selenium (22-28 µg/L) had plasma anderythrocyte selenium values lower than those of infants fed human milk (Johnson et al.,1993). However, plasma and erythrocyte glutathione peroxydase activities were normal,indicating that the physiologic requirement for selenium was being met. The same biologicalpattern was observed in German infants fed cows’ milk formulae as compared to breast-fedinfants (Jochum et al., 1995)
No minimum contents of selenium in infant and follow-on formulae are specified in the InfantFormulae Directive, while a maximum selenium content of 3 µg/100 kcal was set for infantformulae with added selenium. The Expert Panel of LSRO recommended a minimum level of1.5 µg/100 kcal and a maximum level of 5 �g/100 kcal for the selenium content of infant

153
formulae (LSRO, 1998). The Commission Directive on FSMPs set a minimum and maximumselenium content in nutritionally complete foods intended for use by infants of 1 and 3 µg/100kcal, respectively.
The RNIs for selenium in adults are based on the amount of selenium needed to maximisesynthesis of the selenoprotein glutathion peroxydase as assessed by the plateau in the activityof the plasma isoform of this enzyme. However, no functional criteria of selenium status havebeen demonstrated that reflect response to dietary intake in infants. The AI for infants aged 0-6 months (15 mg/day) is based on an average volume of human milk intake of 0.78 L/day andan average concentration in human milk of 18 µg/L (FNB, 2000a). The AI for infants aged 7-12 months has been estimated to 20 µg/day, by adding selenium intake from human milk(average volume of human milk intake of 0.6 L/day) and selenium intake fromcomplementary feeding (Lambeck et al., 1984). Daily RNIs of selenium proposed by differentbodies are shown in Table 3.
Table 3. Daily RNIs of selenium proposed by different bodies
Reference RNI (�g/day) Age groupSCF, 1993b 8 6-12 months
AFSSA, 2001 --
0-6 months7-12 months
COMA, 1991101310
0-3 months4-6 months7-12 months
CSH, 2000101315
0-3 months4-5 months6-11 months
D-A-CH, 2000 5-157-30
0-4 months5-12 months
FNB, 2000a 1520
0-6 months7-12 months
FAO/WHO, 2002b 610
0-6 months7-12 months
The UL of selenium intake has been set by the FNB to 45 µg/day in 0-6 month infants and 60µg/day in 7-12 month infants (FNB, 2000a). The Committee set an UL for children 1-3 yearsof 60 �g/day (SCF, 2000f).
A minimum selenium content of 3 µg/100 kcal would allow a 5 kg cows’ milk protein basedformula-fed infant consuming 100 kcal/kg to achieve the RNI recently established by the FNBfor selenium (15 µg/day) (FNB, 2000a). A maximum selenium content of 9 µg/100 kcalwould allow a 5 kg-formula-fed infant to receive a selenium intake close to the UL ofselenium intake established by the FNB (FNB, 2000a).
Recommendation
The minimum selenium content should be 3 �g/100 kcal and the maximum selenium contentshould be 9 �g/100 kcal for both infant formulae and follow-on formulae.

154
IX. PROBIOTICS
1. INTRODUCTION
Human breast-milk promotes the development of a microbial flora in the colon which islargely predominated by lactobacilli and bifidobacteria (up to 90% of the total flora)(Harmsen et al., 2000). Due to the microbial production of lactic and acetic acids the faecalpH decreases which inhibits the colonisation by potentially pathogenic bacteria.
Modern infant formulae with low contents of protein, high contents of lactose and highcalcium-phosphate ratios do not, as a rule, have the same quantitative and qualitative effectson the gut microflora of the infant. The detectable effects on the microflora depend very muchon the method applied, because of difficulties in cultivation of obligate anaerobic species.Molecular methods based on identification of microbal DNA are now available forquantitative studies (Tannock, 2000) and may be combined with classical bacteriologicalmethods (AFSSA, 2003). In recent years two approaches have been proposed to achieve anintestinal flora more similar to that of breast-fed infants: the addition of non-digestiblecarbohydrates that may act as prebiotics to formulae, such as oligofructosyl-saccharose andoligogalactosyl-lactose, and the addition of bacterial cultures such as specific strains oflactobacilli and bifidobacteriacae considered as probiotics to formulae. Prebiotics have beendefined as “non-digestible food ingredients that beneficially affect the host by selectivelystimulating the growth and/or activity of one or a limited number of bacteria in the colon, andthus improve host health” (Gibson and Roberfroid, 1995). Probiotics have been considered tobe “microbial food supplements that beneficially affect the host by improving his intestinalmicrobiological balance” (Fuller, 1989) or “microbial cell preparations or components ofmicrobial cells that have a beneficial effect on the health and well being of the host”(Salminen et al., 1999).
Although the Infant Formulae Directive does not specify that the addition of live bacteria toinfant and/or follow-on formulae is permitted, except for the purpose of acidification offormula (Directive 95/2/EC, Annex VI, parts 1 and 2), several formulae with added livebacteria considered as “probiotics” have been introduced into the European market in recentyears.
2. LEGISLATION
2.1 Legislation on bacteria in infant formulae
The addition of microbes to infant or follow-on formula is not mentioned in the InfantFormulae Directive. However, article 3 of the Directive permits the use of food ingredientswhose suitability for the particular nutritional use of infants has been proven by generallyaccepted scientific evidence.
For the production of acidified infant and follow-on formulae non-pathogenic L(+)-lactic acidproducing bacterial cultures are permitted.
Whereas in fermented dairy products bacteria, yeasts and moulds are added for fermentationpurposes, to metabolise lactose to lactic acid with a reduction of the pH to �4.6 and

155
consecutive changes in the physico-chemical properties of the milk constituents (Tamime,2002), probiotic bacteria are added e.g. freeze-dried to the finished formula product and notincubated for any length of time under temperature control. Therefore, the bacteria do nothave to be those permitted in fermented dairy products.
Microbiological criteria for infant formula and follow-on formula have not yet beenharmonised in the EU.
There is no special regulation in the EU neither on criteria for bacteria claimed to be“probiotic” nor on their use in the manufacturing of food or on claims of foods containingthem.
The US Food and Drug Administration (FDA) has accepted as of 19 March 2002 the noticeon Substances Generally Recognised as Safe (GRAS) submitted by Nestlé USA for the use ofBifidobacterium lactis strain Bb12 and Streptococcus thermophilus strain Th4 as ingredientsin milk-based formula that is intended for consumption by infants four months and older andwho are not immunocompromised (FDA, 2002). The FDA has, however, not made its owndetermination regarding the GRAS status of the two notified stains and has not made anydecisions in relation to label claims.
3. SCIENTIFIC REPORTS ON THE USE OF PROBIOTIC BACTERIA INFOODS
3.1 General reports
A group of Experts for Food Hygiene and Veterinary Medicine convened in 1997 at theFederal Institute for Health Protection of Consumers and Veterinary Medicine in Berlin(BgVV Working Group, 1999) to define probiotics, probiotic food, identify microorganismswith probiotic properties (Lactobacillus acidophilus group, Lactobacillus casei group,Bifidobacterium spp), effective doses (108 to 109 microorganisms), set up safety testingrequirements (production of biogenic amines, activation of pro-carcinogens, induction and/ordestruction of thrombi with the aid of specific hydrolases, activation of platelet aggregation,binding to fibrinogen and fibronection, degradation of mucin, haemolytic activity,transmission of resistance to antibiotics), set up criteria for genus and strain identification andstability, consider influences of food processing and handling (survival of microorganisms,food matrix, packaging, shelf-life) and proof of claimed effects with the specific food productunder specified conditions in randomised double-blind placebo-controlled trials. Consideredeffects were improved lactose hydrolysis in lactase deficient subjects, prevention ormitigation of gastrointestinal infections, modulation of immune responses, inactivation ofenzymes and decreased production of harmful metabolic substances. Claims on health-promoting effects would have to be based on scientific evidence. Legislative actions includingthe definition of criteria for the use of the term "probiotic" for a bacterial strain, of conditionsof use of a probiotic strain in the manufacturing of probiotic foodstuffs and the extent ofpermissible claims were proposed.
A committee of Swedish scientists convened by the Swedish Nutrition Foundation reviewedand evaluated human studies on health effects of probiotics and prebiotics (Andersson et al.,2001). The group concluded that certain probiotic bacteria may improve symptoms of lactoseintolerance, acute rotavirus-induced diarrhoea and possibly also other forms of infectious

156
diarrhoea while reports on possible effects on serum cholesterol and on irritable bowelsyndrome are still inconclusive.
A Joint FAO/WHO Expert Consultation on Evaluation of Health and Nutritional Properties ofProbiotics in Food Including Powder Milk with Live Acid Bacteria (2001b) focussed mainlyon the evaluation of the available scientific evidence for the properties, functionality, benefits,safety and nutritional features of probiotic foods:
- probiotic strains must survive the passage through the digestive tract and proliferate inthe gut;
- they belong primarily to two genera: Lactobacillus and Bifidobacterium;
- there are no in vitro tests to predict the probiotic activity of a strain;
- strains should be named according to the International Code of Nomenclature;
- probiotic strains should be deposited in an internationally recognised culturecollection;
- strain identification should be performed by phenotypic tests followed by geneticidentification with methods as DNA/DNA hybridisation, 16SRNA sequencing (Blautet al., 2002) or similar methods;
- beneficial effects must be related to dosage regimens and duration of use of eachindividual product or strain;
- effects considered and evaluated comprised prevention and therapy of infectiousdiarrheal diseases and of sequelae of antibiotic treatment, Helicobacter pyloriinfection, inflammatory bowel diseases, prevention or delaying the onset of cancer,alleviation of constipation, modulation of mucosal or systemic immune responsesincluding allergic diseases, benefits on cardiovascular diseases and urogenitaldisorders and infections, possible beneficial or adverse effects in healthy subjects;
- the necessity for well designed in vivo trials was underlined;
- safety considerations should include transmission of antibiotic or drug resistanceinherent in some probiotic microorganisms; the exclusion of Enterococcus strains asprobiotic microorganisms was recommended;
- labelling should include the microbial species or strain and its viable concentration,claims would have to be substantiated;
- stock cultures should be maintained under appropriate conditions and be checkedperiodically for strain identity and probiotic properties;
- dried milk powders with live lactic acid bacteria should preserve adequate numbers ofviable probiotic bacteria with stable probiotic properties throughout shelf-life;
- the regulatory status of probiotics as a component in food should be established on aninternational level.
157
In the Guidelines for the Evaluation of Probiotics developed subsequently (FAO/WHO,2002c) the need to know the strain identity, established by the most valid methodology isrepeated. A flow-sheet for evaluation of probiotic bacteria and of foods that contain probioticbacteria and are labelled as such is provided. This report also emphasised the need to fullyevaluate the safety of probiotics, in particular with respect to potential infectious risks insubjects with a compromised immune defense and subjects at increased risk for endocarditis.
3.2 AFSSA report on the use of probiotic foods in infants
The specific aspects of the modification of the intestinal flora by nutritional means, includingthe use of probiotics, in infants were evaluated by a French working group (AFSSA, 2003).The tasks were to clarify the aims and risks connected with such a modification, to describethe desirable microbial profile and the means and consequences of its achievement also onother body functions, and to deliberate on how to communicate possible effects.
This working group excluded genetically modified and non-viable microorganisms from itsdefinition of probiotics.
The speciation of probiotic strains both by classical bacteriological and modern molecularmethods and the deposition of identified strains in an internationally recognised culturecollection were considered necessary.
Two distinct periods of modification of intestinal colonisation were defined: the first week oflife, when breast-fed infants develop a flora dominated by bifidobacteria and formula-fedinfants possibly a more complex flora, and the period when complementary feeding is started.
The fermentative capacity, profile of short-chain fatty acids and pH in faeces varies amonginfants: acetic acid and lactic acid dominate until one month of age in breast-fed infants andhigher concentrations of propionic acid and butyric acid appear later, whereas formula-feeding favours propionate and butyrate production and a near neutral pH of the faeces. Thepossible health consequences of the enzymatic activities of the more diversified flora offormula-fed infants compared to that of breast-fed infants are not known. For infants withoutlactose-intolerance the lactose-fermenting capacity of probiotic bacteria confers noappreciable benefit.
It is not clear whether a diminished bacterial translocation that has been observed in animalexperiments with the supply of certain probiotic strains would also occur in infants. There issome evidence that certain probiotic bacteria exert strain-specific effects on the intestinalmucosal and systemic immune system. The application of Lactobacillus rhamnosus GG(5.108 colony forming units (CFU)/day over one month) to infants and young children (age 2month to 16 month) allergic to cow's milk protein and of Lactobacillus GG orBifidobacterium lactis Bb12 added to a hydrolysed formula to previously breast-fed infantssuffering from atopic dermatitis ameliorated the clinical symptoms (Majamaa and Isolauri,1997; Isolauri et al., 2000). Lactobacillus GG (1010 CFU) given as a supplement two to fourweeks before delivery to pregnant women at risk of atopic disease and to their children duringsix months decreased the incidence of atopic eczema during the first two years of life(Kalliomäki et al., 2001). Confirmation by further investigations appears necessary.
In young children and partly also in infants, several strains of Lactobacilli have shortened anddecreased the symptoms of infectious enteritis, especially Rotavirus diarrhoea (Rosenfeldt et

158
al., 2002; Rautanen et al., 1998; Shornikova et al., 1997), and both Lactobacillus rhamnosusGG and Bifidobacterium lactis Bb12 have been shown to prevent diarrheal diseases (Saavedraet al., 1994; Guandalini et al., 2000; Szajewska et al., 2001). There are some preliminaryindications that the risk of other infectious diseases such as Helicobacter pylori infections andof necrotising enterocolitis might by reduced by some probiotics. However, it remains to bedetermined if the modification of the intestinal flora in young infants of good health is of anyappreciable benefit to their health.
For safety reasons probiotics should not be given to immunocompromised or prematureinfants, based on current knowledge. In addition to the requirements on strain identity,viability, strain stability, and number of probiotic bacteria in a food until the end of its shelflife, it is recommended that instructions for preparation, storage and heating of the formulaready for consumption be specific to guarantee the survival of the desired amount ofmicroorganism until the time of feeding.
The working group recommends that nutritional, physiological and therapeutic effects bedemonstrated by appropriate clinical studies described in detail. Formulae with addedprobiotic microorganisms should be labelled with the exact name of the strain and itsconcentration (number of microorganisms per weight unit of formula as ready forconsumption). The label should include recommendations as to the amount and duration ofconsumption, and on storage and preparation.
The French working group has not made proposals as to the communication of provenbeneficial effects of probiotics to the consumer via claims.
4. COMMENTS AND CONCLUSIONS
4.1 Use of probiotics in infant formulae and follow-on formulae
The Committee recognises the necessity to come to a decision at Community level on the useof bacteria generally considered as probiotics in infant formulae and/or follow-on formulae.The Committee consulted previous expert reports, but in view of time restrictions was unableto perform a full review of the available evidence on the inclusion of probiotic bacteria intoinfant formulae and follow-on formulae, and it recommends that a full review should beperformed in the future. The Committee notes that the available information is still limited,and many studies in young infants have been done in non-European countries and in selectedsubpopulations of infants that are at increased risk of infectious or atopic diseases. TheCommittee recommends that infant formulae with microorganisms regarded as probioticsshould only be introduced into the market if their benefit and safety have been evaluatedaccording to the principles outlined in chapter XI of this report.
Follow-on formulae with added bacteria regarded as probiotics have been for since aboutthree years. The Committee has no reason to object to the addition of bacteria regarded asprobiotics to follow-on formulae, provided the requirements described below are fulfilled.
4.2 Requirements for the use of probiotic bacteria in follow-on formulae
Only bacterial strains with identity and genetic stability demonstrated by cultural andmolecular methods should be used, if they can be considered as generally safe when added tothe individual food and have been shown to survive the gastrointestinal passage, have the

159
capacity to proliferate in the gut for the duration of consumption and can modify the intestinalmilieu (for example pH, short chain fatty acids). The identity of the probiotic strain should bedescribed by molecular methods in a dossier and be available to the food control authorities.The content of viable bacteria should be such throughout shelf-life as to achieve 106 to 108
colony forming units per gram of formula prepared as ready for consumption. Processing,packaging and storage should not impair the viability of the bacteria.
4.3 Labelling requirements for follow-on formulae with added probiotic bacteria
In case of the addition of microorganisms, it is proposed to allow a label statement on thename of the bacterial strain, the number of microorganisms per g of powder or per 100 mL ofthe formula as prepared ready for consumption, and the duration of guaranteed microorganismcontent. The instructions for storage, preparation, heating and handling should take intoaccount the possible impaired viability of probiotic strains when exposed to heat or oxygen.
The term “probiotic(s)” should only appear on formula labels if beneficial health effects inrecipient infants have been established by adequate clinical trials and the results have beenevaluated by an independent scientific body. The Committee considers claims on effects ofprobiotic bacteria on modification of the risk for specific health disorders as inappropriateunless such effects have been demonstrated by adequate scientific evidence following theguidance outlined in chapter XI of this report.

160
X. COMMENTS ON THE PRESENTATION OF INFANTFORMULAE AND FOLLOW-ON FORMULAE
As part of the review on the requirements of infant formulae and follow-on formulae, theCommittee reviewed the scientific basis for the current European requirements for thepresentation of such products (Article 9 of the Infant Formulae Directive).
1. In consideration of the numerous health and other benefits of breast-feeding, themarketing of breast milk substitutes should not interfere with breast-feeding, and withthe promotion of and the support for breast-feeding.
2. The labelling and presentation of infant formulae and follow-on formulae shouldclearly identify their respective roles as a breast milk substitute and as the liquid partof a diversified diet and should not in any way discourage breast-feeding. Theproducts should be labelled in such a way as to avoid any confusion between infantformula, follow-on formula and foods for special medical purposes.
3. The Committee has reviewed the scientific basis for the compositional criteria ofdescriptions of infant formulae as laid down in the Infant Formulae Directive (AnnexIV). The Directive defined the conditions for claims on aspects of formulacomposition (“adapted protein”, “low sodium”, “sucrose free”, “lactose only”, “lactosefree”, “iron enriched”) as well as one functional property (“reduction of risk of allergyto milk proteins”).
4. With respect to these hitherto accepted claims, the Committee notes that the criteriaused for the term “adapted protein” does not necessarily describe a protein of moresuperior quality for the feeding of infants. Therefore, the Committee suggestsremoving this claim.
5. The Committee suggests removing the claim “low sodium”. All infant formulae andfollow-on formulae have a limitation of sodium contents within well-defined ranges,and no products with high sodium content are recommended or permitted for healthyinfants.
6. The Committee considers the claim “lactose free” to be of considerable relevance forthe choice of products intended to be fed to infants who do not tolerate lactose. Theacceptable maximum amount of residual lactose, if any, in formulae considered“lactose free” should not exceed 10 mg per 100 kcal. This proposal is based on theempirical guidance values for a safe intake of galactose (both free and �-glycosidic)for infants with classical galactosaemia).
7. Similarly, the Committee suggests removing the claim “sucrose free” or “saccharosefree” for infant formulae, as the Committee has recommended that sucrose(saccharose) should not be added to infant formulae except for infant formulae basedon protein hydrolysates where it may be used in limited amounts to achieve anacceptable taste.
8. The Committee further notes that the criteria used for the term “iron enriched” willbecome superfluous if the recommendation that all infant formulae should contain ironwithin the range specified in this report is adopted. Thus the Committee suggests
161
deleting this claim.
9. The Committee suggests permitting nutrition labelling of docosahexaenoic acid(DHA) content in infant formulae and in follow-on formulae if DHA contents equal atleast 0.2% of total fatty acid contents.
10. The Committee concludes there is no scientific foundation to base a claim that aformula induces “reduction of risk of allergy to milk proteins” or is “hypoallergenic”on a content of immunoreactive protein of less than 1% of nitrogen-containingsubstances, as is presently the case. The Committee suggests that such a limitedcontent of immunoreactive protein could indicate the compositional characteristics ofa formula as being based on a “protein hydrolysate”. However, the demonstration of acontent of immunoreactive protein of less than 1% of nitrogen-containing substancescannot predict any potential preventive effect on the risk of developing an allergy tomilk proteins (ESPGHAN, 1993; von Berg et al., 2003). Such functional effects canonly be based on controlled clinical trials following generally accepted scientificstandards. Therefore, the Committee recommends that any such claims that a formulainduces “reduction of risk of allergy to milk proteins” or is “hypoallergenic” shouldonly be allowed if adequate scientific evidence has been accepted by an independentscientific body reviewing such data.
11. The Committee recommends that the source of the protein or proteins used for theproduction of the hydrolysate should be declared. Moreover, the Committeerecommends not using the term “partial hydrolysate” since there is no agreeddefinition of “partial” or “extensive” hydrolysates and the effects of proteinhydrolysates on prevention of allergic manifestations appear not to be strictly relatedto the degree of hydrolysis, but may depend also on other properties of thehydrolysates and the formulae produced thereof (ESPGHAN, 1993; von Berg et al.,2003).
12. The Committee recommends that the scientific basis for claims for infant formulae, aslaid down in Annex IV of the Infant Formulae Directive, should be reconsidered,based on current scientific knowledge. The Committee recommends that mechanismsand criteria should be developed for the communication not only of relevantcompositional properties, but possibly also of selected other effects of infant formulaeor follow-on formulae if they have been demonstrated beyond doubt in rigorousstudies with adequate scientific standards, and the evidence has been accepted by anindependent scientific body reviewing such data.
13. The Committee notes that some dietetic products intended for infants with minor andmostly transient health complaints, such as repeated possetting or intestinaldiscomfort, are currently marketed as Dietary Foods for Special Medical Purposes.Neither the nature of the complaints concerned nor the recently adopted definition ofDietary Foods for Special Medical Purposes (Directive 1999/21/EC) justifies suchpresentation for the vast majority of these products. The Committee also notes thatsuch presentation has implications for the labelling and marketing practices of theseproducts. The Committee recommends that the scientific basis for the use, potentialbenefits and compositional aspects of such products should be reviewed.

162
XI. MODIFICATION OF THE COMPOSITION OF INFANTFORMULAE OR FOLLOW-ON FORMULAE BEYOND THE
ESTABLISHED STANDARDS
The Committee is aware of continuing improvements in the understanding of the complexcomposition of human milk, in dietary effects on physiological outcomes in the infant, and infood technology, which have led and will continue to lead to innovative modifications ofinfant formulae and follow-on formulae. The addition of new ingredients or of establishedingredients in newly determined amounts that deviate from the established guidance onformula composition, the reduction or elimination of current constituents, or any othermodification of formula composition should be made possible if the benefit, suitability andsafety for particular use by infants have been established by generally accepted scientific dataand this is overseen and evaluated by an independent scientific body prior to the introductionof such modified products into the market. Here we propose some general principles thatshould be followed in the evaluation of modifications of infant formulae or follow-onformulae with regard to their suitability and safety for particular nutritional use by infants.The Committee is aware, however, that details of the appropiate evaluation process of specificmodifications will have to be decided on a case by case basis, depending on the nature ofthose modifications.
1. The introduction of modifications to an infant formula or a follow-on formula beyondthe established standards should be based on and justified by defining an expectedbenefit (nutritional, functional, technological, or other). Any such modification shouldbe based on a systematic review of the relevant existing literature and otherinformation available in the area of the proposed innovation to develop a clearhypothesis or hypotheses on the expected benefits, and on safety considerations whichmight need to be addressed in an ensuing further evaluation. The hypotheses outlinedin the systematic review of the relevant existing information should form the basis forthe choice of potential further pre-clinical or clinical studies that may need to beperformed to evaluate a modification. In addition, general nutritional assessments maybe needed. Based on this systematic review and the description of the specificinnovation, its suitability and safety for the intended use, and the extent of potentialadditional scientific data that may be necessary, should be determined by anindependent scientific body prior to the commercialization of the modified product.
2. A detailed description of the modification in the composition and/or process should beprovided. Complete compositional data of the modified or new product, in particularinformation on those compounds that may be altered or newly formed during theprocess, including possible contaminants, should be provided. In case of addedingredients a full description of the new ingredient(s) should be provided, such as theirchemical name according to IUPAC nomenclature rules, CAS number (if any),synonyms, trade names and abbreviations, molecular and structural formulae,molecular weight, purity and impurities. If a mixture of compounds is used, theconstitutents of the mixture and proportion of each component should be reported. Incase of natural extracts, particular attention should be given to other components of theextract and possible allergenic residues from the original source. Specifications,manufacturing processes, methods of analysis in formulae, and reaction and fate informulae to which the ingredient is added should be reported as outlined in the SCFguidance document on safety evaluation of sources of nutrients (SCF, 2001a).

163
3. Further required data are the way of addition of new ingredients, and a description ofthe technological processes applied to the formula, with particular emphasis on the drymixing vs. wet mixing steps. When the innovation includes addition of a newingredient submitted to further processing, potential effects on the ingredient and othercomponents of the formula should be characterized. When innovation is limited to theuse of a new source of a nutrient or ingredient authorized by the EU legislation orevaluated by the Committee, which is added by dry mixing and for which nointerference with other formula ingredients is to be expected, pre-clinical assessmentmay be limited to the ingredient itself following the guidance previously provided bythe Committee (SCF, 2001a).
4. All available biological and toxicological information should be reported, such asbioavailability of added or modified compounds from the formula, subsequentmetabolic fate and biological distribution, biological effects and underlying knownmechanisms, any known interactions with other components of the formula, impact ofadded or modified compounds on gastrointestinal physiology and the absorption ofother nutrients, and any toxicological information. Safety data should be applicable tothe population for which the product is intended as far as possible.
5. Information on in vitro or in vivo studies in animal models or other experimentalsettings should be provided if they may help to establish information on nutritionaladequacy, potential benefits, and safety of the proposed innovation. When innovationinvolves a change in protein source, or any technological process that may affectprotein quality, pre-clinical assessment should include not only amino-acid profile, butalso a relevant measurement of amino-acid availability (for instance lysine blockageand protein efficiency).
6. If the innovation falls under the definition of a novel food, the Novel Food procedureas described in Directive 258/97/EEC should apply, and the respective SCF guidelines(SCF, 1997) should be followed.
7. In case sources of nutrients or other ingredients are used that contain or are derivedfrom genetically modified organisms, the SCF guidance on safety evaluation of GMOs(SSC, 2003) should be followed.
8. In addition to preclinical assessment, clinical trials may often be needed to furthercharacterise the suitability and safety of modifications that extend beyond theestablished standards of infant formulae and follow-on formulae. Clinical studiesshould only be undertaken if there is reasonable assurance on the probable suitabilityand safety in infants from the preclinical assessment. The gold standard for theevaluation of outcomes in infants fed a modified infant formula should be thecomparison with outcomes seen in healthy infants who have been exclusively breast-fed for four to six months, but comparative studies with established formulae may alsobe useful. If clinical studies are to be performed, they should follow the generalprinciples of Good Clinical and Good Laboratory Practices. Ethical approval should beacquired and informed parental consent obtained, and this should be declared in thereport of results. The study design should consider from the outset the statistical powerof the study, and the confidence limits of any differences found should be included inthe reports on the studies. All infants participating in clinical trials should becharacterised with regard to factors which might affect the planned outcomes. A coredata set that should be reported for all nutritional studies in infants has been proposed
164
(ESPGHAN, 2003a). Blind randomisation with respect to the allocation of test andreference formulae should be used whenever the innovation under evaluation allowsthis approach. The possibility of unexpected adverse outcomes should be anticipatedand addressed by adequate clinical monitoring of participants, and by incorporatinginto the study design arrangements for the independent scrutiny of the accumulatingdata. Preliminary pilot studies of the proposed study design may be useful to identifyand anticipate outcomes and issues which would inform definitive studies and enableprotocols to be adapted, and they also would enable the views of the infants’ carers tobe taken into account.
9. A growth study in infants should be performed if the modification may reasonably beexpected to have an effect on growth. Examples where a growth study would appearnecessary are changes in energy density beyond established limits, significant changesin macronutrient composition, new or markedly modified nitrogen sources, or possiblealterations of bioavailability of macronutrients. Results should be compared either tothose achieved with a reference formula, or to breast fed populations, considering thatmaximal weight gain is not always optimal weight gain. Studies to evaluate infantgrowth should have a duration of at least 3 months, should preferably start from birth,and should include, as a minimum, monthly measures of the growth parametersweight, length and head circumference. Growth studies should be designed to have apower to detect a difference in weight gain equal to 0.5 standard deviations. It isdesirable to also include some measure of body composition, such as assessments ofskinfold thickness and arm circumference, as well as a measure of infant formulaintake, but this is considered optional.
10. In specific cases, the monitoring of adverse responses by consumers, medical doctorsand other health care professionals after the introduction of a new infant formula or asignificantly changed infant food into the market may be useful. The effectiveexecution of such an “post market monitoring” would require the definition of furtherdetails such as the the specific questions to be addressed and information to becollected, conditions of data collection (e.g. spontaneous reports by consumers orhealth professional, or active surveillance methods), and the conditions of dataevaluation by an independent scientific body.
165
XII. REFERENCES
AAP (American Academy of Pediatrics, Committee on Nutrition) (1999). Iron fortification ofinfant formulas. Pediatrics 104: 119-123.
Abrams SA, Griffin IJ, Davila PM (2002). Calcium and zinc absorption from lactose-containing and lactose-free infant formulas. Am J Clin Nutr 76: 442-446.
Abumrad NN, Schneider AJ, Steel D, Rogers LS (1981). Amino acid intolerance duringprolonged total parenteral nutrition reversed by molybdate therapy. Am J Clin Nutr 34: 2551-2559.
Adlof RO, Duval S, Emken EA (2000). Biosynthesis of conjugated linoleic acid in humans.Lipids 35: 131-5.
AFSSA (Agencie Française de Sécurité Sanitaire des Aliments) (2001). Comité de Nutritionde la Société Française de Pédiatrie. Nourrissons, enfants et adolescents. In: A Martin, éd.Apports nutritionnels conseillés pour la population française, 3ème édition, Cnerna-CNRS,Editions Tec et Doc, Paris, pp. 255-291.
AFSSA (Agence Française de Sécurité Sanitaire des Aliments (2003). Alimentation infantileet modification de la flore intestinale (Working document).
Agostoni C, Carratù B, Boniglia C, Riva E, Sanzini E (2000). Free amino acid content instandard infant formulas: comparison with human milk. J Am Coll Nutr 19: 434-438.
Åkeson, PK, Axelsson IEM, Räihä NCR, Warm A, Minoli I, Moro G (2000). Protein intakeand metabolism in formula-fed infants given Swedish or Italian weaning foods. Acta Paediatr89 158-164.
Ala-Houhala M (1985). 25-Hydroxyvitamin D levels during breast-feeding with and withoutmaternal or infantile supplementation of vitamin D. J Pediatr Gastroenterol Nutr 4: 220-226.
Alam NH, Meier R, Rausch T, Meyer-Wyss B, Hildebrand P, Schneider H, Bachmann C,Minder E, Fowler B, Gyr K (1998). Effects of a partially hydrolyzed guar gum on intestinalabsorption of carbohydrate, protein and fat: a double-blind controlled study in volunteers.Clin Nutr 17: 125-129.
Alessi M, Paul T, Scaiano JC, Ingold KU (2002). The contrasting kinetics of peroxidation ofvitamin E-containing phospholipids unilamellar vesicles and human low-density lipoprotein. JAm Chem Soc 124: 6957-6965.
Alexy U, Kersting M, Sichert-Hellert W, Manz F, Schöch G (1999). Macronutrient intake of3- to 36-month old German infants and children: results of the DONALD study. Ann NutrMetab 43: 14-22.
Al-Saleh I, al-Doush I (1997). Selenium levels in infant milk formula. Biometals 10: 299-302.
Anceschi MM, Petrelli A, Zaccardo G, Barbati A, di Renzo GC, Cosmi EV, Hallman M(1988). Inositol and glucocorticoid in the development of lung stability in male and femalerabbit fetuses. Pediatr Res 24: 617-621.

166
Andelman MB, Sered BR (1966). Utilization of dietary iron by term infants: a study of 1,048infants from a low socio-economic population. Am J Dis Child 111: 45-55.
Anderson JW, Johnstone BM, Remley DT (1999). Breast-feeding and cognitive development:a meta-analysis. Am J Clin Nutr 70: 525-535.
Andersson H, Asp NG, Bruce A, Roos S, Wadström A, Wold AE (2001). Health effects ofprobiotics and prebiotics. A literature review on human studies. Scand J Nutr 45: 58-75.
Andersson Y, Lindquist S, Lagerqvist C, Hernell O (2000). Lactoferrin is responsible for thefungistatic effect of human milk. Early Hum Dev 59: 95-105.
Andrews NC (1999). Disorders of iron metabolism. N Engl J Med 341: 1986-1995.
Angeles IT, Schultink WJ, Matulessi P, Gross R, Sastroamidjojo S (1993). Decreased rate ofstunting among anemic Indonesian preschool children through iron supplementation. Am JClin Nutr 58: 339-342.
Angelsen NK, Vik T, Jacobsen G, Bakketeig LS (2001). Breast feeding and cognitivedevelopment at age one and five years. Arch Dis Child 85: 183-188.
Arbuckle LD, MacKinnon MJ, Innis SM (1994). Formula 18:2 (n-6) and 18:3 (n-3) contentand ratio influence long-chain polyunsaturated fatty acids in the developing piglet liver andcentral nervous system. J Nutr 124: 289-298.
Armstrong J and Reilly JJ (2002). Breastfeeding and lowering the risk of childhood obesity.Lancet 359: 2003-2004.
Arnaud CD, Sanchez SD (1996). Calcium and phosphorus. In: Present Knowledge inNutrition. 7th ed (Ziegler EE, Filer Jr LJ, eds) ILSI Press, Washington DC, pp 245-255.
Arneil GC, Chin KC (1979). Lower-solute milks and reduction of hypernatremia in youngGlasgow infants. Lancet 2: 840.
Ascherio A, Willett WC, Rimm EB, Giovannucci EL, Stampfer MJ (1994). Dietary ironintake and risk of coronary disease among men. Circulation 89: 969-974.
Asnes RS, Wisotsky DH, Migel PF Seigle RL, Levy J (1982). The dietary chloride deficiencysyndrome occurring in a breast-fed infant. J Pediatr 100: 923-924.
Atkinson SA, Alston-Mills B, Lonnerdal B, Neville MC (1995). Major minerals and ionicconstituents of human and bovine milks. In: Handbook of Milk Composition (Jensen RG, ed)Academic Press Inc, New York, NY, pp 593-622.
Atkinson SA, Randall-Simpson J, Paes B, Lönnerdal B (1996). Plasma ferritin (Ft),transferrin receptors (TfR) and log TfR/Ft ratio as indices of iron deficiency in infantsrandomized to formulas with 1.5, 3, 7 or 12 mg iron/L. Exp Biol 10: A291.
Aukema HM and Holub BJ (1994). Inositol. In: Modern Nutrition in Health and Disease. 8th
ed. Vol. 1 (Shils ME, Olson JA, Shike M, eds.) Lea & Febiger, Philadelphia PA, pp 466-472.
Aukett MA, Parks YA, Scott PH, Wharton BA (1986). Treatment with iron increases weightgain and psychomotor development. Arch Dis Child 61: 849-857.

167
Bach AC, Babayan V (1982). Medium-chain triglycerides: an update. Am J Clin Nutr 36:950-62.
Badger TM, Ronis MJJ, Hakkak R, Rowlands JC, Korourian S (2002). The healthconsequences of early soy consumption. J Nutr 132: 559S-565S
Bamji MS, Chowdhury N, Ramalakshmi B, Jacob CM (1991). Enzymatic evaluation ofriboflavin status of infants. Eur J Clin Nutr 45: 309-313.
Bässler KH, Golly I, Loew D, Pietrzik K (2002). In: Vitamin-Lexikon. 3rd ed. (Urban andFischer Eds.), Munich, pp 1-728.
Bates CJ, Prentice A (1994). Breast milk as a source of vitamins essential minerals and traceelements. Pharmac Ther 62: 193-220.
Bayley TM, Alsami M, Thorkelson T, Krug-Wispe S, Jones PJH, Bulani JL, Tsang RS(1998). Influence of formula versus breast milk on cholesterol synthesis rates in four-month-old infanbts. Pediatr Res 44: 60-67.
Beaton GH (1985). Nutritional needs during the first year of life. First year of life Someconcepts and perspectives. Pediatr Clin North Am 32: 275-288.
Bell EF (1989). Upper limit of vitamin E in infant formulas. J Nutr 119: 1829-1831.
Bergmann RL, Bergmann KE (1991). Fluoride nutrition in infancy - is there a biological roleof fluoride for growth? In: Trace elements in nutrition of children - II (Chandra RK, ed.)Nestlé Nutrition Workshop Series, Vol 23. New York, Raven Press, pp 105-116.
Bernback S, Blackberg L, Hernell O (1990). The complete digestion of human milktriacylglycerol in vitro requires gastric lipase, pancreatic colipase-dependent lipase, and bilesalt-stimulated lipase. J Clin Invest 85: 1221-26.
BgVV Working Group “Probiotic Microorganism Cultures in Food“ (1999). Final report.http://www.bfr.bund.de/cms/detail.php?template=internet_de_index_js.
Bindels JG and Harzer G (1985). Aminosäuren- und Proteinzusammensetzung derFrauenmilch im Verlauf der Laktation. Ernährungs-Umschau 33: 233-234.
Birlouez-Aragon I (1999). Effect of iron fortification on protein nutritional quality of infantand growth formulas. Recent Res Dev Agric Food Chem 3: 139-148.
Biser-Rohrbaugh A and Hadley-Miller N (2001). Vitamin D deficiency in breast-fed toddlers.J Pediatr Orthop 21: 508-511.
Bitman J, Wood DL, Mehta NR, Hamosh P and Hamosh M (1984). Comparison of thephospholipid composition of breast milk from mothers of term and preterm infants duringlactation. Am J Clin Nutr 40:1103-19.
Blaut M, Collins MD, Welling GW, Doré J, van Loo J, de Vos W (2002). Molecularbiological methods for studying the gut microbiota: the EU human gut flora project. Br J Nutr87 (Suppl 2): 203-211.

168
Bleichrodt N and Born MP (1994). A meta-analysis of research on iodine and its relationshipto cognitive development. In: The damaged brain of iodine deficiency: cognitive, behavioral,neuromotor, educative aspects. (Stanbury JB, ed.), New York, Cognizant Communication, pp195-200.
BNF (British Nutrition Foundation) (1992). Task Force on Unsaturated Fatty Acids.Unsaturated fatty acids: nutritional and physiological significance. London: Chapman & Hall.
Boehm G, Lidestri M, Casetta P, Jelinek J, Negretti F, Stahl B, Marini A (2002).Supplementation of a bovine milk formula with an oligosaccharide mixture increases countsof faecal bifidobacteria in preterm infants. Arch Dis Child Fetal Neonatl Ed 86: F178-F181.
Borman A, Wood TR, Balck HC, Anderson EG, Oesterling MJ, Womack M, Rose WC(1946). The role of arginine in growth with some observations on the effect of argininic acid.J Biol Chem 166: 585-594.
Borrelli O, Salvia G, Campanozzi A, Franco MT, Moreira FL, Emiliano M, Campanozzi F,Cucchiara S (1997). Use of a new thickened formula for treatment of symptomaticgastroesophageal reflux in infants. Ital J Gastroenterol Hepatol 29: 237-242.
Borschel MW (1995). Vitamin B-6 in infancy: requirement and current feeding practices. In:Vitamin B-6 Metabolism in Pregnancy, Lactation and Infancy. (Ratten DJ, ed.) Boca Raton,CRC Press, pp 109-124.
Bosscher D, Van Caillie-Bertrand M, Deelstra H (2001). Effect of thickening agents, based onsoluble dietary fiber, on availability of calcium, iron, and zinc from infant formulas. Nutrition17: 614-618.
Bosscher D, Van Caillie-Bertrand M, Van Dyck K, Robberecht H, Van Cauwenbergh R,Deelstra H (2000). Thickening infant formula with digestible and indigestible carbohydrate:availability of calcium, iron, and zinc in vitro. J Pediatr Gastroenterol Nutr 30: 373-378.
Bouhnik Y, Vahedi KAL, Attar A, Salfati J, Pochart P, Marteau P, Flourie B, Bornet F,Rambaud JC (1999). Short-chain fructo-oligosaccharide administration dose-dependentlyincreases faecal bifidobacteria in healthy humans. J Nutr 129: 113-116.
BPA (British Paediatric Association) (1956). Hypercalcemia in infants and Vitamin D. BrMed J 2: 149.
BPA (British Paediatric Association) (1964). Infantile hypercalcemia, nutritional rickets andinfantile scurvy in Great Brittain. Br Med J 1: 1639-1661.
Bradley CK, Hillman L, Sherman AR, Leedy D, Cordano A (1993). Evaluation of two iron-fortified, milk-based formulas during infancy. Pediatrics 91: 908-914.
Brand JM and Greer FR (1990). Hypermagnesemia and intestinal perforation followingantacid administration in a premature infant. Pediatrics 85: 121-124.
Braverman LE (1994). Iodine and the thyroid - 33 years of study. Thyroid 4: 351-356.
Bromberger P and Hallman M (1986). Myoinositol in small preterm infants: relationshipbetween intake and serum concentration. J Pediatr Gastroenterol Nutr 5: 455-458.

169
Brooke OG (1980). Energy balance and metabolic rate in preterm infants fed fed withstandard and high-energy formulas. Br J Nutr 44: 13-23.
Brown KM, Morrice PC, Duthie GG (1997). Erythrocyte vitamin E and plasma ascorbateconcentrations in relation to erythrocyte peroxidation in smokers and nonsmokers: doseresponse to vitamin E supplementation. Am J Clin Nutr 65: 496-502.
Brown RO, Forloines-Lynn S, Cross RE, Heizer WD (1986). Chromium deficiency afterlong-term parenteral nutrition. Dig Dis Sci 31: 661-664.
Bruce RC and Kliegman RM (1997). Hyponatremic seizures secondary to oral waterintoxication in infancy: association with commercial bottled drinking water. Pediatrics 100:E4.
Brugnara C and Platt OP (1998). The neonatal erythrocyte and its disorders. In: Nathan andOski’s haematology of infancy and childhood. (Nathan DG and Orkin SH, eds.) Philadelphia,PA, WB Saunders, pp 19-52.
Bruner AB, Joffe A, Duggan AK, Casella JF, Brandt J (1996). Randomised study of cognitiveeffects of iron supplementation in non-anaemic iron-deficient adolescent girls. Lancet 348:992-996.
Brunser O, Espinoza J, Araya M, Cruchet S, Gil A (1994). Effect of dietary nucleotidesupplementation on diarrhoeal disease in infants. Acta Paediatr 82: 188-191.
Brunvand L and Brunvatne R (2001). [Health problems among immigrant children inNorway]. Tidsskr Nor Laegeforen 121: 715-718 (in Norwegian).
Buchman AL, Moukarzel A, Jenden DJ, Roch M, Rice K, Ament ME (1993). Low plasmafree choline is prevalent in patients receiving long term parenteral nutrition and is associatedwith hepatic amintransferase abnormalities. Clin Nutr 12: 33-37.
Buchman AL, M Dubin, Moukarzel AA, Jenden DJ, Roch M, Rice K, Gornbein J, Ament ME(1995). Choline deficiency: a cause of hepatic steatosis during parenteral nutrition that can bereversed with intravenous choline supplementation. Hepatology 22: 1399-1403.
Buchman, AL, Dubin M, Jenden DJ, Moukarzel A, Roch M, Rice K, Gornbein J, Ament ME,Eckhert CD (1992). Lecithin increases plasma free choline and decreases hepatic steatosis inlong-term total parenteral nutrition patients. Gastroenterology 102: 1363-1370.
Buchman, AL, Sohel M, Moukarzel A, Bryant D, Schanler R, Awal M, Burns P, Dorman K,Belfort M, Jenden DJ, Killip D, Roch M (2001). Plasma choline in normal newborn infants,toddlers, and in very-low-birth-weight neonates requiring total parenteral nutrition. Nutrition17: 18-21.
Businco L, Bruno G, Gianpietro PG, Furculo G, Lucaroni F (2000). No estrogenic hormonaleffects in children fed soy formula long term. J Nutr 130: 710S-711S (abstr).
Butte NF (1996). Energy requirements in infants. Eur J Clin Nutr 50 (Suppl 1): S24-S36.
Butte NF (2001). The role of breastfeeding in obesity. Pediatr Clin North Am 48: 189-198.

170
Butte NF, Garza C, Nichols BL, O'Brien Smith E (1984). Human milk intake and growth inexclusively breast-fed infants. J Pediatr 104 187-195.
Butte NF, O’Brian SE, Garza C (1990). Energy utilization of breast-fed and formula-fedinfants. Am J Clin Nutr 51: 350-358.
Butte NF, Wong WW, Hopkinson JM, Heinz CJ, Mehta NR, Smith EO (2000a). Energyrequirements derived from total energy expenditure and energy deposition during the first 2 yof life. Am J Clin Nutr 72: 1558-1569.
Butte NF, Wong WW, Hopkinson JM, Smith EO, Ellis KJ (2000b). Infant feeding modeaffects early growth and body composition. Pediatrics 106: 1355-1366.
Butte NF, Wong WW, Hopkinson JM (2001). Energy requirements of lactating womenderived from doubly labeled water and milk energy output. J Nutr 131: 53-58.
Calbet JAL and MacLean DA (2002). Plasma glucagon and insulin responses depend on therate of appearance of amino acids after ingestion of different protein solutions in humans. JNutr 132: 2174-2182.
Calvo EB, Galindo AC, Aspres NB (1992). Iron status in exclusively breast-fed infants.Pediatrics 90: 375-379.
Campfield T, Braden G, Flynn-Valone P, Clark N (1994). Urinary oxalate excretion inpremature infants: effect of human milk versus formula feeding. Pediatrics 94: 674-678.
Carabin IG and Flamm WG (1999). Evaluation of safety of inulin and oligofructose as dietaryfiber. Regulat Toxicol Pharmacol 30: 268-282.
Carey MC and Hernell O (1992). Digestion and absorption of fat (1992). Seminars inGatrointestinal Disease 3: 189-208.
Carlson SE and Neuringer M (1999). Polyunsaturated fatty acid status and neurodevelopment:a summary and critical analysis of the literature. Lipids 34: 171-178.
Carlson SE, Montalto MB, Ponder DL, Werkman SH, Korones SB (1998). Lower incidenceof necrotizing enterocolitis in infants fed a preterm formula with egg phospholipids. PediatrRes 44: 491-498.
Carnielli VP, Luijendijk IHT, van Goudoever JB, Sulkers EJ, Boerlage AA, Degenhart HJ,Sauer PJJ (1995). Feeding premature newborn infants palmitic acid in amounts andstereoisomeric position similar to that of human milk: effects on fat and mineral balance. AmJ Clin Nutr 61: 1037-1042.
Carnielli VP, Luijendijk IHT, Van Goudoever JB, Sulkers EJ, Boerlage AA, Degenhart HJ,Sauer PJ (1996a). Structural position and amount of palmitic acid in infant formulas: effectson fat, fatty acid, and mineral balance. J Pediatr Gastroenterol Nutr 23: 553-560.
Carnielli VP, Wattimena DJ, Luijendijk IH, Boerlage A, Degenhart HJ, Sauer PJ (1996b).The very low birth weight premature infant is capable of synthesizing arachidonic anddocosahexaenoic acids from linoleic and linolenic acids. Pediatr Res 40: 169-174.
Carroll AE, Garrison MM, Christakis DA (2002). A systematic review of nonpharmacological

171
and nonsurgical therapies for gastroesophageal reflux. Arch Pediatr Adolesc Med 156: 109-113.
Carver JD, Pimental B, Cox WI, Brness LA (1991). Dietary nucleotide effects upon immunefunction in infants. Pediatrics 88: 359-363.
Casey CE, Hambidge KM, Neville MC (1985). Studies in human lactation: zinc, copper,manganese and chromium in human milk. Am J Clin Nutr 49: 773-785.
Chandra RK (1997). Five-year follow-up of high-risk infants with family history of allergywho were exclusively breast-fed or fed partial whey hydrolysate, soy, and conventional cow'smilk formulas. J Pediatr Gastroenterol Nutr 24: 380-388.
Chapell JE, Clandinin MT, Kearny-Volpe C, Reichmann B, Swyer PW (1986). Fatty acidbalance studies in premature infants fed human milk or formula. Effect of calciumsupplementation. J Pediatr 108: 439-447.
Chierici R, Sawatzki G, Tamisari L, Volpato S, Vigi V (1992). Supplemenation of an adaptedformula with bovine lactoferrin, 2: effects on serum iron, ferritin and zinc levels. ActaPaediatr 81: 475-479.
Christian M, Edwards C, Weaver LT (1999). Starch digestion in infancy. J PediatrGastroenterol Nutr 29: 116-124.
Churella HR, Borschel MW, Thomas MR, Breen M, Jacobs J (1994). Growth and proteinstatus of term infants fed soy protein formulas differing in protein content. J Am Coll Nutr 13:262-267.
Clagett-Dame M and De Luca HF (2002). The role of vitamin a in Mammalian reproductionand embryonic development. Annu Rev Nutr 22: 347-381.
Clandinin MT, Chappell JE, Leong S, Heim T, Swyer PR, Chance GW (1980a). Intrauterinefatty acid accretion rates in human brain: implications for fatty acid requirements. Early HumDev 4: 121-129.
Clandinin MT, Chappell JE, Leong S, Heim T, Swyer PR, Chance GW (1980b). Extrauterinefatty acid accretion in infant brain: implications for fatty acid requirements. Early Hum Dev 4:131-138.
Clandinin MT, Chappell JE, van Aerde JE (1989). Requirements of newborn infants for longchain polyunsaturated fatty acids.Acta Paediatr Scand 351 (Suppl): 63-71.
Clarke SD and Jump DB (1996). Polyunsaturated fatty acid regulation of hepatic genetranscription. J Nutr 126 (Suppl): 1105-1109.
Cocho JA, Cervilla JR, Rey-Goldar ML, Fdez-Lorenzo JR, Fraga JM (1992). Chromiumcontent in human milk, cow’s milk, and infant formulas. Biol Trace Elem Res 32: 105-107.
Cockcroft S (2001). Signalling roles of mammalian phospholipase D1 and D2. Cell Mol LifeSci 58: 1674-1687.
CAC (Codex Alimentarius Commission) (1981). Codex standard for infant formula. Codexstan 72- 1981.

172
CAC (Codex Alimentarius Commission) (1994). Joint FAO/WHO Food StandardsProgramme. Codex alimentarius vol. 4. Foods for special dietary uses (including foods forinfants and children). Part 2 – Foods for infants and children. Food and AgricultureOrganization and World Health Organization. Rome, pp 15-75.
CAC (Codex Alimentarius Commission) (2002). Proposed draft revised standard for infantformula (Codex Stan 72/1981). Codex Alimentarius Commission 25th session. ALINORM03/26, pp 44-54.
Cole CR, Rising R, Lifshitz F (1999). Consequences of incomplete carbohydrate absorptionfrom juice consumption in infants. Arch Pediatr Adolesc Med 153: 1098-1102.
COMA (Committee on Medical Aspects of Food Policy) (1991). Dietary Reference Valuesfor food energy and nutrients for the United Kingdom. Report on Health and Social SubjectsNo 41. London, HMSO.
COMA (Committee on Medical Aspects of Food of Food Policy) (1996). Guidelines on thenutritional assessment of infant formulas. Report on Health and Social Subjects No. 47.London, HMSO.
Commission Directive 91/321/EEC of 14 May 1991 on infant formulae and follow-onformulae. Official Journal of the European Communities, 04.07.1991, L 175, p 35.
Commission Directive 95/2/EC of the 20 February 1995 on food additives other than coloursand sweeteners. Official Journal of the European Communities, 18.03.1995, L 61.
Commission Directive 96/4/EC of 16 February 1996 amending Directive 91/321/EEC oninfant formulae and follow-on formulae. Official Journal of the European Communities,28.02.1996, L 49.
Commission Directive 1999/21/EC of 25 March 1999 on dietary foods for special medicalpurposes. Official Journal of the European Communities, 07.04.1999, L 91/29.
Commission Directive 1999/50/EC of 25 May 1999 amending Directive 91/321/EEC oninfant formulae and follow-on formulae. Official Journal of the European Communities,02.06.1999, L 139.
Commission of the European Communities. White Paper on Food Safety. COM (1999) 719final. http://europa.eu.int/eur-lex/en/com/wpr/1999/com1999_0719en01.pdf
Cornelissen M, von Kries R, Loughnan P, Schubiger G (1997). Prevention of vitamin Kdeficiency bleeding: efficacy of different multiple oral dose schedules of vitamin K. Eur JPediatr 156: 126-130.
Corrigan JJ Jr and Marcus FI (1974). Coagulopathy associated with vitamin E ingestion.JAMA 230: 1300-1301.
Cosgrove M (1998). Perinatal and infant nutrition. Nucleotides. Nutrition 14: 748-751.
Council Directive 89/398/EEC of 3 May 1989 on approximation of the laws of the MemberStates relating to foodstuffs intended for particular nutritional uses. Official Journal of theEuropean Communities, 30.6.1989, L 186, p 27.

173
Csaszar A and Abel T (2001). Receptor polymorphisms and diseases. Eur J Pharmacol 414: 9-22.
CSH (Conseil Supérieur d’Hygiéne) (2000). Recommendations Nutrionnelles en Belgique –Révision 2000.
Cummings JH, Macfarlane GT, Englyst HN (2001). Prebiotic digestion and fermentation. AmJ Clin Nutr 73: 415S-420S.
Cunningham C, Tipton KF, Dixon HBF (1998). Conversion of taurine into N-chlorotaurine(taurine chloramine) and sulphoacetaldehyde in response to oxidative stress. Biochem J 330:939-945.
D’Souza RM and D’Souza R (2002). Vitamin A for treating measles in children. CochraneDatabase Syst Rev (1): CD001479.
D-A-CH Referenzwerte (2000). Deutsche Gesellschaft für Ernährung, ÖsterreichischeGesellschaft für Ernährung, Schweizerische Gesellschaft für Ernährungsforschung,Schweizerische Vereinigung für Ernährung: Referenzwerte für die Nährstoffzufuhr,Umschau/Braus Verlag, Frankfurt.
Dakshinamurti K (1994). Biotin. In: Modern Nutrition in Health and Disease (Shils ME,Olson JA, Shike M, eds.) Philadelphia, Lea & Febiger, pp 426-431.
Dallman PR (1992). Changing iron needs from birth through adolescence. In: Nutritionalanemias. (Nestlé Nutrition Workshop Series) (Fomon SJ, Zlotkin S, eds.) New York, RavenPress, pp 29-36.
Dallman PR and Siimes MA (1979). Percentile curves for hemoglobin and red cell volume ininfancy and childhood. J Pediatr 94: 26-31.
Dalton MA, Sargent JD, O’Connor GT, Olmstead EM, Klein RZ (1997). Calcium andphosphorus supplementation of iron-fortified infant formula: no effect on iron status ofhealthy full-term infants. Am J Clin Nutr 65: 921-926.
Daly A, MacDonald A, Aukett A, Williams J, Wolf A, Davidson J, Booth IW (1996).Prevention of anaemia in inner city toddlers by an iron supplemented cow’s milk formula.Arch Dis child 75: 9-16.
Danesh J and Appleby P (1999). Coronary heart disease and iron status: meta-analyses ofprospective studies. Circulation 99: 852-854.
Darragh AJ and Moughan PJ (1998). The amino acid composition of human milk correctedfor digestibility. Br J Nutr 80: 25-34.
Davidsson L, Cederblad A, Lönnerdal B, Sandström B (1989). Manganese absorption fromhuman milk, cow’s milk, and infant formulas in humans. Am J Dis Child 143: 823-827.
Davidsson L, Galan P, Kastenmayer P, Cherouvrier F, Juillerat MA, Hercberg S, Hurrell RF(1994). Iron bioavailability studied in infants: the influence of phytic acid and ascorbic acid ininfant formulas based on soy isolate. Pediatr Res 36: 816-822.
174
Davidsson L, Kastenmayer P, Yuen M, Lönnerdal B, Hurrell RF (1994). Influence oflactoferrin on iron absorption from human milk in infants. Pediatr Res 35: 117-124.
Davies PS (1998). Energy requirements for growth and development in infancy. Am J ClinNutr 68: 939S-943S.
Davies DP, Ansari BM, Mandal BK (1979). The declining incidence of infantilehypernatremic dehydration in Great Britain. Am J Dis Child 133: 148-150.
Davis TA, Nguyen HV, Garcia-Bravo R, Fiorotto ML, Jackson EM, Lewis DS, Lee DR,Reeds PJ (1994). Amino acid composition of human milk is not unique. J Nutr 124: 1126-1132.
Dawson MI (2000). The importance of vitamin A in nutrition. Curr Pharm Des 6: 311-325.
De Bruin NC, Degenhart HJ, Gal S, Westerterp K, Stijnen T, Visser HK (1998). Energyutilization and growth in breast-fed and formula-fed infants measured prospectively duringthe first year of life. Am J Clin Nutr; 67: 885-896.
Dean TP, Adler BR, Ruge F, Warner JO (1993). In vitro allergenicity of cow’s milksubstitutes. Clin Exp Allergy 23: 205-210.
Decsi T, Burus I, Molnar S, Minda H, Veitl V (2001). Inverse association between transisomeric and long-chain polyunsaturated fatty acids in cord blood lipids of full-term infants.Am J Clin Nutr 74: 364-368.
Decsi T and Koletzko B (1995). Do trans fatty acids impair linoleic acid metabolism inchildren? Ann Nutr Metab 39: 36-41.
Delange F (1994). The disorders induced by iodine deficiency. Thyroid 4: 107-128.
Delange F, Wolff P, Gnat D, Dramaix M, Pilchen M, Vertongen F (2001). Iodine deficiencyduring infancy and early childhood in Belgium: does it pose a risk to brain development? EurJ Pediatr 160: 251-254.
DeMaeyer E and Adiels-Tegman M (1985). The prevalence of anaemia in the world. WorldHealth Stat Q 38: 302-316.
Deneo-Pellegrini H, De Stefani E, Boffetta P, Ronco A, Mendilaharsu M (1999). Dietary ironand cancer of the rectum: a case-control study in Uruguay. Eur J Cancer Prev 8: 501-508.
Dewey KG (1998a). Growth characteristics of breast-fed compared to formula-fed infants.Biol Neonate 74: 94-105.
Dewey KG (1998b). Growth patterns of breastfed infants and the current status of growthcharts for infants. J Hum Lact 14: 89-92.
Dewey KG (2001). Nutrition, growth, and complementary feeding of the breastfed infant.Pediatr Clin North Am 48: 87-104.
Dewey KG, Peerson JM, Brown KH, Krebs NF, Michaelsen KF, Persson LA, Salmenpera L,Whitehead RG, Yeung DL (1995). Growth of breast-fed infants deviates from current
175
reference data: a pooled analysis of US, Canadian, and European data sets. World HealthOrganization Working Group on Infant Growth. Pediatrics 96: 495-503.
Dewey KG, Beaton G, Fjeld C, Lönnerdal B, Reeds P (1996). Protein requirements of infantsand children. Eur J Clin Nutr 50 (Suppl 1): S119-S150.
Dewey KG, Domellof M, Cohen RJ, Landa Rivera L, Hernell O, Lönnerdal B (2002). Ironsupplementation affects growth and morbidityof breast-fed infants: results of a randomisedtrial in Sweden and Honduras. J Nutr 132: 3249-3255.
Dieter HH, Schimmelpfennig W, Meyer E, Tabert M (1999). Early childhood cirrhoses (ECC)in Germany between 1982 and 1994 with special consideration of copper etiology. Eur J MedRes 4: 233-242.
Divi RL, Chang HC, Doerge DR (1997). Anti-thyroid isoflavones from soybean. BiochemPharmacol 54: 1087-1096.
Domellöf M and Hernell O (2002). Iron-deficiency anaemia during the first two years of life.Scand J Nutrition 46: 20-30.
Domellöf M, Cohen RJ, Dewey KG, Hernell O, Landa-Rivera L, Lönnerdal B (2001). Ironsupplementation of breast-fed Swedish and Honduran infants from 4-9 months of age. JPediatr 138: 679-687.
Domellöf M, Lönnerdal B, Abrams SA, Hernell O (2002). Iron absorption in breast-fedinfants: Effect of age, iron status, iron supplements and complementary foods. Am J Clin Nutr76: 198-204.
Donovan SM and Lönnerdal B (1989a). Development of a human milk protein standard. ActaPaediatr Scand 78: 171-179.
Donovan SM and Lönnerdal B (1989b). Non-protein nitrogen and true protein in infantformulas. Acta Paediatr Scand 78: 497-504.
Dorea JG (2002). Selenium and breast-feeding. Br J Nutr 88: 443-461.
Dorosty AR, Emmett PM, Cowin IS, Reilly JJ (2000). Factors associated with early adiposityrebound. Pediatrics 105: 1115-1118.
Dostalova L, Salmenpera L, Vaclavikova V, Heinz-Erian P, Schuep W (1988). Vitaminconcentrations in term milk of European mothers. In: Vitamins and Minerals in Pregnancyand Lactation (Berger H, ed.) Nestle Nutrition Workshop Series, vol 16, New York, RavenPress, pp 275-298.
Eder K, Slomma N, Becker K (2002). Trans-10, cis-12 conjugated linoleic acid suppresses thedesaturation of linoleic and �-linolenic acids in HepG2 cells. J Nutr 132: 1115-1121.
Eife R, Weiss M, Barros V, Sigmund B, Goriup U, Komb D, Wolf W, Kittel J, Schramel P,Reiter K (1999). Chronic poisoning by copper in tap water: I. Copper intoxications withpredominantly gastointestinal symptoms. Eur J Med Res 4: 219-223.
Einstein RS and Blemings KP (1998). Iron responsive elements and iron homeostatis. JNutrition 128: 2295-2298.

176
Eke F and Nte A (1996). A prospective clinical study of patients with hypernatraemicdehydration. Afr J Med Med Sci 25: 209-212.
Elias SL and Innis SM (2001). Infant plasma trans, n-6, and n-3 fatty acids and conjugatedlinoleic acids are related to maternal plasma fatty acids, length of gestation, and birth weightand length. Am J Clin 73: 807-814.
Ellis L, Picciano MF, Smith AM, Hamosh M, Mehta NR (1990). The impact of gestationallength on human milk selenium concentration and glutathion peroxydase activity. Pediatr Res27: 32-35.
Elmadfa I and Bosse W (1985). Vitamin E. Wissenschaftliche Verlagsgesellschaft, Stuttgart.
Emond AM, Hawkins N, Pennock C, Golding J (1996). Haemoglobin and ferritinconcentrations in infants at 8 months of age. Arch Dis Child 74: 36-39.
Engfer MB, Stahl B, Finke B, Engfer MB, Stahl B, Finke B, Sawatzki G, Daniel H (2000).Human milk oligosaccharides are resistant to enzymatic hydrolysis in the uppergastrointestinal tract. Am J Clin Nutr 71: 1589-1596.
Erbersdobler HF and Hupe A (1991). Determination of lysine damage and calculation oflysine bio-availability in several processed foods. Z Ernährungswiss 30: 46-49.
Erney RM, Malone WT, Skelding MB, Marcon AA, Kleman-Leyer KM, O’Ryan ML, Ruiz-Palacios G, Kilty MD, Pickering LK, Prieto PA (2000). Variability of human milk neutraloligosaccharides in a diverse population. J Pediatr Gastroenterol Nutr 30: 131-133.
ESPGHAN (European Society for Paediatric Gastroenterology, Hepatology and Nutrition)(1977). Committee on Nutrition. Guidelines on infant nutrition: I. Recommendations for thecomposition of an adapted formula. Acta Paediatr Scand (Suppl): 1-20.
ESPGHAN (European Society for Pediatric Gastroenterology, Hepatology and Nutrition)(1991). Committee on Nutrition: Aggett PJ, Haschke F, Heine W, Hernell O, Koletzko B,Launiala K, Rey J, Rubino A, Schöch G, Senterre J, Tormo R. Comment on the content andcomposition of lipids in infant formulas. Acta Paediatr Scand 80: 887-896.
ESPGHAN (European Society for Pediatric Gastroenterology, Hepatology and Nutrition)(1993). Committee on Nutrition: Aggett P, Haschke F, Heine W, Hernell O, Koletzko B, ReyJ, Rubino A, Schöch G, Senterre J, Strobel S, Tormo R. Comment on antigen-reduced infantformulae. Acta Paediatr 82: 314-319.
ESPGHAN (European Society for Pediatric Gastroenterology, Hepatology and Nutrition)(1994). Committee on Nutrition: Aggett PJ, Haschke F, Heine W, Hernell O, Koletzko B,Lafeber H, Ormisson A, Rey J, Tormo R. Childhood diet and prevention of coronary heartdisease. J Pediatr Gastroenterol Nutr 19: 261-269.
ESPGHAN (European Society for Paediatric Gastroenterology, Hepatology and Nutrition)(1997). Committee on Nutrition: Aggett P, Bresson J, Haschke F, Hernell O, Koletzko B,Lafeber H, Michaelsen KF, Micheli J, Ormisson A, Rey J, Salazar de Sousa J, Weaver L.Recommended Dietary Allowances (RDAs), Recommended Dietary Intakes (RDIs),Recommended Nutrient Intakes (RNIs), and Population Reference Intakes (PRIs) are not“Recommended Intakes”. J Pediatr Gastroenterol Nutr 25: 236-241.

177
ESPGHAN (European Society for Pediatric Gastroenterology, Hepatology and Nutrition)(1998). Committee on Nutrition. Comment on the vitamin E content in infant formulas,follow-on formulas, and formulas for low birth weight infants. J Pediatr Gastroenterol Nutr26: 351-352.
ESPGHAN (European Society for Paediatric Gastroenterology, Hepatology and Nutrition)(2001). Committee on Nutrition: Aggett PJ, Agostoni C, Goulet O, Hernell O, Koletzko B,Lafeber HL, Michaelsen KF, Rigo J, Weaver LT. The nutritional and safety assessment ofbreast milk substitutes and other dietary products for infants: A commentary by theESPGHAN Committee on Nutrition. J Pediatr Gastroenterol Nutr 32: 256-258.
ESPGHAN (European Society for Paediatric Gastroenterology, Hepatology and Nutrition)(2002a). Committee on Nutrition: Aggett PJ, Agostoni C, Axelsson I, Bresson JL, Goulet O,Hernell O, Koletzko B, Lafeber HL, Michaelsen KF, Micheli JL, Rigo J, Szajewska H,Weaver LT. Iron metabolism and needs in early childhood: do we know enough? J PediatrGastroenterol Nutr 34: 337-345.
ESPGHAN (European Society for Paediatric Gastroenterology, Hepatology and Nutrition)(2002b). Committee on Nutrition: Aggett PJ, Agostini C, Goulet O, Hernell O, Koletzko B,Lafeber HL, Michaelsen KF, Milla P, Rigo J, Weaver L. Anti-reflux or antiregurgitation milkproducts for infants and young children: a commentary by the ESPGHAN Committee onNutrition. J Pediatr Gastroenterol Nutr 34: 496-498.
ESPGHAN (European Society for Paediatric Gastroenterology, Hepatology and Nutrition)(2003a). Committee on Nutrition: Aggett PJ, Agostoni C, Axelsson I, Goulet O, Hernell O,Koletzko B, Lafeber HL, Michaelsen KF, Morley R, Rigo J, Szajewska H, Weaver LT. Coredata for nutrition trials in infants: a discussion document. J Pediatr Gastroenterol Nutr 35 (inpress).
ESPGHAN (European Society for Paediatric Gastroenterology, Hepatology and Nutrition)(2003b). Committee on Nutrition: Aggett PJ, Agostoni C, Axelsson I, Edwards CA, Goulet O,Hernell O, Koletzko B, Lafeber HN, Michaelsen KF, Micheli J, Rigo J, Szajewska H, WeaverLT. Non-digestible carbohydrate in the diets of infants and young children. Comment byESPGHAN Committee on Nutrition. J Pediatr Gastroenterol Nutr (in press).
Essex C (1996). Phytoestrogens and soy based infant formula. Risks remain theoretical. BrMed J 313: 507-508.
Evliyaoglu O, Berberoglu M, Ocal G, Adiyaman P, Aycan Z (2001). Severe hypercalcemia ofan infant due to vitamin D toxicity associated with hypercholesterolemia. J Pediatr EndocrinolMetab 14: 915-919.
Exl B-M, Deland U, Secretin M-C, Preysch U, Wall M, Shmerling DH (2000). Improvedgeneral health status in an unselected infant population following an allergen-reduced dietaryintervention programme: the ZUFF-STUDY-PROGRAMME. Part II: infant growth andhealth status to age 6 months. Eur J Nutr 39: 145-156.
Fairweather-Tait SJ (1996). Iron deficiency anaemia: epidemiology, complications, diagnosisand management. Int Sem Paediatr Gastroenterol Nutr 5: 3-7.
Fairweather-Tait TS, Balmer SE, Scott PH, Ninski MJ (1987). Lactoferrin and iron absorptionin newborn infants. Pediatr Res 22: 651-654.

178
FAO (Food and Agriculture Organization) (1970). Food Policy and Food Science Service,Nutrition Division: Amino-acid content of foods and biological data on proteins. Nr 24.
FAO/WHO (Food and Agriculture Organization/World Health Organization) (1970).Requirements of ascorbic acid, vitamin D, vitamin B12, folate and iron. Report of a JointFAO/WHO Expert group. WHO Technical Report Series No. 452; FAO Nutrition MeetingsReport Series No. 47. World Health Organisation, Geneva.
FAO/WHO (Food and Agriculture Organization/World Health Organization) (1985). JointFAO/WHO/UNU Expert Consultation. Energy and protein requirements. WHO TechnicalReport Series No. 724, pp 1-206.
FAO/WHO (Food and Agriculture Organization/World Health Organization) (1994). Lipidsin early development. In: Fats and oils in human nutrition. Report of a Joint ExpertConsultation FAO/WHO, Rome, pp. 49-55.
FAO/WHO (Food and Agriculture Organization/World Health Organization) (2001a).Requirements of vitamin A, iron, folate, and vitamin B12. FAO Food Nutr Series No. 23.Rome.
FAO/WHO (Food and Agriculture Organization/World Health Organization) (2001b). JointFAO/WHO Expert Consultation on Evaluation of Health and Nutritional Properties ofProbiotics in Food including Powder Milk with Live Lactic Acid Bacteria. Cordoba,Argentina.
FAO/WHO (Food and Agriculture Organization/World Health Organization) (2002a). JointWHO/FAO Expert Consultation on Diet, Nutrition and the Prevention of Chronic Disease.Draft 26 April 2002, World Health Organisation, Geneva.
FAO/WHO (Food and Agriculture Organization/World Health Organization) (2002b). Humanvitamin and mineral requirements. Report of a Joint FAO/WHO Expert Consultation,Bangkok, Thailand. Food and Agriculture Organization, Rome.
FAO/WHO (Food and Agriculture Organization/World Health Organization) (2002c). JointFAO/WHO Working Group Guidelines for the Evaluation of Probiotics in Food. London,Ontario/Canada.
Farquharson J, Cockburn F, Patrick WA, Jamieson EC, Logan RW (1992). Infant cerebralcortex phospholipid fatty acid composition and diet. Lancet 340: 810-813.
FDA (Food and Drug Administration) (1985). Nutrient requirements for infant formulas.Federal Register 50 (210): 45106-45108.
FDA (Food and Drug Administration) (2002). Agency Response Letter to GRAS Notice No.GRN 000049.
Fell JM, Reynolds AP, Meadows N, Khan K, Long SG, Quaghebeur G, Taylor WJ, Milla PJ(1996). Manganese toxicity in children receiving long-term parenteral nutrition. Lancet 347:1218-1221.
Fidanza F (1991). Nutritional assessment: a manual for population studies. London, ChapmanHall.
179
Filer Jr LJ, Mattson FH, Fomon SJ (1969). Triglyceride configuration and fat absorption bythe human infant. J Nutr 99: 293-298.
Filer Jr LJ (1988). Modified food starch - an update. J Am Diet Assoc 88: 342-344.
Finch JL, Brown AJ, Slatopolsky E (1999). Differential effects of 1,25-dihydroxy-vitamin D3and 19-nor-1,25-dihydroxy-vitamin D2 on calcium and phosphorus resorption in bone. J AmSoc Nephrol 10: 980-985.
Fleischer Michaelsen K, Sauer Larsen P, Thomsen BL, Samuelson G (1994). TheCopenhagen Cohort Study on Infant Nutrition and Growth: breast-milk intake, human milkmacronutrient content, and influencing factors. Am J Clin Nutr 59: 600-611.
FNB (Food and Nutrition Board) (1989). National Research Council (US) & Subcommitteeon the Tenth Edition of the RDAs. Recommended Dietary Allowances 1989. Institute ofMedicine. National Academy Press, Washington DC.
FNB (Food and Nutrition Board) (1997). Dietary Reference Intakes for Calcium, Phosphorus,Magnesium, Vitamin D, and Fluoride. Institute of Medicine. National Academy Press,Washington DC.
FNB (Food and Nutrition Board) (2000a). Dietary Reference Intakes for Vitamin C, VitaminE, Selenium, and Carotenoids. Institute of Medicine. National Academy Press, WashingtonDC.
FNB (Food and Nutrition Board) (2000b). Dietary Reference Intakes: Choline. Institute ofMedicine. National Academy Press, Washington DC, pp. 390-422.
FNB (Food and Nutrition Board) (2001). Dietary Reference Intakes: Vitamin A, Vitamin K,Arsenic, Boron, Chromium, Copper, Iodine, Iron, Manganese, Molybdenum, Nickel, Silicon,Vanadium and Zinc. Institute of Medicine. National Academy Press, Washington DC.
FNB (Food and Nutrition Board) (2002a). Dietary Reference Intakes for Energy,Carbohydrate, Fiber, Fat, Fatty Acids, Cholesterol, Protein, and Amino Acids. Institute ofMedicine. National Academy Press, Washington DC (pre-publication copy).
FNB (Food and Nutrition Board) (2002b). Letter report on dietary reference intakes for transfatty acids. In: Dietary reference intakes for energy, carbohydrate, fiber, fat, fatty acids,cholesterol, protein, and amino acids. Institute of Medicine. National Academy Press,Washington DC.
Fok TF, Chui KK, Cheung R, Ng PC, Cheung KL, Hjelm M (2001). Manganese intake andcholestatic jaundice in neonates receiving parenteral nutrition: a randomized controlled study.Acta Paediatr 90: 1009-1015.
Fomon SJ (1993). In: Nutrition of normal infants. St. Louis, Mosby.
Fomon SJ (2001). Feeding normal infants: rationale for recommendations. J Am Diet Assoc101: 1002-1005.
Fomon SJ and Ziegler EE (1989). Upper limits of nutrients in infant formulas. J Nutr 119:1763-1873.

180
Fomon SJ and McCormick DB (1993). B vitamins and choline. In: Nutrition of NormalInfants (Craven L. Ed) Mosby Year Book Inc. St Louis MO, pp 366-394.
Fomon SJ and Nelson SE (1993). Calcium, phosphorus, magnesium and sulfur. In: Nutritionof Normal Infants (Craven L, ed.) Mosby-Year Book Inc. St Louis, MO, pp 192-211.
Fomon SJ, YounoszaI MK, Thomas LN (1966). Influence of vitamin D on linear growth ofnormal full-term infants. J Nutr 88: 345-350.
Fomon SJ, Thomas LN, Filer LJ, Anderson TA, Bergmann KE (1973). Requirements forprotein and essential amino acids in early infancy. Acta Paediatr Scand 62: 33-45.
Fomon SJ, Ziegler EE, Filer LJ, Nelson SE, Edwards B (1979). Methionine fortification of asoy protein formula fed to infants. Am J Clin Nutr 32: 2460-2471.
Fomon SJ, Ziegler EE, Nelson SE, Edwards BB (1983). Sweetness of diet and foodconsumption by infants. Proc Soc Exp Biol Med 173: 190-193.
Fomon SJ, Ziegler EE, Nelson SE, Edwards BB (1986). Requirement for sulfur-containingamino acids in infancy. J Nutr 116: 1405-1422.
Fomon SJ, Ziegler EE, Nelson SE, Frantz JA (1995a). What is the safe protein-energy ratiofor infant formulas? Am J Clin Nutr 62: 358-363.
Fomon SJ, Ziegler EE, Nelson SE, Serfass RE, Frantz JA (1995b). Erythrocyte incorporationof iron by 56-day-old infants fed a 58Fe-labeled supplement. Pediatr Res 38: 373-378.
Fomon SJ, Ziegler EE, Nelson SE, Rogers RR, Frantz JA (1999). Infant formula with protein-energy ratio of 1.7 g/100 kcal is adequate but may not be safe. J Pediatr Gastroenterol Nutr28: 495-501.
Forsyth JS (1995). The relationship between breast-feeding and infant health anddevelopment. Proc Nutr Soc 54: 407-418.
Forsyth JS, Ogston SA, Clark A, Florey CD, Howie PW (1993). Relation between earlyintroduction of solid food to infants and their weight and illness during the first two years oflife. Br Med J 306: 1572-1576.
Fort P, Moses N, Fasano, M, Goldberg T, Lifshitz F (1990). Breast and soy-formula feedingsin early infancy and the prevalence of autoimmune thyroid disease in children. J Am CollNutr 9: 164-167.
Freeman VE, Mulder J, Hof vant M, Hoey HMV, Gibney MJ (1998). A longitudinal study ofiron status in children at 12, 24 and 36 months. Public Health Nutr 1: 93-100.
Friedman Ca, McVey J, Borne MJ, Lames M, May WL, Temple DM, Robbins KK, Miller CJ,Rawson JE (2000). Relationship between serum inositol concentration and development ofretinopathy of prematurity: a prospective study. J Pediatr Ophthalmol Strabismus 37: 79-86.
FSAI (Food Safety Authority of Ireland) (1999). Recommended Dietary Allowances forIreland. Dublin, Food Safety Authority of Ireland (www.fsai.ie).
Fuller R (1989). Probiotics in man and animals. J Appl Bacteriol 66: 365-378.
181
Fuller MF and Reeds PJ (1998). Nitrogen cycling in the gut. Annu Rev Nutr 18: 385-411.
Garby L and Sjölin S (1959). Absorption of labeled iron in infants less than three months old.Acta Paediatr Scand Suppl 117: 24-28.
Garza C and De Onis M (1999). A new international growth reference for young children. AmJ Clin Nutr 70 (Suppl): 169S-172S.
Gaull GE (1989). Taurine in pediatric nutrition: review and update. Pediatrics 83: 433-442.
Gay-Crosier F, Schreiber G, Hauser C (2000). Anaphylaxis from inulin in vegetables andprocessed food. N Engl J Med 18: 1372-1373.
Gebre-Medhin M, Vahlquist A, Hofvander Y, Uppsall L, Vahlquist B (1976). Breast milkcomposition in Ethiopian and Swedish mothers. I: Vitamin A and beta-carotene. Am J ClinNutr 29: 441-451.
Gezondheidsraad (Health Council of the Netherlands) (2000). Voedingsnormen calcium,vitamine D, thiamine, riboflavine, niacine, pantotheenzuur en biotine. Nr 2000/12. Den Haag.
Gibson GR and Roberfroid MB (1995). Dietary modulation of the human colonic microbiota:introducing the concept of prebiotics. J Nutr 125: 1401-1412.
Gibson RA, Neumann A, Makrides M (2000). The effects of diets rich in docosahexaenoicacid and/or gamma linolenic acid on plasma fatty acid profiles in term infants. In: Lipids ininfant nutrition (Huang YS, Sinclair A, eds.) IL; AOCS Press, pp 19-28.
Gil A and Sánchez-Medina F (1982). Acid-soluble nucleotides of human milk at differentstages of lactation. J Dairy Res 49: 301-307.
Gillman MW, Rifas-Shilman SL, Camargo CA, Jr, Berkey CS, Frazier AL, Rockett HR, FieldAE, Colditz GA (2001). Risk of overweight among adolescents who were breastfed as infants.JAMA 285: 2461-2467.
Gjesing B, Osterballe O, Schwartz B, Wahn U, Lowenstein H (1986). Allergen-specific IgEantibodies against antigenic components in cow milk and milk substitutes. Allergy 41: 51-56.
Goellner MH, Ziegler EE, Fomon SJ (1981). Urination during the first three years of life.Nephron 28: 174-178.
Greene HL, Specker BL, Smith R, Murrell J, Swift L (1990). Plasma riboflavinconcentrations in infants fed human breast milk versus formula: comparison with values inrats made riboflavin deficient and human cord blood. J Pediatr 117: 916-920.
Greer FR (1989). Calcium, phosphorus and magnesium: how much is too much for infantformulas? J Nutr 119: 1846-1851.
Greer FR (2001). Are breast-fed infants vitamin K deficient? Adv Exp Med Biol 501: 391-395.
Greger JL (1999). Nondigestible carbohydrates and mineral bioavailability. J Nutr 129(Suppl): 1434S-1435S.

182
Guandalini S, Pensabene L, Abu Zikri M, Dias JA, Casali LG, Hoekstra H, Kolacek S,Massar K, Micetic-Turk D, Papadopoulou A, Salazar de Sousa J, Sandhu B, Szajewska H,Weizman Z (2000). Lactobacillus GG administered in oral rehydration solution to childrenwith acute diarrhoea. A multicenter European trial. J Pediatr Gastroenterol Nutr 30: 54-60.
Guesry PR, Bodanski H, Tomsit E, Aeschlimann JM (2000). Effect of 3 doses offructooligosaccharides in infants. World Congress of Pediatric Gastroenterology, Hepatologyand Nutrition, Boston, 5-9 August 2000. J Pediatr Gastroenterol Nutr 31 (Suppl 2): S252(Abstract).
Guest GM, Brown EW, Wing M (1938). Erythrocytes and hemoglobin of the blood in infancyand in childhood: II. Variability in number, size and hemoglobin content of the erythrocytesduring the first five years of life. Am J Dis Child 56: 529-549.
Gylling H and Miettinen TA (1999). Cholesterol reduction by different plant stanol mixturesand with variable fat intake. Metabolism 48: 575-580.
Hallberg L, Rossander HL, Brune M, Gleerup A (1992). Bioavailability in man of iron inhuman milk and cow’s milk in relation to their calcium contents. Pediatr Res 31: 524-527.
Hallman M, Bry K, Hoppu K, Lappi M, Pohavuori M (1992). Inositol supplementation inpremature infants with respiratory distress syndrome. N Engl J Med 326: 1233-1239.
Hamaker BR, Rivera K, Morales E, Graham GG (1991). Effect of dietary fiber on fecalcomposition in preschool Peruvian children consuming maize, amaranth or casava flours. JPediatr Gastroenterol Nutr 13: 59-66.
Hamill PVV, Drizd TA, Johnson CL, Reed RB, Roche AF, Moore WM (1979). Physicalgrowth: National Center for Health Statistics percentiles. Am J Clin Nutr; 32: 607-629.
Hammarsten O (1883). Z Physiol Chemie 7: 227.
Hansen CM, Leklem JE, Miller LT (1996). Vitamin B-6 status of women with a constantintake of vitamin B6 changes with three levels of dietary protein. J Nutr 126: 1891-1901.
Harmsen HJM, Wildeboer-Veloo ACM, Raangs GC, Waagendorp AA, Klijn N, Bindels JG,Welling GW (2000). Analysis of intestinal flora development in breast-fed and formula-fedinfants by using molecular identification and detection methods. J Pediatr Gastroenterol Nutr30: 61-67.
Harzer G and Bindels JG (1987). Main compositional criteria of human milk and theirimplications in early infancy. In: New aspects of nutrition in pregnancy, infancy andprematurity. (Xanthou M. ed.) Elsevier Scientific Publ, Amsterdam, pp 83-94.
Haschke F and Male C (1996). Iron nutritional status during early childhood. In: Iron nutritionin health and disease (Hallberg L, Asp N-G, eds.). London, John Libbey, pp 325-329.
Haschke F, Ziegler EE, Edwards BB, Fomon SJ (1986). Effect of iron fortification of infantformula on trace mineral absorption. J Pediatr Gastroenterol Nutr 5: 768-773.
Haschke F, Vanura H, Male C, Owen G, Pietschnig B, Schuster E, Krobath E, Huemer C(1993). Iron nutrition and growth of breast- and formula-fed infants during the first 9 monthsof life. J Pediatr Gastroenterol Nutr 16: 151-156.

183
Haschke F, van’t Hof MA, and the Euro-Growth Study Group (2000). Euro-Growthreferences for breast-fed boys and girls: influence of breast-feeding and solids on growth until36 months of age. J Pediatr Gastroenterol Nutr 31 (Suppl 1): S60-S71.
Hatano S, Aihara K, Nishi Y, Usui T (1985). Trace elements (copper, zinc, manganese, andselenium) in plasma and erythrocytes in relation to dietary intake during infancy. J PediatrGastroenterol Nutr 4: 87-92.
Hayakawa R, Matsunaga K, Suzuki M, Hosokawa K, Arima Y, Shin CS, Yoshida M (1987).Is sesamol present in sesame oil? Contact Dermatitis 17: 133-135.
Hediger ML, Overpeck MD, Ruan WJ, Troendle JF (2000). Early infant feeding and growthstatus of US-born infants and children aged 4-71 mo: analyses from the third National Healthand Nutrition Examination Survey, 1988-1994. Am J Clin Nutr 72: 159-167.
Hediger ML, Overpeck MD, Kuczmarski RJ, Ruan WJ (2001). Association between infantbreastfeeding and overweight in young children. JAMA 285: 2453-2460.
Heine W, Klein PD, Reeds PJ (1991). The importance of �-lactalbumin in infant nutrition. JNutr 121: 277-283
Heinig MJ, Nommsen LA, Peerson JM, Lönnerdal B, Dewey KG (1993a). Energy and proteinintakes of breast-fed and formula-fed infants during the first year of life and their associationwith growth velocity: the DARLING study. Am J Clin Nutr 58: 152-161.
Heinig MJ, Nommsen LA, Peerson JM, Lönnerdal B, Dewey KG (1993b). Intake and growthof breast-fed and formula-fed infants in relation to the timing of introduction ofcomplementary foods: the DARLING study. Acta Paediatr 82: 999-1006.
Herbert V (1996). Vitamin B12. In: Present Knowledge in Nutrition. 7th ed. (Ziegler EE, FilerJr LJ, eds.). Washington DC, ILSI Press, pp 191-205.
Hernell O and Bläckberg L (1994). Molecular aspects of fat digestion in the newborn. ActaPaediatr 405 (Suppl): 65-69.
Hernell O and Bläckberg L (1997). Digestion and absorption of human milk lipids. In:Encyclopedia of human biology (Dulbecco R, ed.), Academic press, New York, 2nd ed, vol 3,pp 319-28.
Hernell O and Lönnerdal B (2002). Iron status of infants fed low iron formula: no effect ofadded bovine lactoferrin or nucleotides. Am J Clin Nutr 76: 858-864.
Hernell O and Lönnerdal B (2003). Nutritional evaluation of protein hydrolysate formulas inhealthy term infants: plasma amino acids, hematology and trace elements (in press).
Hertrampf E, Cayazzo M, Pizzaro F, Stekel A (1986). Bioavailability of iron in soy-basedformula and its effect on iron nutriture in infancy. Pediatrics 78: 640-645.
Hickenbottom SJ, Follett JR, Lin Y, Dueker SR, Burri BJ, Neidlinger TR, Clifford AJ (2002).Variability in conversion of beta-carotene to vitamin A in men as measured by using adouble-tracer study design. Am J Clin Nutr 75: 900-907.

184
Hill ID and Bowie MD (1983). Chloride deficiency syndrome due to chloride-deficient breastmilk. Arch Dis Child 58: 224-226.
Hirano M, Honma K, Daimatsu T, Hayakawa K, Oizumi J, Zaima K, Kanke Y (1992).Longitudinal variations of biotin content in human milk. Int J Vitamin Nutr Res 62: 281-282.
Hokama T (1994). A study of the iron requirement in infants, using changes in total body irondetermined by hemoglobin, serum ferritin and bodyweight. Acta Paediatr Jpn 36: 153-155.
Holmes HC, Snodgrass GJAI, Iles RA (2000). Changes in the choline content of humanbreast milk in the first 3 weeks after birth. Eur J Pediatr 159 198-204
Hopkins LL Jr, Ransome-Kuti O, Majaj AS (1968). Improvement of impaired carbohydratemetabolism by chromium (III) in malnourished infants. Am J Clin Nutr 21: 203-11.
Hövels O, Makosch G, Bergmann KE, Magnet W, Abt K, Sies S, Tews KH, Jung G, LimbachHJ, Gregor H (1983). [Representative studies of the vitamin D status of 2-year old children inFrankfurt am Main]. Monatsschr Kinderheilkd 131: 23-27 (in German).
Howie PW, Forsyth JS, Ogston SA, Florey CD (1990). Protective effect of breastfeedingagainst infection. Br Med J 300: 11-16.
Hunter EJ (2001). Studies on effects of dietary fatty acids as related to their position ontriglycerides. Lipids 36: 655-668.
Hurrell RF, Juillerat MA, Reddy MB, Lynch SR, Dassenko SA, Cook JD (1992). Soy protein,phytate and iron absorption in humans. Am J Clin Nutr 56: 573-578.
Hurrell RF, Lynch SR, Trinidad TP, Dassenko SA, Cook JD (1989). Iron absorption inhumans as influenced by bovine milk proteins. Am J Clin Nutr 49: 546-552.
Hypponen E, Kenward MG, Virtanen SM, Piitulainen A, Virta-Autio P, Tuomilehto J, KnipM, Akerblom HK (1999). Infant feeding, early weight gain, and risk of type 1 diabetes.Childhood Diabetes in Finland (DiMe) Study Group. Diabetes Care 22: 1961-1965.
Idjradinata P and Pollitt E (1993). Reversal of developmental delays in iron-deficient anaemicinfants treated with iron. Lancet 341: 1-4.
Idjradinata P, Watkins WE, Pollitt E (1994). Adverse effect of iron supplementation onweight gain of iron-replete young children. Lancet 343: 1252-1254.
Igel M, Giesa U, Lutjohann D, Von Bergmann K (2003). Comparison of the intestinal uptakeof cholesterol, plant sterols, and stanols in mice. J Lipid Res 44: 533-538.
Innis SM, Adamkin DH, Hall RT, Kalhan SC, Lair C, Lim M, Stevens DC, Twist PF,Diersen-Schade DA, Harris CL, Merkel KL, Hansen JW (2002). Docosahexaenoic acid andarachidonic acid enhance growth with no adverse effects in preterm infants fed formula. JPediatr 140: 547-554.
Innis SM, Dyer R, Quinlan P, Diersen-Schade D (1995). Palmitic acid is absorbed as sn-2monopalmitin from milk and formula with rearranged triacylglycerols and results in increasedplasma triglyceride sn-2 and cholesteryl ester palmitate in piglets. J Nutr 125: 73-81.

185
Ip C, Banni S, Angioni E, Carta G, McGinley J, Thompson HJ, Barbano D, Bauman D(1999). Conjugated linoleic acid -enriched butter fat alters mammary gland morphogenesisand reduces cancer risk in rats. J Nutr 129: 2135-2142.
Isolauri E, Arvola T, Sutas Y, Moilanen E, Salminen S (2000). Probiotics in the managementof atopic eczema. Clin Exp Allergy 30: 1604-1610.
IUPAC-IUBMB Joint Commission on Biochemical Nomenclature (International Union ofPure and Applied Chemistry and International Union of Biochemistry and MolecularBiology) (1982). Abbreviated terminology of oligosaccharide chains. Recommendations1980. J Biol Chem 257: 3347-3351.
Jackson AA, Shaw JC, Barber A, Golden MH (1981). Nitrogen metabolism in preterm infantsfed human donor breast milk: the possible essentiality of glycine. Pediatr Res 15: 1454-1461.
Jackson KG, Taylor RJ, Clohessy AM, Williams CM (1999). The effect of the daily intake ofinulin on fasting lipid, insulin, and glucose concentrations in middle-aged men and women.Br J Nutr 82: 23-30.
Jamieson EC, Abbasi KA, Cockburn F, Farquharson J, Logan RW, Patrick WA (1994). Effectof diet on term infant cerebral cortex fatty acid composition. World Rev Nutr Diet 75: 139-141.
Janas LM, Picciano MF, Hatch TF (1987). Indices of protein metabolism in term infants fedeither human milk or formulas with reduced protein concentration and various whey/caseinratios. J Pediatr 110: 838-848.
Jeans PC and Stearns G (1938). The effect of vitamin D on linear growth in infancy: II. Theeffect of intakes above 1,800 U.S.P. units daily. J Pediatr 13: 730-734.
Jensen CL and Heird WC (2002). Lipids with an emphasis on long-chain polyunsaturatedfatty acids. Clin Perinatol 29: 261-281.
Jensen RG (1989). The lipids of human milk. Boca Raton, CEC Press.
Jensen RG (1995). Handbook of Milk Composition. New York, Academic Press.
Jensen RG (1999). Lipids in human milk. Lipids 34: 1243-1271.
Jensen RG and Lammi-Keefe C (2001). The anticarcinogenic conjugated fatty acid c9, t11-c18:2, or rumenic acid, in human milk: amounts and effects. Adv Exp Med Biol 501: 153-156.
Jochum F, Fuchs A, Menzel H, Lombeck I (1995). Selenium in German infants fed breastmilk or different formulas. Acta Paediatr 84: 859-862.
Johns P, Dowlati L, Wargo W (2003). Determinations of isoflavones in ready-to-feed soy-based infant formula. J AOAC Int 86: 72-78.
Johnson CE, Smith AM, Chan GM, Moyer-Mileur LJ (1993). Selenium status of term infantsfed human milk or selenite-supplemented soy formula. J Pediatr 122: 739-741.

186
Johnston L, Vaughan L, Fox HM (1981). Pantothenic acid content of human milk. Am J ClinNutr 34: 2205-2209.
Jørgensen MH, Hernell O, Lund P, Holmer G, Michelsen KF (1996). Visual acuity anderythrocyte docosahexaenois acid status in breastfed and formula-fed term infants during thefirst four months of life. Lipids 31: 99-105.
Jørgensen MH, Holmer G, Lund P, Hernell O, Michaelsen KF (1998). Effect of formulasupplemented with docosahexaenoic acid and gamma-linolenic acid on fatty acid status andvisual acuity in term infants. J Pediatr Gastroenterol Nutr 26: 412-421.
Jørgensen MH, Hernell O, Hughes EL, Michaelsen KF (2001). Is there a relationship betweendocosahexaenoic acid concentration in mothers´milk and visual development in term infants?J Pediatr Gastroenerol Nutr 32: 293-296.
Jurutka PW, Whitfield GK, Hsieh JC, Thompson PD, Haussler CA, Haussler MR (2001).Molecular nature of the vitamin D receptor and its role in regulation of gene expression. RevEndocr Metab Disord 2: 203-216.
Kalliomäki M, Salminen S, Arvilommi H, Kero P, Koskinen P, Isolauri E (2001). Probioticsin primary prevention of atopic disease: a randomised placebo-controlled trial. Lancet 357:1076-1079.
Kang-Yoon SA, Kirksey A, Giacoia GP, West K (1992). Vitamin B6 status of breast fedneonates: influence of pyridoxine supplementation on mothers and neonates. Am J Clin Nutr56: 548-558.
Kang-Yoon SA, Kirksey A, Giacoia GP, West K (1995). Vitamin B6 adequacy in neonatalnutrition: associates with preterm delivery, type of feeding, and vitamin B6 supplementation.Am J Clin Nutr 62: 932-942.
Karmann, A and van Boekel A (1986). Evaluation of the Kjeldahl factor for conversion of thenitrogen content of milk and milk products to protein content. Neth Milk Dairy J 40: 315-336.
Kato I, Dnistrian AM, Schwartz M, et al. (1999). Iron intake, body iron stores and colorectalcancer risk in women: a nested case-control study. Int J Cancer 80: 693-698.
Keen CL, Zidenbetg-Cherr S, Lonnerdal B (1994). Nutritional and toxicological aspects ofmangan,ese intake: an overview. In: Risk assessment of essential elements (Mertz W,Abernathy CO, Olin SS, eds.) Washington DC, ILSI Press, pp 221-235.
Kersting M, Ness B, Schöch G (1994). Das Baukastensystem der Beikost zur Realisierung derEmpfehlungen für die Nährstoffzufuhr im 5-12. Lebensmonat. Akt Ernähr-Med 19: 160-169(in German).
Koletzko B (1992). Trans fatty acids may impair biosynthesis of long-chain polyunsaturatesand growth in man. Acta Paediatr 81: 302-306.
Koletzko B (1999). Response to and range of acceptable fat intake in infants and children. EurJ Clin Nutr 53 (Suppl 1): S78-S83.
Koletzko B (2003). In: Kinderheilkunde und Jugendmedizin. 12th edition (Koletzko B, ed.).Berlin, Springer Verlag.

187
Koletzko B and von Kries R (2001). Gibt es eine frühkindliche Prägung des späterenAdipositasrisikos? Monatsschr Kinderheilkunde 149: 11-18 (in german).
Koletzko B, Thiel I, Abiodun PO (1992). The fatty acid composition of human milk in Europeand Africa. J Pediatr 120: S62-70.
Koletzko B, Hernell O, Michaelsen KF (2000). Short and long term effects of breast feedingon child health. In: Advances in Experimental Medicine and Biology, Vol. 248. New York,Kluwer Academic/Plenum Publishers, pp 1-447.
Koletzko B, Agostoni C, Carlson SE, Clandinin T, Hornstra G, Neuringer M, Uauy R,Yamashiro Y, Willatts P (2001). Long chain polyunsaturated fatty acids (LC-PUFA) andperinatal development. Acta Paediatr 90: 460-464.
Koletzko B, Ashwell M, Beck B, Bronner A, Mathioudakis B (2002). Characterisation ofinfant food modifications in the European Union. Ann Nutr Metab 46: 231-242.
Kontush A, Finckh B, Karten B, Kohlschutter A, Beisiegel U (1996). Antioxidant andprooxidant activity of alpha-tocopherol in human plasma and low density lipoprotein. J LipidRes 37: 1436-1448.
Koparal E, Ertugrul F, Oztelein K (2000). Fluoride levels in breast milk and infant foods. JClin Pediatr Dent 24: 299-302.
Krebs NF (2000). Dietary zinc and iron source, physical growth and cognitive development ofbreastfed infants. J Nutr 130 (Suppl): 358S-360S.
Krebs NF and Hambidge KM (1986). Zinc requirements and zinc intakes of breast-fedinfants. Am J Clin Nutr 43: 288-292.
Krebs NF and Westcott J (2002). Zinc and breastfed infants: if and when is there a risk ofdeficiency. Adv Exp Med Biol 503: 69-75.
Krebs NF, Reidinger CJ, Robertson AD, Hambidge KM (1994). Growth and intakes ofenergy and zinc in infants fed human milk. J Pediatr 124: 32-39.
Krebs NF, Reidinger CJ, Hartley S, Robertson AD, Hambidge KM (1995). Zincsupplementation during lactation: effects on maternal status and milk zinc concentrations. AmJ Clin Nutr 61: 1030-1036.
Kuchan MJ, Ostrom KM, Smith C, PE Hu (2000). Influence of purine intake on uric acidexcretion in infants fed soy infant formula. J Am Coll Nutr 19: 16-22.
Kunz C, Rodriguez M, Koletzko B, Jensen R (1999). Nutritional and biochemical propertiesof human milk, part I. General aspects, proteins and carbohydrates. Clinics in Perinatology26: 307-333.
Kunz C, Rudloff S, Baier W, Klein N, Strobel S (2000). Oligosaccharides in human milk:structural, functional, and metabolic aspects. Annu Rev Nutr 20: 699-722.
Lack G, Fox D, Northstone K, Golding J, (2003). Factors associated with the development ofpeanut allergy in childhood. New Engl J Med 348: 977-985

188
Lasekan JB, Ostrom KM, Jacobs JR, Blatter MM, Ndife NI, Gooch WM, Cho S (1999).Growth of newborn, term infants fed soy formulas for one year. Clin Pediatr 38: 563-571.
Latifah R and Razak IA (1989). Fluoride levels in infant formulas. J Pedod 13: 323-327.
Lauritzen L, Hansen HS, Jorgensen MH, Michaelsen KF (2001). The essentiality of long-chain n-3 fatty acids in relation to development and function of the brain and retina. ProgLipid Res 40: 1-94.
Leach JL, Baxter JH, Molitor BE, Ramstack MB, Masor ML (1995). Total potentiallyavailable nucleotides of human milk by stage of lactation. Am J Clin Nutr 61: 1224-1230.
Leary HL (1992). Nonclinical testing of formulas containing hydrolyzed milk protein. JPediatr 121: S42-S46.
Liener IE (1994). Implication of antinutritional components in soybean foods. Crit Rev FoodSci Nutr 34: 31-67.
Lipkin EW and Kowdley KV (2002). Vitamin K replacement in osteoporosis associated withcirrhosis: another reason to “eat your vegetables”? Am J Gastroenterol 97: 786-788.
Lönnerdal B (1994a). Nutritional importance of non-protein nitrogen. In: Protein Metabolismduring Infancy. Räihä NCR (Ed.). Nestlé Nutrition Workshop Series, Raven Press, New York.Vol. 33, pp 105-116.
Lönnerdal B (1994b). Nutritional aspects of soy formula. Acta Paediatr Suppl 402: 105-108.
Lönnerdal B (1995). Magnesium nutrition of infants. Magnes Res 8: 99-105.
Lönnerdal B (1997). Effects of milk and milk components on calcium, magnesium and traceelement absorption during infancy. Physiol Rev 77: 643-669.
Lönnerdal B (1998). Copper nutrition during infancy and childhood. Am J Clin Nutr 67:1046S-1053S.
Lönnerdal B and Forsum E (1985). Casein content of human milk. Am J Clin Nutr 41: 113-120.
Lönnerdal B and Hernell O (1994). Iron, zinc, copper and selenium status of breast-fed infantsand infants fed trace element fortified milk-based infant formula. Acta Paediatr 83: 367-373.
Lönnerdal B and Hernell O (1998). Effects of feeding ultrahigh-temperature (UHT)-treatedinfant formula with different protein concentrations or powdered formula, as compared withbreast-feeding, on plasma amino acids, hematology, and trace element status. Am J Clin Nutr68: 350-356.
Lönnerdal B, Keen CL, Hurley LS (1981). Iron, copper, zinc, and manganese in milk. AnnRev Nutr 1: 149-174.
Lönnerdal B, Keen CL, Ohtake M, Tamura T (1983). Iron, zinc, copper, and manganese ininfant formulas. Am J Dis Child 137: 433-437.
189
Lönnerdal B, Cederblad A, Davidsson L, Sandström B (1984). The effect of individualcomponents of soy formula and cow's milk formula on zinc bioavailability. Am J Clin Nutr40: 1064-1070.
Lönnerdal B, Bell JG, Hendrickx AG, Burns RA, Keen CL (1988). Effect of phytate removalon zinc absorption from soy formula. Am J Clin Nutr 48: 1301-1306.
Lönnerdal B, Jayawickrama L, Lien EL (1999). Effect of reducing the phytate content and ofpartially hydrolyzing the protein in soy formula on zinc and copper absorption and status ininfant rhesus monkeys and rat pups. Am J Clin Nutr 69: 490-496.
Looker AC, Dallman PR, Carroll MD, Gunter EW, Johnson CL (1997). Prevalence of irondeficiency in the United States. JAMA 277: 973-976.
Lozoff B, Klein NK, Nelson EC, McClish DK, Manuel M, Chacon ME (1998). Behavior ofinfants with iron-deficiency anemia. Child Dev 69: 24-36.
LSRO (Life Sciences Research Office) (1998). LSRO Report: Assessment of NutrientRequirements for Infant formulas. Center for Food Safety and Applied Nutrition Food andDrug Administration Department of Health and Human Services, Washington.
Lucas A (1998). Programming by early nutrition: an experimental approach. J Nutr 128(Suppl): 401S-406S.
Lucas A, Quinlan P, Abrams S, Ryan S, Meah S, Lucas PJ (1997). Randomized controlledtrial of a synthetic triglyceride milk formula for preterm infants. Arch Dis Child 77: F178-184.
Lucas A, Stafford M, Morley R, Abbott R, Stephenson T, MacFadyen U, Elias-Jones A,Clements H (1999). Efficacy and safety of long-chain polyunsaturated fatty acidsupplementation of infant-formula milk: a randomised trial. Lancet 354: 1948-1954.
Lukens JN (1995). Iron metabolism and iron deficiency. In: Blood diseases of infancy andchildhood (Miller DR, Baenher RL, eds.). Mosby, St. Louis, pp 193-219.
Lynch JR (1995). Iron overload: prevalence and impact on health. Nutr Rev 53: 255-260.
Mahoney CP, Margolis MT, Knauss TA, Labbe RF (1980). Chronic vitamin A intoxication ininfants fed chicken liver. Pediatrics 65: 893-896.
Majamaa H and Isolauri E (1997). Probiotics: a novel approach in the management of foodallergy. J Allergy Clin Immunol 99: 179-185.
Makrides M, Neumann MA, Byard RW, Simmer K, Gibson RA (1994). Fatty acidcomposition of brain, retina, and erythrocytes in breast- and formula-fed infants. Am J ClinNutr 60: 189-194.
Male C, Persson LÅ, Freeman V, Guerra A, Hof vant M, Haschke F and the Euro-GrowthIron Study (2001). Prevalence of iron deficiency in 12-mo-old infants from 11 European areasand influence of dietary factors on iron status (Euro-Growth Study). Acta Paediatr 90: 492-498.

190
Manuel PD and Walker-Smith JA (1980). Decline of hypernatraemia as a problem ingastroenteritis. Arch Dis Child 55: 124-127.
Mariotti F, Pueyo ME, Tomé D, Benamouzig R, Mahé S (2001). Guar gum does not impairthe absorption and utilization of dietary nitrogen but affects early endogenous urea kinetics inhumans. Am J Clin Nutr 74: 487-493.
Marsh A, Long H, Stierwalt RN (1959). Comparative hematologic response to ironfortification of a milk formula for infants. Pediatrics 24: 404-412.
Martínez M (1992). Tissue levels of polyunsaturated fatty acids during early humandevelopment. J Pediatr 120: S129-S138.
Martínez-Augustin O, Boza JJ, Del Pino JI, Lucena J, Martinez-Valverde A, Gil A (1997a).Dietary nucleotides might influence the humoral immune response against cow's milkproteins in preterm neonates. Biol Neonate 71: 215-223.
Martínez-Augustin O, Boza JJ, Navarro J, Martinez-Valverde A, Araya M, Gil A (1997b).Dietary nucleotides might influence the humoral immunity in immunocompromised children.Nutrition 13: 465-469.
Martorell R, Stein AD, Schroeder DG (2001). Early nutrition and later adiposity. J Nutr 131(Suppl): 874S-880S.
Masters N, McGuire MA, Beerman KA, Dasgupta N, McGuire MK (2002). Maternalsupplementation with CLA decreases milk fat in humans. Lipids 37: 133-138.
Mattson FH and Volpenhein RA (1964). The Digestion and absorption of triglycerides. J BiolChem 239: 2772-2777.
McCaffree J (2001). Rickets on the rise. J Am Diet Assoc 101: 16-17.
McKusick VA (1998). Mendelian Inheritance in Man: A Catalogue of Human Genes andGenetic Disorders. Baltimore, John Hopkins Univ Press, 12th ed..
Merryweather-Clarke AT, Pointon JJ, Shearman JD, Robson KJ (1997). Global prevalence ofputative haemochromatosis mutations. J Med Genet 34: 275-278.
Metges CC (2001). Does dietary protein in early life affect the development of adiposity inmammals? J Nutr 131: 2062-2066.
Meydani SN, Meydani M, Bluymberg JB, Leka LS, Pedrosa M, Diamond R, Schaefer EJ(1998). Assessment of the safety of supplementation with different amounts of vitamin E inhealthy older adults. Am J Clin Nutr 68: 311-318.
Michaelsen KF, Hoppe C, Schack-Nielsen L, Molgaard C (2002). Does an excessive proteinintake early in life cause health problems such as obesity later in Life? In: Public HealthIssues in Infant and Child Nutrition (Black RE, Michaelsen KF eds.) Nestlé NutritionWorkshop Series, Lippincott Williams & Wilkins, Philadelphia. Vol. 48, pp 279-291.
Miera O (1998). Die stickstoffhaltigen Substanzen in Säuglingsanfangsnahrungen. EineAnalyse der Aminosäurenzusammensetzung und der Nicht-Proteinstickstoff-Fraktionen.Doctor’'s Thesis Medical Faculty Humboldt University, Berlin.

191
Mock DM (1996). Biotin. In: Present Knowledge in Nutrition, 7th ed. (Ziegler EE, Filer JnrLJ, eds.), Washington DC, ILSI Nutrition Foundation, pp 220-235.
Mock DM, Perman JA, Thaler M, Morris Jr RC (1983). Chronic fructose intoxication afterinfancy in children with hereditary fructose intolerance. N Engl J Med 309: 764-770.
Moffatt ME, Longstaffe S, Besant J, Dureski C (1994). Prevention of iron deficiency andpsychomotor decline in high-risk infants through use of iron-fortified infant formula: arandomized clinical trial [see comments]. J Pediatr 125: 527-534.
Morais MB, Ferrari AA, Fisberg M (1993). Effect of oral iron therapy on physical growth.Rev Paul Med 111: 439-444.
Morgan WA (1995). DNA single-strand breakage in mammalian cells induced by redoxcycling quinines in the absence of oxidative stress. J Biochem Toxicol 10: 227-232.
Morley R, Abbott R, Fairweather-Tait S, MacFadyen U, Stephenson T, Lucas A (1999). Ironfortified follow on formula from 9 to 18 months improves iron status but not development orgrowth: a randomised trial. Arch Dis Child 81: 247-252.
Moro G, Minoli I, Mosca M, Fanaro S, Jelinek J, Stahl B, Boehm G (2002). Dosage-relatedbifidogenic effects of galacto- and fructooligosaccharides in formula-fed term infants. JPediatr Gastroenterol Nutr 34: 291-295.
Mortensen EL, Michaelsen KF, Sanders SA, Reinisch JM (2002). The association betweenduration of breast-feeding and adult intelligence. JAMA 287: 2365-2371.
Motil KJ, Kertz B, Thotathuchery M (1997). Lactational performance of adolescent mothersshows preliminary differences from that of adult women. JAdolesc Health 20: 442-449.
Mughal MZ, Salama H, Greenaway T, Laing I, Mawer EB (1999). Lesson of the week: floridrickets associated with prolonged breast feeding without vitamin D supplementation. Br MedJ 318: 39-40.
Murphy PA, Song T, Bueman G, Barua K (1997). Isoflavones in soy-based infant formulas. JAgric Food Chem 45: 4635-4638.
Nail PA, Thomas MR, Eakin R (1980). The effect of thiamin and riboflavin supplementationon the level of those vitamins in human breast milk and urine. Am J Clin Nutr 33: 198-204.
Nayman R, Thomson ME, Scriver CR, Clow CL (1979). Observations on the composition ofmilk-substitute products for treatment of inborn errors of amino acid metabolism.Comparisons with human milk. Am J Clin Nutr 32: 1279-1289.
Newbold RR, Padilla Banks E, Bullock B, Jefferson WN (2001). Uterine adenocarcinoma inmice treated neonatally with genistein. Cancer Res 61: 4325-4328.
Nielsen GA, Thomsen BL, Michaelsen KF (1998). Influence of breastfeeding andcomplementary food on growth between 5 and 10 months. Acta Paediatr 87: 911-917.
Nommsen LA, Lovelady CA, Heinig MJ, Lönnerdal B, Dewey KG (1991). Determinants ofenergy, protein, lipid and lactose concentrations in human milk during the first 12 months oflactation: the DARLING study. Am J Clin Nutr 53: 457-465.

192
Nordic Committee of Ministers (2000). Nordic Committee of Senior Officials for FoodIssues. Nordic Working Group on Food Toxicology and Risk Evaluation. Safety evaluation offructans. Copenhagen. TemaNord, p 523.
Oberleas D, Muhrer ME, O’Dell BL (1966). Dietary metal-complexing agents and zincavailability in the rat. J Nutr 90: 56-62.
O’Brien KO, Zavaleta N, Caulfiezld LE, Wen, Abrams SA (2000). Prenatal iron supplementsimpair zinc absorption in pregnant Peruvian women. J Nutr 130: 2251-2255.
Ogasa K, Kuboyama M, Kiyosawa I, Suzuki T, Itoh M (1975). The content of free and boundinositol in human and cow’s milk J Nutr Sci Vitaminol 21: 129-135.
Olson AL, Nelson SE, Rebouche CJ (1989). Low carnitine intake and altered lipidmetabolism in infants. Am. J Clin Nutr 49: 624-628.
O’Neill NC and Tanner MS (1989). Uptake of copper from brass vessels by bovine milk andits relevance to Indian childhood cirrhosis. J Pediatr Gastroenterol Nutr 9: 167-172.
Ong KKL, Ahmed ML, Emmett PM, Preece MA, Dunger DB, and the Avon LongitudinalStudy of Pregnancy and Childhood Study Team (2000). Association between postnatal catch-up growth and obesity in childhood: prospective cohort study. Br Med J 320: 967-971.
Oppenheimer SJ (1989). Iron and infection: the clinical evidence. Acta Paediatr Scand(Suppl) 361: 53-62.
Orenstein SR, Shalaby TM, Putnam PE (1992). Thickened feedings as a cause of increasedcoughing when used as therapy for gastro-oesophageal reflux in infants. J Pediatr 121: 913-915.
Oski FA (1993). Iron deficiency in infancy and childhood. N Engl J Med 329: 190-193.
Ouahchi K, Arita M, Kayden H, Hentati F, Ben Hamida M, Sokol R, Arai H, Inoue K,Mandel JL, Koenig M (1995). Ataxia with isolated vitamin E deficiency is caused bymutations in the alpha-tocopherol transfer protein. Nat Genet 9: 141-145.
Pal BR and Shaw NJ (2001). Rickets resurgence in the United Kingdom: improving antenatalmanagement in Asians. J Pediatr 139: 337-338.
Pariza MW, Park Y, Cook ME (2001). The biologically active isomers of conjugated linoleicacid. Prog Lipid Res 40: 283-298.
Pereira GR, Baker L, Egler J, Corcoran L, Chiavacci R (1990). Serum myoinositolconcentrations in premature infants fed human milk, formula for infants and parenteralnutrition. Am J Clin Nutr 51: 589-593.
Perrsson B, Tunell R, Ekengren K (1965). Chronic vitamin A intoxication during the first halfyear of life. Acta Paediatr Scand 54: 49-60.
Persson LA, Lundström M, Lönnerdal B, Hernell O (1998). Are weaning foods causingimpaired iron and zinc status in 1-year-old Swedish infants? A cohort study. Acta Paediatr 87:618-622.

193
Phelps RA, Shenstone FS, Kemmerer AR, Evans RJ (1965). A review of cyclopropenoidcompounds: Biological effects of some derivatives. Poult Sci 44: 358-394.
Picciano MF (1985). Trace elements in human milk and infant formulas. In: Trace elements innutrition of children (Chandra RK, ed.). Nestlé Nutrition Workshop Series, Vol 8. New York,Raven Press, pp 157-174.
Picciano MF (1995). Water soluble vitamins in human milk. In: Handbook of MilkComposition (Jensen RG, ed.) New York, Academic Press, pp 189-194.
Pickering LK, Granoff DM, Erickson JR, Masor ML, Cordle CT, Schaller JP, Winship TR,Paule CL, Hilty MD (1998). Modulation of the immune system by human and infant formulacontaining nucleotides. Pediatrics 101: 242-249.
Picone TA, Benson JD, Maclean WC, Sauls HS (1989a). Amino acid metabolism in humanmilk- fed and formula-fed term infants. In: Protein and non-protein nitrogen in human milk.(Atkinson SA, Lönnerdal B, eds.) CRC Press, Boca Raton, Florida, pp 173-186.
Picone TA, Benson JD, Moro G, Minoli I, Fulconis F, Rassin DK, Raiha NCR (1989b).Growth, serum biochemistries, and amino acids of term infants fed formulas with amino acidand protein concentrations similar to human milk. J Pediatr Gastroenterol Nutr 9: 351-360.
Pisacane A, De Vizia B, Valiante A, Vaccaro F, Russo M, Grillo G, Giustardi A (1995). Ironstatus in breast-fed infants. J Pediatr 127: 429-431
Pittler MH and Ernst E (2001). Guar gum for body weight reduction: meta-analysis ofrandomized trials. Am J Med 110: 724-730.
Pizarro F, Yip R, Dallman PR, Olivares M, Hertrampf E, Walter T (1991). Iron status withdifferent infant feeding regimens: relevance to screening and prevention of iron deficiency. JPediatr 118: 687-692.
Plesofsky-Vig N (1996). Pantothenic acid. In: Present Knowledge in Nutrition. 7th ed. (ZieglerEE, Filer Jr LJ, eds.). Washington DC, ILSI Press, pp 236-244.
Pomeranz A, Dolfin T, Korzets Z, Eliakim A, Wolach B (2002). Increased sodiumconcentrations in drinking water increase blood pressure in neonates. J Hypertens 20: 203-207.
Pouessel G, Bouarfa K, Soudan B, Sauvage J, Gottrand F, Turck D (2003). Iodine nutritionalstatus and risk factors for iodine deficiency. Arch Pédiatr (in French) (in press).
Powers NG (2001). How to assess slow growth in the breastfed infant. Birth to 3 months.Pediatr Clin North Am 48: 345-363.
Prentice AM, Lucas A, Vasquez-Velasquez L, Davies PSW, Whitehead RG (1988). Arecurrent dietary guidelines for young children a prescription for overfeeding? Lancet 2: 1066-1069.
PAG Ad hoc Working Group (Protein-Calorie Advisory Group of FAO/WHO) (1975).
Quaghebeur G, Taylor WJ, Kingsley DP, Fell JM, Reynolds AP, Milla PJ (1996). MRI inchildren receiving total parenteral nutrition. Neuroradiology 38: 680-683.

194
Quinlan PT, Lockton S, Irwin J, Lucas AL (1995). The relationship between stool hardnessand and stool composition in breast- and formula-fed infants. J Pediatr Gastroenterol Nutr 20:81-90.
Räihä N, Minoli I, Moro G (1986). Milk protein intake in the term infant. I. Metabolicresponses and effects on growth. Acta Paediatr Scand 75: 881-886.
Räihä NCR (1985). Nutritional proteins in milk and the protein requirement of normal infants.Pediatrics 75: 136-141.
Räihä NCR (1994a). Milk protein quantity and quality in human milk and infant formulae.Acta Paediatr 402 (Suppl): 57-58.
Räihä NCR (1994b). Protein content of human milk, from colostrum to mature milk. In:Protein metabolism during infancy (Räihä NCR, ed.). Nestlé Nutrition Workshop Series, Vol.33, Raven Press, New York, pp 87-99.
Räihä NCR, Fazzolari-Nesci A, Boehm G (1996). Taurine supplementation preventshyperaminoacidemia in growing term infants fed high-protein cow's infant milk formula. ActaPaediatr 85: 1403-1407.
Räihä NCR, Fazzolari-Nesci A, Cajozzo C, Puccio G, Monestier A, Moro G, Minoli I,Haschke-Becher E, Bachmann C, Van 't Hof M, Carrié-Fässler AL, Haschke F (2002). Wheypredominant, whey modified infant formula with protein/energy ratio of 1.8 g/100 kcal:adequate and safe for term infants from birth to four months. J Pediatr Gastroenterol Nutr 35:275-281.
Rao MR, Hediger ML, Levine RJ, Naficy AB, Vik T (2002). Effect of breast feeding oncognitive development of infants born small for gestational age. Acta Paediatr 91: 267-274.
Rapa A, Marinello D, Chiorboli E, Sacco F, Bona G (1999). Iodine deficiency in Italy. Lancet354: 596-597.
Rautanen T, Isolauri E, Vesikari T (1998). Management of acute diarrhoea with lowosmolarity oral rehydration solutions and Lactobacillus GG. Arch Dis Child 79: 157-160.
Rebouche CJ (1992). Carnitine function and requirements during the life cycle. FASEB J 6:3379-3386.
Rebouche CJ and Seim H (1998). Carnitine metabolism and its regulation in microorganismsand mammals. Ann Rev Nutr 18: 39-61.
Reeds PJ (2000). Dispensable and indispensable amino acids for humans. J Nutr 130: 1835S-1840S.
Regulation (EC) No 258/97 of the European Parliament and of the Council of the 27 January1997 concerning novel foods and novel food ingredients. Official Journal of the EuropeanCommunities, 14.02.97, L 43/1.
Rigo J, Verloes A, Senterre J (1989). Plasma amino acid concentrations in term infants fedhuman milk, a whey-predominant formula, or a whey hydrolysate formula. J Pediatr 115:752-755.

195
Rigo J, Salle BL, Cavero E, Richard P, Putet G, Senterre J (1994a). Plasma amino acid andprotein concentrations in infants fed human milk or a whey protein hydrolysate formuladuring the first month of life. Acta Paediatr 83: 127-131.
Rigo J, Salle BL, Putet G, Senterre J (1994b). Nutritional evaluation of various proteinhydrolysate formulae in term infants during the first month of life. Acta Paediatr Suppl 402:100-104.
Rigo J, Salle BL, Picaud JC, Putet G, Senterre J (1995). Nutritional evaluation of proteinhydrolysate formulas. Eur J Clin Nutr 49: S26-S38.
Rigo J, Pieltain C, Studzinski F, Knol J, Bindels JG (2001). Clinical evaluation in term infantsof a new formula based on prebiotics, �-palmitate and hydrolysed proteins. ESPGHAN 34th
Annual Meeting, Geneva , May 9-12, 2001. J Pediatr Gastroenterol Nutr 32: 402 (Abstract).
Risérus U, Berglund L, Vessby B (2001). Conjugated linoleic acid reduces abdominal adiposetissue in obese men with the metabolic syndrome: a randomised controlled trial. Int J Obesity25: 1129-1135.
Risérus U, Arner P, Brismar K, Verssby B (2002). Treatment with dietary trans10 cis12conjugated linoleic acid causes isomer-specific insulin resistance in obese men with themetabolic syndrome. Diabetes Care 25: 1516-1521.
Rizzoli R, Bonjour JP, Ferrari SL (2001). Osteoporosis, genetics and hormones. J MolEndocrinol 26: 79-94.
Rodriguez de Turco EB, Parkins N, Ershov AV, Bazan NG (1999). Selective retinal pigmentepithelial cell lipid metabolism and remodeling conserves photoreceptor docosahexaenoicacid following phagocytosis. J Neurosci Res 57: 479-486.
Rodriguez M, Koletzko B, Kunz C, Jensen R (1999). Nutritional and biochemical propertiesof human milk, part II. Lipids, micronutrients and bioactive factors. Clinics in Perinatology26: 335-359.
Rolland-Cachera MF, Deheeger M, Bellisle F, Sempé M, Guilloud-Bataille M, Patois E(1984). Adiposity rebound in children: a simple indicator for predicting obesity. Am J ClinNutr 39: 129-135.
Rolland-Cachera MF, Deheeger M, Akrout M, Bellisle F (1995). Influence of macronutrientson adiposity development: a follow up study of nutrition and growth from 10 months to 8years of age. Int J Obes 19: 573-578.
Roncagliolo M, Garrido M, Walter T, Peirano P, Lozoff B (1998). Evidence of altered centralnervous system development in infants with iron deficiency anemia at 6 months: delayedmaturation of auditory brainstem responses. Am J Clin Nutr 68: 683-690.
Rosenfeldt V, Michaelsen KF, Jacobsen M, Larsen CN, Moller PL, Pedersen P, Tvede M,Weyrether H, Valerius NH, Paerregaard A (2002). Effect of probiotic Lactobacillus strains inyoung children hospitalized with acute diarrhea. Pediatr Infect Dis J 21: 411-416.
Rottoli A, Decarlis S, Gianni ML, Giovannini M (1997). Influence of a mineral water on therheological characteristics of reconstituted infant formulas and diluted cows' milk. J Int MedRes 25: 275-284.

196
Roughead ZK and McCormick DB (1990). Flavin composition of human milk. Am J ClinNutr 52: 854-857.
Rowe PM (2001). Why is rickets resurgent in the USA? Lancet 357: 1100.
Rowland MGM (1986). The weanling’s dilemma: are we making progress? Acta PaediatrScan 323 (Suppl): 33-42.
Rudloff S and Kunz C (1997). Protein and nonprotein nitrogen components in human milk,bovine milk, and infant formula: quantitative and qualitative aspects in infant nutrition. JPediatr Gastroenterol Nutr 24: 328-344.
Ruiz MC, Alegria A, Barbera R, Farre R, Lagarda MJ (1996). Calcium, magnesium, sodium,potassium and iron content of infant formulas and estimated daily intakes. J Trace Elem MedBiol 10: 25-30.
Saarinen UM and Siimes MA (1978). Serum ferritin in assessment of iron nutrition in healthyinfants. Acta Paediatr Scand 67: 745-751.
Saarinen UM, Siimes MA, Dallman PR (1977). Iron absorption in infants: high bioavaliabilityof breast milk iron as indicated by the extrinsic tag method of iron absorption and by theconcentration of serum ferritin. J Pediatr 91: 36-39.
Saavedra JM, Baumann NA, Oung I, Perman JA, Yolken RH (1994). Feeding ofBifidobacterium bifidum and Streptococcus thermophilus to infants in hospital for preventionof diarrhoea and shedding of Rotavirus. Lancet 344: 1046-1049.
Salmenpera L, Perheentupa J, Pispa JP, Siimes MA (1985). Biotin concentrations in maternalplasma and milk during prolonged lactation. Int J Vitamin Nutr Res 55: 281-285.
Salmenpera L, Perheentupa J, Pakarinen P, Siimes MA (1986). Folate nutrition is optimal inexclusively breast-fed infants but inadequate in some of their mothers and in formula-fedinfants. J Pediatr Gastroenterol Nutr 5: 283-289.
Salminen S, Bouley C, Boutron-Ruault MC, Cummings JH, Franck A, Gibson GR, Isolauri E,Moreau MC, Roberfroid M, Rowland I (1998). Functional food science and gastrointestinalphysiology and function. Br J Nutr 80 (Suppl 1): 147-171.
Salminen S, Ouwehand A, Benno Y, Lee YK (1999). Probiotics: how should they be defined?Trend Food Sci Technol 10: 107-110.
Samuelson G, Bratteby LE, Mohsen R, Vessby B (2001). Dietary fat intake in healthyadolescents: inverse relationships between the estimated intake of saturated fatty acids andserum cholesterol. Br J Nutr 85: 333-341.
Sandström B, Cederblad A, LönnerdalB (1983). Zinc absorption from human milk, cow’smilk, and infant formulas. Am J Dis Child 137: 726-729.
SanGiovanni JP, Parra-Cabrera S, Colditz GA, Berkey CS, Dwyer JT (2000a). Meta-analysisof dietary essential fatty acids and long-chain polyunsaturated fatty acids as they relate tovisual resolution acuity in healthy preterm infants. Pediatrics 105: 1292-1298.

197
SanGiovanni JP, Berkey CS, Dwyer JT, Colditz GA (2000b). Dietary essential fatty acids,long-chain polyunsaturated fatty acids, and visual resolution acuity in healthy fullterm infants:a systematic review. Early Hum Dev 57: 165-188.
Sann L, Mousson B, Rousson M, Maire I, Bethenod M (1988). Prevention of neonatalhypoglycemia by oral lipid supplementation in low birth weight infants. Eur J Pediatr147:158-161.
Sarwar G and Botting HG (1999). Liquid concentrates are lower in bioavailable tryptophanthan powdered infant formulas, and tryptophan supplementation of formulas increases braintryptophan and serotonin in rats. J Nutr 129: 1692-1697.
Sarwar G, Peace RW, Botting HG (1989). Differences in protein digestibility and quality ofliquid concentrate and powder forms of milk-based infant formulas fed to rats. Am J ClinNutr 49: 806-813.
Sarwar G, Darling P, Ujiie M, Botting HG, Pencharz PB (1996). Use of amino acid profiles ofpreterm and term human milks in evaluating scoring patterns for routine protein qualityassessment of infant formulas. J AOAC Int 79: 498-502.
Savino F, Muratore MC, Silvestro L, Oggero R, Mostert M (1999). Allergy to carob gum inan infant. J Pediatr Gastroenterol Nutr 29: 475-476.
Scaglioni S, Agostoni C, Notaris RD, Radaelli G, Radice N, Valenti M, Giovannini M, Riva E(2000). Early macronutrient intake and overweight at five years of age. Int J Obes 24: 777-781.
Scariati PD, Grummer SL, Fein SB, Yip R (1997). Risk of diarrhea related to iron content ofinfant formula: lack of evidence to support the use of low-iron formula as a supplement forbreast-fed infants. Pediatrics 99: E2.
SCF (Scientific Committee for Food) (1983). First report on the essential requirements ofinfant formulae and follow-up milks based on cow’s milk proteins. Opinion expressed on 27April 1983. Reports of the Scientific Committee for Food, Fourteenth Series. EuropeanCommission, Luxembourg.
SCF (Scientific Committee for Food) (1989). The minimum requirements for soya-basedinfant formulae and follow-up milks. Opinion expressed on 9 December 1988. Reports of theScientific Committee for Food, Twenty-third Series. European Commission, Luxembourg.
SCF (Scientific Committee for Food) (1991). First addendum to the Reports of the ScientificCommittee on Food concerning the essential requirements of infant formulae and follow-upmilks based on cow’s milk proteins (opinion expressed on 27 April 1983) and the minimumrequirements for soya-based infant formulae and follow-up milks (opinion expressed on 9December 1988). Opinion expressed on 27 October 1989. Reports of the ScientificCommittee for Food, Twenty-fourth Series. European Commission, Luxembourg.
SCF (Scientific Committee for Food) (1993a). Report on infant formulae claimed to be“hypoallergenic” or “hypoantigenic” (opinion expressed on 9 December 1991). SecondAddendum concerning the essential requirements of infant formulae and follow-up milksbased on cows’ milk proteins and the minimal requirements for soya-based infant formulaeand follow-up milks (opinion expressed on 9 December 1991). Reports of the ScientificCommittee for Food, Twenty-eight Series. European Commission, Luxembourg.
198
SCF (Scientific Committee for Food) (1993b). Nutrient and energy intakes for the EuropeanCommunity. Reports of the Scientific Committee for Food, Thirty-first Series. EuropeanCommission, Luxembourg. http://europa.eu.int/comm/food/fs/sc/scf/out89.pdf
SCF (Scientific Committee for Food) (1995). Report on essential requirements for infantformulae and follow-on formulae. Opinion expressed on 17 September 1993. Reports of theScientific Committee for Food, Thirty-fourth Series. European Commission, Luxembourg.
SCF (Scientific Committee for Food) (1997). The calculation of vitamin E content in infantformulae and follow-on formulae. Opinion expressed on 7 June 1996. Reports of theScientific Committee for Food, Thirty-ninth Series. European Commission, Luxembourg.
SCF (Scientific Committee for Food) (1999a). Opinion on certain additives to foods forinfants and young children in good health and in foods for special medical purposes forinfants and youg children. Opinion expressed on 21 March 1997 and amended on 13 June1997. Forty-third Series. European Commission, Luxembourg.
SCF (Scientific Committee for Food) (1999b). Opinion on arsenic, barium, fluoride, boronand manganese in natural mineral waters (expressed on 13 December 1996). Forty-thirdSeries. European Commission, Luxembourg.
SCF (Scientific Committee on Food) (2000a). Opinion on the tolerable upper intake level ofvitamin B6. Opinion expressed on 19 October 2000.
SCF (Scientific Committee on Food) (2000b). Opinion on the tolerable upper intake level offolate. Opinion expressed on 19 October 2000.
SCF (Scientific Committee on Food) (2000c). Opinion on the tolerable upper intake level ofvitamin B2. Opinion expressed on 22 November 2000.
SCF (Scientific Committee on Food) (2000d). Opinion on the tolerable upper intake level ofvitamin B12. Opinion expressed on 19 October 2000.
SCF (Scientific Committee on Food) (2000e). Opinion on the tolerable upper intake level ofmanganese. Opinion expressed on 19 October 2000.
SCF (Scientific Committee on Food) (2000f). Opinion on the tolerable upper intake level ofselenium. Opinion expressed on 19 October 2000.
SCF (Scientific Committee on Food) (2001a). Guidance on submission for safety evaluationsof sources of nutrients or of other ingredients proposed for use in the manufacture of foods.Opinion expressed on 11 July 2001.
SCF (Scientific Committee on Food) (2001b). Opinion on the tolerable upper intake level ofvitamin B1. Opinion expressed on 11 July 2001.
SCF (Scientific Committee on Food) (2001c). Opinion on the tolerable upper intake level ofbiotin. Opinion expressed on 26 September 2001.
SCF (Scientific Committee for Food) (2001d). Statement on the use of resistant short chaincarbohydrates (oligofructose and oligogalactose) in infant formulae and in follow-on formulae(expressed on 26 September 2001).
199
SCF (Scientific Committee for Food) (2001e). Additional statement on the use of resistantshort chain carbohydrates (oligofructosyl-saccharose and oligogalactosyl-lactose) in infantformulae and in follow-on formulae, expressed on 13 December 2001.
SCF (Scientific Committee on Food) (2001f). Opinion on the tolerable upper intake level ofmagnesium. Opinion expressed on 26 September 2001.
SCF (Scientific Committee on Food) (2002a). Opinion on the tolerable upper intake level ofnicotinic acid and nicotinamide (niacin). Opinion expressed on 17 April 2002.
SCF (Scientific Committee on Food) (2002b). Opinion on the tolerable upper intake level ofpreformed vitamin A (retinol and retinyl esters). Opinion expressed on 26 September 2002.
SCF (Scientific Committee on Food) (2002c). Opinion on the tolerable upper intake level ofvitamin D. Opinion expressed on 4 December 2002.
SCF (Scientific Committee on Food) (2002d). Opinion on the tolerable upper intake level ofpantothenic acid. Opinion expressed on 17 April 2002
SCF (Scientific Committee on Food) (2002e). Opinion on the tolerable upper intake level ofiodine. Opinion expressed on 26 September 2002.
SCF (Scientific Committee on Food) (2003a). Opinion on the tolerable upper intake level ofvitamin K. Opinion expressed on 4 April 2003.
SCF (Scientific Committee on Food) (2003b). Opinion on the tolerable upper intake level ofcopper. Opinion expressed on 5 March 2003.
SCF (Scientific Committee on Food) (2003c). Opinion on the tolerable upper intake level ofzinc. Opinion expressed on 5 March 2003.
SCF (Scientific Committee for Food) (2003d). Opinion of the Scientific Committee on Foodon Carrageenan. Opinion expressed on 5 March 2003.
Schanler RJ (1989). Water-soluble vitamins. In: Textbook of Gastroenterology and Nutritionin Infancy. 2nd ed. (Lebenthal E, ed.) New York, Raven Press, pp 377-391.
Schlimme E, Martin D, Meisel H (2000). Nucleosides and nucleotides: natural bioactivesubstances in milk and colostrum. Br J Nutr 84: S59-S68.
Schlimme E and Schneehagen K (1995). Ribonucleosides in human milk. Concentrationprofiles of these minor constituents as a function of nursing time. Z Naturforsch 50: 105-113.
Schmelzle H, Wirth S, Skopnik H, Radke M, Knol J, Böckeler H-M, Brönstrup A, Wells J,Fusch C (2003). Randomized double-blind study of the nutritional efficacy and bifidogenicityof a new infant formula containing partially hydrolysed protein, a high �-palmitic acid leveland non digestible saccharides. J Pediatr Gastroeneterol Nutr 36:343-351.
Schneider BD and Leibolod EA (2000). Regulation of mammalian iron homeostatis. CurrOpin Clin Nutr Metab Care 3: 267-273.
200
Schöch G and Kersting M (1996). Bedarf an Energie und Eiweiß und die Richtlinien derEuropäischen Union (EU) für das 1. Lebensjahr Monatsschr Kinderheilkd 144 (Suppl 2):S184-S192.
Scholte HR and de Jonge PC (1987). Metabolism, function and transport of carnitine in healthand disease. In: Carnitin in der Medizin (Gitzelmann R, Baerlocher K, Steinmann B (eds.).Schattauer Verlag, Stuttgart, pp 21-59.
Scholz-Ahrens KE and Schrezenmeir J (2002). Inulin, oligofructose and mineral metabolism -experimental data and mechanism. Br J Nutr 87 (Suppl 2): S179-S186.
Schonfeld J, Evans DF, Wingate DL (1997). Effect of viscous fiber (guar) on postprandialmotor activity in human small bowel. Dig Dis Sci 42: 1613-1617.
Schulz-Lell G, Dörner K, Oldigs HD, Sievers E, Schaub J (1991). Iron availability from aninfant formula supplemented with bovine lactoferrin. Acta Paediatr Scand 1980: 155-158.
Scoditti A, Peluso P, Pezzuto R, Giordano T, Melica A (1996). Asthma to carob bean flour.Ann Allergy Asthma Immunol 77: 81.
Setchell KDR (2001). Soy isoflavones - benefits and risks from nature's selective estrogenreceptor modulators (SERMs). J Am Coll Nutr 20: 354S-362S.
Setchell KDR, Zimmer-Nechemias L, Cai J, Heubi JE (1998). Isoflavone content of infantformulas and the metabolic fate of these phytoestrogens in early life. Am J Clin Nutr 68:1453S-1461S.
Shaffer S and Feretti D (1990). Neonatal hyponatremia associated with low maternal breastmilk sodium content. Clin Pediatr 29: 119-121.
Shen L, Robberecht H, Van Dael P, Deelstra H (1995). Estimation of the bioavailability ofzinc and calcium from human, cow's, goat, and sheep milk by an in vitro method. Biol TraceElem Res 49: 107-118.
Shornikova AV, Casas IA, Isolauri E, Nykkanen H, Vesikari T (1997). Lactobacillus reuterias a therapeutic agent in acute diarrhea in young children. J Pediatr Gastroenterol Nutr 24:399-404.
Sievers E and Schaub J (2003). Antireflux or antiregurgitation milk products. J PediatrGastroenterol Nutr 236: 418.
Sievers E, Oldigs H-D, Dörner K, Schaub J (1992). Longitudinal zinc balances in breast-fedand formula-fed infants. Acta Paediatr 81: 1-6.
Siimes MA, Salmenpera L, Perheentupa J (1984). Exclusive breast-feeding for 9 months: riskof iron deficiency. J Pediatr 104: 196-199.
Sunderland R and Emery JL (1979). The mortality and birth rates of spina bifida during aperiod of treatment, selectionand antenatal screening in Sheffield, 1963-78. Z KinderchirGrenzgeb 28: 294-301.
Small DM (1991). The effects of glyceride structure on absorption and metabolism.Annu Rev Nutr 11:413-434.

201
Smith CA, Cherry RB, Maletskos CJ, et al. (1955). Persistence and utilization of maternaliron for blood formation during infancy. J Clin Invest 34: 1391-1402.
Snyderman SE, Holt LE Jr, Dancis J, Roitman E, Boyer A, Balis ME (1962). “Unessential”nitrogen: a limiting factor for human growth. J Nutr 78: 57-72.
Socha P, Koletzko B, Pawlowska J, Proszynska K, Socha J (1997). Treatment of cholestaticchildren with water-soluble vitamin E (alpha-tocopheryl polyethylene glycol succinate):effects on serum vitamin E, lipid peroxides and polyunsaturated fatty acids. J PediatrGastroenterol Nutr 24: 189-193.
Sokol RJ (1994). Fat-soluble vitamins and their importance in patients with cholestatic liverdiseases. Gastroenterol Clin North Am 23: 673-705.
Solomons NW (1986). Competitive interaction of iron and zinc in the diet: consequences forhuman nutrition. J Nutr 116: 927-935.
Song WO, Chan GM, Wyse BW, Hansen RG (1984). Effect of pantothenic acid status on thecontent of the vitamin in human milk. Am J Clin Nutr 40: 317-324.
Specker BL, Black A, Allen L, Morrow F (1990a). Vitamin B12: low milk concentrations arerelated to low serum concentrations in vegetarian women and to methylmalonic aciduria intheir infants. Am J Clin Nutr 52: 1073-1076.
Specker BL, Brazerol W, Ho ML, Norman EJ (1990b). Urinary methylmalonic acid excretionin infants fed formula or human milk. Am J Clin Nutr 51: 209-211.
Sprecher H, Luthria DL, Mohammed BS, Baykousheva SP (1995). Reevaluation of thepathways for the biosynthesis of polyunsaturated fatty acids. J Lipid Res 36: 2471-2477.
SSC (Scientific Steering Committe) (2003). Guidance document for the risk assessment ofgenetically modified plants and derived food and feed. Opinion expressed on 23 April 2003.
Staggers JE, Hernell O, Stafford RJ and Carey MC (1990). Physical-chemical behaviour ofdietary and biliary lipids during intestinal digestion and absorption. 1. Phase behaviour andaggregation states of model lipid systems patterned after aqueous duodenal contents ofhealthy adult human beings. Biochemistry 29: 2028-2040.
Stastny D, Vogel RS, Picciano MF (1984). Manganese intake and serum manganeseconcentration of human milk-fed and formula-fed infants. Am J Clin Nutr 39: 872-878.
Steichen JJ and Koo WWK (1992). Mineral nutrition and bone mineralization in full-terminfants. Monattsschr Kinderheilkd 140 (Suppl 1): S21-S27.
Steinbrecher HA, Griffiths DM, Jackson AA (1996). Urea production in normal breast-fedinfants measured with primed/intermittent oral doses of �15N, 15N� urea. Acta paediatr 85:656-662.
Stephensen CB (2001). Vitamin A, infection, and immune function. Annu Rev Nutr 21: 167-192.
Stettler N, Zemel BS, Kumanyika S, Stallings VA (2002). Infant weight gain and childhoodoverweight status in a multicenter, cohort study. Pediatrics 109: 194-199.

202
Stevens RG, Graubard BI, Micozzi MS, Neriishi K, Blumberg BS (1994). Moderate elevationof body iron level and increased risk of cancer occurrence and death. Int J Cancer 56: 364-369.
Strom BL, Schinnar R, Ziegler EE, Barnhart KT, Sammel MD, Macones GA, Stallings VA,Drulis JM, Nelson SE, Hanson SA (2001a). Exposure to soy-based formula in infancy andendocrinological and reproductive outcomes in young adulthood. JAMA 286: 807-814.
Strom BL, Schinnar R, Barnhart KT, Sammel MD, Macones GA, Stallings VA (2001b).Exposure to soy-based formula in infancy J Am Med Ass 286: 2403 (letter).
Sturgeon P (1956). A review with special consideration of iron requirements during normalinfancy. Pediatrics 18: 267.
Sturman JA (1988). Taurine in development. J Nutr 118: 1169-1176.
Sturman JA and Chesney RW (1995). Taurine in pediatric nutrition. Pediatr. Clin North Am42: 879-897.
Suerwald T, Hachey DL, Jensen CL, Chen H, Anderson RE, Heird WC (1996). Effect ofdietary �-linolenic acid intake on incorporation of docosahexaenoic acid and arachidonicacids into plasma phospholipids of term infants. Lipids 31: S131-S135.
Sugano M and Ikeda I (1996). Metabolic interactions between essential and trans-fatty acids.Curr Opin Lipidol 7: 38-42.
Sulkers EJ, Lafeber HN, Degenhart HJ, Lindemans J, Sauer PJ (1990). Comparison of twopreterm formulas with or without addition of medium-chain triglycerides (MCTs). II: Effectson mineral balance. J Pediatr Gastroenerol Nutr 5: 42-47.
Sutor AH, von Kries R, Cornelissen EA, McNinch AW, Andrew M (1999). Vitamin Kdeficiency bleeding (VKDB) in infancy. ISTH Pediatric/Perinatal Subcommittee.International Society on Thrombosis and Haemostasis. Thromb Haemost 81: 456-461.
Suttie JW (1996). Vitamin K. In: Present Knowledge of Nutrition. 7th ed. (Ziegler EE, FilerLJ, eds.). ILSI Press, Washington DC, pp 137-145.
Suzuki S, Iwata G, Sutor AH (2001). Vitamin K deficiency during the perinatal and infantileperiod. Semin Thromb Hemost 27: 93-98.
Szajewska H and Mrukowicz JZ (2001). Probiotics in the treatment and prevention of acuteinfectious diarrhea in infants and children: a systematic review of published randomized,double-blind, placebo-controlled trials. J Pediatr Gastroenterol Nutr 33 (Suppl 2): S17-S25.
Szajewska H, Kotowska M, Mrukowicz JZ, Armanska M, Mikolajczyk W (2001). Efficacy ofLactobacillus GG in prevention of nosocomial diarrhoea in infants. J Pediatr 138: 361-365
Tamime AY (2002). Fermented milks: a historical food with modern applications - a review.Eur J Clin Nutr 56 (Suppl 4): S2-S15.
Tang G, Qin J, Dolnikowski GG, Russell RM (2000). Vitamin A equivalence of beta-carotenein a woman as determined by a stable isotope reference method. Eur J Nutr 39: 7-11.

203
Tannock GW (2002). Analysis of the intestinal microflora using molecular methods. Eur JClin Nutr 56 (Suppl 4): S44-S49.
Tarlo SM, Dolovich J, Listgarten C (1995). Anaphylaxis to carrageenan: a pseudo-latexallergy. J Allergy Clin Immunol 95: 933-936.
Taves DR (1983). Dietary intake of fluoride ashed (total fluoride) versus unashed (inorganicfluoride) analysis of individual foods. Br J Nutr 49: 295-301.
Thomas MR, Sneed SM, Wei C, Nail PA, Wilson M, Sprinkle EE (1980). The effects ofvitamin C, vitamin B6, vitamin B12, folic acid, riboflavin and thiamin on the breast milk andmaternal status of well-nourished women at 6 months post-partum. Am J Clin Nutr 33: 2151-2156.
Thomson AW, Fowler EF, Sljivic VS, Brent L (1980). Carrageenan toxicity. Lancet 1: 1034.
Tinggi U, Patterson C, Reilly C (2001). Selenium levels in cow's milk from different regionsof Australia. Int J Food Sci Nutr 52: 43-51.
Tomarelli RM, Meyer BJ, Weaber JR, Bernhart FW (1968). Effect of positional distributionon the absorption of the fatty acids of human milk and infant formulas. J Nutr 95: 583-590
Tomashek KM, Nesby S, Scanlon KS, Cogswell ME, Powell KE, Parashar UD, Mellinger-Birdsong A, Grummer-Strawn LM, Dietz WH (2001). Nutritional rickets in Georgia.Pediatrics 107: E45.
Topp H, Duden R, Schoch G (1993). 5-6-Dihydrouridine: a marker ribonucleoside fordetermining whole body degradation rates of transfer RNA in man and rats. Clin Chim Acta17: 73-82.
Torun B, Davies PSW, Livingstone MBE, Paolisso M, Sackett R, Spurr GB (1996). Energyrequirements and dietary energy recommendations for children and adolescents 1 to 18 yearsold. Eur J Clin Nutr 50 (Suppl 1): S35-S81.
Toschke AM, Vignerova J, Lhotska L, Osancova K, Koletzko B, von Kries R (2002).Overweight and obesity in 6- to 14- year-old Czech children in 1991: protective effect ofbreast-feeding. J Pediatrics 141: 764-769.
Traber MG and Sies H (1996). Vitamin E in humans: demand and delivery. Annu Rev Nutr16: 321-347.
Tran TT, Chowanadisai W, Crinella FM, Chicz-DeMet A, Lönnerdal B (2002). Effect of highdietary manganese intake of neonatal rats on tissue mineral accumulation, striatal dopaminelevels, and neurodevelopmental status. Neurotoxicology 23: 635-643.
Trang HM, Cole DE, Rubin LA, Pierratos A, Siu S, Vieth R (1998). Evidence that vitamin D3increases serum 25-hydroxyvitamin D more efficiently than does vitamin D2. Am J Clin Nutr68: 854-858.
Tsang RC (1972). Neonatal magnesium disturbances. Am J Dis Child 124: 282-293.
Tsang RC, Zlotkin SH, Nichols BL, Hansen JW (1997). Nutrition during infancy. In:Principles and practice. 2nd ed. Cincinnati, Digital Educational Publications.

204
Tsongas TA, Meglen RR, Walravens PA, Chappell WR (1980). Molybdenum in the diet: anestimate of average daily intake in the United States. Am J Clin Nutr 33: 1103-1107.
Tunell R, Allgen LG, Jalling B, Perrson B (1965). Prophylactic vitamin A dose in Sweden.An investigation in connection with cases of intoxication. Acta Paediatr Scand 54: 61-68.
Tuthill DP, Cosgrove M, Dunstan F, Stuart ML, Wells JCK, Davies DP (2002). Randomizeddouble-blind controlled trial on the effects on iron status in the first year between a no addediron and standard infant formula recieved for three months. Acta Paediatr 91: 119-124.
Uauy R, Quan R, Gil A (1994). Role of nucleotides in intestinal development and repair:implications for infant formula. J Nutr 124: 1436S-1441S.
Uauy R, Mena P, Wegher B, Nieto S, Salem N Jr (2000). Long chain polyunsaturated fattyacid formation in neonates: effect of gestational age and intrauterine growth. Pediatr Res 47:127-135.
Urbiené S, Ciuckinas A, Margelyte J (1997). Physical and chemical properties and thebiological value of goat's, cow's and human milk. Milchwissenschaft 52: 427-430.
Valeix P, Preziosi P, Rossignol C, Farnier MA, Hercberg S (1992). Iodine intakes assessed byurinary iodine concentrations in healthy children aged ten months, two years, and four years.Biol Trace Elem Res 32: 259-266.
Van der Brempt X, Ledent C, Mairesse M (1992). Rhinitis and asthma caused byoccupational exposure to carob bean flour. J Allergy Clin Immunol 90: 1008-1010.
Van Loo J, Cummings J, Delzenne N, Englyst H, Franck A, Hopkins M, Kok N, MacfarlaneG, Newton D, Quigley M, Roberfroid M, van Vliet T, van den Heuvel E (1999).Functional food properties of non-digestible oligosaccharides: a consensus report from theENDO project (DGXII AIRII-CT94-1095). Br J Nutr 81: 121-132.
Van Nieuwenhoven MA, Kovacs EMR, Brummer R-JM, Westerterp-Plantenga MS, Brouns F(2001). The effect of different dosages of guar gum on gastric emptying and small intestinaltransit of a consumed semisolid meal. J Am Coll Nutr 20: 87-91.
Van Winkle S, Levy SM, Kiritsy MC, Heiman JR, Wefel JS, Marshall T (1995). Water andformula fluoride concentrations: significance for infants fed formula. Pediatr Dent 17: 305-310.
Van Zoeren-Grobben D, Jacobs NJ, Houdkamp E, Lindeman JH, Drejer DF, Berger HM(1998). Vitamin E status in preterm infants: assessment by plasma and erythrocyte vitamin E-lipid ratios and hemolysis tests. J Pediatr Gastroenterol Nutr 26: 73-79.
Vandenplas Y and Sacré L (1986). Milk-thickening agents as a treatment for gastroesophagealreflux. Clin Pediatr 26: 66-68.
Vandenplas Y, Hauser B, Blecker U, Suys B, Peeters S, Keymolen K, Loeb H (1993). Thenutritional value of a whey hydrolysate formula compared with a whey-predominant formulain healthy infants. J Pediatr Gastroenterol Nutr 17: 92-96.
Vaz FM and Wanders RJ (2002). Carnitine biosynthesis in mammals. Biochem J 361: 417-429.

205
Veitl V, Wells JCK, Helm K, Lamme W, Müller H, Kafka C, Brönstrup A, Böckler HM(2000). Akzeptanz, Toleranz und Wirksamkeit von milupa Comformil bei Säuglingen mitkleinen Ernährungs- und Verdauungsproblemen. J Ernährungsmed 2: 14-20.
Vervel C, Zeghoud F, Boutignon H, Tjani JC, Walrant-Debray O, Garabedian M (1997).Fortified milk and supplements of oral vitamin D. Comparison of the effect of two doses ofvitamin D (500 and 1,000 IU/day) during the first trimester of life. Arch Pediatr 4: 126-132(in French).
Vieth R (1999). Vitamin D supplementation, 25-hydroxyvitamin D concentrations, and safety.Am J Clin Nutr 69: 842-856.
Villalpando S, Butte NF, Flores-Huerta S, Thotahuchery M (1998). Qualitative analysis ofhuman milk produced by women consuming a maize-predominant diet typical of ruralMexico. Ann Nutr Metab 42: 23-32.
Virtanen SM, Rasanen L, Ylonen K, Aro A, Clayton D, Langholz B, Pitkaniemi J, SavilahtiE, Lounamaa R, Tuomilehto J, et al. (1993). Early introduction of dairy products associatedwith increased risk of IDDM in Finnish children. The childhood in diabetes in Finland StudyGroup. Diabetes 42: 1786-1790.
Vohra P, Shariff G, Kratzer FH (2000). Growth inhibitory effect of some gums and pectinsfor Tribolium castaneum larvae, chickens and Japanese quails. Nutr Rep Int 19: 463.
Von Berg A, Koletzko S, Grübl A, Filipiak-Pittroff B, Wichmann E, Bauer CP, Reinhardt D,Berdel D (2003). The effect of hydrolyzed cow’s milk formula for allergy prevention in thefirst year of life: The German Infant Nutritional Intervention Study, a randomized duble-blindtrial. J Allergy Clin Immunol 111: 533-540.
Von Kries R (1998). Neonatal vitamin K prophylaxis: the Gordian knot still awaits untying.Br Med J 316: 161-162.
Von Kries R, Shearer M, McCarthy PT, Haug M, Harzer G, Gobel U (1987). Vitamin K1content of maternal milk: influence of the stage of lactation, lipid composition, and vitaminK1 supplements given to the mother. Pediatr Res 22: 513-517.
Von Kries R, Koletzko B, Sauerwald T, von Mutius E, Barnert D, Grunert V, von Voss H(1999). Breastfeeding and obesity: cross sectional study. Br Med J 319: 147-150.
Wack RP, Lien EL, Taft D, Roscelli JD (1997). Electrolyte composition of human breast milkbeyond the early postpartum period. Nutrition 13: 774-777.
Walker WA (2000). Role of nutrients and bacterial colonization in the develoment ofintestinal host defense. J Pediatr Gastroenterol Nutr 30: S2-S7.
Walravens PA and Hambidge KM (1976). Growth of infants fed a zinc supplementedformula. Am J Clin Nutr 29: 1114-1121.
Walravens PA, Chakar A, Mokni R, Denise J, Lemonnier D (1992). Zinc supplements inbreastfed infants. Lancet 340: 683-685.

206
Walter T, Dallman PR, Pizarro F, Velozo L, Pena G, Bartholmey SJ, Hertrampf E, OlivaresM, Letelier A, Arredondo M (1993). Effectiveness of iron-fortified infant cereal in preventionof iron deficiency anemia. Pediatrics 91: 976-982.
Wang B, Brand-Miller J, McVeagh P, Petocz P (2001). Concentration and distribution ofsialic acid in human milk and infant formulas. Am J Clin Nutr 74: 510-515.
Warshaw JB and Curry E (1980). Comparison of serum carnitine and ketone bodyconcentration in breast- and in formula-fed newborn infants. J Pediatr 97: 122-125.
Webster WS, Vaghef H, Ryan B, Dencker L, Hellman B (2000). Measurement of DNAdamage by the comet assay in rat embryos grown in media containing high concentrations ofvitamin K1. Toxicol In Vitro 14: 95-99.
Wecker L (1990). Dietary choline: a limiting factor for the synthesis of acetylcholine by thebrain. Adv Neurol 51: 139-145.
Welch TR, Bergstrom WH, Tsang RC (2000). Vitamin D-deficient rickets: the reemergenceof a once-conquered disease. J Pediatr 137: 143-145.
Wharton BA (1989). An approach to setting maxima in infant formulas. J Nutr 119: 1768-1989.
Wharton BA (1994). International recommendations on protein intakes in infancy: somepoints for discussion. In: Protein Metabolism during Infancy (Räihä NCR, ed.). NestléNutrition Workshop Series, Raven Press, New York. Vol. 33, pp 67-83.
Wharton BA and Scott PH (1996). Distinctive aspects of metabolism and nutrition in infancy.Clin Biochem 29: 419-428.
Whitehead RG, Paul AA, Cole TJ (1981). A critical analysis of measured food energy intakesduring infancy and early childhood in comparison with current internationalrecommendations. J Hum Nutr 35: 339-348.
WHO (World Health Organisation) (1985). Thirty-Eigth World Health Assembly.International Code of Marketing of Breast-Milk Subsitutes. WHO/MCH/NUT/86.1.
WHO (World Health Organisation) (1986). Thirty-Ninth World Health Assembly. Guidelinesconcerning the main health and socioeconomic circumstances in which infants have to be fedon breast-milk substitutes. A39/8 Add. 1. 10 April 1986.
WHO (World Health Organization) (1998). Complementary feeding of young children indeveloping countries: a review of current scientific knowledge. Geneva.
WHO (World Health Organisation) (2001a). Fifty-Fourth World Health Assembly. Infant andyoung child nutrition. WHA 54.2, 18 May 2001.
WHO (World Health Organisation) (2001b). Expert Consultation on the optimal duration ofexclusive breast-feeding. Conclusions and Recommendations. A54/INF.Doc./4. Geneva, 28 to30 March 2001.
WHO (World Health Organisation) (2002). Iron deficiency anaemia. Assessment, prevention,and control. A guide for programme managers. Geneva (WHA/NHD/01.03).
207
Whyte RK, Campbell D, Stanhope R, Bayley HS, Sinclair JC (1986). Energy balance in lowbirth weight infants fed formula of high or low medium-chain triglyceride content. J Pediatr108: 964-971.
Widdowson EM and Spray CM (1951). Chemical development in utero. Arch Dis Child 26:205-214.
Willatts P and Forsyth JS (2000). The role of long-chain polyunsaturated fatty acids in infantcognitive development. Prostaglandins, Leucotrienes and Essential Fatty Acids 63: 95-100.
Willershausen B, Kroes H, Brandenbusch M (2000). Evaluation of the contents of mineralwater, spring water, table water and spa water. Eur J Med Res 5: 251-262.
Williams CH, Witerly SA, Buddington RK (1994). Influence of dietary neosugar on selectedbacterial groups of the humant faecal microbiota. Microb Ecol Health Dis 7: 91-97.
Williams J, Wolff A, Daly A, MacDonald A, Aukett A, Booth IW (1999). Iron supplementedformula milk related to reduction in psychomotor decline in infants from inner city areas:randomised study. Br Med J 318: 693-697.
Wong WW, Hachey DL, Insull W, Opekun AR, Klein PD (1993). Effect of dietarycholesterol on cholesterol synthesis in breast-fed and formula-fed infants. J Lipid Res 34:1403-1411.
Woodard WK, Miller KJ, Legant O (1961). Acute and chronic hypervitaminosis in a 4 monthold infant. J Pediatr 59: 260-264.
Wu PY, Edmond J, Morrow JW, Auestad N, Ponder D, Benson J (1993). Gastrointestinaltolerance, fat absorption, plasma ketone and urinary dicarboxylic acid levels in low- birth-weight infants fed different amounts of medium-chain triglycerides in formula. J PediatrGastroenterol Nutr 17:145-152.
Wurzelmann JI, Silver A, Schreinemachers DM, Sandler RS, Everson RB (1996). Iron intakeand the risk of colorectal cancer. Cancer Epidemiol Biomarkers Prev 5: 503-507.
Yang G-Q and Xia YM (1995). Studies on human dietary requirements and safe range ofdietary intakes of selenium in China and their application in the prevention of related endemicdiseases. Biomed Environ Sci 8: 187-201.
Yellayi S, Naaz A, Szewczykowski MA, Sato T, Woods JA, Chang J, Segre M, Allred CD,Helferich WG, Cooke PS (2002). The phytoestrogen genistein induces thymic and immunechanges: a human health concern? Proc Natl Acad Sci 99: 7616-7621.
Yoshioka H, Iseki K, Fujita K (1983). Development and differences of intestinal flora in theneonatal period in breast-fed and in bottle-fed infants. Pediatrics 72: 317-321.
Yuzbasiyan-Gurkan V, Grider A, Nostrant T, Cousins RJ, Brewer GJ (1992). Treatment ofWilson's disease with zinc: X. Intestinal metallothionein induction. J Lab Clin Med 120: 380-386.
Zeisel SH (1981). Dietary choline: biochemistry, physiology and pharmacology. Annu RevNutr 1: 95-121.

208
Zeisel SH (1994). Choline. In: Modern Nutrition in Health and Disease. 8th ed. Vol. 1 (ShilsME, Olson JA, Shike M, eds.), Lea & Febiger, Philadelphia PA, pp 449-458.
Zempleni J (1995). Pharmacokinetics of vitamin B6 supplements in humans. J Am Coll Nutr14: 579-586.
Ziegler EE (2002). Protein requirements in infancy. In: Infant Formula: Closer to theReference (Räihä NCR, Rubaltelli FF, eds.). Nestlé Nutrition Workshop Series, PediatricProgram, Vol. 47 Supplement. Nestec Ltd., Vevey/Lippincott Williams & Wilkins,Philadelphia, pp 97-110.
Zoppi G, Zamboni G, Bassani N, Vazzoler G (1979). Gammaglobulin level and soy-proteinintake in early infancy. Eur J Pediatr 131: 61-69.
Zoppi G, Gerosa F, Pezzini A, Bassani N, Rizzotti P, Bellini P, Todeschini G, Zamboni G,Vazzoler G, Tridente G (1982). Immunocompetence and dietary protein intake in earlyinfancy. J Pediatr Gastroenterol Nutr 1: 175-182.

209
ANNEX to the Report of the Scientific Committee on Food on the EssentialRequirements for Infant Formulae and Follow-on Formulae
SUMMARY TABLE OF RECOMMENDATIONSON THE COMPOSITION OF
INFANT FORMULAE AND FOLLOW-ON FORMULAE
Infant Formulae Follow-on Formulae
Energy density (kcal/100 mL) 60-70 60-70Nutrients (per 100 kcal, unless otherwise stated)
Protein1
Cow’s milk protein 1.8-3 g2 1.8-3 gSoy proteinProtein hydrolysates 2.25-3 g
L-carnitine addition to soy protein andprotein hydrolysates formulae 1.2 mg no requirement
Addition of taurine �12 mgNucleotides, if added3
� 5 mgCholine 7-30 mg no requirementFatTotal fat 4.4-6 g 4.0-6.0 gPhospholipids �1 g/LInositol 4-40 mg no requirementLauric and myristic acids Together �20% of total fatty acidsLinoleic 0.5-1.2 gFormulae without added LCPUFA
�-linolenic 100 mgLinoleic/�-linolenic ratio 5-15
Formulae with added LCPUFA�-linolenic4 50 mgLinoleic/�-linolenic ratio4 5-20n-6 LCPUFA �2% of total fatty acidsArachidonic acid �1% of total fatty acidsn-3 LCPUFA �1% of total fatty acidsRatio EPA/DHA (wt/wt) <1
Cottonseed/sesame oils No use of these type of oilsConjugated linoleic acid (CLA) No intentional additionTrans fatty acids �3% of total fatty acidsErucic acid �1% of total fatty acids
1 Calculation of protein content: N x 6.25, non-protein nitrogen (formulae made from intact protein) �15% oftotal nitrogen.2 Infant formulae containing 1.8 g/100 kcal should be clinically evaluated.3 Maximum content per nucleotide as specified in the text.4 If DHA content ≥0.2% of total fatty acids.

210
Infant Formulae Follow-on Formulae
CarbohydratesTotal carbohydrates 9-14 gLactose in cows’ milk protein- andprotein hydrolysates formulae 4.5 g
Lactose in soy protein formulae No requirement
Saccharose
None in cows’ milkprotein and soy protein
formulae�20% of total
carbohydrates in proteinhydrolysates formulae
Fructose None
Sum of saccharose,fructose, honey �20%of total carbohydrates
GlucoseNo intentional addition to formulae based on
intact proteins,�2 g in formulae based on protein hydrolysates
Maltose, maltodextrins Unrestricted
Starches
�30% of totalcarbohydrates (�2
g/100 mL) asprecooked or
gelatinised naturallygluten-free starches
No starches modifiedby enzymatic cross-
linking or stabilisation
Gluten-freecarbohydrates only
VitaminsVitamin A 60-180 �g REVitamin D 1-2.5 �g 1-3 �g
Vitamin E 0.5 mg �TE/g PUFA (corrected for double bond,see footnote5) - 5 mg
Vitamin K 4-20 �gVitamin B1 (thiamine) 60-300 �gVitamin B2 (riboflavin) 80-400 �gVitamin B3 (niacin) 300-1200 �g NEVitamin B6 (pyridoxine) 35-165 �gVitamin B12 (cobalamin) 0.1-0.5 �gPantothenic acid 400-2000 �gFolic acid 10-30 �gVitamin C (ascorbic acid) 10-30 mgBiotin 1.5-7.5 �g
5 0.5 mg α-TE/1 g linoleic acid (18:2n-6); 0.75 mg α-TE/1 �-linolenic acid (18:3n-3); 1.0 mg α-TE/1 garachidonic acid (20:4n-6); 1.25 mg α-TE/1 g eicosapentaenoic acid (20:5n-3); 1.5 mg α-TE/1 gdocosahexaenoic acid (22:6n-3).

211
Infant Formulae Follow-on Formulae
Trace Elements Iron
Cow’s milk protein and proteinhydrolysate formulae 0.3-1.3 mg 0.6-1.7 mg
Soy protein formulae 0.45-1.9 mg 0.9-2.5 mgCalcium 50-140 mgCalcium/Phosphorus-Ratio 1.0-2.0
Phosphorus
Cows’ milk protein- and protein hydrolysateformulae: 25-90 mg
Soy protein formulae: 30-100(Bioavailable phosphorus, if measured: 20-70 mg)
Magnesium 5-15 mgSodium 20-60 mgChloride 50-160 mgPotassium 60-160 mgChromium No recommended minimum and maximum levelsManganese 1-100 �gMolybdenum No recommended minimum and maximum levelsFluoride <100 �gIodine 10-50 �gSelenium 3-9 �gCopper 35-100 �gZinc
Cow’s milk protein and proteinhydrolysate formulae 0.5-1.5 mg
Soy protein formulae 0.75-2.40 mg

