report of the operational performance ... - india, south asia
TRANSCRIPT
Report of the
Comptroller and Auditor General of India
on
Operational Performance and Productivity of the Refinery
and Smelter Plants of National Aluminium Company Limited
Union Government (Commercial)
Ministry of Mines
No. 6 of 2019 (Performance Audit)
Laid on the table of Lok Sabha and Rajya Sabha on ………………….

CONTENTS
CHAPTER SUBJECT PAGES
Preface i
Executive Summary iii
1. Introduction and Audit Approach 1
2. Refinery and Mines 11
3. Smelter and Captive Power Plant 27
4. Environmental Issues 33
5. Conclusion and Recommendations 39
Appendix 43
Annexures 45
List of Abbreviations 55

i
PREFACE
The Performance Audit has been carried out in line with the Regulations
on Audit and Accounts, 2007 and Performance Auditing Guidelines 2014
of the Comptroller and Auditor General of India.
National Aluminium Company Limited (NALCO), a Central Public Sector
Enterprise was incorporated on 7 January 1981, with its Registered Office
at Bhubaneswar, Odisha. The Company, which functions under the
administrative control of Ministry of Mines, Government of India acquired
Navratna status in April 2008.
The Mines and the Refinery are located at Damanjodi, while the Smelter
and the Captive Power Plant are located at Angul, Odisha. The present
Performance Audit was undertaken to see whether the Company was
utilising the capacity of Mines, Refinery, Smelter and Captive Power Plant
optimally and to bring out the reasons for sub-optimal performance.
Audit wishes to acknowledge the co-operation extended by the
Management of NALCO and the Ministry of Mines at each stage of the
audit process.
Report No. 6 of 2019
iii
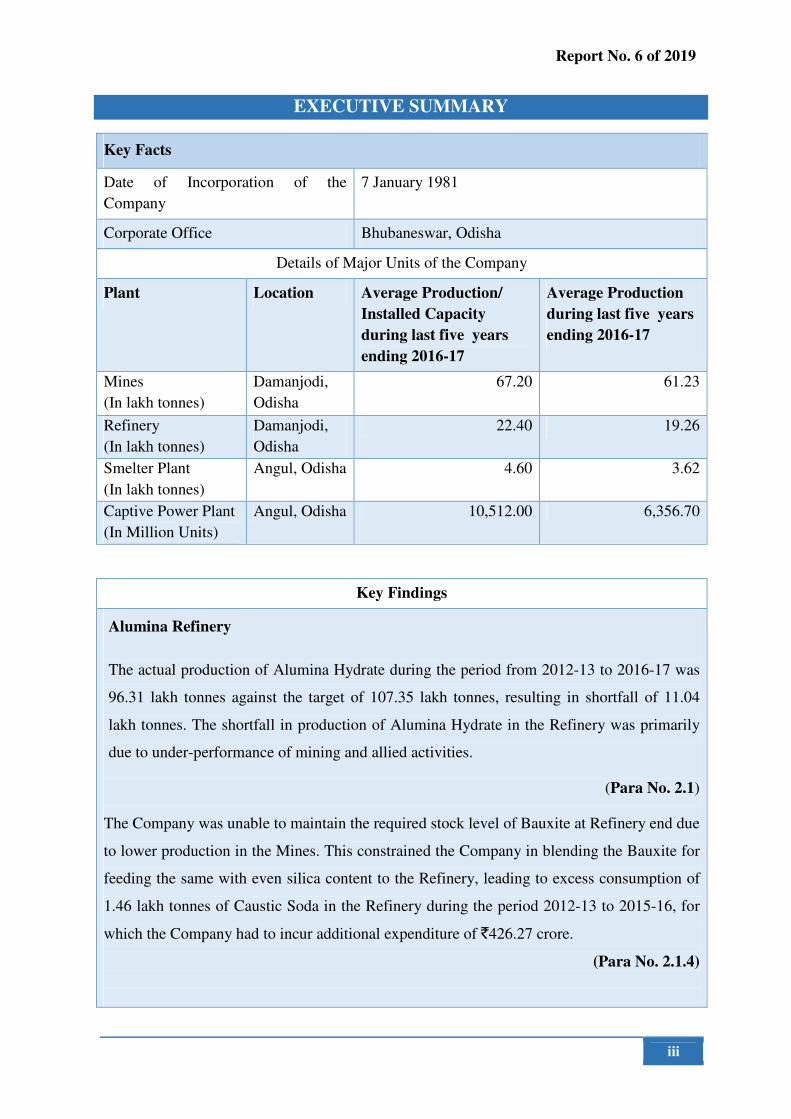
EXECUTIVE SUMMARY
Key Facts
Date of Incorporation of the
Company
7 January 1981
Corporate Office Bhubaneswar, Odisha
Details of Major Units of the Company
Plant Location Average Production/
Installed Capacity
during last five years
ending 2016-17
Average Production
during last five years
ending 2016-17
Mines
(In lakh tonnes)
Damanjodi,
Odisha
67.20 61.23
Refinery
(In lakh tonnes)
Damanjodi,
Odisha
22.40 19.26
Smelter Plant
(In lakh tonnes)
Angul, Odisha 4.60 3.62
Captive Power Plant
(In Million Units)
Angul, Odisha 10,512.00 6,356.70
Key Findings
Alumina Refinery
The actual production of Alumina Hydrate during the period from 2012-13 to 2016-17 was
96.31 lakh tonnes against the target of 107.35 lakh tonnes, resulting in shortfall of 11.04
lakh tonnes. The shortfall in production of Alumina Hydrate in the Refinery was primarily
due to under-performance of mining and allied activities.
(Para No. 2.1)
The Company was unable to maintain the required stock level of Bauxite at Refinery end due
to lower production in the Mines. This constrained the Company in blending the Bauxite for
feeding the same with even silica content to the Refinery, leading to excess consumption of
1.46 lakh tonnes of Caustic Soda in the Refinery during the period 2012-13 to 2015-16, for
which the Company had to incur additional expenditure of `426.27 crore.
(Para No. 2.1.4)
Report No. 6 of 2019
iv
Despite realising the requirement for installation of High Rate Decanter and Deep Cone
Washer for handling increased mud load in the Refinery since May 2011, which could have
accrued an approximate annual savings of `75.45 crore, the Company awarded the work
order for processability study in February 2016, i.e. after 57 months.
(Para No. 2.2)
Smelter Plant
The capacity utilisation of Smelter Plant remained lower than the installed capacity primarily
due to non-availability of adequate power from the Captive Power Plant. The Company was
not able to develop the Coal Blocks allotted by Government of India for supply of coal to the
Captive Power Plant for generation of required power for Smelter Plant. There was shortfall
in production of 4.93 lakh tonnes of Aluminium in the Smelter Plant during the period 2012-
13 to 2016-17, for which the Company lost the opportunity of earning incremental
contribution amounting to `1,086.63 crore, due to selling of intermediate product (Calcined
Alumina) instead of selling the value added product (Aluminium metal).
(Para No. 3.1)
The Company incurred additional expenditure of `326.62 crore towards excess consumption
of coal in the Captive Power Plant during the period from 2012-13 to 2016-17 due to high
dry flue gas and un-burnt carbon loss in ash, resulting in higher Station Heat Rate as
compared to the norms.
(Para No. 3.4)
As the Company did not avail the facility of joint sampling of coal at the loading point, the
Company could not detect slippage of quality of coal, resulting in avoidable expenditure of
`239.23 crore towards coal procured during the period 2012-13 to 2016-17.
(Para No. 3.5)
Environmental Issues
The transportation of excavated Bauxite in South Block Mines by dumpers to the crushers in
Central and North Block Mines, instead of transporting the same through the conveyor belt,
was not in conformity with the conditions of Environmental Clearance granted for operation
of South Block Mines.
(Para No. 4.1)

Report No. 6 of 2019
v
The discharge of Red Mud which ranged from 6,723 tonnes per day to 8,741 tonnes per day,
as well as discharge of Red Mud Pond Effluent which ranged from 5,425 kilo litres (KL) per
day to 6,854 KL per day, during the period 2012-13 to 2016-17, was consistently higher than
the corresponding limits of 6,087 tonnes per day and 5,200 KL per day as specified by the
Odisha State Pollution Control Board.
(Para No. 4.2)
Recommendations:
1. The Management may constantly monitor the position and deployment of skilled
Heavy Earth Moving Machine operators so that, in future, production from Mines is
not affected.
2. Balance pre-production drilling activity may be completed expeditiously so that
quality and quantity of Bauxite are properly assessed before preparing annual and
monthly mine production plan.
3. Removal of the top soil and the laterite overburden may be carried out as per the
Indian Bureau of Mines (IBM) approved mining plan. Clearance of the backlog
would help to get more options for quality control and blending of Bauxite.
4. The Management may maintain adequate level of Bauxite in stockpile to reduce the
variation in Bauxite quality before feeding to the Refinery.
5. The allotted Coal Blocks may be developed at the earliest to ensure supply of coal
to the Captive Power Plant.

Report No. 6 of 2019
1
Chapter 1: INTRODUCTION AND AUDIT APPROACH
1.1 About the Company
National Aluminium Company Limited (Company) was incorporated on 7 January
1981, with its Registered Office at Bhubaneswar, Odisha. The Company acquired
Navratna status in April 2008. The Company has its Bauxite Mines at Panchpatmali
Hill, Odisha and Alumina Refinery for production of Alumina near to the Mines in
Damanjodi. A Smelter Plant was established in Angul, Odisha near the Talcher coal
deposits to produce Aluminium from Calcined Alumina along with a Captive Power
Plant to ensure continuous supply of electricity. The Company is also the first Indian
company in the Aluminium sector to venture into the International Market with London
Metal Exchange (LME) registration since May 1989.
1.2 Details of production process
1.2.1 Mines
The Company mined Bauxite, the principal raw material for production of Aluminium,
from its Panchpatmali Mines at Damanjodi, Odisha. The Company is required to
prepare a Mining Plan for five years and get it approved by the Indian Bureau of Mines
(IBM) prior to commencement of mining operations. The entire mining operations are
to be carried out as per the approved Mining Plan. Deviations, if any, from such
approved Mining Plan also required prior approval from the IBM. During mining
operations, the overburden is removed to expose the Bauxite, which after excavation is
transported through Dumpers to the Primary Crusher at the Mines, where the same is
crushed for transportation to the Alumina Refinery through a 14.6 km long cable belt
conveyor.
1.2.2 Alumina Refinery
The Bauxite received from the Mines is processed in the Refinery with Caustic Soda
and other chemicals for production of Alumina Hydrate. The same is further processed
as Calcined Alumina in the Calciner Plants (Calciners) of the Refinery. A portion of the
Calcined Alumina is exported and the remaining portion is sent to the Smelter Plant of
the Company at Angul for production of Aluminium.
Report No. 6 of 2019
2
1.2.3 Smelter Plant
The Smelter Plant of the Company at Angul, Odisha produces Aluminium products like
Aluminium Ingots, Billets etc. from the Calcined Alumina received from the Refinery.
The Company also has a Rolled Product Unit in the Smelter Plant for production of
different value added rolled products like Rolled Coil1, Chequered Sheet2 etc.
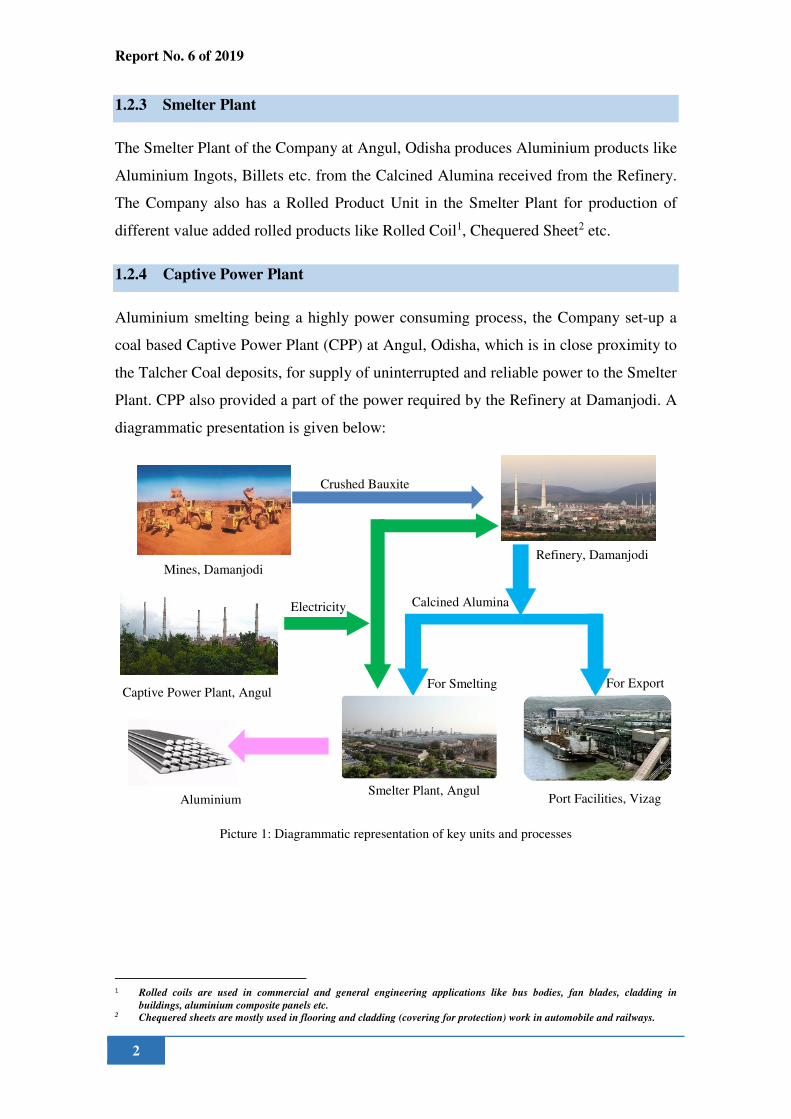
1.2.4 Captive Power Plant
Aluminium smelting being a highly power consuming process, the Company set-up a
coal based Captive Power Plant (CPP) at Angul, Odisha, which is in close proximity to
the Talcher Coal deposits, for supply of uninterrupted and reliable power to the Smelter
Plant. CPP also provided a part of the power required by the Refinery at Damanjodi. A
diagrammatic presentation is given below:
Picture 1: Diagrammatic representation of key units and processes
1 Rolled coils are used in commercial and general engineering applications like bus bodies, fan blades, cladding in
buildings, aluminium composite panels etc. 2 Chequered sheets are mostly used in flooring and cladding (covering for protection) work in automobile and railways.
Mines, Damanjodi Refinery, Damanjodi
Crushed Bauxite
Captive Power Plant, Angul
Smelter Plant, Angul
Electricity Calcined Alumina
Port Facilities, Vizag Aluminium
For Smelting For Export
Report No. 6 of 2019
3
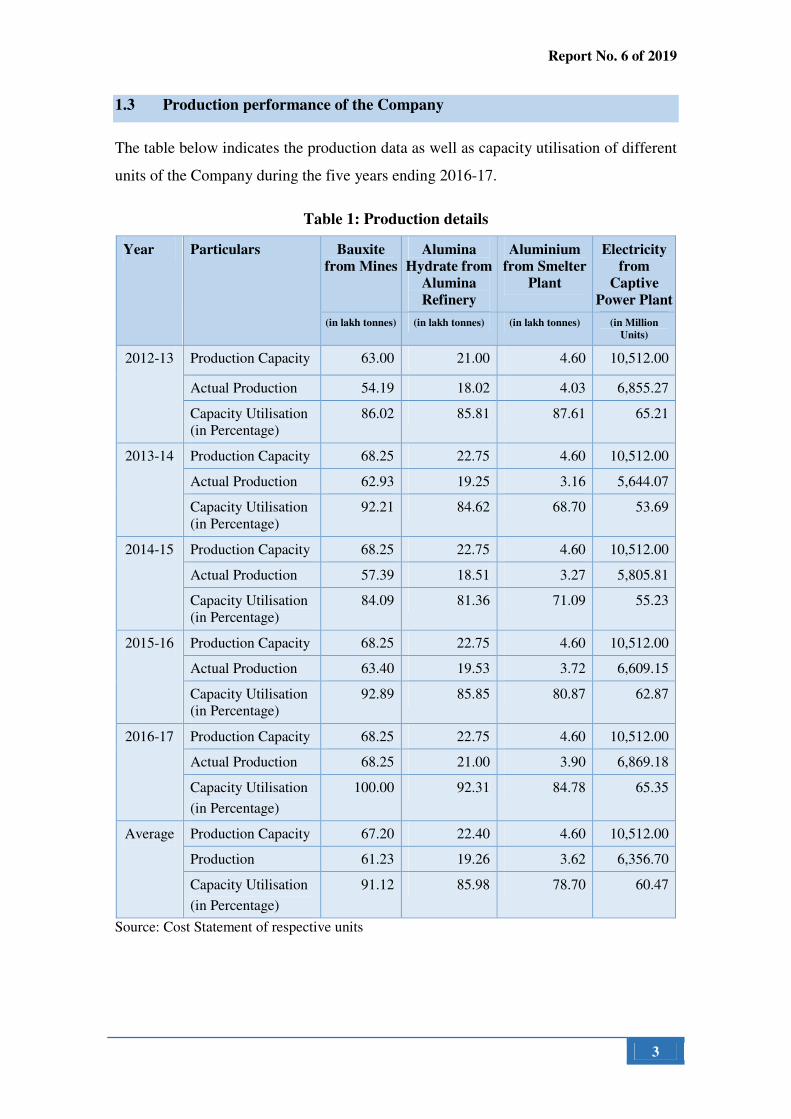
1.3 Production performance of the Company
The table below indicates the production data as well as capacity utilisation of different
units of the Company during the five years ending 2016-17.
Table 1: Production details
Year Particulars Bauxite
from Mines
Alumina
Hydrate from
Alumina
Refinery
Aluminium
from Smelter
Plant
Electricity
from
Captive
Power Plant
(in lakh tonnes) (in lakh tonnes) (in lakh tonnes) (in Million
Units)
2012-13 Production Capacity 63.00 21.00 4.60 10,512.00
Actual Production 54.19 18.02 4.03 6,855.27
Capacity Utilisation
(in Percentage)
86.02 85.81 87.61 65.21
2013-14 Production Capacity 68.25 22.75 4.60 10,512.00
Actual Production 62.93 19.25 3.16 5,644.07
Capacity Utilisation
(in Percentage)
92.21 84.62 68.70 53.69
2014-15 Production Capacity 68.25 22.75 4.60 10,512.00
Actual Production 57.39 18.51 3.27 5,805.81
Capacity Utilisation
(in Percentage)
84.09 81.36 71.09 55.23
2015-16 Production Capacity 68.25 22.75 4.60 10,512.00
Actual Production 63.40 19.53 3.72 6,609.15
Capacity Utilisation
(in Percentage)
92.89 85.85 80.87 62.87
2016-17 Production Capacity 68.25 22.75 4.60 10,512.00
Actual Production 68.25 21.00 3.90 6,869.18
Capacity Utilisation
(in Percentage)
100.00 92.31 84.78 65.35
Average Production Capacity 67.20 22.40 4.60 10,512.00
Production 61.23 19.26 3.62 6,356.70
Capacity Utilisation
(in Percentage)
91.12 85.98 78.70 60.47
Source: Cost Statement of respective units
Report No. 6 of 2019
4
1.4 Performance of the Company in the domestic Aluminium Sector3
The principal producers of Aluminium in India are National Aluminium Company
Limited (the Company), Hindalco Industries Limited (Hindalco) and Vedanta Limited
(Vedanta). While the Company is a Central Public Sector Enterprise, both Hindalco and
Vedanta are functioning as private sector entities. The comparative performance of the
Company in the production of Alumina and Aluminium with the above two domestic
peers is discussed below:
1.4.1 Production Performance:
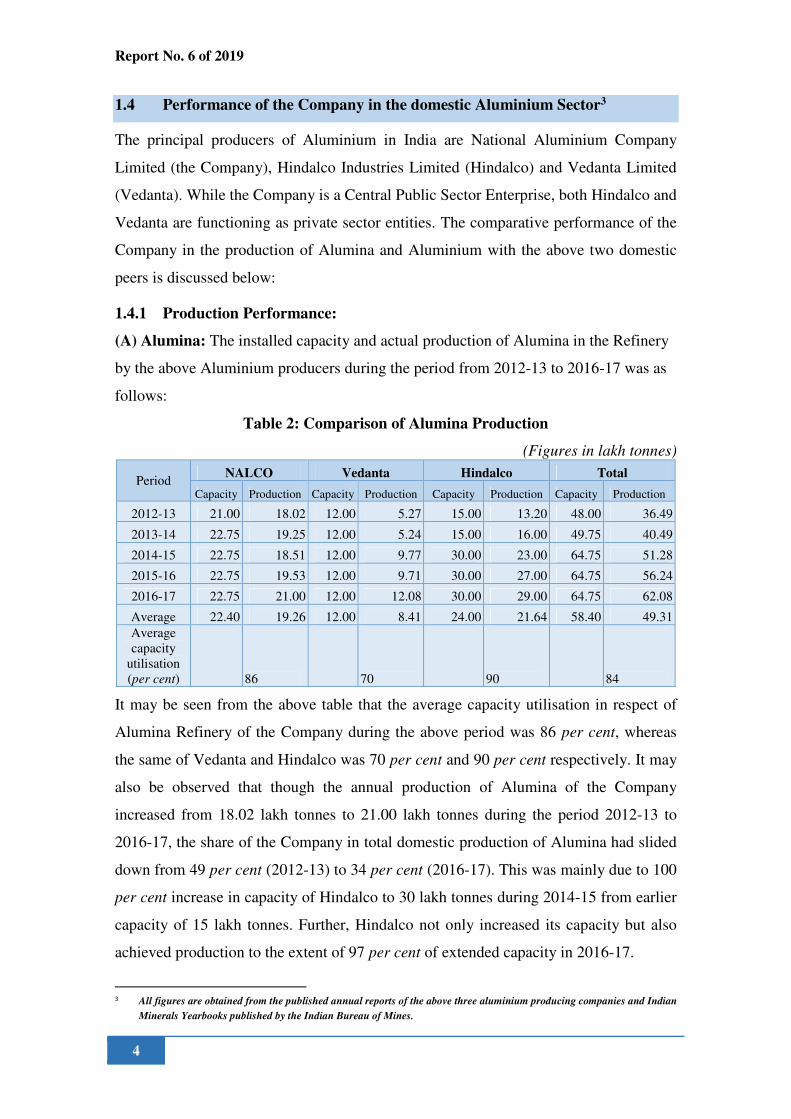
(A) Alumina: The installed capacity and actual production of Alumina in the Refinery
by the above Aluminium producers during the period from 2012-13 to 2016-17 was as
follows:
Table 2: Comparison of Alumina Production
(Figures in lakh tonnes)
Period NALCO Vedanta Hindalco Total
Capacity Production Capacity Production Capacity Production Capacity Production
2012-13 21.00 18.02 12.00 5.27 15.00 13.20 48.00 36.49
2013-14 22.75 19.25 12.00 5.24 15.00 16.00 49.75 40.49
2014-15 22.75 18.51 12.00 9.77 30.00 23.00 64.75 51.28
2015-16 22.75 19.53 12.00 9.71 30.00 27.00 64.75 56.24
2016-17 22.75 21.00 12.00 12.08 30.00 29.00 64.75 62.08
Average 22.40 19.26 12.00 8.41 24.00 21.64 58.40 49.31
Average
capacity
utilisation
(per cent) 86 70 90 84
It may be seen from the above table that the average capacity utilisation in respect of
also be observed that though the annual production of Alumina of the Company
increased from 18.02 lakh tonnes to 21.00 lakh tonnes during the period 2012-13 to
2016-17, the share of the Company in total domestic production of Alumina had slided
down from 49 per cent (2012-13) to 34 per cent (2016-17). This was mainly due to 100
per cent increase in capacity of Hindalco to 30 lakh tonnes during 2014-15 from earlier
capacity of 15 lakh tonnes. Further, Hindalco not only increased its capacity but also
achieved production to the extent of 97 per cent of extended capacity in 2016-17.
3 All figures are obtained from the published annual reports of the above three aluminium producing companies and Indian
Minerals Yearbooks published by the Indian Bureau of Mines.
Alumina Refinery of the Company during the above period was 86 per cent, whereas
the same of Vedanta and Hindalco was 70 per cent and 90 per cent respectively. It may
Report No. 6 of 2019
5
The Management while accepting the above stated (March 2019) that:
• Due to severe cyclonic HUDHUD during October 2014, production had been
affected with consequential lesser than production level of previous financial
year.
• Using Bauxite with higher Silica content in compliance with revised
guidelines of IBM had lowered output i.e. Alumina even with handling same
volume of Bauxite as input.
• The three aluminium producers were operating at different geographical
locations having independent Bauxite mines with varied alumina and silica
content. Hence, comparative analysis in such situation would not reflect a
logical relation between different miners.
• Average capacity utilisation of NALCO during said five years was higher
than that of the National average.
The Ministry endorsed (March 2019) the above views of the Management.
The above reply of the Management may be viewed in the light of the following:
• The impact of HUDHUD cyclone (October 2014) as stated by the
Management was negligible with reference to the performance of the
Company for five years ending 2016-17.
• The revised IBM guideline of using Bauxite having higher Silica content was
applicable to the industry as a whole.
• Bauxite deposit being heterogeneous in nature, its quality varied from face to
face in the same mines.
• The average capacity utilisation of the Company was lower than that of
Hindalco during the five years ending 2016-17.
Report No. 6 of 2019
6
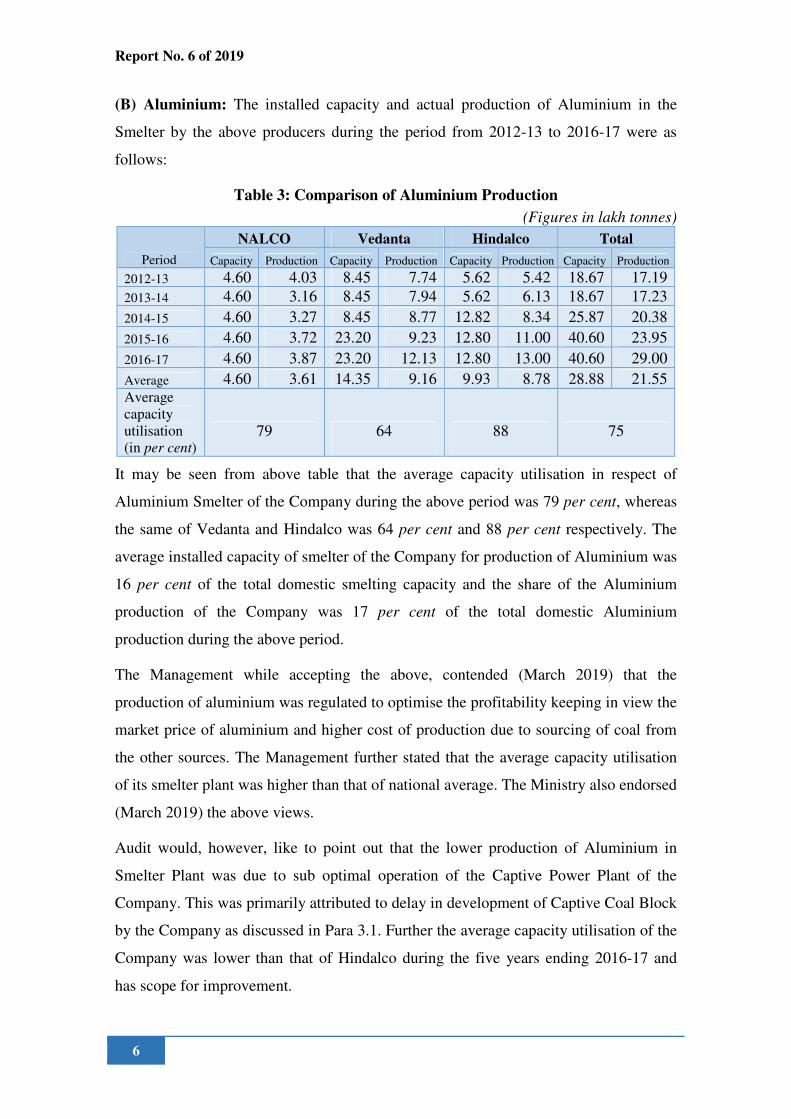
(B) Aluminium: The installed capacity and actual production of Aluminium in the
Smelter by the above producers during the period from 2012-13 to 2016-17 were as
follows:
Table 3: Comparison of Aluminium Production
(Figures in lakh tonnes)
Period
NALCO Vedanta Hindalco Total
Capacity Production Capacity Production Capacity Production Capacity Production
2012-13 4.60 4.03 8.45 7.74 5.62 5.42 18.67 17.19
2013-14 4.60 3.16 8.45 7.94 5.62 6.13 18.67 17.23
2014-15 4.60 3.27 8.45 8.77 12.82 8.34 25.87 20.38
2015-16 4.60 3.72 23.20 9.23 12.80 11.00 40.60 23.95
2016-17 4.60 3.87 23.20 12.13 12.80 13.00 40.60 29.00
Average 4.60 3.61 14.35 9.16 9.93 8.78 28.88 21.55 Average
capacity
utilisation
(in per cent) 79 64 88 75
It may be seen from above table that the average capacity utilisation in respect of
Aluminium Smelter of the Company during the above period was 79 per cent, whereas
the same of Vedanta and Hindalco was 64 per cent and 88 per cent respectively. The
average installed capacity of smelter of the Company for production of Aluminium was
16 per cent of the total domestic smelting capacity and the share of the Aluminium
production of the Company was 17 per cent of the total domestic Aluminium
production during the above period.
The Management while accepting the above, contended (March 2019) that the
production of aluminium was regulated to optimise the profitability keeping in view the
market price of aluminium and higher cost of production due to sourcing of coal from
the other sources. The Management further stated that the average capacity utilisation
of its smelter plant was higher than that of national average. The Ministry also endorsed
(March 2019) the above views.
Audit would, however, like to point out that the lower production of Aluminium in
Smelter Plant was due to sub optimal operation of the Captive Power Plant of the
Company. This was primarily attributed to delay in development of Captive Coal Block
by the Company as discussed in Para 3.1. Further the average capacity utilisation of the
Company was lower than that of Hindalco during the five years ending 2016-17 and
has scope for improvement.
Report No. 6 of 2019
7
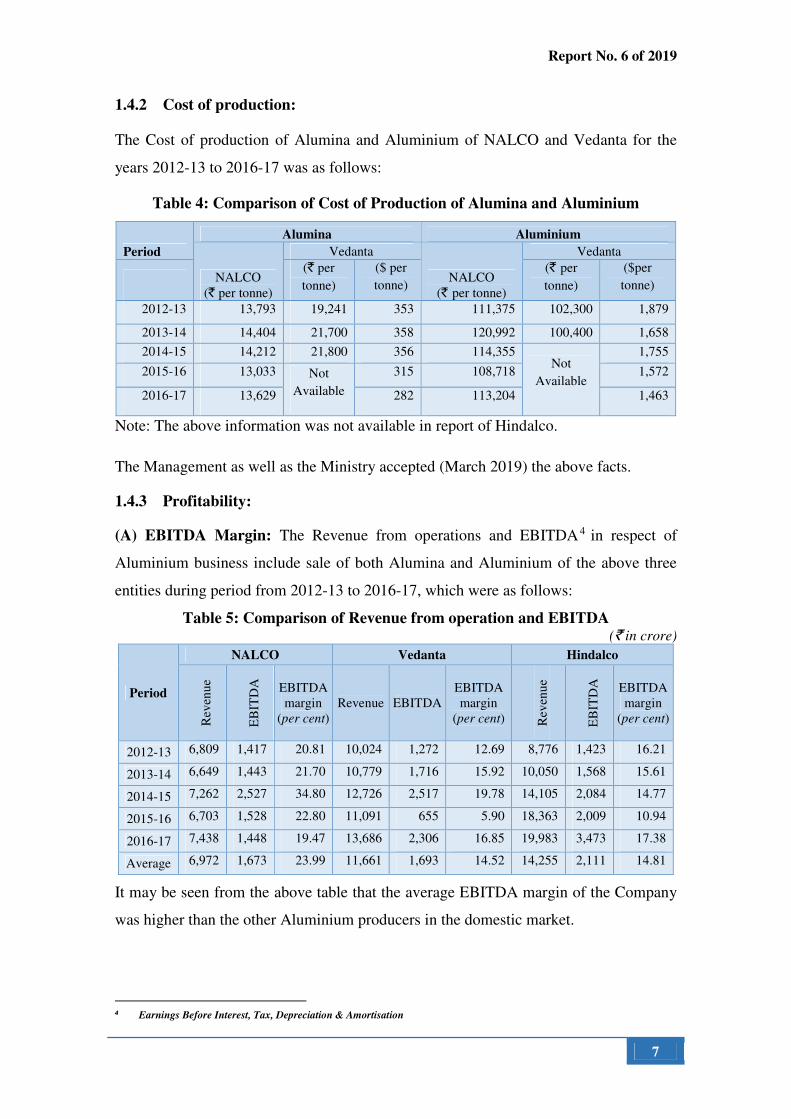
1.4.2 Cost of production:
The Cost of production of Alumina and Aluminium of NALCO and Vedanta for the
years 2012-13 to 2016-17 was as follows:
Table 4: Comparison of Cost of Production of Alumina and Aluminium
Period
Alumina Aluminium
NALCO
(` per tonne)
Vedanta
NALCO
(` per tonne)
Vedanta
(` per
tonne)
($ per
tonne)
(` per
tonne)
($per
tonne)
2012-13 13,793 19,241 353 111,375 102,300 1,879
2013-14 14,404 21,700 358 120,992 100,400 1,658
2014-15 14,212 21,800 356 114,355 Not
Available
1,755
2015-16 13,033 Not
Available
315 108,718 1,572
2016-17 13,629 282 113,204 1,463
Note: The above information was not available in report of Hindalco.
The Management as well as the Ministry accepted (March 2019) the above facts.
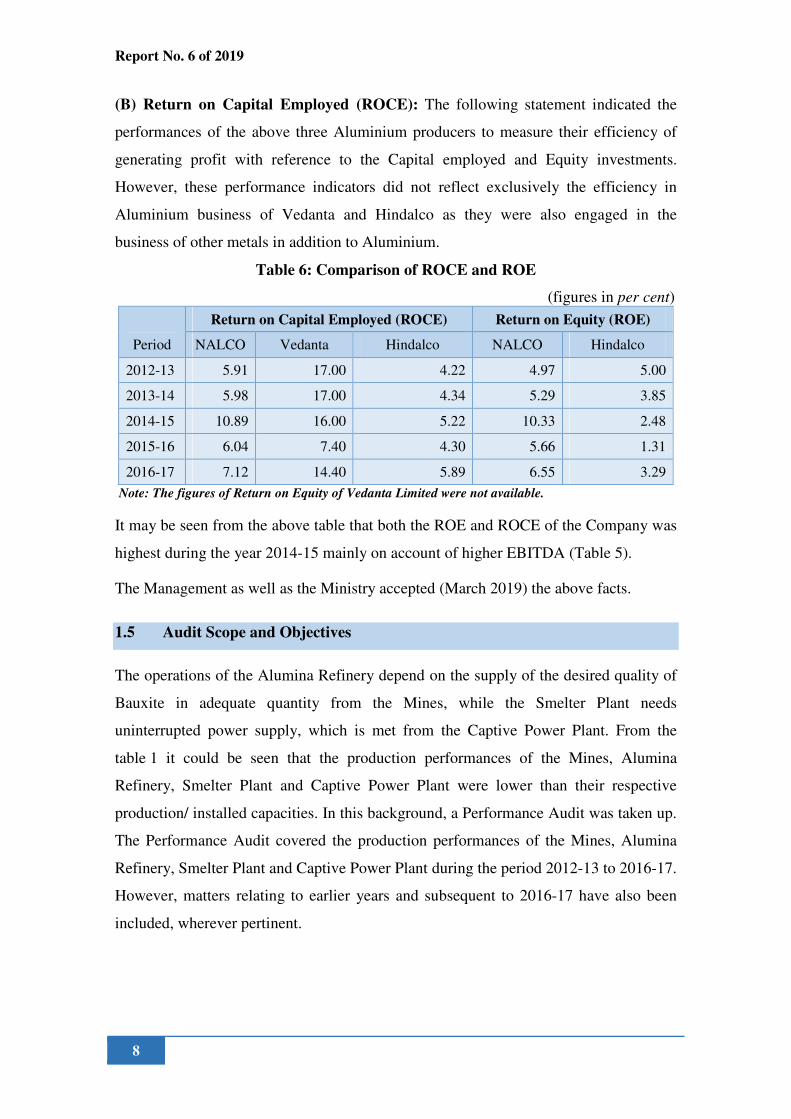
1.4.3 Profitability:
(A) EBITDA Margin: The Revenue from operations and EBITDA4 in respect of
Aluminium business include sale of both Alumina and Aluminium of the above three
entities during period from 2012-13 to 2016-17, which were as follows:
Table 5: Comparison of Revenue from operation and EBITDA (` in crore)
Period
NALCO Vedanta Hindalco
Rev
enu
e
EB
ITD
A
EBITDA
margin
(per cent)
Revenue EBITDA
EBITDA
margin
(per cent) Rev
enu
e
EB
ITD
A
EBITDA
margin
(per cent)
2012-13 6,809 1,417 20.81 10,024 1,272 12.69 8,776 1,423 16.21
2013-14 6,649 1,443 21.70 10,779 1,716 15.92 10,050 1,568 15.61
2014-15 7,262 2,527 34.80 12,726 2,517 19.78 14,105 2,084 14.77
2015-16 6,703 1,528 22.80 11,091 655 5.90 18,363 2,009 10.94
2016-17 7,438 1,448 19.47 13,686 2,306 16.85 19,983 3,473 17.38
Average 6,972 1,673 23.99 11,661 1,693 14.52 14,255 2,111 14.81
It may be seen from the above table that the average EBITDA margin of the Company
was higher than the other Aluminium producers in the domestic market.
4 Earnings Before Interest, Tax, Depreciation & Amortisation
Report No. 6 of 2019
8
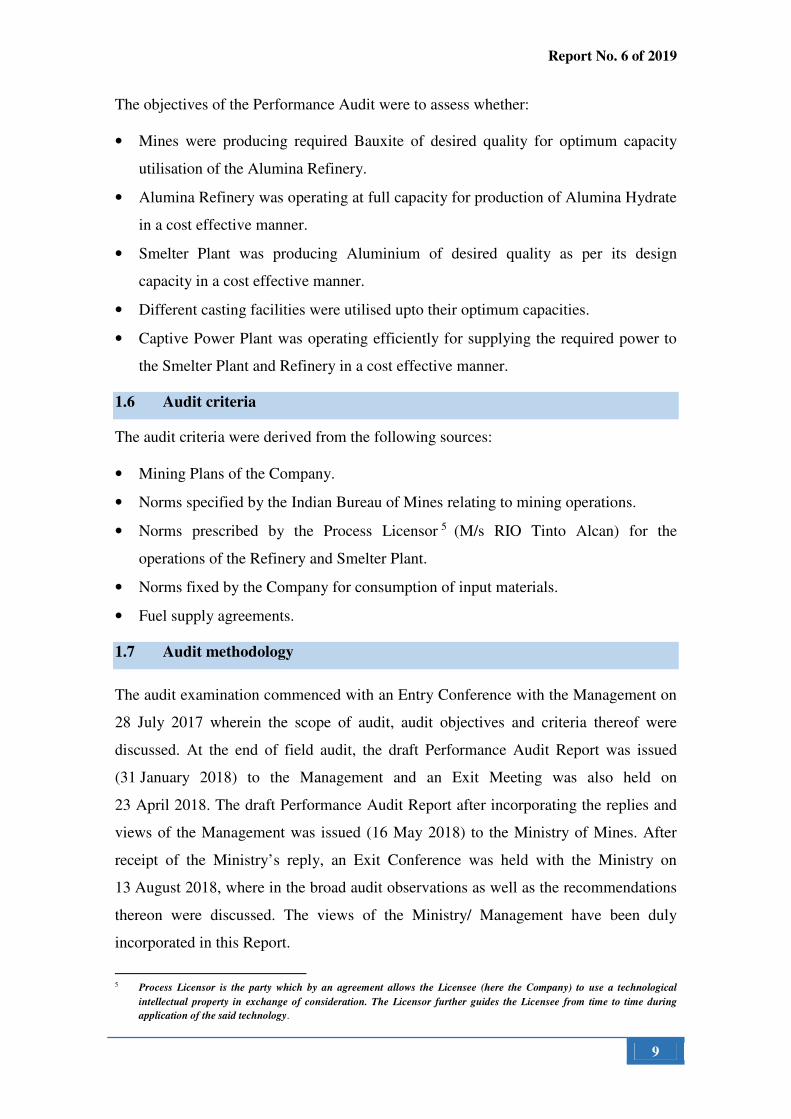
(B) Return on Capital Employed (ROCE): The following statement indicated the
performances of the above three Aluminium producers to measure their efficiency of
generating profit with reference to the Capital employed and Equity investments.
However, these performance indicators did not reflect exclusively the efficiency in
Aluminium business of Vedanta and Hindalco as they were also engaged in the
business of other metals in addition to Aluminium.
Table 6: Comparison of ROCE and ROE
(figures in per cent)
Period
Return on Capital Employed (ROCE) Return on Equity (ROE)
NALCO Vedanta Hindalco NALCO Hindalco
2012-13 5.91 17.00 4.22 4.97 5.00
2013-14 5.98 17.00 4.34 5.29 3.85
2014-15 10.89 16.00 5.22 10.33 2.48
2015-16 6.04 7.40 4.30 5.66 1.31
2016-17 7.12 14.40 5.89 6.55 3.29
Note: The figures of Return on Equity of Vedanta Limited were not available.
It may be seen from the above table that both the ROE and ROCE of the Company was
highest during the year 2014-15 mainly on account of higher EBITDA (Table 5).
The Management as well as the Ministry accepted (March 2019) the above facts.
1.5 Audit Scope and Objectives
The operations of the Alumina Refinery depend on the supply of the desired quality of
Bauxite in adequate quantity from the Mines, while the Smelter Plant needs
uninterrupted power supply, which is met from the Captive Power Plant. From the
table 1 it could be seen that the production performances of the Mines, Alumina
Refinery, Smelter Plant and Captive Power Plant were lower than their respective
production/ installed capacities. In this background, a Performance Audit was taken up.
The Performance Audit covered the production performances of the Mines, Alumina
Refinery, Smelter Plant and Captive Power Plant during the period 2012-13 to 2016-17.
However, matters relating to earlier years and subsequent to 2016-17 have also been
included, wherever pertinent.
Report No. 6 of 2019
9
The objectives of the Performance Audit were to assess whether:
• Mines were producing required Bauxite of desired quality for optimum capacity
utilisation of the Alumina Refinery.
• Alumina Refinery was operating at full capacity for production of Alumina Hydrate
in a cost effective manner.
• Smelter Plant was producing Aluminium of desired quality as per its design
capacity in a cost effective manner.
• Different casting facilities were utilised upto their optimum capacities.
• Captive Power Plant was operating efficiently for supplying the required power to
the Smelter Plant and Refinery in a cost effective manner.
1.6 Audit criteria
The audit criteria were derived from the following sources:
• Mining Plans of the Company.
• Norms specified by the Indian Bureau of Mines relating to mining operations.
• Norms prescribed by the Process Licensor 5 (M/s RIO Tinto Alcan) for the
operations of the Refinery and Smelter Plant.
• Norms fixed by the Company for consumption of input materials.
• Fuel supply agreements.
1.7 Audit methodology
The audit examination commenced with an Entry Conference with the Management on
28 July 2017 wherein the scope of audit, audit objectives and criteria thereof were
discussed. At the end of field audit, the draft Performance Audit Report was issued
(31 January 2018) to the Management and an Exit Meeting was also held on
23 April 2018. The draft Performance Audit Report after incorporating the replies and
views of the Management was issued (16 May 2018) to the Ministry of Mines. After
receipt of the Ministry’s reply, an Exit Conference was held with the Ministry on
13 August 2018, where in the broad audit observations as well as the recommendations
thereon were discussed. The views of the Ministry/ Management have been duly
incorporated in this Report.
5 Process Licensor is the party which by an agreement allows the Licensee (here the Company) to use a technological
intellectual property in exchange of consideration. The Licensor further guides the Licensee from time to time during
application of the said technology.
Report No. 6 of 2019
10
1.8 Structure of the Report
This Report contains Chapters covering the performance of the Refinery and Mines,
Smelter and Captive Power Plants, Environmental Issues, Conclusion and
Recommendations. The Report also contains seven Annexures and a List of
Abbreviations.
1.9 Audit Acknowledgement
Audit acknowledges the cooperation extended by the Management and the Ministry for
timely completion of the above audit.

Report No. 6 of 2019
11
Chapter 2: REFINERY AND MINES
The Alumina Refinery (Refinery) was commissioned (February 1987) with a
production capacity of 8 lakh tonnes
per annum (TPA) of Alumina
Hydrate and the same was gradually
increased to 22.75 lakh TPA. The
Bauxite Mines (Mines) at
Panchpatmali, Damanjodi was
commissioned (November 1985)
with a production capacity of 24 lakh
TPA. The capacity of the Mines was
gradually increased to 68.25 lakh TPA in line with the enhanced capacity of the
Refinery. The governing factor for mining of Bauxite ore was the content of
Aluminium and Silica therein. The quality of Bauxite is directly related to the content
of Aluminium and inversely related to the Silica content. As per the Mining Plan of the
Company submitted to the Indian Bureau of Mining (IBM) the mineable Bauxite
deposit as on 31 March 2014 in Panchpatmali has an average Aluminium content of
42.65 per cent and Silica content of 3.82 per cent.
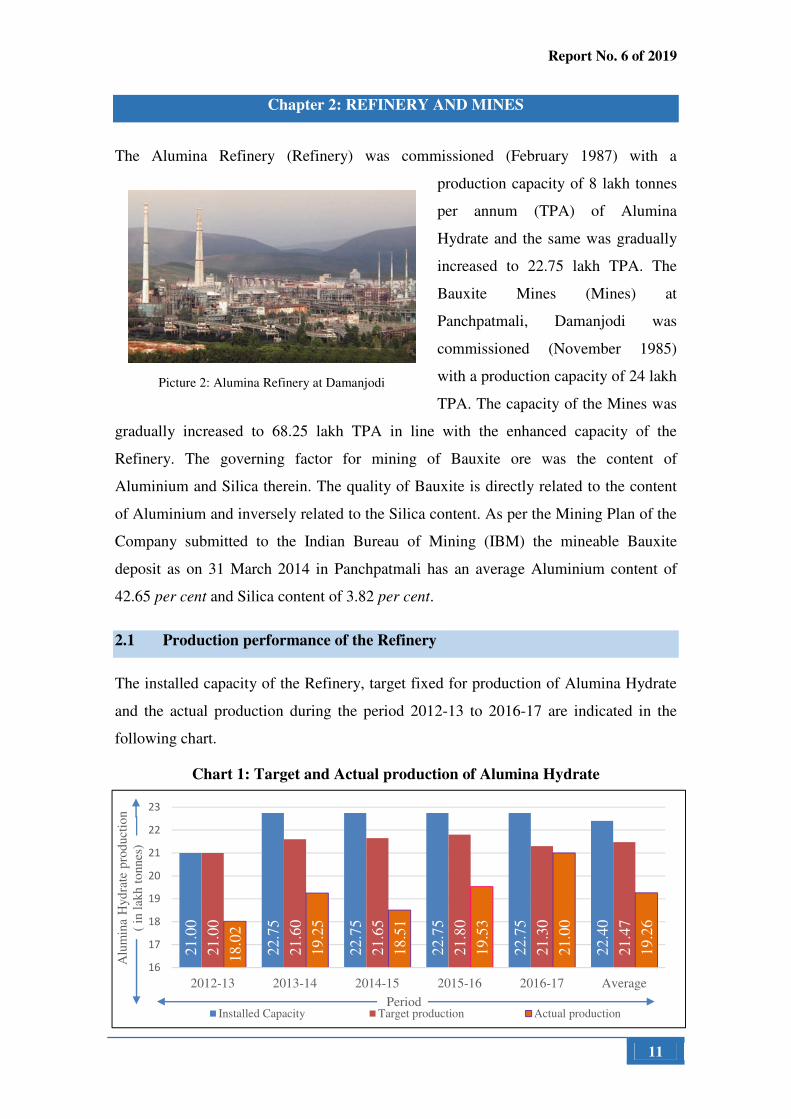
2.1 Production performance of the Refinery
The installed capacity of the Refinery, target fixed for production of Alumina Hydrate
and the actual production during the period 2012-13 to 2016-17 are indicated in the
following chart.
Chart 1: Target and Actual production of Alumina Hydrate
21.0
0
22.7
5
22.7
5
22.7
5
22.7
5
22.4
0
21.0
0
21.6
0
21.6
5
21.8
0
21.3
0
21.4
7
18.0
2
19.2
5
18.5
1
19.5
3
21.0
0
19.2
6
16
17
18
19
20
21
22
23
2012-13 2013-14 2014-15 2015-16 2016-17 Average
Alu
min
a H
yd
rate
pro
duct
ion
( in
lak
h t
onnes
)
PeriodInstalled Capacity Target production Actual production
Picture 2: Alumina Refinery at Damanjodi

Report No. 6 of 2019
12
It may be seen that during the period 2013-14 to 2016-17 the Company fixed the annual
production target of Alumina Hydrate lower than the installed capacity. This was
considering the rising trend of silica content in the Bauxite received from the Mines.
Even then the targeted production for the respective years could not be achieved. The
actual production of Alumina Hydrate during the period 2012-13 to 2016-17 was 96.31
lakh tonnes against the target of 107.35 lakh tonnes, resulting in shortfall of 11.04 lakh
tonnes.
Audit further observed that the shortfall in production of Alumina Hydrate in the
Refinery was primarily due to under-performance of Mining and allied activities. The
delay in carrying out processability study and upgradation of mud handling equipment
in the Refinery for processing of higher silica content in Bauxite also contributed to
lower production of Alumina Hydrate. These findings are enumerated below:
2.1.1 Under-performance of Mining and Allied activities
The Company, in its Annual Mine Production Plan, brings out the quantity of Bauxite
to be excavated along with the total silica content therein, and mining is conducted
accordingly. It may be seen from the chart below that actual production of Bauxite
from the Mines during the period 2012-13 to 2016-17 was lower than the targets fixed,
both in terms of quantity and quality (in terms of silica content).
Chart 2: Target and actual production of Bauxite
63
.00
68
.25
68
.25
68
.25
68
.25
63
.00
64
.80
68
.25
68
.25
68
.25
54
.19
62
.93
57
.39
63
.40
68
.25
2.59%
3.23%
3.15%
3.03%
3.54%
2.98%
3.46% 3.39%3.53% 3.56%
2.20%
2.40%
2.60%
2.80%
3.00%
3.20%
3.40%
3.60%
50.00
52.00
54.00
56.00
58.00
60.00
62.00
64.00
66.00
68.00
70.00
2012-13 2013-14 2014-15 2015-16 2016-17
Sil
ica
conte
nt
in B
auxit
e
(in p
erce
nta
ge)
Pro
duct
ion/
Exca
vat
ion
(in l
akh t
onnes
)
Period
Production Capacity Target Production Actual Production Planned Silica Actual Silica
Report No. 6 of 2019
13
The reasons for non-achievement of the production target in terms of quantity and
slippage in the quality of Bauxite are brought out in the Paras No. 2.1.2 and 2.1.3
respectively.
2.1.2 Non-achievement of production target of Bauxite
The primary reasons for the lower production of Bauxite during the period 2012-13 to
2016-17 are discussed in the following paragraphs:
2.1.2.1 Inordinate delay in appointment of HEMM operators
The Mines of the Company were fully mechanised open cast Mines wherein mining
operations were carried out by deployment of various types of Heavy Earth Moving
Machineries (HEMM) brief description of which is given in Appendix.
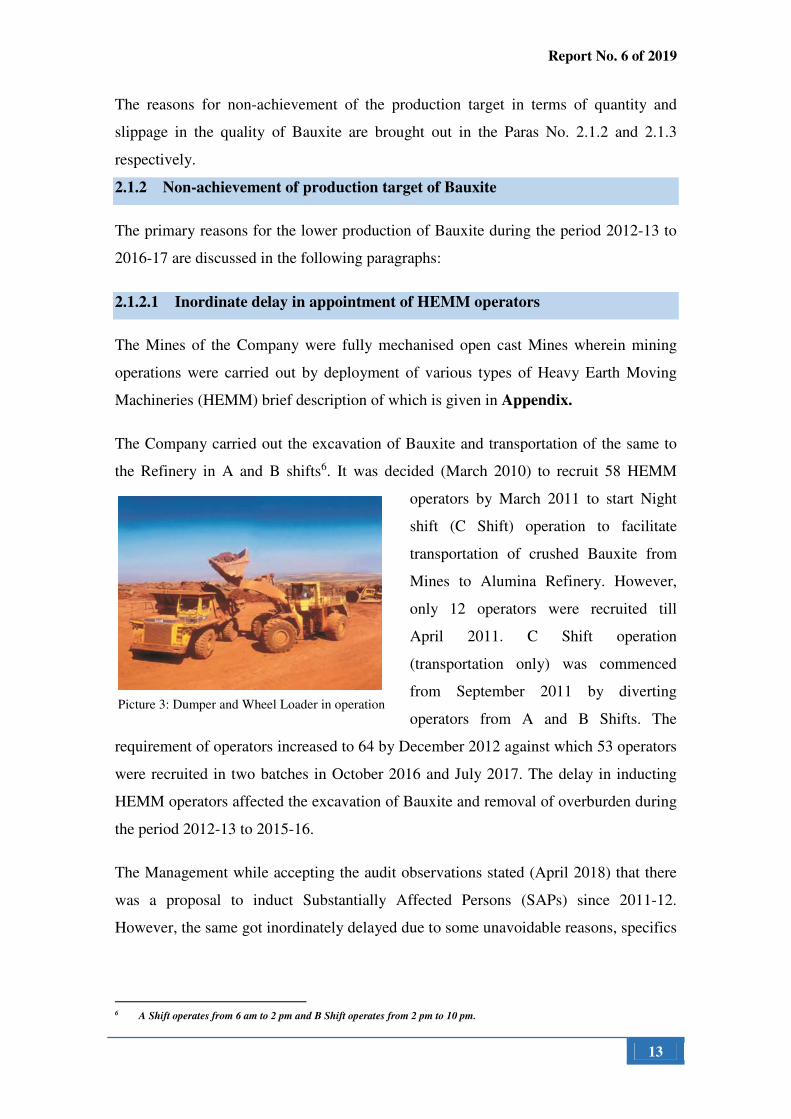
The Company carried out the excavation of Bauxite and transportation of the same to
the Refinery in A and B shifts6. It was decided (March 2010) to recruit 58 HEMM
operators by March 2011 to start Night
shift (C Shift) operation to facilitate
transportation of crushed Bauxite from
Mines to Alumina Refinery. However,
only 12 operators were recruited till
April 2011. C Shift operation
(transportation only) was commenced
from September 2011 by diverting
operators from A and B Shifts. The
requirement of operators increased to 64 by December 2012 against which 53 operators
were recruited in two batches in October 2016 and July 2017. The delay in inducting
HEMM operators affected the excavation of Bauxite and removal of overburden during
the period 2012-13 to 2015-16.
The Management while accepting the audit observations stated (April 2018) that there
was a proposal to induct Substantially Affected Persons (SAPs) since 2011-12.
However, the same got inordinately delayed due to some unavoidable reasons, specifics
6 A Shift operates from 6 am to 2 pm and B Shift operates from 2 pm to 10 pm.
Picture 3: Dumper and Wheel Loader in operation
Report No. 6 of 2019
14
of which were, however, not elaborated by the Management. The Ministry also
endorsed the reply of the Management.
2.1.2.2 Inadequate availability as well as under-utilisation of HEMM
The Company fixed the norms for availability of HEMM for each year in its ‘IMS
Objectives and Targets’7. Audit, however, observed that the Company did not consider
such norms while evaluating the actual availability of HEMM in its Monthly Progress
Report (MPR).
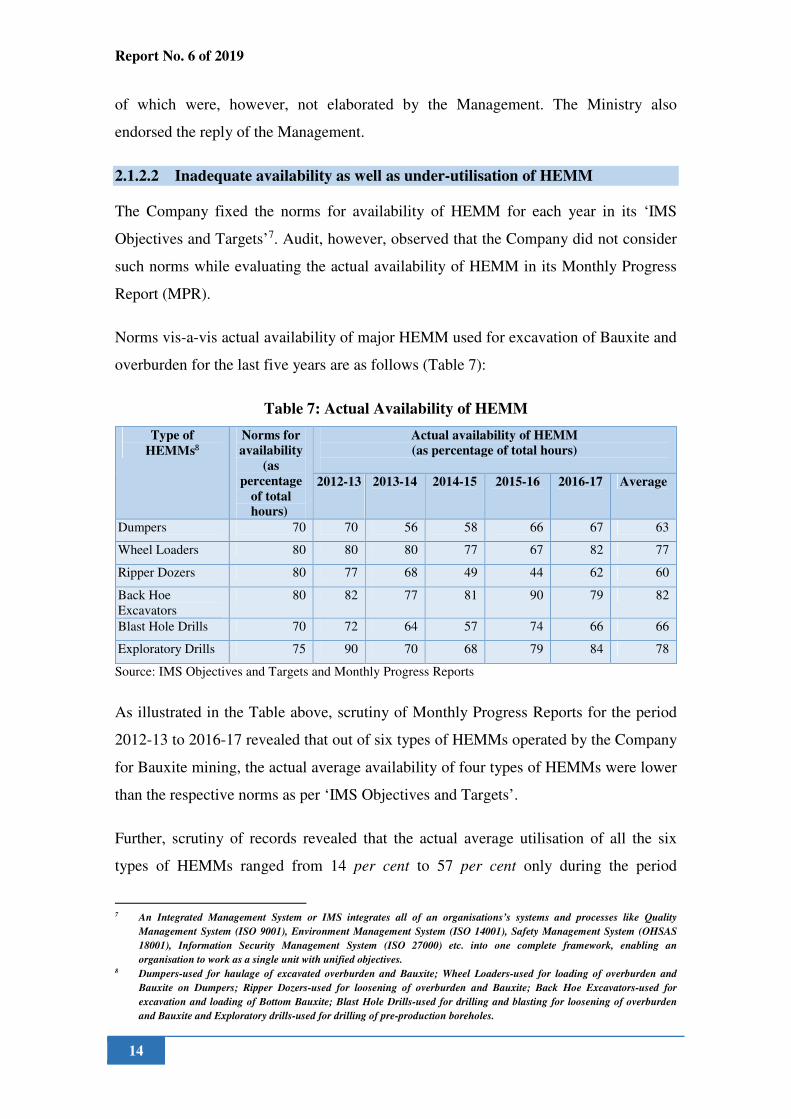
Norms vis-a-vis actual availability of major HEMM used for excavation of Bauxite and
overburden for the last five years are as follows (Table 7):
Table 7: Actual Availability of HEMM
Type of
HEMMs8
Norms for
availability
(as
percentage
of total
hours)
Actual availability of HEMM
(as percentage of total hours)
2012-13 2013-14 2014-15 2015-16 2016-17 Average
Dumpers 70 70 56 58 66 67 63
Wheel Loaders 80 80 80 77 67 82 77
Ripper Dozers 80 77 68 49 44 62 60
Back Hoe
Excavators
80 82 77 81 90 79 82
Blast Hole Drills 70 72 64 57 74 66 66
Exploratory Drills 75 90 70 68 79 84 78
Source: IMS Objectives and Targets and Monthly Progress Reports
As illustrated in the Table above, scrutiny of Monthly Progress Reports for the period
2012-13 to 2016-17 revealed that out of six types of HEMMs operated by the Company
for Bauxite mining, the actual average availability of four types of HEMMs were lower
than the respective norms as per ‘IMS Objectives and Targets’.
Further, scrutiny of records revealed that the actual average utilisation of all the six
types of HEMMs ranged from 14 per cent to 57 per cent only during the period
7 An Integrated Management System or IMS integrates all of an organisations’s systems and processes like Quality
Management System (ISO 9001), Environment Management System (ISO 14001), Safety Management System (OHSAS
18001), Information Security Management System (ISO 27000) etc. into one complete framework, enabling an
organisation to work as a single unit with unified objectives. 8 Dumpers-used for haulage of excavated overburden and Bauxite; Wheel Loaders-used for loading of overburden and
Bauxite on Dumpers; Ripper Dozers-used for loosening of overburden and Bauxite; Back Hoe Excavators-used for
excavation and loading of Bottom Bauxite; Blast Hole Drills-used for drilling and blasting for loosening of overburden
and Bauxite and Exploratory drills-used for drilling of pre-production boreholes.
Report No. 6 of 2019
15
2012-13 to 2016-17. Audit observed that lower availability of such HEMMs coupled
with under-utilisation of the same adversely affected the production of Bauxite from
Mines.
The Management while accepting non-considering of norms for availability of HEMM
for evaluation in MPR stated the same was
being revised accordingly. The Management
while accepting under-availability and
under-utilisation of HEMM stated that
under-availability of HEMM had not
affected the quality or quantity of Bauxite
production. The Ministry also endorsed the
views of the Management.
The contention of the Management and the Ministry with regard to the under
availability of Dumpers not affecting the production of Bauxite needs to be seen in the
light of the position that under-availability of Dumpers was indicated as one of the
constraints for excavation of Bauxite in the MPRs of 15 months, out of 60 months
reviewed by Audit.
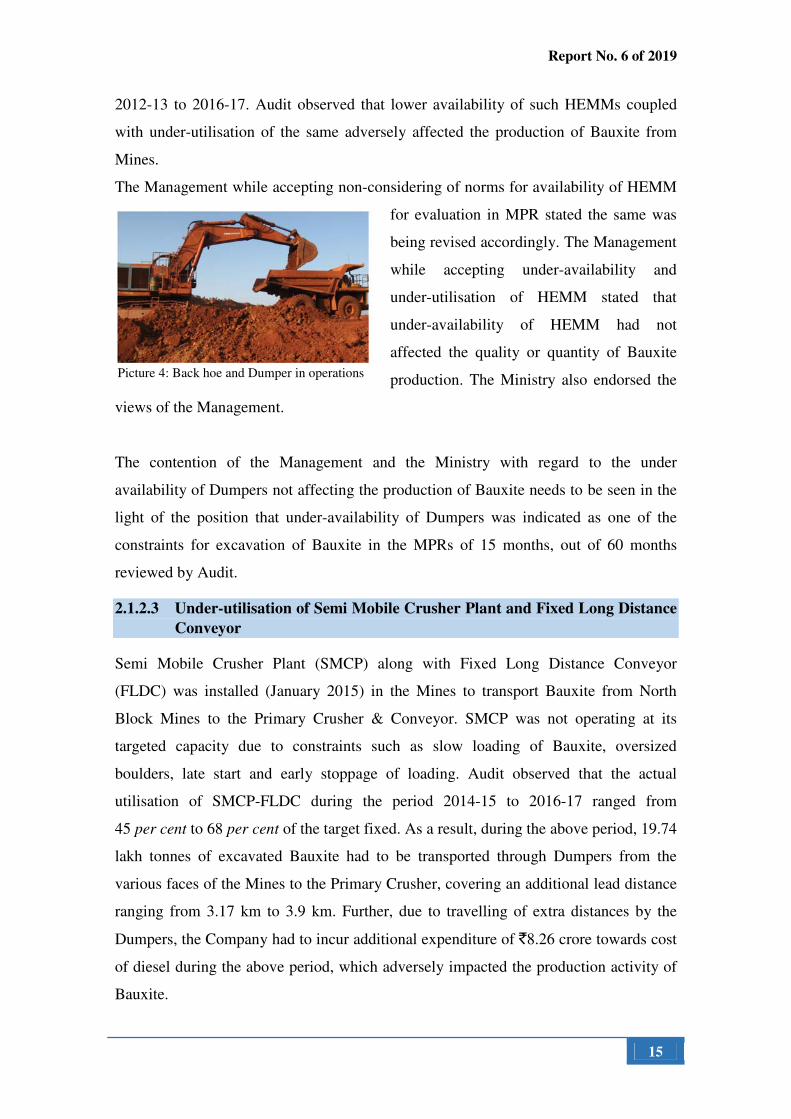
2.1.2.3 Under-utilisation of Semi Mobile Crusher Plant and Fixed Long Distance
Conveyor
Semi Mobile Crusher Plant (SMCP) along with Fixed Long Distance Conveyor
(FLDC) was installed (January 2015) in the Mines to transport Bauxite from North
Block Mines to the Primary Crusher & Conveyor. SMCP was not operating at its
targeted capacity due to constraints such as slow loading of Bauxite, oversized
boulders, late start and early stoppage of loading. Audit observed that the actual
utilisation of SMCP-FLDC during the period 2014-15 to 2016-17 ranged from
45 per cent to 68 per cent of the target fixed. As a result, during the above period, 19.74
lakh tonnes of excavated Bauxite had to be transported through Dumpers from the
various faces of the Mines to the Primary Crusher, covering an additional lead distance
ranging from 3.17 km to 3.9 km. Further, due to travelling of extra distances by the
Dumpers, the Company had to incur additional expenditure of `8.26 crore towards cost
of diesel during the above period, which adversely impacted the production activity of
Bauxite.
Picture 4: Back hoe and Dumper in operations

Report No. 6 of 2019
16
The Management stated (April 2018) that it took two years to stabilize a plant which
was normal in any bulk material handling system. The Ministry also endorsed the
views of the Management.
The above reply of the Management may be viewed in light of the position that the
performance of SMCP-FLDC was evaluated by Audit with reference to the target fixed
by the Company itself. Further, the Management had fixed these target already lower
than the installed capacity considering constraints associated with operation of SMCP-
FLDC.
2.1.2.4 Delay in adopting the IBM guidelines regarding revision in cut-off grade
of Bauxite
The Company estimated Bauxite reserve considering cut-off grade of total Silica9
content at four per cent (maximum). In the meantime, Indian Bureau of Mines (IBM)
notified (October 2009) revised threshold value10 of Bauxite wherein cut-off grade of
reactive Silica was fixed at five per cent (maximum) for mining, beyond which the
Bauxite obtained after mining could be discarded as waste. In pursuance of the above
IBM guidelines the Company determined the cut-off limit of total Silica at seven per
cent for mining considering past performance. The Company, however, initiated the
proposal to change the cut-off grade of total Silica at seven per cent (maximum) in May
2011 and switched over to mining as per the aforesaid cut-off grade only from October
2015, i.e. after a delay of about six years from the IBM notification.
Audit, therefore, observed that due to delay in switching over to mining as per the
revised threshold limit, the Company treated the Bauxite having total Silica content
between four per cent and seven per cent as non-ore grade and backfilled the mined-
out areas with the same, leading to wastage of natural resources during the intervening
period between October 2009 and October 2015. Audit also observed that
implementation of the revised guidelines required only a change of value for cut-off
grade from four per cent to seven per cent in the existing ‘SURPAC’ mining software
for which the data was already available with the Company.
9 The Silica in Bauxite is of two types-Reactive Silica and Non-Reactive Silica. Non-Reactive Silica is that which does not
participate in the chemical process during processing of Bauxite and it only adds to the waste burden as red mud. Reactive
Silica is that which participates during the chemical process and forms a compound with Alumina, soda and silica. This
Compound also forms a part of red mud reject and causes loss of recovery of Caustic soda and Alumina. 10 ‘Threshold Value of Minerals’ is the limit prescribed by the IBM from time to time based on the beneficiability and/or
marketability of a mineral for a given region and a given time, below which a mineral obtained after mining can be
discarded as waste.

Report No. 6 of 2019
17
The Management stated (April 2018) that the IBM guidelines could not be
implemented immediately as studies were to be conducted to exactly establish adverse
impact on the Refinery as well as on the cost of production alongwith suggestions for
necessary modifications in the Refinery Plant, which took time up to the middle of
2015 and the Company finally implemented and switched over to mining as per the
IBM guidelines in October 2015. The Ministry also endorsed (July 2018) the above
views of the Management.
The reply of the Management/ Ministry was not acceptable because the implementation
of the revised IBM guidelines was not dependent on such studies as is evident from the
fact the implementation of revised guidelines was started from October 2015, i.e.
before the work for such study was entrusted to M/s RIO Tinto Alcan (February 2016).
2.1.2.5 Shortfall in production due to delay in filing application for renewal of
Forest Clearance
As per the guidelines prescribed by the Hon’ble Supreme Court of India, application for
renewal of Forest Clearance (FC) was to be made to the concerned State Government,
24 months prior to the expiry of the existing FC. It was also prescribed that in case FC
got delayed for any reason, the user agency may apply for grant of a Temporary Work
Permit (TWP). However, the said application can be made after the expiry of 13
months from the date of filing application for renewal of FC but not later than nine
months prior to the expiry of existing FC.
It was seen that the Company applied for renewal of FC of Central-North Block Mine
to the Government of Odisha in January 2011 which was 21 months and 18 days prior
to the expiry of the existing FC. However, the renewal of FC got delayed and the
Company had to apply (February 2012) for Temporary Work Permit (TWP) to run the
Mines. Due to delay in filing application for renewal of FC, the application for TWP
was also got delayed. As a result, the Company could not obtain TWP/FC within the
validity of the lease period. In absence of TWP, the Company had to suspend all the
mining activities from 17 November 2012, which commenced on 17 December 2012
only after receiving TWP.
Audit observed that due to delay in filing application for renewal of FC with
consequential delay in applying for TWP, the mining activities of the Company was
Report No. 6 of 2019
18
suspended for a month resulting in lower production of Bauxite in the Mines with
consequential loss of production of 1.06 lakh tonnes of Alumina Hydrate in the
Refinery.
The Management stated (April 2018) that the Company filed applications for FC and
TWP as per the timelines prescribed under Forest Conservation Act, Forest
(Conservation) Rules and Guidelines issued by the Ministry of Environment, Forest
and Climate Change (MoEF & CC) and not as per the guidelines prescribed by the
Apex Court, as no notification/guidelines was circulated by the Government in this
regard. Ministry also endorsed (July 2018) the views of the Management.
The reply of the Management/Ministry is not tenable because the Management was
aware of the directions of the Apex Court since 2009, as it was conveyed to them while
granting TWP for South Block of the Mines.
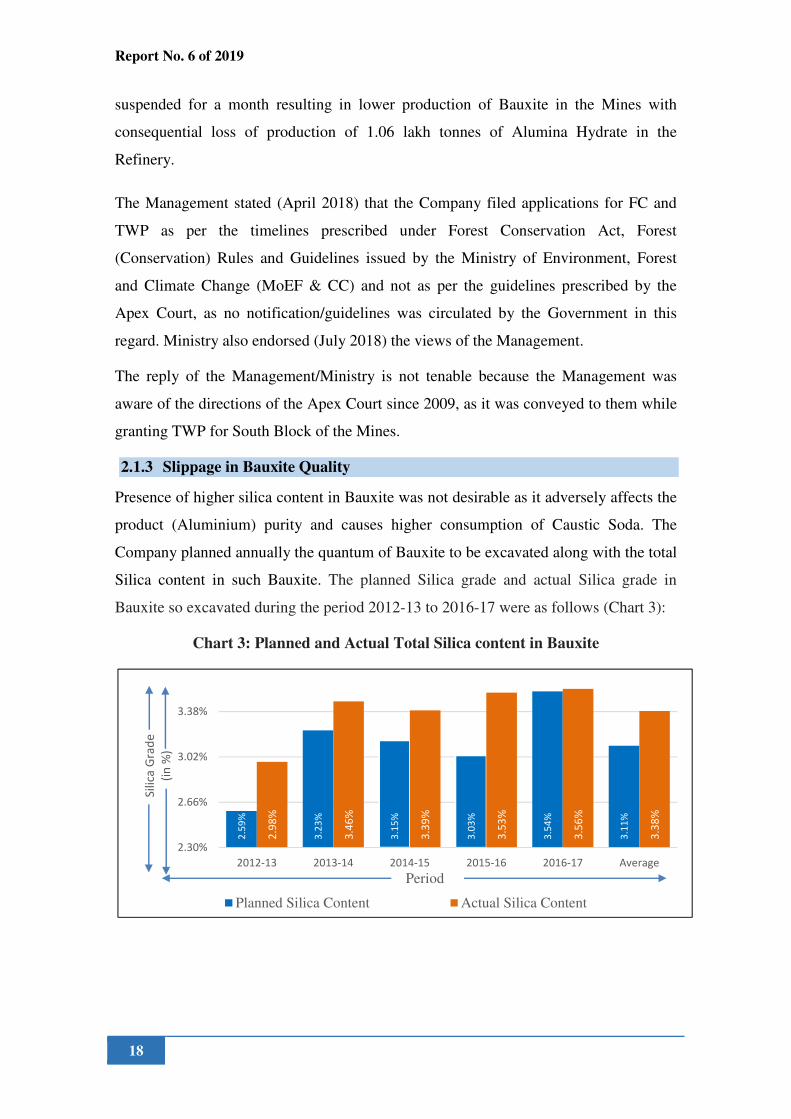
2.1.3 Slippage in Bauxite Quality
Presence of higher silica content in Bauxite was not desirable as it adversely affects the
product (Aluminium) purity and causes higher consumption of Caustic Soda. The
Company planned annually the quantum of Bauxite to be excavated along with the total
Silica content in such Bauxite. The planned Silica grade and actual Silica grade in
Bauxite so excavated during the period 2012-13 to 2016-17 were as follows (Chart 3):
Chart 3: Planned and Actual Total Silica content in Bauxite
2.5
9%
3.2
3%
3.1
5%
3.0
3%
3.5
4%
3.1
1%
2.9
8%
3.4
6%
3.3
9%
3.5
3%
3.5
6%
3.3
8%
2.30%
2.66%
3.02%
3.38%
2012-13 2013-14 2014-15 2015-16 2016-17 Average
Sil
ica
Gra
de
(in
%)
Period
Planned Silica Content Actual Silica Content

Report No. 6 of 2019
19
It may be seen from the above that the actual silica content was higher than the planned
in all the above five years. The salient reasons for non-achievement of planned Silica
content are discussed in the succeeding paragraphs.
2.1.3.1 Non-compliance with Blending Scheme of Monthly Mine Production Plan
The Company prepared a ‘Blending Scheme’ in the Monthly Mine Production Plan
indicating the quantum of Bauxite with varied Silica content from multiple faces to be
mined, with the objective to produce Bauxite of desired Silica content. Audit observed
that the Company did not follow such Blending Scheme while mining, during all the
60 months (2012-13 to 2016-17) covered in audit.
During Exit Conference with the Ministry, the Management, however, stated
(August 2018) that corrective actions have been implemented.
2.1.3.2 Non-implementation of measures to improve Bauxite quality
The Company planned the following measures in its Mining Plan approved by the IBM
with the objective to minimise mixing of extraneous materials in Bauxite ore and to
ensure improvement in blending and grade control of Bauxite.
• Pre-production drilling at 25 metres interval with an average depth of 25 meters
each to assess the quantum of overburden to be removed prior to extraction of
Bauxite ore.
• Transportation and feeding of top Bauxite and bottom Bauxite in the crusher in
the ratio of 3:1.
Scrutiny of records revealed that the Company deviated from the IBM approved mining
plan as the Company drilled only 1,123 boreholes towards pre-production drilling
against the target of 1,280 boreholes during the period 2012-13 to 2016-17. Moreover,
the average depth of boreholes was about 22 meters against the required depth of
25 meters. The Company also neither planned nor adhered to transportation and feeding
of top Bauxite and bottom Bauxite proportionately in the crusher as required in the
IBM approved mining plan.
The Management contended (April 2018) that the progress of drilling drops drastically
in clay zone which restricted the yearly performance in drilling and the extent of
drilling would continue depending upon the extent of the ore body and not 25 meters.
Report No. 6 of 2019
20
The Ministry further added (July 2018) that the apprehensions of shortfall in achieving
pre-production drilling during the period 2012-17 would impact production quality and
quantity in future years were not correct. The Management further stated (April 2018)
that the ratio of 3:1 was a broad guideline and not a sacrosanct figure. The Ministry
also endorsed (July 2018) the same view.
The above contentions of the Management/Ministry may be viewed in light of the
position that as per Section 22A of the Mineral Conservation Rules, 1960 mining
operations should be undertaken in accordance with the duly approved Mining Plan.
Modifications of the same, if any, should also have been got approved by the IBM in
advance.
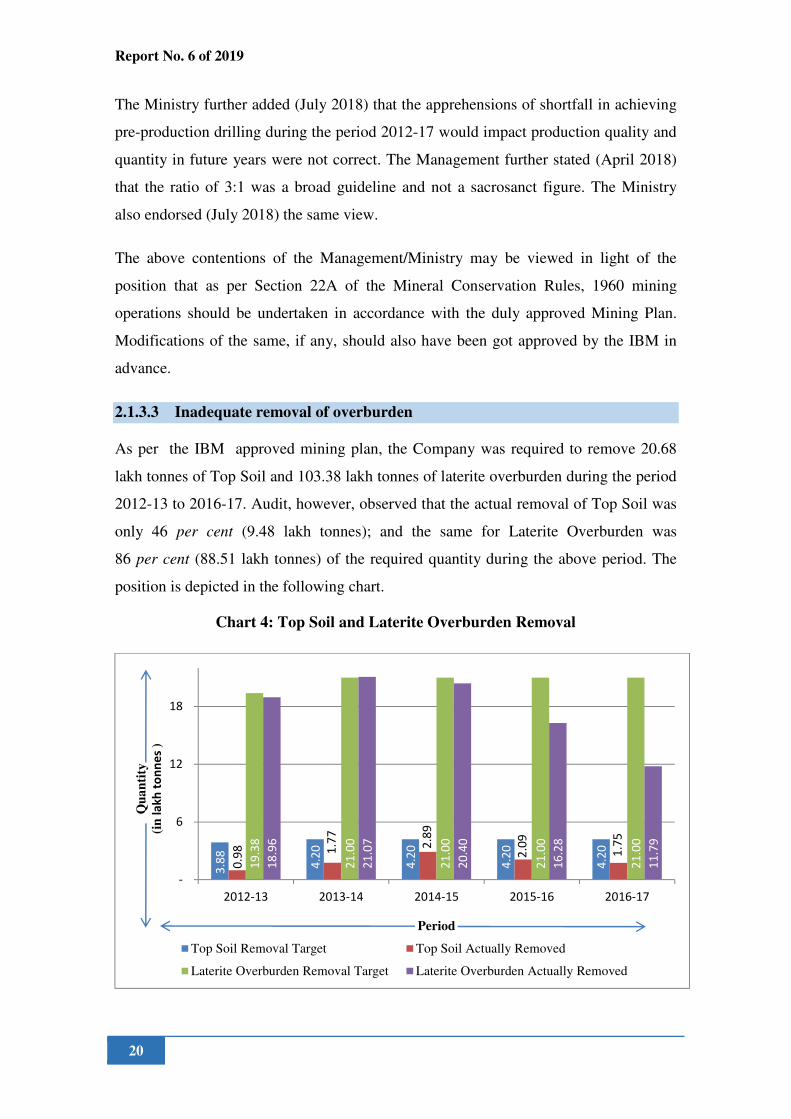
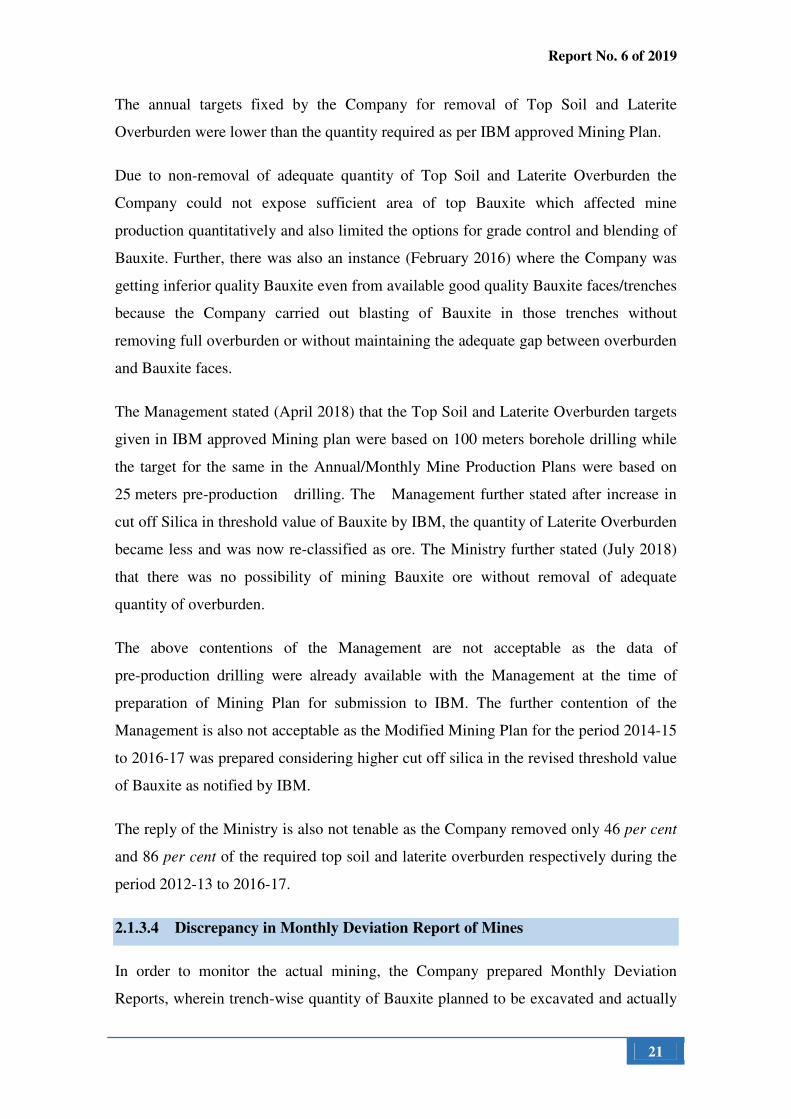
2.1.3.3 Inadequate removal of overburden
As per the IBM approved mining plan, the Company was required to remove 20.68
lakh tonnes of Top Soil and 103.38 lakh tonnes of laterite overburden during the period
2012-13 to 2016-17. Audit, however, observed that the actual removal of Top Soil was
only 46 per cent (9.48 lakh tonnes); and the same for Laterite Overburden was
86 per cent (88.51 lakh tonnes) of the required quantity during the above period. The
position is depicted in the following chart.
Chart 4: Top Soil and Laterite Overburden Removal
3.8
8
4.2
0
4.2
0
4.2
0
4.2
0
0.9
8
1.7
7
2.8
9
2.0
9
1.7
5
19
.38
21
.00
21
.00
21
.00
21
.00
18
.96
21
.07
20
.40
16
.28
11
.79
-
6
12
18
2012-13 2013-14 2014-15 2015-16 2016-17
Qu
an
tity
(in
la
kh
to
nn
es )
Period
Top Soil Removal Target Top Soil Actually Removed
Laterite Overburden Removal Target Laterite Overburden Actually Removed
Report No. 6 of 2019
21
The annual targets fixed by the Company for removal of Top Soil and Laterite
Overburden were lower than the quantity required as per IBM approved Mining Plan.
Due to non-removal of adequate quantity of Top Soil and Laterite Overburden the
Company could not expose sufficient area of top Bauxite which affected mine
production quantitatively and also limited the options for grade control and blending of
Bauxite. Further, there was also an instance (February 2016) where the Company was
getting inferior quality Bauxite even from available good quality Bauxite faces/trenches
because the Company carried out blasting of Bauxite in those trenches without
removing full overburden or without maintaining the adequate gap between overburden
and Bauxite faces.
The Management stated (April 2018) that the Top Soil and Laterite Overburden targets
given in IBM approved Mining plan were based on 100 meters borehole drilling while
the target for the same in the Annual/Monthly Mine Production Plans were based on
25 meters pre-production drilling. The Management further stated after increase in
cut off Silica in threshold value of Bauxite by IBM, the quantity of Laterite Overburden
became less and was now re-classified as ore. The Ministry further stated (July 2018)
that there was no possibility of mining Bauxite ore without removal of adequate
quantity of overburden.
The above contentions of the Management are not acceptable as the data of
pre-production drilling were already available with the Management at the time of
preparation of Mining Plan for submission to IBM. The further contention of the
Management is also not acceptable as the Modified Mining Plan for the period 2014-15
to 2016-17 was prepared considering higher cut off silica in the revised threshold value
of Bauxite as notified by IBM.
The reply of the Ministry is also not tenable as the Company removed only 46 per cent
and 86 per cent of the required top soil and laterite overburden respectively during the
period 2012-13 to 2016-17.
2.1.3.4 Discrepancy in Monthly Deviation Report of Mines
In order to monitor the actual mining, the Company prepared Monthly Deviation
Reports, wherein trench-wise quantity of Bauxite planned to be excavated and actually

Report No. 6 of 2019
22
excavated was compared. Scrutiny of Monthly Deviation Reports of 53 months as
available out of 60 months for the period 2012-13 to 2016-17 revealed the following
discrepancies:
• Out of 53 months, data of 47 months for excavation of bauxite as per Monthly
Deviation Report was not matching with the same as per Monthly Progress
Report.
• In its Monthly Mine Production Plans, the Company indicated the trench-wise
quantity and quality of Bauxite to be excavated. The Company, however, did
not mention the trench-wise quality of Bauxite actually excavated in its
Monthly Deviation Report. The Company was, therefore, was not in a position
to ascertain the trench-wise deviations in quality of Bauxite excavated.
Recording of trench-wise actual quality of Bauxite excavated would have also
facilitated the Company in preparing more realistic blending schemes of
Bauxite mining in the subsequent months for improvement of grade control.
The Management stated (April 2018) that:
• These differences were seen in the initial stages when the Deviation Report was
introduced and over the months these were resolved and addressed.
• The Company had a set practice of collecting samples from blast hole drills and
mine faces for quality control, but comparison of trench-wise quality of Bauxite
excavated against the planned was technically not correct.
The reply of the Management may be viewed in the light of the position that:
• available data of all 41 months (for the period from 2013-14 to 2016-17,
excluding the period of initial 12 months pertaining to 2012-13) did not match.
Hence, the discrepancies were not addressed by the Management.
• the practice of collection of samples from blast hole drill/mine faces for quality
control would be purposeful when the trench-wise sample so collected was
compared with the trench-wise planned Bauxite quality data.
The Ministry further stated (July 2018) that these differences were due to unintentional
wrong entry of the figures and informed that necessary care is being taken and figures
are being cross checked to avoid aforesaid differences

Report No. 6 of 2019
23
2.1.4 Inadequate blending of Bauxite at Refinery
The stockyard of Bauxite at Refinery consisted of five stockpiles with a maximum
capacity of 1.65 lakh tonnes each. The Bauxite with variant silica content received at
Refinery from the Mines was stacked in the stockyard in horizontal layers. In order to
minimise the variations in silica content in the Bauxite to be fed to the Refinery, the
stacked Bauxite was reclaimed vertically for proper blending. An ideal stock of about
65 per cent of the stockpile capacity (1.07 lakh tonnes) was required to be maintained
to facilitate the above process of blending.
Audit, however, observed that due to lower production of Bauxite in the Mines, the
required stock level of 65 per cent could not be maintained in the Refinery stockyard
during the period 2012-13 to 2016-17. The position of stock level at the Refinery end is
depicted below:
Chart 5: Year-wise inventory level of Bauxite at Refinery stockyard.
The actual average stock level ranged from 6 per cent (2014-15) to 43 per cent
(2016-17) only with the minimum monthly average stock level of only 41 tonnes
(April 2015) in all the five stockpiles as a whole. Thus, the Company was unable to
blend the Bauxite with variant silica content for feeding Bauxite to the Refinery with
even silica content. As a result, the consumption of Caustic Soda during the period
2012-13 to 2014-15 ranged from 87.36 kg per tonne to 102.82 kg per tonne against the
norms of 72 kg per tonne. The consumption of Caustic Soda during the year 2015-16
was 106.05 kg per tonne against the norms of 100 kg per tonne. This led to excess
consumption of 1.46 lakh tonnes of Caustic Soda in the Refinery during the
65%
65%
65%
65%
65%
35%
25%
14%
20%
61%
1% 5
%
0%
0%
7%1
4%
14%
6%
8%
43%
0%
10%
20%
30%
40%
50%
60%
70%
2012-13 2013-14 2014-15 2015-16 2016-17Inven
tory
lev
el o
f B
auxit
e
(in %
)
Period
Recommended level Actual Maximum level Actual Minimum level Monthly average
Report No. 6 of 2019
24
period 2012-13 to 2015-16 for which the Company had to incur additional expenditure
of `426.27 crore (Annexure I).
Moreover, such continuous feeding of Bauxite with variant silica content to the
Refinery also resulted in lower extraction of Alumina Hydrate from the Bauxite than
norms and the un-extracted portion of Bauxite was passed to the Red Mud pond. This
led to higher consumption of 12.76 lakh tonnes of Bauxite in the Refinery for
production of 96.31 lakh tonnes of Alumina Hydrate during the period 2012-13 to
2016-17. In this connection it is worth mentioning that the Process licensor had also
indicated (November 2015) that non-maintenance of required stock level at the
Refinery end resulted in almost zero blending. This caused continuously varying grade
of Bauxite being fed to the Refinery and could be one of the main reasons for higher
consumption of Bauxite and Caustic Soda.
The Management stated (April 2018) that blending of Bauxite at low stock situation
was not a problem and moreover, the primary blending takes place before primary
crushing at Mines itself. The Management further stated that the apprehension of high
consumption of Caustic Soda and Bauxite as a result of improper blending was totally
wrong and unfounded as there was no change in chemical composition of Bauxite
during blending. The Ministry also endorsed (July 2018) the above views of the
Management.
The reply of the Management/Ministry regarding blending of Bauxite in the Mines
itself was not tenable because there was very limited blending capacity in the Mines
and the Process Licensor (M/s RIO Tinto Alcan) had advised for achieving the
blending in the Refinery. The Management’s further reply on excess consumption of
Caustic Soda and Bauxite was also not acceptable as the Process Licensor had already
brought out that the main reason for higher consumption was non-maintenance of
required stock level at the Refinery end.
2.1.5 Excess consumption of fuel oil in Calciners
The Aluminium Hydrate produced from the Bauxite was further processed in the
Calciner Plant (Calciners) of the Refinery for production of Calcined Alumina11. It was
11 Calcined Alumina is produced by heating Alumina Hydrate wherein it losses moisture to form Alumina crystals.

Report No. 6 of 2019
25
seen that the Calciners were operated with lower load due to corresponding lower
production of Alumina Hydrate in the Refinery. This low load operation of Calciners
resulted in higher consumption of Fuel Oil than the norms. The actual consumption of
Fuel Oil ranged between 77.56 litres per tonne and 78.88 litres per tonne against the
norms of 77 litres per tonne. The excess consumption of Fuel Oil worked out to 11,719
kilo litres during the period 2012-13 to 2016-17, for which the Company incurred
additional expenditure of `34.73 crore12 (Annexure II).
The Management stated (April 2018) that reason for low capacity utilisation of
Calciners was because of increased demand for Alumina Hydrate before calcination as
well as unsteady off-take of Calcined Alumina leading to abrupt load restrictions and
stoppages of Calciners. The Ministry also endorsed the above views of the
Management.
The reply of the Management/ Ministry is not tenable as sale of Alumina Hydrate was
negligible as it was ranging between 0.63 per cent (2013-14) and 1.11 per cent
(2016-17) of the total production for the above period.
2.2 Delay in Technology Upgradation
In view of deteriorating Bauxite quality over the years, the Company felt (May 2011)
that existing mud handling equipment of the Refinery were inadequate to meet the
production requirement and thereby reducing the refining capacity. It was, therefore,
envisaged (May 2011) to suitably upgrade the existing mud handling equipment with
old ball mills and install High Rate Decanter and Deep Cone Washer (HRD&DCW). It
was also proposed to carry out a detailed study/ re-engineering in this regard with the
help of an engineering consultant to identify the upgradation required. The matter was
discussed (November 2014) with the Process Licensor for a processability study with a
view to assess the Refinery performance with the future Bauxite feed. The work order
for such study was accordingly awarded to the Process Licensor in February 2016 and
the study Report was submitted in December 2016. The Company in the meantime
estimated (December 2015) that the proposed installation of HRD&DCW in the three
out of four streams of the Refinery at an investment of `355 crore would accrue an
annual savings of `75.45 crore. It was, however, seen that the order for consultancy
12 On the basis of annual average purchase price of Fuel Oil per kilo litre.
Report No. 6 of 2019
26
services for installation of HRD&DCW was awarded in April 2017 with a completion
schedule of 50 months.
Audit observed that the Management was well aware since May 2011 that installation
of HRD&DCW was required in the three streams of the Refinery to overcome the
problems associated with the mud handling activities in view of deteriorating Bauxite
quality. However, the Company took 57 months 13 for placement of order for
processability study. Thus, there was inordinate delay in taking a final decision for
carrying out processability study for installation of HRD&DCW and this was not
justified considering the magnitude of financial savings that could have been accrued.
The Management stated (April 2018) that even without HRD&DCW, streams 1, 2 and
3 had exceeded the rated capacity in several years with the conventional settlers. It was
also stated that there has been no delay and actions were taken with best economic
interest and with minimum specific consumption of Caustic Soda and hence, the losses
indicated did not actually occur.
The reply of the Management is not tenable as the Company itself felt and proposed
(May 2011) for installation of HRD&DCW in the three streams of the Refinery which
would have led to accruing of financial savings. The Process licensor had also opined
(February 2014 and November 2014) for installation of HRD&DCW in the Refinery.
13 May 2011 to February 2016
Audit Summation
The production of Alumina Hydrate in the Refinery was lower than the targets
primarily due to corresponding lower production of Bauxite in the Mines. The
Silica content in the Bauxite was higher than planned, which had adverse impact
in the quality of Bauxite fed to the Refinery. The Company did not maintain
required stock level of Bauxite at Refinery due to lower production of Bauxite at
Mines. This led to inability of the Company to feed Bauxite with even Silica
content to the Refinery and resulted in excess consumption of Bauxite as well as
Caustic Soda. The Company also made inordinate delay in taking decision for
carrying out processability study and technological upgradation.

Report No. 6 of 2019
27
CHAPTER 3: SMELTER AND CAPTIVE POWER PLANTS
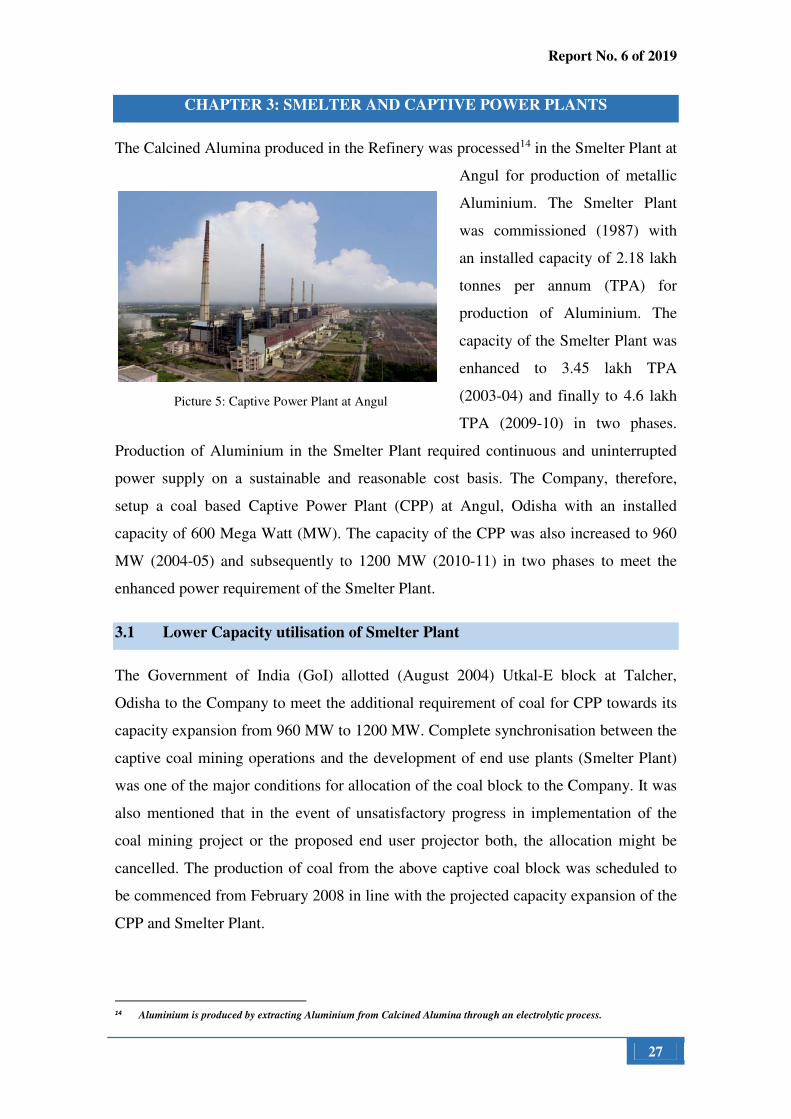
The Calcined Alumina produced in the Refinery was processed14 in the Smelter Plant at
Angul for production of metallic
Aluminium. The Smelter Plant
was commissioned (1987) with
an installed capacity of 2.18 lakh
tonnes per annum (TPA) for
production of Aluminium. The
capacity of the Smelter Plant was
enhanced to 3.45 lakh TPA
(2003-04) and finally to 4.6 lakh
TPA (2009-10) in two phases.
Production of Aluminium in the Smelter Plant required continuous and uninterrupted
power supply on a sustainable and reasonable cost basis. The Company, therefore,
setup a coal based Captive Power Plant (CPP) at Angul, Odisha with an installed
capacity of 600 Mega Watt (MW). The capacity of the CPP was also increased to 960
MW (2004-05) and subsequently to 1200 MW (2010-11) in two phases to meet the
enhanced power requirement of the Smelter Plant.
3.1 Lower Capacity utilisation of Smelter Plant
The Government of India (GoI) allotted (August 2004) Utkal-E block at Talcher,
Odisha to the Company to meet the additional requirement of coal for CPP towards its
capacity expansion from 960 MW to 1200 MW. Complete synchronisation between the
captive coal mining operations and the development of end use plants (Smelter Plant)
was one of the major conditions for allocation of the coal block to the Company. It was
also mentioned that in the event of unsatisfactory progress in implementation of the
coal mining project or the proposed end user projector both, the allocation might be
cancelled. The production of coal from the above captive coal block was scheduled to
be commenced from February 2008 in line with the projected capacity expansion of the
CPP and Smelter Plant.
14 Aluminium is produced by extracting Aluminium from Calcined Alumina through an electrolytic process.
Picture 5: Captive Power Plant at Angul
Report No. 6 of 2019
28
Audit observed that the development of the captive coal block got delayed due to
various reasons like delay in submission of modified mining lease map to the
concerned Authorities, delay in deputation of surveyor and non-appointment of Mining
Developer-cum-Operator. Due to such delays, the scheduled date of coal production
was revised from February 2008 to June 2012. However, the Company failed to adhere
to the revised target date of coal production and the above captive coal block was
ultimately de-allocated in September 2014. The same was again re-allotted by the GoI
along with another coal block (Utkal-D) to the Company in September 2015. It was,
however, seen that both the above captive coal blocks were yet to be developed for
production of coal therefrom (March 2018).
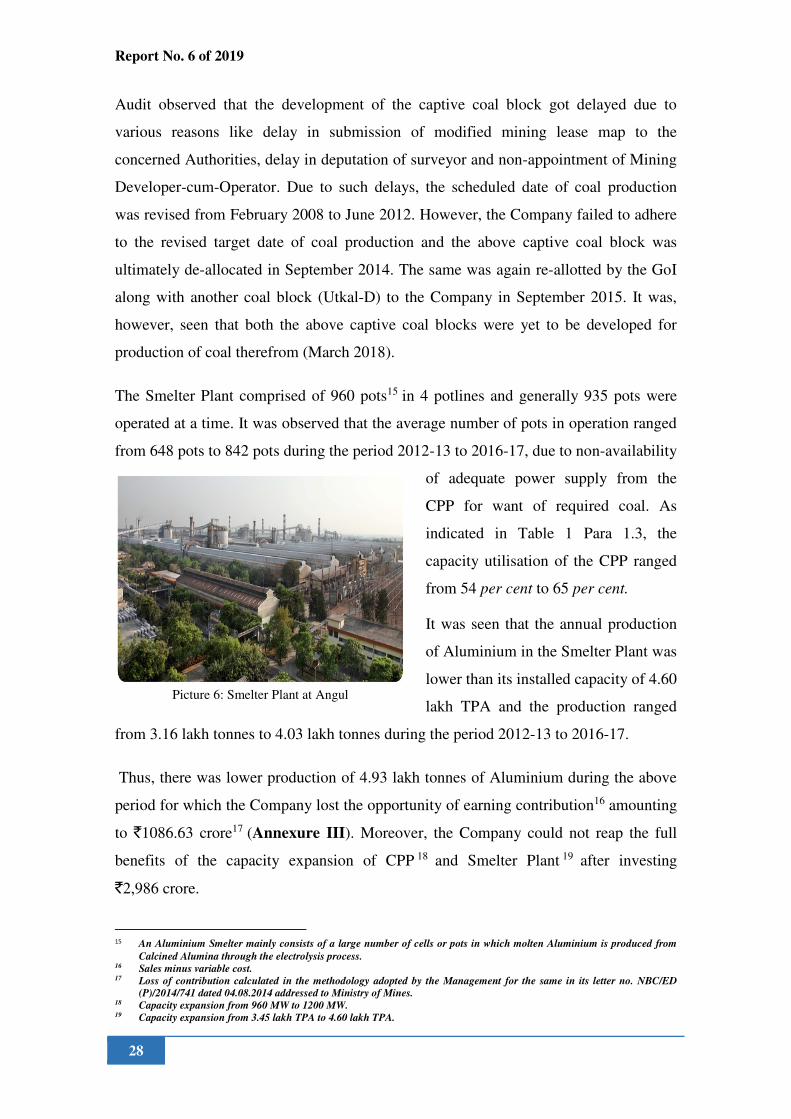
The Smelter Plant comprised of 960 pots15 in 4 potlines and generally 935 pots were
operated at a time. It was observed that the average number of pots in operation ranged
from 648 pots to 842 pots during the period 2012-13 to 2016-17, due to non-availability
of adequate power supply from the
CPP for want of required coal. As
indicated in Table 1 Para 1.3, the
capacity utilisation of the CPP ranged
from 54 per cent to 65 per cent.
It was seen that the annual production
of Aluminium in the Smelter Plant was
lower than its installed capacity of 4.60
lakh TPA and the production ranged
from 3.16 lakh tonnes to 4.03 lakh tonnes during the period 2012-13 to 2016-17.
Thus, there was lower production of 4.93 lakh tonnes of Aluminium during the above
period for which the Company lost the opportunity of earning contribution16 amounting
to `1086.63 crore17 (Annexure III). Moreover, the Company could not reap the full
benefits of the capacity expansion of CPP 18 and Smelter Plant 19 after investing
`2,986 crore.
15 An Aluminium Smelter mainly consists of a large number of cells or pots in which molten Aluminium is produced from
Calcined Alumina through the electrolysis process. 16 Sales minus variable cost. 17 Loss of contribution calculated in the methodology adopted by the Management for the same in its letter no. NBC/ED
(P)/2014/741 dated 04.08.2014 addressed to Ministry of Mines. 18 Capacity expansion from 960 MW to 1200 MW. 19 Capacity expansion from 3.45 lakh TPA to 4.60 lakh TPA.
Picture 6: Smelter Plant at Angul

Report No. 6 of 2019
29
The Management while accepting the delay in development of captive coal blocks
stated (April 2018) that continuous follow up and monitoring was being done for
opening of coal blocks. It was also stated that production of Aluminium in Smelter
Plant was restricted keeping in view the availability of economical power from CPP.
Ministry also endorsed (July 2018) the views of the Management.
3.2 Excess consumption of Calcined Alumina in production of Aluminium
As per the norms fixed by the Process Licensor, 1,924 kg of Calcined Alumina was
required for production of one tonnes of hot metal of Aluminium. It was seen that
during 2012-13, 2013-14 and 2016-17 the actual consumption of Calcined Alumina
was more than the above norms which led to excess consumption of 16,522 tonnes of
Calcined Alumina valuing `31.13 crore (Annexure IV). The major reason for such
excess consumption of Calcined Alumina was operation of pots in lower amperage20
due to inadequate power supply.
Both the Management and the Ministry while accepting the higher consumption of
Calcined Alumina stated (August 2018) that the same was due to fluctuation/
disturbance of power during potline operations.
3.3 Consumption of Fuel oil in the Bake oven plants
Fuel Oil (FO) was used in Bake Oven plants of Smelter Plant for baking21 of anodes.
There were three Bake Oven plants and for each plant the Company had fixed norms
for consumption of Fuel Oil. It was seen in audit that the actual specific consumption of
Fuel Oil in all the three Bake Oven plants was higher than their respective norms
during the period 2012-13 to 2016-17, excepting for the Bake Oven Plant-1 in 2012-13.
This led to excess consumption of 3,619 kilolitres of FO valuing `10.71 crore
(Annexure V). The major reason for higher specific consumption of FO in Bake Oven
plants was higher rejection of baked anode due to deteriorated flue wall condition of
Bake Oven plants.
The Management (April 2018) and Ministry (July 2018) accepted the audit observation.
20 The strength of electrical current needed to make a piece of electrical equipment work properly
21 Anodes made up of petroleum coke and coal-tar-pitch needs to be baked in a Bake Oven Plant before using the same in
the Potlines for electrolysis process.

Report No. 6 of 2019
30
3.4 Loss due to excess Station Heat Rate in CPP
Station Heat Rate (SHR) indicates quantum of heat energy (Kcal22) required to generate
one unit (KWh23) of electrical energy at generator terminals of a thermal power plant.
Audit observed that during the period 2012-17 the actual SHR of the CPP of the
Company was higher than the SHR norms of 2,615 Kcal per KWh resulting in excess
consumption of coal valuing `326.62 crore (Annexure VI). The higher SHR was
mainly due to high dry flue gas loss and un-burnt carbon loss in ash.
The Management (April 2018) and the Ministry (July 2018) while accepting the audit
observation stated that despite taking various proactive measures the actual SHR was
2,689 Kcal per KWh in May 2018.
3.5 Loss due to Grade slippage of coal
The Company entered into Fuel Supply Agreements (FSAs) with Mahanadi Coalfields
Limited (MCL) for procurement of coal for its CPP at Angul and Refinery at
Damanjodi. As per the provisions of the FSAs the Company could avail the facility of
joint sampling of coal at the colliery
siding/ loading point for
determination of grade of coal. It
was seen that in absence of any joint
sampling of coal at such loading
point, the grade of coal supplied was
determined on the basis of sampling
done by MCL at the loading point
and the invoices for supply of coal
were raised accordingly. Scrutiny of
the records revealed that the actual
grades of coal received were inferior to the grades invoiced by MCL and the Company
had to bear an additional expenditure of `239.23 crore (Annexure VII) towards grade
slippage of coal procured during the period 2012-13 to 2016-17. Audit observed that in
absence of joint sampling of coal at the loading point, the Company could not ensure
that the invoices of coal were raised for the grades actually delivered by MCL.
22 Kilo Calories 23 Kilo Watt Hour
Picture 7: Coal Stacker cum reclaimer

Report No. 6 of 2019
31
The Management while accepting the fact of grade slippage stated (April 2018) that
there was no provision in the FSA for claiming any compensation towards deviation in
quality of coal supplied.
The reply of the Management is not relevant as the question of claiming any
compensation towards grade slippage does not arise, if grade slippage was arrested
through joint sampling of coal as per the provisions of FSA.
The Ministry, however, stated (July 2018) that third party sampling has been started
since April 2018.
Audit Summation
The Company could not develop the coal blocks allotted, leading to
underutilisation of Captive Power Plant, which further caused sub-optimal
operations of potlines in the Smelter. Due to such sub-optimal operation of
Smelter, there was lower production of 4.93 lakh tonnes of Aluminium during
the period 2012-13 to 2016-17 with consequential loss in opportunity to earn
contribution amounting to `1086.63 crore. Moreover, the Company could not
reap the full benefits of the capacity expansion of CPP and Smelter despite
having made a substantial investment. The actual consumption of Calcined
Alumina in the potlines and Fuel oil in the Bake Oven Plants was higher than
the respective norms for consumption. Further, the actual Station Heat Rate of
the CPP was higher than the norms, which resulted in excess consumption of
coal. The Company also did not exercise its option for joint sampling of coal,
due to which it could not arrest grade slippage of coal supplied to the Refinery
and Captive Power Plant.


Report No. 6 of 2019
33
Chapter4: ENVIRONMENTAL ISSUES
4.1 Non-compliance of the Environmental conditions during transportation of
Bauxite
The Company during submission of application for Environmental Clearance (EC) of
South Block Mines proposed (October 2010) that there would be an in-pit crusher and
conveyor system to crush the Bauxite to be produced from the South Block Mines
within the working area and transport the crushed Bauxite to long distance/downhill
cable belt conveyor, through a dedicated conveyor system. It was further clarified that
in-pit transportation of overburden and Bauxite will be done by Dumpers, whereas the
conveyor will transport crushed Bauxite from the in-pit crusher. In the above proposal
the mining operation was to commence from the year 2019-20 with the removal of
overburden, whereas excavation of Bauxite was to commence from the year 2021-22.
Based on the proposal, EC was granted (February 2011) by the Ministry of
Environment, Forest and Climate Change (MoEF & CC) the Company for operation of
South Block Mines. In the meantime, Consent to Establish (CTE) was granted (October
2010) by Odisha State Pollution Control Board (OSPCB) for production of Bauxite
from South Block Mines with a condition that the Bauxite would be transported by
cable conveyor belt from South Block Mines to the Refinery. The condition of
transportation of Bauxite by conveyor to the Refinery was again reiterated (December
2016) by the OSPCB while granting Consent to Operate (CTO) for South Block Mines.
In this context it may be stated that use of Dumpers instead of Conveyor belt would
increase pollution by emitting excess dust, smoke and sound in comparison to the
Dumpers.
In the meantime, due to increase in silica content in the Bauxite the specific
consumption of Bauxite for production of one tonnes of Alumina Hydrate had
increased from 3 tonnes to 3.25 tonnes. This required excavation of additional 6 lakh
tonnes of Bauxite per annum to meet the requirement of Alumina Refinery. The
Company decided to prepone the excavation of Bauxite from the South Block Mines to
the year 2016-17 instead of the planned timeline of 2021-22.
Audit, observed that this decision to prepone excavation from South Block mine
compelled the Company to transport (December 2017) excavated Bauxite from the
Report No. 6 of 2019
34
mine faces to the adjoining Central and North Block Mines by Dumpers for crushing
and onward transportation to the Alumina Refinery, as the conveyor was not ready.
This was a non-compliance of the conditions of EC granted by MoEF & CC and
CTE/CTO granted by OSPCB. Further, for transportation of Bauxite from South Block
Mines, the Company awarded the contract of `3.90 crore for deployment of Dumpers
for six months and the deployment is still continuing. Against the contract, the
Company had already incurred an expenditure of `3.48 crore for the period January
2018 to June 2018.
The Management stated (April 2018) that although it was envisaged in Environment
Impact Assessment (EIA) report to crush and transport excavated Bauxite from South
Block to the crusher house of Central and North Block by a semi-mobile crusher and a
dedicated conveyor system, transportation of Bauxite from Mines to Refinery through
cable conveyor belt has only been mentioned in the EC, CTE and CTO granted for
South Block mine, which has been approved by IBM. The Ministry also endorsed (July
2018) the views of the Management.
The reply of the Management/Ministry is not acceptable as the IBM is not the authority
for waiver of the conditions specified in the EC, CTE and CTO clearances.
4.2 Discharge of Red Mud and Red Mud Pond Effluent beyond norms
The Company was granted (May 2010) EC for enhancing the production capacity of
the Refinery from 21 lakh tonnes per annum (TPA) to 22.75 lakh TPA of Alumina
Hydrate. Bauxite (68.25 lakh TPA), Caustic Soda (1.62 lakh TPA), Coal (14.35 lakh
TPA), Heavy Fuel Oil (1.84 lakh kilo litres per annum) and Lime (0.46 lakh TPA) was
to be used as a raw material, as specified in the EC.
Audit, however, observed that during 2016-17 the Company had produced 21 lakh
tonnes of Alumina Hydrate by processing 69.30 lakh tonnes of Bauxite against
approved quantity of 68.25 lakh tonnes. Thus, the Company has violated the EC norms
by utilising Bauxite more than the permitted level.
Audit also observed that during the period 2012-13 to 2016-17, OSPCB while granting
CTO stipulated the limit of daily disposal of Red mud and Red mud pond effluent from
the Refinery. As per CTO, the Company cannot change or alter either the quality or

Report No. 6 of 2019
35
quantity of the rate of discharge without the previous approval of the OSPCB. In case
of non-compliance of any order/directive of the OSPCB and/or violation of the terms
and conditions of the CTO, the Company would be liable for legal action as per the
provisions of the Law/Act. Audit observed that during the period 2012-13 to 2016-17,
the actual discharge of Red Mud ranged from 6,723 tonnes per day to 8,741 tonnes
per day against the permitted limit of 6,087 tonnes per day. Similarly, the actual
discharge of Red Mud Pond Effluent ranged from 5,425 kilo litres (KL) per day to
6,854 KL per day during the above period against the permitted limit of
5,200 KL per day. Year wise actual discharge of Red Mud and Red Mud Pond Effluent
is presented the following Chart. Thus, the Company violated the conditions of CTO by
consistently discharging Red Mud and Red Mud Pond Effluent higher than the limit
specified by the OSPCB.
Chart 6: Red Mud Pond discharge
Source: CTO from OSPCB ad Monthly Progress Report of Company
The Management while accepting that the consumption of Bauxite was more than that
permitted in EC during 2016-17 contended (April 2018) that the raw material quantity
specified in the EC may vary due to change in quality but the production quantity and
pollution parameters should not be breached.
60
87
60
87
60
87
60
87
60
87
67
23
75
45
67
46
76
24
87
41
52
00
52
00
52
00
52
00
52
00
54
25
59
76
55
67
61
23
68
54
4500
5000
5500
6000
6500
7000
7500
8000
8500
9000
2012-13 2013-14 2014-15 2015-16 2016-17
Dis
charg
e p
er D
ay
(in
ton
nes
/KL
)
Period
Norms for Red Mud disharge (tonnes per day) Actual Red Mud discharge (tonnes per day)
Norms for Red Mud Pond Effluent discharge (KL per day) Actual Red Mud Pond Effluent disharge (KL per day)
Report No. 6 of 2019
36
The reply of the Management is not tenable as EC does not include any such provision
regarding flexibility in increasing the permissible limit of usage of Bauxite. The
Management was however, silent about higher discharge of red mud pond effluent.
While endorsing the view of the Management, the Ministry stated (July 2018) that the
CTO conditions outlines the mode of disposal of red mud which were strictly adhered
to. The Ministry further stated that the Company has been submitting the actual
quantities of red mud disposed to the OSPCB by filing annual returns.
The contention of the Ministry is not tenable because the CTO conditions not only
outlined the mode of disposal of red mud, but the quantity of effluent to be discharged
was also specified, which the Company could not comply with. Moreover, submission
of annual returns to OSPCB does not absolve the Company from the responsibilities of
complying with the pollution control norms.
4.3 Excess consumption of Fluoride in the Smelter Plant
Under Corporate Responsibility for Environment Protection (CREP), the MoEF & CC,
in order to reduce the emission of Fluoride, fixed (December 2005) the target of
consumption of Fluoride 24 for Smelter Plant as 10 kg per tonne of Aluminium
produced. Test check of half yearly reports of the Company, during the period 2012-13
to 2016-17, revealed that consumption of Fluoride ranged between 12 kg per tonne and
12.9 kg per tonne which was more than the CREP target of 10 kg per tonne. Thus, the
Company continuously failed to achieve the target of Fluoride consumption.
Also as required under CREP, forage Fluoride25 content was to be maintained within
40 ppm26 (annual average) and 60 ppm (average for two consecutive months). It was,
however, observed that the Company was taking and analyzing the samples for forage
Fluoride only on quarterly basis. The reports of such quarterly samples showed that the
results ranged from 42.83 ppm to 72.33 ppm, which were above the norms for annual
average. Moreover, it could not be appreciated how the bi-monthly averages could be
worked out if the Company was only taking the readings on quarterly basis. The
reasons for not taking monthly samples were not found on record.
24 Fluoride as elementary Fluorine (F) 25 Forage and grasses growing near industrial areas are often contaminated by fluoride-rich industrial effluents or by
windblown or rain-splashed soil having a high fluoride concentration. 26 ppm stands for parts per million
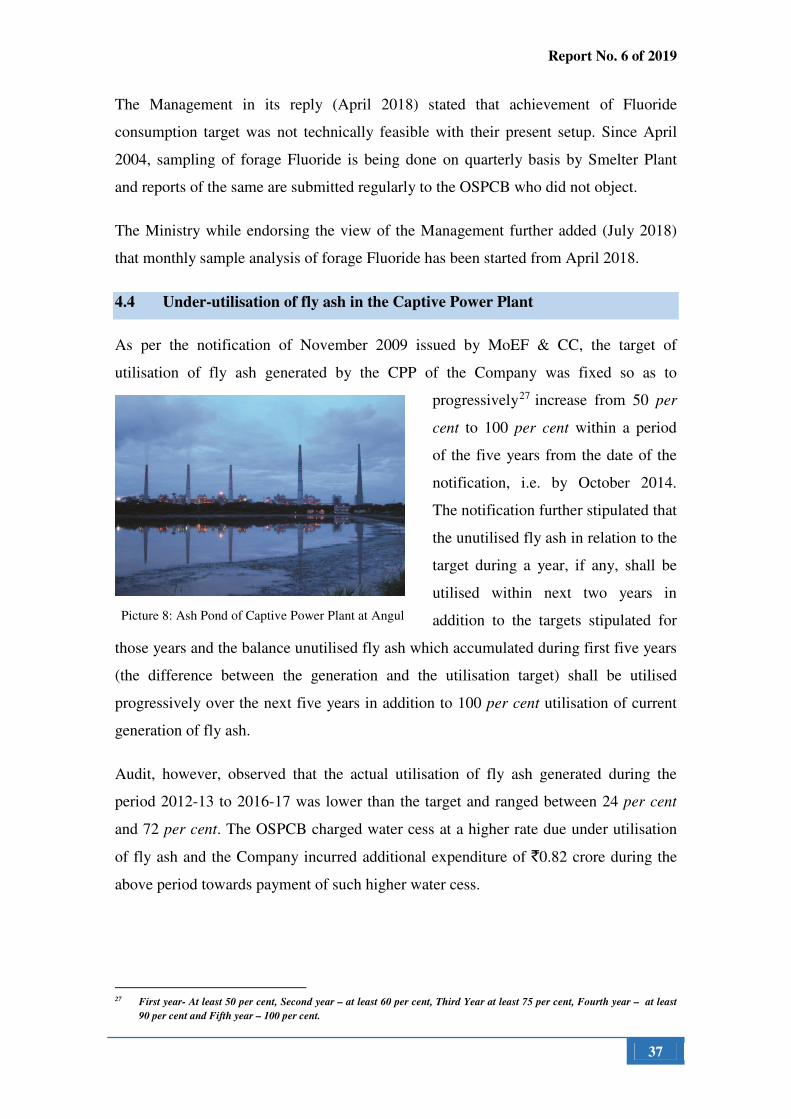
Report No. 6 of 2019
37
The Management in its reply (April 2018) stated that achievement of Fluoride
consumption target was not technically feasible with their present setup. Since April
2004, sampling of forage Fluoride is being done on quarterly basis by Smelter Plant
and reports of the same are submitted regularly to the OSPCB who did not object.
The Ministry while endorsing the view of the Management further added (July 2018)
that monthly sample analysis of forage Fluoride has been started from April 2018.
4.4 Under-utilisation of fly ash in the Captive Power Plant
As per the notification of November 2009 issued by MoEF & CC, the target of
utilisation of fly ash generated by the CPP of the Company was fixed so as to
progressively27 increase from 50 per
cent to 100 per cent within a period
of the five years from the date of the
notification, i.e. by October 2014.
The notification further stipulated that
the unutilised fly ash in relation to the
target during a year, if any, shall be
utilised within next two years in
addition to the targets stipulated for
those years and the balance unutilised fly ash which accumulated during first five years
(the difference between the generation and the utilisation target) shall be utilised
progressively over the next five years in addition to 100 per cent utilisation of current
generation of fly ash.
Audit, however, observed that the actual utilisation of fly ash generated during the
period 2012-13 to 2016-17 was lower than the target and ranged between 24 per cent
and 72 per cent. The OSPCB charged water cess at a higher rate due under utilisation
of fly ash and the Company incurred additional expenditure of `0.82 crore during the
above period towards payment of such higher water cess.
27 First year- At least 50 per cent, Second year – at least 60 per cent, Third Year at least 75 per cent, Fourth year – at least
90 per cent and Fifth year – 100 per cent.
Picture 8: Ash Pond of Captive Power Plant at Angul
Report No. 6 of 2019
38
The Management while accepting the audit observation stated (April 2018) that various
steps had been taken to maximize ash utilisation. The Ministry also endorsed
(July 2018) the views of the Management.
Audit Summation
The transportation of excavated Bauxite in South Block Mines by dumpers to the
crushers in Central and North Block Mines, instead of transporting the same
through the conveyor belt was not in conformity with the conditions of
Environmental Clearance granted for operation of South Block Mines.
The discharge of Red Mud and Red Mud Pond Effluent at the Alumina Refinery
were consistently higher than the corresponding limits specified by the Odisha
State Pollution Control Board during the period 2012-13 to 2016-17.
The Company continuously failed to achieve the Corporate Responsibility for
Environment Protection (CREP) target of Fluoride consumption of 10 kg per tonne
at the Aluminium Smelter.
The actual utilisation of fly ash generated during the period 2012-13 to 2016-17, at
the Captive Power Plant was lower than the target and ranged between 24 per cent
and 72 per cent.

Report No. 6 of 2019
39
Chapter 5: CONCLUSION AND RECOMENDATIONS
The production from the Refinery, Smelter and Captive Power Plant of the Company
remained lower than the respective capacities throughout the period 2012-13 to
2016-17. The lower capacity utilisation of the Refinery was due to corresponding lower
production of Bauxite from the Mines, coupled with slippage in the quality of the
Bauxite so excavated. There was a shortfall of production of 11.04 lakh tonnes of
Alumina Hydrate in the Refinery during the above period. Lower production of Bauxite
in the Mines was mainly attributed to (a) Inadequate operations of Heavy Earth Moving
Machineries, (b) Under-utilisation of Semi Mobile Crusher Plant and Fixed Long
Distance Conveyor, (c) Delay in adopting the IBM guidelines regarding revision in cut-
off grade of Bauxite and (d) Delay in filing application for renewal of Forest Clearance
of Mines. Slippage in quality of Bauxite so excavated was primarily due to (a)
Non-compliance with the Blending scheme of Monthly Mine Production Plan, (b) Non
implementation of measures to improve Bauxite quality, (c) Inadequate removal of
overburden and (d) Discrepancy in Monthly Deviation Report of Mines.
Due to lower production of Bauxite in the Mines, the company could not maintain the
required stock level of Bauxite in the Refinery Stockyard during the period 2012-13 to
2016-17. The Company, therefore, was not able to blend the Bauxite with varying
Silica content for feeding to the Refinery with even Silica content. This led to excess
consumption of 1.46 lakh tonnes of Caustic Soda in the Refinery during the period
2012-13 to 2015-16, for which the Company had to incur additional expenditure of
`426.27 crore.

Report No. 6 of 2019
40
The Company was not able to develop the captive coal block allotted to it for supply of
required coal to its Captive Power Plant towards generation of power. Due to shortfall
in generation of power at Captive Power Plant, the actual number of pots in operation
ranged from 648 pots to 842 pots against 935 pots generally operated. As a result, the
production of Aluminium in the Smelter Plant was lower by 4.93 lakh tonnes than the
target during the period 2012-13 to 2016-17. The Company, therefore, lost the
opportunity of earning contribution of `1086.63 crore for such lower production of
Aluminium during the above period.
There were deviations in complying with the Environmental norms prescribed by
MoEF & CC and OSPCB in the following areas, such as (a) discharge of excess red
mud and red mud pond effluent in the Refinery than permitted, (b) consumption of
excess fluoride per unit of Aluminium produced and excess emission of forage Fluoride
in the Smelter Plant, and (c) lower utilisation of fly ash generated in the Captive Power
Plant.
Recommendations
1. The Management may constantly monitor the position and deployment of
skilled Heavy Earth Moving Machine operators so that, in future, production
from Mines is not affected.
2. Balance pre-production drilling activity may be completed expeditiously so that
quality and quantity of Bauxite are properly assessed before preparing annual
and monthly mine production plan.
3. Removal of the top soil and the laterite overburden may be carried out as per the
IBM approved mining plan. Clearance of the backlog would help to get more
options for quality control and blending of Bauxite.
4. The Management may maintain adequate level of Bauxite in stockpile to reduce
the variation in Bauxite quality before feeding to the Refinery.
5. The allotted Coal Blocks may be developed at the earliest to ensure supply of
coal to the Captive Power Plant.

Report No. 6 of 2019
41
Response of the Ministry of Mines on the audit recommendations:
The Ministry of Mines was in agreement with all the Recommendations.
New Delhi (VENKATESH MOHAN)
Dated: Deputy Comptroller and Auditor General
(Commercial)
Countersigned
New Delhi (RAJIV MEHRISHI)
Dated: Comptroller and Auditor General of India


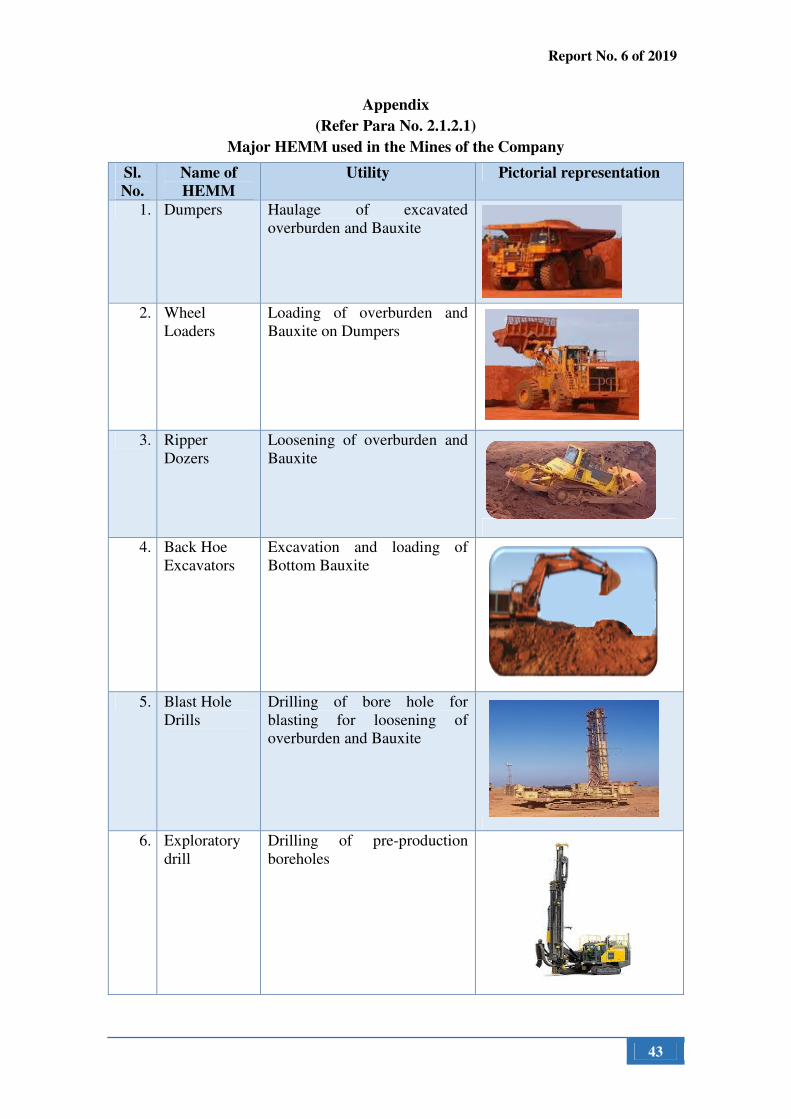
Report No. 6 of 2019
43
Appendix
(Refer Para No. 2.1.2.1)
Major HEMM used in the Mines of the Company
Sl.
No.
Name of
HEMM
Utility Pictorial representation
1. Dumpers Haulage of excavated
overburden and Bauxite
2. Wheel
Loaders
Loading of overburden and
Bauxite on Dumpers
3. Ripper
Dozers
Loosening of overburden and
Bauxite
4. Back Hoe
Excavators
Excavation and loading of
Bottom Bauxite
5. Blast Hole
Drills
Drilling of bore hole for
blasting for loosening of
overburden and Bauxite
6. Exploratory
drill
Drilling of pre-production
boreholes

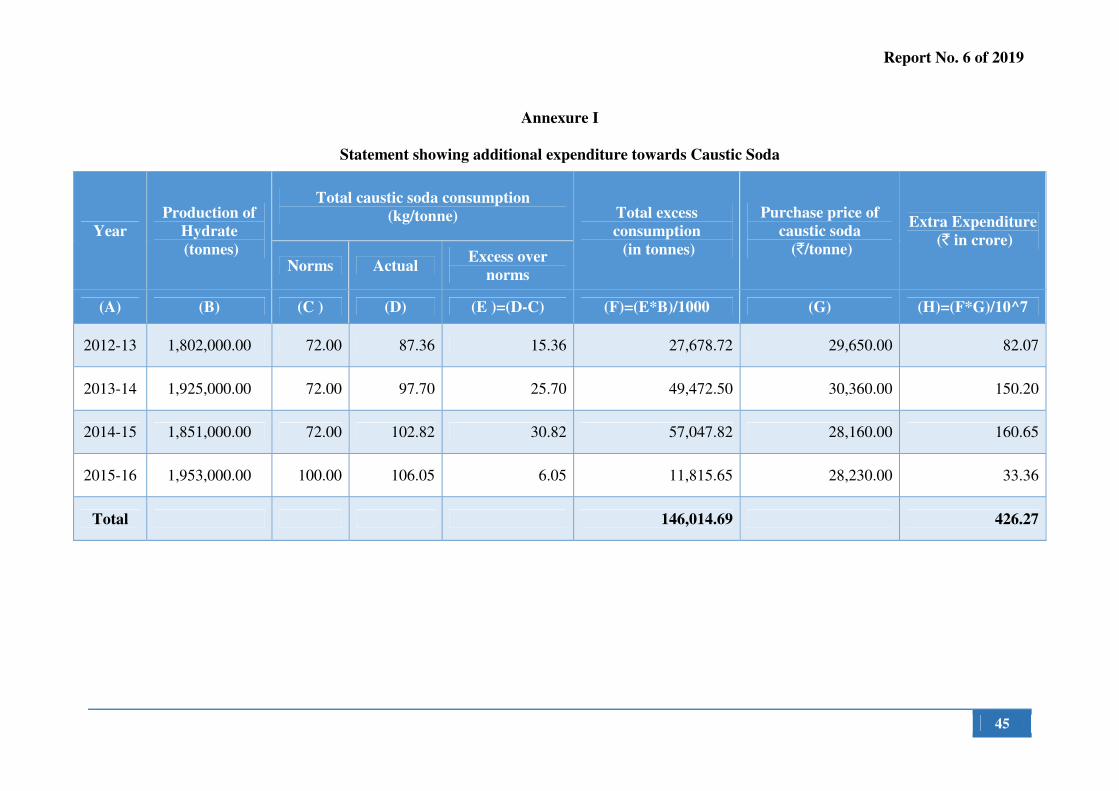
Report No. 6 of 2019
45
Annexure I
Statement showing additional expenditure towards Caustic Soda
Year
Production of
Hydrate
(tonnes)
Total caustic soda consumption
(kg/tonne) Total excess
consumption
(in tonnes)
Purchase price of
caustic soda
(`/tonne)
Extra Expenditure
(` in crore)
Norms Actual Excess over
norms
(A) (B) (C ) (D) (E )=(D-C) (F)=(E*B)/1000 (G) (H)=(F*G)/10^7
2012-13 1,802,000.00 72.00 87.36 15.36 27,678.72 29,650.00 82.07
2013-14 1,925,000.00 72.00 97.70 25.70 49,472.50 30,360.00 150.20
2014-15 1,851,000.00 72.00 102.82 30.82 57,047.82 28,160.00 160.65
2015-16 1,953,000.00 100.00 106.05 6.05 11,815.65 28,230.00 33.36
Total 146,014.69 426.27

Report No. 6 of 2019
46
Annexure II
(Refer Para No. 2.1.5 )
Statement showing additional expenditure towards Fuel Oil
Year
Consumption of fuel
oil (litre/tonne)
Excess
Consumption
over norms
(ltr/tonne)
Production of
Calcined
Alumina
(in tonnes)
Total Excess
consumption
(KL)
Average purchase
price of fuel oil
(`/KL)
Extra
Expenditure
(` in crore) Norms Actual
(A) (B) (C ) (D)=(C-B) (E ) (F) =
(E*D)/1000 (G) (H) =(E*F)/10^7
2012-13 77.00 77.56 0.56 1,762,700.00 987.11 40,344.80 3.98
2013-14 77.00 77.76 0.76 1,912,600.00 1,453.58 40,783.01 5.93
2014-15 77.00 78.88 1.88 1,826,500.00 3,433.82 34,943.29 12.00
2015-16 77.00 78.11 1.11 1,910,000.00 2,120.10 20,997.14 4.45
2016-17 77.00 78.83 1.83 2,032,500.00 3,719.48 22,505.28 8.37
Total 11,714.08 34.73

Report No. 6 of 2019
47
Annexure III
(Refer Para No. 3.1)
Calculation of loss of opportunity to earn contribution due to lower operation of Smelter Plant
Sl. No. Particulars 2012-13 2013-14 2014-15 2015-16 2016-17 Total
(`̀̀̀ in crore)
(A)
Sales Realisation from
Auminium Metal (Ingot)
(in ` per tonne)
122,925.59 125,329.31 140,592.61 115,783.54 122,783.72
Variable Cost (` per tonne)
(B) Variable cost of Hot Metal used 96,774.01 95,170.00 91,559.62 88,965.89 91,977.88
(C ) Cost of other input materials 659.28 1,650.11 1,396.83 717.03 681.45
(D) Fuel 534.00 521.97 430.47 268.68 321.85
(E) Utilities 162.02 206.11 173.50 149.54 141.29
(F) Direct Expenses 104.17 96.02 108.59 46.33 45.51
(G) Packaging Cost 298.09 294.26 65.94 75.07 61.80
(H)=(B+C+D
+E+F+G)
Total variable cost of Ingot
(in ` per tonne) 98,531.57 97,938.47 93,734.95 90,222.54 93,229.78
(I)=(A-H) Contribution (in ` per tonne) 24,394.02 27,390.84 46,857.66 25,561.00 29,553.94
(J) Sales Margin on Calcined
Alumina (in ` per tonne) 4,327.75 4,569.11 6,466.04 5,217.73 5,397.12
(K) Specific Consumption of
Alumina ( in tonne) 1.972 1.940 1.931 1.937 1.945
(L)=(J*K)
Margin of Alumina in
Aluminium metal produced
(in ` per Tonne)
8,534.32 8,864.07 12,483.34 10,106.74 10,497.40
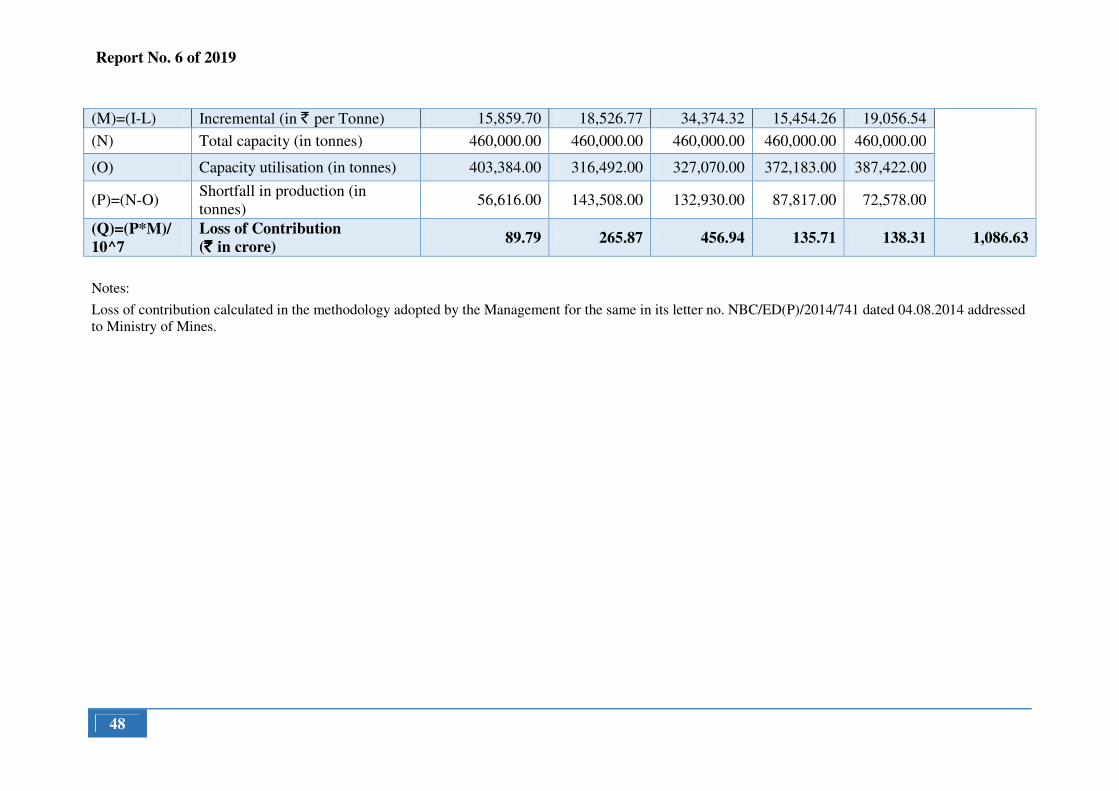
Report No. 6 of 2019
48
(M)=(I-L) Incremental (in ` per Tonne) 15,859.70 18,526.77 34,374.32 15,454.26 19,056.54
(N) Total capacity (in tonnes) 460,000.00 460,000.00 460,000.00 460,000.00 460,000.00
(O) Capacity utilisation (in tonnes) 403,384.00 316,492.00 327,070.00 372,183.00 387,422.00
(P)=(N-O) Shortfall in production (in
tonnes) 56,616.00 143,508.00 132,930.00 87,817.00 72,578.00
(Q)=(P*M)/
10^7
Loss of Contribution
(` ` ` ` in crore) 89.79 265.87 456.94 135.71 138.31 1,086.63
Notes:
Loss of contribution calculated in the methodology adopted by the Management for the same in its letter no. NBC/ED(P)/2014/741 dated 04.08.2014 addressed
to Ministry of Mines.

Report No. 6 of 2019
49
Annexure IV
(Refer Para No. 3.2)
Statement showing excess consumption of Calcined Alumina
Year Actual
Production of
hot metal
(tonnes)
Total
consumption
of Alumina
(tonnes)
Actual Specific
Consumption
of Alumina
(tonnes)
Norms for
consumption
of Alumia per
Tonnes of hot
metal
(tonnes)
Excess
consumption
over norms per
Tonnes of hot
metal
(tonnes)
Total excess
consumption
(tonnes)
Sales price of
alumina
(` ` ` ` per tonne)
Loss due to
excess
consumption
(`̀̀̀ in crore)
(A) (B) (C ) (D) (E ) (F )=(D-E) (G )=(F*B) (H) (I)=(G*H)/10^7
2012-13 406,482 795,387 1.957 1.924 0.033 13,315.63 18,612.38 24.78
2013-14 318,544 613,943 1.927 1.924 0.003 1,064.34 19,539.62 2.08
2014-15 329,511 631,453 1.916 1.924 - - 21,399.93 -
2015-16 374,903 720,880 1.923 1.924 - - 19,093.87 -
2016-17 390,467 753,401 1.929 1.924 0.005 2,142.49 19,896.12 4.26
Total 16,522.47 31.13

Report No. 6 of 2019
50
Annexure V
(Refer Para No. 3.3)
Excess consumption of FO over Norms in 'Bake Oven' Plants
Plant Particulars 2012-13 2013-14 2014-15 2015-16 2016-17 Total
Bake Oven-1
Production
(tonnes) (A) 86,793.00 61,962.00 60,969.00 90,918.00 94,019.76
FO consumption Norms
(ltrs/Tonne) (B) 65.00 65.00 65.00 65.00 65.00
Actual consumption
(ltrs/tonne) (C ) 65.00 68.00 66.00 72.00 68.80
Excess consumption
(ltrs/tonne) (D)=(C-B) - 3.00 1.00 7.00 3.80
Excess consumption
(KL) (E )=(D*A)/1000 - 185.89 60.97 636.43 357.28 1,240.56
Bake Oven-2
Production
(tonnes) (F) 76,060.00 66,014.00 68,141.00 81,401.00
103,734.00 FO consumption Norms
(ltrs/tonne) (G) 54.00 54.00 54.00 54.00 54.00
Actual consumption
(ltrs/tonne) (H) 60.00 59.00 56.00 59.00 58.70 Excess consumption
(ltrs/tonne) (I)=(H-G) 6.00 5.00 2.00 5.00 4.70 Excess consumption
(KL) (J)=(I*F)/1000 456.36 330.07 136.28 407.01 487.55 1,817.27
Bake Oven-3
Production
(tonnes) (K) 77,065.00 65,796.00 67,867.00 50,944.00 34,982.00 FO consumption Norms
(ltrs/tonne) (L) 54.00 54.00 54.00 54.00 54.00
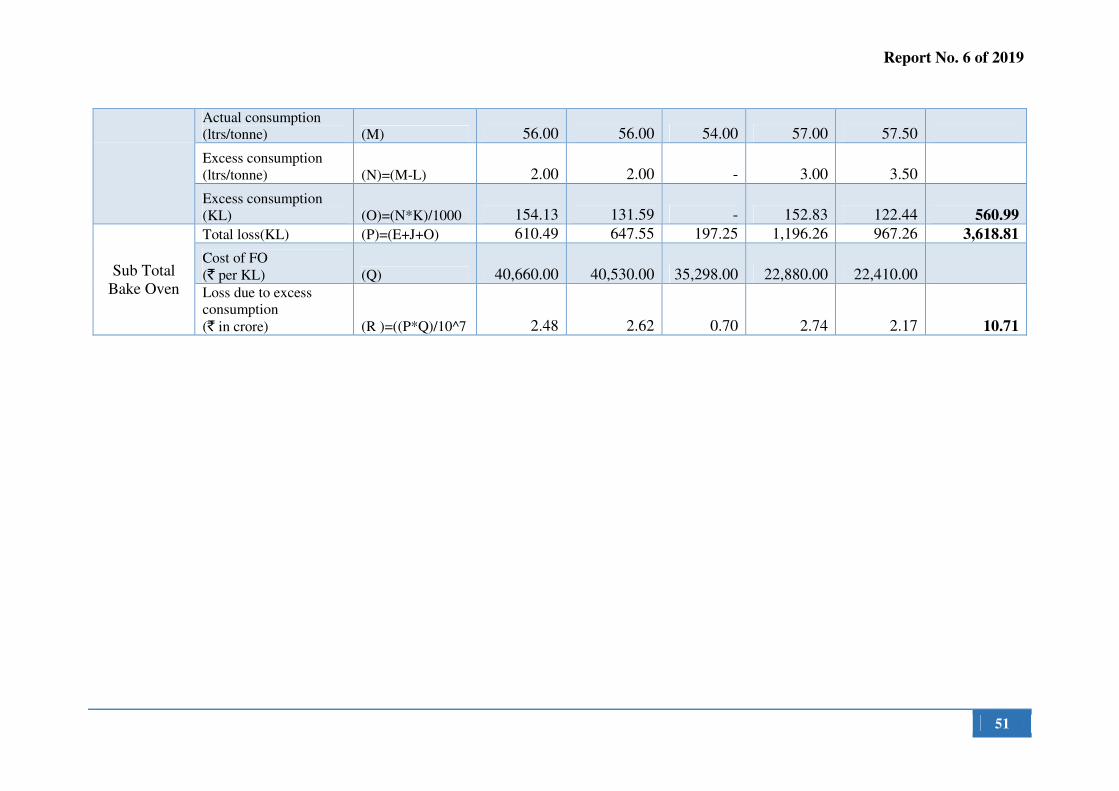
Report No. 6 of 2019
51
Actual consumption
(ltrs/tonne) (M) 56.00 56.00 54.00 57.00 57.50
Excess consumption
(ltrs/tonne) (N)=(M-L) 2.00 2.00 - 3.00 3.50
Excess consumption
(KL) (O)=(N*K)/1000 154.13 131.59 - 152.83 122.44 560.99
Sub Total
Bake Oven
Total loss(KL) (P)=(E+J+O) 610.49 647.55 197.25 1,196.26 967.26 3,618.81
Cost of FO
(` per KL) (Q) 40,660.00 40,530.00 35,298.00 22,880.00 22,410.00 Loss due to excess
consumption
(` in crore) (R )=((P*Q)/10^7 2.48 2.62 0.70 2.74 2.17 10.71
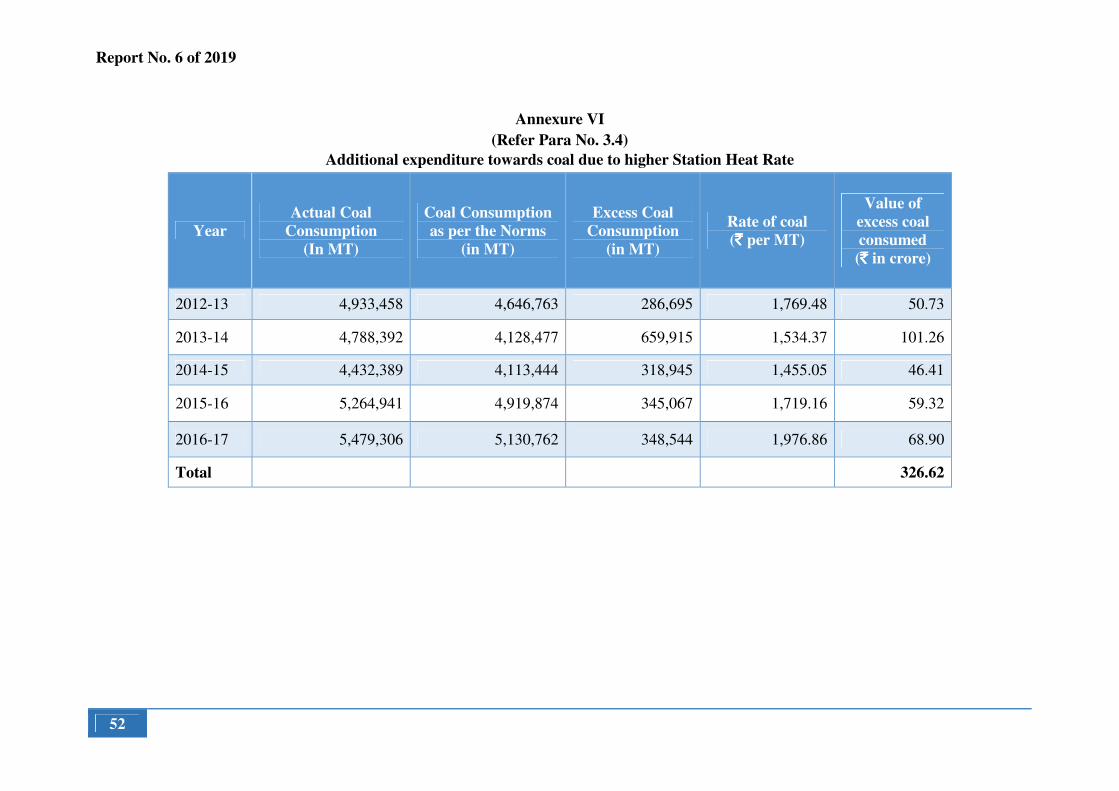
Report No. 6 of 2019
52
Annexure VI
(Refer Para No. 3.4)
Additional expenditure towards coal due to higher Station Heat Rate
Year
Actual Coal
Consumption
(In MT)
Coal Consumption
as per the Norms
(in MT)
Excess Coal
Consumption
(in MT)
Rate of coal
(`̀̀̀ per MT)
Value of
excess coal
consumed
(`̀̀̀ in crore)
2012-13 4,933,458 4,646,763 286,695 1,769.48 50.73
2013-14 4,788,392 4,128,477 659,915 1,534.37 101.26
2014-15 4,432,389 4,113,444 318,945 1,455.05 46.41
2015-16 5,264,941 4,919,874 345,067 1,719.16 59.32
2016-17 5,479,306 5,130,762 348,544 1,976.86 68.90
Total 326.62
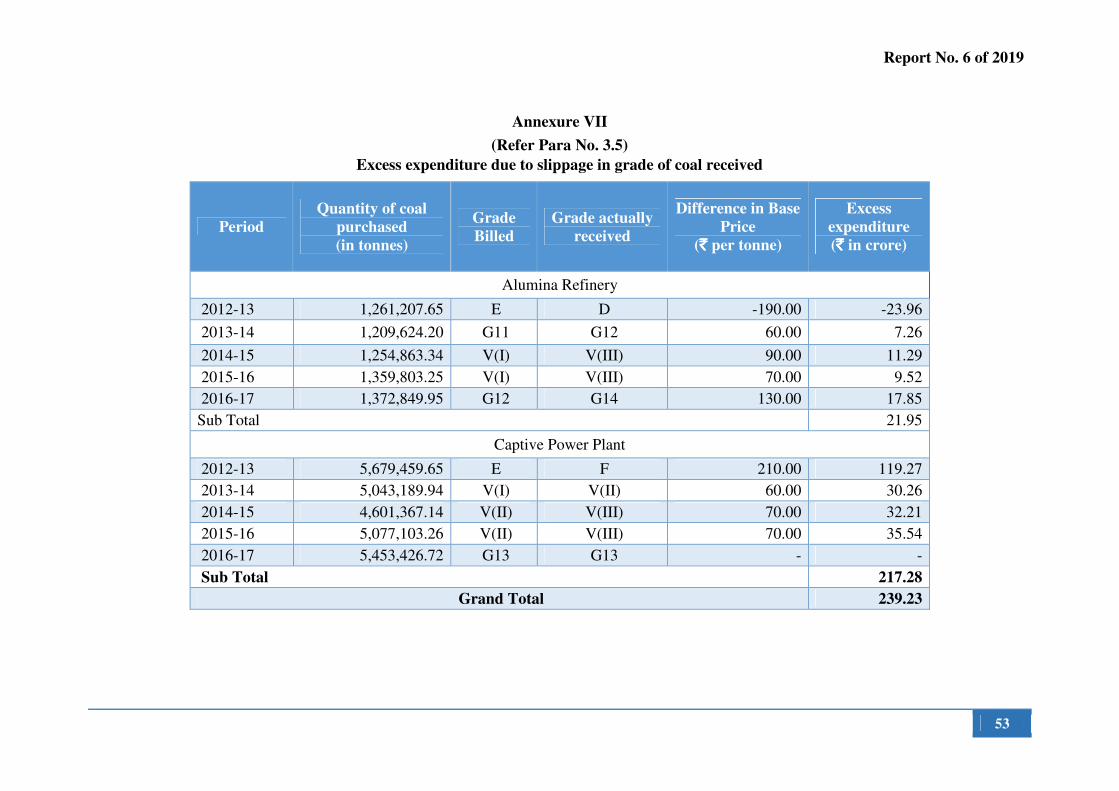
Report No. 6 of 2019
53
Annexure VII
(Refer Para No. 3.5)
Excess expenditure due to slippage in grade of coal received
Period
Quantity of coal
purchased
(in tonnes)
Grade
Billed
Grade actually
received
Difference in Base
Price
(`̀̀̀ per tonne)
Excess
expenditure
(`̀̀̀ in crore)
Alumina Refinery
2012-13 1,261,207.65 E D -190.00 -23.96
2013-14 1,209,624.20 G11 G12 60.00 7.26
2014-15 1,254,863.34 V(I) V(III) 90.00 11.29
2015-16 1,359,803.25 V(I) V(III) 70.00 9.52
2016-17 1,372,849.95 G12 G14 130.00 17.85
Sub Total 21.95
Captive Power Plant
2012-13 5,679,459.65 E F 210.00 119.27
2013-14 5,043,189.94 V(I) V(II) 60.00 30.26
2014-15 4,601,367.14 V(II) V(III) 70.00 32.21
2015-16 5,077,103.26 V(II) V(III) 70.00 35.54
2016-17 5,453,426.72 G13 G13 - -
Sub Total 217.28
Grand Total 239.23
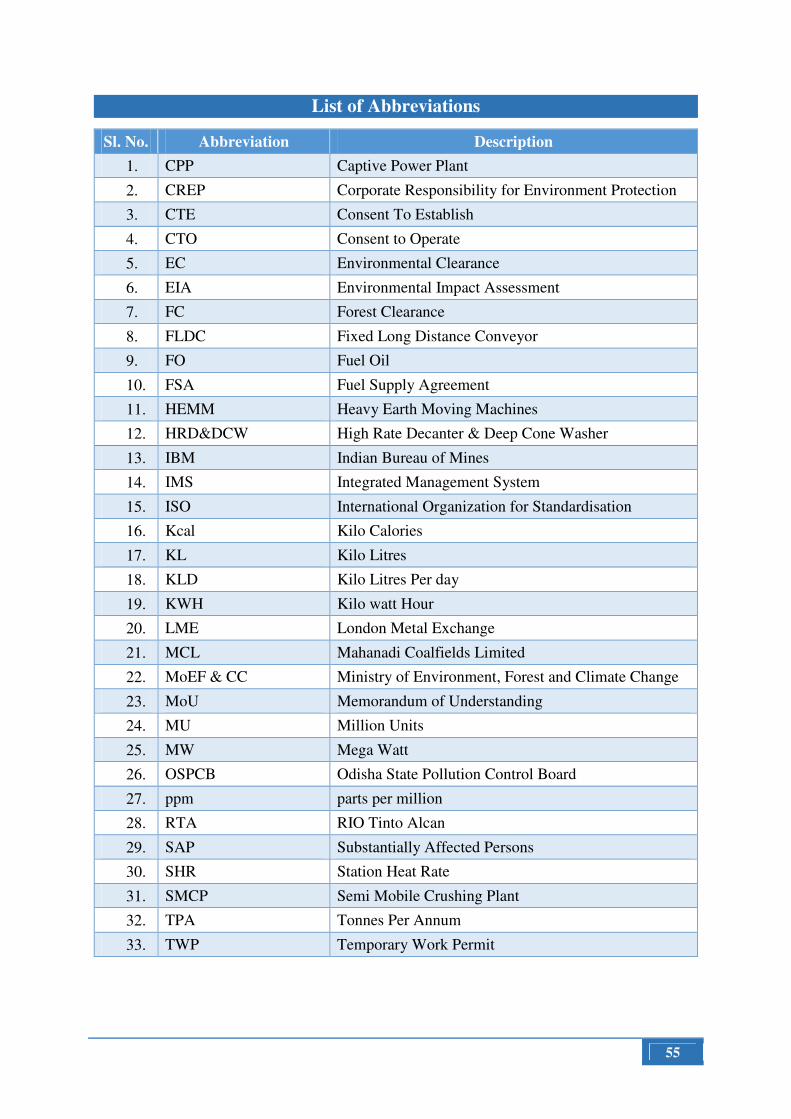
55
List of Abbreviations
Sl. No. Abbreviation Description
1. CPP Captive Power Plant
2. CREP Corporate Responsibility for Environment Protection
3. CTE Consent To Establish
4. CTO Consent to Operate
5. EC Environmental Clearance
6. EIA Environmental Impact Assessment
7. FC Forest Clearance
8. FLDC Fixed Long Distance Conveyor
9. FO Fuel Oil
10. FSA Fuel Supply Agreement
11. HEMM Heavy Earth Moving Machines
12. HRD&DCW High Rate Decanter & Deep Cone Washer
13. IBM Indian Bureau of Mines
14. IMS Integrated Management System
15. ISO International Organization for Standardisation
16. Kcal Kilo Calories
17. KL Kilo Litres
18. KLD Kilo Litres Per day
19. KWH Kilo watt Hour
20. LME London Metal Exchange
21. MCL Mahanadi Coalfields Limited
22. MoEF & CC Ministry of Environment, Forest and Climate Change
23. MoU Memorandum of Understanding
24. MU Million Units
25. MW Mega Watt
26. OSPCB Odisha State Pollution Control Board
27. ppm parts per million
28. RTA RIO Tinto Alcan
29. SAP Substantially Affected Persons
30. SHR Station Heat Rate
31. SMCP Semi Mobile Crushing Plant
32. TPA Tonnes Per Annum
33. TWP Temporary Work Permit