report of the joint rijkswaterstaat/dfo/ices workshop ...ices.dk/sites/pub/publication...
TRANSCRIPT

ICES WKRASM REPORT 2014 SCICOM STEERING GROUP ON HUMAN INTERACTIONS ON ECOSYSTEMS
ICES CM 2014/SSGHIE:01
REF. ACOM SCICOM
WGMPCZM
Report of the Joint Rijkswaterstaat/DFO/ICES Workshop:
Risk Assessment for Spatial Management (WKRASM)
24-28 February 2014
Amsterdam, the Netherlands

International Council for the Exploration of the Sea Conseil International pour l’Exploration de la Mer
H. C. Andersens Boulevard 44–46 DK-1553 Copenhagen V Denmark Telephone (+45) 33 38 67 00 Telefax (+45) 33 93 42 15 www.ices.dk [email protected]
Recommended format for purposes of citation:
ICES. 2014. Report of the Joint Rijkswaterstaat/DFO/ICES Workshop: Risk Assess-ment for Spatial Management (WKRASM), 24–28 February 2014, Amsterdam, the Netherlands. ICES CM 2014/SSGHIE:01. 35 pp.
For permission to reproduce material from this publication, please apply to the Gen-eral Secretary.
The document is a report of an Expert Group under the auspices of the International Council for the Exploration of the Sea and does not necessarily represent the views of the Council.
© 2014 International Council for the Exploration of the Sea

ICES WKRASM REPORT 2014 | i
Contents
Executive summary ................................................................................................................ 1
1 Opening of the meeting ................................................................................................ 2
2 Adoption of the agenda ................................................................................................ 2
3 Terms of Reference ........................................................................................................ 2
4 Introduction to the workshop...................................................................................... 2
5 Structure of the workshop ........................................................................................... 3
6 Bow-tie Analysis ............................................................................................................ 3
7 Canadian and European Applications of the Bow-tie Analysis ............................ 7
8 Conceptual Bow-tie Analysis in Cumulative Effects Assessments ...................... 8
9 Bow-tie Analysis Chaining ........................................................................................ 10
10 Bow-tie Analysis of Policy Objectives ..................................................................... 12
11 Risk Criteria and Risk Matrix in Decision-Making .............................................. 13
12 Assess the use of the Bow-tie analysis approach in risk evaluation of management options for achieving ecosystem objectives within a spatial management context ...................................................................................... 15
13 Develop a common understanding and language for evaluating management options in MSP .................................................................................... 19
14 Define needs for education and training of experts in applying the methods used in the workshop ................................................................................. 22
15 Concluding Remarks and Next Steps ...................................................................... 23
16 References ..................................................................................................................... 24
Annex 1: List of Participants............................................................................................... 26
Annex 2: Agenda ................................................................................................................... 28
Annex 3: WKRASM resolution for the meeting ............................................................. 30
Annex 4: Risk assessment techniques of IEC/ISO 31010:2009 ..................................... 32
Annex 5: European Commission directives and policy documents ............................ 34
Annex 6: Recommendations ............................................................................................... 35

ICES WKRASM REPORT 2014 | 1
Executive summary
The Joint Rijkswaterstaat/DFO/ICES Workshop: Risk Assessment for Spatial Man-agement (WKRASM) was attended by seventeen participants from Belgium, Canada, Germany, The Netherlands and the United Kingdom.
The workshop briefly discussed various methods of risk assessment and manage-ment to motivy the choice for elaborated discussions on the Bow-tie analyses and then analysed in detail the use of the Bow-tie analysis (IEC/ISO 31010) in cumulative effects (CEA) and cumulative impact assessments (CIA) in a marine spatial planning (MSP) context.
Key results and chapters of the report are:
1. Assess the use of the Bow-tie analysis approach in risk evaluation of management options for achieving ecosystem objectives in a spatial management context.
The workshop did not review in depth all of the potential uses of the Bow-tie analy-sis. However, the review did conclude that the Bow-tie analysis can be useful in the evaluation of the management options for achieving policy or ecosystem objectives within a spatial management context provided that the analysis is conducted by sub-ject matter experts skilled in the methodology and the relevant fields of science and policy.
In addition to integrating the CEA within a risk management framework, the Bow-analysis can lead to a better understanding of the risks and consequences of failing an ecosystem objective resulting from cumulative pressures. Subsequently, it can be used to identify and evaluate possible management options or scenarios that can be considered to either prevent the likelihood of not achieving the objectives or to miti-gate impacts as a result of failing the objectives. Participants concluded that the strength of the approach is to contribute to a more informed and effective decision-making process.
2. Develop a common understanding and language for evaluating management options in MSP.
In order to gain a better understanding and acceptance of the Bow-tie analysis in CEA, there is a need to bridge environmental and risk management terminologies. Such translation between the terminologies is needed before acceptance and use can become widespread. This also involves incorporating policy terminology from EU directives (in a European context), OSPAR, HELCOM and conceptual thinking of re-lated fields of science including natural as well as social and economic sciences.
3. Define needs for education and training of experts in applying the methods used in the workshop.
The group recognized that there are different levels of training needs which at this time is not an immediate priority. Generally, it is understood that there would be at least three levels of training if this type of analysis is introduced in marine spatial planning and management. The first level would be a comprehensive training pack-age that would enable scientific and policy experts to develop Bow-ties and to inte-grate scientific and policy information to create Bow-ties templates. The second level would be training that would allow technical staff to create Bow-ties from the tem-plates in relation to their specific planning and management activities. The thirds level would be training that would allow practitioners and industry to use and inter-pret Bow-tie’s in daily work or operations.

2 | ICES WKRASM REPORT 2014
1 Opening of the meeting
The Chairs, Rob Gerits and Roland Cormier, opened the meeting at 13:30 hours on Monday, 24 February 2014 and welcomed the participants to Amsterdam. Eric van Zanten provided information on housekeeping and technical facilities. A brief intro-duction of the participants followed. A list of participants is provided in Annex 1.
Mariska Harte, Manager, Department of Regulations, Rijkswaterstaat Sea and Delta (RWS) welcomed the participants and provided background information on planning problems in the Dutch North Sea which relate to the workshop theme. Andreas Kan-nen, chair of the ICES work group on marine planning and coastal zone management (WGMPCZM), explained why the work group proposed WKRASM given the context of earlier work done by WGMPCZM on risk management approaches in spatial planning of marine areas (ICES 2013a), such as Cooperative Research Reports and workshops related to ecosystem and coastal risk management (Cormier et al. 2013a, Cormier et al. 2013b), quality management (WKQAMSP: ICES 2012), and cultural eco-system services (WKCES: ICES 2013b).
2 Adoption of the agenda
A workshop agenda and a reader with several background materials were circulated in advance of the meeting. The agenda was adopted and adapted as in Annex 2.
3 Terms of Reference
WKRASM was guided by the following terms of reference (ToRs) (2013/2/ SSGHIE10) (Annex 3):
a) assess the use of the Bow-tie analysis approach in risk evaluation of man-agement options for achieving ecosystem objectives in a spatial management context;
b) develop a common understanding and language for evaluating management options in MSP; and,
c) define needs for education and training of experts in applying the method used in the workshop.
It was noted that the report is due by 7 April 2014 (via SSGHIE) for the attention of SCICOM. Further output from the workshop in the form of a Cooperative Research Report will be developed together with WGMPCZM, and is expected to be completed one year after the meeting of the work group.
4 Introduction to the workshop
In April 2013, WGMPCZM discussed the current state of knowledge and approaches regarding trans-boundary cumulative effect assessment (CEA) and cumulative im-pact assessments (CIA). The discussion identified the need for a tool that could pro-vide transparency and structure for these types of assessments and the evaluation of management options that would integrate these assessments in MSP for European regional seas incorporating regional ecosystem objectives.
The Bow-tie analysis was proposed as a possible tool for this type of evaluation. The Bow-tie analysis is one of the risk assessment and evaluation techniques (IEC/ISO

ICES WKRASM REPORT 2014 | 3
2009) of the ISO 31000 risk management suite of standards. It is presently being used by many industry sectors and regulators and has been in used in Canada for regula-tory and policy analysis in environmental management both in marine and freshwa-ter applications.
The workshop evaluated the use of the Bow-tie analysis in CEA applications in Euro-pean Regional Seas starting with a preliminary set of Marine Strategic Framework Directive (MSFD) indicators and GEnS criteria as well as OSPAR indicators related to marine mammals, birds, benthic fauna and fisheries stocks. The South-eastern North Sea was used as the study area using quality status reports and various impact re-ports. The cumulative effects of potential wind farm developments being planned over the coming decades was used as the risk scenario for the Bow-tie analysis in light of the present status of the indicators and the other drivers of human activities occurring in the area. The goal of the workshop provided recommendations to ICES and OSPAR as to the application of the Bow-tie analysis as a tool for CEA and devel-oping management options to reduce potential risks from large scale spatial devel-opments on MSFD indicators.
5 Structure of the workshop
The workshop was structured along 4 activities that included an overview of the ori-gins and methodology of Bow-tie analysis, a short training exercise, examples of its application in policy analysis and decision-making risk criteria, and breakout group activities focused on a case study in the North Sea within a European MSP trans-boundary context. Scientists and managers involved in CEA evaluated this approach using wind farms and bird strikes as the assessment end point. It should be noted that some of the participants had extensive experience in using the Bow-tie approach while others had little or no experience.
6 Bow-tie Analysis
The Bow-tie analysis is listed as a risk assessment technique of the IEC/ISO 31010:2009 standard (IEC/ISO 2009). It is part of a suite of standards of the ISO 31000 risk management standard which includes frameworks and vocabulary (ISO 2009a, 2009b). The ISO 31000 risk management standard integrates the risk assessment function within the context of the risk management process, supported by communi-cation and consultation as well as monitoring and review. Compared to classical eco-logical assessments, the risk assessment function of the standard is further subdivided into risk identification, risk analysis, and risk evaluation. The ISO 31000:2009 risk management standard has been introduced to regulatory and policy frameworks as a means to better manage risks (GRM 2012). Based on analysis of vari-ous ecosystem risk assessment and risk management frameworks, the ISO 31000:2009 was recently linked to the ecosystem approach to management (Cormier et al. 2013a) (Figure 1). Within an ecosystem context, risk identification is used to identify the ecosystem vulnerabilities in relation to pressures generated from activities of the drivers operating within the boundaries of the ecosystem. Risk analysis is used to characterize the likelihood and magnitude of the ecosystem and socio-economic im-pacts, with additional consideration to existing regulations and policies used to man-age the risks along the pathways of the causes and their effects. Risk evaluation is used to ascertain the severities of the risks to determine if status quo is acceptable or if there is need for additional or enhanced management measures.

4 | ICES WKRASM REPORT 2014
Figure 1. Ecosystem risk management approach adapted from ISO 31000:2009 risk management standard (Cormier et al. 2013, ICES 2013c).
Based on IEC/ISO 31010:2009, the Bow-tie analysis is:
“A simple diagrammatic way of describing and analysing the pathways of a risk from hazards to outcomes and reviewing controls. It can be considered to be a combina-tion of the logic of a fault tree analysing the cause of an event (represented by the knot of a Bow-tie) and an event tree analysing the consequences.”
The origin of the Bow-tie diagram is found in the petro-chemical industries as a haz-ards analysis technique from the early 1980s (CGE 2014). It was later adopted as an industry standard to manage the risks related to potential catastrophic events in the oil and gas industry and to provide a systematic approach of assuring control over these hazards. Since then, the Bow-tie analysis has been adopted by a broad range of industry sectors including aviation, mining, maritime transportation, chemical pro-cessing and health care.
With the development of the ISO 31000 risk management standard (ISO 2009a), the Bow-tie analysis was included as one of more than 25 risk assessment techniques listed in the IEC/ISO 31010 risk assessment standard (IEC/ISO 2009); (Annex 4). In Canada, the selection of the Bow-tie analysis was based on a review of the techniques in the standard. The selection was based on the need for a technique:
• that could be used for the risk evaluation of management options within a legislative and policy risk management framework;
• that could be used within a management context operating under uncer-tainty and complexity;
• that could integrate quantitative methods in the analysis; and, • that could be used by operational staff and industry without specialized
training.

ICES WKRASM REPORT 2014 | 5
Bow-tie Analysis Methodology
The Bow-tie analysis is applicable to consequence analysis as well as qualitative or quantitative probability and severity estimations. It is particularly applicable to as-sessing and evaluating the effectiveness of existing controls. As a controls assessment tool, it is considered as a valuable approach in the determination of the nature and degree of uncertainty related to the pathways of risk and their controls (Figure 2).
Figure 2. Bow-tie analysis conceptual diagram.
The Bow-tie analysis can be used to analyse and communicate the relationships in high risk scenarios. The Bow-tie consists of plausible risk scenarios within a certain context, and illustrates ways in which an organization can take action to prevent these scenarios from happening or enhance their readiness to respond if they occur. Risks beyond the tolerance of the organization would typically be evaluated with a Bow-tie analysis. It should be noted that the origin name for the method is based on the fact that it looks like a Bow-tie.
The Bow-tie analysis supports a number of goals such as:
• providing a structure for the systematic analysis of the source of a risk, be-ing an undesired event as well as their causes and consequences;
• facilitating the identification of control measures that are necessary to pre-vent an undesired event from occurring as well as the identification of the controls measures to mitigate or recover from the consequences that may result from an undesired event;
• contributing to enhanced communication and awareness of the risks and their management;
• informing management of existing controls and their performance; and, • evaluating the need for additional control measures as well as designing
effectiveness monitoring of implemented control measures.
Bow-tie Analysis Elements
A Bow-tie contains several key elements that are crucial for its proper use as a risk management methodology. Bow-ties start with a hazard, the operational context, and an undesired event or “top event”. A hazard is technically the source of the risk that can cause the undesired event. An adequate description of the source of the risk

6 | ICES WKRASM REPORT 2014
should not be too specific (generating a lot of small hazards difficult to manage) or be too generic (not framing the risks of concern).
• Undesired Event or “Top Event”: The undesired event is the top event that describes the loss of control over the hazard or the risk source.
• Consequences: The consequences are the potential harmful impacts that may occur as a result of the top event. A top event can lead to multiple conse-quences.
• Causes: Based on the source of the risk, each cause represents a scenario that can lead to a top event. There may be multiple causes that can independently bring about the top event. The causes may also occur at different time scales, and in some cases can take several years before they manifest themselves.
• Barriers: On the left side of the top event, barriers are the prevention controls inserted to reduce the likelihood of a top event occurring. On the right side of the top event, additional barriers are the mitigation and recovery controls inserted to reduce the repercussions or severity of the consequences as a re-sult of a top event. Typically, the repercussions and the severity of the con-sequences may be expressed in terms of people, assets, environment, and reputation.
• Escalation factors: These are factors that can undermine the effectiveness of a barrier or cause it to fail. Escalation factors are important elements to consid-er in a Bow-tie analysis as they focus attention to intrinsic design weaknesses as well as to outside influences. It should be noted that escalation factors were not discussed extensively in the workshop.
Based on all potential scenarios, barriers are implemented to act on all possible links between the causes, the top event and the potential consequences. The position of the barriers can be considered as follows:
• The first set of barriers is placed between a causes and the top event. These barriers are meant to prevent the causes from creating a top event by elimi-nating, avoiding or controlling the causes (e.g. reduce the likelihood of a top even such as a change in state of the ecosystem). These barriers are often re-ferred to as preventive barriers.
• The second set of barriers is placed between the top event and the conse-quences. These barriers are meant to mitigate or recover from the conse-quences as a result of the top event (e.g. reduce the magnitude or severity of the impacts to ecosystem features or functions or to ecosystem services). These barriers are often referred to as mitigation or recovery barriers.
• The third set of barriers is placed between a barrier and an escalation factor. These barriers are meant to prevent the escalation factor from causing the other barriers to fail (e.g. reduce the likelihood of a barrier failing).

ICES WKRASM REPORT 2014 | 7
7 Canadian and European Applications of the Bow-tie Analysis
In Canada, the Bow-tie analysis was adapted for regulatory and policy analysis as well as environmental management because it integrates scientific and technical risk assessments within a policy and management context. Being a practical application of a risk management framework, it was found to be particularly well adapted at in-tegrating the evaluation of management options considering ecosystem risks and ex-isting management strategies.
Bow-tie Analysis in Environmental Regulatory Decision-Making in Alberta
As part of the workshop presentations, representatives of Alberta Environment and Sustainable Resource Development (a sub-national department and regulatory au-thority in the province of Alberta in Canada) shared their experiences using Bow-ties as a tool in environmental regulatory decision-making.
Adoption and Application
The Department of Environment and Sustainable Resources began to use the Bow-tie analysis in 2008 to manage operational, tactical, and strategic-level risks. The Alberta approach for risk management was to learn from sectors that excel at risk manage-ment, and adopt their best practices and methods to the policy and regulatory con-text. The Bow-tie approach was adopted to enable informed action on risk reduction. The method was seen as a structured approach that organizes information from a variety of sources to determine management or regulatory gaps and prioritize risk management actions.
In Alberta, the Bow-tie analysis is used primarily to inform policy and regulatory de-cisions and is particularly useful for improving the management of shared risks. These risks fall within the purview of multiple authorities and cannot be adequately managed by any single organization. The Bow-tie approach is effective at showing multiple responsibilities in complex, multi-agency risk management. It enables col-laboration by ensuring a common understanding and allowing the various parties to work collaboratively in designing an effective and efficient management solution. It also limits the tendency to call for new regulations by demonstrating the many con-trols that are often already in place. The focus of Bow-tie discussions then turns to collaborative solutions to aligning and improving existing management systems.
Criteria for Decision-Making
The role of clear and explicit risk criteria in decision-making is critical. Criteria re-move personal bias by ensuring that the level of risk assigned to the process is based on the organization’s perspective, rather than those of individuals—since the impact and likelihood of a risk is determined by predefined criteria rather than individual perceptions. The criteria also allow an organization to ensure that different areas of impact (social, environmental, economic, legal, and reputational) are considered equivocally.
Consequences of a risk event are described as part of the Bow-tie process. The impact of these consequences is then assessed with the risk criteria, across the various cate-gories (social, environmental, etc.). This allows for a broader understanding of the policy implications of an ecological issue (e.g. the major economic costs that could be associated with an alien invasive species). The Bow-tie method captures these impli-cations, and provides decision-makers with a clear picture on the risk within the cur-

8 | ICES WKRASM REPORT 2014
rent management system that is in place (including potential gaps), and the multiple potential impacts of the risk.
European Marine Examples of Bow-tie analysis
Under the EU FP7 project VECTORS (Vectors of change in the marine environment), the Bow-tie analysis is being used in risk analysis for two major case-studies being used as illustrations for other potential events. Firstly, it is being used to assess the risk of the failure of wind farms on the Dogger Bank (North Sea) due to extreme events related to climate change (IECS, University of Hull, UK, and unpublished). Secondly, the CNR, Oristano, Sardinia is using Bow-tie analysis to look at the causes and consequences of the failure of the local but important sea urchin fishery. These events are being judged against scenario-testing for the period to 2050 in which the scenarios are derived from those for the Millennium Ecosystem Assessment.
8 Conceptual Bow-tie Analysis in Cumulative Effects Assessments
The terms cumulative effects and cumulative impacts within an assessment context are often used interchangeably. Often considered within a project specific context, cumulative impacts tend to focus attention on the combined impacts within the foot-print of a project (Duinker and Greig 2006, Connelly 2011). In part, the difficulty is in linking thresholds and indicators of effects at an ecosystem scale to regional man-agement requirements, and to controls implemented at operational or project scale. In the EU, there are several directives and policies that have definitions related to cumulative effects and cumulative impacts and their assessment (Annex 5).
Integration of DPSIR/DPSWR in the Bow-tie Diagram
As a means of bridging the language of risk management of the Bow-tie analysis to environmental management, the DPSIR/DPSWR (Cooper 2013; Atkins et al. 2011) was used to define the elements of the Bow-tie diagram. This formed the basis for discus-sions and the development of the Bow-tie diagrams during the workshop.
Conceptually, Bow-tie analysis of cumulative effects and cumulative impacts were based on the premise that multiple Drivers generate Activities that exert Pressures which may cause cumulative effects. The cumulative effect may subsequently lead to multiple impacts to the integrity of ecosystem features and functions (the S as State Change in DPSIR), and, ultimately to the welfare of ecosystem services valued by humans (the I as Impact or W Welfare changes to the human system) (Figure 3). In a Bow-tie analysis, the source of the risk is based on the fact that Drivers are generating Activities in the marine environment. Subsequently, the Pressures resulting from these Activities have the potential of directly causing effects. Effects, however, may cause multiple and varied Impacts. The Bow-tie examples discussed during the work shop were based on this conceptual frame to define the Causes, Top Event, Conse-quences and Barriers related to a Risk Source (Figure 4). It should be noted that Figure 4 and the subsequent figures have been generated by the commercial Bow-TieXP software (BowTieXP, 2014).
Drivers (driving forces) are considered as the social, cultural, economic, and regula-tory forces that drive human activities in the ecosystem or planning area. These are typically referred to as industry sectors or agents of development such as marine transportation, energy, agriculture, fisheries, or tourism. The activities of the drivers operating in or around a marine ecosystem boundary are technically the Risk

ICES WKRASM REPORT 2014 | 9
Sources for the Bow-tie analysis. If there are no activities or drivers, for that matter, occurring within the marine ecosystem boundaries or within the zone of influence of the ecosystem there are no environmental or ecosystem sources of the risks.
Pressures are considered as the physical, chemical, or biological agents that are intro-duced or discharged into the ecosystem as the result of the activities of the Drivers, such as the quantity or frequency of released wastewater, sediment and fertilizer run-off, biomass removal, or aggregate being extracted. In the Bow-tie analysis, Pressures are considered as the Causes of the Event.
State change is considered as changes to the integrity of the environment or ecosys-tem as a result of the Pressures in terms of disruption, alteration, or degradation. In the Bow-tie analysis, the change to the State of the ecosystem integrity is considered as the Top Event that should be avoided. These may be expressed in relation to eco-system or conservation objectives as well as strategic sustainability outcomes such as the Good Environmental Status1 or OSPAR ecosystem quality objectives2.
Impacts are the consequences of the changes in the State of the environmental or eco-system integrity to society; in terms of ecosystem or biodiversity Impacts including impacts to cultural, social and economic ecosystem services Welfare. In the Bow-tie analysis, Impacts (on the human system) are considered as the Consequences of the changes that may occur if the Top Event occurs.
Responses are the management measures implemented to either prevent the Pres-sures from changing the State of the environment or ecosystem or to mitigate the Impacts to the societal aspects of the ecosystem or ecosystem services (i.e. Welfare). For example, Reponses can typically be regulations, policies, governance, economic instruments, best management practices, standards, and stewardship or even educa-tion strategies. In the Bow-tie analysis, Responses are the Barriers that are imple-mented to prevent the Causes from triggering the Top Event or to mitigate the magnitude or severity of the Consequences if the Top Event occurs.
Figure 3. Bow-tie Analysis conceptual framework adapted from Cormier et al. 2013.
1 EU. 2010. Commission Decision of 1 September 2010 on criteria and methodological standards on good environmental status of marine waters [notified under document C(2010) 5956] (Text with EEA relevance 2010/477/EU). Official Journal of the European Union, L 232/14. 2 OSPAR Ecosystem Quality Objectives http://www.ospar.org/content/content.asp?menu=00690302200000_000000_000000

10 | ICES WKRASM REPORT 2014
Figure 4. Bow-tie representation of the DPSIR/DPSWR framework.
9 Bow-tie Analysis Chaining
As mentioned earlier in the text, the Top Event (Effects) or the Consequences (Im-pacts) of one Bow-tie can become Causes (Pressures) or contribute to (or even be-come) the Top Event (Effects) of another Bow-tie. Such “chaining” of Bow-tie diagrams can be used to map the risks and the management measures from the oper-ational scale of a project to the regional scale of the management area to the ecosys-tem scale. Chaining can then facilitate the assessment of the net cumulative pressures (ICES 2012) of multiple project operations to cumulative effects related to the man-agement objectives of a given area, and, ultimately contribute to achieving ecosystem objectives at the scale of the ecosystem (Figure 5). In terms of management strategies, chaining Bow-ties can ensure that overall sustainability, ecosystem, or conservation objectives are traceable back to regional management plans down to operational guidelines, standards, and procedures. The Bow-tie analysis can be used to identify scientific and technical knowledge gaps and research needs as well as to provide the basis for environmental monitoring and compliance surveillance. They technically frame and support strategic, tactical and operational integrated management ap-proaches to achieving objectives.
In the example of Figure 5, the Bow-tie analysis shows that birds may be struck by the blades of horizontal-axis utility-scale wind turbines which can cause lethal and sub-lethal effects on those birds. The Bow-tie analysis then links the consequences of the wind turbine to the regional pressures generated by wind farms that may cause cumulative effects on the bird populations. Finally, the Bow-tie analysis links the regional consequences to ecosystem scale pressures generated by multiple human activities that may cause effects on the biodiversity.

ICES WKRASM REPORT 2014 | 11
Project Specific Bow-tie Analysis (Operational)
Regional Bow-tie Analysis (Tactical)
Ecosystem Scale Bow-tie Analysis (Strategic)
Chained Bow-tie analysis describing the cumulative effects of multiple drivers.
Figure 5. Bow-tie analysis of chained Top Events within the context of cumulative effects assess-ment.

12 | ICES WKRASM REPORT 2014
10 Bow-tie Analysis of Policy Objectives
As mentioned in the previous sections, the Bow-tie analysis can be used to map poli-cies to management strategies down to operational control measures. In the work-shop, participants discussed examples related to the Good Environmental Status (GEnS) criteria of the Marine Strategic Framework Directive (MSFD) and the OSPAR Ecosystem Quality Objectives (EcoQO) (Borja et al., 2013). Examples of the Bow-tie diagrams are presented in Figures 6 and 7.
Figure 6. Bow-tie analysis of the Good Environmental Status criteria of the MSFD for Descriptor 9: Contaminants in Fish and Seafood.
A Bow-tie analysis of the 11 GEnS descriptors demonstrated that the descriptors have inter-dependencies that chain them together to the ultimate effects at the level of De-scriptor 1: Biodiversity (Figure 6). In understanding the inter-dependencies, the chained Bow-tie diagrams could then be used to guide trans-national marine spatial planning initiatives to ensure that the most significant risks are addressed by the most appropriate management strategy and location. The chained Bow-ties also pro-vide clarity as to where and how along the risk pathways do specific indicators play a role.
Figure 7. OSPAR EcoQO Context.

ICES WKRASM REPORT 2014 | 13
The Bow-tie analysis of the OSPAR EcoQO demonstrated how and where the various indicators are mapped to pressures, effects, or consequences. In this case, the indica-tors are more an indication of the effectiveness of management measures than im-pacts.
It should be noted, however, that the GEnS criteria and EcoQO indicators would have to be adapted to consequence statements that are typically found in Bow-tie analysis. They should express or describe the consequence or the impact instead of a descrip-tion of the indicator.
11 Risk Criteria and Risk Matrix in Decision-Making
As discussed in during the Alberta application of risk management and the Bow-tie analysis, risk criteria define and classify the severity of the risks expressed in increas-ingly larger magnitudes of severity or impacts (Table 1).
Table 1. Example of cultural ecosystem service risk criteria (ICES 2013b).
Level Cultural Ecosystem Services
Extreme A permanent or long-term damage to a cultural ecosystem service that would undermine the cultural integrity of the community. The result of which would create long-term loss of trust accompanied by a significant unwillingness to cooperate on marine planning issues.
Very high An impact to a cultural ecosystem service that would require extensive additional management measures to mitigate the consequences to the cultural integrity of the community. The result of which would create significant loss of trust and strong resistance to collaborate. Agreements would not be achievable and negative impacts on other marine planning activities.
Medium An impact to a cultural ecosystem service where existing management measures can control the consequences to the cultural integrity of the community. The result of which would create some loss of trust and resistance to collaborate in the marine planning activity. Agreement would not be achievable.
Low An impact to a cultural ecosystem service where existing management measures can avoid any consequence to the cultural integrity of the community. Agreements on approaches can be achieved in collaboration with the community of interest with specified additional management measures.
Negligible Impacts to a cultural ecosystem service are at a level that does not hamper the capacity of the service to its cultural functions without any potential consequence to the cultural integrity of the community. An agreement is achieved with all participants without any further management measures.
These provide a common benchmark for any organization having to make risk-based decisions avoiding debates between people involved in the various aspects of plan-ning and management processes because of their personal perceptions and tolerances to the risks. Although they would need to be developed, risk criteria for ecological features and functions would greatly facilitate the communication of the severity of the impacts.
The risk matrix defines the tolerability or the acceptability of each likelihood and se-verity combinations in terms of the need for taking management action. Typical risk matrices use three to four colour schemes. For example, green could be translated as no need for management actions, yellow as maintain management measures, orange as additional management measures required or red as the risk is not acceptable. The

14 | ICES WKRASM REPORT 2014
tolerability scheme (colour layout) of the risk matrix is usually tailored to the type of risk-decision-making (Figure 8).
Figure 8. Examples of tolerability levels of various risk matrices reflecting a management decision scenario.
For example, a scientific review panel would conduct an ecological risk assessment to estimate the likelihood and magnitude of a cumulative effect and their impacts relat-ed to the existing management measures (I), of the preventive management option (P) and of the mitigation management option (M) being considered. Given that a sci-entific assessment is objective and is based on facts, it would simply reflect likelihood and magnitude leaving the severity, tolerability or values to the governance decision-making processes and stakeholder constituency (Figure 9). Once the assessment re-sults are overlaid on the risk matrix, the tolerability of the each management options would then be reflected and used to inform the decision-making process as to the acceptability of the options. A risk matrix does not make the decision. It facilitates the comparisons and understanding of the resulting risks and tolerability for each management options under considerations.
Figure 9. Risk criteria to defining the resulting severity of the management options under consid-erations versus the risk matrix showing the management options against the tolerance criteria for decision-making.
In this workshop, the criteria were discussed in terms of the evaluation of the man-agement options within the context of a Bow-tie analysis.
ICES WKRASM REPORT 2014 | 15
12 Assess the use of the Bow-tie analysis approach in risk evalua-tion of management options for achieving ecosystem objectives within a spatial management context
One of the aims of the workshop was to assess the use of the Bow-tie analysis in risk evaluation of management options for achieving ecosystem objectives within a spatial management context.
The discussions of the workshop participants are presented in the following 4 discus-sion topics:
1. Aspects of risk evaluation of management options
2. Achieving ecological objectives
3. Applicable in an MSP context
4. Advantages of the method for gaining acceptance
1. Aspects of risk evaluation of management options
The central questions were:
• Does the Bow-tie analysis help structure the information? • Does the Bow-tie analysis bring together science and management options? • Does the Bow-tie analysis help inform the decision-making?
The Bow-tie analysis appears to be a helpful method and instrument for structuring varied and multi-faceted information. It coherently brings together information from different disciplines and different levels into a transparent, logical and defendable framework. This is important in the MSP context which necessitates the cooperation of different disciplines operating at different scales and levels (e.g. local-regional-international-ecosystem scales; operational-tactical-strategic levels). By integrating and sharing this information in a well-structured diagrammatic representation, it builds on mutual understanding between experts and practitioners from different disciplines that need to work together on the formulation and prioritisation of risk based management options for decision-making.
Apart from structuring information on risks and management options, it also docu-ments the legislation and policies used for management as well as accountabilities for implementing the management measures supporting the evaluation of management options to address gaps or impediments.
Bow-ties can bridge science and management. The analysis needs scientific input for identifying and assessing the risks, evaluating management options and, integrating ecological, social, economic, and legal sciences. It has the ability to integrate the re-sults from modelling (see section 13 for an elaboration on this subject). Similarly, Bow-ties can highlight gaps in available information and help direct future research.
Through the process of structuring information at different levels and from different disciplines, building the initial Bow-ties can be time consuming and require profes-sional training (see also section 14). At first glance, completed Bow-ties that deal with multi-faceted issues can appear complex. However, once a series of reference Bow-ties have been completed, subsequent analysis can build upon these Bow-ties increas-ing the efficiency of doing analysis for new management areas and context.

16 | ICES WKRASM REPORT 2014
Bow-tie software enables practitioners to present and visualise complex analysis in a structured and focussed way to decision makers. Hence, it is an excellent way to pre-sent management options that integrates management regimes from different coun-tries legislative configuration, which can be important within an MSP context that has to deal at an operational, tactical and, strategic level.
2. Achieving ecological targets
The Bow-tie analysis sets the ecological targets (literally) as the focal point of the analysis (e.g. as the centre of attention). However, the challenge is in the accurate and relevant identification of the “top event” or the context in order to avoid doing the analyses on risk sources or objectives that have nothing to do with the planning initi-ative. This requires subject matter expertise in the structuring of the process.
In terms of doing a Bow-tie analysis effectively and accurately, there were potential issues or weaknesses that were identified during the workshop:
• The lack of clarity around the undesired ecological event or wanted eco-logical situation or objective;
• Confusion around the spatial scale to be used for the gathering and analys-ing of information;
• Confusion around the disassembly, analysis, and then reassembly of com-plex adaptive ecosystems; and,
• The quality of the information used since the Bow-tie is only as good as the background understanding of (ecological) science and management used to generate it.
It is noted, however, that most of these issues or weaknesses are not unique to the Bow-analysis. These points are simply highlighted as general points and would apply to any ecological risk analysis for identifying management options.
3. Applicable in an MSP context
MSP processes can be characterized as processes balancing mutual interests of the involved stakeholders where the ultimate decision and accountability lies within the political and public policy levels. From a practical sense, the MSP process is aimed at integrating spatial solutions and regulating human uses of the sea while protecting marine ecosystems. Thus, a variety of scientific and technical disciplines is needed to deliver the full set of information to inform for decision-making.
The Bow-tie analysis can help to integrate knowledge and science from disparate sources and thus aid in structuring the questions that arise during the marine plan-ning activities. As a consequence of its application, it is valuable for communicating the logic or reasoning behind the decisions that have to be taken in order to prevent an undesired ecological event.
Using a process supported by subject matter experts, risks and management options can be identified in consultation with stakeholders. Because of its transparency and visual nature, it is even an excellent method and instrument (if supported profession-ally) for stakeholder engagement that leads to a common understanding of conflicts and to a transparent evaluation of potential management options as we as setting priorities.
Although the visual presentation of the Bow-tie is straight-forward, its simplicity can be deceptive to some degree. The proper framing of the risk source, the wording of the central top event and subsequent application to the appropriate level of detail
ICES WKRASM REPORT 2014 | 17
means that the initial development of a bow-tie can be complex. However, the ap-proach is fit for the purpose of integrating and structuring complex multi-level and multidisciplinary information in a diagrammatic representation that facilitates analy-sis (also see next section).
4. Advantages of the method for gaining acceptance
In considering the Bow-tie analysis suitability for CEA and MSP, additional ad-vantages were identified during the workshop. In addition to enhancing the efficien-cy of CEA and MSP activities, the Bow-tie analysis has additional advantages that should be considered:
• It is already widely used in a broad range of industry sectors, and will therefore be accepted more easily by these sectors if used in stakeholder involvement. Given that the method is part of the IEC/ISO 31010 standard, it provides assurance that the approach was developed along high quality standards.
• Reference Bow-ties designed for specific management contexts or areas could enhance the efficiency of many planning processes as they would provide start up templates and could even have an integrated library of legislation and policies. In addition, they would help to develop a common language between different industry sectors, stakeholders and countries. Such reference standards will require acceptance across a broad constitu-ency of users and will require a high design standard.
• Bow-tie software such as BowTieXP can store and integrate entire libraries of scientific, technical and policy information ensuring transparency in the decision-making processes.
The Bow-tie analysis is not a new method. It has been developed and in use by indus-try for quite some time and is already being used in environmental management in Canada. This provides a sound basis of expertise and know-how that can help in the application and acceptance of the approach within a European context. In addition to similar ecosystem management needs and situations, the federal and provincial gov-ernance structures in Canada are comparable to the European situation given the re-lation between the states and the EU in the North-western part of Europe.
It should be noted that the software (only available for the WINDOWS OS) is profes-sionally supported and has a pricing scheme that is related to the type and level of analysis and use needed.
Conclusions and next steps
The workshop did not fully analyse in depth the use of the Bow-tie analysis. Howev-er, the review did conclude that the Bow-tie method is useful in CEA and in the risk evaluation of management options to achieve ecosystem objectives within a spatial management context. The workshop also concluded that such analysis should be supported by trained subject matter experts.
Using the Bow-analysis in CEA leads to an integration of the assessment into the management function that, until now, were conducted and considered separately. The Bow-tie analysis will:
• allow users to assess the risks of a comprehensive set of pressures that are linked and that may lead to a (possibly) undesired change in the state of the ecosystem and, thus, fail to meet ecosystem objectives;

18 | ICES WKRASM REPORT 2014
• allow a comprehensive overview and evaluation of management options (physical measures, licensing, etc.) to prevent the undesired effects of the pressures or to mitigate impacts of these effects;
• provide an overview of the failure mechanisms of management options be-ing considered in the planning process;
• allow users to comprehend and monitor the effectiveness of the manage-ment options in terms of ecosystem objectives including economics and so-cial aspects as well as reputation and presumed stakeholder positions; and,
• provide insight into the knowledge gaps that needs to be addressed lead-ing to relevant research priority needs being identified.
A Bow-tie is a diagrammatic representation of the complex relations between the risks and management that can lead to better communication and understanding of the risks with third parties. Furthermore, it facilitates regulatory discussions with industry because the Bow-tie is an ISO standard method, developed for industry uses.
Hence, using the Bow-tie analysis to integrate CEA’s and CIA’s within a risk man-agement approach can lead to a better understanding of the repercussions of failing an ecosystem objective as a result of cumulative pressures highlighting possible man-agement options to prevent the effects or mitigate the impacts. Therefore, it can strongly facilitate the decision-making process.
Participants agreed that working towards a broader understanding and acceptance of the methodology is among the first priority being suggested:
1. To start with, it would be preferable to elaborate a more detailed Bow-tie of existing legislation and policies of a regional European sea within an MSP context integrating MSFD goals and GEnS criteria. This would provide the basis to further understand how the method is used in policy analysis in terms of identifying policy opportunities and impediments within multi-jurisdictional context.
2. It is being suggested that a bilateral Bow-tie analysis could be done between Belgium and the Netherland in relation to MSFD indicators for marine mammals. In such a case study, a Bow-tie analysis would also provide in-sight in the efficiencies that could be gained and opportunities for further de-velopment.
3. Bow-tie analysis can incorporate the outcomes studies that are based on modelling. It is suggested that further work be done to integrate ecological CEA models within the Bow-tie analysis on a regional sea scale.

ICES WKRASM REPORT 2014 | 19
13 Develop a common understanding and language for evaluating management options in MSP
The Bow-tie approach helps to structure information and, thus, helps to gain joint understanding and facilitate joint problem framing among a group of experts, stake-holders and policy makers. At the same time a Bow-tie is a conceptual integrator bridging information from science and policy. While the assessment of any area or problem can be seen as a product of scientific research, the management of the risks identified in assessments requires an evaluation of management options that would include rules of management, regulatory regimes or economic incentives as a suite of management tools. Even though the Bow-tie approach is not the only approach to integrate diverse information, its particular strength is in bridging science and policy making. Not only does it require linking of several sets of qualitative and quantita-tive information, it must also link the rules, conceptual models and languages of sci-ence and administration.
In addition to providing a consistent framework, The Bow-tie analysis will force the development of a common framing of the problem around key components. It is likely that, if a common language is developed around such a framework, this will facilitate discussions across disciplines and jurisdictions and contribute to the devel-opment of a shared knowledge base. This in turn, it can increase efficiency in spatial planning and management and offer a way to combine different approaches from different countries and different legal systems, building upon completed Bow-ties from another planning initiative. This again is highly relevant in the context of the transnational nature of a wide range of issues facing MSP such as cumulative impacts on ecosystems from wind farm development along the shores of most North Sea countries (Kannen 2012), and in the implementation of directives such as the MSFD.
An advantage of the method (although not unique) and in particular the Bow-tieXP software package is that it allows to store all information (conceptual model of the problem to tackle, related data and related documents such as legislative documents, assessment reports, etc.) in one place and easily accessible (BowTieXP 2014).
One critical point in applying the approach is its use is the requirement to adequately frame and determine the expected outcomes. Particularly, since the framing of issues is critical and, in reality, differs significantly between different government agencies, NGOs, industry, other actors and stakeholders. Workshop participants also noted that not all actors speak the same language, not only in terms of terminology, but also with regards to ideology. For example, it can be also observed that some stakeholders might not speak in “spatial” terms, “environmental” terms or “administrative” terms (Kannen et al. 2013). In addition, the risks associated with the decisions varies and, therefore, the criteria used for risk assessment and decision-making can be different or interpreted differently. Developing Bow-ties is, by necessity, a team effort, which is best performed in a well-designed participatory process, involving, ideally, all rel-evant actors and stakeholders from several disciplinary perspectives. The core of the Bow-tie is the formulation of the policy question and the problem definition of what is the problem. In order to recognise this and bridge language barriers between dif-ferent societal actors and/or scientific disciplines, Bow-ties need to be developed along one or even a set of well-designed and moderated processes if they are ex-pected to provide widely accepted outputs for management and policy making.
Workshop participants raised a number of questions regarding the Bow-tie’s ability to incorporate feedback loops in complex adaptive systems, like the North Sea envi-

20 | ICES WKRASM REPORT 2014
ronment. It was noted that this was a challenge for any methodology, however. Simi-lar comments were voiced regarding the reductionist approach of the Bow-tie, even though the benefits of a simplified representation for decision-makers were also seen as a benefit of the tool. The discussion concluded with comments regarding the need to balance complexity and simplicity—reflecting both the intricacies of ecological sys-tems and the management decisions.
Apart from the above, one conceptual constraint relating to scientific theory was raised during the Bow-tie development exercise during the workshop. The approach is limited when incorporating feedback loops (e.g. a consequence resulting from a particular set of pressures turns into a pressure for other consequences). This point towards a general conceptual problem of all such integrating approaches: Because the approach focuses on outcomes for decision-making as its main aim (e.g. identifying regulatory gaps in reducing pressures or mitigating effects), it is reductionist simpli-fying system behaviour significantly. The approach aims to create informed deci-sions based on structured information and therefore reduces the complexity inherent in social and natural system behaviour. Technically, some (mainly structural) ele-ments of complexity such as feedback loops can be recognised in the approach, but then lead to a huge set of nested Bow-ties, which implies that the advantage of rela-tively simple visualisation of relationships is significantly reduced to a degree where the model might not serve any more the purpose for which it has been developed. On the other hand, deconstructing complex environments and then reassemble them in a simplified way are sensitive and lead into perilous territory. There is a need to balance reductionism and complexity and show both, complexity as well as simplici-ty. Therefore, awareness of the process in which the Bow-tie is contextualized and related uncertainties needs to be clear identified. However, this problem is not exclu-sive to the Bow-tie approach, but shared among all similar approaches and relates mostly to the complexity of the behaviour of those natural and social systems that spatial and environmental planning deal with.
The ability of the Bow-tie analysis to incorporate quantitative modelling was also dis-cussed. Presenters shared their experience of incorporating productivity curves into the Bow-tie model. The challenges associated with spatial modelling, and the neces-sity of being clear on the spatial level being assessed, was highlighted by participants.
A constraint, that might be resolved with further development work on the approach is how modelling can be included: Could and should modelling become an integral part of Bow-tie analysis or does it merely serve as an additional set of information, whose results feed the scientific information that underpins relationships between threats (pressures), control measures, state changes (or top events in Bow-tie termi-nology) and consequences (or impacts)? Technically, certain type of models such as productivity curves can be incorporated, although this would in and by itself be a significant amount of work. It is even more complicated to incorporate spatial mod-elling. However, integrating models is not only a technical question, but as much a question of language and concepts along which models have been developed and how these can be incorporated into the overall Bow-tie approach.
One of the major concerns voiced during the workshop was the necessity for clear language and shared understanding of terms used in the Bow-tie analysis. Various disciplines bring a broad suite of terms, concepts, and language to the MSP context. Participants noted the challenges of bridging between these fields, mental models, and taxonomies, but suggested that dictionaries, use of skilled facilitators, and other best practices could ensure that the Bow-tie effectively brings together the variety of

ICES WKRASM REPORT 2014 | 21
disciplines. The translation exercise between ecological and risk management con-cepts, in particular, was flagged as a critical step.
Similarly, even though the Bow-tie approach is based on ISO standards, the exercise during the workshop showed that there is a lack of clarity around the terminology of what is classified as a “top event” and a consequence in an environmental context. As outlined above, successful use of the approach critically depends on a common language. But every scientific discipline and every field of specialisation has a unique jargon and specific mental models that have to be addressed when linking several types and sources of information. Furthermore, jargons of policy and regulatory lan-guages as well as country specific policies, cultures and legal structures (in a transna-tional setting) influence management and policy making decisions.
During the workshop, differences between risk concepts and ecological concepts be-came particularly apparent. When applying the approach within a marine policy concept bridging these becomes crucial. In order to achieve acceptance in a wider scientific and regulatory community, translation between risk terminology and envi-ronmental terminology is urgently needed and needs to be done in a balanced way, not one taking over on the other. Workshop participants got the impression, that this is possible, but it is necessary to understand the meaning of the different words and their underlying assumptions and interpretations. As well, there might be different types of “risk language”, for example the ISO risk language is not necessarily coher-ent with risk terminology in coastal engineering. A conceptual challenge is to under-stand, that in a risk management context, work is organised from decision theory principles while the ecological context is classified as a descriptive process.
Conclusions and next steps
In order to achieve acceptance for applying the approach in a wider community, a fundamental shared/common understanding of the language and terms used is re-quired. Translation between environmental terminology and risk management ter-minology needs to be an important step. A step to be taken before acceptance can be expected. This involves incorporating terminology from EU directives (in a Europe-an context), OSPAR, HELCOM and conceptual thinking of related fields of science including natural as well as social sciences.

22 | ICES WKRASM REPORT 2014
14 Define needs for education and training of experts in applying the methods used in the workshop
For the use of Bow-ties to become an integral part of risk management and decision making for MSP, a broad acceptance of the method is required. Training needs for staff to design, adopt, and use Bow-ties are likely significant.
Workshop participants noted the need for competent and experienced facilitators in applying the Bow-tie analysis. A significant, but not insurmountable, degree of knowledge regarding the methodology is required. Expertise is required within or-ganizations to achieve the true value of the Bow-tie analysis in an MSP context. The workshop briefly discussed possible training programs and needs to support wide-spread adoption of the Bow-tie method. These included on-site training, case studies, general materials, a community of practice, as well as others. Further work is re-quired to define the training programme.
The construction of Bow-ties requires the use of structured thinking and in depth knowledge of how such analysis is conducted. The software itself is plug-and-play and is simple to use with minimal training. Although chaining Bow-ties requires in depth knowledge of the software, the complexity comes from the need to understand the CEA and MSP context in order to build Bow-ties or chain Bow-ties that link oper-ational and regional scales to strategic outcomes. The integration of CEA and MSP within a risk management framework will also require training.
In any planning and management context, there is always new emerging issues and knowledge. Bow-ties will therefore require updating to ensure that they reflect the latest management context and strategies. This will require some training in the management of the information and Bow-ties from an organizational perspective.
Conclusions and next steps
There is a training need for professional use of the Bow-tie method. A training pack-age could be elaborated within the ICES framework, but acceptance will be a first step to take.
Training needs would have to be structured along roughly three types of users. Ad-vance training would be developing Bow-tie templates and maintain lookup tables and the library of reference of documents. A second level of training would provide the basis for users that would be developing Bow-ties for specific applications or op-erational needs. And, a third level of training would be needed for those who would be using the Bow-tie information for the daily operations.

ICES WKRASM REPORT 2014 | 23
15 Concluding Remarks and Next Steps
The workshop participants concluded that the Bow-tie analysis is likely a useful tool in the CEA and MSP acknowledging that much more work is required to ensure that Bow-ties reflect the needs of these assessment and planning activities as well as gain widespread acceptance. The Bow-tie methodology would likely add significant value to MSP activities, particularly in bringing together different scientific and technical disciplines and jurisdictions, as well as being able to clearly communicate complex situations to decision makers.
To broaden acceptance and understanding of the method, the workshop participants also highlighted the need for a common lexicon and language with regards to the application of risk management thinking to ecological and ecosystem issues. Transla-tion between various scientific and ecological disciplines, as well as risk management and policy/regulatory studies will be required. This also involves incorporating ter-minology from EU directives (in a European context), OSPAR, HELCOM and concep-tual thinking of related fields of science including natural as well as social sciences.
The workshop did not review depth the use of the Bow-tie analysis. However, partic-ipants agree that it can be a useful instrument for the evaluation of management op-tions aimed at achieving ecosystem objectives within a spatial management context. They also recognized that the process of the Bow-tie analysis has to be led by subject matter experts trained in the use of the method and risk management concepts. It is also recognized that the Bow-tie analysis can enhance the efficiency of CEA and MSP initiatives overtime as subsequent initiatives can build upon previously completed Bow-ties as reference material.
Participants agreed that working towards a broader understanding and acceptance of the methodology is among the first priority being suggested:
1. To start with, it would be preferable to elaborate a more detailed Bow-tie of exist-ing legislation and policies of a regional European sea within an MSP context in-tegrating MSFD goals and GEnS criteria. This would provide the basis to further understand how the method is used in policy analysis in terms of identifying pol-icy opportunities and impediments within multi-jurisdictional context.
2. There is a need to analyse the integration of ecological models used in CEA with-in the Bow-tie analysis to determine its application at a regional sea scale provid-ing the scientific underpinning of the Bow-tie.
3. Based on the approaches and applications of the Bow-tie analysis in Canada, a case study should be developed to demonstrate its applicability in facilitating CEA in MSP and, above all, legislative and policy analysis within a multi-jurisdictional regional sea context.

24 | ICES WKRASM REPORT 2014
16 References
Atkins, J.P., D. Burdon, M. Elliott and A.J. Gregory. 2011. Management of the Marine Environ-ment: Integrating Ecosystem Services and Societal Benefits with the DPSIR Framework in a Systems Approach. Marine Pollution Bulletin. 62(2): 215-226.
Borja, A., M. Elliott., J.H. Andersen, A.C. Cardoso, J. Carstensen, J.G. Ferreira, A.-S. Heiskanen, J.C. Marques, J. Neto., H. Teixeira., L. Uusitalo., M.C. Uyarra, N. Zampoukas. 2013. Good Environmental Status of marine ecosystems: What is it and how do we know when we have attained it? Marine Pollution Bulletin. 76: 16-27.
Bow-tieXP. 2014. http://www.cgerisk.com/software/risk-assessment/Bow-tiexp
CGE. 2014. The history of the Bow-tie. (http://www.cgerisk.com/knowledge-base/risk-assessment/the-Bow-tie-methodology).
Connelly, R. 2011. Canadian and international EIA frameworks as they apply to cumulative effects. Environmental Impact Assessment Review. 31: 453-456.
Cooper, P. 2013. Socio-ecological accounting: DPSWR, a modified DPSIR framework, and its application to marine ecosystems. Ecological Economics. 94: 106-115.
Cormier, R., A. Kannen, M. Elliott, P. Hall and I.M. Davies. 2013a. Marine and coastal ecosys-tem-based risk management handbook. ICES Cooperative Research Report No. 317. 60 pp.
Cormier, R., I. Davies, and A. Kannen. 2013b. Integrated coastal-zone risk management. ICES Cooperative Research Report 320. 145 pp.
Duinker, P.N. and L.A. Greig. 2006. The impotence of cumulative effects assessment in Canada: Ailments and ideas for redeployment. Environmental Management. 37(2): 153-161.
GRM. 2012. Risk management in regulatory frameworks: Towards a better management of risks. Group of experts on risk management in regulatory systems. United Nations Eco-nomic Commissions for Europe. Working Party on Regulatory Cooperation and Standard-ization Policies. 108 pp.
HELCOM/VASAB, OSPAR and ICES. 2012. Report of the Joint HELCOM/VASAB, OSPAR and ICES Workshop on Multi-Disciplinary Case Studies of MSP (WKMCMSP), 2-4 November 2011, Lisbon, Portugal. Administrator. 45 pp.
ICES. 2012. Joint DFO/KnowSeas, and ICES Workshop on Quality Assurance in MSP (WKQAMSP), 28 February–1 March 2012, Dartmouth, Canada. ICES CM 2012/SSGHIE:02. 48 pp.
ICES. 2013a. Report of the Working Group on Marine Planning and Coastal Zone Management (WGMPCZM), 8–12 April 2013, ICES Headquarters, Copenhagen, Denmark. ICES CM 2013/SSGHIE:08. 212 pp.
ICES. 2013b. Report of the Joint HZG/LOICZ/ICES Workshop: Mapping Cultural Di-mensions of Marine Ecosystem Services (WKCES), 17-21 June 2013, Geesthacht, Ger-many. ICES CM 2013/SSGHIE:12. 70pp.
ICES. 2013c. Report of the Working Group on Working Group on the Northwest At-lantic Re-gional Sea (WGNARS), 28 January – 1 February 2013, Dartmouth, Canada. ICES CM 2013/SSGRSP:03. 108 pp.
IEC/ISO. 2009. Risk Assessment Techniques. International Organization for Standardization. IEC/ISO 31010:2009. 192 pp.
ISO. 2009a. Risk Management Principles and Guidelines. International Standards Organization. ISO 31000:2009(E).
ISO. 2009b. Risk Management Vocabulary. International Standards Organization. ISO GUIDE 73:2009(E/F).

ICES WKRASM REPORT 2014 | 25
Kannen, A. 2012. Challenges for marine spatial planning in the context of multiple sea uses, policy arenas and actors based on experiences from the German North Sea. In: Regional Environmental Change. doi:10.1007/s10113-012-0349-7.
Kannen, A., K. Gee, and C. Fischer. 2013. Recommendations for Marine Governance in the EU. Policy Brief No. 4. EU FP7 KNOWSEAS Project.
26 | ICES WKRASM REPORT 2014
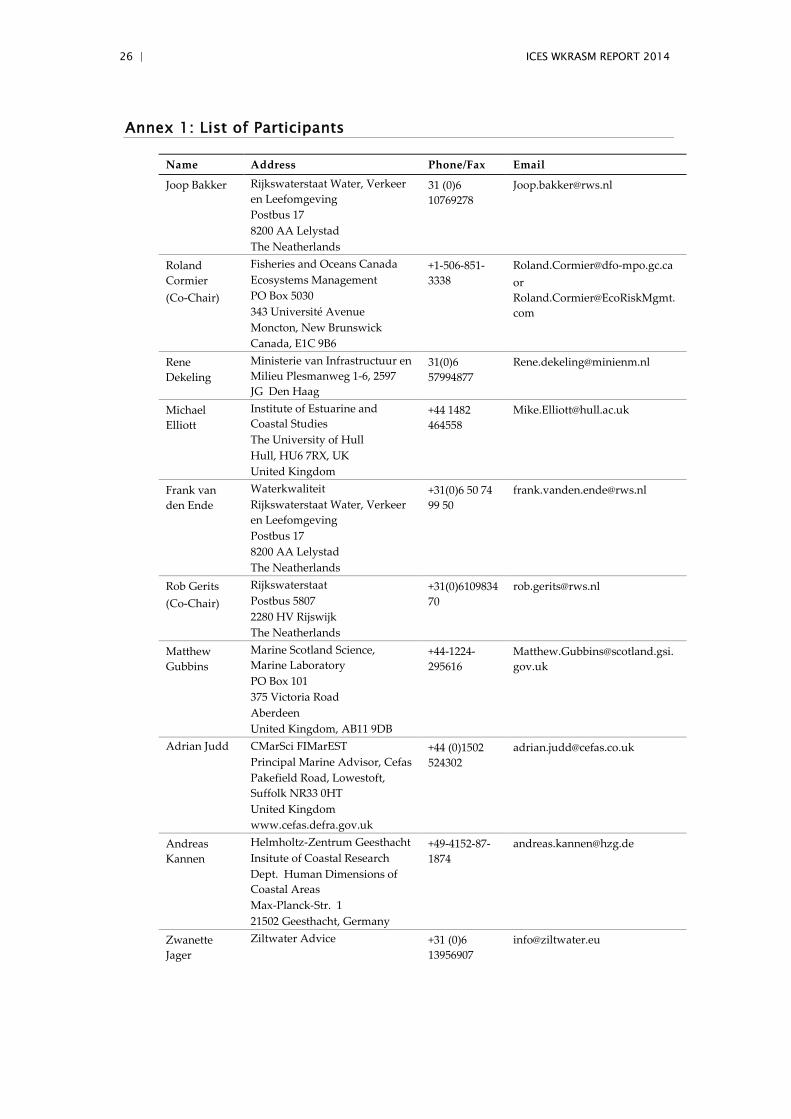
Annex 1: List of Participants
Name Address Phone/Fax Email
Joop Bakker Rijkswaterstaat Water, Verkeer en Leefomgeving Postbus 17 8200 AA Lelystad The Neatherlands
31 (0)6 10769278
Roland Cormier (Co-Chair)
Fisheries and Oceans Canada Ecosystems Management PO Box 5030 343 Université Avenue Moncton, New Brunswick Canada, E1C 9B6
+1-506-851-3338
[email protected] or [email protected]
Rene Dekeling
Ministerie van Infrastructuur en Milieu Plesmanweg 1-6, 2597 JG Den Haag
31(0)6 57994877
Michael Elliott
Institute of Estuarine and Coastal Studies The University of Hull Hull, HU6 7RX, UK United Kingdom
+44 1482 464558
Frank van den Ende
Waterkwaliteit Rijkswaterstaat Water, Verkeer en Leefomgeving Postbus 17 8200 AA Lelystad The Neatherlands
+31(0)6 50 74 99 50
Rob Gerits (Co-Chair)
Rijkswaterstaat Postbus 5807 2280 HV Rijswijk The Neatherlands
+31(0)610983470
Matthew Gubbins
Marine Scotland Science, Marine Laboratory PO Box 101 375 Victoria Road Aberdeen United Kingdom, AB11 9DB
+44-1224-295616
Adrian Judd
CMarSci FIMarEST Principal Marine Advisor, Cefas Pakefield Road, Lowestoft, Suffolk NR33 0HT United Kingdom www.cefas.defra.gov.uk
+44 (0)1502 524302
Andreas Kannen
Helmholtz-Zentrum Geesthacht Insitute of Coastal Research Dept. Human Dimensions of Coastal Areas Max-Planck-Str. 1 21502 Geesthacht, Germany
+49-4152-87-1874
Zwanette Jager
Ziltwater Advice +31 (0)6 13956907

ICES WKRASM REPORT 2014 | 27
John Lark John Lark Coherent Advice Risk Management Consulting Ottawa, Canada www.coherentadvice.com
+1-613-769-0240
Erik Lizée Alberta Environment and Sustainable Resource Development 9th floor, Petroleum Plaza ST 9915 – 108 Street, Edmonton, AB, T5K 2G8, Canada
+1-780-643-0657
Mary Metz
Alberta Environment and Sustainable Resource Development 9th floor, Petroleum Plaza ST 9915 – 108 Street, Edmonton, AB, T5K 2G8, Canada
+1-780-644-8856
Bob Rumes Royal Belgian Institute of Natu-ral Sciences Management Unit of the North Sea Mathematical Models Gulledelle 100 1200 Brussel Belgium
+32 2 773 21 24
Katie Smyth Institute of Estuarine and Coastal Studies The University of Hull Hull, HU6 7RX, UK United Kingdom
+44(0)1482464120
Jan Tjalling van der Wal
IMARES Institute for Marine Resources & Ecosystem Studies Bevesierweg 4, 1781 CA Den Helder Postbus 57, 1780 AB Den Helder The Neatherlands
+31(0)317487147
Amyas Walji CGE Risk Management Solutions Vlietweg 17v 2266 KA, Leidschendam The Netherlands
+31(0)881001350
Eric van Zanten
Rijkswaterstaat Zee en Delta afdeling V&P postbus 5014 4330 KA Middelburg bezoekadres Poelendaelesingel 18 Middelburg 0118-622868
+31(0)622991545

28 | ICES WKRASM REPORT 2014
Annex 2: Agenda
Chairman workshop: Roland Cornier and Rob Gerits
Regardz, Zilveren toren, Stationsplein 51, 1012 AB Amsterdam 020 553 5000
Monday February 24th, 2014 Name
13:30 Welcome Rob Gerits Roland Cormier
14:00 Personal introduction of participants All
14:10 Formal welcome host RWS Mariska Harte
14:20 Formal welcome ICES WG Chair Andreas Kannen
14:30 Introduction on the MSP challenges in the Southern North Sea
Rob Gerits
14:40 Introduction of the Bow-tie Analysis Roland Cormier
14:40 Introduction of ISO 31000 Risk Management and Bow-tie standards
John Lark
15:40 Coffee Break All
16:00 My first Bow-tie Exercise All
16:00 Bow-tie Analysis: Alberta experience Mary Metz Érik Lizée
17:45 Wrap up and end of meeting Roland Cormier
18:30 Dinner in the Zilveren Toren All
Tuesday February 25th 2014
09:00 Setting the context for the day Roland Cormier
09:30 Chaining the Bow-ties and defining elements (Bird case study)
Roland Cormier
10:30 Coffee break All
10:45 Defining the elements for the Bow-tie analysis (Breakout groups)
Roland Cormier and All
11:45 Conclusions and questions of the morning dis-cussions
Roland Cormier and All
12:30 Lunch break All
13:30 Defining the elements for the Bow-tie analysis (Breakout groups) continued
Roland Cormier and All
15:30 Coffee Break All
17:00 Conclusions and questions of the morning dis-cussions
Roland Cormier and All

ICES WKRASM REPORT 2014 | 29
18:00 Wrap up and end of meeting Rob Gerits Roland Cormier
Wednesday February 26th, 2014
09:00 Review previous day discussion Rob Gerits Roland Cormier
09:15 Risk Criteria and decision-making Roland Cormier
10:15 Coffee break All
10:30 Added value in using the Bow-tie Analysis Rob Gerits Roland Cormier
11:15 Concluding Remarks Rob Gerits Roland Cormier
11:45 Define next steps All
12:30 Closure of the workshop Rob Gerits Roland Cormier
13:30 Preparation of the recommendations and the report
Workshop organizing commit-tee
17:00 Wrap up and end of meeting
Thursday February 27th, 2014
09:00 Drafting of report sections Workshop organizing commit-tee
Friday February 28th, 2014
09:00 Final comments and format Workshop organizing commit-tee
12:00 Wrap up and end of meeting

30 | ICES WKRASM REPORT 2014
Annex 3: WKRASM resolution for the meeting
The Joint Rijkswaterstaat/DFO and ICES Workshop: Risk Assessment for Spatial Management (WKRASM), chaired by Rob Gerits, Netherlands and Roland Cormier, Canada, will meet in Amsterdam, The Netherlands, 24–28 February 2014 to:
a ) Assess the use of the bow-tie analysis approach in risk evaluation of man-agement options for achieving ecosystem objectives within a spatial man-agement context;
b ) Develop a common understanding and language for evaluating manage-ment options in MSP;
c ) Define needs for education and training of experts in applying the meth-ods used in the workshop.
The need for the Workshop has arisen through the increasing importance of marine spatial planning throughout the ICES area, and more widely. In particular OSPAR and HELCOM are encouraged to contribute to the workshop.
Environmental impact Assessment, and within this the assessment of cumulative im-pacts (CIA) are part of the decision-making process in MSP. The working group has seen that there is a desire for developing a common language on CIA, because the risk of trans-boundary impacts of national initiatives and the need for exchange of information and discussion on management options.
The Bow-tie approach was brought forward as an approach that has proved to be helpful in risk evaluation and evaluation of management options within a multi-driver context. The approach evaluates the pressures of multiple drivers in relation to a given environmental effect with the intent of identifying existing management measures and gaps. Given that the Bow-tie is an ISO standard used by major indus-tries, it also provides the basis to create a common language in CIA.
In a workshop, this approach would be assessed in terms of its applicability to envi-ronmental risk assessment in the development of spatial management strategy within the European trans-boundary context. Scientist from different disciplines and man-ager involved in MSP activities would be brought together to analyse this approach in relation to selected cases and to develop a common understanding on the applica-bility in MSP.
WKRASM will report by (6 weeks after meeting) in collaboration with WGMPCZM via SSGHIE for the attention of SCICOM. Further output from the workshop in the form of a Cooperative Research Report will be developed together with WGMPCZM.
Supporting Information
Priority The WKRASM is a direct outcome of the work in WGMPCZM in 2013 and the workshop on Quality Assurance in MSP (WKQAMSP) in 2012. The WK will further the scientific knowledge base for MSP and complement other activities in WGMPCZM.
Scientific justification
Bow-tie analysis (ISO 31010:2009) Overview Bow-tie analysis is a simple diagrammatic way of describing and analysing the pathways of a risk from causes to consequences. However the focus of the Bow-tie is on the barriers between the causes and the risk, and the risk and consequences. Bow-tie diagrams can be constructed starting from fault and

ICES WKRASM REPORT 2014 | 31
event trees, but are more often drawn directly from a brainstorming session. Use Bow-tie analysis is used to display a risk showing a range of possible causes and consequences. It is used when the situation does not warrant the complexity of a full fault tree analysis or when the focus is more on ensuring that there is a barrier or control for each failure pathway. It is useful where there are clear independent pathways leading to failure. Input An understanding is required of information on the causes and consequences of a risk and the barriers and controls which may prevent, mitigate or stimulate it. Some level of quantification of a Bow-tie diagram may be possible where pathways are independent, the probability of a particular consequence or outcome is known and a figure can be estimated for the effectiveness of a control. However, in many situations, pathways and barriers are not independent and controls may be procedural and hence the effectiveness unclear. Output The output is a simple diagram showing main risk pathways and the barriers in place to prevent or mitigate the undesired consequences or stimulate and promote desired consequences.
Resource requirements
None
Participants We expect between 10 – 15 participantsfrom different disciplines and working backgrounds (including practioners, natural and social scientists)
Secretariat facilities
Setting up and managing the sharepoint site and registration page.
Financial No financial implications.
Linkages to advisory committees
Development of the science base for MSP in ICES is direcly relevanat to ACOM and several ACOM EGs and initiatives, as it is for SCICOM EGs and initiatives.
Linkages to other committees or groups
Directly relevant to WGMPCZM
Linkages to other organizations
OSPAR, HELCOM, EU (DG MARE, DG Environment). In addition the outcomes are relevant to other national organizations and international organizations working with the development of MSP (eg. DFO in Canada).

32 | ICES WKRASM REPORT 2014
Annex 4: Risk assessment techniques of IEC/ISO 31010:2009
The following is only a summarized list of the risk assessment techniques that are available in IEC/ISO 31010:2009. The actual standards should be consulted for the full analysis of the methods:
Look-up Methods
• Check-lists: A simplified technique of listing typical uncertainties found in guidelines and standards.
• Preliminary hazard analysis: An inductive method to identify hazards, haz-ardous situations and events that can cause harm for a given operating con-text.
Supporting Methods
• Interview and brainstorming: A means of collecting a broad set of ideas fol-lowed by a ranking them by a group of people.
• Delphi technique: A means of combining expert opinions of a group of ex-perts in the identification of risk and the analysis of probabilities and conse-quences as well as management options.
• SWIFT Structured (“what-if”): A system to identify risks within a facilitated workshop environment.
• Human reliability analysis (HRA): An assessment of human errors and im-pacts on the performance of a system.
Scenario Analysis
• Root cause analysis (single loss analysis): An analysis of a single loss (inci-dent) to understand the causes and identify improvements to avoid future incidents.
• Scenario analysis: Identification of future analysis in considerations of poten-tial risk should the scenario occur.
• Toxicological risk assessment: Identification and analysis of hazards and possible pathways to determine the level of exposure to risk.
• Business impact analysis: Analysis of key disruption risk that could affect operations including the identification of the capabilities to manage the risk.
• Fault tree analysis: Identification of potential causes of an undesired event (top event) and analysis of potential risk reduction measures.
• Event tree analysis: Inductive reasoning to identify potential outcomes given different events.
• Cause/consequence analysis: A combined fault tree and event analysis in consideration of causes and consequences as a result of an event.
• Cause-and effect analysis: An analysis of the multiple contributing factors that can cause an effect as represent by a tree structure or fishbone diagram.
Functional Analysis
• Failure Mode and Effect Analysis (FMEA): A technique to identify failure modes and mechanisms as well as their effects in manufacturing.
• Reliability centred maintenance: Identification of policies needed to manage failures to ensure that objectives can be met efficiently and effectively.
• Sneak analysis: Methodology to identify design errors. • Hazard and operability studies (HAZOP): Risk identification of possible de-
viations from expected performance.

ICES WKRASM REPORT 2014 | 33
• Hazard analysis and critical control points (HACCP): A systematic ap-proach to identify hazards and critical control points to prevent defects in product quality, reliability or safety.
Controls Assessment
• Layers of protection analysis (LOPA): Evaluation of the effectiveness of con-trols
• Bow-tie analysis: An analysis of the pathways of risk to identify the hazard (source of the risk), causes and consequences and review prevention and mit-igation controls.
Statistical Methods
• Markov analysis: Analysis of repairable complex systems existing in multi-ple states as well as degraded states.
• Monte-Carlo analysis: Establish the aggregate variation in a system as a re-sult of variations in a system for a number of inputs.
• Bayesian analysis: Statistical assessment of the probability of results utilizing prior distribution data.

34 | ICES WKRASM REPORT 2014
Annex 5: European Commission directives and policy documents
Cumulative Effect
EU. 2001. Guidance on EIA-Scoping. Office for Official Publications of the European Communities, Luxembourg. http://ec.europa.eu/environment/eia/eia-guidelines/g-scoping-full-text.pdf
EU. 2002. Assessment of Plans and Projects Significantly Affecting Natura 2000 Sites. http://ec.europa.eu/environment/.../natura2000/.../natura_2000_assess_en.pdf
EU. 2013. Environmental Impact Assessment of Projects - Rulings of the Court of Jus-tice. http://ec.europa.eu/environment/eia/pdf/eia_case_law.pdf 7.
EU. 2013. Guidance for Streamlining of Environmental Assessment Procedures for Energy Infrastructure Projects of Common Interest (PCIs). http://ec.europa.eu/energy/infrastructure/doc/assessment/20130919_pci-en-guidance.pdf
EU. 2013. Guidance on Integrating Climate Change and Biodiversity into Environ-mental Impact Assessment Environment http://ec.europa.eu/environment/eia/pdf/EIA%20Guidance.pdf
Cumulative Impacts
EU. 1999. Guidelines for the Assessment of Indirect and Cumulative Impacts as well as Impact Interactions. Office for Official Publications of the European Com-munities, Luxembourg. ISBN 92-894-1337-9 http://ec.europa.eu/environment/eia/eia-studies-and-reports/guidel.pdf
EU. 1999. Study on the Assessment of Indirect and Cumulative Impacts as well as Impact interactions Introduction-Volume 1. http://ec.europa.eu/environment/eia/eia-studies-and-reports/volume1.pdf
EU. 2013. Guidance for Streamlining of Environmental Assessment Procedures for Energy Infrastructure Projects of Common Interest (PCIs). http://ec.europa.eu/energy/infrastructure/doc/assessment/20130919_pci-en-guidance.pdf
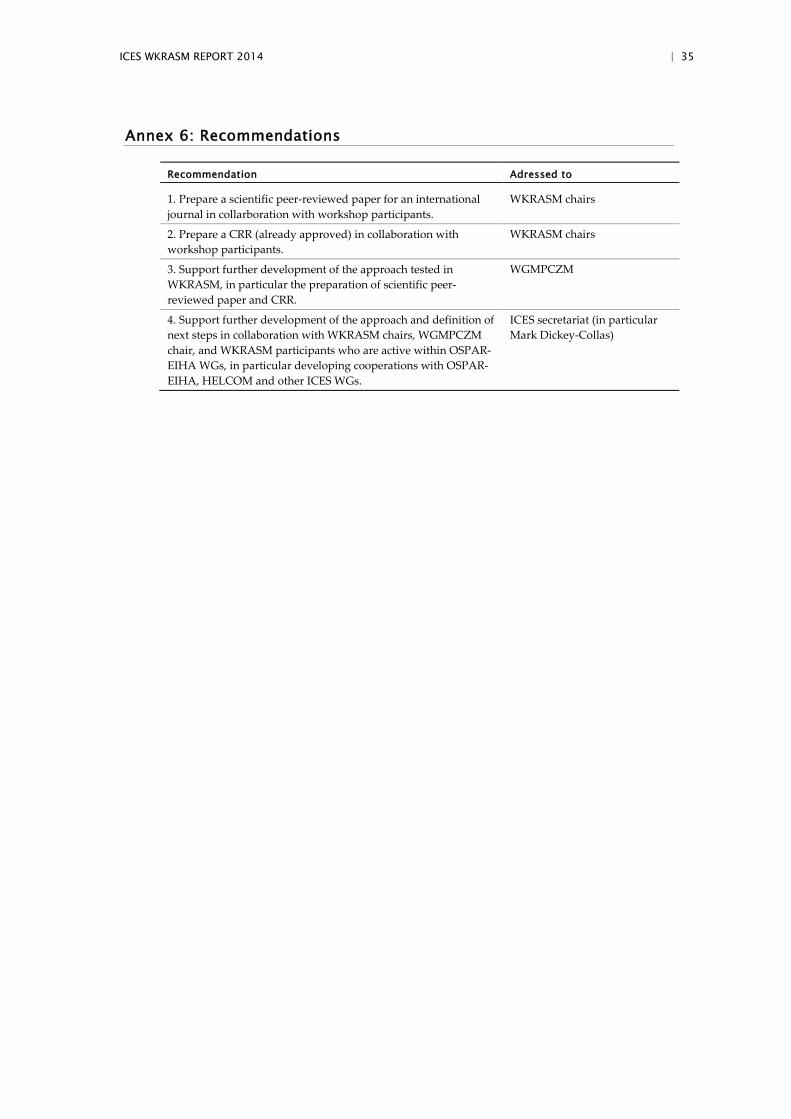
ICES WKRASM REPORT 2014 | 35
Annex 6: Recommendations
Recommendation Adressed to
1. Prepare a scientific peer-reviewed paper for an international journal in collarboration with workshop participants.
WKRASM chairs
2. Prepare a CRR (already approved) in collaboration with workshop participants.
WKRASM chairs
3. Support further development of the approach tested in WKRASM, in particular the preparation of scientific peer-reviewed paper and CRR.
WGMPCZM
4. Support further development of the approach and definition of next steps in collaboration with WKRASM chairs, WGMPCZM chair, and WKRASM participants who are active within OSPAR-EIHA WGs, in particular developing cooperations with OSPAR-EIHA, HELCOM and other ICES WGs.
ICES secretariat (in particular Mark Dickey-Collas)