report of the american academy of actuaries’ long term ... term care risk based capital work group...
TRANSCRIPT
Report of the American Academy of Actuaries’ Long Term Care Risk Based Capital Work Group
To the
NAIC Capital Adequacy Task Force
June 2004
The American Academy of Actuaries is the public policy organization for 15,000 actuaries practicing in all specialties within the United States. A major purpose of the Academy is to act as the public information organization for the actuarial profession. The Academy is non-partisan and assists the public policy process through the presentation of clear and objective actuarial analysis. The Academy regularly prepares testimony for Congress, provides information to federal elected officials, comments on proposed federal regulations, and works closely with state officials on issues related to insurance. The Academy also develops and upholds actuarial standards of conduct, qualification and practice and the Code of Professional Conduct for all actuaries practicing in the United States.

ii
TABLE OF CONTENTS
1 SUMMARY 1
2 PROJECT OVERVIEW 4
3 MODEL DESCRIPTION 8
4 MODELING APPROACH 10
5 DATA COLLECTION 19
6 ASSUMPTION SELECTION FOR BASELINE MODEL 22
7 MODEL RESULTS 28
8 FORMULA DEVELOPMENT 33
9 TOPICS FOR FUTURE INVESTIGATION 41
10 LTC RBC WORK GROUP 42 APPENDICES
Appendix A Model Description 43 Appendix B Survey results 47 Appendix C Loss Experience Form Loss Ratios 48

1
1 SUMMARY
1.1 The Charge
The NAIC Health Organization and Life Risk Based Capital Working Groups (now the Life Risk Based Capital Subgroup) requested the American Academy of Actuaries to review the Managed Care Organization Risk Based Capital formulas for Disability Income (DI), Long Term Care (LTC), Stop Loss and Limited Benefit insurance products. In response to this request, the Academy assembled a Joint Task Force from members of its Life Risk Based Capital Committee and its Health Organization Risk Based Capital Task Force. The LTC Risk Based Capital Work Group (Group) was specifically formed to address LTC insurance. This report describes the source of data, methodology, analysis and our recommendations. We provided an interim report to the Life Risk Based Capital Subgroup in June 2003. We received a number of useful suggestions from members of the Subgroup and others. Since then, we have incorporated these suggestions, updated the data and modified our methods.
1.2 Methodology
Our group followed the general probability of ruin approach of setting risk based capital factors. As with other lines of business, we targeted a 5% ruin probability. This means that, on the average, an effective RBC formula should reduce the likelihood of insolvency for a company to less than 5% of the time.1 The measurement period for this exercise was five years.
To be consistent with the effort of the Disability Income RBC Work Group, we adopted the risk based capital simulation model for DI. We developed inputs to the model using data from Form A of the LTC Loss Experience Forms and two surveys of companies writing LTC insurance. We constructed two separate sets of baseline assumptions for large and small companies because we noticed significant differences in the experience data by size of company. With the baseline assumptions, we used the simulation model to calculate the required surplus for a 5% ruin probability. Next, we performed a series of sensitivity analysis by varying the inputs to the model. This exercise enabled us to settle on an appropriate surplus level that would cover a reasonable range of companies and their experience. We then developed our
1 Throughout this report, we ignore any offsetting effect to insolvency risk from other lines of business.
Therefore, LTC product line insolvency risk is synonymous with company insolvency.

2
recommendation by converting the required surplus expressed as percentages of earned premiums into percentages of incurred claim factors using projected relationships between earned premiums, claim reserves and incurred claims. The claim reserve factor in the current formula was left unchanged.
1.3 Recommendations
We recommend the following new risk based capital formula. A block of LTC business is characterized by low claims at the beginning and claims exceeding premiums in the later durations. Insolvency risk increases as claims increase. We believe, in the long run, risk based capital for LTC relates better to claims than to premiums. The following is our recommendation for the C-2 component, as compared with the current formula:
Recommended Formula
Current Formula
37% of First $35 Million of
Incurred Claims+
12% of Incurred Claims in excess of $35 Million
+5% of Claim Reserves
25% of First $50 Million of Earned Premiums
+ 15% of Earned Premiums in
excess of $50 Million +
5% of Claim Reserves
Notes:
1. All values in this report are post-tax adjustment values for the RBC formula. 2. Both recommended and current formulas are net of reinsurance. 3. Incurred claims are defined as paid claims plus change in claim reserves during a
calendar year.
We noted that the LTC insurance business is growing and will become more mature in the future. We developed the new formula for conditions that we expect to exist over the next ten years. As a result, we recommend applying the new formula for the next ten years or a shorter period. It represents the appropriate risk based capital for a reasonably well managed company that makes rational decisions and has experience that mirrors the industry’s experience.

3
In evaluating our recommendation, we ask the Life Risk Based Capital Subgroup to keep the following in mind:
• LTC insurance is beginning to be split between open blocks and closed blocks. An estimated 35% of the current total in-force policies are in closed blocks. Unlike the current formula, we believe the new formula applies equally well for both open and closed blocks.
• Risk based capital is intended to primarily cover volatility of loss
ratios due to random events and also to recognize certain other risks such as utilization trend, persistency, etc. Not all risks were modeled. Moreover, while LTC product risk management has improved, mistakes in pricing and management control are still embedded in the historical data that we used. Volatility may be overstated. On the other hand, future loss ratios would include claims from newer benefits such as home health care. Direct application of the model results using historical loss ratio data may not capture the volatility associated with future claims.
• The RBC model simulated certain management. Assumptions regarding
these actions have significant impact on the results. Supporting data regarding management actions is scarce. Moreover, these actions are subject to behavioral changes in the future.
• Because of the sensitivity of results under various model scenarios, we
used considerable judgment in selecting the prudent best estimates to formulate our recommendation.
• As indicated in Section 8.2, the recommended formula includes a 50%
load for conservatism from our baseline analysis of results. • Incurred claim factor may be less stable than premium factor. In Section
8.4 (page 37), we offer an approach to mitigate this potential issue.
1.4 Future Considerations
The recommended formula is a better basis for LTC RBC than the current formula, but the existing model cannot reflect conservatism (or the lack thereof) in statutory reserves. We recommend a further charge to develop another model that addresses the key LTC risks (morbidity, persistency and investment returns) on a holistic basis. RBC should be allowed to reflect the level of statutory reserves as an offset to total asset adequacy requirements (see Section 9 for further details).

4
2 PROJECT OVERVIEW 2.1 Product Characteristics
As an insurance product line, LTC insurance is relatively new. Although there were a few number of companies offering this coverage as early as 1975, no company achieved measurable growth before 1988. The industry has seen significant growth since then.
Almost all LTC policies have level premiums payable for life. However, premiums are not guaranteed. If experience is adverse, a company can file for states’ approvals to increase premiums by risk class. For a cohort of business, premiums (ignoring any rate increases) will decrease due to policy terminations. Claims will be less than premiums in the early years and will exceed premiums in the later years.
Premium and Claim Patterns for a Cohort of Business
$0
$1,000
$2,000
$3,000
$4,000
$5,000
$6,000
1992 1993 1994 1995 1996 1997 1998 1999 2000 2001
Written Premiums($Million)
Source: LTC Experience Form A
0 5 10 15 20 25 30 35 40 45 50Policy Year
Earned PremiumsIncurred Claims

5
Incurred claims, as percentages of premiums, will increase steadily. For an open block of business, the overall incurred claim loss ratio is a combination of loss ratios for layers of the block by issue year. It will generally increase along a path that is a function of the experience of the in-force business and the growth rate of the new business. The net cash flow generated from a block of LTC business reflects the relationship between premiums and claims. Cash flow is positive during the early renewal years when premiums exceed claims and expenses; cash flow is negative during the later years when the reverse holds. Since the current average issue age is in the early 60s for individual insurance and late 40s for group insurance, the liabilities of such a block can last for more than 50 years. Future claims are, therefore, subject to uncertainties about future events. Among the influencing factors are:
• secular trend in health status of the elderly population, • government support systems, and • change in public attitude regarding utilization of long term care services.
Besides the morbidity risk, other risk factors for LTC insurance include policy terminations, investment returns on assets backing the liabilities, and expenses. Claim experience for some companies has been worse than expected. Persistency experience (higher than expected) has also been unfavorable. Consequently, there have been a number of rate increases. These increases distorted the historical incurred claim loss ratio patterns for these companies. Measured on a return on investment basis, profitability on LTC insurance depends on risk based capital and reserve requirements as well as emerging actual experience as compared to pricing expectation. For many companies, risk based capital is a significant consideration in the viability of the LTC product line as it competes with other lines for capital. The recent consolidation activities within the industry may be a signal of the imbalance between the risk and reward profile of the product. Thus, a review of the risk based capital requirement is timely.
2.2 Objectives
LTC had no explicit formula when RBC calculations began in 1991. In 1994, an Academy group reviewed and proposed risk based capital changes for a variety of accident and health products. The underlying data for LTC was not useful because it was found to be immature. LTC adopted the DI RBC formula in 1994. While the refinement for the DI formula was completed in 2000, LTC has maintained the original DI formula factors.

6
The main objective for this project is to recommend a formula based on LTC experience. A secondary objective is to ensure the formula produces risk based capital that properly tracks the risk it is mitigating. We believe that the current formula, which is primarily premium-based, generally is not in-step with the growing claims in the later policy years.
2.5 General Guidelines and Limitations
• The company is assumed to be reasonably well managed and its reported experience represents a fair picture of the actual results year by year. Deviations from a reasonable pattern of loss ratios are assumed to be due to statistical variations, correction of prior reserve estimates and premium rate adjustments. Regarding its premium rate adjustment practice, we assumed that the company would react in a rational and consistent manner to changes in experience. This is consistent with other model work for RBC values.
• As with all other products in the Life & Health RBC formulas, the model
assumes the statutory reserves associated with the LTC block of business are adequate. The recommended risk based capital will only cover the insolvency risks due to fluctuation of experience and will not cover any deficiencies in the actual reserves. Based on a suggestion from discussions of the interim report, we evaluated the effect of reserve strengthening on required surplus. We modified the model to simulate reserve strengthening triggered by modeled adverse claim experience. This does not address solvency risk created when statutory reserves are not adequate at the start of the testing period or will need to be increased to cover claims beyond the study period.
• In selecting specific assumptions and in interpreting model results, we
chose to err on the conservative side. The input assumptions are necessarily representative of the whole industry. We assumed the company has the same experience as industry-wide experience.
• As discussed later in the report, we modeled variation in claim experience only. The modeling did not consider the interaction between claim, persistency and investment return.
• We targeted development of a formula that would be appropriate for the
next 10 years. The model design does not accommodate simulation of the risk changes due to a maturing/growing block of business. The convention we have adopted is to target the midpoint of the testing period (the next ten years), or use an average of yearly estimates. This midpoint and averaging approach may not accurately reflect the yearly pattern during the testing period for a company.

7
2.6 Scope of LTC Products Covered
LTC policies covered under the recommended formula include individual and group policies, policies with limited payments as well as LTC riders attached to other insurance or annuity contracts. The recommended formula does not cover LTC benefits that accelerate the normal benefits of a life or annuity contract.
2.7 Refinements Since the Interim Report We carefully considered the suggestions made by members of the Life Risk Based Capital Subgroup and interested parties on the interim report. In producing this report, we have:
• Updated the loss ratio data by adding one additional year of experience, • Conducted a follow-up survey to obtain detailed information on certain
critical assumptions,
• Analyzed the component of the simulation model relating to reserve strengthening and made modifications to reflect the nature of LTC reserves, and
• Developed an expanded set of "what if "scenarios.

8
3 MODEL DESCRIPTION 3.1 Origin of Model
The basic model used in the development of this recommendation has its roots in a model used in the development of the health organization RBC factors in 1994. Health organizations generally offer products that are short-term in nature, such as major medical and hospital indemnity. This model was also applied to long-term risks such as DI and LTC. The original model was later modified to accommodate DI. Our Group, in turn, has also made a number of modifications to the DI model in order to recognize issues unique to LTC insurance.
3.2 Consistencies with the DI Model
The LTC simulation model started out as a copy of the model for DI. The choice of the DI model is obvious. Disability Income and Long Term Care have similar product features such as level premiums with active life reserves. However, DI coverage normally ends at an attained age such as 65 where as LTC coverage has no age limit. DI has a longer history than LTC and appears to be more subject to economic fluctuation. LTC is perhaps more subject to trend risk from changing utilization pattern (e.g. use of home health care) than DI. Many DI policies are non-cancelable; almost all LTC policies are guaranteed renewable. These differences have significant implications in terms of model assumptions. The basic operations of the models, however, are very similar.
3.3 Assumptions
The model uses a stochastic process to generate the surplus amount needed to avoid ruin at the desired probability. Various input assumptions are required to run the model. These assumptions are intended to reflect the experience of a “typical” company based on industry-wide data and practices. There are three types of input assumptions:
1. Product Assumptions. These assumptions identify the LTC product characteristics such as expected loss ratios, deviation in loss ratio (based on standard deviations), reserve level, profit, investment yield on assets, federal income tax rate, etc.
2. Management Assumptions. These assumptions specify the management
actions to adjust premium rates. They include loss ratio trigger levels for filing for rate adjustments, elapsed time to implement rate actions, proportion of total business being re-rated, etc.

9
3. Run Parameters. These are the parameters for the simulation mechanics.
They include the number of random trials for the simulation, the number of years of simulated experience, use of serial correlation, and the testing period, etc.
3.4 General Description of the LTC Risk based Capital Simulation Model
The model starts with an in-force block of business and an initial amount of surplus. The model simulates changes in loss ratios that result in increases or decreases in surplus. Implicit in the yearly loss ratio is the claim experience of new claimants during the year and existing claimants from prior years. These changes assume a normally distributed random variable, with the initial mean equal to zero and a standard deviation derived from actual loss ratios. The model simulates potential premium rate actions by management in response to loss ratios. These actions will also affect surplus. A set of management action assumptions determines the amount of rate actions and their timing.
Ruin occurs if the surplus becomes negative during the testing period. Starting with an initial surplus at the beginning of the testing period, the model produced thousands of randomly generated scenarios for each test in order to determine the ruin probability. Through an iterative process, the model then seeks out the initial surplus level that achieves a 5% ruin probability. The simulated changes in loss ratio reflect statistical fluctuation in claim experience a company may encounter. The model does not consider statistical fluctuation in persistency, interest rate or expenses. In terms of fluctuation that endangers solvency, the Group viewed the statistical fluctuation of these risk factors to be much less significant than for the claim risk during the next ten years. The model also does not address reserve adequacy or inappropriate premiums due to mis-pricing with respect to morbidity, persistency, investment return or expenses.
Appendix A provides a detailed description of the simulation model.

10
4 MODELING APPROACH
4.1 General Considerations
The insolvency risk of any particular insurance company depends on a number of external and internal factors. Examples of external factors are changes in government regulations, large number of bond defaults, etc. The internal factors are specific to the company and include the level of free surplus, its product portfolio, management organization and strength, product experience, new business growth rate, etc. Ideally, each company should hold a level of risk based capital according to its own characteristics. Recognizing that no single formula fits equally well for all companies, the NAIC has established three formulas connected to various Annual Statements. We have focused on the Life & Health RBC formula as the vast majority of LTC insurance is written by life insurance companies. We believe that a similar approach is appropriate for the other formulas as well. LTC is a relatively new market where only a handful of companies have fifteen or more years of experience and many companies have just a few years. The task for the Group was to devise a formula that is appropriate for the majority of companies. In order to achieve this objective using available data, we assumed that companies behave like a “typical” company that mirrors the industry averages2 relative to past and future growth, reserve methodology, investment strategy, expenditures and profit objectives.
For LTC insurance, the product risks are claims, persistency, investment earnings and expenses. Generally, C-2 risk for RBC covers the variation from expected for insurance obligations. We modeled claim risk. We did not model persistency or interest rate risks for reasons given below. Expense risk is generally not product specific and, if included, would be in the C-4 component.
4.2 Fit of Model
There is rarely definitive proof that a model exactly describes a real phenomenon. However, certain evidence can be discerned to provide a certain comfort level that the model comes close to reality. The Group believes that the RBC model simulates the risk of insolvency reasonable well.
2 The differences in years of experience, the recent consolidation and the substantially different growth rates
mean that this “average” is highly suspected relative to projecting future experience. The model, however, requires assumptions (or ranges of assumptions) that are generated from this average company.

11
We observed that:
1. It behaves as expected. That is, certain changes of inputs produce predictable results. For example, if the expected profit is reduced, the required surplus is higher.
2. Results are sensitive to critical assumptions. For example, the timing of
management actions significantly affect the required surplus. 3. The LTC simulation model was adapted from a generalized model
whose outputs were accepted for a variety of product lines. We have tested the model with inputs similar to those for DI and have arrived at results comparable to those produced by the DI model.
4.3 Growing Business
The RBC simulation models for other lines of health business assumed either a very short horizon or a stationary population such as for DI where new issues equaled the number of terminated policies each year. The Group felt neither of these assumptions are appropriate for the current LTC business. The DI model assumed that expenses and profits are at a steady state and the only profit variance comes from claims. In the near future, the investment income for LTC products is expected to grow as reserve balance grows. Expenses relating to claim administration will also grow but their impact is much less than that for investment income. The LTC model ignores the growth and uses a constant profit margin over the testing period. The Group recognized that this is a simplification but it is conservative. We reviewed other aspects of the DI model in details and concluded that the simulation model can accommodate non-stationary population. Expected loss ratios, however, will need to reflect that LTC is a relatively new and growing business. LTC is a level-premium product. For a block of new business, claims start out low in the early policy years and exceed premiums in the later years. The corresponding incurred claim loss ratios for a closed block will increase by policy duration. With growth in business, the loss ratio will not increase as fast as the loss ratios on closed blocks because the new business loss ratio tempers the increase in the in-force business.

12
Nevertheless, as an industry, the incurred claim loss ratios have been slowly increasing as illustrated by the following. .
Incurred Claim Loss Ratios Top 51 Companies
20%
25%
30%
35%
40%
45%
1993 1994 1995 1996 1997 1998 1999 2000 2001
From the experience loss ratio data (see Appendix C), we determined the approximate annual percentage increase in loss ratio by size of company and by the current loss ratio level. We modified the RBC model to assume the following trends in the expected loss ratios:
Incurred Claim Loss Ratio
Under $60 Million3
Premiums $60 Million
Premiums & Over Under 25% 5% 3% 25% to 40% 1% 2% Over 40% 3% 1%
4.4 Company Actions
Options to manage claim results for in-force LTC business are limited. Companies may adjust premium rates (subject to state approval), adjudicate claims proactively (especially on home health care claims) or convert existing policies to new policy forms. Rate adjustment is by far the most prevalent action to date. The other two alternatives are more difficult to track and measure.
The model only simulates rate adjustments. Mimicking the rate adjustment process is a challenge since companies’ practices and philosophy vary considerably. In addition, the model has limitations that cannot adequately reflect the multi-year impact of a nationwide rate increase filing.
The actual process for rate adjustment starts with the emergence of experience that differs from expected. First, management would evaluate experience based on credibility of the data. The decision for rate action would involve projecting a
3 See Section 6.2 for explanation of why $60 million was chosen.

13
lifetime loss ratio using historical data and estimates of future morbidity, persistency and interest rate experience. Even when the projected lifetime loss ratio is materially different from the statutory loss ratio standard, rating filing is not automatic. Potential damage to a company’s reputation and negative impact on new sales are serious implications. On the other hand, if experience is unfavorable, some companies may want to restore the expected profit level as soon as possible. If experience were favorable, regulators would apply pressure to reduce rates. Once management decides to adjust premium rates, the timing of the adjustment will depend on the following factors:
• internal resources available, • preparation time for the filing, • states’ rate approval processes, • administrative implementation of rate changes, and • contractual provisions regarding the adjustment4.
The effect of rate adjustment on net income will depend on:
• the proportion of total business affected by the rate filing, • the requested amount of rate adjustment, • the amounts approved by the states, • the number of policyholders who decide to lapse the
policies or reduce the amount of benefits, and • the future claim experience of the policyholders remaining.
The RBC model uses several parameters to simulate rate adjustments. First, an annual loss ratio exceeding a high limit will trigger a rate increase. Similarly, a loss ratio that is less than a low limit will trigger a rate decrease. In the real world, claim experience would not be the only factor. Projection of future persistency may also affect the estimate of the lifetime loss ratio. The rate adjustment action applies to a specific portion of the total block, depending on whether the action is to increase or decrease premium rates. Finally, the rate adjustment changes the surplus level after the specified implementation period. Estimates of these parameters for rate actions came from the results of the surveys of company practices provided. See Appendix B for a summary of results of the surveys.
4 Some contracts allow rate changes at the next billing date; others restrict changes only at policy anniversary.

14
4.5 Effect of Company Actions on Loss Ratios
Historical volatility in loss ratios comes from two sources. One source of volatility is pure random fluctuation. This is termed the statistical risk. The excess of total variation over the statistical risk is due to non-random events. In the RBC model, this is attributable to company actions and is called the historical risk5. Embedded in the observed series of loss ratios over time are actions by the company that may increase or decrease volatility. New business, with its low loss ratios, decreases volatility for the entire block. Rate adjustments also decrease volatility. Strengthening of claim reserves would increase volatility.
For each company, a program in the RBC model transforms the actual incurred claim loss ratios to a series of new loss ratios that would have resulted in the absence of management actions (assumed to have occurred in accordance with the set of management action rules described above). The resulting loss ratio pattern represents statistical fluctuation in the loss ratios experienced by the companies, net of changes due to management actions. A sample standard deviation and serial correlation by company are then determined using the adjusted loss ratios. Finally, the program calculates the premium-weighted averages of the standard deviation and serial correlation separately for the large company group and the small company group. These become inputs to the simulation portion of the model.
4.6 Independence Assumption and Serial Correlation Once we removed the impact of management actions (i.e. the historic risk), we used the transformed loss ratios to calculate the sample variance of a random normal variable with mean zero. However, these successive loss ratios may not represent independent observations; they may correlate with each other. For example, after a rate increase, a certain number of healthy insured may lapse and the remaining group of policyholders may produce high loss ratios in future years. We may then over-estimate volatility. This phenomenon is measured statistically by the serial correlation. We applied the standard test for detecting serial correlation, the Durbin-Watson test, to the transformed loss ratios. The test suggests that serial correlation is not present. Accordingly, we did not make further adjustment to these loss ratios to reflect serial correlation.
5 Some non-random events may not be company actions (e.g. utilization trend, federal law changes), but we are not
aware of any adverse events during the past ten years that would significantly change the historical loss ratios.

15
As an alternative scenario, we examined what would happen if we accounted for serial correlation in the same manner as in the DI model. The simulation model relates successive random numbers by the sample serial correlation. The weighted average of the sample serial correlations from companies’ adjusted loss ratio is negative. This means that, on the average, positive change in loss ratio tends to follow negative change in loss ratio and negative change in loss ratio follows positive change in loss ratio. This tendency to move towards the mean dampens volatility. This negative value produced a lower required surplus level than in the case where serial correlation is ignored.
4.7 Projection Period
The model that developed health RBC factors is capable of looking at the risk of failure over a three to seven year period. The model actually starts a number of years before the testing period since results in any year are impacted by assumed management actions to loss ratio deviations from prior periods that are still being “phased-in.” We used a ten-year seasoning period. We tested the risk of insolvency over a five-year period to be consistent with other lines of business.
4.8 Morbidity Risk
We considered morbidity risk as first order risk when evaluating risk based capital for LTC. Fluctuation in yearly claim experience, by far, has the greatest immediate impact on surplus. We assumed an 11% pre-tax statutory profit as part of the baseline assumptions for simulation runs. At a projected average 50% incurred claim loss ratio for the effective period of the study (that is, the next ten years), a 20% worsening of claim experience would deplete the expected profit.
4.9 Persistency Risk
Persistency risk (and investment return risk described below) is a second order risk. Persistency is a function of death and voluntary lapses. To the extent that persistency is greater than pricing assumptions over a lengthy period, more policies will persist and more claims will be incurred in the future. This is systemic risk, not statistical risk. From the net income perspective, variance in persistency during a year affects revenues, claims and change in contract reserves. For a typical block of LTC new issues, higher than expected persistency during the first few policy years increases surplus. Surplus decreases afterward. In recent years, industry

16
voluntary lapse rates after the initial policy years have been low, in the neighborhood of 2% to 4%6. During the effective period, we estimated that contract reserves are approximately 4.5 times premiums. There will be expected loss for any year only if voluntary lapse rate is near zero7. It appears that statistical fluctuation around the neighborhood of current low termination rates has minimal impact on insolvency. The RBC model was not designed to simulate volatility due to risks other than claims. To be consistent with other lines of business, the Group believes that it is appropriate not to model persistency risk at this time.
4.10 Investment Return Risk
LTC insurance is characterized by level premiums and increasing claim costs over the coverage period. It develops substantial reserves that give rise to investment earnings. Investment income is a significant component of the income statement as the business matures. Over the effective period of the study, we estimated that investment income could be over 20% of premium revenue. Because the liabilities are long-tailed, assets supporting the reserves are generally invested in relatively long-term instruments such as long-term corporate bonds. Large blocks of LTC business generally have segregated investment portfolios dedicated to LTC. For smaller blocks, commingled portfolios that support other product lines also back the LTC liabilities. Typical LTC asset portfolios are subject to default risk and reinvestment risk. The C-1 component of the RBC formula addresses default risk. Reinvestment risk (including investment of positive net cash flow) arises in a low interest rate environment where the cash from operation and from coupons of bonds can only be invested at a lower yield rate than expected in pricing. This produces lower than expected profits. Currently, the RBC formula for health coverage does not cover reinvestment risk. A properly managed investment portfolio for a block of LTC insurance business can be insulated from reinvestment risk with hedging instruments that effectively guarantee a level of investment returns. On a year-to-year basis, reinvestment risk does not set off wide fluctuation in earnings since only a relatively small portion of the total portfolio is new investments. Nevertheless, a prolonged
6 See Long-Term Care Insurance Persistency Experience, 2004, LIMRA International and Society of Actuaries LTC
Experience Committee. 7 2.5% of 450% of premiums equals 11% of premiums. Therefore, there is no profit at a 2.5% termination rate,
assuming all other assumptions are exactly met.
17
period of low interest rate will depress profits and increase the probability of insolvency. Over the effective period of the study, we conservatively estimated that 25% of a typical LTC investment portfolio is invested in new instruments each year. This portion contains coupons and net cash from normal operation only and excludes any strategic actions in the course of prudent asset management. At zero interest rate, the reduction in profit in one year would be 5% of premium (25% of the 20% investment income as a percentage of premiums). This is far less than the potential impact of claim fluctuation. The LTC RBC model assumes no investment return risk.
4.11 Statutory Reserves
Statutory reserves are intended to include margins for future levels of morbidity, persistency and investment return risk. Risk based capital and statutory reserves together make up the total amount of assets needed to retire a company’s obligations with a reasonable margin of protection from insolvency. It follows that capital adequacy depends on reserve adequacy. State regulations specify reserve standards. For LTC, the relevant reserve regulations include the minimum valuation standards, gross premium valuation, premium deficiency reserve, and cash flow testing. NAIC has recently updated the minimum reserving standards for future new issues. The same underlying experience that causes reserve inadequacy may well increase the likelihood of ruin. For example, if future claim experience is far worse than what was assumed in the reserves, reserves will not be able to support future claims. If a company does not implement rate increases for whatever reasons, cumulative net losses will eventually exceed available surplus. The company will become insolvent. Similarly, if the actual persistency is better than expected, the assumed credits to future reserves from terminating policies will not be realized and surplus may become a source of additions to reserves. However, the fact that risk based capital and statutory reserves are both required by the states does not imply that one is merely an extension of the other. A distinction between risk based capital and statutory reserves is the period of time each is intended to cover. LTC statutory active life reserves cover the duration of the in-force policies that can span over 40 years. Risk based capital covers momentary demand on surplus for a period of typically less than ten years. Consistent with other lines of business, the RBC model is not designed to address reserve adequacy. However, when the model captures a period of continued high loss ratios, reserve strengthening is assumed to take place. The

18
model reduces current surplus by an estimate of a premium deficiency reserve under the following assumption:
• The model assumes that reserves are adequate at the start of the projection period. The expect profits over the period depend on, among other factors, the expected changes in the reserves.
• If the average loss ratio over the last three years (which may start
during the seasoning period) exceeds a threshold, an additional reserve is set up that year. This reduces surplus for that year.
• The additional reserve is calculated as the present value of future loss
ratio deficiencies until the set of assumed management actions is realized.

19
5 DATA COLLECTION
5.1 LTC Experience Forms
The loss ratio data came from the LTC Loss Experience Forms, an un-audited supplement to the Annual Statement. There are three forms annually provided to regulators. Form A is a nationwide incurred claim exhibit for the calendar year prior to the reporting year. Loss ratios are grouped by similar policy forms. Form B is a nationwide exhibit of cumulative claim experience for the year of reporting and Form C is a statewide version of Form B. Because of the one-year lag in reporting, the incurred claims are more fully developed than the other forms because there is less estimation of future claim payments. Form A supplied the annual incurred claim loss ratios for this study. We also collected other useful financial items for our analysis from these forms. These items include paid claims, changes in claim reserves, earned premiums and active life reserves. The Group obtained data for 105 companies from 1991 through 2002 reported years. We selected data from the top 51 companies with earned premiums over $2 million. Data from other companies appear to be erratic and unreliable. The top 51 companies accounted for over 85% of the total in-force business in 2001. Of these, 13 have direct premiums over $100 million and 16 companies over $60 million. The 16 companies have over 73% of total in-force.
Data between 1991 and 1994 are either incomplete or inconsistent for a significant number of companies – 23 companies. The Group decided to use data from 1995 through 2001 experience years instead (reported on Form A in 1996 through 2002).
2001 Earned Premiums By Company($Million)
0
100
200
300
400
500
600
Less than $60MM

20
Even so, six companies had data which we suspected might still be incorrect. We contacted these companies and three of them resubmitted their experience data. We also made decisions on including and excluding certain data. Several large companies reported incomplete data; we limited their contributions to the years where data is available. We decided to include the data from a large-size company that had significant claim reserve strengthening. Because we calculated weighted-average of loss ratios using premiums as weights, these adjustments had a relatively minor effect on the overall results. Pertinent data from these forms is shown in Appendix C. The incurred claim loss ratio history of a company depends on the following factors:
• Business mix (plan, issue age, gender distributions, etc.), • Underwriting standards, • New business growth rate, • Persistency experience, • Claim experience, • Rate adjustments, if any, • Claim reserve adjustments, if any, • Reporting accuracy, and • Random fluctuation.
While we have made the best attempt to isolate the statistical risk (i.e. random fluctuation), it is clear that the resulting loss ratios probably contain more volatility than from pure random fluctuation. We divided the 51 companies into two groups – large companies and small companies. See Section 6.2 below for a description of the division. The sample standard deviation for the large company group is smaller than that for the small company group. This is to be expected according to the law of large numbers. Several other reasons may also contribute to the difference. Large blocks tend to be growing blocks. New business tempers the increasing loss ratios on the in-force business and absorbs occasional swings in experience. Furthermore, we noticed that there are significantly more data inconsistencies within the small company group than the large company group.

21
5.2 Comparison with DI Loss Ratio Data
From the Final Report of the Disability Income RBC Work Group, we made the following comparison:
Even though there are significantly more sets of data points for LTC, the number of experience years is considerably less than that for DI. This shorter period, the underlying growth and less sensitivity to economic environment may explain the lower standard deviation values for LTC. This shorter period also makes it difficult to detect serial correlation in the LTC loss ratios.
5.3 Company Surveys
In order to gather model inputs other than loss ratios, we conducted a survey of companies currently selling LTC in 2002. Twelve companies responded. They accounted for 54% of the total LTC business in-force. The survey collected information on anticipated growth rate, expected profit level and capital management. With respect to rate adjustments, companies were asked about loss ratio triggering level, anticipated proportion of total business affected and the timing of the rate adjustment process. Not all companies answered all questions. However, there were at least five answers to each question. Since the survey is confidential, we averaged the results over the number of responses without regards to companies’ size of business. We also conducted a follow-up survey at the end of 2003. The purpose of this survey was to gather additional data on certain input assumptions. Specifically, we obtained new information regarding the portion of total business re-rated and the timing of the rating process by size of business from nine companies. Altogether the two surveys covered approximately 40% of the companies whose data was used in the RBC model. A summary of the survey results is shown in Appendix B.
Guaranteed Renewable DI
LTC
Number of Small Companies
6
35
Standard Deviation
15.0% 12.5%
Number of Large Companies 4 16
Standard Deviation 11.2% 5.9%
Number of Years of Data 15 7

22
6 ASSUMPTION SELECTION FOR BASELINE MODEL
6.1 Baseline Model
There are more than 20 input items for the model. Some of them have significant impact on the outputs while others have only marginal impact. To anchor the analysis of the model results, we devised two sets of baseline assumptions, one for large companies and one for small companies. We obtained results from the model runs using the baseline assumptions. We then generated additional results by varying input assumptions. Together they formed the basis for our analysis and recommendations.
6.2 Size of Business
The current formula uses two tiers for the premiums factor: 25% of earned premiums (net of reinsurance) for the first $50 million and 15% in excess of $50 million. The Group decided to follow the same tiered structure and divided the companies into two groups, using $60 million direct earned premiums for 2001 as the break point. The $60 million direct premiums threshold corresponds to the current $50 million break point, which is net of reinsurance. We determined that the net to direct premium ratio was 85% in 2001, based on the relationship for the 51 companies.
6.3 Claim Variation
We used the standard deviation of incurred claim loss ratios to generate deviations from the target loss ratio (described below). However, we first isolated the statistical volatility from the observed data by removing the impact of the company’s actions (based on the assumed set of company action rules described below).
Loss Ratio Standard Deviation: 4.7% $60 million earned
premiums and above 11.8% under $60 million
Serial Correlation of Loss Ratios: None As noted in the discussion of serial correlation, we also examined the situation where we assumed there is serial correction among the loss ratios. For these runs, the serial correlations calculated from actual data are: Serial Correlation: -16.6% $60 million and above -20.8% under $60 million

23
6.4 Profit Margin
We developed a business financial projection using asset share data from a mixture of nursing home only and comprehensive LTC plans. The financial projection reflected historical as well as expected future sales patterns for the industry. We also calibrated the projection with historical incurred claim loss ratios from the LTC Experience Forms. Over the next ten years, the average pre-tax profit from the financial projection is 11%. From the survey, the average response is also approximately 11%. This corresponds to an approximately 7% after-tax profit.
6.5 Target Loss Ratio
The target loss ratio represents the starting loss ratio from which deviations are modeled. We used a 75% target as suggested by the financial projection over the next 10 years. This target included both incurred claims (60%) and changes in active life reserves (15%). Since the source of variation is the observed incurred claim loss ratios, this implies a constant change in active life reserve as a percentage of current premiums. The Group considered this an acceptable model simplification since variations in active life reserves are assumed to result from factors (such as persistency) other than statistical fluctuations.
The Group also checked other outputs from the financial projection for reasonableness. Investment income was equal to 21%8 of premium and the expense margin (including commissions and premium tax) was equal to 35%. A 35% tax rate is assumed on profits and losses. The group felt that these assumptions were reasonable given the underlying growth rates and time horizon of the model. Over the effective period of the simulation, the statutory income statement, expressed as percentages of premiums, is as follows:
Premiums 100% Investment Income 21% Claims/Reserves 75% Expenses 35% Pre-Tax Profits 11% Tax 4% After-Tax Profit 7%
8 Since the target loss ratio includes both claims incurred and changes in active life reserves, it can be
expected that investment income will increase as a percentage of premium over the study period. A constant investment return percentage provides a margin for conservatism in the model.

24
6.6 Management Action Assumptions
The model uses various assumptions regarding how management will adjust premium rates in order to recognize emerging experience. All of these assumptions are based on the results of surveys of LTC carriers as well as the judgment from members of the task force. These assumptions include: High Re-price Ratio: 86% The high re-price ratio is the level that the actual loss ratio must exceed the expected 75% target before management will take action by increasing premium rates. This ratio corresponds to 115% of the target loss ratio. Low Re-price Ratio: 60% The low re-price loss ratio is the level that the actual loss ratio must fall below the target before management will take action by decreasing premium rates. This number is 80% of the target loss ratio. High Loss Ratio Phase-In Factor: 60% large companies
80% small companies These percentages represent the portion of business that is being re-rated when the actual loss ratio exceeds the high re-price ratio. In choosing the phase-in factors, the Group considered the following:
• The results of the latest survey of nine companies supported these choices of assumptions.
• The 86% re-price ratio implies that there will be little or no profit left. • The adverse claim experience that triggers the rate increase is on the
entire block in the model. In order to restore the profit margin, a company needs to re-rate a significant portion of the entire block.
• The danger of insolvency may induce the company to re-rate the
entire block.
• There have been examples of large and small companies implemented rate increases on the entire block.

25
• On a growing block of business, the new business is automatically re-rated. On the other hand, in-force policy forms that are only a few years old may not be included for the rate increase due to lack of credibility of their claim experience.
• Not all rate increases are filed in all states, not all rate increase filings are
approved, and not all approved rates are the same as the requested rates.
The Group felt that there is a greater tendency for small companies to rate the entire block than for large companies. The results of the follow-up survey appear to support this difference. Low Loss Ratio Phase-In Factor: 20% This number reflects the portion of the block to be re-rated due to lower than expected loss ratios. There is little historical evidence of rate decreases in LTC. Over the next ten years, rate decreases are not expected to be common. Reflecting rate decreases during both the seasoning period and the study period is conservative as premium income is reduced until premium rates are raised. Phase-In Delay: 24 months large companies 15 months small companies This period represents the elapsed period from the time when management recognizes favorable or unfavorable experience to the point when the rate adjustment is in effect. This period can be divided into four phases:
Phase 1 Decision made to adjust rates Phase 2 Prepare rate filings for state approval Phase 3 States review and approve the filings Phase 4 New rates billed to policyholders
For rate increases, the Group believed that a reasonable length of time for each of the last three phases is three months. The length for Phase 4 is consistent with one known source for published rate filing information9. The Group felt that it is difficult to quantify the length for Phase 1 because supporting data is not available. Furthermore, the start of the process is ambiguous. There are few options other than relying on survey results. Sales are generally more competitive for larger companies. A rate increase can hurt a company’s reputation; premiums for new policies would be higher (to be consistent with rate increase). New sales may suffer. Consequently, we believe the phase-in delay should be longer for large companies than for small companies.
9 California Insurance Department website - LTC insurance.

26
6.7 Reserve Strengthening
The original DI model contained logics to determine the impact of reserve strengthening on required surplus. When the loss ratio exceeds a specified loss threshold in a given year, additional reserves are set up at the end of that year. This reduces free surplus and increases the probability of ruin. The amount of additional reserve is the sum of all future excesses of experience loss ratio over the threshold loss ratio (i.e., a premium deficiency reserve). We reviewed the calculation routines and made several adjustments regarding the timing of the reserve strengthening and the amount:
• We adopted a three-year moving average loss ratio as the trigger for a reserve increase. The decision to strengthen reserves typically comes after the decision to increase rates for the following reasons. The question of reserve adequacy applies to the entire LTC block. If only a portion of the business is re-rated, reserve strengthening would not be automatic. In addition, reserves generally have more conservative margins than pricing assumptions. The use of a moving average simulates the delayed action. It also reflects our expectation that a single year’s adverse experience (much of which may be statistical fluctuation) will not be the basis for strengthening reserves.
• We refined the calculation of the additional reserve. In the year
where the experience loss ratio exceeds the loss ratio trigger described above, the premium deficiency is the excess of the experience loss ratio over the trigger on the portion of business not being re-rated, that is, the complement of the High Loss Ratio Phase-In Factor. The second year deficiency is the same excess but on the remaining portion not re-rated and so on. The additional reserve is the present value of all future premium deficiencies. The present value is taken with due consideration to an assumed interest rate and an average annual policy termination rate.
The effect of reserve strengthening is an increase in the required surplus. We noticed that the effect is inversely related to the phase-in factor, that is, high phase-in factor diminishes the effect of reserve strengthening. Reserve Strengthening Threshold Loss Ratio: 86% (average of 3 years) Reserve Strengthening %: 75%

27
The reserve strengthening percentage is set to approximate the effect of discounting future deficiencies by policy termination.
6.8 Other Model Assumptions
Loss Ratio Cap: 300%. The experience loss ratio is not allowed to exceed 300%. Surplus Accumulation Due the growth of the market, initial capital investment on new business and reserve requirements, it is unlikely there will be material dividends paid during the RBC testing period. Accordingly, we allowed the surplus to accumulate in excess of the required amount in any year.
Tax Recognition: 100% The assumed tax rate of 35% is the top marginal corporate tax rate. The current tax rate for LTC could be higher because of federal DAC proxy tax and the difference between statutory reserve and tax reserve in early policy years. However, the company’s effective tax rate is on the corporate level, not on the LTC product level. Companies’ effective tax rate is generally below 35%. Based on these two reasons, the Group decided to assume that the 35% is fully recognized. This is consistent with DI and most other accidental and health lines of business.
Years of Seasoning: 10 years The model is run for ten years before the testing period begins. The required surplus amount is reset at the end of the seasoning period. Testing Period: 5 years
We picked a five-year period to be consistent with the DI RBC modeling.

28
7 MODEL RESULTS
7.1 Results from Baseline Assumptions
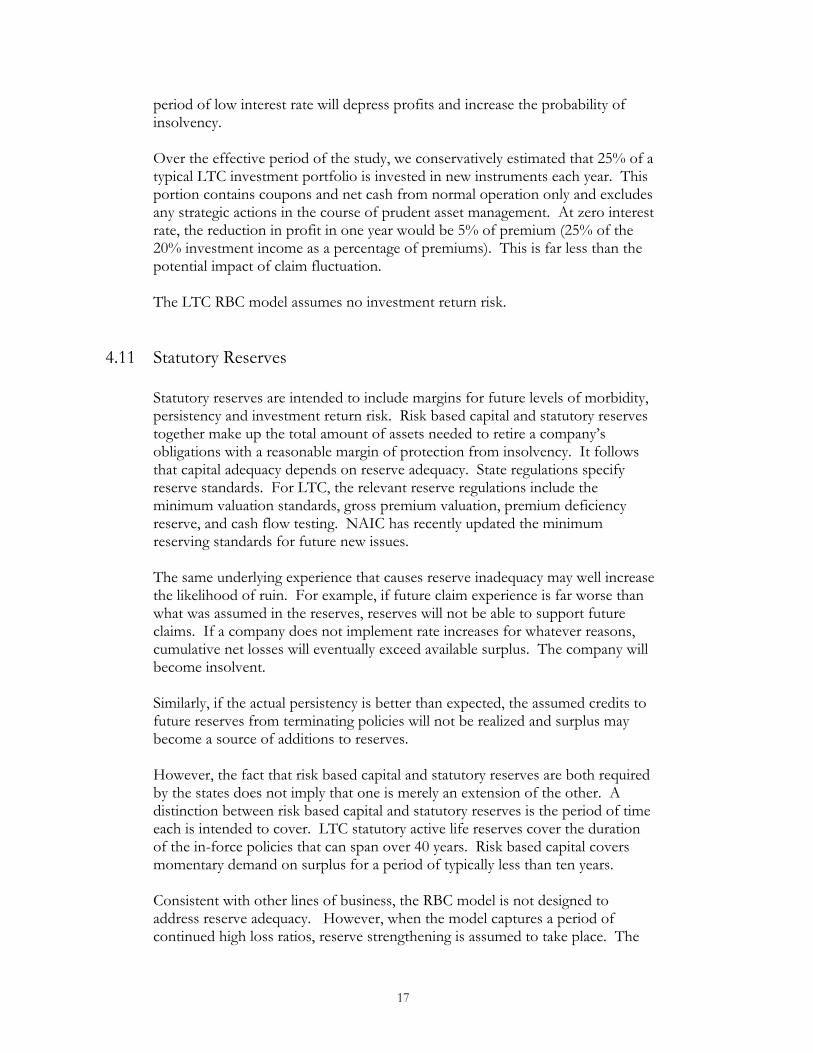
With the baseline assumptions, the model generated the following surplus requirements for a 5% ruin probability: Direct Earned Premiums % of Premiums Under $60 million: 15.6% $60 million & over: 8.2% As previously noted, 16 companies have premiums over $60 million. These companies together have over 73% of the total in-force premiums. Nevertheless, there is a noticeable discrepancy in required surplus between large blocks and small blocks. There are several possible explanations for the discrepancy. Small blocks will have greater year-to-year fluctuation of experience due to low frequency of claims. Companies in the small group have an estimated average 40,000 policies in-force. At even an annual claim rate of 1%, credibility of one year’s result is low. Second, there appear to be higher frequencies of rate increases for small blocks than large blocks. The management action adjustment in the RBC model probably did not fully eliminate the historical risk. Finally, small blocks appear to have a higher likelihood to report experience inaccurately. This can result in artificial fluctuation in year-to-year loss ratios. When reviewing the Loss Experience Forms, the group noted that most of the incomplete data came from the small blocks. In fact, the group decided to exclude data after the top 51 companies because there was an unacceptable level of missing data. All these factors have a cumulative effect on the standard deviation of incurred claim loss ratios. We ranked the companies in descending order by premium size and calculated the simple averages of the standard deviations of loss ratios by grouping companies in descending order by premium size. For example, the 10 companies with the most in-force have an average standard deviation of 5% of premium. The 40 companies with the most in-force have an average standard deviation of 11%. The resulting trend confirmed that small blocks have greater variability.
29
Average of Standard DeviationsBy Descending Group Size
0%2%4%6%8%
10%12%14%
1 6 11 16 21 26 31 36 41 46 51
Number of Companies Grouped By Size In Descending Order
Other aspects of the baseline assumptions somewhat offset the claim variability. For small companies, we have assumed a shorter phase-in delay and a larger phase-in factor than for the large companies.
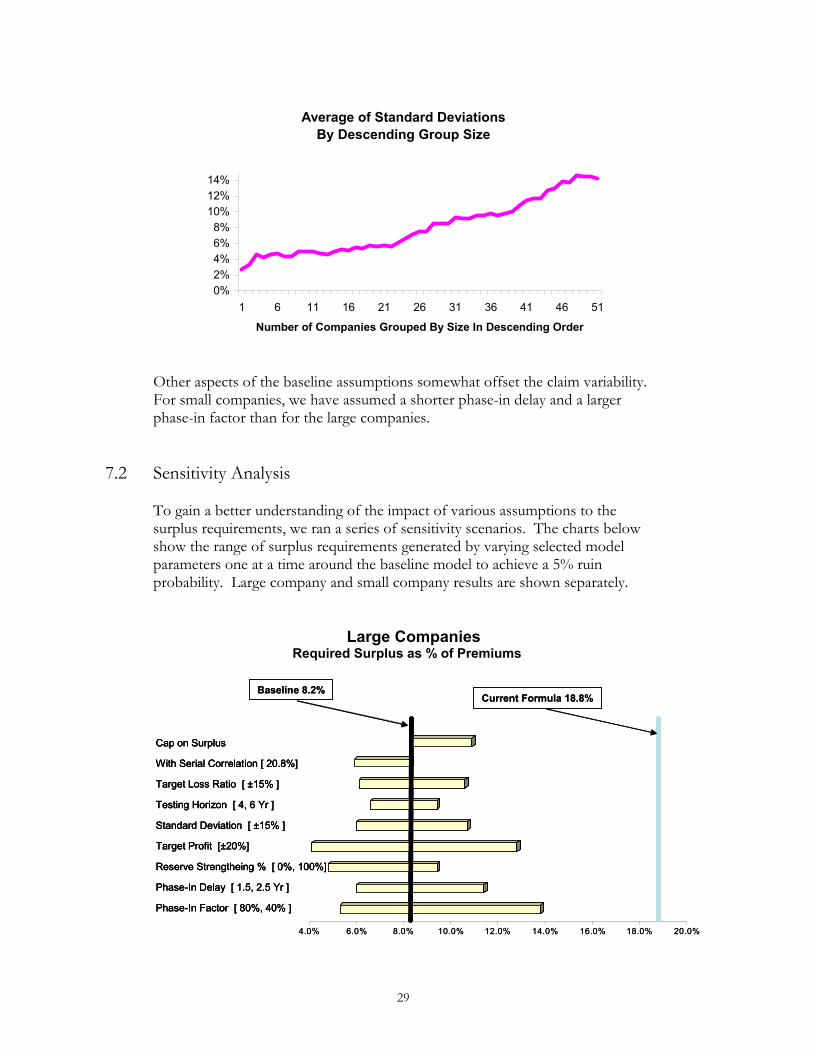
7.2 Sensitivity Analysis
To gain a better understanding of the impact of various assumptions to the surplus requirements, we ran a series of sensitivity scenarios. The charts below show the range of surplus requirements generated by varying selected model parameters one at a time around the baseline model to achieve a 5% ruin probability. Large company and small company results are shown separately.
Large Companies Required Surplus as % of Premiums
4.0% 6.0% 8.0% 10.0% 12.0% 14.0% 16.0% 18.0% 20.0%
Cap on Surplus
With Serial Correlation [ 20.8%]
Standard Deviation [ ±15% ]
Target Profit [±20%]
Target Loss Ratio [ ±15% ]
Testing Horizon [ 4, 6 Yr ]
Reserve Strengtheing % [ 0%, 100%]
Phase-In Delay [ 1.5, 2.5 Yr ]
Phase-In Factor [ 80%, 40% ]
Baseline 8.2%Current Formula 18.8%
4.0% 6.0% 8.0% 10.0% 12.0% 14.0% 16.0% 18.0% 20.0%
Cap on Surplus
With Serial Correlation [ 20.8%]
Standard Deviation [ ±15% ]
Target Profit [±20%]
Target Loss Ratio [ ±15% ]
Testing Horizon [ 4, 6 Yr ]
Reserve Strengtheing % [ 0%, 100%]
Phase-In Delay [ 1.5, 2.5 Yr ]
Phase-In Factor [ 80%, 40% ]
Cap on Surplus
With Serial Correlation [ 20.8%]
Standard Deviation [ ±15% ]
Target Profit [±20%]
Target Loss Ratio [ ±15% ]
Testing Horizon [ 4, 6 Yr ]
Reserve Strengtheing % [ 0%, 100%]
Phase-In Delay [ 1.5, 2.5 Yr ]
Phase-In Factor [ 80%, 40% ]
Baseline 8.2%Current Formula 18.8%

30
Small Companies Required Surplus as % of Premiums
For each of the assumption parameters, we defined a reasonable range of scenarios for that parameter.10 For example, the range for pre-tax profit is 9% to 13% as suggested by the survey. For certain parameters such as phase-in factor for small companies and serial correlation, we simply desired to see the sensitivity of results to specific parameter values. While there will be many situations where the effects of different values than the baseline assumptions cancel each other, there will also be extreme scenarios where they compound.
10 For the small company phase-in delay, we believe that the baseline is appropriate for well-managed companies who
regularly review their LTC experience and take immediate action. For sensitivity testing, we used lower levels to reflect less rigorous management review and action.
6.0% 9.0% 12.0% 15.0% 18.0% 21.0% 24.0% 27.0% 30.0% 33.0%
Cap on Surplus
With Serial Correlation [ -20.8%]
Standard Deviation [ ±15% ]
Target Profit [±20%]
Target Loss Ratio [ ±15% ]
Testing Horizon [ 4, 6 Yr ]
Reserve Strengtheing % [ 0%, 100%]
Phase-In Delay [ 1, 2 Yr ]
Phase-In Factor [ 60%, 40% ]
Baseline 15.6%Current Formua 28.8%
6.0% 9.0% 12.0% 15.0% 18.0% 21.0% 24.0% 27.0% 30.0% 33.0%
Cap on Surplus
With Serial Correlation [ -20.8%]
Standard Deviation [ ±15% ]
Target Profit [±20%]
Target Loss Ratio [ ±15% ]
Testing Horizon [ 4, 6 Yr ]
Reserve Strengtheing % [ 0%, 100%]
Phase-In Delay [ 1, 2 Yr ]
Phase-In Factor [ 60%, 40% ]
Cap on Surplus
With Serial Correlation [ -20.8%]
Standard Deviation [ ±15% ]
Target Profit [±20%]
Target Loss Ratio [ ±15% ]
Testing Horizon [ 4, 6 Yr ]
Reserve Strengtheing % [ 0%, 100%]
Phase-In Delay [ 1, 2 Yr ]
Phase-In Factor [ 60%, 40% ]
Baseline 15.6%Current Formua 28.8%

31
As an illustration, consider the High Loss Ratio Phase-In Factor (PIF) and the Phase-In Delay (PID). Combination of values for these two parameters produced the following range (based on large company results):
7.3 Other Sensitivity Considerations
7.3.1 Rate Guarantees and Rate Stability Regulation
Other than the proportion of business subject to rate change and the timeframe to implement the rate change, the baseline assumptions did not consider the effect of other rate restrictions. One restriction is any premium rate guarantee for a specified period in certain LTC contracts. Another potential restriction is the NAIC rate stability model regulation. This regulation requires a margin in the pricing for moderately adverse conditions. In theory, the frequency of rate changes should be lower than before, the profit margin higher and the phase-in delay longer. The Group decided not to incorporate these considerations in the baseline assumptions for the following reasons. We identified less than five companies that granted rate guarantee provisions to recently issued policy forms. A conservative estimate would be that less than 5% of all in-force policies have rate guarantees. Furthermore, these guarantees are relatively new and apply to policies issued primarily during the last 3 years. They would have very small impact on historical loss ratio fluctuation. The rate stability regulation has been in effect since 2002. It affects slightly more than 50% of the new issues since then.
PIF = 80% 60% 60% 60% 40%PID = 1.5 1.5 2 2.5 2.5
Baseline
4.1% 5.9% 8.2% 11.3% 17.0%
PIF = 80% 60% 60% 60% 40%PID = 1.5 1.5 2 2.5 2.5
Baseline
4.1% 5.9% 8.2% 11.3% 17.0%

32
Claims associated with policies under these regulations would also have minimal impact on overall loss ratio fluctuations over the next 10 years. To assess the impact of rate guarantee or the rate stability regulation, we tested a scenario where we changed a number of assumptions, namely, a higher trigger for rate increase, a lower phase in factor and higher profits:
Required Surplus
Earned Premiums
Baseline 115% Re-price LR
60% Phase In Factor (80% for Small Companies.)
11% Profits
120% Re-price LR
40% Phase In Factor (60% for Small Companies.)
13% Profits Under $60 Million 15.6% 21.8% $60 Million & Over 8.2% 9.9%
Rate guarantee and rate stability regulation appear to have a greater impact on small companies than on large companies.
7.3.2 Limited Pay Policies
Policies with a limited period of premium payments have been available for a number of years. These policies would limit the insurers’ ability to restore future margins. Limited pay policies currently comprised of less than 1% of the total in-force. There is no evidence that substantial portion of new sales are limited pay policies. To date, there are only very few companies with a significant portion of limited pay policies. For these reasons, the baseline assumptions ignored the potential impact of limited pay policies. In a premium-based RBC formula such as the current formula, special treatment should be required for limited pay policies. For example, the RBC formula for limited pay policies that are paid-up may need to be a function of active life reserves. With a claim-based RBC formula, no such issue exists.

33
8 FORMULA DEVELOPMENT
8.1 Process for Developing a Recommended Formula With the results from simulation runs using the baseline assumptions and sensitivity scenarios, the Group proceeded to develop the recommended formula. We also examined different exposure units besides earned premium that may match insolvency risk more effectively. The steps we took to develop a recommended formula are as follows:
1. Review model results and agree on the recommended required surplus as percentages of premiums,
2. Estimate the relationship between claim reserves, incurred claims and
premiums,
3. Address potential issues concerning the new factors,
4. Convert the recommended premium factors to claim reserve and incurred claim factors, and
5. Estimate the potential impact of the recommended formula.
8.2 Premium Factors The large and small company baseline assumptions represented two sets of best-guess parameters. The sensitivity runs provided a range of reasonable possibilities. In deriving the recommended premium factors, the Group considered the following:
• The baseline assumptions were developed using the Group’s interpretation of industry loss ratio averages and survey results. We recognized that individual companies’ experience would likely be different from the baseline assumptions.
• The results from the multitude of sensitivity tests suggest that there
is a considerably wide range of possible surplus requirements.
• Certain risks, such as persistency and investment return, were not considered.
• The model is only a rough representation of reality.

34
Under these circumstances, prudent judgment is called for. The group spent considerable time examining the sensitivity test results. We concluded that the current factors are probably conservative. The results from the baseline assumptions would probably not cover the majority of variations among the companies. The Group decided to recommend a 50% loading on the premium factors from the baseline assumptions. The 50% turned out to be approximately half-way between the current factors and the baseline factors. The comparison of premium factors is as follows:
Earned Premium Baseline Loaded Current11
Under $60 Million 15.6% 23.4% 28.8% $60 Million & Over 8.2% 12.3% 18.8%
8.3 Conversion to a Claim-Based Formula
The current formula uses a combination of earned premium and claim reserve factors. For a given block of new issues, earned premiums decrease in the future due to policy termination while claims increase in the future by attained age. The insolvency risk modeled is the volatility in claim experience. In the later policy durations where claim activities are at the highest, the RBC margin of protection using premium factors would be decreasing. Note that in the graph below, the RBC margin in the early years far exceeds the claim risk it is protecting.
Incurred Claim Loss Ratios
Single Year of Issues
1 6 11 16 21 26 31 36 41 46 51
Policy Year
0%
50%
100%
150%
200%Incurred Claims
20% Premium as Margins
11 We added 3.8% of earned premiums (equivalent to 5% of claim reserves) to the current formula of 25% of the first
$50 million of earned premiums net of reinsurance and 15% in excess of $50 million.

35
A premium factor could conceivably be devised so that the protection is adequate in the later years. However, this would produce very large RBC requirements in the early policy years and could become a barrier to entry into this line of business. This is essentially the situation under the current formula except that the protection is not adequate in the later years. For a growing block, premium factor can track reasonably well with claims since the ratio of claims to premiums increases moderately. In a closed block of business, premium factor will rapidly be out of pace with claims. Because of the mismatch between premiums and claims in the later years, the group considered other factors as candidates for the RBC formula: net amount at risk, paid claims, incurred claims, claim reserve and active life reserve. Net amount at risk follows the premium pattern but recognizes prior claim payments12. The rest follows the incurred claim pattern. The group was concerned about the situation where the active life reserves are inadequate. If active life reserves are used as the basis for RBC, any inadequacy will carry to the RBC level. Paid claims have the advantage of being more stable than incurred claims, but they are difficult to convert from premium factors because they vary considerably by company. In the final analysis, a substantial majority of the group picked incurred claims as the factor to replace premiums. The group also decided not to retain a premium component because claim fluctuation has little to do with premiums. The business financial projection provided the future relationship between earned premiums and incurred claims for the industry as a whole. Claim reserves track reasonably well with incurred claims and tend to lag behind. Using claim reserves would provide a slight level of conservatism in the later policy years, provided that we match the relationship between claim reserves and incurred claims well in the early years. Accordingly, the group recommended no change to that portion of the formula.
12 Net amount at risk is defined as the total amount of maximum daily benefit in-force during a year, less the
total amount of actual daily benefits of all prior claims. This factor primarily measures claim frequency with some variation for severity of claim. In contrast, the claim reserve factor addresses the claim severity risk.

36
Projected Relationship between Incurred Claims and Claim Reserves for a Growing Block
(Different Scales)
2004 2009 2014 2019 2024 2029 2034 2039
Incurred Claims
Claim Reserve
The financial model suggests that a conservative estimate is that claim reserve will be 76% of premiums averaged over the next ten years. Thus, the current 5% claim reserve factor translated to 3.8% of premiums. The Group also decided to retain the current tiers based on the size of the business. Large companies (Tier 2) share the same premium factor for Tier 1 on the portion of premiums subject to the Tier 1 factor. Using an average size of $260 million of premiums for the large companies, we estimated that there is a credit equal to approximately 2.6% of premiums. This credit was deducted from the premium factor for Tier 2. In order to convert to incurred claim factors, we selected the projected 2006 industry-wide incurred claim loss ratio of 53%. This is a conservative choice to convert premium factors to incurred claim factors. In the same fashion, the break point of $50 million premiums between the two tiers conservatively translated to a recommended new break point of $35 million of incurred claims
37
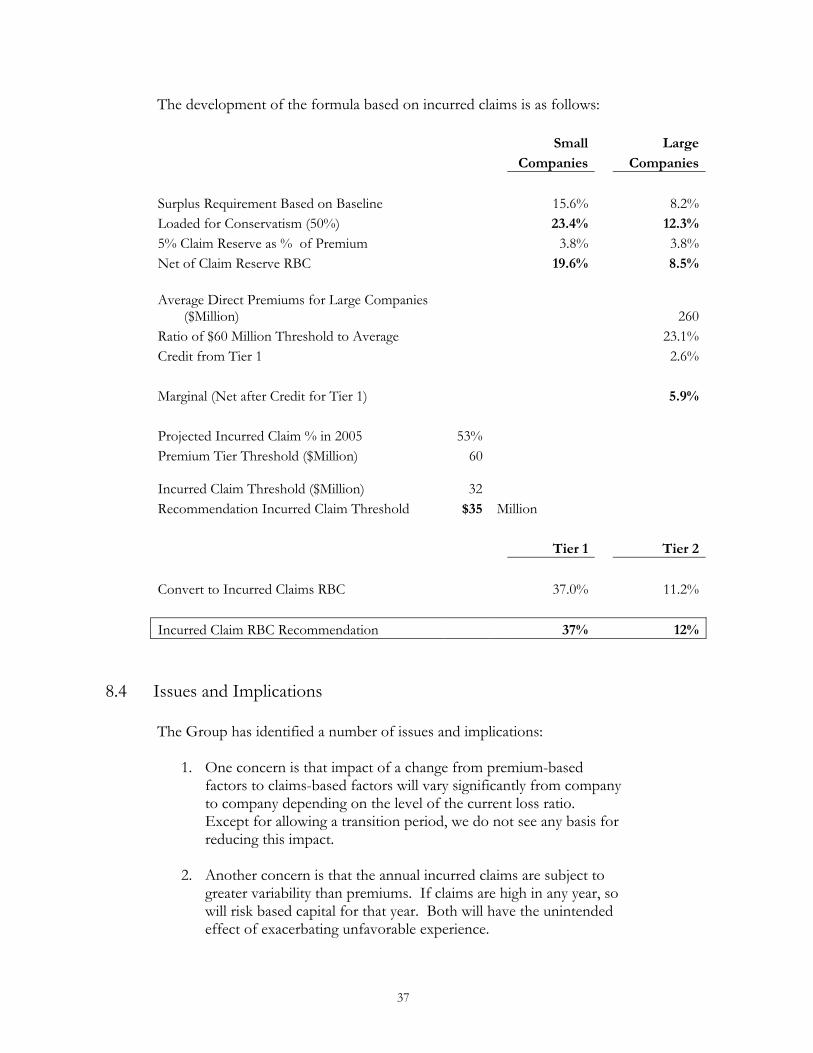
The development of the formula based on incurred claims is as follows:
Small Large Companies Companies
Surplus Requirement Based on Baseline 15.6% 8.2%Loaded for Conservatism (50%) 23.4% 12.3%5% Claim Reserve as % of Premium 3.8% 3.8%Net of Claim Reserve RBC 19.6% 8.5% Average Direct Premiums for Large Companies
($Million) 260Ratio of $60 Million Threshold to Average 23.1%Credit from Tier 1 2.6% Marginal (Net after Credit for Tier 1) 5.9% Projected Incurred Claim % in 2005 53% Premium Tier Threshold ($Million) 60
Incurred Claim Threshold ($Million)
32 Recommendation Incurred Claim Threshold $35 Million Tier 1 Tier 2
Convert to Incurred Claims RBC 37.0% 11.2% Incurred Claim RBC Recommendation 37% 12%
8.4 Issues and Implications The Group has identified a number of issues and implications:
1. One concern is that impact of a change from premium-based factors to claims-based factors will vary significantly from company to company depending on the level of the current loss ratio. Except for allowing a transition period, we do not see any basis for reducing this impact.
2. Another concern is that the annual incurred claims are subject to
greater variability than premiums. If claims are high in any year, so will risk based capital for that year. Both will have the unintended effect of exacerbating unfavorable experience.

38
Expected incurred claim loss ratio does increase relatively steadily each year. The variability should be measured against the expected loss ratio. Actual historical loss ratio would exhibit greater variability than if it is compared to expected. Nevertheless, the Group recognized that annual incurred claims might not be as stable as premiums. An average of the most recent three-year incurred claims would be a more stable factor. To give greater effect to the current year’s incurred claims, the averaging method could increase the weight for this year relative to the prior two while still increasing stability of RBC. The proposed formula already included an adjustment for averaging by using the projected incurred claim loss ratio one year earlier.
3. For companies with a closed block of business, the
recommended formula will require more risk based capital in the future than the current formula. Below is an illustration of a typical closed block of in-force business that mirrors the industry average on closed blocks.
In-Force Business Only
2004 2009 2014 2019 2024 2029 2034 2039
Current RBC
Proposed RBC

39
For a growing block of business, the recommended formula will generally lower risk based capital initially from the current formula but will require more ultimately. A growing block may exhibit the following pattern:
The above graph illustrated a block of business consisted of in-force business as in the previous graph and new business with a constant stream of new issues through 2014. The RBC using the new formula exceeds the corresponding RBC under the current formula shortly after the new issue period. However, depending on the growth rate of new business, the recommended formula may provide lower risk based capital than the current formula for a continuously growing block. For new business, the recommended formula will likely result in lower initial capital investment. This will result in an improvement in the expected return on investment.
5 With higher RBC in the later years, companies will need to develop greater disciplines in managing capital and business growth. This would require a review of the capital strategy and planning for expected retention of more LTC profits in the later years. Ultimately, this is beneficial to the companies and their policyholders.
6 For closed blocks of business, the new formula may intensify the
pressure for rate increase. The Group considered this a distinct possibility. However, it is better to make corrections today than tomorrow. It should be noted that, for the majority of the in-force business, the loss ratio criteria for rate adjustments are not dependent on the level of risk based capital.
New and In-Force Business
2004 2009 2014 2019 2024 2029 2034 2039
Current RBC
Proposed RBC

40
8.5 Transition to the Recommended Formula
Any change in the risk based capital formula will have an impact on a company’s capital management plan. The Life Risk Based Capital Subgroup may want to consider the following alternatives for transition to a new formula:
• Use a grading of the new formula and the current formula. For example, over a 5-year period, the risk based capital for the first year would be 80% of the current formula and 20% of the new formula. For the second year, it will be 60% of the current formula and 40% of the new formula, and so on. This approach also provides a gradual transition from a premium-based formula to a claim-based formula.
• Set the effective date of the new formula to be 3 years from the
adoption date. This allows companies the time to plan and to adjust to the new formula.
• Permit voluntary adoption of the new formula over the next 3 years.

41
9 TOPICS FOR FUTURE INVESTIGATION
This section outlines a number of future considerations to enhance insolvency protection for LTC insurance.
9.1 Multiple Blocks of Business
Many LTC insurance companies have significant other blocks of business. The Central Limit Theorem of statistics states that given a distribution with a mean and a variance, the sampling distribution of the mean approaches a normal distribution with a decreasing variance as the sample size increases. In other words, a small block of LTC could be combined with the other blocks of business for claim variance and not be treated in isolation. This is one way to reduce the significantly higher factor on small blocks.
9.2 Data Management
We have learned that LTC insolvency risk is largely dependent on a company’s actions. A method of collecting information regarding company’s actions should be developed so that there will be ample supporting data to serve as inputs to future review of the formula.
9.3 Model Refinements
Ten years or so from now, persistency and investment return risks will have significant effect on surplus requirements. A new model should be developed so that morbidity, persistency and investment return risks and their interaction can be simulated. In addition, the model should deal with total capital requirements that include both statutory reserve and risk based capital.
9.4 Individual Company Versus Industry Average
The current one-size-fits-all approach should be evaluated. Individual companies’ own characteristics have tremendous influences on its own insolvency risk. One suggestion is for the Life Risk Based Capital Subgroup to provide a reasonably conservative, safe-harbor type formula. At its discretion, a company may determine its own capital requirement under a set of specific guidelines stipulated by NAIC.

42
10 LONG TERM CARE RISK BASED CAPITAL WORK
GROUP MEMBERS
10.1 Academy RBC Work Group Members Bob Yee (Chair) Joanna Ossinger (Academy Staff)
Mike Abroe Dan Nitz Anthony Green Al Schmitz Norm Hill Steve Sperka Burton Jay John Timmerberg Warren Jones Dan Winslow Ed Mohoric Bill Weller
10.2 Interested Parties
Dana Fulton Jim Glickman Larry Gorski Loretta Jacobs Barbara Lautzenheiser Bart Munson Amy Pahl Jim Reiskytl Steven Schoonveld

43
APPENDIX A
Model Description
The model description contains four sections. Two inputs to the simulation model is the standard deviation and serial correlation of the incurred benefit loss ratios. The first section describes how these two inputs are modified to remove the effect of management action in the data. The reason for this adjustment is that the model simulates management action when experience is emerging differently than expected. The surplus formulas describe how the model takes the model office input, loss ratio deviates and management action information and loops through the testing period to determine the ruin probability based on the initial required surplus amount. The loss ratio section describes how loss ratios are determined in the model based on the distribution of random deviates. The management action section describes how the model simulates premium rate changes based on changes in the loss ratios. I. Standard Deviation and Serial Correlation
• Calculate the standard deviation and serial correlation of the incurred claim
loss ratios for each of 51 companies over the years when data is available (1995 to 2001).
• Input parameters for ‘Management Action’ are:
- starting target loss ratio (70%) - loss ratio annual increase % (vary by loss ratio class and premium
size class) - high and low re-pricing incurred claim loss ratios - phase-in % for high & low - phase-in delay - 2001 premium
• Change Due to Management Action: Start with actual loss ratio year 1,
apply the re-pricing criteria, phase-in %, phase-in delay.
• LR Trend: Multiply by the Annual Trend % to determine total next year’s expected change in LR due to management action and trend. The Annual Trend % varies by premium class and loss ratio class.

44
• Subtract from next year’s actual to get Change in LR due to Random Claim
Fluctuation. • This is done for each year in test period. • Calculate the Standard Deviation & Serial Correlation of the changes for
each company.
Determine the premium-weighted averages of Standard Deviation & Serial Correlation by premium class. II. Surplus Formulas The model starts with a target surplus amount that is reset to initial level at the beginning of the testing period (After the initial seasoning period is completed). For each year in the testing period, the amount of surplus changes based on profits earned in the year, where profit is defined as:
• the pricing pre-tax profit (expressed as a percentage of premium, plus • any gain or loss caused by the actual loss ratio deviating from the pricing loss ratio,
less • • tax.
Formulas: Surplus (J + 1) = Surplus (J) +CIS(J); all values are expressed as a percent of premium.
where
CIS(J) = Profit(J) – Tax(J) Profit(J) = Pricing Pre-tax Profit + TLR(J) – LRH(J)
Tax(J) = Profit(J) x Tax rate
Definitions: CIS = Change in Surplus TLR = Target Loss Ratio LRH = Loss Ratio History
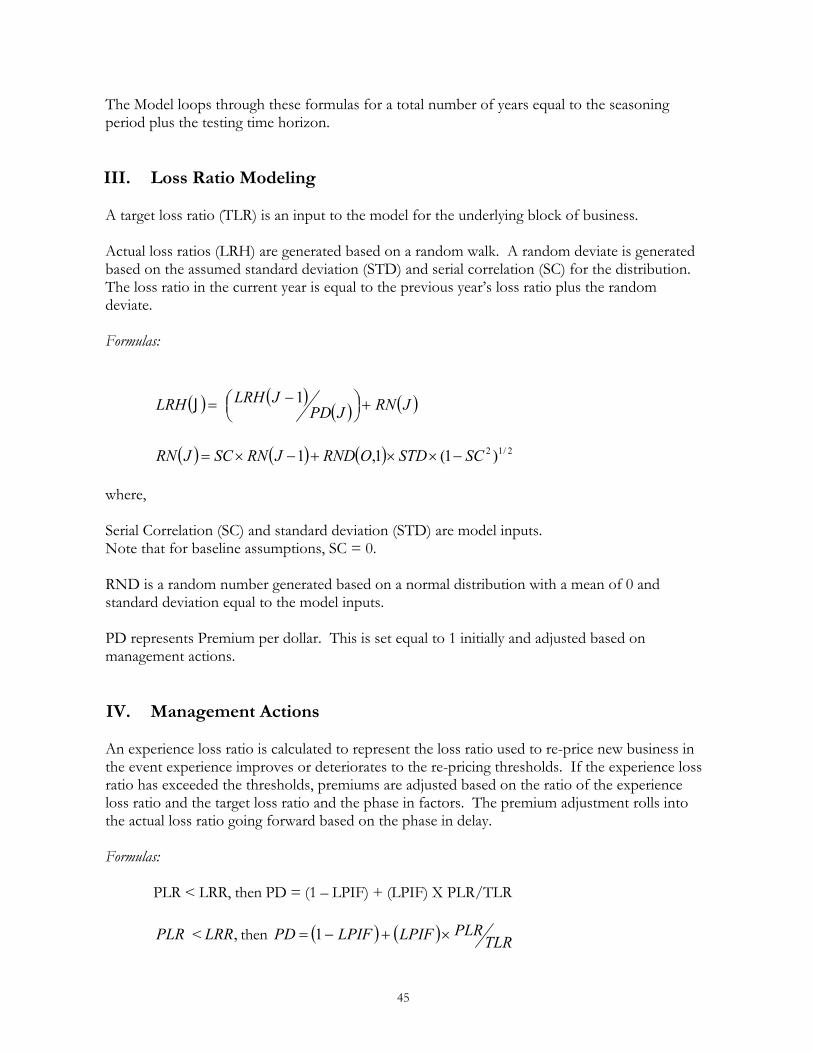
45
The Model loops through these formulas for a total number of years equal to the seasoning period plus the testing time horizon.
III. Loss Ratio Modeling A target loss ratio (TLR) is an input to the model for the underlying block of business. Actual loss ratios (LRH) are generated based on a random walk. A random deviate is generated based on the assumed standard deviation (STD) and serial correlation (SC) for the distribution. The loss ratio in the current year is equal to the previous year’s loss ratio plus the random deviate. Formulas:
( ) ( )( ) ( )JRNJPD
JLRHLRH +
−= 1 J
( ) ( ) ( ) 2/12 )1(1,1 SCSTDORNDJRNSCJRN −××+−×= where, Serial Correlation (SC) and standard deviation (STD) are model inputs. Note that for baseline assumptions, SC = 0. RND is a random number generated based on a normal distribution with a mean of 0 and standard deviation equal to the model inputs. PD represents Premium per dollar. This is set equal to 1 initially and adjusted based on management actions. IV. Management Actions An experience loss ratio is calculated to represent the loss ratio used to re-price new business in the event experience improves or deteriorates to the re-pricing thresholds. If the experience loss ratio has exceeded the thresholds, premiums are adjusted based on the ratio of the experience loss ratio and the target loss ratio and the phase in factors. The premium adjustment rolls into the actual loss ratio going forward based on the phase in delay. Formulas: PLR < LRR, then PD = (1 – LPIF) + (LPIF) X PLR/TLR PLR < ,LRR then ( ) ( ) TLR
PLRLPIFLPIFPD ×+−= 1

46
If, PLR < ,HRR then ( ) ( ) TLR
PLRHPIFHPIFPD ×+−= 1 PLR is a weighted average of prior experience loss ratios (LRH) used to price new business. The PLR used to price new business is calculated from previous loss ratios based on the phase-in delay. LPIF, HPIF = Low and high loss ratio phase-in factor. LRR, HRR = Low and high loss ratio re-price levels.
If ARLR = where the reserve strengthening loss ratio threshold and if the average of the last 3 PLRs > ARLR, , then the following additional reserve is deducted from surplus:
RSP × ( PLR – ARLR ) × ( 1 – HPIF ) / ( HPIF + I )
where RSP is the reserve strengthening %, and I is the investment yield. The above formula assumes the experience variance, ( PLR – ARLR ), holds in future years. This is appropriate for a stationary population scenario. An argument can be made that reserve adequacy is evaluated on current in-force business only. With future decrements on the closed block, the initial deficit would decrease in the future.
For a 3% average annual decrement, the PV (no interest, decrements only) as percentages of total is as follows:
Years PV % of Total 10 85%
20 74% 30 65% 40 57% 50 51%
75% was assigned to RSP.
APPENDIX B

47
August 2002 Survey Result Summary
Average Average Co. 12 Co. 11 Co. 10 Co. 9 Co. 8 Co. 7 Co. 6 Co. 5 Co. 4 Co. 3 Co. 2 Co. 1
1 Industry Growth 9% 10% >10% >10% 5-10% 10% 5-10% 5% >10% 5%
1a Co Growth 10% 5-10% >10% >10% >10% 5-10% >10% 10% 5% >10% >10%
2 Prem Deduct. 11% >10% >15% 10% 7% 5-10%
3 ROI or Stat Prof ROI After-Tax* ROI Pre-T Pre-T ROI ROI After-T ROI After-T After-T After-T ROI ROI
4 Co Target 14% 10% 12% 11% 12-15% 15% 15% 4-5% 12% 5% 5-6% 5% 16% 12-16%
5 Industry Target 14% 12% 10-15% 11% 12-15% 15% 15% 4-5% 15% 5-10% 5-6% 10-15% 15% 10-12%
6 Industry Actual 10% 6% 5% 5-8% 10% 9% 12% 10-15% < 5% 3% 1-2% 12%
7a Reprice Upper 113% 120% 130% 115% 105% 110% 110% 110% 115% 115%
7b Reprice Lower 70% 80, 95% 80% 85% 70% 40% 50% 85%
8 % Repriced 56% 100% 30% 30-40% 100% 40% 20%
9 Phase In (Months) 18** 6-12 6-24 6-9 30 24 12 18 12 60 18
10 Invest Yield 7.1% 7.5% 6-7% 7-8% 7.25% 7-7.5% 6.75-7% 7% 6.75% 7% 7.2% 7%
Pre-T = Pre-Tax Statutory Profits After-T = After-Tax Statutory Profits
* After-Tax Statutory Profits translated to Pre-Tax Statutory Profits assuming 35% tax rate. ** Ignored one outlier.
December 2003 Survey Result Summary
CO. A CO. B CO. C CO. D CO. E CO. F CO. G CO. H CO. I
1 Premium Size 102 425 140 95 50 50 48 NA 6 3
2 Phase In (Months) 18 30 15 15 24 18 9 24 12 12
3 Reprice Upper 16% NA 0.2 0.1 0.15 NA NA 0.2 0.1 0.2
4 % Repriced 78% 0.65 0.8 0.75 0.8 NA 0.8 0.4 1 1

48
APPENDIX C
Loss Experience Form A Incurred Claim Loss Ratios
NAIC 2001Company Earned
Code Premiums 1995 1996 1997 1998 1999 2000 2001 2002 94-95 95-96 96-97 97-98 98-99 99-00 00-01 Std Dev70025 759,977,028 27% 32% 38% 37% 40% 46% 49% 46% 5% 6% -1% 3% 7% 3% -3% 3.7%65099 470,117,449 19% 20% 19% 17% 20% 29% 27% 31% 1% -1% -2% 3% 9% -2% 4% 4.0%76325 379,053,159 41% 49% 50% 55% 66% 56% 61% 89% 7% 1% 6% 11% -9% 4% 28% 11.3%61263 395,458,779 41% 36% 34% 34% 34% 33% 38% 40% -5% -1% 0% -1% -1% 5% 2% 3.1%63282 337,243,362 52% 44% 49% 46% 39% 38% 44% 53% -8% 5% -3% -7% 0% 5% 9% 6.5%87726 267,118,501 20% 25% 15% 17% 19% 21% 25% 38% 6% -11% 2% 1% 3% 4% 13% 7.2%65005 213,349,817 22% 22% 24% 21% 24% 25% 23% 26% 0% 2% -3% 3% 1% -2% 3% 2.4%62235 231,526,353 35% 29% 30% 20% 15% 12% -7% 1% -10% -4% 12% 4.7%65978 214,581,046 12% 13% 19% 35% 50% 48% 41% 37% 1% 6% 16% 15% -2% -7% -4% 9.2%64130 168,881,967 17% 14% 19% 27% 28% 26% 34% 36% -3% 6% 7% 1% -2% 8% 2% 4.4%69477 103,026,557 16% 21% 28% 31% 34% 34% 49% 44% 5% 7% 3% 3% 0% 15% -5% 6.2%71412 61,335,107 38% 27% 32% 46% 51% 38% 42% 47% -11% 5% 14% 5% -13% 4% 5% 9.7%86231 101,865,755 34% 33% 35% 37% 44% 47% 52% 54% -2% 3% 2% 7% 3% 5% 2% 2.8%67121 91,612,448 22% 22% 23% 19% 21% 37% 20% 27% 0% 1% -5% 3% 16% -17% 7% 10.2%61387 NA 30% 34% 35% 32% 32% 34% 34% 4% 1% -3% 0% 2% 0% -34% 2.3%90611 106,596,797 32% 33% 14% 9% 8% 8% 5% 4% 1% -19% -5% -1% 0% -3% -1% 6.9%60054 59,133,012 16% 20% 18% 26% 28% 31% 28% 37% 3% -2% 8% 2% 3% -3% 9% 4.4%66915 57,868,385 10% 12% 18% 24% 23% 22% 23% 25% 2% 6% 6% 0% -2% 1% 2% 3.0%68330 41,517,337 110% 110% 92% 92% 96% 0% -17% 3% 12.0%69345 49,332,298 12% 7% 7% 7% 7% 12% 13% 16% -4% 0% 0% 0% 4% 1% 3% 2.6%60593 33,754,792 44% 37% 53% 61% 55% 53% 64% 73% -7% 15% 8% -5% -3% 11% 9% 8.8%60380 31,006,612 24% 31% 31% 29% 31% 36% 37% 49% 8% 0% -2% 2% 5% 1% 12% 5.0%71404 28,110,087 22% 17% 14% 23% 48% 22% 31% 40% -4% -3% 9% 25% -25% 9% 9% 15.6%68241 36,534,041 32% 31% 31% 19% 54% 42% 27% 24% -1% 0% -12% 35% -13% -14% -3% 17.0%64297 31,603,975 39% 57% 31% 4% 4% 12% 9% 8% 18% -26% -27% 0% 9% -3% -1% 16.8%65110 29,875,969 9% 9% 37% 14% 15% 13% 12% 14% 0% 28% -23% 1% -2% -1% 2% 14.8%80578 23,270,874 15% 12% 18% 31% 19% 23% 23% 28% -3% 6% 13% -12% 4% 0% 5% 7.9%92916 17,331,024 43% 50% 106% 127% 132% 77% 82% 85% 7% 55% 22% 4% -55% 6% 3% 32.6%83437 18,426,147 16% 25% 26% 14% 22% 25% 21% 26% 9% 1% -12% 8% 3% -4% 5% 7.4%65021 16,191,955 41% 40% 58% 57% 64% 75% 71% 70% -1% 18% -1% 7% 11% -4% -1% 8.1%71471 15,626,537 58% 112% 75% 95% 75% 74% 66% 62% 53% -36% 19% -20% 0% -8% -4% 28.7%69515 19,451,328 2% 6% 8% 17% 14% 10% 16% 22% 5% 2% 9% -3% -4% 6% 6% 4.9%80594 11,287,439 9% 30% 17% 20% 15% 19% 18% 30% 21% -13% 3% -5% 4% -1% 12% 11.1%60836 14,281,906 74% 61% 70% 61% 62% 102% 86% 70% -13% 9% -9% 1% 40% -16% -16% 20.2%62553 10,172,587 36% 41% 47% 48% 41% 23% 28% 28% 5% 6% 1% -6% -18% 5% 0% 8.6%77887 7,289,330 32% 34% 30% 63% 55% 52% 82% 54% 2% -4% 33% -8% -3% 30% -28% 21.6%61271 5,873,033 12% 11% 9% 13% 13% 13% 17% 32% -1% -2% 4% 0% 0% 4% 15% 5.7%64211 6,100,260 47% 92% 103% 105% 107% 105% 98% 157% 45% 11% 2% 2% -2% -7% 59% 25.6%69353 7,537,024 19% 28% 45% 15% 18% 17% 17% 38% 9% 17% -31% 4% -1% 1% 21% 17.0%65676 5,750,679 5% 13% 27% 27% 20% 36% 144% 66% 7% 14% 0% -7% 16% 109% -78% 54.7%86355 7,177,241 72% 83% 68% 129% 81% 94% 75% 71% 11% -15% 62% -48% 13% -19% -4% 34.3%61751 4,831,643 84% 96% 68% 52% 55% 79% 85% 86% 13% -28% -17% 3% 24% 6% 1% 17.6%68284 5,792,249 19% 19% 37% 20% 20% 23% 7% 24% 1% 17% -17% 0% 2% -15% 17% 13.5%69701 4,018,838 77% 51% 88% 10% 102% 133% 149% 93% -26% 37% -79% 92% 32% 16% -56% 59.4%67199 3,111,806 117% 123% 150% 167% 182% 152% 192% 246% 6% 27% 17% 15% -30% 40% 54% 26.8%60186 3,364,958 30% 32% 18% 32% 13% 13% 133% 160% 1% -14% 14% -19% 0% 120% 27% 47.5%71835 116,092 7% 15% 13% 1% 15% 22% 14% 0% 8% -2% -12% 13% 7% -8% -14% 10.7%66281 6,891,090 9% 3% 2% 112% 124% 75% 71% 27% -7% -1% 110% 12% -48% -5% -44% 52.5%68195 2,972,015 4% 8% 16% 10% 14% 11% 45% 42% 4% 8% -6% 5% -3% 33% -3% 13.2%86991 214,554 20% 13% 16% 21% 20% 29% 48% 13% -8% 4% 5% -2% 10% 18% -35% 17.0%68500 893,238 15% 11% 15% 25% 23% 22% 16% 30% -4% 4% 10% -2% -1% -6% 14% 7.5%
Annual Change in Loss RatoIncurred Claim Loss Ratio