report of task force on energy -...
TRANSCRIPT

Report ofTask Force on EnergyNovember 2014


Contents
Executive Summary 01
Introduction and Key Issues 05
Objectives and Scope of Policy 09
Meeting the Demand-Supply gap: Scenario Analysis 27
The Road Ahead 31

Executive summary
01 Report of Task Force on Energy

02Report of Task Force on Energy
1. Executive summaryQuality power supply to various competing sectors is a sine-qua-non to meet the ambitious development objectives of newly formed state of Telangana. Driven by considerable growth in demand from agriculture, domestic, industrial sectors and metro city of Hyderabad, the per-capita consumption in the state stands at 9851 units against a national average of 9172 units for FY 2012-13.
Energy deficit in Telangana for last three years was in the range of 5%-12%. Energy requirement in Telangana was 47,428 MU in FY 13-14, of which only 44,946 MU could be met resulting in an energy deficit of nearly 5%. Going forward, energy requirement is expected to see an increase of around 11% for the period FY 2014-15 to FY 2018-19.
This policy paper, attempts to chalk out a roadmap by visualizing probable changes in fuel mix, improvement in efficiencies across the generation-transmission-distribution value chain, longevity of current PPAs and programmed capacity augmentation in generation vis-à-vis government’s objective of supplying 24 x 7 quality power supply to all. Figure 1 illustrates demand-supply scenarios projected over the next 5 years.
In next 5 years, significant thermal capacity augmentation to the tune of 6,000 MW is planned at Bhoopalpally, Manuguru and Ramagundam by TSGENCO. It will be supplanted by capacity addition of 1,050 MW at Jaipur (Adilabad) by SCCL.
Hydel capacity of 360 MW at Jurala and Pulichintala is expected to be added by FY 15-16.
In terms of power from CGS, major additions are expected by FY 18-19 from Kudigi, Tuticorin, Neyveli, Kalpakkam and Srikali plants.
Plants like Krishnapatnam, RTPP-IV, Thermal Power Tech (Case-I LT) located in Andhra Pradesh with which TSDISCOMS already have a PPA are expected to add a capacity of 1454 MW cumulatively by FY 16-17.
In addition to augmentation of supply from regular sources, TSDISCOMS have prepared a detailed roadmap for enabling significant addition in solar and wind capacities.
1 TSDISCOMS 2 CEA Executive Summary, Power Sector, August-14
Figure 1: Historic and Projected Demand-Supply gap in Telangana*
*- Details of Base, Optimistic and Pessimistic cases are available in Section 4.1, 4.2, 4.3

The above growth in supply will witness a corresponding change in fuel mix as well. Currently coal based generation contributes to around 72%, hydel - 7% and NCE - 1% of energy mix.
Going forward, the dominance of coal based generation is expected to continue as the share of hydel is expected to come down due to lower hydel based capacity additions. However due to the strong policy push by the Government of Telangana, non-conventional energy, predominantly solar is expected to contribute around 7,529 MU in FY 19 which would be about 8% of the energy availability of the state.
The above change in fuel mix will be impacted by expiry of some existing PPAs, during next 5 years.
The net impact due to rescinding of current TS/AP GENCO PPAs in FY 18-19 to the State of Telangana would be a loss of 347 MW of thermal generation which translates to 2,217 MU. This is around 2.6% of the projected energy requirement in FY 18-19
While the Central Government has recently come out with a new pricing mechanism for gas from KG-D6 basin to propel production of gas and consequent power generation, PPAs of TSDISCOMS with gas based IPPs for 542 MW would expire over the next 2-3 years. In the years FY 12-13 and FY 13-14, the availability of power from gas based IPPs were 4,196 MU and 2,186 MU respectively. This translates to a PLF of 39% and 20% respectively against a normative PLF requirement of 85%.
PPA with KSK Mahanadi which is due to expire in June 2016 may be renewed on favourable terms. This would ensure continued annual availability of 1,570 MU.
The paper further illustrates that the best case scenario in supply demand projection, is predicated on GoI’s attempts at materializing gas supplies from D6 basin and freeing up coal blocks for capacity augmentation in generation sector. The non-integration of NEW grid with SR grid presents a considerable challenge to the overall energy availability and energy pricing in the southern region.
In addition to the above, this paper goes on to highlight the following imperatives:
1. As per AP Reorganization Act 2014, engagement with Ministry of Power should be enhanced to ensure that NTPC sets up 4000 MW of dedicated power plant at Ramagundam with best efforts.
2. Post availability of gas from D6 basin the Government may consider reviving the Shankarpally gas plant proposal to augment dedicated power supply to the IT region of Hyderabad.
3. The process of calling pan India tenders for procurement of Long Term power should be initiated in quick earnest to ensure that the available corridor is booked from FY 17-18 onwards for drawing cheaper power from NEW Grid. Suitable modifications needed in the SBDs should be applied for with Ministry of Power.
4. An ambitious capacity addition of 7280 MW is planned by TSGENCO in long term. The same should be put on fast track with enhanced inter departmental co-ordination.
5. Transmission corridor augmentation to ensure evacuation from upcoming generation centers should be monitored proactively to ensure that transmission corridor leads generation availability.
6. Government should further create an enabling environment for renewable generation to significantly impact the fuel mix going forward.
7. SCCL is expected to produce 113 MT in the last two years of the 12th plan period and 303 MT in the 13th plan period. SCCL and TSGENCO should proactively try to access international assets through transparent route to cater to the needs of coal fired power plants.
8. By rationalization of linkages initiated by GoI, TSGENCO should be able to get pit head advantages.
9. Mine Developer & Operator (MDO) route may also be explored to enhance the mining potential by leveraging SCCL expertise.
10. Once Govt. of India’s policy of enhancing gas output achieves its goal, suitable gas plants in addition to extant PPAs are expected to plug energy deficit through open cycle generation with appropriate regulated tariffs.
11. The key challenges which DISCOMS face in meeting these targets are: Reducing technical and commercial loss in distribution of power, minimizing interruptions and breakdowns in network infrastructure and meeting customer expectations on new connection release and complaint resolution.
12. For meeting these objectives, DISCOMS need to make investments in SCADA, GIS, HVDS, smart metering, network strengthening, integrated IT systems, customer service centers, prepaid power cards and AMR.
13. Moving forward, significant capacity additions are expected from renewable energy sources. Telangana DISCOMS will have to address the challenge of greater penetration of renewables into the grid.
14. Rules and regulations should be suitably framed to ensure implementation of recommendations of BEE and BIS. This would ensure optimal demand side management across various sectors.
03 Report of Task Force on Energy

Final target is to ensure that resources translate into energy and 84,496 MU is available to the people of
Telangana by FY 18-19 on 24X7 basis by augmentation of generation, increase in fuel availability, reducing the transmission loss to optimal level and continued stress on reduction of distribution losses.
Therefore a mission like approach has to be taken up, keeping the motto of energy conservation in mind that “1 unit of electricity saved is 1.25 units of electricity generated”.
The summary of energy requirement and energy surplus resulting due to approach outlined in this paper in FY 18-19 is shown in Figure 2.
04
Figure 2: Energy requirement and surplus (FY 18-19) – Base scenario^
^- Details of Base scenario is available in Section 4.1
Report of Task Force on Energy
Introduction and key issues
05 Report of Task Force on Energy
2. Introduction and Key Issues
2.1 Introduction and Context
Availability of reliable and affordable power is a critical requirement for economic development of any state. The state of Telangana is spread across 1,14,840 square kilometers. It is the twelfth largest state in India. According to 2011 census data the population of Telangana stands at 3,52,86,757. Hyderabad is the capital city and is largest contributor to the Gross State Domestic Product (GSDP) and other revenues of Telangana. It is also the major center for tourism, cultural activities and commerce. Many large Indian industrial enterprises are housed in Hyderabad, including BHEL, NFC, NMDC, BEL, DRDO, HAL, CCMB, CDFD etc. It is also a hub for major Information Technology and Pharmaceutical companies. Telangana is one of the top IT exporting states of India and about one third of the bulk drugs in the country are manufactured in the state.
Besides these, the economy of Telangana is also dependent upon agriculture. Although the region is drained by major rivers like Krishna and Godavari, most of the land is arid, thus making irrigation necessary to support crops such as paddy, cotton, mango and tobacco.
In view of the above, there is high energy requirement in the state. In addition, a significant increase in energy requirement is projected over the next 5 years due to various factors listed below:• Increase in domestic consumption.• Increase in commercial and economic activity.• Increase in requirement for irrigation • Urban development in cities of Hyderabad, Warangal,
Nizamabad and Karimnagar.• Upcoming major projects such as Hyderabad Metro Rail,
Hyderabad ITIR region, Lift Irrigation Schemes (LIS), Hyderabad-Nagpur industrial corridor etc.
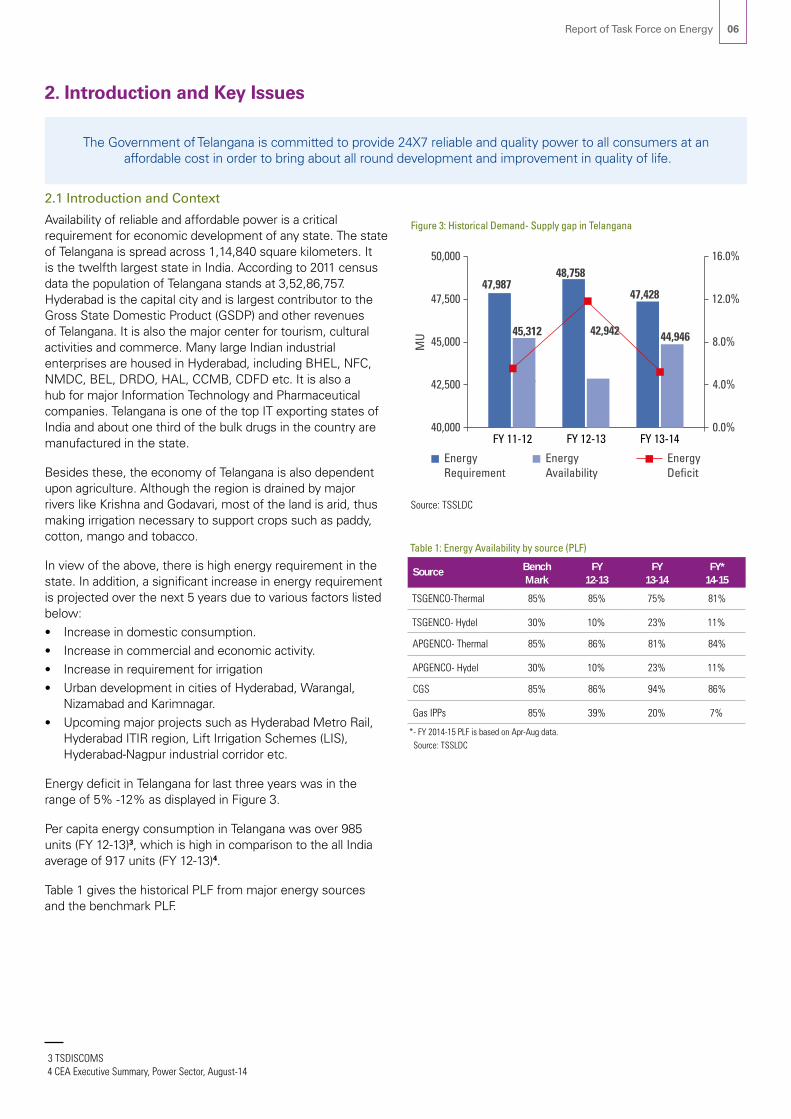
Energy deficit in Telangana for last three years was in the range of 5% -12% as displayed in Figure 3.
Per capita energy consumption in Telangana was over 985 units (FY 12-13)3, which is high in comparison to the all India average of 917 units (FY 12-13)4.
Table 1 gives the historical PLF from major energy sources and the benchmark PLF.
The Government of Telangana is committed to provide 24X7 reliable and quality power to all consumers at an affordable cost in order to bring about all round development and improvement in quality of life.
Table 1: Energy Availability by source (PLF)
Source BenchMark
FY12-13
FY 13-14
FY* 14-15
TSGENCO-Thermal 85% 85% 75% 81%
TSGENCO- Hydel 30% 10% 23% 11%
APGENCO- Thermal 85% 86% 81% 84%
APGENCO- Hydel 30% 10% 23% 11%
CGS 85% 86% 94% 86%
Gas IPPs 85% 39% 20% 7%
*- FY 2014-15 PLF is based on Apr-Aug data. Source: TSSLDC
06
3 TSDISCOMS4 CEA Executive Summary, Power Sector, August-14
Figure 3: Historical Demand- Supply gap in Telangana
Source: TSSLDC
Report of Task Force on Energy

PLF of TSGENCO thermal plants for the period June 2014 to August 2014 was 80%. Shortage of gas has resulted in a very low PLF of gas based IPPs (20%) in FY 13-14. The gas pipeline burst in May 2014 resulted in a very low PLF of 7% during the period April 2014 to August 2014.
Energy availability for FY 14-15 from TSGENCO and APGENCO-Thermal plants has been computed at PLF of 80%, for gas IPPs at 20% PLF and for CGS at 85% PLF.
The current energy availability (FY 14-15) for Telangana from various sources is detailed in Table 2.
In case further capacity addition is not taken up, the energy deficit is expected to balloon from a current 9,203 MU (17%) to 40,742 MU (51%) on an annual basis in FY 18-19 as detailed in Table 3.
Energy deficit of this scale will adversely impact the state’s growth aspirations and economic development in general.
Hence, medium-term and long-term energy security is an immediate priority and there is an urgent need to explore all avenues of increasing energy availability from existing sources and new sources.
2.2 Energy Requirement
Energy requirement in the state of Telangana is expected to increase significantly in the next 5 years due to the following reasons:
Hyderabad Metro Rail (HMR)1,402 MU of energy would be required annually to operate the Hyderabad Metro Rail by FY 18-19. Year wise energy requirement for HMR is given in Table 4.
Lift Irrigation Schemes (LISs)A number of Lift Irrigation Schemes (LISs) are planned in the state of Telangana to supply water for irrigation, drinking water and industrial purpose. Major schemes planned in the region - Pranahita-Chevella, Kalwakurthy, Komaram Bheema are expected to be operational 16 hours every day during August to November every year. Year wise energy requirement for LISs is given in Table 5.
Table 2: Existing Energy Availability by source
Source Energy Availability (MU)
TSGENCO- Thermal 8,622
TSGENCO- Hydel 2,408
APGENCO- Thermal 10,612
APGENCO- Hydel 813
CGS 13,230
IPPs 2,041
NCEs 500
Others (Case-I) 1,570
Short Term 6,000
Total 45,795
Source: TSSLDC
Table 3: Telangana Demand-Supply projection (MU)
Particular FY14-15
FY15-16
FY16-17
FY17-18
FY18-19
Energy Requirement 54,998 63,047 67,902 77,164 84,496
Energy Availability (Existing sources)
45,795 45,037 44,030 43,896 43,754
Energy Deficit -9,203 -18,009 -23,872 -33,268 -40,742
Energy Deficit (%) -16.7% -28.6% -35.2% -43.1% -48.2%
Source: TSSLDC
Table 4: Energy requirement for Hyderabad Metro Rail (MU)
FY 15-16 FY 16-17 FY 17-18 FY 18-19
703 1,051 1,402 1,402
Source: TSSLDC
Table 5: Table 5: Energy requirement for Lift Irrigation Schemes (MU)
FY 14-15 FY 15-16 FY 16-17 FY 17-18 FY 18-19
1,223 3,728 3,728 7,392 7,392
Source: TSSLDC
07 Report of Task Force on Energy

Hyderabad Information Technology Investment Region (ITIR)Upcoming Hyderabad ITIR region which is planned to be constructed over 50,000 acres is expected to provide direct employment to 15 lakh people. The ITIR region which is expected to come up in phased manner from FY 2015-16 would require 2,632 MU energy annually once it is fully operational. This is given in Table 6.
Upcoming urban centers of Warangal, Nizamabad and KarimnagarHistorically energy demand from domestic and industrial consumers in the urban centers of Warangal, Nizamabad and Karimnagar has shown a growth of 8%. With enhanced impetus on urbanization, a growth rate of about 10% is expected in future.
Other factors contributing to escalating energy requirementsUpcoming steel plant at Bayyaram which would require 2,400 MU annually by FY 18-19.
• 6% increase in Agriculture sales every year.
• 7 hours of power supply to Agriculture consumers.
• 24X7 power supply to all other consumers.
• Substantive growth in energy requirement of other consumer categories like Industrial, Domestic and Commercial resulting from rapid economic development planned in Telangana.
Above mentioned growth drivers would result in an 11% increase in energy requirement for the period FY 2014-15 to FY 2018-19.
Figure 4 represents the Demand-Supply gap for all scenarios, the assumptions of which have been explained in detail in sections 4.1, 4.2 and 4.3.
Table 6: Energy requirement for Hyderabad ITIR (MU)11
FY 15-16 FY 16-17 FY 17-18 FY 18-19
876 1,752 2,628 2,632
Source: TSSLDC
08
Figure 4: Historic and Projected Demand-Supply gap in Telangana
Report of Task Force on Energy

Objectives and Scope of Policy
09 Report of Task Force on Energy

3. Objectives and scope of policy
Key steps to be taken to meet the energy requirement of Telangana in next five years are given below:
Supply side management
3.1 Achieve capacity addition targetsi. Commission new power plants under state ownership.ii. Firm up power supply from upcoming Central Generating
Stations (CGS).iii. Firm up power supply from upcoming power plants in
Andhra Pradesh.iv. Undertake power procurement through competitive
bidding to tap power from SR and outside SR generators.v. Increase installed capacity of Non-Conventional Energy
(NCE) sources.vi. Ensure more sustainable fuel mix.vii. Examine continuity of PPAs due to expire in next five
years.
3.2 Efficiency improvements across value chaini. Enhance coal supply from SCCL.ii. Improve efficiency of existing TSGENCO plants.iii. Improve efficiency of Transmission sector.iv. Improve efficiency of Distribution sector.v. Improve financial health of DISCOMS.
3.3 Demand side management
i. Implement efficiency measures in energy consumption of domestic households, street lights, agriculture pump sets and industries.
3.1 Achieve capacity addition targets
3.1.1 Commission new power plants under state ownership
TSGENCOTSGENCO has planned significant capacity additions in the next 5 years of which some projects are under construction while the others have been conceptualized. Table 7 provides the status of upcoming TSGENCO power plants.
It can be observed from the above matrix that only KTPP-II, Lower Jurala HEP and Pulichintala HEP are projects which are under construction. Commissioning of these plants is expected to happen in the next two years. Nearly 8,500 MU of energy would be available to Telangana every year from FY 18-19 from these upcoming TSGENCO power plants.
Coal linkage for other upcoming power plants like KTPP Stage-III, Manuguru-TPS and Ramagundam-TPS needs to be firmed up to ensure timely commissioning and operation of these power plants.
Government may also consider reviving the Shankarpally gas plant proposal to augment dedicated power supply to IT region of Hyderabad subject to availability of gas from D6 basin.
SCCLIn addition to the above, a 2X600 MW capacity power plant is expected to be commissioned at Jaipur (Adilabad). Unit 1 would be commissioned by March 2016 and Unit 2 by October 2016. 1050 MW of power from this plant will be available for sale to four DISCOMS (2 TSDISCOMS, 2 APDISCOMS) out of which 53.89% of power would be available to Telangana annually (3,855MU).
Table 7: Key milestones of upcoming TSGENCO power plants
Power plantCap
(MW)Feas. Study
Land Acqstn.
Fin. Closure
Synchro-nization
Sch.CoD
Kakatiya TPP Stage-II#
600 ü ü ü û Oct-15
Kothagudem TPS Stage-VII
800 ü û û û Apr-18
Kakatiya TPP Stage-III*
800 ü û û û NA
Manuguru TPS 4000 û û û û NA
Ramagundam TPS 1080 û û û û NA
Lower Jurala HEP##
240 ü ü ü û Mar-15
Pulichintala HEP###
120 ü ü ü û Dec-15
*- KTPP Stage-III CoD not expected by FY 18-19 as public hearing is not completed, Telangana share- # : 323 MW, ## : 129 MW, ### : 64.5 MWSource: TSSLDC, Analysis
10Report of Task Force on Energy

3.1.2 Firm up power supply from upcoming Central Generating Stations (CGS)
TSGENCOA total of 1000 MW of power from upcoming CGS would be available to Telangana in the next 5 years from Kudigi, Tuticorin, Neyveli, Kalpakkam and Srikali plants. The capacity availability to Telangana from upcoming CGS is detailed in Table 8.
The state of Telangana is expected to procure nearly 7,000 MU annually from above mentioned sources by FY 18-19.
However it may be noted that availability of power from the above CGS sources is subject to timely completion of evacuation infrastructure. Transmission network must be ready before the scheduled CoD of these plants.
Further, as per AP Reorganization Act 2014, engagement with Ministry of Power should be enhanced to ensure that NTPC sets up 4000 MW of dedicated power plant at Ramagundam with best efforts.
A monitoring mechanism to ensure that the required Inter-state and Intra-state transmission infrastructure is constructed as per schedule should be set up. This monitoring mechanism should also ensure coordination between PGCIL and TSTRANSCO to achieve the transmission infrastructure targets as per schedule.
Regular SRPC meetings should be utilized for effective coordination of all interstate projects impacting above infrastructure.
3.1.3 Firm up power supply from upcoming power plants in Andhra Pradesh
A total of 1455 MW of power from upcoming APGENCO power plants and Thermal Power Tech (Case-I Long Term) would be available to Telangana in the next 5 years, the same is given in Table 9.
Construction and testing of Krishnapatnam Unit-I is completed and the commissioning of this power plant is expected by December 2014.
Similarly the construction of Krishnapatnam Unit-II and RTPP Stage-IV is under progress and these power plants are expected to be commissioned by June 2015 and March 2017 respectively.
In addition, commissioning of private sector power plant (Thermal Power Tech) at Nellore is expected by April 2015 and Telangana is entitled to get 269 MW from this source.
As per the Andhra Pradesh Reorganization Act, the existing Power Purchase Agreements of Telangana DISCOMS would continue with the APGENCO power plants. Telangana DISCOMS have a PPA with the above mentioned APGENCO plants and accordingly energy availability from these APGENCO stations has been considered.
The state of Telangana is expected to procure nearly 9,900 MU annually from above mentioned sources by FY 16-17
Again, timely completion of evacuation infrastructure assumes high importance. Transmission facilities must be in place before commissioning of these plants to ensure power availability.
Table 8: Additional Capacity available to Telangana from upcoming CGS (MW)
Power Plant CoDFY
14-15FY
15-16FY
16-17FY
17-18FY
18-19
Energy per annum
(MU)
NTPC Kudigi TPS Stage-1
Aug-15 Mar-17
- 218 171 - - 2,812
NTPL Tuticorin Apr-15 - 133 - - - 906
New Neyveli TPP
Aug-17 - - - 59 - 405
NPCIL Kalpakkam
Jun-15 - 69 - - - 419
NLC Sirkali TPS Aug-17Aug-18
- - - 261 104 2,381
Total - 420 171 320 104 6,922
Source: TSDISCOMS Resource Plan Filing (FY 14-15 to FY 18-19)
Table 9: Additional Capacity available to Telangana from upcoming other plants (MW)
Power Plant CoD FY14-15
FY15-16
FY16-17
Energy per annum (MU)
Krishnatpatnam Unit-I
Dec-14 431 - - 2,937
Krishnatpatnam Unit-II
Jun-15 - 431 - 2,937
RTPP Stage-IV Mar-17 - 323 2,203
Thermal Power Tech (Case-I LT)
Apr-15 - 269 - 1,836
Total 431 700 323 9,913
Source: TSDISCOMS Resource Plan Filing (FY 14-15 to FY 18-19)
11 Report of Task Force on Energy

3.1.4 Procure power from power plants located in Southern and outside Southern region
Power plants within Southern regionThe state of Telangana would need additional energy apart from the TSGENCO, CGS and APGENCO sources. Spare capacity with coal-based generators in the Southern region (SR) will be around 3300 MW in FY 14-15 and will increase to nearly 6000 MW by FY 16-17. Spare capacity of the above generators has been arrived at based on commissioning schedule and capacity tied up in bids till date. The generators from Southern region can be tapped for additional energy requirement to avoid the NEW-SR transmission corridor constraints in the medium/ long term.
It may be noted that other states in the SR are also competing for this spare capacity and they have already initiated short-term/medium-term/long-term procurement through competitive bidding.
Power plants outside Southern regionWhile significant surplus capacity is available with generators outside the SR region, transmission constraints limit the power that can be available to Telangana. New transmission lines of 765 kV D/C Angul-Srikakulam-Vemagiri and 765 KV D/C Wardha-Nizamabad-Hyderabad are expected to add around 4000 MW of transmission capacity to the SR grid by March 17. Out of this, 1050 MW has already been booked by Tamil Nadu and 1795 MW is pending against already signed PPAs. The existing transmission capacity from WR and ER to SR grid is 3850 MW out of which 3314 MW is already booked through Long Term Agreement and Medium Term Open Access Agreement. Details are given in Table 10 and Table 11 below.
While undertaking power procurement through competitive bidding, the following must be ensured:
1. Early and timely completion of process so as to be successful in blocking the corridor.
2. Longer tenure of PPA to gain higher priority in open access applications.
3.1.5 Increase installed capacity of Non-Conventional Energy (NCE) sources
Non-conventional energy (NCE) sources consist of Biomass, Bagasse, Solar, Wind, Mini Hydel and Waste based power projects. Telangana has large untapped non-conventional energy potential. Table 12 gives a comparison of the installed capacity as against the NCE potential in the state.
It can be observed that the installed capacity of NCE sources is a mere 5% of the total potential. Measures to improve installed capacity are listed below:
1. Set up single window clearance mechanism to expedite clearance of NCE projects.
2. Allow unrestricted banking of energy during ToD hours.
3. Provide cross subsidy surcharge exemption on consumers purchasing NCE energy.
4. Grant tax exemptions like VAT, stamp duty on purchase of equipment etc.
5. Provide Policy support in matters like setting up solar roof top panels and net metering.
6. Promote Decentralized Distributed Generation (DDG) model of solar power generation for localized consumption and replacement of night time agriculture power supply with solar power during day time.
Table 10: Upcoming Interstate Transmission projects
Line LengthSch.
completion date
Expected Capacity Benefit
Remarks
765 kV D/C Kodhapur- Narendra
200 km Dec ' 15 600 - 700 MW
Under Construction
765 kV D/C Angul-Srikakulam-Vemagiri
275 + 300 km
Aug ' 16 1000 - 1500 MW
Under Construction
765 kV D/C Wardha - Nizamabad -
Hyderabad
270 + 270 km Mar ' 17 3000 MW Pre - Award Stage
800kV Raigarh - Pugalur HVDC 1500 km Aug ' 19 6000 MW
Approval by standing committee pending
Source: PGCIL
Table 11: Status on Corridor Booking by Open Access Consumers
Transmission capacity booked MW
Existing Transmission capacity from WR & ER 3850
Existing LTOA + MTOA 3314
Expected further enhancement by Mar 17 4000
Capacity already blocked by TANGEDCO PPAs 1050
Further LTOA applications pending against PPAs 1795
Balance capacity available 1155
Source: PGCIL
Table 12: NCE Installed capacity (vs) Potential
Source Potential (MW) Installed capacity (MW)
Installed capacity % of Potential
Wind* 1500 0 0.0%
Solar 5000 79 1.6%
Biomass 100 72 72.0%
Bagasse 150 126 84.0%
Mini Hydel 200 38 18.8%
Waste based 100 38 38.1%
Total 7050 353 5.0%
Source: TSREDA * Indian Wind Power Association
12Report of Task Force on Energy

Figure 7: Current Energy mix by fuel type (FY 15)
With these measures, it is expected that phase wise capacity addition of Wind and Solar power would be as detailed in Figure 5 and Figure 6.
To kick start the above, TSDISCOMS have already initiated tariff-based international competitive bidding process for procurement of 500 MW of solar power on long-term basis.
3.1.6 Ensure more sustainable fuel mix
In FY 14-15, coal based generation would contribute to around 72% of the total energy mix. Contribution from NCE sources would be around 1%. Current energy mix of Telangana is heavily coal dominated as indicated in Figure 7.
With coal sources fast depleting and lack of gas availability, there is an urgent need for Telangana to improve its energy mix with higher contribution from NCE sources.
Currently, share of NCE in Telangana is low in comparison to states like Madhya Pradesh (7%), Rajasthan (24%) and Tamil Nadu (38%).
Telangana has a large unexploited NCE potential of over 7000 MW. TSDISCOMS have signed PPAs contributing to an installed capacity of 379 MW of NCE sources. It is expected that energy mix of Telangana is expected to change as illustrated in Figure 8.
13
Figure 5: Wind capacity addition plan
Figure 6: Solar capacity addition plan
Figure 8: Proposed Energy mix by fuel type (FY 19)
Report of Task Force on Energy

3.1.7 Examine continuity of PPAs due to expire in next 5 years
Some of the existing PPAs of TSDISCOMS with generators would expire during the next 10 years.
TSGENCO & APGENCO Currently, Telangana is entitled to 53.89% of power from TSGENCO and APGENCO stations. Post expiry of PPA, no
capacity would be available from APGENCO stations while 100% capacity of TSGENCO plants would be available to Telangana. Table 13 illustrates the capacity and energy loss to Telangana post expiry of current PPAs on 31 March 2019.
Cost of power generation of TSGENCO thermal stations is cheaper when compared to APGENCO thermal stations due to availability of pit head coal. This is shown in Table 14.
Post expiry of PPAs with TSGENCO and APGENCO stations, Telangana stands to benefit from access to entire low cost energy from TSGENCO stations. Assuming a 5% increase in PP cost, the savings to Telangana post expiry of PPAs would be about Rs 275 crs.
Gas based IPPsThe Central Government is likely to come out with a new gas pricing mechanism for gas from KG-D6 basin shortly to propel production of gas and consequent power generation. However, PPAs of TSDISCOMS with gas based IPPs for 542 MW would expire over the next 2-3 years as given in Table 15.
In FY 12-13 and FY 13-14, the availability from gas based IPPs were 4,196 MU and 2,186 MU respectively. This translates to a PLF of 39% and 20% respectively against a normative PLF requirement of 85%. In the above scenario of constrained gas availability in the near term, an urgent decision is required to be taken on the need for extending the PPAs with gas based IPPs.
Table 13: Capacity and Energy loss to Telangana post PPA expiry with TSGENCO & APGENCO
Current Post PPA Expiry Gain(+) /Loss(-)
Source I C E C E C E
MW MW MU MW MU MW MU
TSGENCO Thermal 1,283 691 4,844 1,283 8,988 591 4,144
TSGENCO Hydel 1,776 957 1,621 1,776 3,009 819 1,387
TSGENCO Total 3,058 1,648 6,465 3,058 11,997 1,410 5,532
APGENCO Thermal 1,680 905 6,345 - - - 905 - 6,345
APGENCO Hydel 1,580 851 1,404 - - - 851 - 1,404
APGENCO Total 3,260 1,757 7,748 - - - 1,757 - 7,748
Total 6,318 3,405 14,213 3,058 11,997 - 347 - 2,217
I-Installed Capacity, C-Capacity Share, E-Energy ShareSource: TSDISCOMS
Table 14: Power Purchase cost differential -TSGENCO and APGENCO stations
2013-14 Actuals
Source PP cost Energy
Rs./Unit MU
TSGENCO Thermal 2.84 4011
APGENCO Thermal 3.36 5632
Total Thermal 3.15 9643
Source: TSDISCOMS
Table 15: Capacity and Energy loss to Telangana post PPA expiry with gas IPPs
Installed Capacity
Telangana Share PPA expiry date
Power Plant MW MW
GVK Phase-I 216 116 19-Jun-15
Lanco Kondapalli 362 195 17-Oct-15
Spectrum 208 112 18-Apr-16
Reliance 220 119 23-Oct-17
Total 1,006 542
Source: TSDISCOMS
14Report of Task Force on Energy

NTPC Ramagundam-IIPost expiry of PPA with NTPC Ramagundam-I on 30th April 2010, DISCOMS reached an arrangement for supply of power to them on same terms and conditions of expired PPA till generation is possible. TSDISCOMS can follow similar approach for PPA with NTPC Ramagundam-II, which is due to expire by 31st March 2016. This would ensure continued availability of 2,000 MU annually to Telangana state.
KSK Mahanadi (Case-I Medium Term)PPA of TSDISCOMS with KSK Mahanadi is due to expire in June 2016. TSDISCOMS need to initiate a discussion with KSK Mahanadi for renewing the PPA on favorable terms. This would ensure continued annual availability of 1,570 MU.
3.2 Efficiency improvements across the value chain
3.2.1 Enhance coal supply from SCCL
Singareni Collieries Company Limited (SCCL) is a coal mining company jointly owned by Government of Telangana and Government of India in a 51:49 equity basis. Presently it operates 15 opencast and 34 underground mines in 4 districts of Telangana with a manpower of around 62,805.
Operational and cost economics of coal mining depend upon the geo mining conditions which are site specific in nature and oblivious to quality of coal. Godavari Valley coal fields have deeper and steeply dipping deposits.
SCCL has proven geological reserves aggregating to 8,791 MT. Out of this 1,136 MT was mined till March 2014.
The details of production and cost during XIth plan are given in Table 16.
Table 16: SCCL Production and Cost - FY 07-08 to FY 11-12
Year
Under Ground Open Cast
Production( LT)
Production Cost (Rs/Ton)
Production (LT)
Production Cost (Rs/Ton)
2007-08 126 1,719 280 711
2008-09 121 2,018 325 817
2009-10 110 2,169 385 1,012
2010-11 116 2538 397 1,142
2011-12 105 3,316 417 1,229
Source: SSCL Vision 2032, Volume 1, August 2012
15 Report of Task Force on Energy
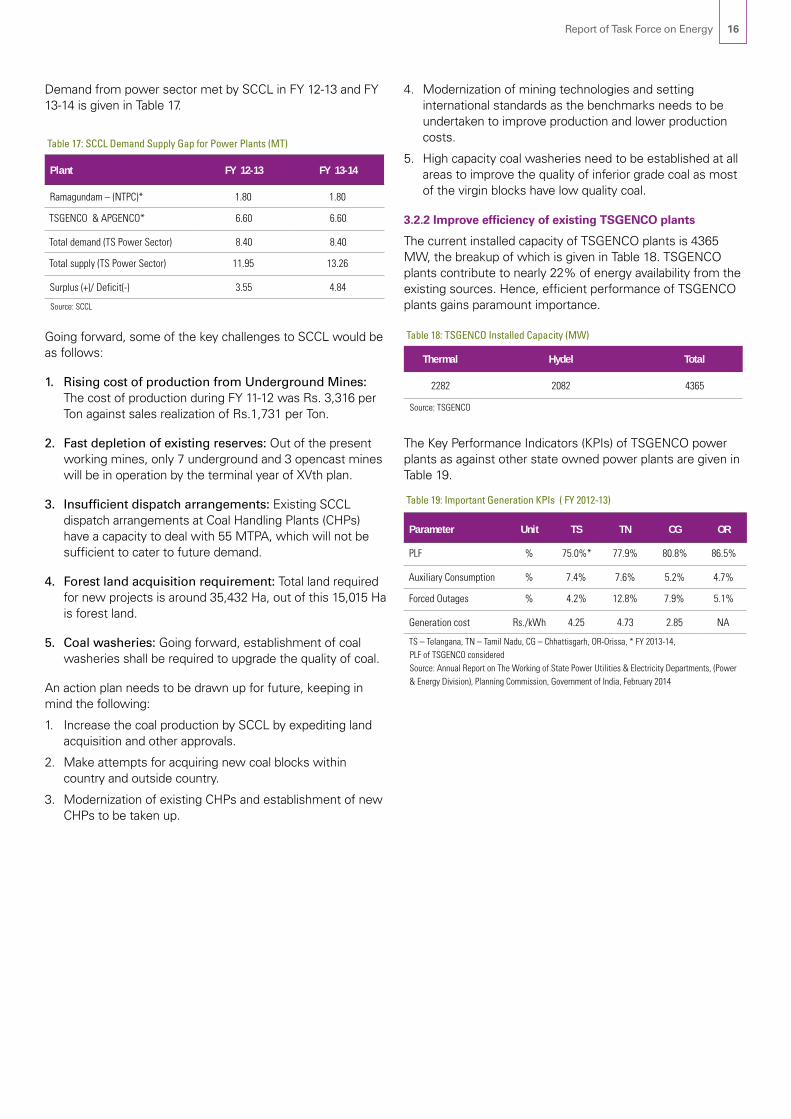
Demand from power sector met by SCCL in FY 12-13 and FY 13-14 is given in Table 17.
Going forward, some of the key challenges to SCCL would be as follows:
1. Rising cost of production from Underground Mines: The cost of production during FY 11-12 was Rs. 3,316 per Ton against sales realization of Rs.1,731 per Ton.
2. Fast depletion of existing reserves: Out of the present working mines, only 7 underground and 3 opencast mines will be in operation by the terminal year of XVth plan.
3. Insufficient dispatch arrangements: Existing SCCL dispatch arrangements at Coal Handling Plants (CHPs) have a capacity to deal with 55 MTPA, which will not be sufficient to cater to future demand.
4. Forest land acquisition requirement: Total land required for new projects is around 35,432 Ha, out of this 15,015 Ha is forest land.
5. Coal washeries: Going forward, establishment of coal washeries shall be required to upgrade the quality of coal.
An action plan needs to be drawn up for future, keeping in mind the following:
1. Increase the coal production by SCCL by expediting land acquisition and other approvals.
2. Make attempts for acquiring new coal blocks within country and outside country.
3. Modernization of existing CHPs and establishment of new CHPs to be taken up.
4. Modernization of mining technologies and setting international standards as the benchmarks needs to be undertaken to improve production and lower production costs.
5. High capacity coal washeries need to be established at all areas to improve the quality of inferior grade coal as most of the virgin blocks have low quality coal.
3.2.2 Improve efficiency of existing TSGENCO plants
The current installed capacity of TSGENCO plants is 4365 MW, the breakup of which is given in Table 18. TSGENCO plants contribute to nearly 22% of energy availability from the existing sources. Hence, efficient performance of TSGENCO plants gains paramount importance.
The Key Performance Indicators (KPIs) of TSGENCO power plants as against other state owned power plants are given in Table 19.
Table 17: SCCL Demand Supply Gap for Power Plants (MT)
Plant FY 12-13 FY 13-14
Ramagundam – (NTPC)* 1.80 1.80
TSGENCO & APGENCO* 6.60 6.60
Total demand (TS Power Sector) 8.40 8.40
Total supply (TS Power Sector) 11.95 13.26
Surplus (+)/ Deficit(-) 3.55 4.84
Source: SCCL
Table 18: TSGENCO Installed Capacity (MW)
Thermal Hydel Total
2282 2082 4365
Source: TSGENCO
Table 19: Important Generation KPIs ( FY 2012-13)
Parameter Unit TS TN CG OR
PLF % 75.0%* 77.9% 80.8% 86.5%
Auxiliary Consumption % 7.4% 7.6% 5.2% 4.7%
Forced Outages % 4.2% 12.8% 7.9% 5.1%
Generation cost Rs./kWh 4.25 4.73 2.85 NA
TS – Telangana, TN – Tamil Nadu, CG – Chhattisgarh, OR-Orissa, * FY 2013-14, PLF of TSGENCO consideredSource: Annual Report on The Working of State Power Utilities & Electricity Departments, (Power & Energy Division), Planning Commission, Government of India, February 2014
16Report of Task Force on Energy

Some of the constraints faced by TSGENCO power plants are as follows:
1. Low materialization of coal linkage from MCL: Materialization of coal linkage from MCL has been less than 85% which has resulted in loss of generation.
2. Sub-standard quality of coal: Average GCV of coal received by TSGENCO stations is much less than the required optimal level.
3. Insufficient coal linkage: Quantum of coal tied up through linkages is not sufficient for operating the plants at target PLF.
4. Insufficient rail corridor: There is capacity constraint for transporting coal along the East Coast from MCL to TSGENCO plants, due to which coal is not dispatched from MCL as per schedule.
5. Coal stock in number of days: Current coal stock availability is far less than the required benchmark of 30 days.
The following steps have to be taken for ensuring higher PLF of existing TSGENCO plants:
• Ensure coal linkage materialization: 100% of materialization of linkage coal from SCCL and MCL should be ensured.
• Undertake coal auditing: Undertake regular coal auditing exercise to ensure GCV of coal received is as per required standards. A detailed coal auditing exercise should be done by a third party at all three stages i.e. loading, transportation and unloading at power plant.
• Improved blending infrastructure: There is a need to improve blending infrastructure and bring in more scientific methods of blending to improve GCV for boiler-fed coal.
• Coal tracking mechanism: An IT enabled coal tracking mechanism should be developed to monitor the following:
– Coal stock availability
– Coal shortfall – daily and monthly
– Coal linkage materialization
– Coal dispatch from mines to power plants
The above mentioned steps would aid in increasing the PLF of the existing TSGENCO plants from 80% to 90%. The additional energy available from such measures would be to the tune of 900 MU every year.
Table 20 lists the current KPIs and target KPIs for existing TSGENCO plants.
Table 20: TSGENCO KPIs – Current Vs Target
Parameter Unit Current (FY 13-14)
Target (FY 18-19)
PLF % 75.0% 90%
Forced Outages % 4.2% 0%
Coal stock availability Days Less than 5 days 30
Coal linkage materialisation % Less than 85% 100%
GCV of domestic coal kCal/kg Less than 3,200 3,400
Source: Annual Report on The Working of State Power Utilities & Electricity Departments, (Power & Energy Division), Planning Commission, Government of India, February 2014 and SLDC
17 Report of Task Force on Energy

3.2.3 Improve efficiency of Transmission sector
In Telangana, transmission losses were 3.59% and transmission system availability was 99.94% in FY 13-14. However, there is a need to ensure augmentation and strengthening of transmission infrastructure at intra-state and inter-state level, failing which power supply cannot be improved.
Intra-state Transmission network
Table 21 shows proposed intra-state evacuation schemes.
Inter-state Transmission network
1. Hinduja Power: Evacuation from Kamavarapeta to Suryapet through APTRANSCO line. Works by TSTRANSCO are in progress for transmission line from Suryapet to Nandivanaparthy and Shankarpally (825 MW/Ckt).
2. Angul-Srikakulam-Vemagiri: Strengthening of Kalapaka to Khammam line is proposed for onward transmission from Vemagiri ( For power flow on Angul-Srikakulam-Vemagiri line).
3. 765kV-Wardha-Nizamabad-Maheshwaram: Downstream strengthening by establishing 400 kV SS and associated line at Maheshwaram by TSTRANSCO.
4. 765kV-Warora-Warangal-Hyd-Kurnool: Downstream strengthening of network proposed at Warangal and Hyderabad.
It may be noted that energy from new capacities would be available through these new transmission systems.
Hence, timely completion of all the above planned schemes is critical. There is need to set up a dedicated project management group to ensure expeditious resolution of any issues.
The key focus areas of TSTRANSCO going forward should be in Network Strengthening, Renovation and Modernization of the network, Operation and Maintenance. Initiatives taken in the above areas would enable TSTRANSCO to cater to the increased peak demand, ensuring highest levels of availability and in reducing the transmission losses. Table 22 gives a snapshot of performance and key network infrastructure in FY 2013-14 and projected figures for FY 2018-19.
Table 21: Evacuation Schemes for Intrastate Generators
Generating Station LineApproximate capacity/Ckt
(MW)
Singareni TPP SCCL ( Jaipur TPP) to Gajwel 825
Singareni TPP SCCL ( Jaipur TPP) to Nirmal 825
Ramagundam TPS (BPL) Ramagundam (TPS) to Gajwel 825
Ramagundam TPS (BPL) Ramagundam (TPS) to Karimnagar SS
825
Kakatiya TPS -KTPP(BHPLLY) Kakatiya TPP (BHPLLY) to Gajwel
825
KTPP 3rd Unit BPLY to Oglapur 825
KTPP 3rd Unit BPLY to Jangoan 825
RTS Ramagundam - Karimnagar- Gajwel
825
Satupally (1x800 MW) Sattupally-Khammam-Suryapet 825
KTS VII Stage KTS VII Stage to Khammam 825
KTS Khammam to proposed Suryapet SS
825
Source: TSTRANCO
Table 22: TSTRANSCO KPIs and Key Infrastructure –Current vs Target
Parameter Unit Current (FY 13-14)
Target (FY 18-19)
Transmission availability % 99.94% 99.96%
Transmission losses % 3.59% 3.0 %
Peak demand handled MW 7,093* 10,396
No of Power Transformers
400 KV Nos 6 14
220 KV Nos 48 71
132 KV Nos 169 195
*- 53.89% of current peak demand for consolidated AP is considered as peak demand for TelanganaSource: TSTRANSCO
18Report of Task Force on Energy

3.2.4 Improve efficiency of Distribution sector
TSSPDCL and TSNPDCL supply electricity to consumers of Telangana. Table 23 gives the consumer mix of Telangana state.
Table 24 compares the KPIs of distribution sector across select states for FY 13-14.
Some of the measures for improving DISCOM performance are listed below:
1. Distribution Franchisee model: A suitable model of Distribution Franchisee may be considered in appropriate locations in Telangana DISCOMS.
2. Automatic Meter Reading (AMR): This is a solution designed to automatically collect consumption, diagnostic and status data from utility meters and transfer the retrieved data to a central database for billing, troubleshooting, and analysis. This can be used for billing of municipal authorities, water board and other public utilities. Mobile SIM enabled meters which transmit information remotely can be installed.
3. Usage of smart meters: These can be used to monitor energy consumption of key consumer categories such as industrial and commercial consumers. Power intensive consumers can be prevented from exceeding their permitted demand through smart meters. There are currently 16 lakh three phase connections. The total investment required for installing smart meters for these 16 lakh three phase connections would be around Rs. 1,100 Crs.
4. Energy Audit: Implementing technical measures for loss reduction such as, replacing smaller size conductors, maintaining the trunk line length of 11 KV and 33KV within optimal limits, reducing overloading of lines and DTRs, phase balancing of DTR loads, use of additional LT circuits to DTR to reduce overloading of LT lines.
5. Replacement of mechanical meters: Replacing mechanical meters with digital meters will lead to reduction in number of metering and billing exceptions. An action plan needs to be initiated to expedite phasing out of 19.2 lakh mechanical meters. The total investment required would be around Rs. 250 Crs.
6. Peak demand management: Reduce peak demand through customer awareness and differential tariff during peak hours.
7. Reliability improvement: Provide redundancy schemes for meeting the reliability needs of critical commercial, security and essential services establishments, where maintaining uninterrupted power supply is essential like police stations, hospitals, fire stations etc.
Table 23: Consumer mix in Telangana
Category No. of consumers Consumer Contribution (%)
Domestic 81.5 Lakh 73%
Agriculture 19.1 Lakh 17%
Industrial (LT & HT) 1.0 Lakh 1%
Commercial (LT & HT) 8.9 Lakh 8%
Others 1.1 Lakh 1%
Source: TSDISCOMS
Table 24: Distribution KPIs
Parameter Unit TS TN Maha Guj
T&D losses % 16.9% 20% 18.8 % 17.9 %
Cost of Supply Rs./kWh 5.27 6.45 5.84 4.95
Employees per sales No./MU 0.54 1.27 0.64 0.80
Source: Annual Report on The Working of State Power Utilities & Electricity Departments, (Power & Energy Division), Planning Commission, Government of India, February 2014
19 Report of Task Force on Energy

8. Implementation of HVDS: In many utilities across India, HVDS has been implemented to address issues such as high technical and commercial losses, high DTR failure rates and other quality of supply issues. HVDS schemes are under implementation in Telangana. Around 41,813 pump sets are envisaged to be covered under the scheme in FY 14-15 and 5,358 agricultural pump sets have been covered till July 2014. These schemes are prone to cost and time overruns. They need to be monitored on a regular basis for realizing the benefits of reduced losses and better quality of supply.
9. Monitor agriculture supply duration as per the Government policy: In view of rapid urbanization, there is an urgent need for re-survey of existing agricultural connections and use of better technologies for metering agricultural consumption. This could start with metering of DTRs where agricultural consumption is predominant. Subsequently, metering can be done at a consumer level in a phased manner.
10. Implementation of R-APDRP schemes: In all R-APDRP towns, MDAS reports should be used by respective DE/SE to conduct periodic review. To enable the same, all delta GIS updates should be taken up on a war footing and GIS backbone should be updated constantly to reflect ground reality. This will enable scientific review of losses and capacity planning.
11. GIS mapping and metering: Current progress of GIS mapping of DTRs and 11 KV feeders is given in Table 25. Status on metering of DTRs and 11 KV feeders is given in Table 26. MDAS has been implemented in only 36 towns. A comprehensive action plan to implement MDAS in remaining towns needs to be taken up.
12. Implementation of SCADA: SCADA implementation is under progress in Hyderabad and Warangal.To get visibility at 11 KV level, a rudimentary GPRS/VSAT enabled SCADA should be taken up. Currently SCADA provides visibility and remote action capability at 132 KV only, leading to poor coordination between state and DISCOM load dispatch centres. SCADA at 11KV level will enable much enhanced coordination and scientific real time grid management facility. Additionally, SCADA implementation should be taken up at all district headquarters.
13. Age profiling of DTRs: Age profile of all DTRs and meters should be recorded. Inventory planning, Repairs and Maintenance (R&M) should evolve into a function of age / repair profiles of major materials to enable better cash flow management.
14. Installation of pre-paid meters: In coordination with urban development authorities, avenues should be explored for gradually introducing pre-paid metering in urban centres. A target of 10% of total supply on a pre-paid arrangement by 2018 may be pursued.
15. Setting up Consumer care centers: Consumer care centers should be set up in each district with mapping of all consumers in the district along with telephone numbers. This step shall enable a greater reach into consumer base.
If Telangana DISCOMS were to reduce Transmission & Distribution losses at the rate of 0.75%/year vis-à-vis a business-as-usual of 0.25%/year, it translates into a cumulative savings of nearly Rs 2,716 Crores for the period FY 2015-16 to FY 2018-19. The detailed computation of savings in each year if losses are reduced by 0.75% every year is given in Table 27.
Table 25: GIS Mapping of DTRs and 11 kV Feeders status
Total (No.) GIS Mapped (No.) Balance (No.)
DTRs 13,268 11,125 2,143
11 kV 422 333 89
Source: TSDISCOMS
Table 26: Metering of DTRs and 11 kV Feeders status
Total (No.) GIS Mapped (No.) Balance (No.)
DTRs 13,268 13,254 14
11 kV 422 354 68
Source: TSDISCOMS
Table 27: Cost reduction from proposed loss trajectory of DISCOMS
Item Unit FY14-15
FY15-16
FY16-17
FY17-18
FY18-19
Energy Req. MU 54,998 63,047 67,902 77,164 84,496
Business As Usual loss trajectory
% 16.6% 16.4% 16.1% 15.9% 15.6%
Target Loss trajectory
% 16.1% 15.4% 14.6% 13.9% 13.1%
Energy Saved MU 328 745 1,193 1,792 2,432
Energy Savings# Rs. Crs. 125 298 501 791 1,126
# computed at average pooled Power Purchase cost – Rs. 3.81/UnitSource: TSDISCOMS, Analysis
20Report of Task Force on Energy

Table 28 gives a snapshot of performance and network infrastructure in FY 13-14 and projected figures for FY 18-19 for TSDISCOMS.
3.2.5 Improve financial Health of Distribution Companies
As DISCOMS are the interface with the end consumer, they have the responsibility of collecting money from the consumer. However, the money flow in the system is not uniform. The number of days of receivables by the DISCOM is longer than the number of days of payable leading to strain on the DISCOM finances. This is reflected in the historical ARR-ACS gap computed in Table 29.
In effect, the cash conversion cycle for DISCOMS is longer than it ought to be. The reasons behind this are:
1. Metering exceptions: Stuck up meters and cases of meters burnt out (MBO), meters not existing (MNE), reading not furnished (RNF), door locked, meters showing nil consumption and meters under dis- connection.
2. Low Collection efficiency: Collection efficiency is defined as the total collections against the demand raised including arrears. The collection efficiency of Telangana DISCOMS in the recent past is shown in Table 30.
It may be noted that collection efficiency for FY 13-14 has reduced from its level in FY 12-13. For FY 2014-15 till September, the collection efficiency of TSSPDCL and TSNPDCL were 99.55% and 96.34% respectively. There is a need to ensure collection efficiencies are maintained at high levels so as to minimize impact on cash conversion cycle.
3. Low Billing efficiency: For Telangana DISCOMS to achieve AT & C loss below 10%, it is imperative for DISCOMS to achieve a billing efficiency of more than 90%. Therefore DISCOMS should take steps to reduce billing exception cases.
4. Government Department dues: There are dues to be paid to Telangana DISCOMS by various Government Departments which are listed in Table 31.
Table 28: TSDISCOMS KPIs and Key Infrastructure –Current vs Target
Parameter Unit Current (FY 13-14)
Target (FY 18-19)
T&D losses % 16.9% 13.2%
DTR failure rate % 15% 5%
33 kV interruptions No./ckm 1.19 0.92
11 kV interruptions No./ckm 1.92 1.49
Infrastructure Additions
33/11 SS No 2,156 3,238
DTRs No 464,684 748,947
33 kV feeders No 1,037 1,529
11 kV feeders No 8,877 10,512
Source: TSDISCOMs
Table 29: Historical ARR and ACS gap for Telangana DISCOMS
Item Unit FY 12-13
FY 13-14
Revenue from Sales Rs. Crs. 12,991 16,162
Tariff Subsidy Rs. Crs. 3,709 3,899
Additional Subsidy Rs. Crs. - -
FSA Rs. Crs. 1,376 -
Total Revenue Rs. Crs. 18,076 20,061
NTI (Non-Tariff Income) Rs. Crs. 438 433
Total Revenue including NTI Rs. Crs. 18,514 20,494
Power Purchase Costs Rs. Crs. 16,972 17,045
Transmission & SLDC Charges Rs. Crs. 905 799
Distribution Costs Rs. Crs. 5,765 3,328
Total Expenses Rs. Crs. 23,642 21,173
Sales (MU) MU 34,502 35,937
ARR without subsidy Rs./Unit 3.89 4.62
ARR with subsidy (A) Rs./Unit 5.37 5.70
ACS (B) Rs./Unit 6.85 5.89
Gap ( A- B) Rs./Unit -1.49 -0.19
Source: TSDISCOMS Annual Accounts
Table 30: Collection Efficiency of TSDISCOMS
Item FY 11-12 FY 12-13 FY 13-14 FY 14-15*
TSNPDCL 96% 104% 101% 96%
TSSPDCL 98% 101% 95% 100%
* Till September 2014Source: TSDISCOMS
21 Report of Task Force on Energy

Measures need to be initiated for recovery of the above dues as well putting in place a mechanism to prevent the accumulation of dues going forward. Centralized bill adjustment at Hyderabad may be a good option to explore. Agricultural Subsidy Dependence The past trend of subsidy requirement of Telangana DISCOMS are shown below in Table 32,33 and 34.
Table 31: Govt. Department Dues (Rs Cr)
Department TSSPDCL TSNPDCL Arrears as on 30.08.2014
Panchayat Raj 501 385 885
Municipalities 116 37 153
Corporations - 10 10
GHMC 11 - 11
HMWS & SB 143 1 145
Irrigation 39 18 57
Govt. Lift Irrigation Schemes
123 12 134
Home 10 8 18
Health Medical & Family Welfare
9 5 14
Revenue 3 8 12
School Education 4 4 8
Higher Education 1 2 3
Social Welfare 1 1 1
B.C. Welfare 0 0 0
Tribal Welfare - 1 1
Animal Husbandry 0 0 0
Tourism 0 0 0
Total 961 492 1,453 Source: TSPCC
Table 32: Historic Agricultural Sales and Subsidy Trend- TSSPDCL
CoSApproved
SalesTotal
Subsidy
Tariff Order
Subsidy
Cross Subsidy
Unit Rs. /Unit MU Rs. Crs. Rs. Crs. Rs. Crs.
FY 11-12 3.58 5,346 1,914 515 1,399
FY 12-13 4.37 5,881 2,570 837 1,733
FY 13-14 5.20 5,881 3,058 935 2,123
Source: TSSPDCL
Table 33: Historic Agricultural Sales and Subsidy Trend- TSNPDCL
CoSApproved
SalesTotal
Subsidy
Tariff Order
Subsidy
Cross Subsidy
Unit Rs. /Unit MU Rs. Crs. Rs. Crs. Rs. Crs.
FY 11-12 3.82 3,596 1,374 944 429
FY 12-13 4.71 3,956 1,863 1,579 284
FY 13-14 5.51 3,956 2,180 1,751 428
Source: TSNPDCL
Table 34: Historic Agricultural Sales and Subsidy Trend- Telangana Discom
Approved Sales
Total Subsidy Tariff Order Subsidy
Cross Subsidy
Unit MU Rs. Crs. Rs. Crs. Rs. Crs.
FY 11-12 8,943 3,288 1,459 1,828
FY 12-13 9,837 4,433 2,416 2,017
FY 13-14 9,837 5,238 2,687 2,551
22Report of Task Force on Energy

Subsidy required to support agricultural sales is primarily growing due to
1. Increase in Cost of Supply (CoS) to Agricultural Category
2. Increase in Agricultural Sales
Going forward, the dependence on subsidy support is going to increase as shown in Table 35.
The above trend shows unsustainable level of cross subsidy as well as the subsidy support required from the government. Some of the steps which are needed for reducing the above subsidy burden are-
1. Metering measures:
• Short term: Metering of all mother DTRs which supply power to agriculture and other consumers to be immediately undertaken
• Medium term: Metering of all agricultural DTRs to be undertaken.
• Long term: Metering of agricultural consumers to be undertaken
The above would help in segregating agriculture sales from losses and this would portray the actual loss levels of DISCOMS.
2. Re-survey of all the agricultural services is needed for greater subsidy targeting. As per Government Policy, small and marginal farmers need to be provided with subsidy. Resurvey of agricultural services will aid in identification of the small and marginal farmers.
3. Implementation of HVDS on a larger scale, covering segregation of all agricultural feeders needs to be taken up. Presently around 41,813 pump sets are envisaged to be covered under JICA scheme in FY 14-15 and 5,358 agricultural pump sets have been covered till July 2014. Total pump sets to be covered under JICA scheme is 1.96 Lakhs. Steps need to be taken for implementing HVDS for the balance agricultural pump sets in an expedited manner. This will ensure better quality of supply and reduced distribution losses.
4. Demand side management needs to be taken up which would entail measures such as
• Mandatory installation of capacitors
• Insistence on use of ISI marked pump sets for increased efficiency
• Installation of solar pump sets in areas with high water table with technical and financial support from MNRE
Because of the higher cash conversion cycle, accumulation of dues from government departments and excessive dependence on government subsidy, there is a gap between ARR and ACS.
The projected ARR-ACS gap for the DISCOMS is computed in Table 36 based on the following assumptions:
• Average revenue realization is projected to grow at the rate of 6.5% annually. The key drivers for increase in revenue for the period are:
– Increase in consumer base
– Increase in tariff
– Increased proportion of HT industrial & commercial sales leading to better revenue realization
• Average Distribution costs and Transmission costs are projected to grow at 19% and 26% respectively. Power Purchase cost/unit is projected to grow 5% annually.
• Tariff subsidy is projected to grow 15% annually due to increase in agricultural and domestic connections and increased cost to serve agricultural and domestic consumers.
Table 35: Projected Agriculture Subsidy Requirements for Telangana DISCOMS
Item Unit FY14-15
FY15-16
FY16-17
FY17-18
FY18-19
Avg. CoS Rs. /Unit 5.72 6.09 6.43 6.69 6.99
Agl. Sales MU 11,939 12,536 13,163 13,821 14,512
Agl. Subsidy Required
Rs. Cr. 6,832 7,640 8,467 9,248 10,141
Projected Agl. Subsidy by Govt.
Rs. Cr. 3,331 3,522 3,904 4,264 4,676
Cross subsidy through tariffs
Rs Cr. 3,501 4,117 4,563 4,984 5,465
Source: Analysis
23 Report of Task Force on Energy

The key measures to bridge the gap are as follows:
• Undertake intensive energy audit measures on technical and commercial side to reduce losses.
• Promote energy efficiency in domestic, agriculture, public lighting and buildings.
• Power Purchase cost constitutes more than 75% of total cost, hence optimization of power purchase cost needs to be addressed. Figure 9 shows the contribution to power purchase cost from various sources in FY 2013-14.
The total power purchased from various sources in FY 2013-14 was 44,946 MU at an average rate of Rs. 3.81/KWh.
Table 36: Projected ARR and ACS gap for Telangana DISCOMS
FY14-15
FY15-16
FY16-17
FY17-18
FY18-19
Revenue from Sales (Rs Cr) 20,845 25,540 29,366 35,667 41,694
Agl. Tariff Subsidy (Rs Cr) 3,331 3,522 3,904 4,264 4,676
Domestic Tariff Subsidy (Rs Cr) 1,394 1,618 1,861 2,110 2,402
Total tariff Subsidy (Rs Cr) 4,725 5,140 5,765 6,374 7,078
Total Revenue (Rs Cr) 25,570 30,681 35,131 42,042 48,772
NTI (Non-Tariff (Rs Cr) 455 478 502 527 553
Revenue including NTI (Rs Cr) 26,025 31,159 35,632 42,568 49,325
Power Purchase Costs (Rs Cr) 22,815 27,561 31,243 37,413 43,118
Transmission & SLDC Charges (Rs Cr) 944 1,224 1,543 1,685 1,745
Distribution Costs (Rs Cr) 2,188 3,040 3,491 3,966 4,518
PGCIL & ULDC Charges (Rs Cr) 268 295 324 357 392
Total Expenses (Rs Cr) 26,216 32,121 36,601 43,421 49,774
Sales (MU) 45,813 52,707 56,902 64,895 71,230
ARR without subsidy (Rs/KWh) 4.65 4.94 5.25 5.58 5.93
ARR with subsidy (Rs/KWh) (A) 5.68 5.91 6.26 6.56 6.92
ACS (Rs/KWh)(B) 5.72 6.09 6.43 6.69 6.99
Gap (A-B) -0.04 -0.18 -0.17 -0.13 -0.06
Tariff subsidy for FY 14-15 also includes a subsidy amount of Rs. 496 Crs for LT Domestic consumers with monthly consumption between 50 and 200 units. This amount has been considered for future year projections alsoSource: Wheeling Tariff Order for TSDISCOMS ( FY 14-15 to FY 18-19), Analysis
24
Figure 9: PP cost contribution from various sources in FY 2013-14*
*PP of United AP is segregated for Telangana based on PP ratio
Report of Task Force on Energy

3.3 Implement efficiency measures in energy consumption
Optimizing energy consumption is an integral aspect of energy sufficiency. Certain small-scale but easy to implement and effective interventions can help in moderating energy requirement and reducing overall deficit.
Listed below are a few energy efficiency measures to be introduced for domestic, street light and agriculture consumers:
• Domestic households: The total energy consumption of households in Telangana was around 7,800 MU in FY 2013-14. Of this, lighting accounted for 30% of consumption which is around 2,330 MU. A target for a minimum 10% of replacement of existing bulbs with LED bulbs every year is worked out in Table 37.
• Street lights: The total energy consumption in Telangana by street lights was around 600 MU in FY 2013-14. Most of public lighting today is based on conventional lights and the light output is much lower than the prescribed standards. Use of LEDs along with intelligent controls is expected to bring down the energy consumption by 50%. The projected savings are shown in Table 38.
• Agriculture pump-sets: The total annual energy consumption in Telangana for agriculture is about 11,000 MU. Around 25% to 30% saving in agricultural consumption is expected from replacement of existing agriculture pump sets with energy efficient ISI marked pump sets. This computation is shown in Table 39.
• Government buildings: The Energy Conservation Building Code (ECBC) was adopted by the erstwhile Government early this year. This acts as a stepping stone to promote energy savings in the building sector. It lists norms for eco-friendly designs of building envelopes, lighting systems, HVAC systems, electrical, water heating and pumping systems. It is suggested that all existing and new
Government buildings should comply with the ECBC code. Around 25% - 30% savings in energy consumption can be obtained through this initiative.
• Industrial consumers: Industries should be encouraged to get LEED certifications. Alternatively, “Green Cess” can be imposed on inefficient energy consumption in industries.
• State energy conservation mission (SECM): A nodal agency for enabling and encouraging energy conservation activities in the state should be set up.
Rules and regulations should be suitably framed to ensure implementation of recommendations from BEE and BIS. This would ensure optimal demand side management across various sectors.
Table 37: Energy efficiency measures for domestic consumers
Particulars Unit FY 14-15
FY15-16
FY16-17
FY17-18
FY18-19
House holds Lakhs 81 83 86 89 91
LEDs installed Lakhs 16 33 34 35 55
Energy savings MU 123 372 376 256 391
Source: TSDISCOMS, Analysis
Table 38: Energy efficiency measures for street lights
Particulars Unit FY 14-15
FY15-16
FY16-17
FY17-18
FY18-19
Energy savings MU 154 154 154 154 154
Source: TSDISCOMS, Analysis
Table 39: Energy efficiency measures for agriculture consumers
Particulars Unit FY 14-15
FY15-16
FY16-17
FY17-18
FY18-19
Agl pumps to be replaced
Lakhs. 0.95 2.00 2.09 2.20 2.31
Energy savings MU 165 347 364 382 401
Source: TSDISCOMS, Analysis
25 Report of Task Force on Energy

26Report of Task Force on Energy

Meeting the Demand-Supply gap: Scenario analysis
27 Report of Task Force on Energy

The Demand-Supply gap for Telangana for next 5 years has been worked for three different scenarios – Base scenario, Optimistic scenario and Pessimistic scenario.
4.1 Base scenario
3.2.1 Enhance coal supply from SCCL
Following assumptions are taken
a. PLF improvement of TSGENCO plants from current level of 80% to 85% in FY 15-16 and 90% by FY 18-19.
b. SCCL Unit-1 to be commissioned by March 2016 and Unit-2 to be commissioned by October 2016.
c. 1200 MW Medium term power considered in a phased manner commencing from June 2016.
d. 500 MW wind power and 2000 MW solar power considered in a phased manner from FY 15-16.
4. Meeting the Demand-Supply gap: Scenario analysis
Table 40: Telangana Demand-Supply Summary Table (MU) – Base scenario
Sl. No Item FY 14-15
FY15-16
FY16-17
FY17-18
FY18-19
A Energy Requirement 54,998 63,047 67,902 77,164 84,496
B Energy availability from existing sources 45,795 45,037 44,030 43,896 43,754
C = A-B Energy Surplus (+) / Deficit (-) -9,203 -18,009 -23,872 -33,268 -40,742
D (Sec 3.1) Achieve capacity addition targets
D.1 Commission new power plants under state ownership 13 1,618 5,565 6,531 12,523
D.2 Firm up power supply from upcoming Central Generating Stations (CGS) - 2,305 3,005 5,658 6,922
D.3 Firm up power supply from upcoming power plants 1,499 7,289 7,965 9,981 9,981
D.4 Procure power from power plants located in Southern and outside Southern region - - 4,069 8,176 8,176
D.5 Increase installed capacity of Non-Conventional Energy (NCE) sources - 420 1,260 2,101 3,012
D =SUM(D1:D5) Additional energy availability 1,512 11,632 21,865 32,448 40,614
E (Sec 3.2) Additional energy availability (Improve efficiency of existing TSGENCO plants) - 431 431 431 862
F=C-D-E Energy Surplus (+) / Deficit (-) -7,691 -5,947 -1,577 -389 735
Energy Surplus (+) / Deficit (-) -13.98% -9.43% -2.32% -0.50% 0.87%
G (Sec 3.3) Reduction in energy consumption from energy efficiency measures 442 873 894 792 946
H-F-G Energy Surplus (+) / Deficit (-) -7,249 -5,074 -683 403 1,681
Energy Surplus (+) / Deficit (-) -13.18% -8.05% -1.01% 0.52% 1.99%
Source: Analysis
28Report of Task Force on Energy
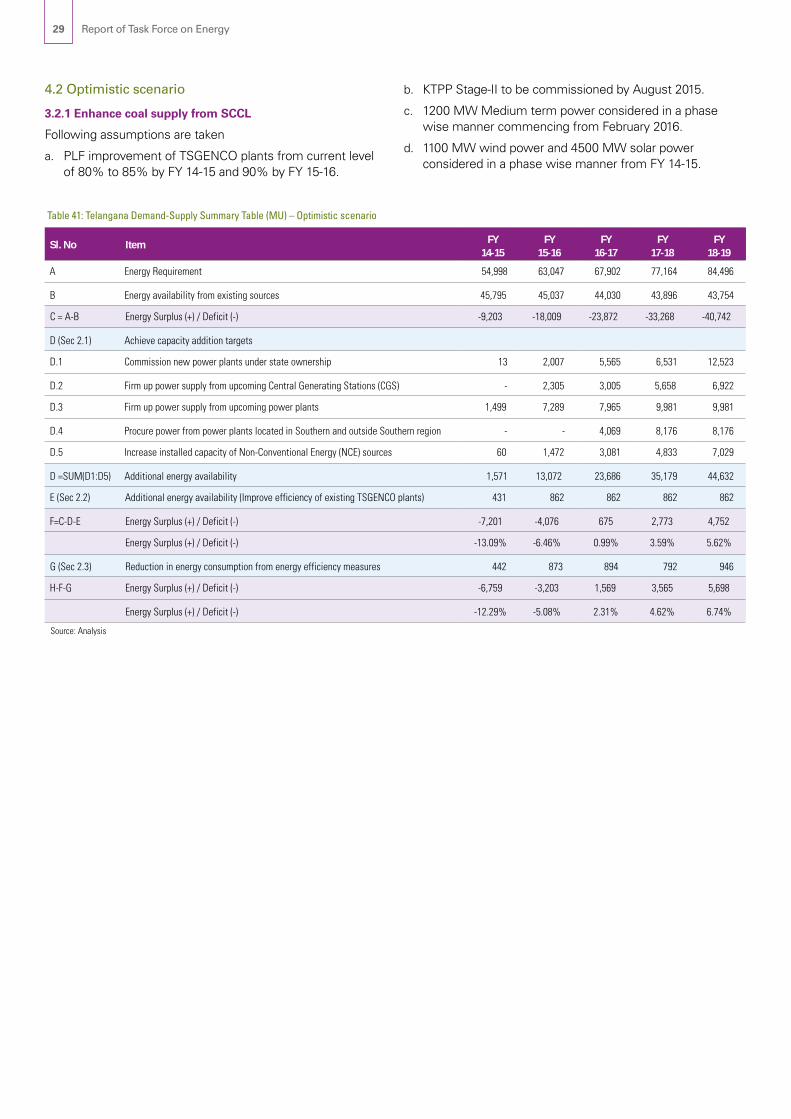
4.2 Optimistic scenario
3.2.1 Enhance coal supply from SCCL
Following assumptions are taken
a. PLF improvement of TSGENCO plants from current level of 80% to 85% by FY 14-15 and 90% by FY 15-16.
b. KTPP Stage-II to be commissioned by August 2015.
c. 1200 MW Medium term power considered in a phase wise manner commencing from February 2016.
d. 1100 MW wind power and 4500 MW solar power considered in a phase wise manner from FY 14-15.
Table 41: Telangana Demand-Supply Summary Table (MU) – Optimistic scenario
Sl. No Item FY 14-15
FY15-16
FY16-17
FY17-18
FY18-19
A Energy Requirement 54,998 63,047 67,902 77,164 84,496
B Energy availability from existing sources 45,795 45,037 44,030 43,896 43,754
C = A-B Energy Surplus (+) / Deficit (-) -9,203 -18,009 -23,872 -33,268 -40,742
D (Sec 2.1) Achieve capacity addition targets
D.1 Commission new power plants under state ownership 13 2,007 5,565 6,531 12,523
D.2 Firm up power supply from upcoming Central Generating Stations (CGS) - 2,305 3,005 5,658 6,922
D.3 Firm up power supply from upcoming power plants 1,499 7,289 7,965 9,981 9,981
D.4 Procure power from power plants located in Southern and outside Southern region - - 4,069 8,176 8,176
D.5 Increase installed capacity of Non-Conventional Energy (NCE) sources 60 1,472 3,081 4,833 7,029
D =SUM(D1:D5) Additional energy availability 1,571 13,072 23,686 35,179 44,632
E (Sec 2.2) Additional energy availability (Improve efficiency of existing TSGENCO plants) 431 862 862 862 862
F=C-D-E Energy Surplus (+) / Deficit (-) -7,201 -4,076 675 2,773 4,752
Energy Surplus (+) / Deficit (-) -13.09% -6.46% 0.99% 3.59% 5.62%
G (Sec 2.3) Reduction in energy consumption from energy efficiency measures 442 873 894 792 946
H-F-G Energy Surplus (+) / Deficit (-) -6,759 -3,203 1,569 3,565 5,698
Energy Surplus (+) / Deficit (-) -12.29% -5.08% 2.31% 4.62% 6.74%
Source: Analysis
29 Report of Task Force on Energy

4.3 Pessimistic scenario
3.2.1 Enhance coal supply from SCCL
Following assumptions are taken
a. PLF improvement of TSGENCO plants from current level of 80% to 85% by FY 16-17.
b. KTPP Stage-II to be commissioned by March 2016.
c. KTPS Stage-VII to be commissioned by August 2018
d. Delay in commissioning of CGS and APGENCO stations by
6 months.
e. SCCL Unit-1 to be commissioned by October 2016 and Unit-2 by April 2017.
f. 1000 MW Medium term power considered in a phase wise manner from June 2016
g. 400 MW wind power and 800 MW solar power considered in a phase wise manner from FY 15-16.
h. Energy efficiency measures not implemented.
Table 42: Telangana Demand-Supply Summary Table (MU) – Pessimistic estimate
Sl. No Item FY 14-15
FY15-16
FY16-17
FY17-18
FY18-19
A Energy Requirement 54,998 63,047 67,902 77,164 84,496
B Energy availability from existing sources 45,795 45,037 44,030 43,896 43,754
C = A-B Energy Surplus (+) / Deficit (-) -9,203 -18,009 -23,872 -33,268 -40,742
D (Sec 3.1) Achieve capacity addition targets
D.1 Commission new power plants under state ownership 13 486 3,637 6,531 10,521
D.2 Firm up power supply from upcoming Central Generating Stations (CGS) - 851 2,900 4,506 6,543
D.3 Firm up power supply from upcoming power plants 1,499 5,820 7,778 9,981 9,981
D.4 Procure power from power plants located in Southern and outside Southern region - - 3,849 6,813 6,813
D.5 Increase installed capacity of Non-Conventional Energy (NCE) sources - 175 525 910 1,401
D =SUM(D1:D5) Additional energy availability 1,512 7,332 18,690 28,742 35,259
E (Sec 3.2) Additional energy availability (Improve efficiency of existing TSGENCO plants) - - 431 431 431
F=C-D-E Energy Surplus (+) / Deficit (-) -7,691 -10,678 -4,752 -4,095 -5,052
Energy Surplus (+) / Deficit (-) -13.98% -16.94% -7.00% -5.31% -5.98%
Source: Analysis
30Report of Task Force on Energy

The Road Ahead
31 Report of Task Force on Energy

This chapter summarizes the key recommendations from preceding sections under following categories:
• Supply side measures
• Proposed measures in Transmission sector
• Proposed measures in Distribution sector
• Creation of overall responsibility and accountability matrix for Telangana power sector.
Supply Side Measures
1. Achieve capacity addition targets and ensure timely procurement of power
• Ensure timely commissioning of TSGENCO plants: Identify bottle necks in commissioning of TSGENCO plants and address those issues.
• Ensure coal linkage materialization for upcoming TSGENCO plants: Firm up coal linkage for upcoming TSGENCO plants.
• Consider revival of Shankarpally gas power plant: Subject to availability of gas from D6 basin, consider revival of Shankarpally gas power plant.
• Procure power from generators in Southern and outside Southern region: Initiate and ensure timely completion of power procurement through competitive bidding process from generators located in Southern and outside Southern region so as to be successful in blocking the transmission corridor. Ensure longer tenure of PPAs to gain higher priority in open access applications.
• Increase installed capacity of NCE sources: Ensuring a more sustainable fuel mix by implementing measures to increase installed capacity of NCE sources. Some of the key measures are as follows: – Set up single window clearance mechanism. – Allow unrestricted banking during ToD hours. – Provide cross subsidy surcharge exemption. – Provide policy support for solar roof tops and net
metering. – Promote DDG model for solar power generation.
2. Examine continuity of PPAs due to expire in next 5 years.
• Evaluate extension of PPAs with gas based IPPs subject to availability of gas.
• Ensure renewal of PPA with NTPC Ramagundam-II on similar terms as done in case of NTPC Ramagundam-I.
• Initiate discussion with KSK Mahanadi for renewing the existing PPA on favourable terms.
3. Enhance coal supply from SCCL
• Expedite land acquisition and other approvals.
• Acquire new coal blocks within country and outside country.
• Modernize existing CHPs and establish new CHPs.
• Modernize mining technologies and undertake steps to lower production costs.
• Establish high capacity coal washeries to improve quality of coal.
4. Improve efficiency of Generation sector
• Ensure sufficient coal linkage and materialization: Ensure 100% materialization of coal linkage for existing TSGENCO plants.
• Undertake coal auditing: Undertake regular coal auditing exercise at three levels – loading, transportation and unloading at power plants.
• Improve blending infrastructure: Improve blending infrastructure to improve GCV of coal.
• Implement coal tracking mechanism: Implement an IT enabled coal tracking mechanism to monitor coal stock availability, coal shortfall, coal linkage materialization etc.
Proposed Measures in Transmission Sector
• Ensure required transmission infrastructure for evacuation of Power from CGS and Power Plants in AP: Set up a monitoring mechanism to oversee implementation of required intra-state and inter-state transmission infrastructure for evacuation of power from upcoming CGS and power plants in AP. Regular SRPC meetings should be utilized for effective coordination of all inter-state projects.
• Strengthen 400 kV / 765 KV network to meet the projected energy requirement. Feasibility studies need to be undertaken for the above.
• Identify Transmission lines / projects to be constructed through – Tariff based competitive bidding – Viability Gap Funding (VGF) based on grant by GoI.
• Identify lines with high losses and undertake system augmentation works.
5. The Road Ahead
32Report of Task Force on Energy

Proposed Measures in Distribution Sector
• Explore Distribution Franchisee models and adopt the model best suited for Telangana State.
• Implement AMR solution for billing of municipal authorities, water board and other public utilities.
• Install smart meters for existing 16 lakh three phase connections.
• Expedite phasing out of existing 19.2 lakh mechanical meters with digital meters.
• Reduce peak demand through customer awareness and differential tariff during peak hours.
• Provide redundancy schemes to improve reliability needs of critical commercial, security and essential services establishments.
• Phase wise HVDS implementation to cover 19.1 lakh agricultural consumers
• Monitor agriculture supply as per Government policy, by effective metering and data collection.
• Feeder / town wise energy audit through MDAS in R-APDRP towns and phased extension to all towns.
– Commercial action plan: Carry out intensive inspection and reduction of MBC exceptions through support of data analytics to improve metering, billing and collection efficiency.
– Technical action plan: Augmentation of lines / DTR, phase balancing of DTRs and using optimal conductor size.
• Implement GIS mapping and metering of DTRs and feeders.
• Implement SCADA at 11 kV feeder level and at all district headquarters.
• Record age profile of all DTRs and meters for better inventory management and planning of Repairs & Maintenance activities.
• Explore avenues for installation of pre-paid meters in urban centers.
• Implement Agricultural feeder segregation.
• Implement net metering for solar roof-top power plants.
• Install solar pump sets in viable areas with above average water table.
• Set up consumer care centers in each district with mapping of all consumers in the district.
• Improve financial health of DISCOMs:
– Undertake short, medium and long term metering of agriculture DTRs and consumers.
– Conduct re-survey of all agriculture services for greater subsidy targeting.
– Timely budgetary support to be extended by the Government to TSDISCOMS. Details for FY 14-15 given in Table 43.
– Government dues should be paid initially.
• Energy efficiency measures:
– Implement demand side management measures like installation of capacitors, usage of ISI marked pump sets, installation of solar pump sets.
– Rules and regulations should be suitably framed to ensure implementation of recommendations from BEE and BIS.
– Set up a nodal agency (SECM) to implement the policy objectives as well as co-ordinate with all the stake-holders for achieving efficiency in energy consumption in target segments.
Table 43: Subsidy Requirement from Current Budget FY 14-15
S. No. Particulars Amount (Rs Cr)
1 LT- I Domestic
0-50 KWh 898
50-200 KWh 496
2 LT – V Agriculture 3,331
Subsidy 4,725
3 Interest on Vidyut bonds* 26
4 Interest on bonds under FRP Scheme 455
5 Interest on expensive power procured from FY 2008 to 2011-12
453
Financing 935
Total budgetary support 5,660
Budget release order to be issued,#The arrears on tariff subsidy for the FY 2014-15 receivable till 31st Oct 14 is Rs. 1,318 crores Source: TSPCC
33 Report of Task Force on Energy

Create responsibility and accountability matrix
It is proposed to create an accountability matrix which clearly identifies responsibility and accountability. This should set timelines for completion of activities with suitable escalation mechanism to expedite decision making and focused execution. Such a responsibility and accountability matrix would ensure timely commissioning of TSGENCO plants, availability of required intra-state and inter-state transmission corridor for evacuation of power from CGS and AP plants, efficient performance of distribution sector and efficiency measures in energy consumption. The structure of the proposed accountability matrix is outlined in Table 44.
Measures outlined in previous sections, if implemented would go a long way in meeting the energy requirement of Telangana in a reliable and affordable manner. This would ensure supply of 24X7 quality power to all, thereby accelerating economic development of Telangana State.
Table 44: Accountability Matrix
Key Issue/ task to be handled Responsible Entity Timeline
Coal linkage issues for upcoming TSGENCO plants
TSGENCO
Commissioning of TSGENCO plants TSGENCO
Transmission evacuation schemes - Generators within the State
TSTRANSCO
Transmission evacuation schemes for receiving power from generators in AP State
PGCIL
Transmission evacuation schemes for receiving power from PGCIL System
TSTRANSCO
Creation of State Energy Conservation Cell Energy Department
Creation of Project Management Group Energy Department
Promotion of renewable energy generation and greater grid integration
TSREDA
Energy Audit Cell - Techno Commercial efficiency improvement
TSTRANSCO/ TSDISCOMS
Implementation of 11 KV SCADA TSTRANSCO/ TSDISCOMS
34Report of Task Force on Energy

Annexure
35 Report of Task Force on Energy

Table 45: Station-wise capacities , Telangana share and PPA expiry
Sl No Name of the Power House Installed Capacity (MW) Telangana Share (MW) PPA Expiry Date
I. THERMAL
1 Kothagudem - A 240 129 31/03/2019
2 Kothagudem - B 240 129 31/03/2019
3 Kothagudem - C 240 129 31/03/2019
4 Kothagudem - D 500 269 31/03/2019
5 KTPS - (Stage -VI) 500 269 22/10/2036
6 Ramagundam - B 63 34 31/03/2019
7 Dr NTTPS 1260 679 31/03/2019
8 Dr NTTPS Stage IV 500 269 27/01/2035
9 R.T.P.P.Stg.1 420 226 31/03/2019
10 R.T.P.P.Stg.2 (unit - 1& 2) 420 226 28/03/2033
11 R.T.P.P. Stg 3 Unit-1 210 113 9/02/2036
12 Kakatiya TPS Stg-1 500 269 13/09/2035
Total Thermal 5093 2744
HYDEL
1 Machkund,Interstate project,Orissa
84 45
2 T.B.Station,Interstate project, Karnataka
58 31
3 Nizam Sagar 10 5
4 Upper Sileru 240 129 31/03/2019
5 Donkarayi 25 13
6 Lower Sileru 460 248
7 Srisailam Right Bank PH 770 415 31/03/2019
8 Srisailam Left Bank PH 900 485 31/03/2019
9 Nagarjunasagar Right Canal PH 90 49 31/03/2019
10 Nagarjunasagar Main PH 816 440 31/03/2019
11 Nagarjunasagar Left Canal PH 60 32
12 Pochampadu 36 19
13 Penna Ahobilam 20 11
14 Singur 15 8
15 Jurala 234 126
Total Hydel 3817 2057
16 Mini Hydel 12 11
17 Wind 2 0
18 Solar Energy Project 1 1 9/01/2037
Total Genco Capacity 8925 4814
36
Annexure I
Report of Task Force on Energy

Table 45: Station-wise capacities , Telangana share and PPA expiry
Sl No Name of the Power House Installed Capacity (MW) Telangana Share (MW) PPA Expiry Date
II. Central Sector Projects:
1 N.T.P.C Ramagundam Stage I 194 105 30/4/2010
2 N.T.P.C Ramagundam Stage II 486 262 31/03/2016
3 N.T.P.C Ramagundam -7 170 92 24/03/2030
4 N.T.P.C.Talcher Stage II (Units 3,4,5&6)
412 222 31/07/2030
5 Simhadri TPS (NTPC) -Stg 1 1000 539 28/02/2028
6 Simhadri TPS (NTPC) -Stg 2 455 245 29/09/2037
7 Neyveli (Tamilnadu)stage-I 116 62 22/04/2013
8 Neyveli (Tamilnadu)stage-II 205 110 8/4/2019
9 M.A.P.P (Tamilnadu) 143 77 20/3/2011
10 Kaiga Nuclear power plant I & II 44 24 15/03/2025
11 Kaiga Nuclear power plant III & IV 136 73 19/01/2036
12 Vallur Stage -1 144 78 31/07/2039
Total Central Sector 3503* 1888
III. Joint sector
1 Vijjeswaram Stage-I 100 9
2 Vijjeswaram Stage-II 172 23
Total Jt Sector 272 32
IV. IPPs
1 Jegurupadu (GVK - Pvt.Sector) 217 117 19/06/2015
2 Jegurupadu GVK -Extn I 220 119 13/04/2024
3 Kakinada (Spectrum - Pvt.Sector) 208 112 18/4/2016
4 Kondapalli Power Corporation Ltd. 351 189 17/10/2015
5 Reliance Energy Ltd 220 119 23/10/2017
6 M/s Vemagiri 370 199 15/09/2029
7 M/s Konaseema Gas Power Ltd 444 239 29/06/2025
8 M/s.Gautami 464 250 4/06/2024
Total IPPs 2495 1344
37 Report of Task Force on Energy
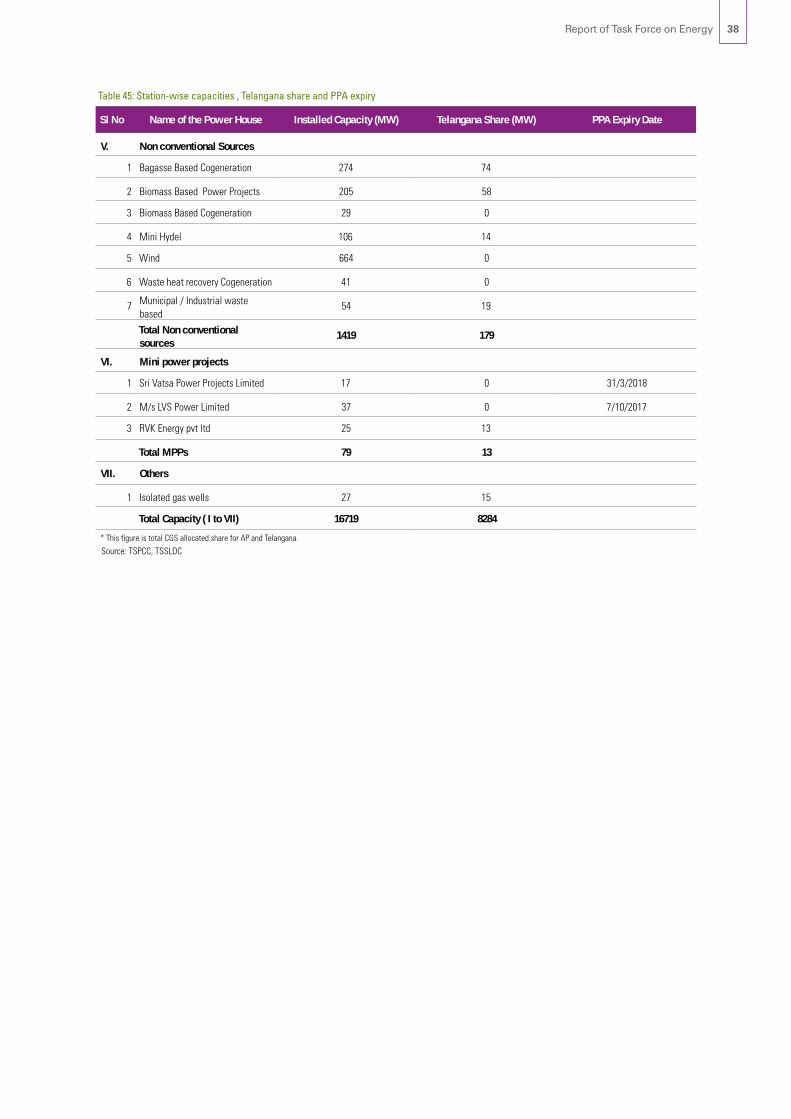
Table 45: Station-wise capacities , Telangana share and PPA expiry
Sl No Name of the Power House Installed Capacity (MW) Telangana Share (MW) PPA Expiry Date
V. Non conventional Sources
1 Bagasse Based Cogeneration 274 74
2 Biomass Based Power Projects 205 58
3 Biomass Based Cogeneration 29 0
4 Mini Hydel 106 14
5 Wind 664 0
6 Waste heat recovery Cogeneration 41 0
7 Municipal / Industrial waste based
54 19
Total Non conventional sources
1419 179
VI. Mini power projects
1 Sri Vatsa Power Projects Limited 17 0 31/3/2018
2 M/s LVS Power Limited 37 0 7/10/2017
3 RVK Energy pvt ltd 25 13
Total MPPs 79 13
VII. Others
1 Isolated gas wells 27 15
Total Capacity ( I to VII) 16719 8284
* This figure is total CGS allocated share for AP and Telangana.
Source: TSPCC, TSSLDC
38Report of Task Force on Energy

39
Annexure II
Key generation plants and load centers - Telangana state
Report of Task Force on Energy

40
ACS Average Cost of Supply
AMR Automated Meter Reading
APDISCOMS Distribution Companies of Andhra Pradesh
APGENCO Andhra Pradesh Power Generation Corporation Limited
APTRANSCO Transmission Corporation of Andhra Pradesh Limited
ARR Average Revenue Realisation
AT&C Aggregate Technical & Commercial
BEE Bureau of Energy Efficiency
BHPL Bhoopalpally
BIS Bureau of Indian Standards
CAGR Compounded Annual Growth Rate
CGS Central Generating Station
CHP Coal Handling Plant
CoD Commercial Operation Date
CoS Cost of Service
DDG Decentralised Distributed Generation
DTR Distribution Transformer
ECBC Energy Conservation Building Code
ER Eastern Region
FSA Fuel Surcharge Adjustment
GCV Gross Calorific Value
GIS Geographical Information System
GoI Government of India
GPRS General Packet Radio Service
GSDP Gross State Domestic Product
HMR Hyderabad Metro Rail
HVAC Heating, Ventilating, and Air Conditioning
HVDS High Voltage Distribution system
IPP Independent Power Producer
ITIR Information Technology Investment Region
JICA Japan International Cooperation Agency
KPI Key Performance Indicator
KTPP Kakatiya Thermal Power Plant
KTPS Kothagudem Thermal Power Station
LED Light Emitting Diode
LEED Leadership in Energy and Environmental Design
LIS Lift Irrigation Scheme
LTA Long Term Agreement
LTOA Long Term Open Access
MBC Metering, Billing and Collection
MCL Mahanadi Coalfields Limited
MDAS Meter Data Acquisition System
MDO Mine Developer and Operator
MNG Manuguru
MNRE Ministry of New and Renewable Energy
MTOA Medium Term Open Access
NCE Non-Conventional Energy
NEW North-East-West
NLC Neyveli Lignite Corporation
NPCIL Nuclear Power Corporation of India Limited
NTPC National Thermal Power Corporation
OCP Open Cast Projects
PGCIL Power Grid Corporation of India Limited
PLF Plant Load Factor
PMG Project Management Group
PPA Power Purchase Agreement
R-APDRP Restructured Accelerated Power Development & Reforms Programme
RTPP Rayalaseema Thermal Power Plant
SBD Standard Bidding Documents
SCADA Supervisory Control and Data Acquisition
SCCL Singareni Collieries Company Limited
SECM State Energy Conservation Mission
SERC State Electricity Regulatory Commission
SR Southern Region
SRPC Southern Regional Power Committee
T&D Transmission and Distribution
TANGEDCO Tamil Nadu Generation & Distribution Company
ToD Time of Day
TSDISCOMS Telangana State Distribution Companies
TSGENCO Telangana State Power Generation Corporation Limited
TSNPDCL Northern Power Distribution Company of Telangana Limited
TSPCC Telangana State Power Coordination Committee
TSPFC Telangana State Power Finance Corporation
TSREDATelangana State Renewable Energy Development Association
TSSLDC Telangana State Load Dispatch Centre
TSSPDCL Southern Power Distribution Company of Telangana Limited
TSTRANSCO Transmission Corporation of Telangana Limited
VSAT Very Small Aperture Terminal
WCL Western Coalfields Limited
WR Western Region
Glossary of Terms
Report of Task Force on Energy
