report of student suspensions, … county school district report of student suspensions, expulsions,...
TRANSCRIPT

Office of Assessment and Evaluation
REPORT OF STUDENT SUSPENSIONS, EXPULSIONS, AND ATTENDANCE
2011-12
Report No. 13-389 September 2013

REPORT OF STUDENT SUSPENSIONS,
EXPULSIONS, AND ATTENDANCE 2011-2012
Charleston County School District
Dr. Nancy J. McGinley Superintendent
Charles D’Alfonso, Ed.D. Executive Director
Department of Achievement and Accountability
Laura F. Donnelly, Ph.D. Director
Office of Assessment and Evaluation
Michael A. Lower, Ph.D. Program Evaluator
Office of Assessment and Evaluation
September 2013 Report No. 13-389

Charleston County School District
Report of Student Suspensions, Expulsions, and Attendance: 2011-2012
Table of Contents
Page
District Summary .......................................................................................................................................... 1 Suspension Tables Table 1A. By Grade Level ................................................................................................................... 4 Table 1B. Rank Order Summary, All Schools .................................................................................... 5 Table 1C. By Gender and Race/Ethnicity, Three Year Comparison ................................................... 7 Table 2A. Elementary Schools (K-5), Current Year ............................................................................ 9 Table 2B. Elementary Schools (K-5), Current Year By Gender ...................................................... 11 Table 2C. Elementary Schools (K-5), Current Year By Race/Ethnicity ........................................... 13 Table 2D. Elementary Schools (K-5), Three Year Comparison ........................................................ 15 Table 3A. Middle Schools (6-8), Current Year ................................................................................. 17 Table 3B. Middle Schools (6-8), Current Year By Gender ............................................................... 19 Table 3C. Middle Schools (6-8), Current Year By Race/Ethnicity ................................................... 21 Table 3D. Middle Schools (6-8), Three Year Comparison ................................................................ 23 Table 4A. High Schools (9-12), Current Year ................................................................................... 25 Table 4B. High Schools (9-12), Current Year By Gender................................................................. 26 Table 4C. High Schools (9-12), Current Year By Race/Ethnicity ..................................................... 27 Table 4D. High Schools (9-12), Three Year Comparison ................................................................. 28 Table 5A. Reasons for Suspension .................................................................................................... 29 Table 5B. Percentage of Reasons Classified as Physical Violence or Criminal Offenses, Elementary Schools (K-5) ................................................................................ 30 Table 5C. Percentage of Reasons Classified as Physical Violence or Criminal Offenses, Middle and High Schools (6-12) ...................................................................... 31 Expulsion Tables Table 6. By Grade Level ................................................................................................................. 32 Table 7. By Gender and Race/Ethnicity, Three Year Comparison ................................................. 33 Table 8. Elementary Schools (K-5) ................................................................................................ 35 Table 9A. Middle Schools (6-8), Three Year Comparison ................................................................ 36 Table 9B. Middle Schools (6-8), Current Year By Gender ............................................................... 38 Table 9C. Middle Schools (6-8), Current Year By Race/Ethnicity ................................................... 40 Table 10A. High Schools (9-12), Three Year Comparison ................................................................. 42 Table 10B. High Schools (9-12), Current Year By Gender................................................................. 43 Table 10C. High Schools (9-12), Current Year By Race/Ethnicity ..................................................... 44 Table 11A. Reasons for Expulsions ..................................................................................................... 45 Table 11B. Percentage of Reasons Classified as Physical Violence or Criminal Offenses, Elementary, Middle and High Schools (K-12) ................................................. 46

Attendance Tables Table 12. Average Daily Attendance Percentage, Three Year Comparison ..................................... 47
Suspension Figures Figure 1A. Percent of Students Suspended at Least One Time by Grade in 2011-12 ........................ 49 Figure 1B. Percent of Students Suspended at Least One Time by Level, 2009-10 to 2011-12 .......... 50 Figure 1C. Suspension Rates for Gender and for Race/Ethnicity in 2011-12 .................................... 51 Figure 1D. Suspension Rates for Gender-Race/Ethnicity, 2009-10 to 2011-12 ................................. 52 Expulsion Figures Figure 2A. Expulsion Rates by Grade in 2011-12 .............................................................................. 53 Figure 2B. Expulsion Rates by Level, 2009-10 to 2011-12 ................................................................ 54 Figure 2C. Expulsion Rates for Gender and for Race/Ethnicity in 2011-12 ...................................... 55 Figure 2D. Expulsion Rates for Gender-Race/Ethnicity, 2009-10 to 2011-12 ................................... 56

REPORT OF STUDENT SUSPENSIONS, EXPULSIONS, AND ATTENDANCE: 2011-2012
This report provides data for Charleston County School District (CCSD) on student discipline and attendance for the 2011-2012 school year. The tables in this narrative provide a district-level summary, while the remainder of the report provides detailed grade-level and school specific data.
Suspensions. During the 2011-12 school year, a total of 10,315 suspensions (out-of-school suspensions) were issued for 4,473 students, or 10.65% of the total district population, K-12. Overall, suspended students averaged 1.88 days absent per suspension. Suspended students lost a cumulative 19,425 days from school during the 2011-12 school year.
Grade Levels
Total Number of
Suspensions1
Students Suspended at Least One Time
Days Lost Due to Suspensions
Total Number2
Percent of Population
(Rate)3Total
Number
Avg. Number of Days
Absent per Suspension
District (K-12) 10,315 4,473 10.65 19,425 1.88 Elementary (K-5) 1,561 825 3.89 2,558 1.64 Middle (6-8) 4,369 1,686 18.08 7,603 1.74 High (9-12) 4,385 1,962 17.11 9,264 2.11
Districtwide suspension rates for the past three years are listed below. The overall number of
suspensions and the suspension rate declined in 2010-11 and 2011-12.
School Year
Total Number of
Suspensions
Students Suspended at Least One Time
Total Number Percent of
Population (Rate) 2009-10 12,806 5,749 14.12% 2010-11 10,809 5,011 12.13% 2011-12 10,315 4,473 10.65%
At the elementary level and middle school level, both the number of suspensions and the suspension rate decreased in 2010-11; while the number of suspensions increased slightly and the suspension rate decreased in 2011-12. At the high school level, the number of suspensions and the suspension rate both steadily decreased since 2009-10. When comparing 2011-12 rates to 2010-11, 50 of CCSD’s 80 schools that were in existence both years maintained or reduced their suspension rate. Of those 50 schools, 33 improved their rate by at least 1 percentage point. Combining data across grades to compare suspension rates for racial/ethnic groups, about 19.20% of black students, 5.01% of Hispanic students, and 3.91% of white students were suspended at least once. These suspension rates are a reduction from 2010-11. These data indicate that black students are suspended at a rate of about five times that for white students. The suspension rate for black students is about nine times that for white students at the elementary level (7.76% versus 0.86%), almost five times at the middle school level (31.85% versus 6.60%), and more than four times at the high school level (29.81% versus 6.97%). The suspension rate for Hispanic students is 1 This column counts every suspension, including multiple suspensions for students suspended more than once during the year. 2 This column counts each suspended student only once, regardless of the number of suspensions they accrue. 3 This column presents the ‘Suspension Rate,’ defined as the percentage of the student population (180-day Average Daily
Membership) suspended one or more times during the school year.
1

about the same as for white students at the elementary school level (0.69% versus 0.86%), but one and a half times at the middle school level (9.98% versus 6.60%) and more than double at the high school level (16.44% versus 6.97%). Combining data across grades to compare suspension rates by gender, about 13.64% of male students were suspended at least once, compared to 7.85% of female students. At the elementary level, the suspension rate for male students is more than double that for females (5.48% versus 2.27%). At the middle school level, the suspension rate for males is about one and a half times that for females (22.71% compared to 13.72%). Similarly, at the high school level, the suspension rate for males is about one and a half times that of females (21.74% versus 13.34%).
Combining data across grades to compare suspension rates for ethnicity-gender categories,
black males have the highest suspension rate (23.78% overall), followed by black females (14.53%), and Hispanic males (5.77%). This trend is true at the high school level, where black males have the highest suspension rate (36.22%), followed by black females (23.70%) and Hispanic males (20.18%). At the middle school level, black males have the highest suspension rate (38.32%), followed by black females (24.98%) and Hispanic females (10.27%). At the elementary level, black males have the highest suspension rate (10.70%), followed by black females (4.70%) and white males (1.38%).
Reasons for suspensions are consolidated and categorized to reflect the behavior of the
student and the severity of the offense, divided into two major groupings: (1) physical violence or criminal offenses and (2) all other offenses. Suspensions that were due to physical violence or criminal offenses are required to be reported in the state school report cards and are serious events in our schools. During the 2011-12 school year, 1,729 suspensions (16.76% of all suspensions) were due to physically violent or criminal offenses. Of the physical violence or criminal offenses, the most common are: disturbing school (4.41% of all offenses) and simple assault (3.42%). The most common of the non-physical violence/criminal offenses are: misconduct (28.20% of all offenses), disturbing class (13.20%), disobedience (9.22%), and disrespect (8.52%).
Expulsions. Districtwide, 86 students were expelled from CCSD schools during the 2011-12
school year (7 more students than in 2010-11). The elementary school level (K-5) reported 5 expulsions. There were 35 expulsions at the middle school level and 46 expulsions at the high school level. Less than one percent of elementary, middle and high school students were expelled during the 2011-12 school year. Nearly two-thirds (64.0%) of all expulsions were due to physical violence or criminal offenses. The most common physical violence or criminal offenses were drug violation (11.63% of expulsions), disturbing school (representing about 10.47% of expulsions), assault (9.30% of expulsions), and intimidation (9.30% of expulsions). Expulsion rates for the last three years are presented in the table below.
Expulsion Rates: 3 Year Comparison Level 2009-10 2010-11 2011-12 District (K-12) 0.29% 0.19% 0.20% Elementary (K-5) 0.00% 0.00% 0.02% Middle (6-8) 0.37% 0.26% 0.38% High (9-12) 0.75% 0.48% 0.40%
Combining data across grades to compare expulsion rates for racial/ethnic groups, about 0.38% of black students, 0.04% of Hispanic students, and about 0.08% of white students were expelled during 2011-12. Black students had the highest expulsion rate at all school levels. The expulsion rate for male students was also higher than that for female students (0.31% vs. 0.10%). This pattern was present at all levels.
2

Attendance. The districtwide Average Daily Attendance rate (ADA%) for 2011-12 was 96.88%, a value close to the rates for 2009-10 (95.63%) and 2010-11 (96.10%). The Average Daily Attendance (ADA) is the aggregate number of days present divided by the number of days the school is in session. The ADA% is the ADA divided by the Average Daily Membership (ADM). Attendance rates for individual schools ranged from 84.28% (Greg Mathis Charter) to 99.81% (Charleston Charter School for Math and Science). Comparing 2011-12 rates to 2010-11, 55 of CCSD’s 80 schools that were in existence both years maintained or improved their attendance rate. Of those 55 schools, 19 improved their rate by at least 1 percentage point.
Attendance Rates: 3 Year Comparison Level 2009-10 2010-11 2011-12 District (K-12) 95.63% 96.10% 96.88
Only one school (Greg Mathis Charter) had an attendance rate lower than 90%. Three
schools had attendance rates between 90% and 94%; 76 schools had an attendance rate of 94% or higher.
3

TABLE 1ACCSD 180-Day Suspension Report, 2011-2012
Average Number
of Days Absent GRADE per Suspension
K 70 1.84% 124 1.77 162 1.311 104 2.83% 233 2.24 369 1.582 141 3.86% 255 1.81 479 1.883 113 3.33% 211 1.87 331 1.574 188 5.61% 364 1.94 597 1.645 209 6.26% 374 1.79 620 1.666 508 15.78% 1,274 2.51 2,121 1.667 590 19.05% 1,602 2.72 2,736 1.718 588 19.54% 1,493 2.54 2,746 1.849 703 21.44% 1,705 2.43 3,715 2.18
10 509 17.20% 1,131 2.22 2,363 2.09 11 375 15.04% 774 2.06 1,685 2.18 12 375 13.71% 775 2.07 1,501 1.94Total 4,473 10.65% 10,315 2.31 19,425 1.88
Student Suspended
1 In this table, the total number of students suspended at least one time is counted by grade level, whereas Tables 2A-4D present numbers of students suspended at least one time by school. In Tables 2A-4D, a student may be counted more than once if suspended at more than one school.
Total Number of
Students Suspendedat Least One Time1
Percent of Students
Suspendedat Least One Time
Total Number
of Days Absentdue to Suspensions
Total
Number ofSuspensions
Average Number
of Suspensions per
4

TABLE 1BCCSD 180-Day Suspension Report, Rank Order Summary for All Schools, 2009-2010 to 2011-2012
(Schools are rank-ordered by their current suspension rate.)
Current CurrentGrades 2009-10 2010-11 2011-12
APPLE Charter K-5 N/A 1.03% 0.00%Charles Pinckney Elementary 3-5 0.61% 0.19% 0.00%Charleston Development Academy Charter K-5 0.00% 0.00% 0.00%East Cooper Montessori Charter 1-5 0.66% 0.68% 0.00%Jane Edwards Elementary K-5 8.31% 1.15% 0.00%Midland Park Elementary K-4 3.11% 0.72% 0.00%Minnie Hughes Elementary K-5 0.00% 0.00% 0.00%Montessori Community K-5 0.00% 0.00% 0.00%Orange Grove Charter Elementary K-5 5.10% 3.09% 0.00%PACE Charter K-4 N/A 0.00% 0.00%Sullivan's Island Elementary K-5 2.22% 2.12% 0.00%Laurel Hill Primary K-2 0.19% 0.18% 0.09%Belle Hall Elementary K-5 1.14% 0.93% 0.14%Jennie Moore Elementary K-5 0.88% 1.02% 0.28%Ashley River Elementary K-5 0.18% 0.17% 0.34%Dunston Elementary K-3 0.00% 2.77% 0.37%Drayton Hall Elementary K-5 5.83% 4.43% 0.37%Buist Academy K-5 1.94% 0.00% 0.39%Stiles Point Elementary K-5 0.89% 0.60% 0.44%Oakland Elementary K-5 7.97% 6.90% 0.62%James Simons Elementary K-5 8.20% 3.94% 0.72%Mt. Pleasant Academy K-5 0.89% 0.41% 0.83%Whitesides Elementary K-5 1.23% 0.68% 1.03%Chicora Elementary K-5 1.67% 1.39% 1.10%James B. Edwards Elementary K-5 1.42% 0.95% 1.15%Ladson Elementary K-5 4.73% 3.31% 1.24%Angel Oak Elementary K-5 3.74% 3.22% 1.42%James Island Elementary K-5 1.88% 3.13% 1.72%Stono Park Elementary K-5 3 10% 3 70% 1 95%
Schools Serving Elementary Grades During 2011-12: K, 1, 2, 3, 4, or 5
Comparison
Stono Park Elementary K 5 3.10% 3.70% 1.95%Harborview Elementary K-5 0.00% 2.56% 2.03%Frierson Elementary K-5 7.90% 3.73% 2.65%Haut Gap Elementary 5 N/A 5.42% 2.67%St. Andrew's School of Math & Science K-5 3.49% 3.94% 3.41%Charleston Progressive K-5 10.37% 8.37% 4.08%Mary Ford Elementary K-5 20.45% 1.94% 4.73%Mitchell Elementary K-5 10.09% 9.91% 5.57%Pinehurst Elementary 2-5 N/A 6.28% 5.86%Mt. Zion Elementary K-5 12.22% 6.37% 5.88%A.C. Corcoran Elementary K-5 7.69% 5.18% 6.39%Hunley Park Elementary K-5 7.41% 4.63% 6.56%Goodwin Elementary K-5 10.35% 8.69% 7.23%Lambs Elementary K-5 2.26% 4.44% 7.49%Murray LaSaine Elementary K-5 7.17% 2.62% 7.65%Hursey Elementary K-5 8.11% 7.00% 7.73%Pepperhill Elementary K-5 12.25% 9.56% 8.18%Springfield Elementary K-5 3.43% 8.28% 10.27%St. James-Santee Elementary K-5 11.37% 4.65% 10.53%North Charleston Elementary K-5 11.62% 16.38% 11.83%Blaney Elementary K-5 18.47% 0.75% 13.28%Ellington Elementary K-5 19.79% 6.91% 14.41%Memminger Elementary K-5 20.62% 14.03% 19.71%Burns Elementary K-5 19.37% 21.60% 23.50%Sanders-Clyde Elementary K-5 19.66% 24.27% 24.35%
5

TABLE 1BCCSD 180-Day Suspension Report, Rank Order Summary for All Schools, 2009-2010 to 2011-2012
(Schools are rank-ordered by their current suspension rate.)
Current CurrentGrades 2009-10 2010-11 2011-12
APPLE Charter 6-7 N/A 5.76% 0.00%Charleston Development Academy Charter 6-8 0.00% 0.00% 0.00%East Cooper Montessori Charter 6-8 0.00% 0.00% 0.00%Jane Edwards Elementary 6 0.00% 0.00% 0.00%Montessori Community 6-8 0.00% 4.79% 0.00%PACE Charter 6-8 N/A 0.00% 0.00%School of the Arts 6-8 2.47% 3.95% 0.21%Buist Academy 6-8 2.15% 0.00% 1.48%Cario Middle 6-8 6.91% 6.95% 4.10%Minnie Hughes 6 8.82% 5.67% 5.07%St. James-Santee 6 47.78% 27.01% 8.89%Moultrie Middle 6-8 10.45% 5.73% 9.77%C.E. Williams Middle 6-8 16.90% 11.88% 9.87%James Simons Elementary 6 13.20% 14.04% 9.93%Charleston Math & Science Charter 6-8 39.45% 14.95% 10.92%Ft. Johnson Middle 6-8 15.59% 13.18% 12.47%Laing Middle 6-8 12.12% 13.77% 13.42%Haut Gap Middle 6-8 21.51% 20.12% 14.30%St. Andrew's Middle 6-8 27.14% 22.39% 15.79%Lincoln 7-8 44.69% 30.97% 17.50%Ellington 6 45.77% 11.30% 21.13%Mitchell Elementary 6 24.55% 7.64% 21.51%Military Magnet Academy 6-8 29.92% 13.99% 22.94%Blaney 6 31.40% 12.48% 23.35%James Island Middle 6-8 25.94% 18.70% 24.36%Burke Middle 7-8 45.05% 51.02% 28.28%Jerry Zucker 6-8 25.37% 15.24% 28.59%Northwoods Middle 6-8 38.73% 38.02% 29.81%West Ashley Middle 6-8 36 64% 26 40% 30 63%
Schools Serving Middle Grades During 2011-12: 6, 7, or 8
Comparison
West Ashley Middle 6 8 36.64% 26.40% 30.63%Charleston Progressive 6 N/A 19.69% 31.49%Sanders-Clyde Elementary 6-8 43.30% 44.17% 38.72%Baptist Hill 7-8 51.93% 47.55% 39.25%ARMS Academy at Morningside 6-8 51.38% 47.80% 42.21%EXCEL Academy at Morningside 6-8 39.81% 35.82% 42.89%Memminger Elementary 6 37.85% 19.46% 60.98%
Current CurrentGrades 2009-10 2010-11 2011-12
PACE Charter 9-12 N/A N/A 0.00%Academic Magnet High 9-12 2.16% 1.49% 1.78%School of the Arts 9-12 5.94% 6.39% 2.61%Wando High 9-12 10.46% 7.65% 7.69%James Island Charter High 9-12 15.76% 14.15% 9.57%Military Magnet Academy 9-12 38.59% 17.52% 9.95%Charleston Math and Science Charter 9-12 31.82% 22.74% 12.46%West Ashley High 9-12 24.56% 21.37% 19.18%Burke High 9-12 42.78% 33.30% 20.83%Lincoln High 9-12 33.26% 17.74% 23.68%Garrett Academy of Technology 9-12 29.65% 30.24% 25.14%Baptist Hill High 9-12 43.20% 30.58% 33.64%St. John's High 9-12 41.67% 43.25% 34.05%North Charleston High 9-12 32.03% 47.70% 35.01%Stall High 9-12 40.09% 41.17% 38.83%Greg Mathis Charter 9-12 82.19% 103.07% 75.05%
Schools Serving High School Grades During 2011-12: 9,10,11, or 12
Comparison
6

TABLE 1CCCSD 180-Day Suspension Report by Gender and Race/Ethnicity, from 2009-2010 to 2011-20121
2009-10Elementary (K-5) 1,792 1,492 1,561 1,063 866 825 5.24 4.18 3.89GenderMale 1,375 1,161 1,166 794 652 593 7.66 6.17 5.48Female 417 331 395 269 214 232 2.71 2.17 2.27EthnicityBlack 1,582 1,287 1,375 922 730 710 9.75 8.03 7.76Hispanic 29 20 15 23 17 12 1.58 1.09 0.69White 178 155 139 115 99 80 1.29 1.10 0.86Ethnicity and GenderBlack Male 1,195 981 1,008 668 538 499 13.98 11.59 10.70Hispanic Male 23 16 15 18 13 12 2.35 1.58 1.29White Male 154 135 119 93 82 66 2.02 1.73 1.38Black Female 387 306 367 240 192 211 5.13 4.31 4.70Hispanic Female 6 4 0 5 4 0 0.73 0.54 0.00White Female 24 20 20 21 17 14 0.48 0.40 0.31Middle (6-8) 5,079 4,319 4,369 2,150 1,849 1,686 24.49 20.51 18.08GenderMale 3,502 2,916 2,856 1,428 1,196 1,066 31.87 26.34 22.71Female 1,577 1,403 1,513 722 653 620 16.98 15.21 13.72Eth i it
At Least One Time1
2009-10 2010-11
Number of Number of Percent of StudentsSuspended At Least Once1Suspensions Students Suspended
2010-11 2011-122010-11 2011-12 2011-122009-10
EthnicityBlack 4,399 3,719 3,606 1,741 1,425 1,318 41.95 35.36 31.85Hispanic 123 98 111 66 54 48 15.83 12.33 9.98White 547 433 575 333 269 284 8.28 6.54 6.60Ethnicity and GenderBlack Male 2,971 2,479 2,304 1,026 895 817 48.08 43.13 38.32Hispanic Male 91 77 74 44 40 25 19.38 16.95 9.73White Male 432 327 445 259 197 205 12.65 9.37 9.45Black Female 1,428 1,240 1,302 586 530 501 29.07 27.11 24.98Hispanic Female 32 21 37 20 14 23 10.53 6.93 10.27White Female 115 106 130 69 72 79 3.49 3.58 3.711 Figures shown on this table for number and percent of students suspended may vary slightly from figures reported on other tables in this report due to minor differences in calculated totals depending on the level of aggregation represented and on whether rates are based on Average Daily Membership (ADM) or enrollment figures.
7

TABLE 1CCCSD 180-Day Suspension Report by Gender and Race/Ethnicity, from 2009-2010 to 2011-20121
2009-10
At Least One Time1
2009-10 2010-11
Number of Number of Percent of StudentsSuspended At Least Once1Suspensions Students Suspended
2010-11 2011-122010-11 2011-12 2011-122009-10High (9-12) 5,935 4,998 4,385 2,716 2,374 1,962 23.32 20.51 17.11GenderMale 3,799 3,199 2,883 1,635 1,400 1,223 29.48 25.36 21.74Female 2,136 1,799 1,502 1,081 974 739 18.69 17.09 13.34EthnicityBlack 4,942 4,129 3,464 2,160 1,862 1,474 38.79 35.68 29.81Hispanic 148 142 141 74 65 73 18.23 15.37 16.44White 821 695 702 469 418 381 9.17 7.88 6.97Ethnicity and GenderBlack Male 3,053 2,554 2,211 1,214 1,049 874 46.23 41.93 36.22Hispanic Male 125 104 102 55 40 44 27.23 19.61 20.18White Male 606 516 516 335 293 285 12.89 10.95 10.04Black Female 1,889 1,575 1,253 917 813 600 31.17 29.92 23.70Hispanic Female 23 38 39 19 25 29 9.31 11.42 12.83White Female 215 179 186 132 125 96 5.24 4.76 3.65District (K-12) 12,806 10,809 10,315 5,929 5,089 4,473 14.57 12.32 10.65GenderMale 8,676 7,276 6,905 3,857 3,248 2,882 18.91 15.74 13.64Female 4,130 3,533 3,410 2,072 1,841 1,591 10.38 9.26 7.85Eth i itEthnicityBlack 10,923 9,135 8,445 4,823 4,017 3,502 25.15 21.90 19.20Hispanic 300 260 267 163 136 133 7.16 5.61 5.01White 1,546 1,283 1,416 917 786 745 5.07 4.26 3.91Ethnicity and GenderBlack Male 7,219 6,014 5,523 2,908 2,482 2,190 30.49 26.93 23.78Hispanic Male 239 197 191 117 93 81 9.79 7.38 5.77White Male 1,192 978 1,080 687 572 556 7.43 6.00 5.67Black Female 3,704 3,121 2,922 1,743 1,535 1,312 18.08 16.82 14.53Hispanic Female 61 63 76 44 43 52 4.07 3.70 4.15White Female 354 305 336 222 214 189 2.51 2.40 2.051 Figures shown on this table for number and percent of students suspended may vary slightly from figures reported on other tables in this report due to minor differences in calculated totals depending on the level of aggregation represented and on whether rates are based on Average Daily Membership (ADM) or enrollment figures.
8

TABLE 2ACCSD 180-Day Suspension Report, 2011-2012
Schools Serving Elementary Grades: K, 1, 2, 3, 4, or 5
SCHOOL1
District 1St. James-Santee 18 10.53% 50 2.78 75 1.50
District 2Belle Hall 1 0.14% 3 3.00 4 1.33Charles Pinckney (3-5) 0 0.00% 0 0.00 0 0.00East Cooper Montessori Charter (1-5) 0 0.00% 0 0.00 0 0.00James B. Edwards 6 1.15% 6 1.00 10 1.67Jennie Moore 2 0.28% 2 1.00 2 1.00Laurel Hill Primary (K-2) 1 0.09% 1 1.00 1 1.00Mt. Pleasant Academy 4 0.83% 6 1.50 6 1.00Sullivan's Island 0 0.00% 0 0.00 0 0.00Whitesides 6 1.03% 7 1.17 10 1.43District 3APPLE Charter 0 0.00% 0 0.00 0 0.00Harborview 11 2.03% 24 2.18 136 5.67James Island Elementary 7 1.72% 11 1.57 26 2.36Murray-LaSaine 12 7.65% 14 1.17 19 1.36Stiles Point 3 0.44% 3 1.00 3 1.00District 4
Total Number of
Students Suspended
at Least One Time
Total Number
of Days Absent
due to Suspensions
Percent of Students
Suspended
at Least One Time Suspensions per Student Suspended
Average Number
of Days Absent
per Suspension
Total Average Number of
Suspensions ReportedNumber of
District 4A.C. Corcoran 38 6.39% 76 2.00 135 1.78Burns 86 23.50% 204 2.37 296 1.45Chicora 4 1.10% 6 1.50 20 3.33Dunston (K-3) 1 0.37% 3 3.00 4 1.33Goodwin 43 7.23% 112 2.60 123 1.10Hunley Park 31 6.56% 46 1.48 55 1.20Hursey 17 7.73% 33 1.94 61 1.85Ladson 8 1.24% 13 1.63 20 1.54Lambs 25 7.49% 54 2.16 84 1.56Mary Ford 15 4.73% 44 2.93 112 2.55Midland Park (K-1) 0 0.00% 0 0.00 0 0.00North Charleston Elementary 62 11.83% 111 1.79 188 1.69Pepperhill 43 8.18% 72 1.67 121 1.68Pinehurst (2-5) 26 5.86% 53 2.04 107 2.021 Grade levels in parentheses indicate elementary grade configurations other than K-5. In addition, multi-level schools and K-6 schools appear on more than one table in this report.
9

TABLE 2ACCSD 180-Day Suspension Report, 2011-2012
Schools Serving Elementary Grades: K, 1, 2, 3, 4, or 5
SCHOOL1
Total Number of
Students Suspended
at Least One Time
Total Number
of Days Absent
due to Suspensions
Percent of Students
Suspended
at Least One Time Suspensions per Student Suspended
Average Number
of Days Absent
per Suspension
Total Average Number of
Suspensions ReportedNumber of
District 9Angel Oak 5 1.42% 7 1.40 7 1.00Frierson 3 2.65% 7 2.33 10 1.43Haut Gap (5) 1 2.67% 1 1.00 1 1.00Mt. Zion 12 5.88% 18 1.50 29 1.61District 10Ashley River 2 0.34% 2 1.00 4 2.00Drayton Hall 3 0.37% 6 2.00 6 1.00Montessori Community 0 0.00% 0 0.00 0 0.00Oakland 3 0.62% 3 1.00 3 1.00Orange Grove Charter 0 0.00% 0 0.00 0 0.00PACE Charter 0 0.00% 0 0.00 0 0.00Springfield 60 10.27% 97 1.62 144 1.48St. Andrew's School of Math & Science 25 3.41% 39 1.56 50 1.28Stono Park 5 1.95% 6 1.20 8 1.33District 20Buist Academy 1 0.39% 1 1.00 1 1.00Chas. Development Academy Charter 0 0.00% 0 0.00 0 0.00Charleston Progressive 12 4.08% 15 1.25 24 1.60gJames Simons 1 0.72% 1 1.00 1 1.00Memminger 50 19.71% 108 2.16 173 1.60Mitchell 17 5.57% 28 1.65 50 0.00Sanders-Clyde 94 24.35% 160 1.70 255 1.59District 23Blaney 19 13.28% 34 1.79 44 1.29Ellington 36 14.41% 59 1.64 116 1.97Jane Edwards 0 0.00% 0 0.00 0 0.00Minnie Hughes 0 0.00% 0 0.00 0 0.00
Program Sites2
Liberty Hill Academy 6 N/A 15 2.50 15 1.00TOTAL ELEMENTARY 825 3.89% 1,561 1.89 2,559 1.641 Grade levels in parentheses indicate elementary grade configurations other than K-5. In addition, multi-level schools and K-6 schools appear on more than one table in this report.2 Suspension rates are not determined for program sites because of fluctuating enrollment and because these students are included in their home school data.
10
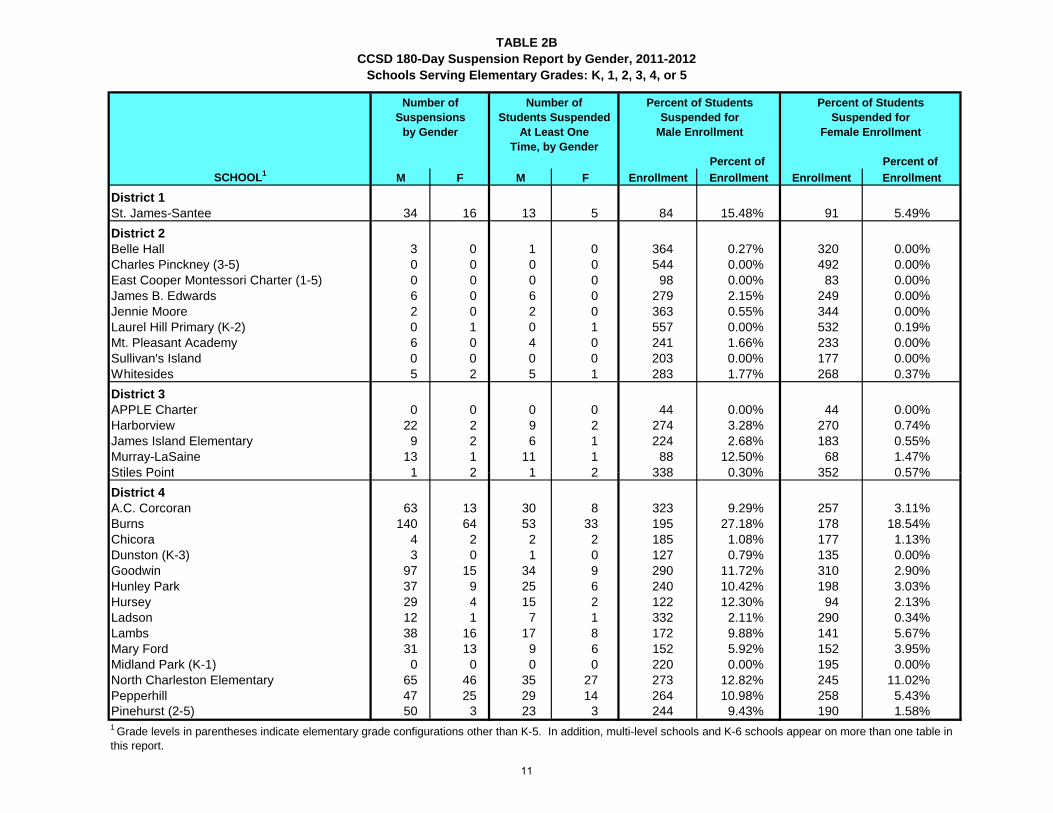
TABLE 2BCCSD 180-Day Suspension Report by Gender, 2011-2012
Schools Serving Elementary Grades: K, 1, 2, 3, 4, or 5
SCHOOL1
District 1St. James-Santee 34 16 13 5 84 15.48% 91 5.49%District 2Belle Hall 3 0 1 0 364 0.27% 320 0.00%Charles Pinckney (3-5) 0 0 0 0 544 0.00% 492 0.00%East Cooper Montessori Charter (1-5) 0 0 0 0 98 0.00% 83 0.00%James B. Edwards 6 0 6 0 279 2.15% 249 0.00%Jennie Moore 2 0 2 0 363 0.55% 344 0.00%Laurel Hill Primary (K-2) 0 1 0 1 557 0.00% 532 0.19%Mt. Pleasant Academy 6 0 4 0 241 1.66% 233 0.00%Sullivan's Island 0 0 0 0 203 0.00% 177 0.00%Whitesides 5 2 5 1 283 1.77% 268 0.37%District 3APPLE Charter 0 0 0 0 44 0.00% 44 0.00%Harborview 22 2 9 2 274 3.28% 270 0.74%James Island Elementary 9 2 6 1 224 2.68% 183 0.55%Murray-LaSaine 13 1 11 1 88 12.50% 68 1.47%Stiles Point 1 2 1 2 338 0 30% 352 0 57%
Number of Number of Percent of Students Percent of StudentsSuspensions Students Suspended Suspended for Suspended for
by Gender Male Enrollment Female Enrollment
At Least OneTime, by Gender
Percent of Percent of Enrollment Enrollment EnrollmentM F M F Enrollment
Stiles Point 1 2 1 2 338 0.30% 352 0.57%District 4A.C. Corcoran 63 13 30 8 323 9.29% 257 3.11%Burns 140 64 53 33 195 27.18% 178 18.54%Chicora 4 2 2 2 185 1.08% 177 1.13%Dunston (K-3) 3 0 1 0 127 0.79% 135 0.00%Goodwin 97 15 34 9 290 11.72% 310 2.90%Hunley Park 37 9 25 6 240 10.42% 198 3.03%Hursey 29 4 15 2 122 12.30% 94 2.13%Ladson 12 1 7 1 332 2.11% 290 0.34%Lambs 38 16 17 8 172 9.88% 141 5.67%Mary Ford 31 13 9 6 152 5.92% 152 3.95%Midland Park (K-1) 0 0 0 0 220 0.00% 195 0.00%North Charleston Elementary 65 46 35 27 273 12.82% 245 11.02%Pepperhill 47 25 29 14 264 10.98% 258 5.43%Pinehurst (2-5) 50 3 23 3 244 9.43% 190 1.58%1 Grade levels in parentheses indicate elementary grade configurations other than K-5. In addition, multi-level schools and K-6 schools appear on more than one table in this report.
11

TABLE 2BCCSD 180-Day Suspension Report by Gender, 2011-2012
Schools Serving Elementary Grades: K, 1, 2, 3, 4, or 5
SCHOOL1
Number of Number of Percent of Students Percent of StudentsSuspensions Students Suspended Suspended for Suspended for
by Gender Male Enrollment Female Enrollment
At Least OneTime, by Gender
Percent of Percent of Enrollment Enrollment EnrollmentM F M F Enrollment
District 9Angel Oak 7 0 5 0 170 2.94% 171 0.00%Frierson 7 0 3 0 56 5.36% 59 0.00%Haut Gap (5) 1 0 1 0 16 6.25% 22 0.00%Mt. Zion 9 9 5 7 106 4.72% 101 6.93%District 10Ashley River 2 0 2 0 279 0.72% 302 0.00%Drayton Hall 6 0 3 0 454 0.66% 362 0.00%Montessori Community 0 0 0 0 57 0.00% 67 0.00%Oakland 3 0 3 0 255 1.18% 221 0.00%Orange Grove Charter 0 0 0 0 334 0.00% 349 0.00%PACE Charter 0 0 0 0 6 0.00% 8 0.00%Springfield 60 37 35 25 282 12.41% 307 8.14%St. Andrew's School of Math & Science 35 4 21 4 373 5.63% 348 1.15%Stono Park 6 0 5 0 122 4.10% 128 0.00%District 20Buist Academy 1 0 1 0 113 0.88% 144 0.00%Charleston Development Academy Charter 0 0 0 0 70 0 00% 68 0 00%Charleston Development Academy Charter 0 0 0 0 70 0.00% 68 0.00%Charleston Progressive 11 4 10 2 140 7.14% 158 1.27%James Simons 1 0 1 0 73 1.37% 64 0.00%Memminger 86 22 38 12 120 31.67% 130 9.23%Mitchell 20 8 11 6 147 7.48% 165 3.64%Sanders-Clyde 117 43 63 31 195 32.31% 198 15.66%District 23Blaney 24 10 14 5 69 20.29% 70 7.14%Ellington 38 21 28 8 134 20.90% 110 7.27%Jane Edwards 0 0 0 0 44 0.00% 54 0.00%Minnie Hughes 0 0 0 0 75 0.00% 69 0.00%
Program Sites2
Liberty Hill Academy 15 0 6 0 N/A N/A N/A N/ATOTAL ELEMENTARY 1,166 395 593 232 10,813 5.48% 10,201 2.27%
2 Suspension rates are not determined for program sites because of fluctuating enrollment and because these students are included in their home school data.
1 Grade levels in parentheses indicate elementary grade configurations other than K-5. In addition, multi-level schools and K-6 schools appear on more than one table in this report.
12
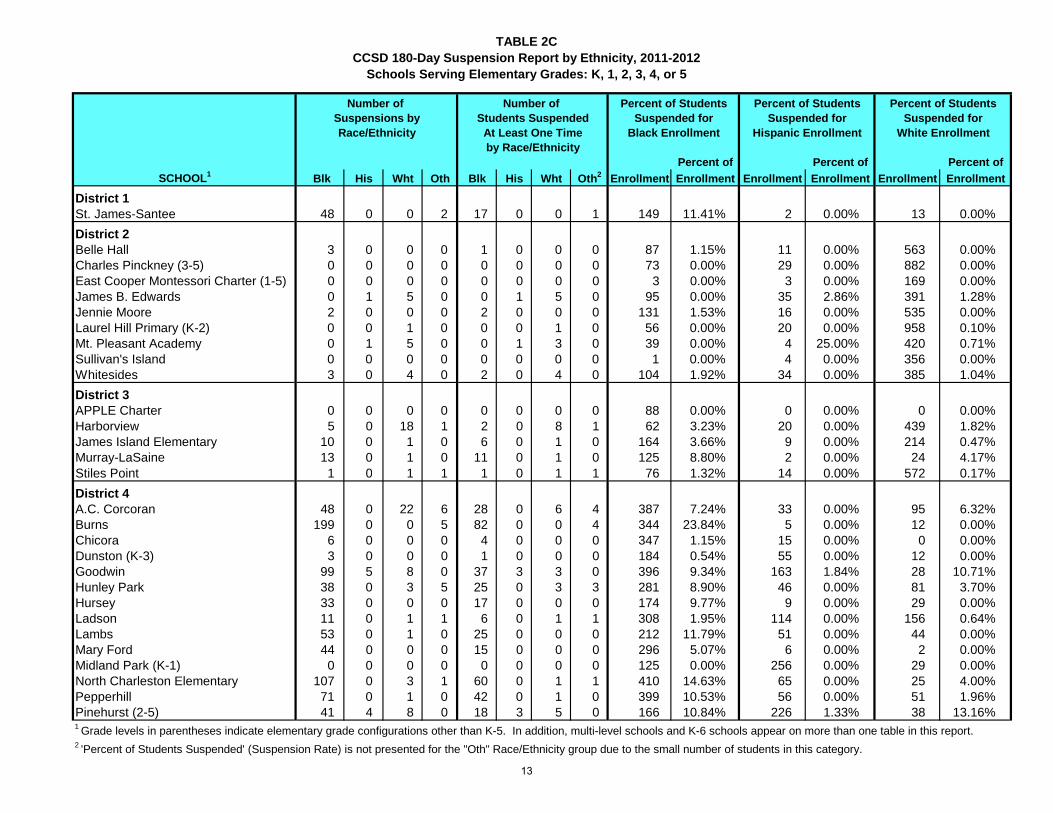
TABLE 2CCCSD 180-Day Suspension Report by Ethnicity, 2011-2012
Schools Serving Elementary Grades: K, 1, 2, 3, 4, or 5
SCHOOL1
District 1St. James-Santee 48 0 0 2 17 0 0 1 149 11.41% 2 0.00% 13 0.00%District 2Belle Hall 3 0 0 0 1 0 0 0 87 1.15% 11 0.00% 563 0.00%Charles Pinckney (3-5) 0 0 0 0 0 0 0 0 73 0.00% 29 0.00% 882 0.00%East Cooper Montessori Charter (1-5) 0 0 0 0 0 0 0 0 3 0.00% 3 0.00% 169 0.00%James B. Edwards 0 1 5 0 0 1 5 0 95 0.00% 35 2.86% 391 1.28%Jennie Moore 2 0 0 0 2 0 0 0 131 1.53% 16 0.00% 535 0.00%Laurel Hill Primary (K-2) 0 0 1 0 0 0 1 0 56 0.00% 20 0.00% 958 0.10%Mt. Pleasant Academy 0 1 5 0 0 1 3 0 39 0.00% 4 25.00% 420 0.71%Sullivan's Island 0 0 0 0 0 0 0 0 1 0.00% 4 0.00% 356 0.00%Whitesides 3 0 4 0 2 0 4 0 104 1.92% 34 0.00% 385 1.04%District 3APPLE Charter 0 0 0 0 0 0 0 0 88 0.00% 0 0.00% 0 0.00%Harborview 5 0 18 1 2 0 8 1 62 3.23% 20 0.00% 439 1.82%James Island Elementary 10 0 1 0 6 0 1 0 164 3.66% 9 0.00% 214 0.47%Murray-LaSaine 13 0 1 0 11 0 1 0 125 8.80% 2 0.00% 24 4.17%Stiles Point 1 0 1 1 1 0 1 1 76 1 32% 14 0 00% 572 0 17%
Percent of by Race/Ethnicity
Suspensions by Students Suspended Suspended forSuspended for Suspended for
EnrollmentEnrollment EnrollmentWhtHis Enrollment Blk OthWht Blk Oth2His Enrollment Enrollment Percent of Percent of
Race/Ethnicity At Least One Time White EnrollmentBlack Enrollment Hispanic Enrollment
Number of Number of Percent of StudentsPercent of Students Percent of Students
Stiles Point 1 0 1 1 1 0 1 1 76 1.32% 14 0.00% 572 0.17%District 4A.C. Corcoran 48 0 22 6 28 0 6 4 387 7.24% 33 0.00% 95 6.32%Burns 199 0 0 5 82 0 0 4 344 23.84% 5 0.00% 12 0.00%Chicora 6 0 0 0 4 0 0 0 347 1.15% 15 0.00% 0 0.00%Dunston (K-3) 3 0 0 0 1 0 0 0 184 0.54% 55 0.00% 12 0.00%Goodwin 99 5 8 0 37 3 3 0 396 9.34% 163 1.84% 28 10.71%Hunley Park 38 0 3 5 25 0 3 3 281 8.90% 46 0.00% 81 3.70%Hursey 33 0 0 0 17 0 0 0 174 9.77% 9 0.00% 29 0.00%Ladson 11 0 1 1 6 0 1 1 308 1.95% 114 0.00% 156 0.64%Lambs 53 0 1 0 25 0 0 0 212 11.79% 51 0.00% 44 0.00%Mary Ford 44 0 0 0 15 0 0 0 296 5.07% 6 0.00% 2 0.00%Midland Park (K-1) 0 0 0 0 0 0 0 0 125 0.00% 256 0.00% 29 0.00%North Charleston Elementary 107 0 3 1 60 0 1 1 410 14.63% 65 0.00% 25 4.00%Pepperhill 71 0 1 0 42 0 1 0 399 10.53% 56 0.00% 51 1.96%Pinehurst (2-5) 41 4 8 0 18 3 5 0 166 10.84% 226 1.33% 38 13.16%1 Grade levels in parentheses indicate elementary grade configurations other than K-5. In addition, multi-level schools and K-6 schools appear on more than one table in this report.2 'Percent of Students Suspended' (Suspension Rate) is not presented for the "Oth" Race/Ethnicity group due to the small number of students in this category.
13

TABLE 2CCCSD 180-Day Suspension Report by Ethnicity, 2011-2012
Schools Serving Elementary Grades: K, 1, 2, 3, 4, or 5
SCHOOL1 Percent of
by Race/Ethnicity
Suspensions by Students Suspended Suspended forSuspended for Suspended for
EnrollmentEnrollment EnrollmentWhtHis Enrollment Blk OthWht Blk Oth2His Enrollment Enrollment Percent of Percent of
Race/Ethnicity At Least One Time White EnrollmentBlack Enrollment Hispanic Enrollment
Number of Number of Percent of StudentsPercent of Students Percent of Students
District 9Angel Oak 5 1 1 0 3 1 1 0 125 2.40% 121 0.83% 91 1.10%Frierson 5 0 2 0 2 0 1 0 103 1.94% 9 0.00% 1 100.00%Haut Gap (5) 0 1 0 0 0 1 0 0 11 0.00% 1 100.00% 26 0.00%Mt. Zion 17 1 0 0 11 1 0 0 90 12.22% 73 1.37% 28 0.00%District 10Ashley River 0 0 2 0 0 0 2 0 78 0.00% 13 0.00% 458 0.44%Drayton Hall 2 0 4 0 2 0 1 0 195 1.03% 31 0.00% 537 0.19%Montessori Community 0 0 0 0 0 0 0 0 5 0.00% 5 0.00% 105 0.00%Oakland 3 0 0 0 3 0 0 0 318 0.94% 19 0.00% 111 0.00%Orange Grove Charter 0 0 0 0 0 0 0 0 251 0.00% 24 0.00% 382 0.00%PACE Charter 0 0 0 0 0 0 0 0 5 0.00% 0 0.00% 9 0.00%Springfield 72 0 24 1 43 0 16 1 269 15.99% 26 0.00% 255 6.27%St. Andrew's School of Math & Science 24 0 13 2 16 0 7 2 281 5.69% 23 0.00% 366 1.91%Stono Park 6 0 0 0 5 0 0 0 206 2.43% 5 0.00% 36 0.00%District 20Buist Academy 0 0 1 0 0 0 1 0 28 0.00% 3 0.00% 211 0.47%Charleston Dev Academy Charter 0 0 0 0 0 0 0 0 134 0 00% 1 0 00% 2 0 00%Charleston Dev. Academy Charter 0 0 0 0 0 0 0 0 134 0.00% 1 0.00% 2 0.00%Charleston Progressive 15 0 0 0 12 0 0 0 265 4.53% 4 0.00% 23 0.00%James Simons 0 0 0 1 0 0 0 1 133 0.00% 0 0.00% 1 0.00%Memminger 108 0 0 0 50 0 0 0 242 20.66% 4 0.00% 0 0.00%Mitchell 27 0 0 1 16 0 0 1 291 5.50% 1 0.00% 13 0.00%Sanders-Clyde 156 0 0 4 93 0 0 1 385 24.16% 1 0.00% 2 0.00%District 23Blaney 34 0 0 0 19 0 0 0 133 14.29% 4 0.00% 2 0.00%Ellington 48 1 9 1 27 1 7 1 152 17.76% 36 2.78% 50 14.00%Jane Edwards 0 0 0 0 0 0 0 0 51 0.00% 14 0.00% 30 0.00%Minnie Hughes 0 0 0 0 0 0 0 0 121 0.00% 11 0.00% 11 0.00%
Program Sites3
Liberty Hill Academy 15 0 0 0 6 0 0 0 N/A N/A N/A N/A N/A N/ATOTAL ELEMENTARY 1,375 15 139 32 710 12 80 23 9,154 7.76% 1,732 0.69% 9,273 0.86%1 Grade levels in parentheses indicate elementary grade configurations other than K-5. In addition, multi-level schools and K-6 schools appear on more than one table in this report.2 'Percent of Students Suspended' (Suspension Rate) is not presented for the "Oth" Race/Ethnicity group due to the small number of students in this category.3 Suspension rates are not determined for program sites because of fluctuating enrollment and because these students are included in their home school data.
14

TABLE 2DCCSD 180-Day Suspension Report, from 2009-2010 to 2011-2012
Schools Serving Elementary Grades: K, 1, 2, 3, 4, or 5
SCHOOL1
District 1St. James-Santee 25 7 50 11.37 4.65 11.70District 2Belle Hall 16 7 3 1.14 0.93 0.28Charles Pinckney (3-5) 9 2 0 0.61 0.19 0.00East Cooper Montessori Charter (1-5) 1 1 0 0.66 0.68 0.00James B. Edwards 10 5 6 1.42 0.95 1.15Jennie Moore 8 7 2 0.88 1.02 0.28Laurel Hill Primary (K-2) 2 2 1 0.19 0.18 0.09Mt. Pleasant Academy 6 2 6 0.89 0.41 0.83Sullivan's Island 8 7 0 2.22 2.12 0.00Whitesides 10 4 7 1.23 0.68 1.03District 3APPLE Charter N/A 1 0 N/A 1.03 0.00Harborview 0 14 24 0.00 2.56 2.03James Island Elementary 11 14 11 1.88 3.13 1.72Murray-LaSaine 23 4 14 7.17 2.62 7.65Stiles Point 15 4 3 0.89 0.60 0.44District 4
2011-122010-11
Number of SuspensionsPercent of Students
Suspended At Least One Time2010-112009-10 2011-122009-10
A.C. Corcoran 66 31 76 7.69 5.18 6.39Burns 135 76 204 19.37 21.60 23.50Chicora 10 5 6 1.67 1.39 1.10Dunston (K-3) 0 8 3 0.00 2.77 0.37Goodwin 101 52 112 10.35 8.69 7.40Hunley Park 47 22 46 7.41 4.63 6.56Hursey 27 17 33 8.11 7.00 7.73Ladson 33 20 13 4.73 3.31 1.24Lambs 15 16 54 2.26 4.44 7.79Mary Ford 120 6 44 20.45 1.94 4.73Midland Park (K-1) 31 2 0 3.11 0.72 0.00North Charleston Elementary 109 81 111 11.62 16.38 12.40Pepperhill 115 51 72 12.25 9.56 8.18Pinehurst (2-5) N/A 26 53 N/A 6.28 4.731 Grade levels in parentheses indicate elementary grade configurations other than K-5 during 2009-10. In addition, multi-level schools and K-6 schools appear on more than one table in this report.
15

TABLE 2DCCSD 180-Day Suspension Report, from 2009-2010 to 2011-2012
Schools Serving Elementary Grades: K, 1, 2, 3, 4, or 5
SCHOOL1 2011-122010-11
Number of SuspensionsPercent of Students
Suspended At Least One Time2010-112009-10 2011-122009-10
District 9Angel Oak 26 11 7 3.74 3.22 1.42Frierson 7 4 7 7.9 3.73 2.65Haut Gap (5) N/A 2 1 N/A 5.42 2.67Mt. Zion 42 13 18 12.22 6.37 5.39District 10Ashley River 1 1 2 0.18 0.17 0.34Drayton Hall 88 34 6 5.83 4.43 0.37Montessori Community 0 0 0 0.00 0.00 0.00Oakland 58 32 3 7.97 6.90 0.62Orange Grove Charter 48 0 0 5.10 0.00 0.00PACE Charter N/A 22 0 N/A 3.09 0.00Springfield 29 48 97 3.43 8.28 10.27St. Andrew's School of Math & Science 33 28 39 3.49 3.94 3.41Stono Park 12 10 6 3.10 3.70 1.95District 20Buist Academy 5 0 1 1.94 0.00 0.39Charleston Development Academy Charter 0 0 0 0.00 0.00 0.00Charleston Progressive 32 14 15 10.37 8.37 4.08J Si 24 6 1 8 20 3 94 0 72James Simons 24 6 1 8.20 3.94 0.72Memminger 117 31 108 20.62 14.03 19.71Mitchell 56 0 28 10.09 0.00 5.57Sanders-Clyde 91 92 160 19.66 24.27 24.35District 23Blaney 44 1 34 18.47 0.75 13.28Ellington 74 16 59 19.79 6.91 14.81Jane Edwards 8 1 0 8.31 1.15 0.00Minnie Hughes 0 0 0 0.00 0.00 0.00Program Sites2
Liberty Hill Academy 3 5 15 N/A N/A N/A
TOTAL ELEMENTARY 1,792 865 1,561 5.24% 4.18% 3.89%
2 Suspension rates are not determined for program sites because of fluctuating enrollment and because these students are included in their home school data.
1 Grade levels in parentheses indicate elementary grade configurations other than K-5. In addition, multi-level schools and K-6 schools appear on more than one table in this report.
16

TABLE 3ACCSD 180-Day Suspension Report, 2011-2012
Schools Serving Middle Grades: 6, 7, or 8
SCHOOL1
District 1Lincoln (7-8) 8 17.50% 11 1.38 40 3.64St. James-Santee (6) 3 8.89% 7 2.33 9 1.29District 2Cario 55 4.10% 107 1.95 233 2.18East Cooper Montessori Charter 0 0.00% 0 0.00 0 0.00Laing 81 13.42% 161 1.99 258 1.60Moultrie 88 9.77% 193 2.19 473 2.45District 3APPLE Charter (6-7) 0 0.00% 0 0.00 0 0.00Ft. Johnson 67 12.47% 175 2.61 292 1.67James Island Middle 87 24.36% 163 1.87 285 1.75District 4ARMS Academy at Morningside 125 42.21% 601 4.81 814 1.35EXCEL Academy at Morningside 118 42.89% 356 3.02 610 1.71Jerry Zucker 149 28.59% 365 2.45 684 1.87Military Magnet 49 22.94% 75 1.53 274 3.65Northwoods 235 29.81% 631 2.69 901 1.43School of the Arts 1 0.21% 1 1.00 3 3.00
Students Suspended Suspended
Total Number of Percent of Students Total Average Number of Total Number Average Number
Number of Suspensions Reported of Days Absent of Days Absent
at Least One Time at Least One Time Suspensions per Student Suspended due to Suspensions per Suspension
District 9Haut Gap 58 14.30% 139 2.40 228 1.64District 10C.E. Williams 64 9.87% 101 1.58 188 1.86Montessori Community (6-7) 0 0.00% 0 0.00 0 0.00PACE Charter 0 0.00% 0 0.00 0 0.00St. Andrew's School of Math & Science 71 15.79% 157 2.21 294 1.87West Ashley Middle 94 30.63% 228 2.43 375 1.64District 20Buist Academy 2 1.48% 3 0.00 3 0.00Burke (7-8) 47 28.28% 86 1.83 216 2.51Chas. Development Academy Charter 0 0.00% 0 0.00 0 0.00Charleston Math & Science Charter 24 10.92% 34 1.42 68 2.001 Grade levels in parentheses indicate middle grade configurations other than 6-8. In addition, multi-level schools and K-6 schools appear on more than one table in this report.
17

TABLE 3ACCSD 180-Day Suspension Report, 2011-2012
Schools Serving Middle Grades: 6, 7, or 8
SCHOOL1Students Suspended Suspended
Total Number of Percent of Students Total Average Number of Total Number Average Number
Number of Suspensions Reported of Days Absent of Days Absent
at Least One Time at Least One Time Suspensions per Student Suspended due to Suspensions per SuspensionDistrict 20, cont.Charleston Progressive (6) 7 31.49% 9 1.29 11 1.22James Simons (6) 2 9.93% 2 1.00 6 3.00Memminger (6) 17 60.98% 44 2.59 62 1.41Mitchell (6) 10 21.51% 22 2.20 46 2.09Sanders-Clyde 41 38.72% 79 1.93 169 2.14District 23Baptist Hill (7-8) 46 39.25% 92 2.00 224 2.43Blaney (6) 4 23.35% 6 1.50 11 1.83Ellington (6) 7 21.13% 18 2.57 32 1.78Jane Edwards (6) 0 0.00% 0 0.00 0 0.00Minnie Hughes (6) 1 5.07% 1 1.00 2 2.00
Program Sites2
Daniel J. Jenkins 97 N/A 441 4.55 703 1.59Liberty Hill Academy 18 N/A 45 2.50 61 1.36Sixth Grade Academy 10 N/A 16 1.60 31 1.94TOTAL MIDDLE 1,686 18.08% 4,369 2.59 7,606 1.74 1 Grade levels in parentheses indicate middle grade configurations other than 6-8. In addition, multi-level schools and K-6 schools appear on more than one table in this report. 2 S i t t d t i d f it b f fl t ti ll t d b th t d t i l d d i th i h h l d t2 Suspension rates are not determined for program sites because of fluctuating enrollment and because these students are included in their home school data.
18

TABLE 3BCCSD 180-Day Suspension Report, 2011-2012, by Gender
Schools Serving Middle Grades: 6, 7, or 8
SCHOOL1
District 1Lincoln (7-8) 8 3 6 2 28 21.43% 14 14.29%St. James-Santee (6) 1 6 1 2 16 6.25% 18 11.11%District 2Cario 78 29 40 15 706 5.67% 629 2.38%East Cooper Montessori Charter 0 0 0 0 25 0.00% 25 0.00%Laing 124 37 64 17 312 20.51% 286 5.94%Moultrie 115 78 56 32 459 12.20% 432 7.41%District 3APPLE Charter (6-7) 0 0 0 0 14 0.00% 22 0.00%Ft. Johnson 121 54 42 25 262 16.03% 271 9.23%James Island Middle 116 47 55 32 168 32.74% 179 17.88%District 4ARMS Academy at Morningside 601 0 125 0 284 44.01% 0 N/AEXCEL Academy at Morningside 0 356 0 118 5 0.00% 266 44.36%
Percent of
Suspensions Students Suspended Students Suspended Students Suspendedby Gender At Least One Male Enrollment
Number of Number of Percent of Percent of
Time, by Gender Female Enrollment
Enrollment Enrollment Enrollment EnrollmentM F M
Percent of
F
Jerry Zucker 239 126 100 49 280 35.71% 247 19.84%Military Magnet 56 19 36 13 127 28.35% 84 15.48%Northwoods 389 242 150 85 422 35.55% 343 24.78%School of the Arts 0 1 0 1 168 0.00% 312 0.32%District 9Haut Gap 107 32 43 15 214 20.09% 198 7.58%District 10C.E. Williams 69 32 38 26 317 11.99% 324 8.02%Montessori Community (6-7) 0 0 0 0 20 0.00% 13 0.00%PACE Charter 0 0 0 0 6 0.00% 5 0.00%St. Andrew's School of Math & Science 99 58 42 29 227 18.50% 213 13.62%West Ashley Middle 162 66 60 34 162 37.04% 141 24.11%1 Grade levels in parentheses indicate middle grade configurations other than 6-8. In addition, multi-level schools and K-6 schools appear on more than one table in this report.
19

TABLE 3BCCSD 180-Day Suspension Report, 2011-2012, by Gender
Schools Serving Middle Grades: 6, 7, or 8
SCHOOL1
Percent of
Suspensions Students Suspended Students Suspended Students Suspendedby Gender At Least One Male Enrollment
Number of Number of Percent of Percent of
Time, by Gender Female Enrollment
Enrollment Enrollment Enrollment EnrollmentM F M
Percent of
FDistrict 20Buist Academy 3 0 2 0 60 3.33% 70 0.00%Burke (7-8) 58 28 33 14 90 36.67% 77 18.18%Chas. Development Academy Charter 0 0 0 0 18 0.00% 24 0.00%Charleston Math & Science Charter 25 9 17 7 109 15.60% 105 6.67%Charleston Progressive (6) 4 5 3 4 4 75.00% 18 22.22%James Simons (6) 2 0 2 0 7 28.57% 13 0.00%Memminger (6) 35 9 12 5 16 75.00% 9 55.56%Mitchell (6) 13 9 7 3 23 30.43% 23 13.04%Sanders-Clyde 30 49 19 22 51 37.25% 54 40.74%District 23Baptist Hill (7-8) 45 47 22 24 50 44.00% 67 35.82%Blaney (6) 2 4 2 2 7 28.57% 8 25.00%Ellington (6) 15 3 6 1 17 35.29% 15 6.67%Jane Edwards (6) 0 0 0 0 9 0.00% 5 0.00%Minnie Hughes (6) 1 0 1 0 11 9.09% 9 0.00%
2Program Sites2
Daniel J. Jenkins 285 156 57 40 N/A N/A N/A N/ALiberty Hill Academy 37 8 16 2 N/A N/A N/A N/ASixth Grade Academy 16 0 10 0 N/A N/A N/A N/ATOTAL MIDDLE 2,856 1,513 1,067 619 4,694 22.73% 4,519 13.70%1 Grade levels in parentheses indicate middle grade configurations other than 6-8. In addition, multi-level schools and K-6 schools appear on more than one table in this report.2 Suspension rates are not determined for program sites because of fluctuating enrollment and because these students are included in their home school data.
20

TABLE 3CCCSD 180-Day Suspension Report, 2011-2012, by Race/Ethnicity
Schools Serving Middle Grades: 6, 7, or 8
SCHOOL1
District 1Lincoln (7-8) 7 0 2 2 6 0 1 1 39 15.38% 0 0.00% 2 50.00%St. James-Santee (6) 5 0 2 0 2 0 1 0 30 6.67% 0 0.00% 1 0.00%District 2Cario 43 1 59 4 21 1 32 1 176 11.93% 36 2.78% 1,073 2.98%East Cooper Montessori Charter 0 0 0 0 0 0 0 0 0 0.00% 0 0.00% 47 0.00%Laing 92 0 67 2 42 0 37 2 155 27.10% 12 0.00% 416 8.89%Moultrie 94 6 86 7 37 4 45 2 120 30.83% 23 17.39% 726 6.20%District 3APPLE Charter (6-7) 0 0 0 0 0 0 0 0 36 0.00% 0 0.00% 0 0.00%Ft. Johnson 84 0 80 11 34 0 27 6 114 29.82% 15 0.00% 384 7.03%James Island Middle 95 0 65 3 46 0 39 2 156 29.49% 6 0.00% 171 22.81%District 4ARMS Academy at Morningside 574 10 17 0 117 3 5 0 237 49.37% 32 9.38% 14 35.71%EXCEL Academy at Morningside 327 20 8 1 102 10 5 1 221 46.15% 27 37.04% 19 26.32%Jerry Zucker 332 15 18 0 136 6 7 0 410 33.17% 50 12.00% 51 13.73%
by Race/Ethnicity
Percent of Students
Enrollment Percent of
Enrollment
Black Enrollment White EnrollmentHispanic Enrollment
Wht Blk Oth2 EnrollmentOth His Wht
At Least One Time
Percent ofEnrollment Enrollment
Percent ofHis
Number of Suspensions byRace/Ethnicity
Blk
Suspended for
Enrollment
Suspended forStudents Suspended Suspended forPercent of StudentsNumber of Percent of Students
Military Magnet 74 0 1 0 48 0 1 0 189 25.40% 13 0.00% 7 14.29%Northwoods 566 28 15 22 201 15 11 8 545 36.88% 118 12.71% 81 13.58%School of the Arts 0 0 1 0 0 0 1 0 45 0.00% 12 0.00% 396 0.25%District 9Haut Gap 90 14 33 2 40 5 12 1 203 19.70% 64 7.81% 136 8.82%District 10C.E. Williams 71 0 28 2 40 0 22 2 244 16.39% 30 0.00% 335 6.57%Montessori Community (6-7) 0 0 0 0 0 0 0 0 7 0.00% 0 0.00% 24 0.00%PACE Charter 0 0 0 0 0 0 0 0 5 0.00% 0 0.00% 6 0.00%St. Andrew's Middle 114 0 33 10 50 0 17 4 265 18.87% 11 0.00% 138 12.32%West Ashley Middle 203 1 20 4 82 1 8 3 239 34.31% 11 9.09% 45 17.78%
2 'Percent of Students Suspended' (Suspension Rate) is not presented for the "Oth" Race/Ethnicity group due to the small number of students in this category.
1 Grade levels in parentheses indicate middle grade configurations other than 6-8. In addition, multi-level schools and K-6 schools appear on more than one table in this report.
21

TABLE 3CCCSD 180-Day Suspension Report, 2011-2012, by Race/Ethnicity
Schools Serving Middle Grades: 6, 7, or 8
SCHOOL1
by Race/Ethnicity
Percent of Students
Enrollment Percent of
Enrollment
Black Enrollment White EnrollmentHispanic Enrollment
Wht Blk Oth2 EnrollmentOth His Wht
At Least One Time
Percent ofEnrollment Enrollment
Percent ofHis
Number of Suspensions byRace/Ethnicity
Blk
Suspended for
Enrollment
Suspended forStudents Suspended Suspended forPercent of StudentsNumber of Percent of Students
District 20Buist Academy 1 0 2 0 1 0 1 0 26 3.85% 1 0.00% 97 1.03%Burke (7-8) 86 0 0 0 47 0 0 0 163 28.83% 1 0.00% 1 0.00%Chas. Dev. Academy Charter 0 0 0 0 0 0 0 0 40 0.00% 1 0.00% 0 0.00%Chas. Math & Science Charter 28 0 6 0 20 0 4 0 90 22.22% 4 0.00% 119 3.36%Charleston Progressive (6) 9 0 0 0 7 0 0 0 22 31.82% 0 0.00% 0 0.00%James Simons (6) 2 0 0 0 2 0 0 0 20 10.00% 0 0.00% 0 0.00%Memminger (6) 44 0 0 0 17 0 0 0 22 77.27% 0 0.00% 0 0.00%Mitchell (6) 22 0 0 0 10 0 0 0 45 22.22% 0 0.00% 0 0.00%Sanders-Clyde 79 0 0 0 41 0 0 0 104 39.42% 1 0.00% 0 0.00%
District 23Baptist Hill (7-8) 79 5 4 4 43 1 1 1 104 41.35% 9 11.11% 2 50.00%Blaney (6) 6 0 0 0 4 0 0 0 14 28.57% 0 0.00% 1 0.00%Ellington (6) 15 0 3 0 6 0 1 0 24 25.00% 3 0.00% 4 25.00%Jane Edwards (6) 0 0 0 0 0 0 0 0 11 0.00% 0 0.00% 2 0.00%Minnie Hughes (6) 1 0 0 0 1 0 0 0 17 5.88% 1 0.00% 2 0.00%
Program Sites3
Daniel J. Jenkins 415 11 13 2 92 2 2 1 N/A N/A N/A N/A N/A N/ALiberty Hill Academy 33 0 12 0 14 0 4 0 N/A N/A N/A N/A N/A N/ASixth Grade Academy 15 0 0 1 9 0 0 1 N/A N/A N/A N/A N/A N/ATOTAL MIDDLE 3,606 111 575 77 1,318 48 284 36 4,138 31.85% 481 9.98% 4,300 6.60%
2 'Percent of Students Suspended' (Suspension Rate) is not presented for the "Oth" Race/Ethnicity group due to the small number of students in this category.3 Suspension rates are not determined for program sites because of fluctuating enrollment and because these students are included in their home school data.
1 Grade levels in parentheses indicate middle grade configurations other than 6-8. In addition, multi-level schools and K-6 schools appear on more than one table in this report.
22

TABLE 3DCCSD 180-Day Suspension Report, from 2009-2010 to 2011-2012
Schools Serving Middle Grades: 6, 7, or 8
SCHOOL1
District 1Lincoln (7-8) 50 17 11 44.69 30.97 17.50St. James-Santee (6) 16 5 7 47.78 27.01 0.00District 2Cario 130 89 107 6.91 6.95 4.18East Cooper Montessori Charter 0 0 0 0.00 0.00 0.00Laing 89 69 161 12.12 13.77 13.58Moultrie 115 54 193 10.45 5.73 9.88District 3APPLE Charter (6-7) N/A 1 0 N/A 5.76 0.00Ft. Johnson 157 71 175 15.59 13.18 12.65James Island Middle 222 73 163 25.94 18.70 24.92District 4ARMS Academy at Morningside2 459 140 601 51.38 47.80 47.61EXCEL Academy at Morningside2 219 86 356 39.81 35.82 45.07Jerry Zucker 221 89 365 25.37 19.25 30.32Military Magnet 108 32 75 29.92 13.99 22.94Northwoods3 878 271 631 38.73 38.02 29.43School of the Arts 12 19 1 2.47 3.95 0.21District 9
2011-122010-11Number of Suspensions Percent of Students Suspended
2010-11 2011-122009-102009-10
Haut Gap 100 66 139 21.51 20.12 14.79District 10C.E. Williams 197 76 101 16.90 11.88 9.87Montessori Community (6-7) 0 1 0 0.00 4.79 0.00PACE Charter N/A 0 0 N/A 0.00 0.00St. Andrew's Middle 312 172 157 27.14 22.39 16.01West Ashley Middle 285 229 228 36.64 26.40 30.95
2 In 2009-10, Morningside was split into two single-gender academies, ARMS Academy (male) and EXCEL Academy (female).
1 Grade levels in parentheses indicate middle grade configurations other than 6-8 during 2011-12. In addition, multi-level schools and K-6 schools appear on more than one table in this report.
23

TABLE 3DCCSD 180-Day Suspension Report, from 2009-2010 to 2011-2012
Schools Serving Middle Grades: 6, 7, or 8
SCHOOL1 2011-122010-11Number of Suspensions Percent of Students Suspended
2010-11 2011-122009-102009-10
District 20Buist Academy 4 0 3 2.15 0.00 1.48Burke (7-8) 138 71 86 45.05 51.02 29.48Chas. Development Academy Charter4 0 0 0 0.00 0.00 0.00Charleston Math & Science Charter 128 30 34 39.45 14.95 10.92Charleston Progressive (6)5 19 4 9 47.55 19.69 31.49James Simons (6) 4 4 2 13.20 14.04 9.93Memminger (6) 15 5 44 37.85 19.46 60.98Mitchell (6) 19 3 22 24.55 7.64 23.66Sanders-Clyde 67 47 79 43.30 44.17 40.61District 23Baptist Hill (7-8) 196 59 92 51.93 47.55 39.25Blaney (6) 14 3 6 31.40 12.48 23.35Ellington (6) 24 3 18 45.77 11.30 21.14Jane Edwards (6)5 0 0 0 0.00 0.00 0.00Minnie Hughes (6) 5 1 1 8.82 5.67 5.07
Program Sites6
Daniel J. Jenkins 697 89 441 N/A N/A N/ALiberty Hill Academy 64 16 45 N/A N/A N/ASixth Grade Academy 96 153 16 N/A N/A N/ATOTAL MIDDLE 5,060 2,059 4,369 24.49% 22.83% 18.08%
2 In 2009-10, Morningside was split into two single-gender academies, ARMS Academy (male) and EXCEL Academy (female).3 School name was Alice Birney prior to 2009-10.4 Charleston Development Academy served grade 6 in 2008-09, grades 6-7 in 2009-10, and grades 6-8 in 2010-11.5 School served grades 6-8 prior to 2009-10.6 Suspension rates are not determined for program sites because of fluctuating enrollment and because these students are included in their home school data.
1 Grade levels in parentheses indicate middle grade configurations other than 6-8 during 2011-12. In addition, multi-level schools and K-6 schools appear on more than one table in this report.
24

TABLE 4ACCSD 180-Day Suspension Report, 2011-2012
Schools Serving High School Grades: 9, 10, 11, or 12
Average Number of Average NumberSuspensions Reported of Days Absent
SCHOOL1 per Student Suspended per Suspension
District 1Lincoln 21 23.68% 34 1.62 112 3.29District 2Wando 265 7.69% 600 2.26 1,314 2.19District 3James Island Charter High 127 9.57% 220 1.73 361 1.64
District 4Academic Magnet 11 1.78% 11 1.00 81 7.36Garrett Academy 181 25.14% 432 2.39 719 1.66Greg Mathis Charter2 61 75.05% 202 3.31 398 1.97Military Magnet 24 9.95% 32 1.33 105 3.28North Charleston High 165 35.01% 396 2.40 1,009 2.55School of the Arts 15 2.61% 17 1.13 33 1.94Stall 369 38.83% 855 2.32 1,932 2.26District 9St. John's 87 34.05% 231 2.66 393 1.70District 10PACE Charter 0 0.00% 0 0.00 0 0.00W A hl Hi h 3 0 19 18% 81 2 23 1 68 2 16
Total Number of Percent of Students Total Total NumberNumber of of Days Absent
at Least One Time at Least One Time Suspensions due to SuspensionsStudents Suspended Suspended
West Ashley High 350 19.18% 781 2.23 1,687 2.16District 20Burke 81 20.83% 143 1.77 319 2.23Chas. Math & Science Charter 25 12.46% 30 1.20 54 1.80District 23Baptist Hill 92 33.64% 190 2.07 482 2.54
Program Sites3
Clark Academy 61 N/A 148 2.43 183 1.24Liberty Hill Academy 24 N/A 59 2.46 77 1.31Summit Academy 3 N/A 4 1.33 9 2.25TOTAL HIGH 1,962 17.11% 4,385 2.23 9,268 2.111 Multi-level schools appear on more than one table in this report.
3 Suspension rates are not determined for program sites because of fluctuating enrollment and because these students are included in their home school data.
2 Suspension rates may exceed 100% due to fluctuation in student population during the school year.
25
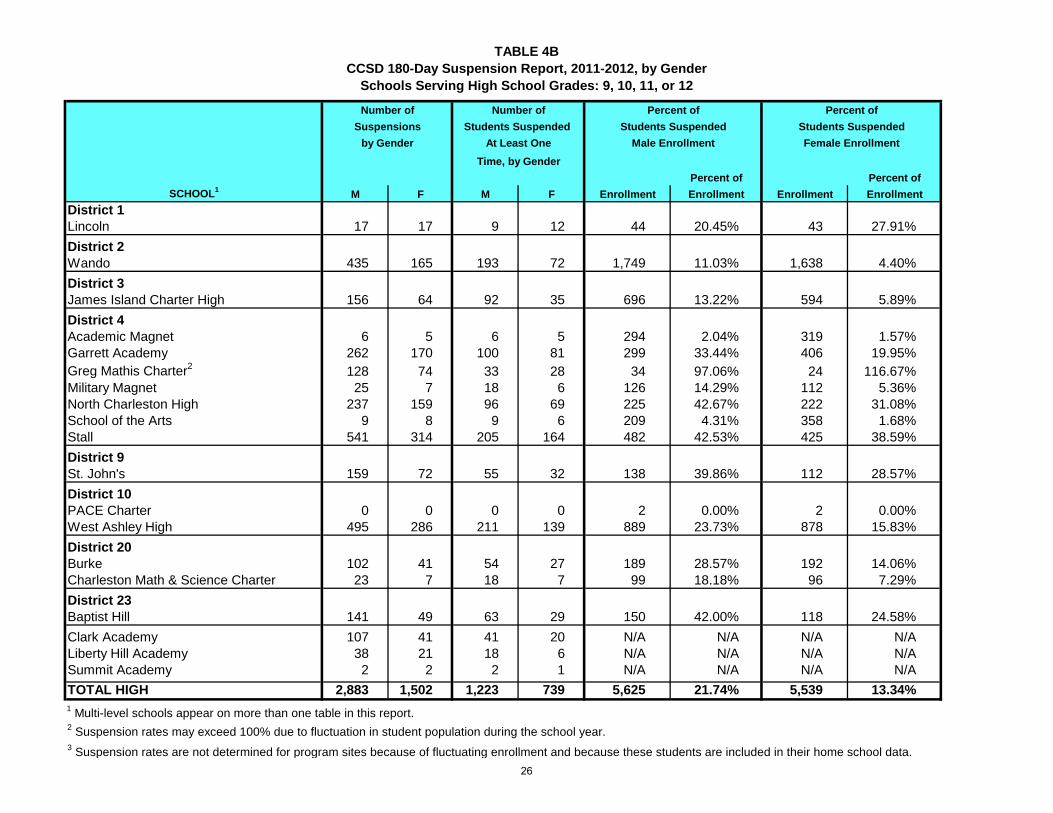
TABLE 4BCCSD 180-Day Suspension Report, 2011-2012, by Gender
Schools Serving High School Grades: 9, 10, 11, or 12
SCHOOL1
District 1Lincoln 17 17 9 12 44 20.45% 43 27.91%District 2Wando 435 165 193 72 1,749 11.03% 1,638 4.40%District 3James Island Charter High 156 64 92 35 696 13.22% 594 5.89%District 4Academic Magnet 6 5 6 5 294 2.04% 319 1.57%Garrett Academy 262 170 100 81 299 33.44% 406 19.95%Greg Mathis Charter2 128 74 33 28 34 97.06% 24 116.67%Military Magnet 25 7 18 6 126 14.29% 112 5.36%North Charleston High 237 159 96 69 225 42.67% 222 31.08%School of the Arts 9 8 9 6 209 4.31% 358 1.68%Stall 541 314 205 164 482 42.53% 425 38.59%District 9St. John's 159 72 55 32 138 39.86% 112 28.57%
Percent ofM F M F Enrollment Enrollment Enrollment Enrollment
Percent of Time, by Gender
Number of Number of Percent of Percent of
by Gender At Least One Male Enrollment Female EnrollmentSuspensions Students Suspended Students Suspended Students Suspended
District 10PACE Charter 0 0 0 0 2 0.00% 2 0.00%West Ashley High 495 286 211 139 889 23.73% 878 15.83%District 20Burke 102 41 54 27 189 28.57% 192 14.06%Charleston Math & Science Charter 23 7 18 7 99 18.18% 96 7.29%District 23Baptist Hill 141 49 63 29 150 42.00% 118 24.58%Clark Academy 107 41 41 20 N/A N/A N/A N/ALiberty Hill Academy 38 21 18 6 N/A N/A N/A N/ASummit Academy 2 2 2 1 N/A N/A N/A N/ATOTAL HIGH 2,883 1,502 1,223 739 5,625 21.74% 5,539 13.34%1 Multi-level schools appear on more than one table in this report.
3 Suspension rates are not determined for program sites because of fluctuating enrollment and because these students are included in their home school data.
2 Suspension rates may exceed 100% due to fluctuation in student population during the school year.
26
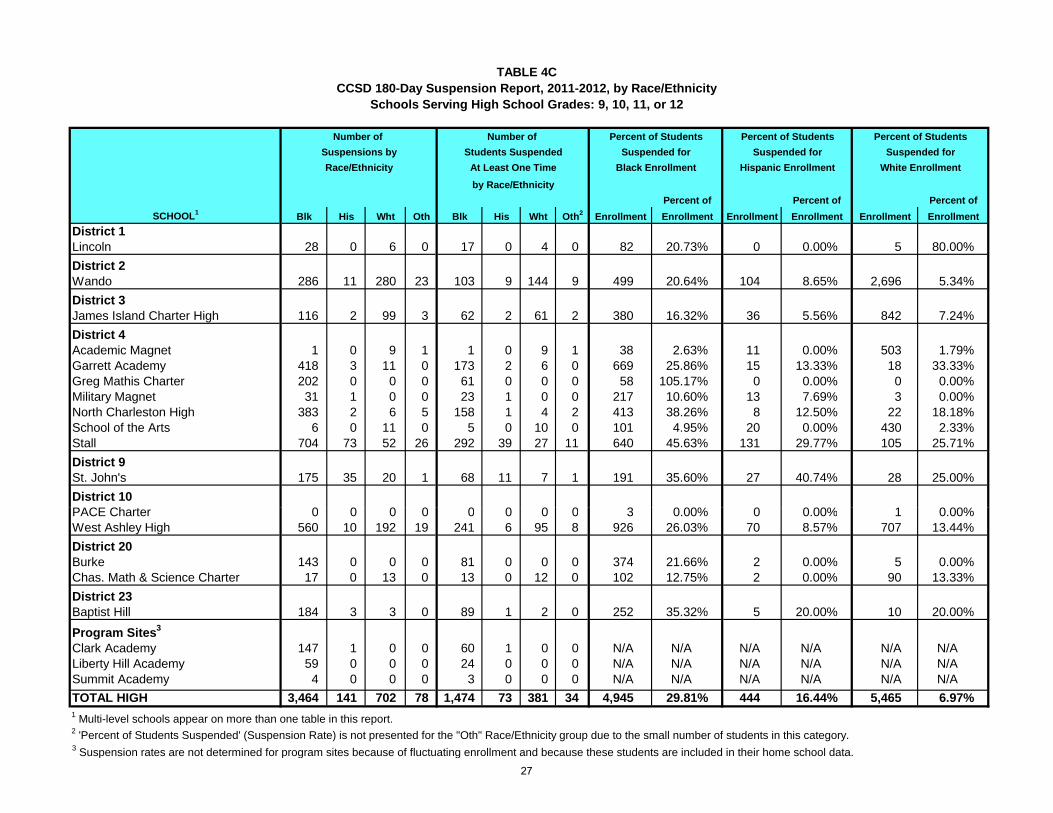
TABLE 4CCCSD 180-Day Suspension Report, 2011-2012, by Race/Ethnicity
Schools Serving High School Grades: 9, 10, 11, or 12
SCHOOL1
District 1Lincoln 28 0 6 0 17 0 4 0 82 20.73% 0 0.00% 5 80.00%District 2Wando 286 11 280 23 103 9 144 9 499 20.64% 104 8.65% 2,696 5.34%District 3James Island Charter High 116 2 99 3 62 2 61 2 380 16.32% 36 5.56% 842 7.24%District 4Academic Magnet 1 0 9 1 1 0 9 1 38 2.63% 11 0.00% 503 1.79%Garrett Academy 418 3 11 0 173 2 6 0 669 25.86% 15 13.33% 18 33.33%Greg Mathis Charter 202 0 0 0 61 0 0 0 58 105.17% 0 0.00% 0 0.00%Military Magnet 31 1 0 0 23 1 0 0 217 10.60% 13 7.69% 3 0.00%North Charleston High 383 2 6 5 158 1 4 2 413 38.26% 8 12.50% 22 18.18%School of the Arts 6 0 11 0 5 0 10 0 101 4.95% 20 0.00% 430 2.33%Stall 704 73 52 26 292 39 27 11 640 45.63% 131 29.77% 105 25.71%District 9St. John's 175 35 20 1 68 11 7 1 191 35.60% 27 40.74% 28 25.00%District 10PACE Ch t 0 0 0 0 0 0 0 0 3 0 00% 0 0 00% 1 0 00%
Number of Number of Percent of StudentsPercent of Students Percent of StudentsSuspensions by Students Suspended Suspended forSuspended for Suspended forRace/Ethnicity At Least One Time White EnrollmentBlack Enrollment Hispanic Enrollment
by Race/Ethnicity Percent of Percent of Percent of
EnrollmentBlk His BlkWht Oth Wht Oth2 Enrollment EnrollmentEnrollment EnrollmentHis Enrollment
PACE Charter 0 0 0 0 0 0 0 0 3 0.00% 0 0.00% 1 0.00%West Ashley High 560 10 192 19 241 6 95 8 926 26.03% 70 8.57% 707 13.44%District 20Burke 143 0 0 0 81 0 0 0 374 21.66% 2 0.00% 5 0.00%Chas. Math & Science Charter 17 0 13 0 13 0 12 0 102 12.75% 2 0.00% 90 13.33%District 23Baptist Hill 184 3 3 0 89 1 2 0 252 35.32% 5 20.00% 10 20.00%
Program Sites3
Clark Academy 147 1 0 0 60 1 0 0 N/A N/A N/A N/A N/A N/ALiberty Hill Academy 59 0 0 0 24 0 0 0 N/A N/A N/A N/A N/A N/ASummit Academy 4 0 0 0 3 0 0 0 N/A N/A N/A N/A N/A N/ATOTAL HIGH 3,464 141 702 78 1,474 73 381 34 4,945 29.81% 444 16.44% 5,465 6.97%1 Multi-level schools appear on more than one table in this report.2 'Percent of Students Suspended' (Suspension Rate) is not presented for the "Oth" Race/Ethnicity group due to the small number of students in this category.3 Suspension rates are not determined for program sites because of fluctuating enrollment and because these students are included in their home school data.
27

TABLE 4DCCSD 180-Day Suspension Report, from 2009-2010 to 2011-2012
Schools Serving High School Grades: 9, 10, 11, or 12
District 1Lincoln 65 27 34 33.26 17.74 23.68District 2Wando 629 399 600 10.46 7.65 7.69District 3James Island Charter High 380 334 220 15.76 14.15 9.57District 4Academic Magnet 16 10 11 2.16 1.49 1.78Garrett Academy 469 390 432 29.65 30.24 25.14Greg Mathis Charter2 193 289 202 82.19 103.07 75.05Military Magnet 192 58 32 38.59 17.52 9.95North Charleston High 497 635 396 32.03 47.70 35.01School of the Arts 45 39 17 5.94 6.39 2.61Stall 715 907 855 40.09 41.17 38.83District 9St. John's 471 367 231 41.67 43.25 34.05District 10PACE Charter 0 0 0 0.00 0.00 0.00West Ashley High 996 840 781 24.56 21.37 19.18District 20
Percent of Students SuspendedNumber of Suspensions2009-10 2011-122010-112010-11 2011-12SCHOOL1
2009-10
Burke 468 311 143 42.78 33.30 20.83Charleston Math & Science Charter (9-12)3 67 58 30 31.82 22.74 12.46District 23Baptist Hill 345 172 190 43.20 30.58 33.64Program Sites4
Clark Academy 120 77 148 N/A N/A N/ALiberty Hill Academy 40 85 59 N/A N/A N/ASummit Academy N/A N/A 4 N/A N/A N/ATOTAL HIGH 5,935 4,998 4,385 23.32% 20.51% 17.12%
2 Rate may exceed 100% due to fluctuation in student population during the school year.3 School served grades 9-10 in 2009-10, grades 9-11 in 2010-11, and grades 9-12 in 2011-12.4 Suspension rates are not determined for program sites because of fluctuating enrollment and because these students are included in their home school data.
1 Multi-level schools appear on more than one table in this report.
28

TABLE 5AReasons for Suspension
180-Day Reportfrom 2009-2010 to 2011-2012
Physical Violence and Criminal Offenses
2009-10 2010-11 2011-12 2009-10 2010-11 2011-12Arson 5 7 12 0.04% 0.07% 0.12% Assault, Aggravated 17 6 13 0.13% 0.06% 0.13% Assault, Simple 398 460 353 3.11% 4.46% 3.42% Counterfeit/Forgery 11 6 6 0.09% 0.06% 0.06% Disturbing School 827 505 455 6.46% 4.90% 4.41% Drug Violation 111 134 182 0.87% 1.30% 1.76% Extortion/Blackmail/Fraud 0 0 0 0.00% 0.00% 0.00% Gambling 4 4 0 0.03% 0.04% 0.00% Intimidation 207 103 180 1.62% 1.00% 1.75% Kidnap/Abduction 0 0 0 0.00% 0.00% 0.00% Larceny/Theft 89 96 133 0.69% 0.93% 1.29% Liquor Law Violation 40 49 72 0.31% 0.48% 0.70% Other Criminal Offense 103 138 142 0.80% 1.34% 1.38% Sex Offense 44 22 41 0.34% 0.21% 0.40% Trespassing 28 13 23 0.22% 0.13% 0.22% Vandalism 39 33 35 0.30% 0.32% 0.34% Weapons Possession 98 65 82 0.77% 0.63% 0.79%
Total 2,021 1,641 1,729 15.78% 15.91% 16.76%
Other Offenses (Non-'Physical Violence/Criminal')
ReasonNumber of Suspensions Percent of Total
2009-10 2010-11 2011-12 2009-10 2010-11 2011-12Attendance Issues 6 2 2 0.05% 0.02% 0.02% Breaking Rules 397 383 425 3.10% 3.71% 4.12% Cheating/Lying 51 46 69 0.40% 0.45% 0.67% Disobedience 1,139 1,013 951 8.89% 9.82% 9.22% Disrespect 1,129 960 879 8.82% 9.31% 8.52% Disturbing Class 2,163 1,739 1,362 16.89% 16.86% 13.20% Dress/Food Code 40 45 37 0.31% 0.44% 0.36% Electrical Device/Unauthorized Device 208 186 88 1.62% 1.80% 0.85% Failure to Attend Punishment 332 171 121 2.59% 1.66% 1.17% Failure to Attend School/Class 886 547 415 6.92% 5.30% 4.02% Leaving Class/School 362 299 184 2.83% 2.90% 1.78% Misconduct 2,958 2,828 2,909 23.10% 27.42% 28.20% Other Offenses 192 167 473 1.50% 1.62% 4.59% Profanity 614 498 400 4.79% 4.83% 3.88% Tardies 200 224 224 1.56% 2.17% 2.17% Tobacco 108 60 47 0.84% 0.58% 0.46%
Total 10,785 9,168 8,586 84.22% 88.88% 83.24%
ReasonNumber of Suspensions Percent of Total
29

TABLE 5BReasons for Suspension
180-Day Report2011-2012
SCHOOL% of School's Suspensions SCHOOL
% of School's Suspensions
District 1 District 4 (continued)
St. James Santee 4 8.00% Pinehurst 4 7.55%
District 2 District 9
Belle Hall 1 33.33% Angel Oak 3 42.86%
James B. Edwards 0 0.00% Frierson 2 28.57%
Jennie Moore 0 0.00% Haut Gap 0 0.00%
Laurel Hill Primary 0 0.00% Mt. Zion 3 16.67%
Mt. Pleasant Academy 1 16.67% District 10
Whitesides 2 28.57% Ashley River 1 50.00%
District 3 Drayton Hall 0 0.00%
Harborview 3 12.50% Oakland 0 0.00%
James Island 0 0.00% Springfield 7 7.22%
Murray LaSaine 0 0.00% St. Andrew's School of M & S 4 10.26%
Stiles Point 0 0.00% Stono Park 0 0.00%
District 4 District 20
A.C. Corcoran 11 14.47% Buist 0 0.00%
Burns 29 14 22% Charleston Progressive 7 46 67%
for Elementary Schools Reporting One or More Suspensions1
(Schools Serving Grades K - 5)
Suspensions Due to PVCO
Suspensions Due to PVCO
Suspensions Classified as Physical Violence or Criminal Offenses (PVCO)
Burns 29 14.22% Charleston Progressive 7 46.67%
Chicora 0 0.00% James Simons 0 0.00%
Dunston 0 0.00% Memminger 20 18.52%
Goodwin 2 1.79% Mitchell 4 14.29%
Hunley Park 2 4.35% Sanders-Clyde 21 13.13%
Hursey 4 12.12% District 23
Ladson 3 23.08% Blaney 2 5.88%
Lambs 4 7.41% Ellington 5 8.47%
Mary Ford 3 6.82% Program Sites
North Charleston 4 3.60% Liberty Hill Academy 1 6.67%
Pepperhill 4 5.56% Total 161 10.31%1 Table only includes schools reporting one or more suspensions.
30

TABLE 5CReasons for Suspension
180-Day Report2011-2012
SCHOOLSuspensions Due to PVCO
% of School's Suspensions SCHOOL
Suspensions Due to PVCO
% of School's Suspensions
District 1 District 10
Lincoln 12 26.67% C.E. Williams Middle 31 30.69%
St. James-Santee 4 57.14% St. Andrew's School of M & S 9 5.73%
District 2 West Ashley High 125 16.01%
Cario Middle 22 20.56% West Ashley Middle 33 14.47%
Laing Middle 70 43.48% District 20
Moultrie Middle 20 10.36% Buist Academy 0 0.00%
Wando High 246 41.00% Burke 44 19.21%
District 3 Charleston Math & Science Charter 15 23.44%
Ft. Johnson Middle 14 8.00% Charleston Progressive 3 33.33%
James Island Charter High 35 15.91% James Simons Elementary 0 0.00%
James Island Middle 8 4.91% Memminger Elementary 7 15.91%
District 4 Mitchell 10 45.45%
Academic Magnet High 10 90.91% Sanders-Clyde 22 27.85%
ARMS Academy at Morningside 46 7.65% District 23
EXCEL A d t M i id 30 8 43% B ti t Hill 29 10 28%
Suspensions Classified as Physical Violence or Criminal Offenses (PVCO)for Middle and High Schools Reporting One or More Suspensions1
(Schools Serving Grades 6-12)
EXCEL Academy at Morningside 30 8.43% Baptist Hill 29 10.28%
Garrett Academy 95 21.99% Blaney 0 0.00%
Greg Mathis Charter 8 3.96% Ellington 3 16.67%
Jerry Zucker 47 12.88% Minnie Hughes 0 0.00%
Military Magnet 12 11.21% Program Sites
North Charleston High 65 16.41% Clark Academy 12 8.11%
Northwoods 154 24.41% Daniel J. Jenkins 125 28.34%
School of the Arts 4 22.22% Liberty Hill Academy 23 22.12%
Stall High 116 13.57% Sixth Grade Academy 3 18.75%
District 9 Summit 2 50.00%
Haut Gap Middle 21 15.11% Total 1,568 17.98%
St. John's High 33 14.29%1 Table only includes schools reporting one or more suspensions.
31

TABLE 6CCSD 180-Day Expulsions by Grade, 2011-2012
GRADEK 0 0.00%1 2 0.05%2 1 0.03%3 0 0.00%4 2 0.06%5 0 0.00%6 2 0.06%7 13 0.42%8 20 0.66%9 21 0.64%
10 15 0.51% 11 7 0.28% 12 3 0.11%
Total 86 0.20%
Number of Percent ofPopulationExpulsions
32

TABLE 7CCSD 180-Day Expulsions by Gender and Race/Ethnicity, from 2009-2010 to 2011-20121
Elementary (K-5) 0 0 5 20,276 20,714 21,225 0.00 0.00 0.02GenderMale 0 0 5 10,367 10,572 10,813 0.00 0.00 0.05Female 0 0 0 9,935 9,881 10,201 0.00 0.00 0.00EthnicityBlack 0 0 5 9,459 9,095 9,154 0.00 0.00 0.05Hispanic 0 0 0 1,452 1,562 1,732 0.00 0.00 0.00White 0 0 0 8,948 9,017 9,272 0.00 0.00 0.00Ethnicity and GenderBlack Male 0 0 5 4,777 4,640 4,665 0.00 0.00 0.11Hispanic Male 0 0 0 766 821 930 0.00 0.00 0.00White Male 0 0 0 4,605 4,750 4,799 0.00 0.00 0.00Black Female 0 0 0 4,682 4,455 4,489 0.00 0.00 0.00Hispanic Female 0 0 0 686 741 802 0.00 0.00 0.00White Female 0 0 0 4,343 4,267 4,473 0.00 0.00 0.00Middle (6-8) 32 23 35 8,781 9,017 9,325 0.36 0.26 0.38GenderMale 24 15 22 4,481 4,541 4,694 0.54 0.33 0.47Female 8 8 13 4,251 4,294 4,519 0.19 0.19 0.29EthnicityBl k 24 20 32 4 150 4 030 4 138 0 58 0 50 0 77
2011-122010-112010-11 2011-122009-10 2011-12 2009-10 2009-10 2010-11
Number of Percent of Students ExpelledStudents Expelled ADM or Enrollment
Black 24 20 32 4,150 4,030 4,138 0.58 0.50 0.77Hispanic 1 1 0 417 438 481 0.24 0.23 0.00White 7 1 3 4,022 4,115 4,300 0.17 0.02 0.07Ethnicity and GenderBlack Male 18 14 20 2,134 2,075 2,132 0.84 0.67 0.94Hispanic Male 1 1 0 227 236 257 0.44 0.42 0.00White Male 5 0 2 2,047 2,102 2,170 0.24 0.00 0.09Black Female 6 6 12 2,016 1,955 2,006 0.30 0.31 0.60Hispanic Female 0 0 0 190 202 224 0.00 0.00 0.00White Female 2 1 1 1,975 2,013 2,130 0.10 0.05 0.05
1 Figures shown on this table for number and percent of students expelled may vary slightly from figures reported on other tables in this report due to minor differences in calculated totals depending on the level of aggregation represented and on whether rates are based on Average Daily Membership (ADM) or enrollment figures.
33

TABLE 7CCSD 180-Day Expulsions by Gender and Race/Ethnicity, from 2009-2010 to 2011-20121
2011-122010-112010-11 2011-122009-10 2011-12 2009-10 2009-10 2010-11
Number of Percent of Students ExpelledStudents Expelled ADM or Enrollment
High (9-12) 85 56 46 11,648 11,574 11,467 0.73 0.48 0.40GenderMale 72 45 38 5,547 5,521 5,625 1.30 0.82 0.68Female 13 11 8 5,784 5,699 5,539 0.22 0.19 0.14EthnicityBlack 73 43 33 5,568 5,219 4,945 1.31 0.82 0.67Hispanic 4 0 1 406 423 444 0.99 0.00 0.23White 8 13 12 5,117 5,305 5,465 0.16 0.25 0.22Ethnicity and GenderBlack Male 62 34 29 2,626 2,502 2,413 2.36 1.36 1.20Hispanic Male 4 0 1 202 204 218 1.98 0.00 0.46White Male 6 11 8 2,598 2,677 2,838 0.23 0.41 0.28Black Female 11 9 4 2,942 2,717 2,532 0.37 0.33 0.16Hispanic Female 0 0 0 204 219 226 0.00 0.00 0.00White Female 2 2 4 2,519 2,628 2,627 0.08 0.08 0.15District (K-12) 117 79 86 40,705 41,304 42,016 0.29 0.19 0.20GenderMale 96 60 65 20,395 20,634 21,132 0.47 0.29 0.31Female 21 19 21 19,970 19,874 20,259 0.11 0.10 0.10EthnicityBl k 97 63 70 19 177 18 344 18 237 0 51 0 34 0 38Black 97 63 70 19,177 18,344 18,237 0.51 0.34 0.38Hispanic 5 1 1 2,275 2,423 2,657 0.22 0.04 0.04White 15 14 15 18,087 18,437 19,037 0.08 0.08 0.08Ethnicity and GenderBlack Male 80 48 54 9,537 9,217 9,210 0.84 0.52 0.59Hispanic Male 5 1 1 1,195 1,261 1,405 0.42 0.08 0.07White Male 11 11 10 9,250 9,529 9,807 0.12 0.12 0.10Black Female 17 15 16 9,640 9,127 9,027 0.18 0.16 0.18Hispanic Female 0 0 0 1,080 1,162 1,252 0.00 0.00 0.00White Female 4 3 5 8,837 8,908 9,230 0.05 0.03 0.05
1 Figures shown on this table for number and percent of students expelled may vary slightly from figures reported on other tables in this report due to minor differences in calculated totals depending on the level of aggregation represented and on whether rates are based on Average Daily Membership (ADM) or enrollment figures.
34

TABLE 8CCSD 180-Day Expulsions, from 2009-2010 to 2011-2012
Schools Serving Elementary Grades: K, 1, 2, 3, 4, or 5
SCHOOLDistrict 4Ladson 0 0 1 0.00 0.00 0.16Mary Ford 0 0 3 0.00 0.00 0.95District 10Springfield 0 0 1 0.00 0.00 0.17TOTAL ELEMENTARY 0 0 5 0.00% 0.00% 0.02%
Number of Expulsions Percent of Population Expelled2009-10 2010-11 2011-12 2009-10 2010-11 2011-12
35

TABLE 9ACCSD 180-Day Expulsions, from 2009-2010 to 2011-2012
Schools Serving Middle Grades: 6, 7, or 8
SCHOOL1
District 1Lincoln (7-8) 0 0 0 N/A 0.00 0.00St. James-Santee (6) 0 0 0 N/A 0.00 0.00District 2Cario 1 0 1 0.08 0.00 0.07East Cooper Montessori Charter 0 0 0 0.00 0.00 0.00Laing 2 2 0 0.47 0.40 0.00Moultrie 1 0 2 0.00 0.00 0.22District 3APPLE Charter (6-7) 0 0 0 0.00 0.00 0.00Ft. Johnson 1 0 0 0.19 0.00 0.00James Island Middle 1 1 0 0.00 0.26 0.00District 4ARMS Academy at Morningside2 0 3 0 N/A 1.02 0.00EXCEL Academy at Morningside2 0 1 1 N/A 0.42 0.36Jerry Zucker 1 0 0 N/A 0.00 0.00Military Magnet 0 0 2 0.00 0.00 0.94Northwoods 1 4 1 0.16 0.56 0.13School of the Arts 0 0 0 0.00 0.00 0.00
Number of Expulsions Percent of Population Expelled2011-122009-102010-112009-10 2011-12 2010-11
District 9Haut Gap 0 1 0 0.47 0.30 0.00District 10C.E. Williams 0 1 0 0.15 0.16 0.00Montessori Community (6-7) 0 0 0 0.00 0.00 0.00PACE Charter N/A 0 0 N/A 0.00 0.00St. Andrew's School of Math & Science 0 1 0 0.00 0.20 0.00West Ashley Middle 5 5 0 0.25 1.43 0.001 Grade levels in parentheses indicate middle grade configurations other than 6-8 during 2011-12. In addition, multi-level schools and K-6 schools appear on more than one table in this report.2 In 2009-10, Morningside was split into two single-gender academies, ARMS Academy (male) and EXCEL Academy (female).
36

TABLE 9ACCSD 180-Day Expulsions, from 2009-2010 to 2011-2012
Schools Serving Middle Grades: 6, 7, or 8
SCHOOL1Number of Expulsions Percent of Population Expelled
2011-122009-102010-112009-10 2011-12 2010-11
District 20Buist Academy 0 0 0 0.00 0.00 0.00Burke (7-8) 0 1 1 0.00 0.72 0.60Chas. Development Academy Charter2 0 0 0 0.00 0.00 0.00Charleston Math & Science Charter 0 0 1 0.80 0.00 0.45Charleston Progressive (6) 0 0 0 0.00 0.00 0.00James Simons (6) 0 0 0 0.00 0.00 0.00Memminger (6) 0 0 0 0.00 0.00 0.00Mitchell (6) 0 0 0 0.00 0.00 0.00Sanders-Clyde 0 0 0 0.00 0.00 0.00District 23Baptist Hill (7-8) 0 0 0 N/A 0.00 0.00Blaney (6) 0 0 0 N/A 0.00 0.00Ellington (6) 0 0 0 N/A 0.00 0.00Jane Edwards (6)3 0 0 0 0.00 0.00 0.00Minnie Hughes (6) 0 0 0 N/A 0.00 0.00
Program Sites4
Daniel J. Jenkins 18 3 26 N/A N/A N/ALiberty Hill Academy 0 0 0 N/A N/A N/ASixth Grade Academy 0 0 0 N/A N/A N/ASixth Grade Academy 0 0 0 N/A N/A N/A
TOTAL MIDDLE 32 23 35 0.59% 0.26% 0.38%
2 Charleston Development Academy served grades 6-7 in 2009-10, grades 6-8 in subsequent years.3 School served grades 6-8 prior to 2009-10.4Suspension rates are not determined for program sites because of fluctuating enrollment and because these students are included in their homeschool data
1 Grade levels in parentheses indicate middle grade configurations other than 6-8 during 2011-12. In addition, multi-level schools and K-6 schools appear on more than one table in this report.
37

TABLE 9BCCSD 180-Day Expulsions by Gender, 2011-2012
Schools Serving Middle Grades: 6, 7, or 8
SCHOOL1
District 1Lincoln (7-8) 0 0 28 0.00% 14 0.00%St. James-Santee (6) 0 0 16 0.00% 18 0.00%District 2Cario 1 0 706 0.14% 629 0.00%East Cooper Montessori Charter 0 0 25 0.00% 25 0.00%Laing 0 0 312 0.00% 286 0.00%Moultrie 2 0 459 0.44% 432 0.00%District 3APPLE Charter (6-7) 0 0 14 0.00% 22 0.00%Ft. Johnson 0 0 262 0.00% 271 0.00%James Island Middle 0 0 168 0.00% 179 0.00%District 4ARMS Academy at Morningside 0 0 284 0.00% 0 N/AEXCEL Academy at Morningside 0 1 5 0.00% 266 0.38%Jerry Zucker 0 0 280 0.00% 247 0.00%Military Magnet 2 0 127 1 57% 84 0 00%
Enrollment Enrollment
Female Enrollment
Percent of M F Enrollment Enrollment
Percent of
Students Expelledby Gender
Number of Percent of Percent ofStudents ExpelledExpulsionsMale Enrollment
Military Magnet 2 0 127 1.57% 84 0.00%Northwoods 1 0 422 0.24% 343 0.00%School of the Arts 0 0 168 0.00% 312 0.00%District 9Haut Gap 0 0 214 0.00% 198 0.00%District 10C.E. Williams 0 0 317 0.00% 324 0.00%Montessori Community (6-7) 0 0 20 0.00% 13 0.00%PACE Charter 0 0 6 0.00% 5 0.00%St. Andrew's School of Math & Science 0 0 227 0.00% 213 0.00%West Ashley Middle 0 0 162 0.00% 141 0.00%1 Grade levels in parentheses indicate middle grade configurations other than 6-8. In addition, multi-level schools and K-6 schools appear on more than one table in this report.
38

TABLE 9BCCSD 180-Day Expulsions by Gender, 2011-2012
Schools Serving Middle Grades: 6, 7, or 8
SCHOOL1 Enrollment Enrollment
Female Enrollment
Percent of M F Enrollment Enrollment
Percent of
Students Expelledby Gender
Number of Percent of Percent ofStudents ExpelledExpulsionsMale Enrollment
District 20Buist Academy 0 0 60 0.00% 70 0.00%Burke (7-8) 1 0 90 1.11% 77 0.00%Chas. Development Academy Charter 0 0 18 0.00% 24 0.00%Charleston Math & Science Charter 1 0 109 0.92% 105 0.00%Charleston Progressive (6) 0 0 4 0.00% 18 0.00%James Simons (6) 0 0 7 0.00% 13 0.00%Memminger (6) 0 0 16 0.00% 9 0.00%Mitchell (6) 0 0 23 0.00% 23 0.00%Sanders-Clyde 0 0 51 0.00% 54 0.00%District 23Baptist Hill (7-8) 0 0 50 0.00% 67 0.00%Blaney (6) 0 0 7 0.00% 8 0.00%Ellington (6) 0 0 17 0.00% 15 0.00%Jane Edwards (6) 0 0 9 0.00% 5 0.00%Minnie Hughes (6) 0 0 11 0.00% 9 0.00%
Program Sites2gDaniel J. Jenkins 14 12 N/A N/A N/A N/ALiberty Hill Academy 0 0 N/A N/A N/A N/ASixth Grade Academy 0 0 N/A N/A N/A N/ATOTAL MIDDLE 22 13 4,694 0.47% 4,519 0.29%1 Grade levels in parentheses indicate middle grade configurations other than 6-8. In addition, multi-level schools and K-6 schools appear on more than one table in this report.2 Expulsion rates are not determined for program sites because of fluctuating enrollment and because these students are included in their home school data.
39

TABLE 9CCCSD 180-Day Expulsions by Race/Ethnicity, 2011-2012
Schools Serving Middle Grades: 6, 7, or 8
SCHOOL1
District 1Lincoln (7-8) 0 0 0 0 39 0.00% 0 0.00% 2 0.00%St. James-Santee (6) 0 0 0 0 30 0.00% 0 0.00% 1 0.00%District 2Cario 1 0 0 0 176 0.57% 36 0.00% 1,073 0.00%East Cooper Montessori Charter 0 0 0 0 0 0.00% 0 0.00% 47 0.00%Laing 0 0 0 0 155 0.00% 12 0.00% 416 0.00%Moultrie 2 0 0 0 120 1.67% 23 0.00% 726 0.00%District 3APPLE Charter (6-7) 0 0 0 0 36 0.00% 0 0.00% 0 0.00%Ft. Johnson 0 0 0 0 114 0.00% 15 0.00% 384 0.00%James Island Middle 0 0 0 0 156 0.00% 6 0.00% 171 0.00%District 4ARMS Academy at Morningside 0 0 0 0 237 0.00% 32 0.00% 14 0.00%EXCEL Academy at Morningside 1 0 0 0 221 0.45% 27 0.00% 19 0.00%Jerry Zucker 0 0 0 0 410 0.00% 50 0.00% 51 0.00%Military Magnet 2 0 0 0 189 1.06% 13 0.00% 7 0.00%
Enrollment EnrollmentWht Oth2 Enrollment Enrollment Enrollment EnrollmentBlk HisPercent of
by Race/EthnicityExpulsions Expelled for Expelled for Expelled for
Black Enrollment Hispanic Enrollment White Enrollment Percent of Percent of
Number of Percent of Students Percent of Students Percent of Students
Northwoods 1 0 0 0 545 0.18% 118 0.00% 81 0.00%School of the Arts 0 0 0 0 45 0.00% 12 0.00% 396 0.00%District 9Haut Gap 0 0 0 0 203 0.00% 64 0.00% 136 0.00%District 10C.E. Williams 0 0 0 0 244 0.00% 30 0.00% 335 0.00%Montessori Community (6-7) 0 0 0 0 7 0.00% 0 0.00% 24 0.00%PACE Charter 0 0 0 0 5 0.00% 0 0.00% 6 0.00%St. Andrew's School of Math & Science 0 0 0 0 265 0.00% 11 0.00% 138 0.00%West Ashley Middle 0 0 0 0 239 0.00% 11 0.00% 45 0.00%
2 'Percent of Students Expelled' (Expulsion Rate) is not presented for the "Oth" Race/Ethnicity group due to the small number of students in this category.
1 Grade levels in parentheses indicate middle grade configurations other than 6-8. In addition, multi-level schools and K-6 schools appear on more than one table in this report.
40

TABLE 9CCCSD 180-Day Expulsions by Race/Ethnicity, 2011-2012
Schools Serving Middle Grades: 6, 7, or 8
SCHOOL1 Enrollment EnrollmentWht Oth2 Enrollment Enrollment Enrollment EnrollmentBlk HisPercent of
by Race/EthnicityExpulsions Expelled for Expelled for Expelled for
Black Enrollment Hispanic Enrollment White Enrollment Percent of Percent of
Number of Percent of Students Percent of Students Percent of Students
District 20Buist Academy 0 0 0 0 26 0.00% 1 0.00% 97 0.00%Burke (7-8) 1 0 0 0 163 0.61% 1 0.00% 1 0.00%Chas. Dev. Academy Charter 0 0 0 0 40 0.00% 1 0.00% 0 0.00%Charleston Math & Science Charter 0 0 1 0 90 0.00% 4 0.00% 119 0.84%Charleston Progressive (6) 0 0 0 0 22 0.00% 0 0.00% 0 0.00%James Simons (6) 0 0 0 0 20 0.00% 0 0.00% 0 0.00%Memminger (6) 0 0 0 0 22 0.00% 0 0.00% 0 0.00%Mitchell (6) 0 0 0 0 45 0.00% 0 0.00% 0 0.00%Sanders-Clyde 0 0 0 0 104 0.00% 1 0.00% 0 0.00%District 23Baptist Hill (7-8) 0 0 0 0 104 0.00% 9 0.00% 2 0.00%Blaney (6) 0 0 0 0 14 0.00% 0 0.00% 1 0.00%Ellington (6) 0 0 0 0 24 0.00% 3 0.00% 4 0.00%Jane Edwards (6) 0 0 0 0 11 0.00% 0 0.00% 2 0.00%Minnie Hughes (6) 0 0 0 0 17 0.00% 1 0.00% 2 0.00%
Program Sites3
D i l J J ki 24 0 2 0 N/A N/A N/A N/A N/A N/ADaniel J. Jenkins 24 0 2 0 N/A N/A N/A N/A N/A N/ALiberty Hill Academy 0 0 0 0 N/A N/A N/A N/A N/A N/ASixth Grade Academy 0 0 0 0 N/A N/A N/A N/A N/A N/ATOTAL MIDDLE 32 0 3 0 4,138 0.77% 481 0.00% 4,300 0.07%
2 Percent of Students Expelled' (Expulsion Rate) is not presented for the "Oth" Race/Ethnicity group due to the small number of students in this category.
1 Grade levels in parentheses indicate middle grade configurations other than 6-8. In addition, multi-level schools and K-6 schools appear on more than one table in this report.
3 Expulsion rates are not determined for program sites because of fluctuating enrollment and because these students are included in their home school data.
41
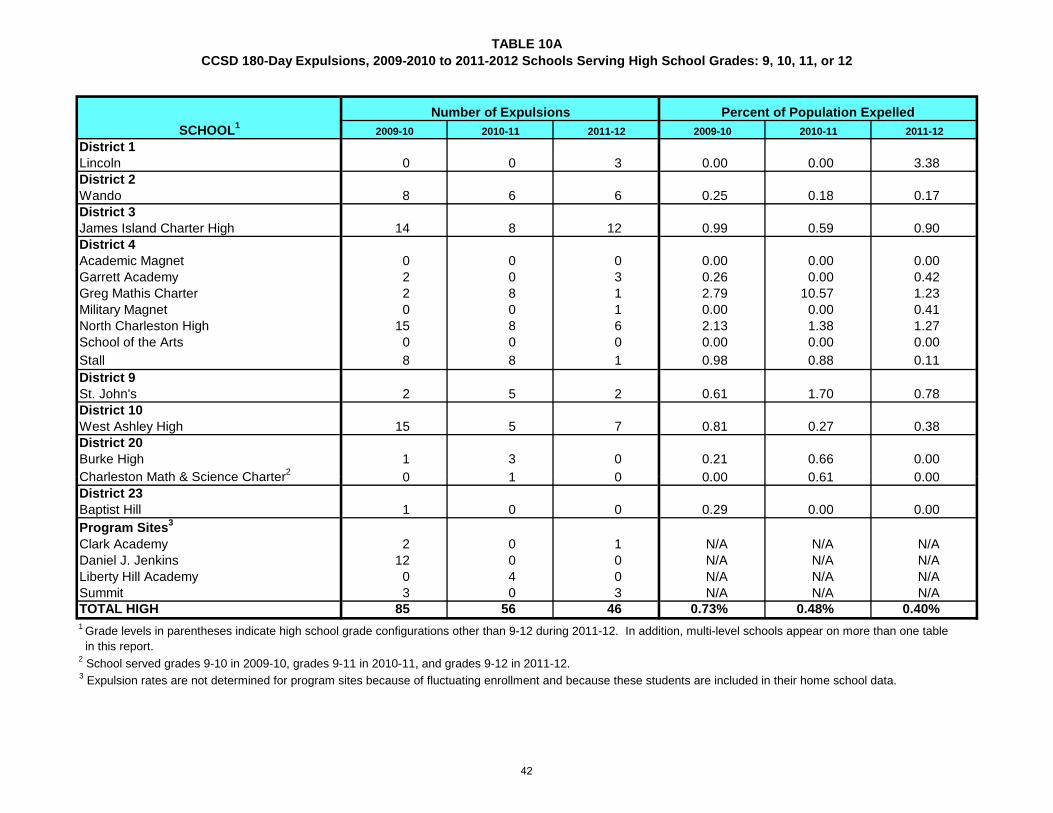
TABLE 10ACCSD 180-Day Expulsions, 2009-2010 to 2011-2012 Schools Serving High School Grades: 9, 10, 11, or 12
SCHOOL1
District 1Lincoln 0 0 3 0.00 0.00 3.38District 2Wando 8 6 6 0.25 0.18 0.17District 3James Island Charter High 14 8 12 0.99 0.59 0.90District 4Academic Magnet 0 0 0 0.00 0.00 0.00Garrett Academy 2 0 3 0.26 0.00 0.42Greg Mathis Charter 2 8 1 2.79 10.57 1.23Military Magnet 0 0 1 0.00 0.00 0.41North Charleston High 15 8 6 2.13 1.38 1.27School of the Arts 0 0 0 0.00 0.00 0.00Stall 8 8 1 0.98 0.88 0.11District 9St. John's 2 5 2 0.61 1.70 0.78District 10West Ashley High 15 5 7 0.81 0.27 0.38District 20Burke High 1 3 0 0.21 0.66 0.00Charleston Math & Science Charter2 0 1 0 0 00 0 61 0 00
Percent of Population Expelled2010-11 2011-12
Number of Expulsions2009-10 2009-10 2010-11 2011-12
Charleston Math & Science Charter 0 1 0 0.00 0.61 0.00District 23Baptist Hill 1 0 0 0.29 0.00 0.00Program Sites3
Clark Academy 2 0 1 N/A N/A N/ADaniel J. Jenkins 12 0 0 N/A N/A N/ALiberty Hill Academy 0 4 0 N/A N/A N/ASummit 3 0 3 N/A N/A N/ATOTAL HIGH 85 56 46 0.73% 0.48% 0.40%1 Grade levels in parentheses indicate high school grade configurations other than 9-12 during 2011-12. In addition, multi-level schools appear on more than one table in this report.2 School served grades 9-10 in 2009-10, grades 9-11 in 2010-11, and grades 9-12 in 2011-12.3 Expulsion rates are not determined for program sites because of fluctuating enrollment and because these students are included in their home school data.
42

TABLE 10BCCSD 180-Day Expulsions by Gender, 2011-2012
Schools Serving High School Grades: 9, 10, 11, or 12
SCHOOL1
District 1Lincoln 3 0 44 6.82% 43 0.00%District 2Wando 4 2 1,749 0.23% 1,638 0.12%District 3James Island Charter High 11 1 696 1.58% 594 0.17%District 4Academic Magnet 0 0 294 0.00% 319 0.00%Garrett Academy 3 0 299 1.00% 406 0.00%Greg Mathis Charter 0 1 34 0.00% 24 4.17%Military Magnet 1 0 126 0.79% 112 0.00%North Charleston High 5 1 225 2.22% 222 0.45%School of the Arts 0 0 209 0.00% 358 0.00%Stall 1 0 482 0.21% 425 0.00%District 9PACE Charter 0 0 2 0.00% 2 0.00%
Enrollment EnrollmentM F Enrollment Enrollment Percent of Percent of
by Gender Male Enrollment Female Enrollment
Number of Percent of Percent ofExpulsions Students Expelled Students Expelled
St. John's 2 0 138 1.45% 112 0.00%District 10West Ashley High 5 2 889 0.56% 878 0.23%District 20Burke 0 0 189 0.00% 192 0.00%Charleston Math & Science Charter 0 0 99 0.00% 96 0.00%District 23Baptist Hill 0 0 150 0.00% 118 0.00%Program Sites3
Clark Academy 1 0 N/A N/A N/A N/ALiberty Hill Academy 0 0 N/A N/A N/A N/ASummit 2 1 N/A N/A N/A N/ATOTAL HIGH 38 8 5,625 0.68% 5,539 0.14%1 Grade levels in parentheses indicate high school grade configurations other than 9-12. In addition, multi-level schools appear on more than one table in this report.2 Expulsion rates are not determined for program sites because of fluctuating enrollment and because these students are included in their home school data.
43
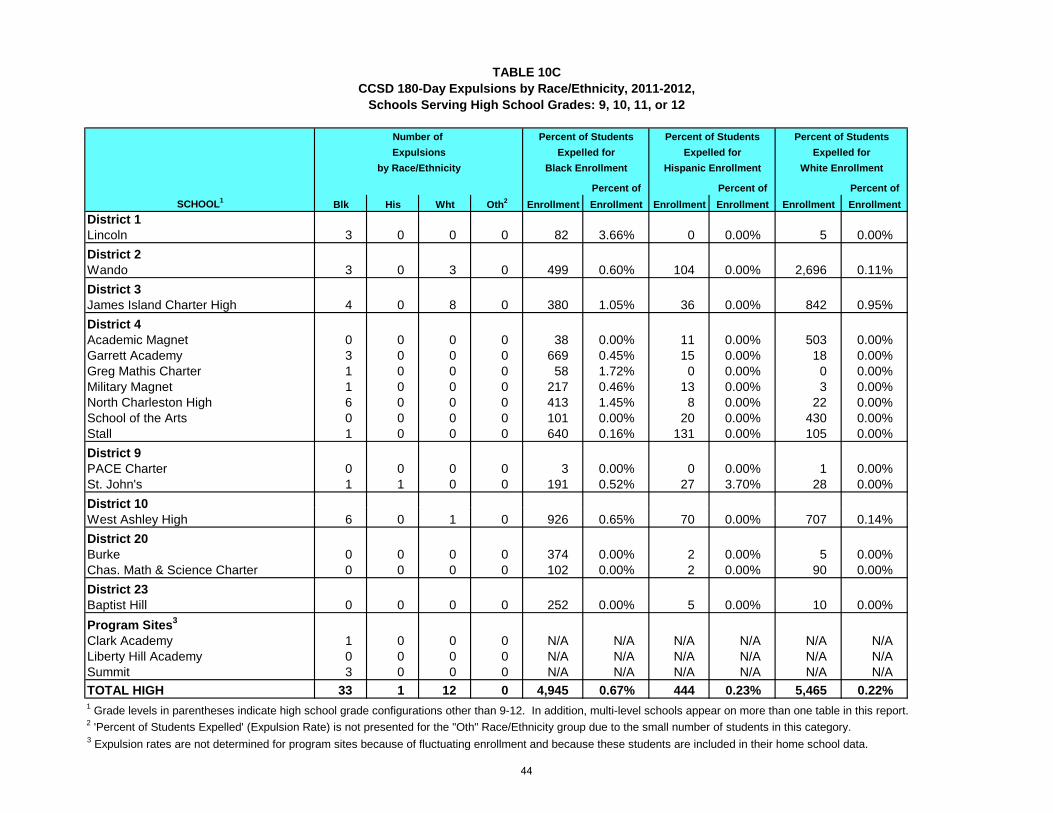
TABLE 10CCCSD 180-Day Expulsions by Race/Ethnicity, 2011-2012,
Schools Serving High School Grades: 9, 10, 11, or 12
SCHOOL1
District 1Lincoln 3 0 0 0 82 3.66% 0 0.00% 5 0.00%District 2Wando 3 0 3 0 499 0.60% 104 0.00% 2,696 0.11%District 3James Island Charter High 4 0 8 0 380 1.05% 36 0.00% 842 0.95%District 4Academic Magnet 0 0 0 0 38 0.00% 11 0.00% 503 0.00%Garrett Academy 3 0 0 0 669 0.45% 15 0.00% 18 0.00%Greg Mathis Charter 1 0 0 0 58 1.72% 0 0.00% 0 0.00%Military Magnet 1 0 0 0 217 0.46% 13 0.00% 3 0.00%North Charleston High 6 0 0 0 413 1.45% 8 0.00% 22 0.00%School of the Arts 0 0 0 0 101 0.00% 20 0.00% 430 0.00%Stall 1 0 0 0 640 0.16% 131 0.00% 105 0.00%District 9PACE Charter 0 0 0 0 3 0.00% 0 0.00% 1 0.00%St. John's 1 1 0 0 191 0.52% 27 3.70% 28 0.00%District 10
Enrollment EnrollmentWht Oth2 Enrollment Enrollment Enrollment EnrollmentBlk HisPercent of
by Race/EthnicityExpelled for Expelled for Expelled forExpulsions
Black Enrollment Hispanic Enrollment White Enrollment
Percent of Percent of
Number of Percent of Students Percent of Students Percent of Students
District 10West Ashley High 6 0 1 0 926 0.65% 70 0.00% 707 0.14%District 20Burke 0 0 0 0 374 0.00% 2 0.00% 5 0.00%Chas. Math & Science Charter 0 0 0 0 102 0.00% 2 0.00% 90 0.00%District 23Baptist Hill 0 0 0 0 252 0.00% 5 0.00% 10 0.00%Program Sites3
Clark Academy 1 0 0 0 N/A N/A N/A N/A N/A N/ALiberty Hill Academy 0 0 0 0 N/A N/A N/A N/A N/A N/ASummit 3 0 0 0 N/A N/A N/A N/A N/A N/ATOTAL HIGH 33 1 12 0 4,945 0.67% 444 0.23% 5,465 0.22%1 Grade levels in parentheses indicate high school grade configurations other than 9-12. In addition, multi-level schools appear on more than one table in this report.2 'Percent of Students Expelled' (Expulsion Rate) is not presented for the "Oth" Race/Ethnicity group due to the small number of students in this category.3 Expulsion rates are not determined for program sites because of fluctuating enrollment and because these students are included in their home school data.
44

TABLE 11AReasons for Expulsion
180-Day Reportfrom 2009-2010 to 2011-2012
Physical Violence and Criminal Offenses
2009-10 2010-11 2011-12 2009-10 2010-11 2011-12Arson 0 0 1 0.00% 0.00% 1.16% Assault 11 9 8 9.40% 11.39% 9.30% Disturbing School 27 14 9 23.08% 17.72% 10.47% Drug Violation 18 11 10 15.38% 13.92% 11.63% Gambling 0 0 0 0.00% 0.00% 0.00% Intimidation 7 7 8 5.98% 8.86% 9.30% Larceny/Theft 3 0 3 2.56% 0.00% 3.49% Liquor Law Violation 1 2 2 0.85% 2.53% 2.33% Other Criminal Offense 1 4 8 0.85% 5.06% 9.30% Sex Offense 0 0 1 0.00% 0.00% 1.16% Trespassing 0 1 1 0.00% 1.27% 1.16% Vandalism 1 2 0 0.85% 2.53% 0.00% Weapons Possession 7 2 4 5.98% 2.53% 4.65%
Total 76 52 55 64.96% 65.82% 63.95%
Other Offenses (Non-'Physical Violence/Criminal')
2009-10 2010-11 2011-12 2009-10 2010-11 2011-12Attendance Issues 3 1 0 2.56% 1.27% 0.00% Breaking Rules 2 2 4 1.71% 2.53% 4.65% Disobedience 0 2 0 0.00% 2.53% 0.00%
Reason
ReasonNumber of Expulsions
Percent of Total
Percent of Total
Number of Expulsions
Disrespect 0 1 1 0.00% 1.27% 1.16% Disturbing Class 3 1 0 2.56% 1.27% 0.00% Failure to Attend Punishment 0 0 0 0.00% 0.00% 0.00% Failure to Attend School/Class 0 0 1 0.00% 0.00% 1.16% Leaving Class/School 0 0 1 0.00% 0.00% 1.16% Misconduct 2 3 5 1.71% 3.80% 5.81% Other Offense 26 16 18 22.22% 20.25% 20.93% Profanity 1 0 0 0.85% 0.00% 0.00% Tardies 2 0 0 1.71% 0.00% 0.00% Tobacco 2 1 1 1.71% 1.27% 1.16%
Total 41 27 31 35.04% 34.18% 36.05%
45

TABLE 11BReasons for Expulsion
180-Day Report2011-2012
SCHOOLExpulsions
Due to PVCO% of School's
Expulsions SCHOOLExpulsions
Due to PVCO% of School's
Expulsions
District 1 District 9
Lincoln 2 66.67% St. John's High 1 50.00%
District 2 District 10
Cario Middle 1 100.00% Springfield 0 0.00%
Moultrie Middle 1 50.00% West Ashley High 3 42.86%
Wando High 4 66.67% District 20
District 3 Burke 1 100.00%
James Island Charter High 3 25.00% Charleston Math and Science Charter 0 0.00%
District 4 Program Sites
EXCEL Academy at Morningside 0 0.00% Clark Academy 1 100.00%
Garrett Academy 3 100.00% Daniel J. Jenkins 21 80.77%
Ladson Elementary 1 100.00% Summit 1 33.33%
Mary Ford Elementary 3 100.00% Total 55 63.95%
Military Magnet Academy 2 66.67%
Expulsions Classified as Physical Violence or Criminal Offenses (PVCO)for Schools Reporting One or More Expulsions1
Greg Mathis Charter 0 0.00%
North Charleston High 5 83.33%
Northwoods Middle 1 100.00%
Stall High 1 100.00%
1 Table only includes schools reporting one or more expulsions.
46

TABLE 12Charleston County School District
Average Daily Attendance Percentage (ADA%)2011-2012
School NameDistrict 1 2009-2010 2010-2011 2011-2012
Lincoln 93.75 96.17 96.68St. James-Santee Elementary 95.52 94.43 96.92
District 2 2009-2010 2010-2011 2011-2012Belle Hall Elementary 96.82 96.66 97.29Cario Middle 94.71 97.41 98.60Charles Pinckney Elementary 96.80 96.86 97.30East Cooper Montessori Charter 96.81 96.81 96.71James B. Edwards Elementary 95.99 96.46 96.42Jennie Moore Elementary 95.93 96.13 96.15Laing Middle 96.08 97.50 98.71Laurel Hill Primary 95.48 95.53 96.54Moultrie Middle 96.05 97.85 97.74Mt. Pleasant Academy 96.85 96.73 97.03Sullivan's Island Elementary 95.86 95.96 96.15Wando High 96.84 98.69 99.43Whitesides Elementary 95.69 95.85 96.41
District 3 2009-2010 2010-2011 2011-2012APPLE Charter N/A 97.07 95.64Ft. Johnson Middle 95.52 97.29 97.39Harbor View Elementary 95.81 95.57 96.54James Island Charter High 95.60 97.78 98.80James Island Elementary 95.67 95.64 96.20James Island Middle 95.64 97.55 96.74Murray LaSaine Elementary 95.87 96.50 95.82Stiles Point Elementary 95.97 96.51 96.87
District 4 2009-2010 2010-2011 2011-2012
Average Daily Attendance %
District 4 2009 2010 2010 2011 2011 2012A.C. Corcoran Elementary 95.48 94.94 95.86Academic Magnet High 97.44 97.55 98.19ARMS Academy at Morningside 91.31 96.57 99.66Burns Elementary 96.82 95.52 91.85Chicora Elementary 97.04 97.43 97.70Dunston Elementary 95.24 93.83 96.31EXCEL Academy at Morningside 93.24 98.88 94.17Garrett Academy of Technology 96.24 96.22 96.04Goodwin Elementary 96.40 96.26 96.75Greg Mathis Charter 83.55 87.06 84.28Hunley Park Elementary 95.40 95.37 96.15Hursey Elementary 94.47 94.13 95.12Jerry Zucker 95.13 98.19 97.52Ladson Elementary 95.51 94.97 95.84Lambs Elementary 95.22 95.14 95.64Mary Ford Elementary 96.22 96.47 95.61Midland Park Elementary 94.96 94.06 95.86Military Magnet Academy 96.14 96.51 96.71North Charleston Elementary 95.79 95.38 97.30
47

TABLE 12Charleston County School District
Average Daily Attendance Percentage (ADA%)2011-2012
School Name Average Daily Attendance %District 4 (continued) 2009-2010 2010-2011 2011-2012
North Charleston High 91.90 87.84 94.62Northwoods 93.38 95.60 96.48Pepperhill Elementary 97.54 94.93 95.58Pinehurst Elementary N/A 95.47 96.21School of the Arts 96.82 97.34 98.14Stall High 92.17 93.54 94.77
District 9 2009-2010 2010-2011 2011-2012Angel Oak Elementary 97.20 95.87 93.53Frierson Elementary 96.81 96.70 97.42Haut Gap Middle 95.07 95.60 97.87Mt. Zion Elementary 95.72 94.68 95.84St. John's High 94.83 85.33 97.54
District 10 2009-2010 2010-2011 2011-2012Ashley River Elementary 96.86 96.74 97.20C.E. Williams Middle 95.54 97.92 98.19Drayton Hall Elementary 96.14 96.21 95.92Montessori Community 95.94 96.88 96.67Oakland Elementary 95.96 95.78 96.45Orange Grove Charter Elementary 96.51 96.74 97.40PACE Charter N/A 70.90 94.55Springfield Elementary 94.73 95.04 95.75St. Andrew's Elementary 96.57 96.61 96.57St. Andrew's Middle 95.76 98.44 98.84Stono Park Elementary 95.28 96.95 96.92West Ashley High 95.58 92.89 93.73West Ashley Middle 94.93 98.24 98.21West Ashley Middle 94.93 98.24 98.21
District 20 2009-2010 2010-2011 2011-2012Buist Academy 96.79 96.86 97.11Burke 92.12 97.73 98.21Charleston Development Academy Charter 99.35 99.12 99.48Charleston Math & Science Charter 95.93 97.49 99.81Charleston Progressive 96.21 87.59 96.37James Simons Elementary 96.42 95.71 95.54Memminger Elementary 96.10 95.02 94.79Mitchell Elementary 94.23 96.65 96.51Sanders-Clyde Elementary 93.95 94.68 96.06
District 23 2009-2010 2010-2011 2011-2012Baptist Hill High 94.38 93.86 96.07Blaney Elementary 95.82 96.88 96.69E. B. Ellington Elementary 95.71 93.95 94.60Jane Edwards 97.35 93.76 96.93Minnie Hughes Elementary 96.85 94.51 96.82
CCSD Total 95.63 96.10 96.88
48

FIGURE 1ACharleston County School District
Percent of Students Suspended at Least One Time by Grade, 2011-2012
15.8%
19.0%19.5%
21.4%
17.2%
15.0%
13.7%
10%
15%
20%
25%
Susp
ensi
on R
ate
(%)
1.8%2.8%
3.9%3.3%
5.6%6.3%
0%
5%
K 1 2 3 4 5 6 7 8 9 10 11 12
Grade
49

FIGURE 1BCharleston County School District
Percent of Students Suspended at Least One Time by Level, 2009-10 to 2011-12
24.5%
20.5%
18.1%
23.3%
20.5%
17.1%
10%
15%
20%
25%
30%
Susp
ensi
on R
ate
(%)
5.2%4.2% 3.9%
0%
5%
10%
2009-10 2010-11 2011-12
Elementary Middle High
50

FIGURE 1CCharleston County School District
Suspension Rates for Gender and Race/Ethnicity, 2011-12(Percent of Students Suspended at Least One Time)
22.8%
13 7%
31.9%
21.7%
29.8%
16.4%
15%
20%
25%
30%
35%
40%
45%
Susp
ensi
on R
ate
(%)
5.5%
2.3%
7.8%
0.7% 0.9%
13.7%
10.0%
6.6%
13.3%
7.0%
0%
5%
10%
15%
Male Female Black Hispanic White
Elementary Middle High
51

FIGURE 1DCharleston County School District
Suspension Rates for Gender-Race/Ethnicity, 2009-10 to 2011-12
30.5%
9 8%
18.1%
26.9%
16.8%
23.8%
14.5%15%
20%
25%
30%
35%
Susp
ensi
on R
ate
(%)
9.8%
7.4%
4.1%
2.5%
7.4%
6.0%
3.7%
2.4%
5.8% 5.7%4.2%
2.1%
0%
5%
10%
Black Male Hispanic Male White Male Black Female Hispanic Female White Female
2009-10 2010-11 2011-12
52
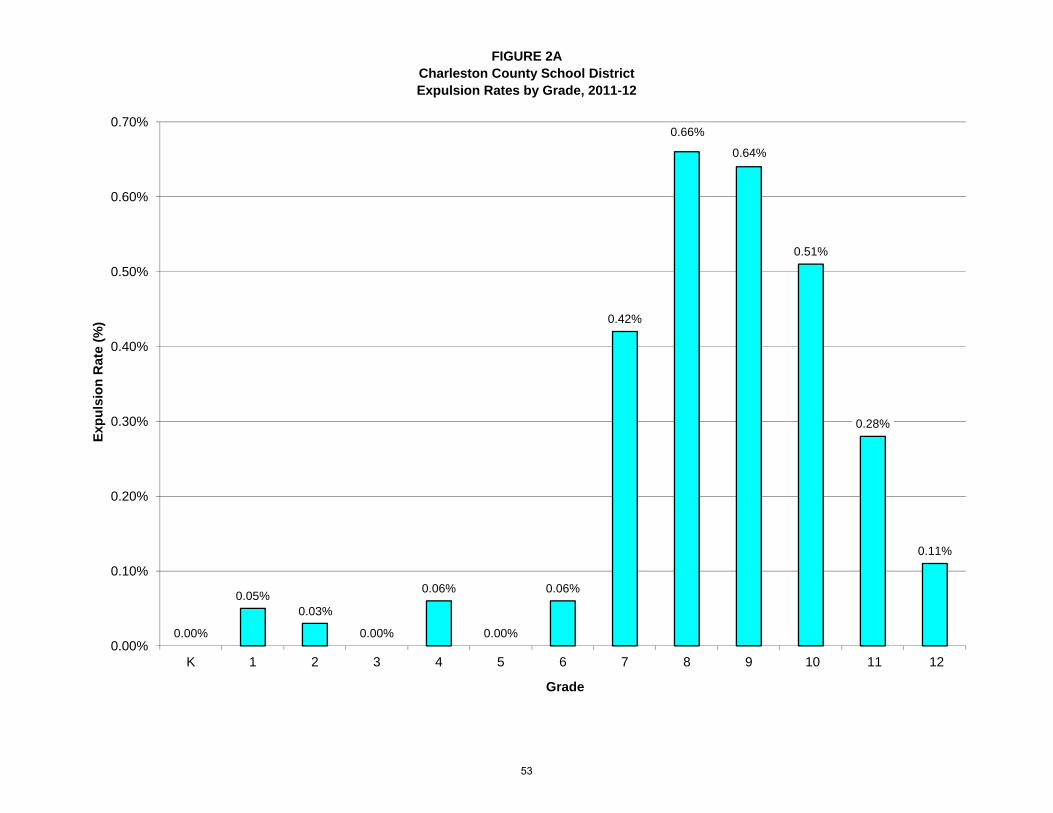
FIGURE 2ACharleston County School DistrictExpulsion Rates by Grade, 2011-12
0.42%
0.66%
0.64%
0.51%
0.28%0.30%
0.40%
0.50%
0.60%
0.70%
Expu
lsio
n R
ate
(%)
0.00%
0.05%0.03%
0.00%
0.06%
0.00%
0.06%
0.11%
0.00%
0.10%
0.20%
K 1 2 3 4 5 6 7 8 9 10 11 12
Grade
53

FIGURE 2BCharleston County School District
Percent of Students Expelled at Least One Time by Level, 2009-10 to 2011-12
0.73%
1.00%
1.50%
2.00%
Expu
lsio
n R
ate
(%)
0.00% 0.00% 0.02%
0.36%0.26%
0.38%
0.48%0.40%
0.00%
0.50%
2009-10 2010-11 2011-12
Elementary Middle High
54

FIGURE 2CCharleston County School District
Expulsion Rates for Gender and Race/Ethnicity, 2011-12
0.77%
0.68% 0.67%
1.00%
1.50%
2.00%
Expu
lsio
n R
ate
(%)
0.05%0.00%
0.05%0.00% 0.00%
0.47%
0.29%
0.00%0.07%
0.14%
0.23% 0.22%
0.00%
0.50%
Male Female Black Hispanic White
Elementary Middle High
55

FIGURE 2DCharleston County School District
Expulsion Rates for Gender-Race/Ethnicity, 2009-10 to 2011-12
0.84%
0.42%
0.52%
0.59%
0.30%
0.40%
0.50%
0.60%
0.70%
0.80%
0.90%
Expu
lsio
n R
ate
(%)
0.12%
0.18%
0.00%
0.05%
0.08%
0.12%
0.16%
0.00%
0.03%
0.07%0.10%
0.18%
0.00%
0.05%
0.00%
0.10%
0.20%
Black Male Hispanic Male White Male Black Female Hispanic Female White Female
2009-10 2010-11 2011-12
56