report of 2010 loss ratio experience in the individual and ... · small employer markets in the...
TRANSCRIPT

Report of 2010 Loss Ratio Experience in the Individual and Small Employer Health
Plan Markets for: Insurance Companies
Nonprofit Health Service Plan Corporations and
Health Maintenance Organizations
June, 2011
Rev. 6/15/2011
This document is made available electronically by the Minnesota Legislative Reference Library as part of an ongoing digital archiving project. http://www.leg.state.mn.us/lrl/lrl.asp

Table of Contents
Introduction ........................................................................ 1 Definition of Loss Ratio ...................................................... 1 Notes on Using the Results ............................................... 3 How Rates are Regulated.................................................. 5 Individual Health Plan Loss Ratios .................................... 6 Small Employer Health Plan Loss Ratios .......................... 7 Health Care Cost Containment in Minnesota.................... 8 Patient Protection and Affordable Care Act.................... 10 Additional Reference Sources ......................................... 12 Attachments 1-8

Introduction Under Minnesota Statutes, section 62A.021, subdivision 1(h), the Minnesota Departments of Health and Commerce are required to issue a public report each year listing, by health plan company, the actual loss ratios experienced in the individual and small employer markets in the State of Minnesota. This report includes loss ratios for the calendar year ending December 31, 2010, for health plan companies regulated by the Minnesota Departments of Health and Commerce. There is a public interest in dissemination of information that may help consumers to choose from among available health plan companies. The loss ratio is a rough measure of how much of the premium revenue was spent on medical care. Revenue not used to pay medical expenses is used for health plan administration, marketing, taxes, other expenses, and net income. In reality, due to many reasons related to operation and measurement, loss ratios are not necessarily an indicator of value for a specific health plan company in any one year. State law has established some minimum loss ratios for small group and individual plans to ensure a minimum value to the consumer. See page 5 for a description of the requirements. Roughly 7 percent of the population receives coverage through a small group, while 5 percent of the population purchases individual coverage. Of the remainder, 52 percent of the population receives coverage through a large group, 27 percent receives coverage through public programs, and 9 percent is uninsured. Claim cost levels have continued to increase for most health plan companies, leading to a series of high rate increases for small employer and individual health plans. Most large employers have self-insured plans, which allow them to reduce cost while having more control over their employee benefits. Self-insured plans are not subject to state benefit mandates or state premium taxes and assessments. This option is not generally available to small employers, because they do not usually have the financial resources to accept the risk of large claims.
Definition of Loss Ratio The loss ratio is the ratio of incurred claims to earned premiums. Health plan companies were asked to provide the total earned premium, incurred claims, and loss ratio for the year ending December 31, 2010, separately for the individual and small employer health plan markets. The small employer market includes non-compliant small employer plans that have been treated as part of the small employer block of business. The small employer market does not include employers with 51 or more employees, even if fewer than 51 employees from a group have enrolled for health plan coverage.

The individual market includes individual policies issued as conversions from group health plan coverage. However, if a company has conversion policies in force, but no other individual health plan business, it need not report data for the individual market.
Earned Premium Earned premium is premium earned during 2010, without adjusting for any payments to the Minnesota Health Care Reinsurance Association (MHCRA) or private reinsurance arrangements. Earned premiums are equal to paid premium for the year plus uncollected premiums minus premiums paid in advance. Earned premium should be based on the most recent available estimates of the premium-related accrual amounts. The number includes any fees from policyholders such as enrollment fees, monthly fees, or processing fees. The number should be calculated without subtracting any commissions or marketing expenses from the premiums. Premiums do not include any payments for Administrative Services Only contracts or any fee-for-service income that was given on a non-insured basis to medical care providers.
Incurred Claims Incurred claims include the paid-on-incurred claims for the year, plus a reserve for claims incurred but not yet paid, plus the change in any other reserves held, plus the expenses incurred during the year for the following items, where expenses for a functional area should include allocated costs such as electronic data processing equipment, office space, management, overhead, and so on:
Any accrued expected value of withholds, bonuses, or other amounts to be paid to providers under contracts with the health plan company
Any accrued prescription drug rebates or refunds from pharmaceutical companies (a reduction to the claims)
Capitations paid or accrued to providers for claims incurred during 2010
Provider tax required by Minnesota Statutes, section 295.52

Notes on Using the Results
How to Use the Data In order to use the loss ratio data for a specific purpose, it is important to find out additional information relevant to that purpose. As discussed below, loss ratios may not be a good way to compare health plan companies, unless other information is taken into account. For example, when the Commerce Department reviews health plan rates for compliance with statutory requirements, we ask for additional information to evaluate the rates, including:
how the loss ratio has been calculated
the benefits that will be offered
any recent changes in rates or benefits
national experience when Minnesota experience is not very credible
an analysis of the relative newness of the experience
any other information that will help evaluate whether rates will meet the statutory requirements
Unintentional Errors The earned premiums, incurred claims, cost containment expenses, and loss ratios that are listed in this report have been provided by the health plan companies. We have not independently verified the loss ratios, and even the most careful process will sometimes include unintentional errors.
Calculation Methods There are different ways of calculating a loss ratio, depending on the accounting method used for calculating earned premiums and incurred claims. One method is used for the statutory annual financial statement, and includes estimates of premiums and claims that have not yet been recorded, and also includes changes in the estimates for the previous year. Another method is commonly used for setting and filing rates. This method restates the earned premium and incurred claims using the most recent information, and does not incorporate adjustments from previous periods. For this report, we have asked the health plan companies to provide loss ratios using the second method.

Loss Ratio is not the Same as Value The loss ratio can be a good measure of relative value if two health plan companies are very similar in the benefits they provide and other factors. In that case, the plan with the higher loss ratio would be a better value. However, health plan companies differ in a variety of ways, and therefore the relative loss ratio is not always indicative of relative value. For example, one health plan company may not spend much effort preventing payment of fraudulent claims, while another may spend much more time and money, resulting in non-payment of many fraudulent claims. The first company would have a higher loss ratio due to the fraudulent claims it paid, but that would not be a value to the honest policyholders. Similarly, one health plan company may pay doctors and hospitals at a higher charge level than another, due to different contractual arrangements. Those higher payments do not represent greater value to the policyholder. Also, every prospective policyholder is different, with different needs for health care. In order to compare health plan companies, it is necessary to review other aspects of the company affecting value, such as availability of particular medical care providers, quality of patient service, and quality of care management.
Statistical Fluctuation Loss ratios also are subject to statistical fluctuation. Each individual’s health care costs are more or less unpredictable, and the total incurred claims of a health plan company are also more or less unpredictable. Having a high or low loss ratio may have been due to such fluctuations, and may not be repeated in a future time period.
Recent Changes Any change that has been made in a health plan company’s business since the beginning of the reporting period also affects the loss ratio. For example, the rate levels or benefits offered may have changed significantly, due to legislative requirements or improvements offered by the health plan company.
Newness of Coverage The newness of the health plans also has an effect on the loss ratio. Policies that have been recently sold typically have lower levels of claims than policies that have been in force for a year or more. Thus, a health plan company may have a relatively low loss ratio, due to a large proportion of relatively new policies, but its expected future loss ratio may not be low.

How Rates are Regulated Minnesota Statutes, section 62A.02, requires all health plan rates to be approved by the Commissioner of Commerce or the Commissioner of Health before being used. The health plan company must supply actuarial reasons and data demonstrating that the benefits are reasonable in relation to the premiums. The Departments of Commerce and Health review all rates to verify reasonableness and compliance with other statutory limitations such as rate bands. Rate restrictions for small employer plans are specified in Minnesota Statutes, section 62L.08, and for individual plans are specified in Minnesota Statutes, section 62A.65.
Loss Ratio Standards In addition to being reasonable and meeting rate restrictions, individual and small employer health plan rates must be calculated to meet the specific minimum loss ratio standards in Minnesota Statutes, section 62A.021. For health maintenance organizations and nonprofit health service plan corporations, Minnesota law requires that small employer group plans have rates that are set to achieve a minimum loss ratio of 71% to 82%, and that individual plans have rates that are set to achieve a minimum loss ratio of 68% to 72%. Health maintenance organizations and nonprofit health service plan corporations have different minimum loss ratios based upon whether they are assessed less than 3% of the total annual amount assessed by the Minnesota Comprehensive Health Association (MCHA). The loss ratio requirements are: Individual coverage:
72% for companies assessed 3% or more of the total annual MCHA assessment
68% for companies assessed less than 3% of the total annual MCHA assessment
Small employer coverage:
82% for companies assessed 3% or more of the total annual MCHA assessment
71% for companies assessed less than 3% of the total annual MCHA assessment, on their policies with fewer than 10 employees
75% for companies assessed less than 3% of the total annual MCHA assessment, on their policies with 10 or more employees
For insurance companies, Minnesota law requires that small employer group plans and individual plans have rates that are set to achieve a minimum loss ratio of 60%. For insurance companies (including affiliates) that are assessed 10% or more of the total annual MCHA assessment, the loss ratio standards used are the same as those used for health maintenance organizations and nonprofit health service plan corporations. Currently, only Medica Insurance Company and HealthPartners Insurance Company fall into this category.

Individual Health Plan Loss Ratios Attachments 1 and 2 list the loss ratios experienced in the individual health plan market in 2010 by health plan companies that cover individuals in that market. Not all health plan companies with individual health plans in force are included, as some had premium volume lower than $200,000, which we considered too low to include. Attachment 1 contains a list in order by decreasing premium volume of the health plan companies that responded. Attachment 2 contains an alphabetical list of the same health plan companies. The loss ratios for 2010 for health plan companies ranged from 41% to 254%. The total loss ratio for 2010 for health plan companies is 90%, lower than the 96% total loss ratio from last year. The lowest loss ratios are usually on small, non-credible blocks of business. The highest loss ratios are usually on blocks of business that are primarily polices or certificates of coverage used as the mandated portability option required by Minnesota Statutes, section 62A.65, subdivision 5(b), for persons formerly covered in group health plans who have exhausted the mandated continuation coverage.

Small Employer Health Plan Loss Ratios Any person, firm, corporation, partnership, association or other entity actively engaged in business (including political subdivisions of the state) is considered a small employer group if:
it employed 2-50 workers who worked at least 20 hours per week on business days during the preceding calendar year; and
it employs at least 2 current employees on the first day of the health plan year.
Attachments 3 and 4 list the loss ratios experienced in the small employer health plan market in 2010 by health plan companies that cover small employer groups. Attachment 3 contains a list in order by decreasing premium volume of the health plan companies that responded. Attachment 4 contains an alphabetical list of the same health plan companies. The loss ratios for 2010 for health plan companies ranged from 46% to 141%. The total loss ratio for 2010 for health plan companies is 82%, lower than the 87% total loss ratio from last year. Please note: First Plan of Minnesota and Noridian Mutual Insurance Company have not been included in Attachments 3, 4, and 6 because they have discontinued business in Minnesota.

Health Care Cost Containment in Minnesota
Minnesota Statutes, section 62J.015 The legislature finds that the staggering growth in health care costs is having a devastating effect on the health and cost of living of Minnesota residents. The legislature further finds that the number of uninsured and underinsured residents is growing each year and that the cost of health care coverage for our insured residents is increasing annually at a rate that far exceeds the state's overall rate of inflation. The legislature further finds that it must enact immediate and intensive cost containment measures to limit the growth of health care expenditures, reform insurance practices, and finance a plan that offers access to affordable health care for our permanent residents by capturing dollars now lost to inefficiencies in Minnesota's health care system. The legislature further finds that controlling costs is essential to the maintenance of the many factors contributing to the quality of life in Minnesota: our environment, education system, safe communities, affordable housing, provision of food, economic vitality, purchasing power, and stable population. It is, therefore, the intent of the legislature to lay a new foundation for the delivery and financing of health care in Minnesota and to call this new foundation the MinnesotaCare Act.
Calculation Method The cost containment expense listed in this report is for Minnesota specific experience, and was obtained from the health plan companies. We have not independently verified the cost containment expense amounts submitted by the health plan companies. Cost containment expense is defined in the Statement of Statutory Accounting Principle (SSAP) No. 85 as, expenses that actually serve to reduce the number of health services provided or cost of such services. The following are examples of items listed in SSAP No. 85 that shall be considered "cost containment expenses" only if they result in reduced levels of costs or services:
Case management activities;
Utilization review;
Detection and prevention of payment for fraudulent requests for reimbursement;
Network access fees to preferred Provider Organizations and other network-based health plans, and allocated internal salaries and related costs associated with network development and/or contracting;
Consumer education solely relating to health improvement and relying on the direct involvement of health personnel, such as smoking cessation and disease management programs; and
Expenses for internal and external appeals processes.

Individual Cost Containment Expense Attachment 5 lists the cost containment expense incurred in the individual health plan market in 2010 by health plan companies that cover individuals in that market. Not all health plan companies with individual health plans in force are included, as some had premium volume lower than $200,000, which we considered too low to include. Attachment 5 contains an alphabetical list of the health plan companies that responded.
The cost containment expense for 2010 for health plan companies ranged from 0% to 13% of premiums earned in the individual market. The total cost containment expense for 2010 for health plan companies is 2%.
Small Employer Cost Containment Expense Attachment 6 lists the cost containment expense incurred in the small employer health plan market in 2010 by health plan companies that cover small employer groups. Not all health plan companies with small employer group health plans in force are included, as some had premium volume lower than $200,000, which we considered too low to include. Attachment 6 contains an alphabetical list of the health plan companies that responded. The cost containment expense for 2010 for health plan companies ranged from 0% to 3% of premiums earned in the small employer group market. The total cost containment expense for 2010 for health plan companies is 1%.

Patient Protection and Affordable Care Act As a result of additional benefits required by the Patient Protection and Affordable Care Act (PPACA), some of the premium rates for individual and small employer group coverage increased in the year 2010 to match the anticipated claim increases. The PPACA required benefits are different for individual plans and small employer group plans. The benefits required are also different for Grandfathered Plans. Plans in which the insureds were first enrolled prior to March 23, 2010 are referred to as Grandfathered plans. Plans in which insureds were first enrolled on or after March 23, 2010 are referred to as Non-Grandfathered plans. The following is a list of PPACA required benefits that may increase premium rates for health plans that did not include them previously.
Individual Grandfathered Plans The benefit package must include:
eliminate lifetime dollar limits on essential benefits
prohibit rescissions
extend dependent coverage for children until age 26
Individual Non-Grandfathered Plans The benefit package must include:
eliminate lifetime dollar limits on essential benefits
prohibit rescissions
extend dependent coverage for children until age 26
eliminate pre-existing condition exclusions for enrollees under age 19
eliminate annual dollar limits on essential benefits
prohibit cost sharing for specific preventive services
establish an internal claims appeal process and an external review process
prohibit the requirement of prior authorization for emergency services
access to a pediatrician that is in-network
prohibit the requirement of prior authorization for an OB/GYN
Small Employer Group Grandfathered Plans The benefit package must include:
eliminate lifetime dollar limits on essential benefits
prohibit rescissions
extend dependent coverage for children until age 26
eliminate pre-existing condition exclusions for enrollees under age 19
eliminate annual dollar limits on essential benefits

Small Employer Group Non-Grandfathered Plans The benefit package must include:
prohibit lifetime limits
eliminate lifetime dollar limits on essential benefits
prohibit rescissions
extend dependent coverage for children until age 26
eliminate pre-existing condition exclusions for enrollees under age 19
eliminate annual dollar limits on essential benefits
prohibit cost sharing for specific preventive services
establish an internal claims appeal process and an external review process
prohibit the requirement of prior authorization for emergency services
access to a pediatrician that is in-network
prohibit the requirement of prior authorization for an OB/GYN The prohibition of cost sharing for specific preventive services increased premium rates more than the other PPACA required benefits. The premium rate increase for this benefit is the highest when the prior benefit package included a high deductible and excluded coverage for preventive services. The elimination of lifetime dollar limits on essential benefits created the second largest increase to premium rates. The premium rate increase for this benefit was the highest in plans that replaced a relatively low lifetime dollar limit, such as $250,000, with an unlimited lifetime dollar limit. A number of heath carriers offered the benefits required by PPACA in the year 2010, but they did not implement the corresponding rate increases in 2010. We project there will be additional rate increases in the year 2011, due to PPACA required changes in the benefit packages.

Additional Reference Sources For information about insurance companies and nonprofit health service plan corporations
Minnesota Department of Commerce Enforcement Division 85 Seventh Place East, Suite 500 St Paul, MN 55101-2198 (651) 296-2488; (800) 657-3602
www.insurance.mn.gov For information about health maintenance organizations
Minnesota Department of Health Managed Care Systems Section 85 Seventh Place East P.O. Box 64882 St. Paul, MN 55164-0882 (651) 201-5100; (800) 657-3916 www.health.state.mn.us/hmo
For information about this report, contact Melane Milbert at (651) 282-5605. [email protected]

Attachment 1
Premium Order List for Individual
2010 2010 Loss
Company Premiums Claims Ratio
** BCBSM, Inc. $ 442,803,197 $ 413,526,620 93%
Medica Insurance Company $ 51,986,005 $ 51,332,299 99%
Time Insurance Company $ 50,425,770 $ 31,375,744 62%
HealthPartners Insurance Company $ 40,176,000 $ 30,509,000 76%
* HealthPartners $ 24,349,000 $ 25,217,000 104%
American Family Mutual Insurance Company $ 10,699,938 $ 9,442,113 88%
* Medica Health Plan $ 8,862,579 $ 10,667,202 120%
PreferredOne Insurance Company $ 7,182,626 $ 2,957,566 41%
World Insurance Company $ 6,184,789 $ 6,224,425 101%
John Alden Life Insurance Company $ 3,472,537 $ 3,028,948 87%
Golden Rule Insurance Company $ 1,766,346 $ 984,287 56%
American Republic Insurance Company $ 1,353,854 $ 705,966 52%
Principal Life Insurance Company $ 835,410 $ 1,411,987 169%
Genworth Life and Annuity Insurance Company $ 363,846 $ 526,727 145%
Thrivent Financial for Lutherans $ 349,624 $ 200,601 57%
Continental General Insurance Company $ 225,625 $ 552,781 245%
Total $ 651,037,146 $ 588,663,266 90%
* Health Maintenance Organization (HMO) ** Nonprofit Health Service Plan Corporation

Attachment 2
Alphabetic List for Individual
2010 2010 Loss
Company Premiums Claims Ratio
American Family Mutual Insurance Company $ 10,699,938 $ 9,442,113 88%
American Republic Insurance Company $ 1,353,854 $ 705,966 52%
** BCBSM, Inc. $ 442,803,197 $ 413,526,620 93%
Continental General Insurance Company $ 225,625 $ 552,781 245%
Genworth Life and Annuity Insurance Company $ 363,846 $ 526,727 145%
Golden Rule Insurance Company $ 1,766,346 $ 984,287 56%
* HealthPartners $ 24,349,000 $ 25,217,000 104%
HealthPartners Insurance Company $ 40,176,000 $ 30,509,000 76%
John Alden Life Insurance Company $ 3,472,537 $ 3,028,948 87%
* Medica Health Plan $ 8,862,579 $ 10,667,202 120%
Medica Insurance Company $ 51,986,005 $ 51,332,299 99%
PreferredOne Insurance Company $ 7,182,626 $ 2,957,566 41%
Principal Life Insurance Company $ 835,410 $ 1,411,987 169%
Thrivent Financial for Lutherans $ 349,624 $ 200,601 57%
Time Insurance Company $ 50,425,770 $ 31,375,744 62%
World Insurance Company $ 6,184,789 $ 6,224,425 101%
Total $ 651,037,146 $ 588,663,266 90%
* Health Maintenance Organization (HMO) ** Nonprofit Health Service Plan Corporation

Attachment 3
Premium Order List for Small Employer
2010 2010 Loss
Company Premiums Claims Ratio
** BCBSM, Inc. $ 617,336,241 $ 501,598,783 81%
Medica Insurance Company $ 350,813,398 $ 295,752,551 84%
* HealthPartners $ 291,116,000 $ 236,970,000 81%
HealthPartners Insurance Company $ 74,684,000 $ 61,299,000 82%
* PreferredOne Community Health Plan $ 63,151,599 $ 53,231,995 84%
Federated Mutual Insurance Company $ 49,889,029 $ 40,423,139 81%
* Blue Plus $ 24,130,724 $ 19,566,322 81%
PreferredOne Insurance Company $ 13,693,151 $ 12,032,475 88%
Principal Life Insurance Company $ 2,846,001 $ 2,311,676 81%
Time Insurance Company $ 1,978,529 $ 1,551,107 78%
John Alden Life Insurance Company $ 1,212,986 $ 563,501 46%
Union Security Insurance Company $ 399,430 $ 563,154 141%
Total $ 1,491,251,088 $ 1,225,863,703 82%
* Health Maintenance Organization (HMO) ** Nonprofit Health Service Plan Corporation
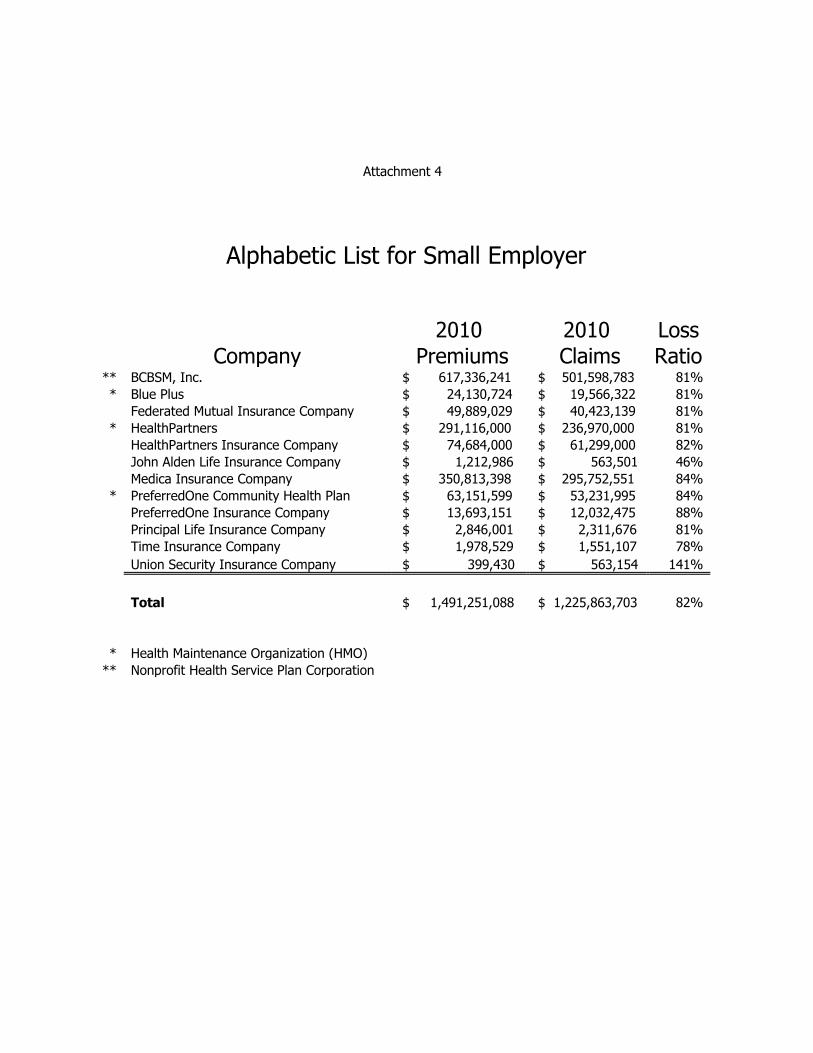
Attachment 4
Alphabetic List for Small Employer
2010 2010 Loss
Company Premiums Claims Ratio
** BCBSM, Inc. $ 617,336,241 $ 501,598,783 81%
* Blue Plus $ 24,130,724 $ 19,566,322 81%
Federated Mutual Insurance Company $ 49,889,029 $ 40,423,139 81%
* HealthPartners $ 291,116,000 $ 236,970,000 81%
HealthPartners Insurance Company $ 74,684,000 $ 61,299,000 82%
John Alden Life Insurance Company $ 1,212,986 $ 563,501 46%
Medica Insurance Company $ 350,813,398 $ 295,752,551 84%
* PreferredOne Community Health Plan $ 63,151,599 $ 53,231,995 84%
PreferredOne Insurance Company $ 13,693,151 $ 12,032,475 88%
Principal Life Insurance Company $ 2,846,001 $ 2,311,676 81%
Time Insurance Company $ 1,978,529 $ 1,551,107 78%
Union Security Insurance Company $ 399,430 $ 563,154 141%
Total $ 1,491,251,088 $ 1,225,863,703 82%
* Health Maintenance Organization (HMO) ** Nonprofit Health Service Plan Corporation

Attachment 5
2010 Cost Containment Expense for Individual
Company
Premiums Earned
Cost Containment
Expense Percent of Premiums
American Family Mutual Insurance Company $ 10,699,938 $ 1,395,689 13%
American Republic Insurance Company $ 1,353,854 $ 39,682 3%
** BCBSM, Inc. $ 442,803,197 $ 7,684,000 2%
Continental General Insurance Company $ 225,625 $ - 0%
Genworth Life and Annuity Insurance Co. $ 363,846 $ - 0%
Golden Rule Insurance Company $ 1,766,346 $ 21,196 1%
* HealthPartners $ 24,349,000 $ 336,000 1%
HealthPartners Insurance Company $ 40,176,000 $ 426,000 1%
John Alden Life Insurance Company $ 3,472,537 $ 107,545 3%
* Medica Health Plan $ 8,862,579 $ 9,372 0%
Medica Insurance Company $ 51,986,005 $ 223,373 0%
PreferredOne Insurance Company $ 7,182,626 $ 147,202 2%
Principal Life Insurance Company $ 835,410 $ 8,497 1%
Thrivent Financial for Lutherans $ 349,624 $ 2,051 0%
Time Insurance Company $ 50,425,770 $ 1,936,149 4%
World Insurance Company $ 6,184,789 $ 218,115 4%
Total $ 651,037,146 $ 12,554,871 2%
* Health Maintenance Organization (HMO) ** Nonprofit Health Service Plan Corporation

Attachment 6
2010 Cost Containment Expense for Small Employer
Company
Premiums Earned
Cost Containment
Expense Percent of Premiums
** BCBSM, Inc. $ 617,336,241 $ 7,610,000 1%
* Blue Plus $ 24,130,724 $ 247,000 1%
Federated Mutual Insurance Company $ 49,889,029 $ 1,104,392 2%
* HealthPartners $ 291,116,000 $ 4,046,000 1%
HealthPartners Insurance Company $ 74,684,000 $ 792,000 1%
John Alden Life Insurance Company $ 1,212,986 $ 40,034 3%
Medica Insurance Company $ 350,813,398 $ 1,507,373 0%
* PreferredOne Community Health Plan $ 63,151,599 $ 957,064 2%
PreferredOne Insurance Company $ 13,693,151 $ 156,399 1%
Principal Life Insurance Company $ 2,846,001 $ 28,948 1%
Time Insurance Company $ 1,978,529 $ 54,102 3%
Union Security Insurance Company $ 399,430 $ 13,643 3%
Total $ 1,491,251,088 $ 16,556,955 1%
* Health Maintenance Organization (HMO) ** Nonprofit Health Service Plan Corporation

Attachment 7
2010 Enrollment for Individual
Company Enrollment
American Family Mutual Insurance Company 4,440
American Republic Insurance Company 837
** BCBSM, Inc. 160,094
Continental General Insurance Company 26
Genworth Life and Annuity Insurance Company 62
Golden Rule Insurance Company 420
* HealthPartners 5,049
HealthPartners Insurance Company 20,931
John Alden Life Insurance Company 1,643
* Medica Health Plan 825
Medica Insurance Company 29,393
PreferredOne Insurance Company 6,349
Principal Life Insurance Company 199
Thrivent Financial for Lutherans 26
Time Insurance Company 23,161
World Insurance Company 1,551
Total 255,006
* Health Maintenance Organization (HMO) ** Nonprofit Health Service Plan Corporation

Attachment 8
2010 Enrollment for Small Employer
Company Enrollment
** BCBSM, Inc. 135,137 * Blue Plus 4,466
Federated Mutual Insurance Company 12,928
* HealthPartners 77,291
HealthPartners Insurance Company 18,762
John Alden Life Insurance Company 184
Medica Insurance Company 80,653
* PreferredOne Community Health Plan 19,846
PreferredOne Insurance Company 5,458
Principal Life Insurance Company 478
Time Insurance Company 412
Union Security Insurance Company 43
Total 355,658
* Health Maintenance Organization (HMO) ** Nonprofit Health Service Plan Corporation