report odour and dust assessment of poultry farm … · report odour and dust assessment of poultry...
TRANSCRIPT

REPORT
ODOUR AND DUST ASSESSMENT OF POULTRY
FARM
P2ML Pastoral
Job No: 7478
28 March 2013
www.pacific-environment.com

7478 P2ML Pastoral Poultry Odour Study R1-1.docx ii
Odour and Dust Assessment of Poultry Farm
P2ML Pastoral | Job Number 7478
PROJECT TITLE: Odour and Dust Assessment of Poultry Farm
JOB NUMBER: 7478
PREPARED FOR: P2ML Pastoral
APPROVED FOR RELEASE BY: Chaim Kolominskas
DISCLAIMER & COPYRIGHT: This report is subject to the copyright statement
located at www.pacific-environment.com © Pacific
Environment Operations Pty Ltd ABN 86 127 101 642
DOCUMENT CONTROL
VERSION DATE PREPARED BY REVIEWED BY
R1-1 28.03.13 G. Galvin C Kolominskas
Pacific Environment Operations Pty ABN 86 127 101 642
ADELAIDE
35 Edward Street, Norwood SA 5067
PO Box 3187, Norwood SA 5067
Ph: +61 8 8332 0960
Fax: +61 7 3844 5858
BRISBANE
Consulting
Level 1, 59 Melbourne Street, South Brisbane QLD 4101
PO Box 3306, South Brisbane QLD 4101
Ph: +61 7 3004 6400
Fax: +61 7 3844 5858
Monitoring
Unit 1, 22 Varley Street
Yeerongpilly, Qld 4105
Ph: +61 7 3004 6460
PERTH
Level 1, Suite 3
34 Queen Street, Perth WA 6000
Ph: +61 8 9481 4961
Fax: +61 7 3844 5858
SYDNEY Suite 1, Level 1, 146 Arthur Street
North Sydney, NSW 2060
Ph: +61 2 9870 0900
Fax: +61 2 9870 0999
MELBOURNE
Suite 62, 63 Turner Street, Port Melbourne VIC 3207
PO Box 23293, Docklands VIC 8012
Ph: +61 3 9681 8551
Fax: +61 3 9681 3408
GLADSTONE
Suite 2, 36 Herbert Street, Gladstone QLD 4680
Ph: +61 7 4972 7313
Fax: +61 7 3844 5858
Website: www.pacific-environment.com

7478 P2ML Pastoral Poultry Odour Study R1-1.docx iii
Odour and Dust Assessment of Poultry Farm
P2ML Pastoral | Job Number 7478
DISCLAIMER
Pacific Environment acts in all professional matters as a faithful advisor to the Client and exercises all
reasonable skill and care in the provision of its professional services.
Reports are commissioned by and prepared for the exclusive use of the Client. They are subject to and
issued in accordance with the agreement between the Client and Pacific Environment. Pacific
Environment is not responsible for any liability and accepts no responsibility whatsoever arising from the
misapplication or misinterpretation by third parties of the contents of its reports.
Except where expressly stated, Pacific Environment does not attempt to verify the accuracy, validity or
comprehensiveness of any information supplied to Pacific Environment for its reports.
Reports cannot be copied or reproduced in whole or part for any purpose without the prior written
agreement of Pacific Environment.
Where site inspections, testing or fieldwork have taken place, the report is based on the information
made available by the client or their nominees during the visit, visual observations and any subsequent
discussions with regulatory authorities. The validity and comprehensiveness of supplied information has
not been independently verified and, for the purposes of this report, it is assumed that the information
provided to Pacific Environment is both complete and accurate. It is further assumed that normal
activities were being undertaken at the site on the day of the site visit(s), unless explicitly stated
otherwise.
7478 P2ML Pastoral Poultry Odour Study R1-1.docx iv
Odour and Dust Assessment of Poultry Farm
P2ML Pastoral | Job Number 7478
CONTENTS
1 INTRODUCTION 1 1.1 Background 1 1.2 Scope of Work 1 1.3 Background 1
2 STUDY APPROACH AND METHODOLOGY 1 2.1 Information and Data Review 1 2.2 Odour Emissions Estimation 2
2.2.1 Basis of Odour Emissions Data 2 2.2.2 Analysis of Odour Data 2 2.2.3 Odour Emissions Estimation 3
2.3 PM10 Emissions Estimation 6 2.4 Meteorological Data Processing 8
2.4.1 TAPM 8 2.4.2 CALMET 8
2.5 Dispersion Modelling 9
3 IMPACT ASSESSMENT CRITERIA 10 3.1 Odour Guidelines 10 3.2 Dust 10
4 METEOROLOGICAL DATA USED IN THE ASSESSMENT 11 4.1 Wind 11 4.2 Stability 14 4.3 Mixing Height 15
5 RESULTS 17
6 CONCLUSIONS 20
7 REFERENCES 21

7478 P2ML Pastoral Poultry Odour Study R1-1.docx 1
Odour and Dust Assessment of Poultry Farm
P2ML Pastoral | Job Number 7478
1 INTRODUCTION
1.1 Background
Pacific Environment was engaged by Susan Shay on behalf of P2ML Pastoral to prepare an air quality
assessment of a proposed free range meat chicken farm located at 427 Bromelton House Road near
Beaudesert, in Queensland.
The objective of this report is to assess odour and dust impacts from the proposed farm.
1.2 Scope of Work
The scope of work for the assessment included:
� estimating hourly varying odour and dust emissions
� meteorological and plume dispersion modelling
� analysing model results and evaluating them against assessment criteria.
1.3 Background
The farm location is in a rural area approximately 4 km north west of Beaudesert. It is located in the
Bromelton State Development Area (SDA) and is subject to the “Bromelton State Development –
Development Scheme November 2012” administered by the Coordinator-General.
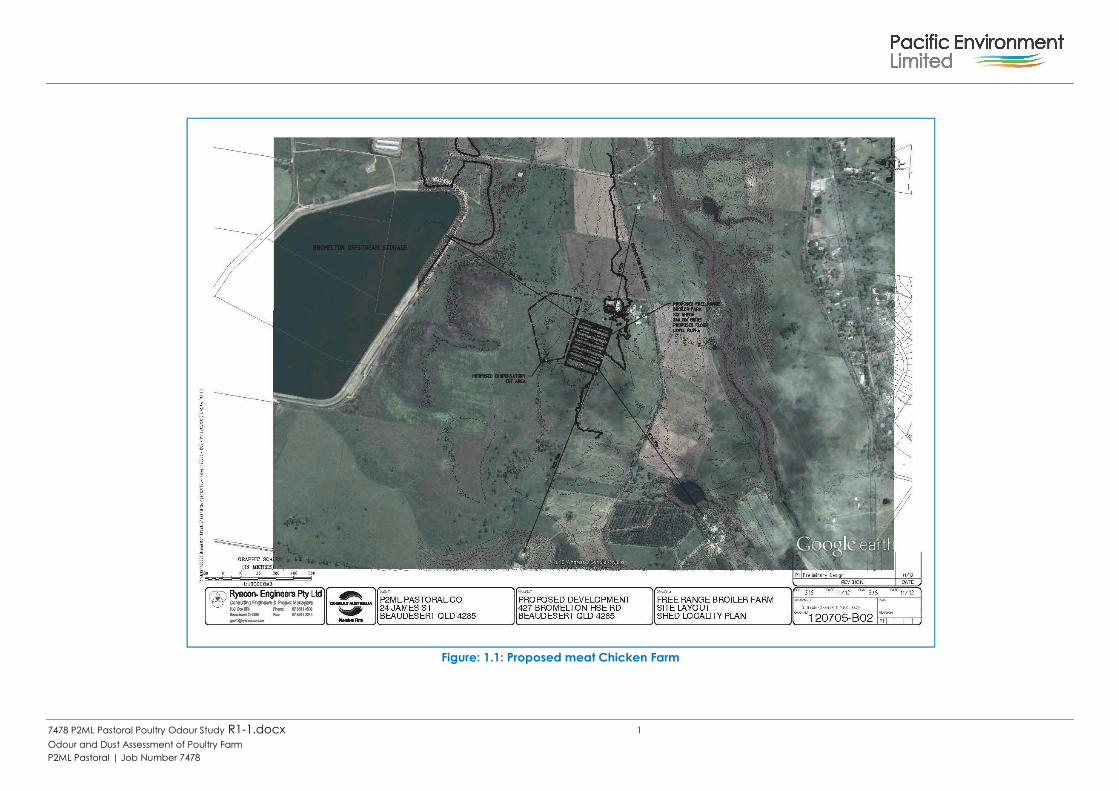
It is proposed that a six shed free range meat chicken farm be developed on the site. This will consist of
six tunnel ventilated sheds each holding up to a maximum of 40,000 birds at a maximum stocking
density of approximately 16 birds per square meter. The stocking density of free range farms is less than
that of traditional meat chicken sheds, which have a maximum stocking density of approximately 19
birds per square metre.
The birds are placed as day old chickens and held for 48 days. Up until around day 20 the birds are
held indoors, after which they have the opportunity to leave the sheds and “range” outside during the
day. Based on typical industry practices, 50% of the birds placed are removed at day 38, with the
remained removed by day 48. After the birds are removed the sheds are cleaned, disinfected and
prepared for the next batch of birds over a 10 day period.
As with other farms, the sheds will be mechanically ventilated. This means that large fans will be
installed on the western ends of the sheds which are used to draw air though the sheds to keep the
birds cool during hot weather.
The proposed layout and receptor locations are shown in Figure: 1.1.
7478 P2ML Pastoral Poultry Odour Study R1-1.docx 1
Odour and Dust Assessment of Poultry Farm
P2ML Pastoral | Job Number 7478
Figure: 1.1: Proposed meat Chicken Farm
7478 P2ML Pastoral Poultry Odour Study R1-1.docx 1
Odour and Dust Assessment of Poultry Farm
P2ML Pastoral | Job Number 7478
2 STUDY APPROACH AND METHODOLOGY
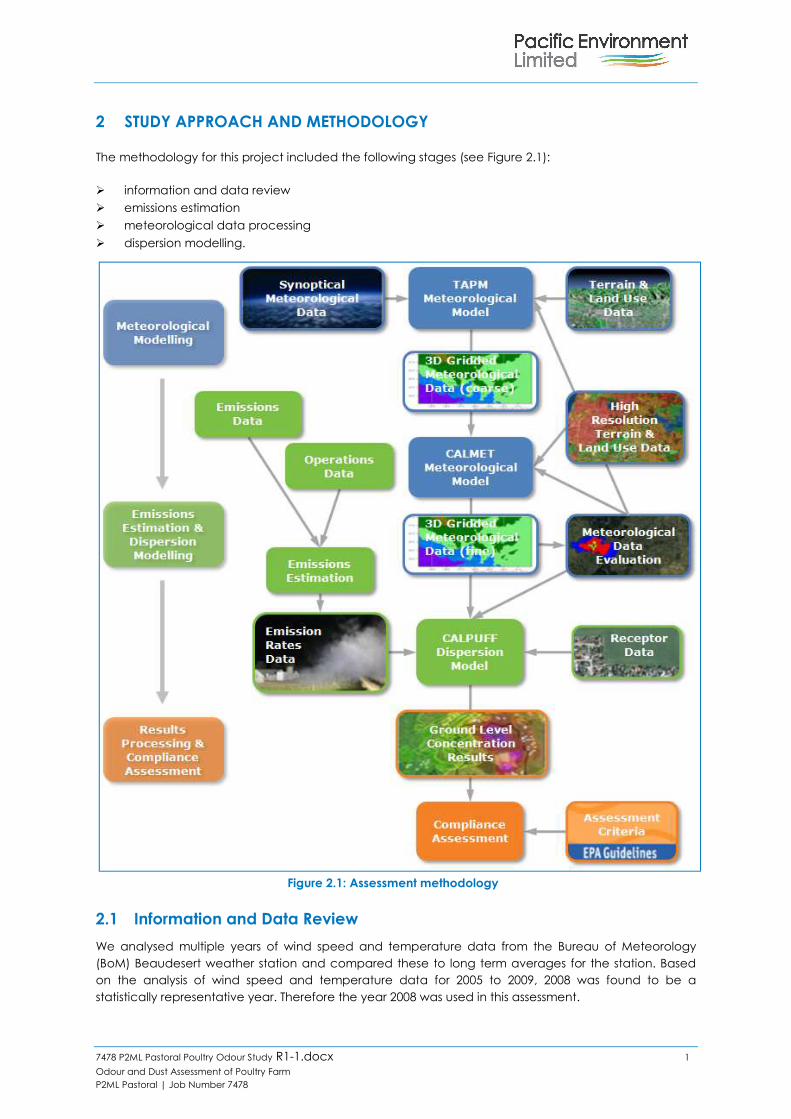
The methodology for this project included the following stages (see Figure 2.1):
� information and data review
� emissions estimation
� meteorological data processing
� dispersion modelling.
Figure 2.1: Assessment methodology
2.1 Information and Data Review
We analysed multiple years of wind speed and temperature data from the Bureau of Meteorology
(BoM) Beaudesert weather station and compared these to long term averages for the station. Based
on the analysis of wind speed and temperature data for 2005 to 2009, 2008 was found to be a
statistically representative year. Therefore the year 2008 was used in this assessment.

7478 P2ML Pastoral Poultry Odour Study R1-1.docx 2
Odour and Dust Assessment of Poultry Farm
P2ML Pastoral | Job Number 7478
2.2 Odour Emissions Estimation
The odour emissions model of Ormerod and Holmes (2005) was used for this assessment. The
methodology is consistent with that recommended in the Best Practice Guidance for the Queensland
Poultry Industry - Plume Dispersion Modelling and Meteorological Processing (PAEHolmes, 2011) as
prepared for the Queensland Government. The document is referenced in the Queensland Guidelines
Meat Chicken Farms (DAFF, 2012).
Although the farm will be a free range operation, based on the work of Gallagher and Brown (2012),
we have modelled the farm as a tunnel ventilated meat chicken farm. Gallagher and Brown (2012)
concluded that odour emissions from free range operations were not significantly different to traditional
meat chicken operations where birds are not allowed to leave the sheds. To account for the free range
operations, we have used a lower stocking density for the sheds and shorter batch length, consistent
with free range operations.
Gallagher and Brown (2012) also concluded that compared to the emissions from the sheds, the
outdoor emissions from the range areas were considerably lower and a minor contributor to overall
farm emissions. Therefore the outdoor areas have not been modelled.
2.2.1 Basis of Odour Emissions Data
Odour emission rates (OERs) for this assessment were based on data from a variety of meat chicken
farms in Australia, as well as theoretical considerations.
The approach generates hourly varying emission rates from meat chicken farm sheds based on the
following factors:
� the number of birds, which varies later in the batch as harvesting takes place
� the stocking density of birds, which is a function of bird numbers, bird age and shed size
� ventilation rate, which depends on bird age and ambient temperature
� design and management practices, particularly those aimed at controlling litter moisture.
Data from existing farms were gathered from tunnel-ventilated sheds (many with nipple drinkers) and
chicken batches at approximately five weeks of age or more. Given that maximum emissions occur
around 5 weeks and later, these samples represent the maximum odour generation potential.
2.2.2 Analysis of Odour Data
Odour data from various farms and under various conditions were standardised to relate the OER per
unit bird density and shed area to the ventilation rate at the time of sampling. The resulting relationship
is shown in Figure 2.2. The data can be segregated into two groups:
� farms operating under typical conditions
� farms that were experiencing elevated odour emissions due to problems with shed design or
management at the time of sampling.
High moisture litter is a common issue that can lead to increased odour emissions. High moisture litter
can be caused by using foggers in heatwave conditions, which was once common with older shed
designs, and water spillage from drinkers, which can be avoided with newer technology. More
frequent changing of litter between batches also minimises odour impacts. A vigilant approach to
identifying and removing wet litter is now a well-accepted tenet of management.
Design factors include inadequate ventilation and retrofitted sheds. Many older sheds had lower
maximum ventilation rates than newer sheds, thereby reducing the effectiveness of airflow to control

7478 P2ML Pastoral Poultry Odour Study R1-1.docx 3
Odour and Dust Assessment of Poultry Farm
P2ML Pastoral | Job Number 7478
litter moisture. Retrofitted sheds also did not often have the insulation properties of new sheds and were
therefore more difficult to cool by ventilation in hot weather.
As illustrated by Figure 2.2, the degree to which these issues affect odour levels is highly variable. The
curves represent a conservative estimate of the relationship between ambient temperature and odour
emissions for tunnel ventilated sheds operating under varying degrees of management. The ’best’
curve (green) represents a well designed and managed shed with a high level of control over (for
example) litter moisture levels. The ’worst’ curve (red) represents a shed experiencing difficulties due to
factors such as adverse weather conditions, equipment failure, poor design or management or a
combination of these factors.
Most of the farms for which data are presented in Figure 2.2 differ significantly from the best practice
design and management criteria for modern farms which include:
� efficient mechanical ventilation
� nipple and cup drinkers
� fully insulated sheds
� impervious floors
� single or dual batch litter usea
� daily litter inspection and replacement (if litter becomes wet).
Figure 2.2: Data used in odour emissions modelling
2.2.3 Odour Emissions Estimation
From Figure 2.2, the relationship between the ’standardised’ OER and shed ventilation is expressed as:
OERS = 0.025 K V 0.5 (1)
where:
a The most recent research has shown no significant difference between single and dual use litter see Poultry CRC.

7478 P2ML Pastoral Poultry Odour Study R1-1.docx 4
Odour and Dust Assessment of Poultry Farm
P2ML Pastoral | Job Number 7478
OERS = standardised odour emission rate (ou.m³/s) per unit shed area (m²) per unit of bird density (in
kg/m²)
V = ventilation rate (m³/s)
K = scaling factor between 1 and 5b where a value of 1 represents a very well designed and managed
shed operating with minimal odour emissions.
The scaling factor (K) referred to in equations 1 and 2 is essentially a scale rating for the design and
management of the sheds. The calculation of K for any given farm is based on several components of
farm management. For new farms conforming to best practice it is recommended that the value of K
be set at 2.2 (PAEHolmes, 2011). We have adopted this factor in this assessment.
Equation 1 can be expanded to provide a prediction of the OER from a shed at any given stage of the
growth cycle as follows:
OER = 0.025 K A D V 0.5 (2)
where:
OER = odour emission rate (ou.m³/s)
A = total shed floor area (m²)
D = average bird density (in kg/m²)
Bird density (D) is related to the age of the birds and the stocking density (i.e. the number of birds
placed per unit area). It is common practice within the meat chicken industry to vary the stocking
density with the time of year and market demands. Lower ambient temperatures during the winter
months allow for higher bird densities. For this assessment, based on current operations, a maximum
stocking density of approximately 16 birds/m² has been adopted. With a known stocking density, a
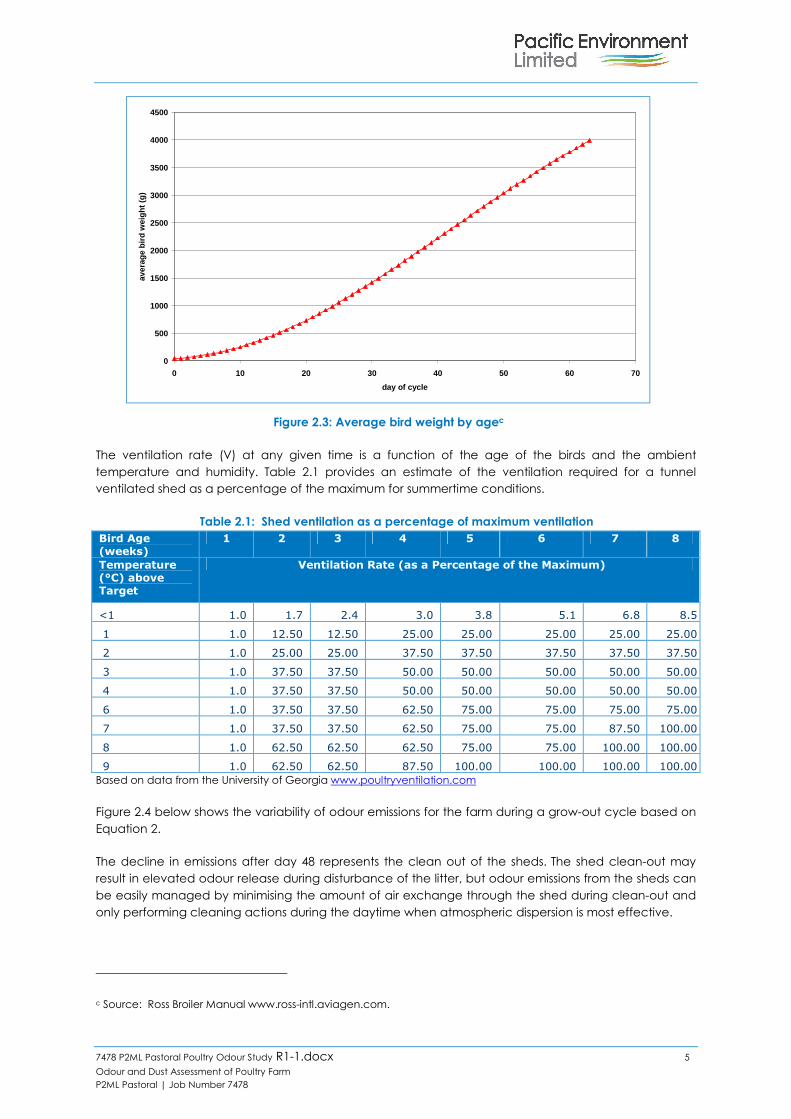
value of the mass per unit area can be estimated based on the relationship shown in Figure 2.3.
b Note that a K factor of 5 would be very uncommon and would represent a shed with serious odour management
issues.
7478 P2ML Pastoral Poultry Odour Study R1-1.docx 5
Odour and Dust Assessment of Poultry Farm
P2ML Pastoral | Job Number 7478
Figure 2.3: Average bird weight by agec
The ventilation rate (V) at any given time is a function of the age of the birds and the ambient
temperature and humidity. Table 2.1 provides an estimate of the ventilation required for a tunnel
ventilated shed as a percentage of the maximum for summertime conditions.
Table 2.1: Shed ventilation as a percentage of maximum ventilation
Bird Age (weeks)
1 2 3 4 5 6 7 8
Temperature (°C) above Target
Ventilation Rate (as a Percentage of the Maximum)
<1 1.0 1.7 2.4 3.0 3.8 5.1 6.8 8.5
1 1.0 12.50 12.50 25.00 25.00 25.00 25.00 25.00
2 1.0 25.00 25.00 37.50 37.50 37.50 37.50 37.50
3 1.0 37.50 37.50 50.00 50.00 50.00 50.00 50.00
4 1.0 37.50 37.50 50.00 50.00 50.00 50.00 50.00
6 1.0 37.50 37.50 62.50 75.00 75.00 75.00 75.00
7 1.0 37.50 37.50 62.50 75.00 75.00 87.50 100.00
8 1.0 62.50 62.50 62.50 75.00 75.00 100.00 100.00
9 1.0 62.50 62.50 87.50 100.00 100.00 100.00 100.00
Based on data from the University of Georgia www.poultryventilation.com
Figure 2.4 below shows the variability of odour emissions for the farm during a grow-out cycle based on
Equation 2.
The decline in emissions after day 48 represents the clean out of the sheds. The shed clean-out may
result in elevated odour release during disturbance of the litter, but odour emissions from the sheds can
be easily managed by minimising the amount of air exchange through the shed during clean-out and
only performing cleaning actions during the daytime when atmospheric dispersion is most effective.
c Source: Ross Broiler Manual www.ross-intl.aviagen.com.
0
500
1000
1500
2000
2500
3000
3500
4000
4500
0 10 20 30 40 50 60 70
day of cycle
aver
age
bird
wei
ght (
g)

7478 P2ML Pastoral Poultry Odour Study R1-1.docx 6
Odour and Dust Assessment of Poultry Farm
P2ML Pastoral | Job Number 7478
Figure 2.4: Example of modelled shed OER variations per shed over time for the farm (K=2.2)
2.3 PM10 Emissions Estimation
We estimated particulate emission rates for this study using a modelling approach based on data from
a meat chicken farm in NSW as well as theoretical considerations.
The approach generates hourly varying emission rates from each shed based on the following factors:
� the total weight of all of birds, which varies later in the batch as harvesting takes place
� ventilation rate, which depends on bird age and ambient temperature
� design and management practices.
Data from an existing farm with tunnel-ventilated sheds and cup drinkers were gathered for chicken
batches between one to eight weeks of age. These samples represent particulate emissions over a full
batch cycle.
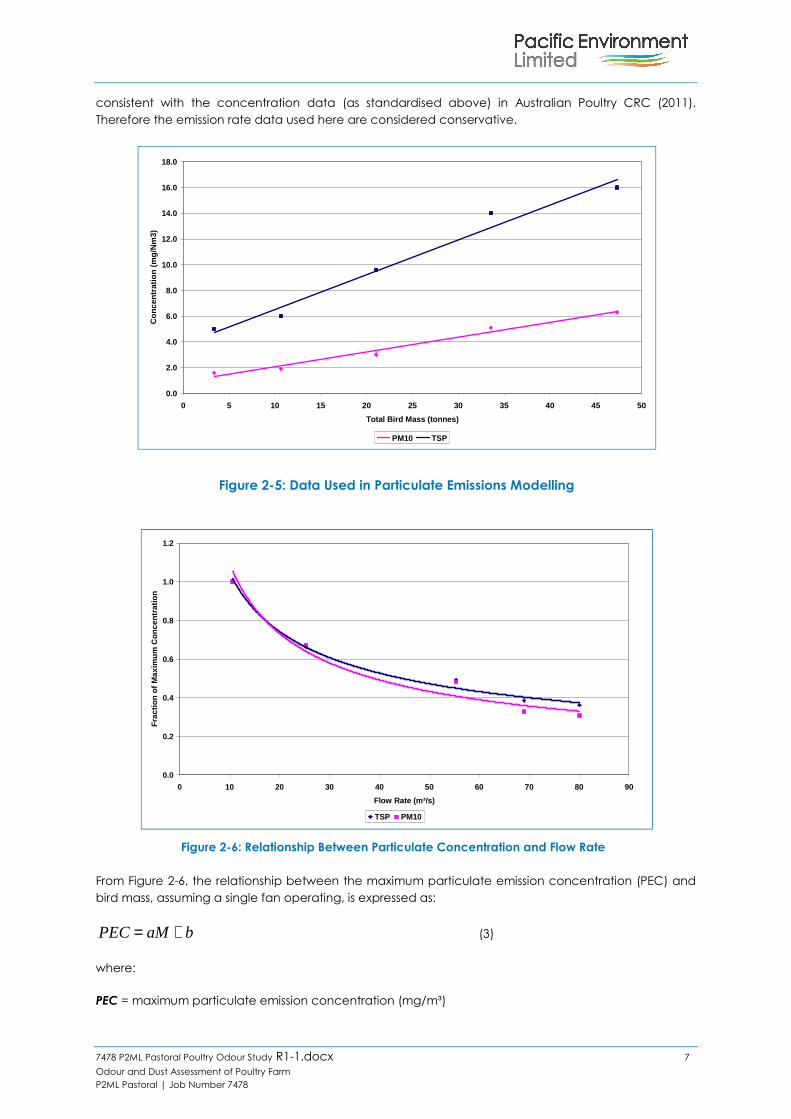
Data from Mirrabooka (2002) were standardised to relate the particulate matter concentration to the
total bird mass at the time of sampling. The resulting relationship is shown in Figure 2-5. The shed
ventilation rate was also related to particulate matter concentration (as a fraction of the maximum)
and is presented in Figure 2-6.
The data were gathered between July and August and therefore may not represent worst case
meteorological conditions. However, Mirrabooka (2002) showed that the emission factors generated
from these data were comparable to Victorian EPA recommended emission rates. More recently in late
2011 Pacific Environment (formerly PAEHolmes) collected PM10 concentration data inside a
Queensland meat chicken shed. We found the dust emission rate for modern sheds when standardised
for bird age and birds present is below that published by Mirrabooka. The more modern data are
7478 P2ML Pastoral Poultry Odour Study R1-1.docx 7
Odour and Dust Assessment of Poultry Farm
P2ML Pastoral | Job Number 7478
consistent with the concentration data (as standardised above) in Australian Poultry CRC (2011).
Therefore the emission rate data used here are considered conservative.
Figure 2-5: Data Used in Particulate Emissions Modelling
Figure 2-6: Relationship Between Particulate Concentration and Flow Rate
From Figure 2-6, the relationship between the maximum particulate emission concentration (PEC) and
bird mass, assuming a single fan operating, is expressed as:
baMPEC += (3)
where:
PEC = maximum particulate emission concentration (mg/m³)
0.0
2.0
4.0
6.0
8.0
10.0
12.0
14.0
16.0
18.0
0 5 10 15 20 25 30 35 40 45 50
Total Bird Mass (tonnes)
Con
cent
ratio
n (m
g/N
m3)
PM10 TSP
0.0
0.2
0.4
0.6
0.8
1.0
1.2
0 10 20 30 40 50 60 70 80 90
Flow Rate (m³/s)
Fra
ctio
n of
Max
imum
Con
cent
ratio
n
TSP PM10
7478 P2ML Pastoral Poultry Odour Study R1-1.docx 8
Odour and Dust Assessment of Poultry Farm
P2ML Pastoral | Job Number 7478
M = Total mass of birds (tonnes)
a = 0.270 for TSP or 0.115 for PM10
b = 0.385 for TSP or 0.917 for PM10
To account for the dilution that occurs under higher flow rates, equation (4) has been taken from Figure
2-6:
)(* dv cVPECPEC = (4)
where:
PECv = particulate emission concentration (mg/m³)
PEC = maximum particulate emission concentration (mg/m³)
V = Ventilation rate (m³/s) and
c = 3.3 for TSP and 4.11 for PM10
d = -0.49 for TSP and –0.58 for PM10
A particulate emission rate (PER) can be calculated by multiplying the PEC by the ventilation rate (V).
The ventilation rate (V) used at any given time is a function of the age of the birds and the ambient
temperature and humidity.
2.4 Meteorological Data Processing
The meteorological data used in the dispersion modelling was processed in two steps. Synoptic scale
meteorological data were first processed in The Air Pollution Model (TAPM) and then further processed
in CALMET to produce the wind field and weather data suitable for dispersion modelling with CALPUFF.
2.4.1 TAPM
TAPM (version 4), is a three dimensional meteorological and air pollution model developed by the
CSIRO Division of Atmospheric Research. Detailed description of the TAPM model is provided in the
TAPM user manual (Hurley P, 2008a). The Technical Paper on TAPM (Hurley P, 2008b) describes technical
details of the model equations, parameterisations, and numerical methods. A summary of some
verification studies using TAPM is also available (Hurley P, 2008c).
TAPM v4 solves the fundamental fluid dynamics and scalar transport equations to predict meteorology
and (optionally) pollutant concentrations. It consists of coupled prognostic meteorological and air
pollution concentration components. The model predicts airflow important to local scale air pollution,
such as sea breezes and terrain induced flows, against a background of larger scale meteorology
provided by synoptic analyses.
We used TAPM-generated upper air data for input to CALMET.
2.4.2 CALMET
CALMET is the meteorological pre-processor to CALPUFF and includes a wind field generator containing
objective analysis and parameterised treatments of slope flows, terrain effects, and terrain blocking
effects. The pre-processor uses the meteorological inputs in combination with land use and geophysical
information for the modelling domain to predict a gridded three dimensional meteorological field

7478 P2ML Pastoral Poultry Odour Study R1-1.docx 9
Odour and Dust Assessment of Poultry Farm
P2ML Pastoral | Job Number 7478
(containing data on wind components, air temperature, relative humidity, mixing height, and other
micro meteorological variables) for the domain used in the CALPUFF dispersion model.
Observed data for the Beaudesert Drumley Street AWS was used as an input into CALMET along with
upper air data generated by TAPM.
2.5 Dispersion Modelling
CALPUFF is a multi layer, multi species, non-steady state puff dispersion model that can simulate the
effects of time and space varying meteorological conditions on pollutant transport, transformation and
removal. The model contains algorithms for near source effects such as building downwash, partial
plume penetration, sub-grid scale interactions as well as longer range effects such as pollutant
removal, chemical transformation, vertical wind shear and coastal interaction effects. The model
employs dispersion equations based on a Gaussian distribution of pollutants across released puffs and
takes into account the complex arrangement of emissions from point, area, volume and line sources.
In addition to the three-dimensional meteorological data output from CALMET; CALPUFF requires the
following input data:
� emission data and plant layout
� receptor information.
CALPUFF is a USEPA regulatory model for long-range transport or for modelling in regions of complex
meteorology. It is the preferred dispersion model for use in coastal and complex terrain situations.
Detailed description of CALPUFF is provided in the user manual (TRC, 2011).
The receptor grid for the dispersion modelling of concentration was, as for the meteorological
modelling, at a grid spacing of approximately 100 m.
Each shed was represented as a pseudo point source on the western side of each shed. The source
diameter and vertical velocity were set as to ensure the momentum of the plume was maintained. The
vertical momentum of the point sources was set to zero by using the ‘rain hat’ switch in CALPUFF. This
switch accounts for the horizontal release of emissions from tunnel-ventilated poultry sheds. It then
removes the need to apply dimensional adjustments to source parameters (i.e., increasing diameter to
achieve minimal exit velocity while conserving volumetric flow rate) to achieve the same end result.

7478 P2ML Pastoral Poultry Odour Study R1-1.docx 10
Odour and Dust Assessment of Poultry Farm
P2ML Pastoral | Job Number 7478
3 IMPACT ASSESSMENT CRITERIA
3.1 Odour Guidelines
The odour criteria in the Queensland Odour Guideline, Guideline on odour impact assessment from
developments, July 2004 (QEPA, 2004) as well as those references in DAFF (2012).
The Queensland Odour Guideline states that for dispersion modelling the inputs of emissions and local
meteorology should be as detailed as possible, reflecting any variation of emissions with time and
including at least a full year of representative hourly meteorological data.
The odour concentrations predicted by the modelling (as detailed in DAFF 2012) at the most exposed
existing or likely future off-site sensitive receptors should be compared with the following guideline
values:
� 1 OU, 1-hour average, 99.5th percentile for non-compatible areas
� 2.5 OU, 1-hour average, 99.5th percentile for rural zones.
Based on the location of the site the appropriate criteria to apply is C99.5 1hr = 2.5 ou at the nearest
receptor.
3.2 Dust
The relevant criteria for PM10 particles is detailed in the EPP (Air) Policy 2008 (OQPC, 2012) and is 50
µg/m3 on a 24 hour average which can be exceeded only 5 days per year.
7478 P2ML Pastoral Poultry Odour Study R1-1.docx 11
Odour and Dust Assessment of Poultry Farm
P2ML Pastoral | Job Number 7478
4 METEOROLOGICAL DATA USED IN THE ASSESSMENT
The primary meteorological parameters involved in modelling plume dispersion from poultry sheds are
wind direction, wind speed, turbulence (atmospheric stability) and mixing height (depth of turbulent
layer). The meteorological data used in the dispersion modelling are evaluated below.
4.1 Wind
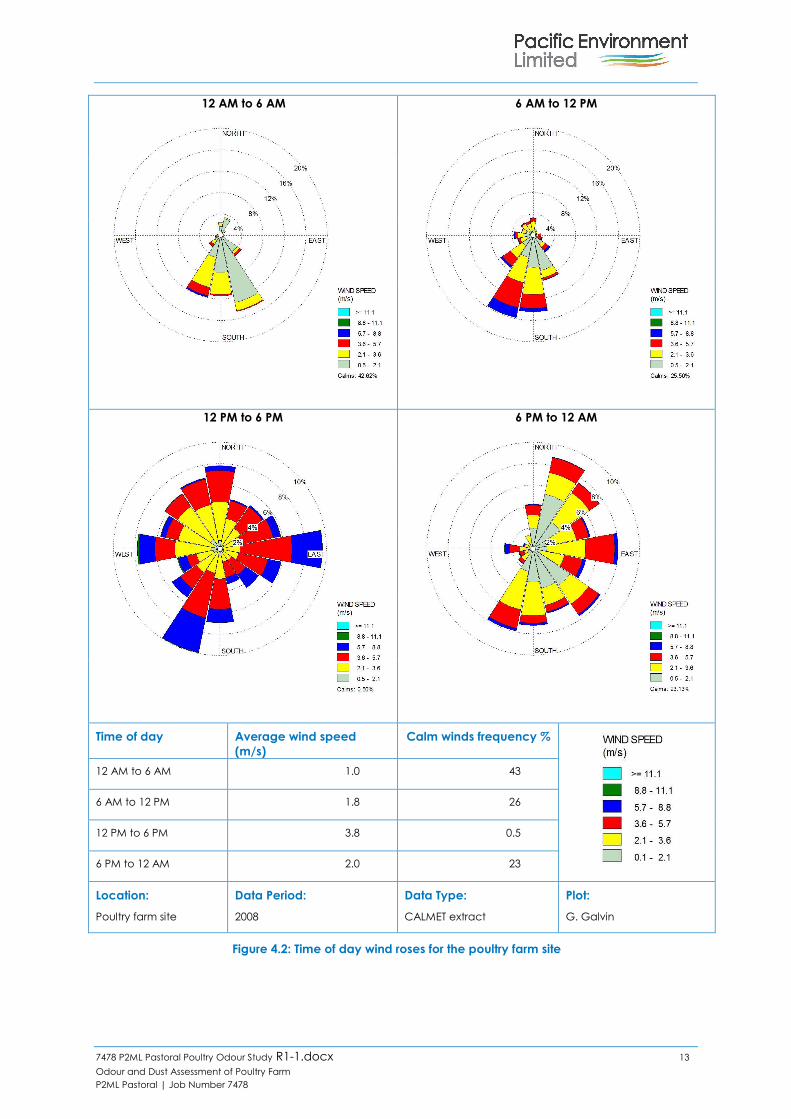
The wind roses show the frequency of occurrence of winds by direction and strength. The bars
correspond to the 16 compass points (north, north-north-east, north-east etc). The bar at the top of
each wind rose diagram represents winds blowing from the north (i.e. northerly winds), and so on. The
length of the bar represents the frequency of occurrence of winds from that direction, and the colour
and width of the bar sections correspond to wind speed categories, as per the legend. Thus it is
possible to visualise how often winds of a certain direction and strength occur over any period of time.
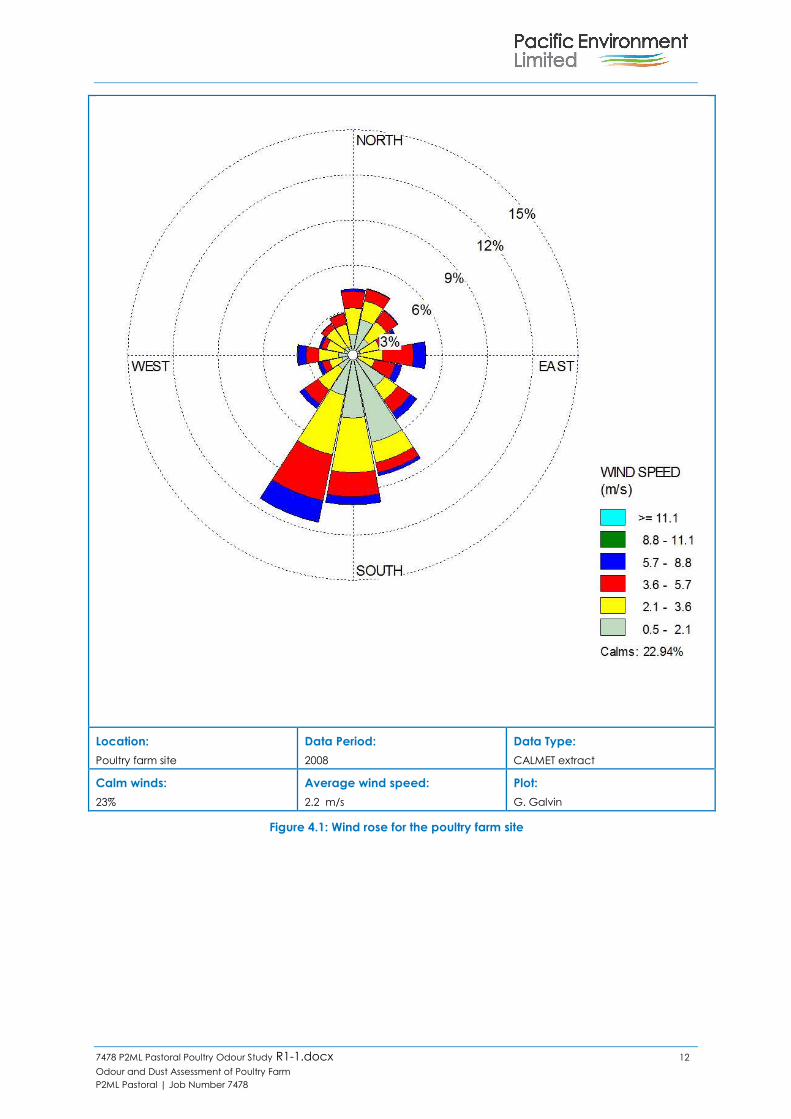
The wind roses plotted from data extracted from CALMET is presented in Figure 4.1 and Figure 4.2. The
annual wind rose (Figure 4.1) shows that the prevailing wind direction is southerly which is typical of the
area. Overall the wind roses show a high frequency of calm to light winds with light winds (up to 3 m/s)
occurring 68% of the time. The number of calms reported below is a function of the stall speed of the
observed data taken from the Beaudesert station. The high frequency of light winds would lead to a
conservative estimate of impacts. Further information on weather station data sourced from the Bureau
of Meteorology can be found in Starke et. al. (2009).
7478 P2ML Pastoral Poultry Odour Study R1-1.docx 12
Odour and Dust Assessment of Poultry Farm
P2ML Pastoral | Job Number 7478
Location:
Poultry farm site
Data Period:
2008
Data Type:
CALMET extract
Calm winds:
23%
Average wind speed:
2.2 m/s
Plot:
G. Galvin
Figure 4.1: Wind rose for the poultry farm site
7478 P2ML Pastoral Poultry Odour Study R1-1.docx 13
Odour and Dust Assessment of Poultry Farm
P2ML Pastoral | Job Number 7478
12 AM to 6 AM
6 AM to 12 PM
12 PM to 6 PM
6 PM to 12 AM
Time of day Average wind speed
(m/s)
Calm winds frequency %
12 AM to 6 AM 1.0 43
6 AM to 12 PM 1.8 26
12 PM to 6 PM 3.8 0.5
6 PM to 12 AM 2.0 23
Location:
Poultry farm site
Data Period:
2008
Data Type:
CALMET extract
Plot:
G. Galvin
Figure 4.2: Time of day wind roses for the poultry farm site
7478 P2ML Pastoral Poultry Odour Study R1-1.docx 14
Odour and Dust Assessment of Poultry Farm
P2ML Pastoral | Job Number 7478
4.2 Stability
Atmospheric turbulence is an important factor in plume dispersion. Turbulence acts to increase the
cross-sectional area of the plume due to random motions, thus diluting or diffusing a plume. As
turbulence increases, the rate of plume dilution or diffusion increases. Weak turbulence limits plume
diffusion and is a critical factor in causing high plume concentrations downwind of a source,
particularly when combined with very low wind speeds.
Turbulence is related to the vertical temperature gradient, the condition of which determines what is
known as stability, or thermal stability. For traditional dispersion modelling using Gaussian plume models,
categories of atmospheric stability are used in conjunction with other meteorological data to describe
atmospheric conditions and thus dispersion.
The most well-known stability classification is the Pasquill-Gifford schemed , which denotes stability
classes from A to F. Class A is described as highly unstable and occurs in association with strong surface
heating and light winds, leading to intense convective turbulence and much enhanced plume dilution.
At the other extreme, class F denotes very stable conditions associated with strong temperature
inversions and light winds, which commonly occur under clear skies at night and in early mornings.
Under these conditions plumes can remain relatively undiluted for considerable distances downwind.
Intermediate stability classes grade from moderately unstable (B), through neutral (D) to slightly stable
(E). Whilst classes A and F are strongly associated with clear skies, class D is linked to windy and/or
cloudy weather, and short periods around sunset and sunrise when surface heating or cooling is small.
As a general rule, unstable (or convective) conditions dominate during the daytime and stable flows
are dominant at night. This diurnal pattern is most pronounced when there is relatively little cloud cover
and light to moderate winds.
The frequency distributions of stability classes in the CALMET meteorological file are presented in Figure
4.3. The data shows a typical frequency (49%) occurrence of E and F class stability for inland locations.
d A more accurate turbulence scheme within CALPUFF, based on micrometeorological parameters
was used for the modelling.

7478 P2ML Pastoral Poultry Odour Study R1-1.docx 15
Odour and Dust Assessment of Poultry Farm
P2ML Pastoral | Job Number 7478
Figure 4.3: Frequency distribution of the estimated stability classes at the poultry farm site
4.3 Mixing Height
Mixing height is the depth of the atmospheric mixing layer beneath an elevated temperature inversion.
It is an important parameter in air pollution meteorology as vertical diffusion or mixing of a plume is
generally considered to be limited by the mixing height. This is because the air above this layer tends to
be stable, with restricted vertical motions.
The estimated diurnal variation of mixing height at the site is presented in Figure 4.4. The diurnal cycle is
clear in this figure. At night, mixing height is normally relatively low. After sunrise, it increases in response
to convective mixing due to solar heating of the earth’s surface. The estimated mixing height behaviour
is consistent with expectations.

7478 P2ML Pastoral Poultry Odour Study R1-1.docx 16
Odour and Dust Assessment of Poultry Farm
P2ML Pastoral | Job Number 7478
Figure 4.4: Estimated mixing heights at the poultry farm site
7478 P2ML Pastoral Poultry Odour Study R1-1.docx 17
Odour and Dust Assessment of Poultry Farm
P2ML Pastoral | Job Number 7478
5 RESULTS
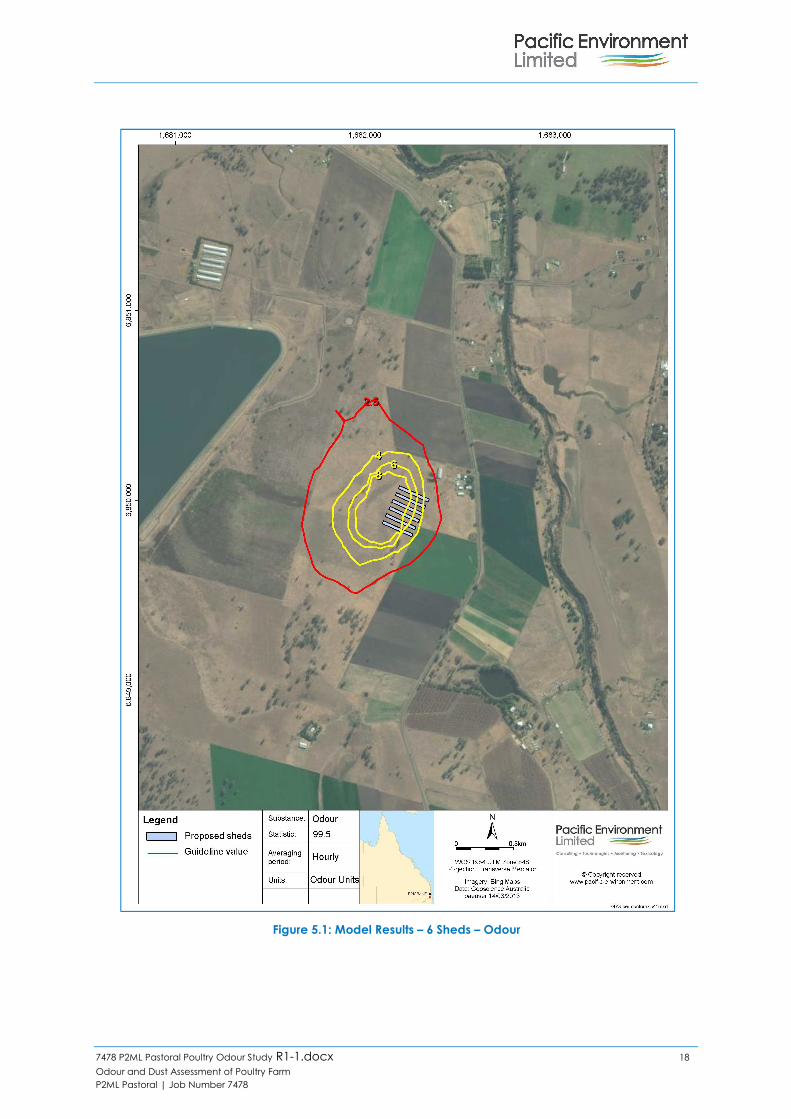
The results of the modelling are shown below. Figure 5.1 shows the model output for the proposed with
a K factor of 2.2. The modelling shows that the C99.5 1hr = 2.5ou criterion is not expected to be exceeded
at any of the receptors shown in Figure: 1.1.
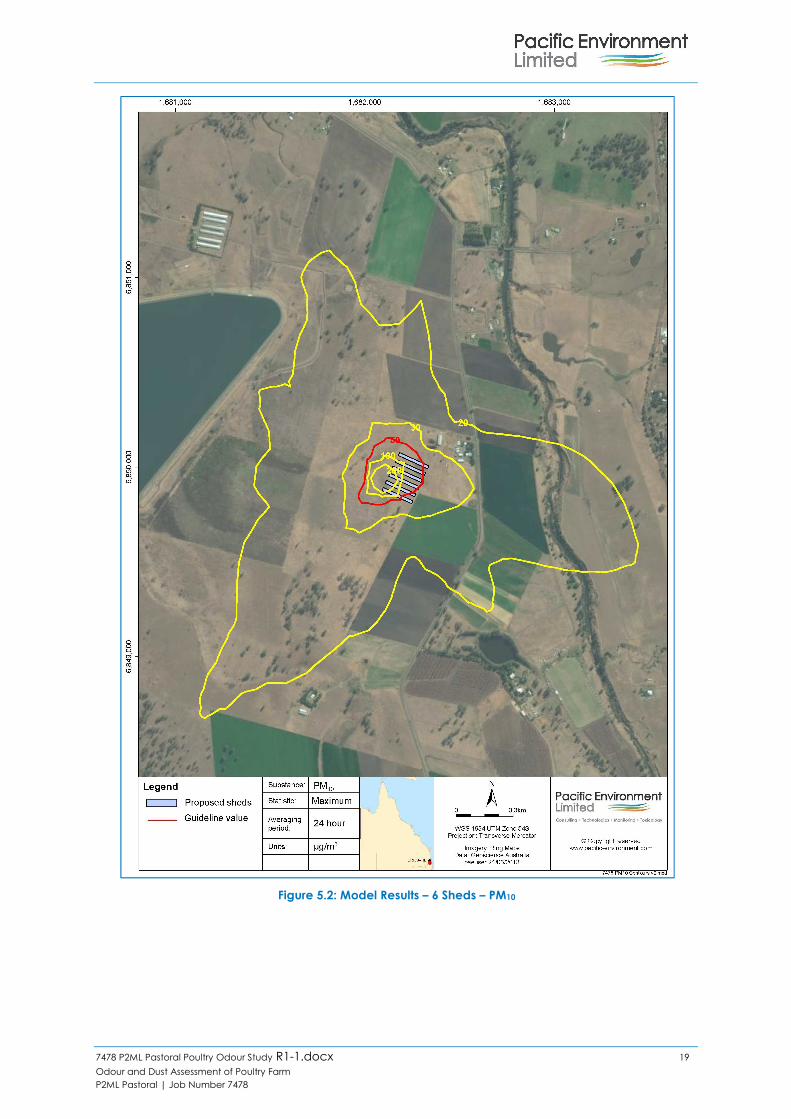
Figure 5.2 shows the model output for PM10 for the proposed 6 shed farm. A background PM10
concentration of 16 µg/m3 has been adopted. This value is the 70th percentile from the Flinders View
monitoring station for 2008. Data from the dataset used to calculate the background value was
excluded as follows:
� When winds blew from 90-110 degrees (to exclude PM10 emissions from the Swanbank Power
Station impacting the observations).
� Data on 28 April 2008 and 16 September 2008. On these days, severe dust storms occurred.
The PM10 criterion was not exceeded at any of the nearby sensitive receptors. Moreover, even if a
higher background value were to be used, the criterion would not be exceeded at any of the nearby
sensitive receptors.
7478 P2ML Pastoral Poultry Odour Study R1-1.docx 18
Odour and Dust Assessment of Poultry Farm
P2ML Pastoral | Job Number 7478
Figure 5.1: Model Results – 6 Sheds – Odour
7478 P2ML Pastoral Poultry Odour Study R1-1.docx 19
Odour and Dust Assessment of Poultry Farm
P2ML Pastoral | Job Number 7478
Figure 5.2: Model Results – 6 Sheds – PM10

7478 P2ML Pastoral Poultry Odour Study R1-1.docx 20
Odour and Dust Assessment of Poultry Farm
P2ML Pastoral | Job Number 7478
6 CONCLUSIONS
Dispersion modelling of predicted odour and dust emissions from the proposed meat chicken farm has
indicated that odour and dust levels at the nearest sensitive receivers will be well within the
Queensland criteria.
For these results to be valid, it is essential that the farm be run in accordance with best management
practices, as detailed in the existing or future versions of Queensland Guidelines Meat Chicken Farms
(DAFF, 2012). Any relaxation of these practices may result in increased impacts in the surrounding
environment.
7478 P2ML Pastoral Poultry Odour Study R1-1.docx 21
Odour and Dust Assessment of Poultry Farm
P2ML Pastoral | Job Number 7478
7 REFERENCES
Australian Poultry CRC, 2011. Dust and odour emissions from meat chicken sheds, Armidale: Australian
Poultry CRC.
DAFF, 2012. Queensland Guidelines Meat Chicken Farms, Brisbane: Department of Agriculture, Fisheries
and Forestry, State of Queensland.
Gallagher, E. & Brown, G., 2012. Odour emissions and nutrient accumulation on free range meat
chicken farms in Queensland. Gold Coast, Poultry Information Exchange .
Hurley P, 2008a. TAPM V4 User Manual - CSIRO Marine and Atmospheric Research Internal Report No.5
Aspendale, Victoria: CSIRO Marine and Atmospheric Research, s.l.: s.n.
Hurley P, 2008b. TAPM V4 Part 1: Technical Description - CSIRO Marine and Atmospheric Research
Paper No. 25 Aspendale, Victoria: CSIRO Marine and Atmospheric REsearch, s.l.: s.n.
Hurley P, 2008c. TAPM V4 Part 2: Summary of Some Verification Studies - CSIRO Marine and Atmospheric
Research Paper No. 26 Aspendale, Victoria: CSIRO Marine and Atmospheric Research, s.l.: s.n.
Mirrabooka, 2002. "Silverweir" Broiler Farm Development Approval Application, Air Quality Impact
Assessment, Brisbane: Mirrabooka Consulting.
OQPC, 2012. Environmental Protection (Air) Policy 2008 Reprint No. 1A. Brisbane: Office of the
Queensland Parliamentary Counsel.
Ormerod, R. & Holmes, G., 2005. Description of PAE Meat Chicken Farm Odour Emissions Model,
Brisbane: Pacific Air & Environment.
PAEHolmes, 2011. Best Practice Guidance for the Queensland Poultry Industry - Plume Dispersion
Modelling and Meteorological Processing, Bribane: PAEHolmes .
QEPA, 2004. Guideline: Odour Impact Assessment from Developments, Brisbane: State of Queensland.
Starke, G., D'Abreton, P., Ormerod, R. & Galvin, G., 2009. Bureau of meteorlogy Data Collection
Methods: Are they adequate for dispersion modelling?. Perth, CASANZ.
TRC, 2011. CALPUFF Version 6 User Instructions. April 2011, Lowell, MA, USA: TRC.