report no. 21021 -vn vietnam managing public resources …
TRANSCRIPT

Report No. 21021 -VN
VietnamManaging Public Resources BetterPublic Expenditure Review 2000
(In Two Volumes) Volume 1: Main Report
December 13, 2000
Poverty Reduction and Economic Management UnitEast Asia and Pacific Region
Document of the World Bank
Pub
lic D
iscl
osur
e A
utho
rized
Pub
lic D
iscl
osur
e A
utho
rized
Pub
lic D
iscl
osur
e A
utho
rized
Pub
lic D
iscl
osur
e A
utho
rized

Vice President :Jemal-ud-din KassumSector Director : Homi KharasTask Manager : David Shand

Acknowledgements
The Vietnam Public Expenditure Review (PER) 2000 was prepared by a joint Government-donor working group, with contributions by several other people, including an NGO. The initialdraft of the main report was discussed at the Mid-Year Meeting of the Consultative Group inDalat, June 22-23, 2000. The final report reflects comments received from donors andGovernment agencies.
Throughout the process, the working group works closely with Mr. Do Hoang Tuan, DeputyDirector, State Budget Department of the Ministry of Finance (MOF) and the Government teamcomprised of representatives from other departments of MOF, from the Ministry of Planning andInvestment, from sector ministries like Ministry of Education and Training (MOET), Ministry ofHealth (MOH), Ministry of Agriculture and Rural Development (MARD), and Ministry ofTransport (MOT). The donor team -- staff and consultants from the World Bank, IMF, UNDP,Denmark, Netherlands and the United Kingdom -- led by Mr. David Shand, worked closelywith Mr. Kazi Matin (Lead Economist, Vietnam). The drafts of concept paper and the draftreports of four sectors as well as those of the cross-cutting themes were discussed in meetingswhere all donors as well as the NGO resource-center were invited at three different stages sinceNovember 1999. The team would like to express its gratitude to various governmnent agenciesand provincial authorities for their support and cooperation throughout the PER process. Theteam would also like to thank Mr. Andrew Steer (Director, Vietnam Program, World Bank), Mr.Homi Kharas (Director, Poverty Reduction and Economic Management, East Asia and PacificRegion), and Ms. Barbara Nunberg (Lead Specialist in Public Sector Management, East Asia andPacific Region), for providing ideas and advise during the preparation of the report.
Team Managers: Mr. Nguyen Cong Nhiep, Mr. David Shand
Lead Advisor: Mr. Vinaya Swaroop
Coordinators: Mr. Do Hoang Anh Tuan, Mr. Nguyen Van Minh
Members of the PER teams included the following:
(i) Government Team: Mr. Nguyen Cong Nghiep, Mr. Do Hoang Anh Tuan, Ms. Truong ThaiPhuong, Ms. Tran Thu Ha, Ms. Tran Kim Hien, Mr. Nguyen Truong Giang, Ms. Do Thuy Hang,Mr. Lai Van Duong, Mr. Ngo Huu Loi, Ms. Nguyen Lan Huong, Mr. Do Viet Duc, Ms. Le ThiHong Sinh, Mr. Vu Duc Hiep (MOF); Mr. Nguyen Buu Quyen, Mr. Nguyen Tu Nhat, Mr. TrinhNhu Phuc, Mr. Le Van Xuan (MPI); Mr. Nguyen Van Hung, Mr. Vu Xuan Cuu (MOT); Ms.Phan Ngoc Thuy (MARD) ; Mr. Vuong Doan Quan (MOET); Mr. Nguyen Nam Lien (Ministryof Health).
(ii) Donor Team: Mr. David Shand (Task Manager), Mr. Vinaya Swaroop (Lead Advisor), Mr.Peter Brooke, Mr. Perran Penrose, Ms. Nguyen Nguyet Nga (Education), Mr. Anil Deolikar, Mr.Nguyen Van Minh (Health), Mr. Francesco Golleti, Ms. Mylene Kherallah, Mr. Nguyen CongChuc, (Agriculture), Mr. Dieter Havlichek, Ms. Nguyen Thi Thanh Hang, Ms. Duong Thi ThanhMai (Transport), Mr. Haroon Akram Lodhi, Mr. Jaki Desai, Ms. Tran Thi Que (gender), Mr.Nguyen Dam, Mr. Brian Van Arkadie (expenditure processes and PIP), Mr. Govinda Rao(decentralization), Ms. Carolyn Turk, Mr. Vu Xuan Dao, Mr. Nguyen Dinh Huan, Mr. Bertrandde Hartingh (voluntary contributions), Mr. David Cowan, Mr. Feridoun Sarraf, Mr. MurrayPetrie (fiscal sustainability and transparency).

Vietnam Public Expenditure Review 2000
Other participants from donors and NGOs: Mr. Torben Bellers (Danish Embassy), Mr. AlanJohnson, Mr. Peter Balacs (Dfid); Mr. Dennis de Tray, (IMF); Ms. Ellen Berends, Ms. ElsKlinkert (Netherlands Embassy); Ms. Anne-Isabelle Blateau, Mr. Trinh Tien Dung, Mr.Emmanuel Cuvillier (UNDP); Mr. Pham Van Ngoc (ActionAid).
Other Contributors: Mr. Christopher Shaw, Ms. Mai Thi Thanh, Mr. Christopher Gibbs, Ms.Tran Thi Minh Phuong, Ms. Nguyen Thi Mai and others.
Peer Reviewers: Mr. Charles Humphreys, Mr. Kyle Peters (World Bank)
Other Support: Ms. Hang Thu Nguyen, Ms. Phuong Anh Vu Tran, Ms. Giang Thi HuongNguyen, Ms. Van Thi Hong Do, Ms. Ha Thanh Hoang, Ms. Chi Kim Tran (World Bank)
Participants at Various Consultations on PER-drafts:
Transport Sector: Mr. Nguyen Viet Tien, Vice Minister of MOT, Ms. Nguyen Thi Thanh Hang,Ms. Ha Khac Hao, Mr. Nguyen Van Hung, Ms. Dang Thi Hoc, Mr. Tran Ba Nghiep, Ms.Nguyen Thuy Ha (Ministry of Transport); Mr. Nguyen Van Thuc, Mr. Lai Van Duong, Ms.Nguyen Thi Nhuan, Mr. Tran Viet Hung (Ministry of Finance); Mr. Vu Van Huy, Mr. Do QuocBinh, Mr. Trinh Nhu Phuc (Ministry of Planning and Investment); Ms. Duong Thi Thanh Mai(National Economic University); Ms. Tran Thi Que; Mr. Haroon Akram Lodhi (Netherlands),Mr. Kazi M. Matin, Mr. Nguyen Van Minh, Ms. Tran Thi Minh Phuong (World Bank); Mr.Trinh Tien Dung (UNDP), Emmanuel Cuvillier, Mr. Hoang Van Hai (UNDP Project VIE96/028); Mr. Steve Ray (Dfid).
Agriculture Sector: Mr. Cao Duc Phat, Vice Minister of MARD, Mr. Vu Van Dong, Ms. NguyenThi Hai (Ministry of Finance); Mr. Dao Trong Tu, Mr. Phan Duy Tam, Mr. Phan Van Quan, Ms.Phan Ngoc Thuy, Mr. Nguyen Van Than (Ministry of Agriculture & Rural Development); Ms.Le Thi Thong, Mr. Nguyen Van Doan (Ministry of Planning & Investment); Mr. David Shand,Mr. Francesco Golleti, Mr. Kazi M. Matin, Mr. Nguyen Van Minh, Mr. Vinaya Swaroop, Mr.Jaikishan Desai (World Bank); Mr. Emmanuel Cuvillier (UNDP); Mr. Hoang Van Hai (VIE96/028); Mr. Henning Nohr, Mr. Morten Boye Hansen (Danish Embassy); Ms. Els Klinkert, Ms.Tran Thi Que (Netherlands Embassy); Mr. Steve Ray (Dfid).
Health Sector: Ms. Phan Thi Cuc, Ms. Nguyen Lan Huong, Ms. Nguyen Thi Nhuan, Ms. DoThuy Hang, Mr. Tran Viet Hung (Ministry of Finance); Mr. Nguyen Dinh Khuong, Mr. NguyenNam Lien, Mr. Le Van Quan, Mr. Truong Viet Dung, Mr. Nghiem Tran Dung, Mr. Nguyen VanDuy, Ms. Vuong Thi Lua (Ministry of Health); Ms. Hoang Kim Thoa, Ms. Tran Kim Nguyen(Ministry of Planning and Investment); Mr. Anil Deolalikar, Mr. Kazi M. Matin, Mr. NguyenVan Minh (World Bank); Ms. Els Klinkert (Netherlands Embassy); Mr. Emmanuel Cuvillier(UNDP Project VIE 96/028).
Education Sector: Ms. Le Thi Hong Sinh, Mr. Tran Viet Hung (Ministry of Finance); Mr. DuongDuc Lan, Mr. Vuong Doan Quan, Mr. Nguyen Dang Thin, Mr. Nguyen Duc Chinh, Mr. KieuDuc Thanh (Ministry of Education and Training); Mr. Peter Brooke, Mr. Christopher Shaw, Mr.Nguyen Van Minh, Ms. Mai Thi Thanh (World Bank); Ms. Nguyen Thi Hue (Dfid).
Budget Process: Mr. Do Hoang Anh Tuan, Mr. Pham Tuan Dat, Mr. Ngo Huu Loi, Ms. DuongQuynh Le, Mr. Tran Sy Thanh, Mr. Bui Anh Binh, Mr. Do Viet Duc, Ms. Phan Thi Cuc, Mr.Dang Van Thanh (Ministry of Finance); Mr. Le Van Xuan, Mr. Nguyen Tu Nhat (Ministry ofPlanning & Investment); Mr. David Shand, Mr. Kazi Matin, Mr. Nguyen Van Minh, Mr.Jaikishan Desai, Mr. Vinaya Swaroop, Mr. Peter Brooke (World Bank); Mr. Haroon Akram

Lodhi (Netherlands); Mr. Emmanuel Cuviller, Mr. Hoang Van Hai (VIE 96/028); Mr. JohanFredriksson, Mr. Trinh Tien Dung, (UNDP); Mr. Dennis de Tray (IMF); Mr. Torben Bellers, Ms.Elisabeth Carlsson, Ms. Tran Thi Que; Ms. Nguyen Nu Hoai Van (Netherlands Embassy).
Fiscal Sustainability & Transparency: Mr. Do Hoang Anh Tuan, Mr. Dang Van Thanh, Mr. BuiAnh Binh, Mr. Nguyen Van Nghia, Mr. Do Viet Duc, Mr. Pham Tuan Dat, Mr. Hoang NguyenHoc, Ms. Phamn Thi Tuat, Ms. Nguyen Thi Yen, Ms. Nguyen Anh Van (Ministry of Finance);Ms. Vu Phuong Lien (State Bank of Vietnam); Mr. Bui Duc Thu (National Assembly); Mr.David Shand, Mr. Kazi Matin, Mr. Nguyen Van Minh, (World Bank); Mr. Haroon Akram Lodhi(Netherlands); Mr. Dennis de Tray, Ms. Ha Thi Kim Nga (IMF); Mr. Emmanuel Cuviller, Mr.Johan Fredriksson (UNDP); Mr. Louise Andersen, Ms. Anette Aarestrup (Danish Embassy); Mr.Trinh Quoc Cuong (Dfid); Ms. Tran Thi Que (Netherlands Embassy).


TABLE OF CONTENTS
CURRENCY EQUIVALENTS ................................................................ I
EXECUTIVE SUMMARY ............................................................... I
CHAPTER I ................................................................ 1
FISCAL SUSTAINABILITY AND TRANSPARENCY .............................................................1
Current situation ................................................................ 1Potential risks to fiscal sustainability ................................................................ 2A medium term fiscal outlook ................................................................ 7Fiscal transparency ................................................................ 7
CHAPTER 2 ............................................................... 12
BUDGETING AND PUBLIC EXPENDITURE MANAGEMENT ............................................ 12
General Position ............................................................... 12Improving expenditure prioritization ............................................................... 13Review of expenditure norms ............................................................... 16Improving the public investment plan (PIP) process ........................................................... 17Improving budget implementation and monitoring .............................................................. 17Fiscal decentralization and public spending ............................................................... 19Local fees and contributions ............................................................... 21
CHAPTER 3 ............................................................... 23
INTER AND INTRA-SECTORAL COMPOSITION OF EXPENDITURES 23Coverage of the PER Data ........................................................... 23Allocation decisions ........................................................... 23Redistributive role of public expenditure ........................................................... 29Gender Issues in public expenditures ........................................................... 31Agriculture Sector ........................................................... 34Health sector ........................................................... 43Education sector ........................................................... 52
Tables:
Table 1.1: Government Budget (percent of GDP) ........................................................... 1Table 3-1-A: Budget expenditure by economic types and by sector, by central and localgovernm ent 1997 .......................................................... 27Table 3-1-B: Budget expenditure by economic types and by sector, by central and localovernment 1998 .......................................................... 28Table 3.2. Public Expenditures In Agriculture .......................................................... 35Table 3.3 Capital and current expenditures by agriculture sub-sector 1997-1998 ............. 36Table 3.4: Budget support to SOEs (in million VND) ........................................................ 41

Table 3.5 Informnation on agricultural SOEs owned by the central government ................ 42Table 3.6: Gross and net enrolment ratios ..................... .................................. 53Table 3.7: Attainment test in mathematics and language (in %) ......................................... 54Table 3.8: Growth of public expenditure on education ..................................................... 54Table 3.9 International comparison of education expenditure ............................................ 55Table 3.10: Sub-sectoral percent shares of education expenditure (%) .............................. 56Table 3.11: Regional differences in average school expenditure ........................................ 58Table 3.12: Shares of expenditure in total expenditure (in %) ............................................ 59Table 3.13: State transport expenditures (in %) ....................................................... 65Table 3.14: State transport spending by mode, locality and spending category (in billionVND)* ....................................................... 65Table 3.15 : Social Subsidies ....................................................... 72
Boxes:Box 1.1: Fiscal Costs of SOE and Banking Reformn ....................................................... 3Box 1.2. Assessing fiscal sustainability in Vietnam ...................................................... 6Box 1.3: Recent Measures to Improve Transparency ...................................................... 8Box 2.1: The budgetary process in Vietnam ...................................................... 13Box 2.2: Better integrating the capital and recurrent budgets ............................................ 14Box 2.3: Medium-tern planning and budgeting ....................................................... 16Box 3.1: Evaluating Public Expenditure Program ...................................................... 25Box 3.2: Broad Strategy for Future Spending ...................................................... 71
Figures:Figure 3.1: Decision Tree for Evaluating Public Programs ................................................. 25Figure 3.2. Inter-sectoral composition of public expenditures ............................................ 26Figure 3.3: Lorenz curve for public spending on education, health and householdconsumption, 1998 ....................................................... 29Figure 3.4: Per capita Agric Spending vs. Per capita AG GDP by province, 1998 (VND'000) ....................................................... 37Figure 3.5: Total Public Spending on Health, Vietnam, 1991-98 ...................................... 46Figure 3.6: Persons per hospital bed, selected Asian countries, 1995 ................................. 47

CURRENCY EQUIVALENTSCURRENCY UNIT = DONG
US$ = 14459 DONG (November 2000)
Government Fiscal YearJanuary 1 to December 31
Abbreviations
ADB Asian Development BankAFTA Asian Free Trade AreaAMC Asset Management CompanyBOT Build - Operation - Transfer
CG Consultative GroupDANIDA Danish International Development AgencyDFID Department for International DevelopmentFAO Food and Agriculture OrganizationFDI Foreign Direct InvestmentFTE Full Time EquivalentGCOP Government Committee for Organization and PersonnelGDP Gross Domestic ProductGER Gross Enrolment RatioGFS Government Financial StatisticsGNP Gross National ProductGOV Government of VietnamGSO General Statistics OfficeGTD General Taxation DepartmentHCMC Hochiminh CityHEPR Hunger Eradication and Poverty ReductionIMCs Irrigation Management CompaniesIMF International Monetary FundIUD Intrauterine DeviceJICA Japan International Cooperation AgencyLSMS Living Standard Measurement SurveyLSS Lower secondaryMARD Ministry of Agriculture and Rural DevelopmentMCTPC Ministry of Communication, Transport, Post and ConstructionMICT Manila International Container TerminalMIS Management Information SystemMOF Ministry of FinanceMOH Ministry of HealthMOLISA Ministry of Labor, Invalids and Social Affairs

MOT Ministry of TransportMOTE Ministry of Education and TrainingMPI Ministry of Planning and InvestmentMTEF Medium term expenditure frameworkMVUC Motor Vehicle User ChargeNCFAW National Committee For the Advancement of WomenNCPFP National Committee of Population and Family PlanningNER Net Enrolment RatioNFEP National Fund for Employment PromotionNGO Non-government OrganizationNPL Non-Performing LoansNTPE National Target Program on EmploymentO&M Operations and MaintenanceODA Official Development AssistantPER Public Expenditure ReviewPHP Phillipine PesosPIP Public Investment ProgramPPA Phillipine Ports AuthorityPPC Province People's CommitteePTR Pupil Teacher RatioSBV State Bank of VietnamSDI Strategic Development InstituteSEC Securities and Exchange CommissionSMEs Small and medium-scale private enterprisesSOE State-Owned EnterpriseSSR Staff Student RatioT.B TuberculosisUNDP United Nations Development ProgrammeUNICEF United Nation Children's FundUSS Upper secondaryVAT Value Added TaxVHI Vietnam Health InsuranceVHIA Vietnam Health Insurance AuthorityVHSR Vietnam Health Sector ReviewVICT Vietnam International Container TerminalVITRANSS Vietnam Transport Sector StudyVLSS Vietnam Living Standards SurveyVR Vietnam RailwayVRA Vietnam Road AdministrationVSI Vietnam Social InsuranceVTET Vocational Technical Education and TrainingVWU Vietnam Women's Union

Executive Summary
EXECUTIVE SUMMARY
1. This Public Expenditure Review (PER), prepared jointly by the Government of Vietnamand donors, examines Vietnam's public expenditure policy and management and proposes waysof improving the results of its public spending program. The report examines cross-cuttingissues-fiscal sustainability and transparency, expenditure management processes, fiscaldecentralization-and analyzes public spending on agriculture, health, education, and transportfrom the perspective of growth, poverty reduction, and gender equity.
2. The report identifies six important areas requiring action:
* Reversing the Government's declining revenue share in GDP and developing amedium-term fiscal outlook,
* Improving budgetary data and increasing the transparency of data and informationflows,
* Ensuring an effective process for prioritizing public expenditures.
* Enhancing "pro-poor" bias of public expenditures.
* Reallocating spending within sectors to improve sector outcomes
* Assessing where services can be provided by private sector to reduce budgetaryburden.
The report's findings reflect a situation which applies in many countries, including those at muchhigher levels of economic development and income than Vietnam. For a country at Vietnam'sstage of development, its system of public expenditure management appears to operate well.
3. This PER represents another step in the Government's ongoing efforts to increase fiscaltransparency and improve public expenditure management and policy. Time did not permit allrelevant issues to be examined or policy suggestions to be made on all the issues that wereanalyzed. The report should therefore be seen as an important part of an ongoing process, withdiscussions and work continuing in the coming months.
4. The report was prepared in a participatory and consultative manner, with stakeholdersparticipating throughout the process. Participants included not only the Ministries of Finance(MOF), Planning and Investment (MPI), Education and Training, Health, Transport, andAgriculture and Rural Development but also provincial authorities; donors, such as DFID,DANIDA, the Government of the Netherlands, the U7NDP, and the IMF; and NGOs, such asAction Aid. Consultative sessions with sector ministries and donors were held at various stagesof the process, and workshops were held in Hanoi and Ho Chi Minh City.
5. The report's findings and recommendations should help the Government and donorsbetter understand how well Vietnam's public expenditure management system encourages theeffective use of public resources and ensures that inter and intra-sectoral spending is consistentwith the Government's stated development objectives. The findings and recornmendationsshould help policymakers assess whether Vietnam can move from a project approach to aprogrammatic approach to foreign assistance in any of the four sectors examined, and if so howit could do so. The report could also help the Government prepare the future state budgets.
i

Vietnam Public Expenditure Review 2000
develop the new five-year plan (including the Public Investment Program [PIP]), and revise theBudget Law.
6. For the Government, the next steps will be to adopt measures that have been wellspecified in the PER, initiate additional follow-up work to develop specific measures wherefindings warrant such work, and analyze issues not examined in this PER. For donors the nextsteps will be to assess the report's implications for their assistance to Vietnam and coordinatetechnical assistance for implementing its recommendation.
CONSTRAINTS TO GROWTH AND THE CHALLENGES FACING VIETNAM
7. High growth has helped reduce poverty... In recent years Vietnam has been one of the10 fastest-growing economies in the world, with annual growth averaging an exceptional 8.5percent between 1992 and 1997. This high rate of growth-the result of the introduction of theeconomic reform process (doi moi) in the late 1980s-helped dramatically reduce poverty, whichfell from 58 percent in 1992 to 37 percent in 1997.
8. ... but annual growth has slowed since 1998, falling to about 5 percent in 1999.Growth in nonagricultural production and investment, especially foreign investment, hasslumped, and unemployment has risen. While the downturn in growth partly reflects the effect ofthe regional economic crisis, insufficient competitiveness and efficiency in the Vietnameseeconomy has hindered the resumption of higher growth. The decline in growth makes increasingthe effectiveness of public expenditure policies and management all the more important.
9. In November 1999 the Prime Minister identified several constraints on faster economicgrowth and poverty reduction: the poor performance by and need for fiscal support to state-owned enterprises, inadequate sectoral policies and inappropriate investment choices, the gapbetween policy and implementation, and the need for better targeting of public spending on thepoor. This PER confirms that these problems are hampering efforts to move to sustainedeconomic growth and poverty reduction.
REVERSING DECLINING REVENUE AND DEVELOPING A MEDIUM-TERMFISCAL OUTLOOK
10. Revenues have declined... Revenue as a share of GDP has fallen by 3-4 percent of GDP.Most of the decline occurred in 1998 and 1999 and was caused by the decline in corporateincome tax collections-the result of a slowing economy, flagging enterprise performance andweakness in tax administration. Given current policies the decline is projected to continue in2000 and beyond.
11. ... and total expenditures have fallen. Public spending as a share of GDP has fallen byabout 4 percent of GDP since 1998. While this fiscal restraint is commendable, further cuts inpublic spending may underrnine the Government's efforts to reduce poverty. Most of the declinein spending has been in nonwage spending in economic services, general administration, andsocial transfers (facilitated by the gradual reduction in the number of pensioners paid from thebudget and the shifting of pension payments to the social insurance fund).
12. But spending pressures are likely to grow. Two types of spending are likely to grow inthe medium terrn. First, implementation of planned reforms of state-owned enterprises and banks
ii

Executive Summary
would require additional spending of as much as 1-2 percent of GDP a year for three to fouryears, according to IMF estimates. This spending would comprise creating a social safety net fordisplaced workers and paying the interest on government bonds used to fund the restructuring ofstate-owned enterprise debt and the phased recapitalization of the banks. Second, theGovernment has increased the base wage of civil servants by 25 percent (with further realincreases envisaged), to be paid in part by the downsizing of the civil service. Givenunsustainably low civil service wages, these increases are clearly needed, but if civil serviceemployment is not reduced, they may crowd out other spending.
13. Reversing the continuing decline in revenues as a share of GDP is critical for sustainingreal levels of public spending in the medium term. In the past, Vietnam has maintained a prudentfiscal stance, maintaining relatively small budget deficits (typically about 1 percent of GDP,excluding on-lending) and a low level of debt/GDP. But the current fiscal situation is underpressure from the declining ratio of revenue to GDP and the growing spending pressures.Without actions to address the revenue problem and accurately assess the medium-term fiscaloutlook and emerging fiscal risks, acceptable levels of public spending in key sectors may bedifficult to maintain in the medium term.
14. Several actions are needed to address these problems over the medium term:
- Revenues need to be increased to about 19-20 percent of GDP. Doing so will requirebroadening the revenue base, removing discretionary exemptions and multiple ratesin the VAT, and further strengthening tax administration.
* Definitive estimates of the fiscal costs of state-owned enterprise and banking reformare needed, linked to annual implementation of the reform programs.
* Full cost estimates of recent and future wage increases are needed, linked to plannedchanges in civil service employment.
15. A medium-term fiscal outlook is needed. A medium-term fiscal outlook would assessthe impact of new revenue-raising policies and project total spending. It would reflect the pace ofsectoral and economy-wide reforms, which determine the volume of donor support in themedium term and thus the size of public investment expenditure. The resulting forecasts of likelydeficits and their financing as well as an analysis of the implications of such financing, couldtrigger timely action and improve the stability of budgetary resources. The medium-term fiscaloutlook could also play a key role in informing the annual budget formulation process and inbuilding a medium-term sector expenditure programs.
16. All types of fiscal risk need to be regularly assessed and reported to the Ministry ofFinance. Identifying and assessing fiscal risks on a regular basis would reduce unanticipatedshocks to public spending. Tight monitoring and control over approved expenditures can beundermined if fiscal risks are not also monitored. For example, in many countries, Governmentguarantees of loans to state enterprises and sectors or directives to state-owned banks to providecredit to state enterprises on noncommercial terms have threatened the fiscal balance. It is thusessential that contingent liabilities and other fiscal risks be reported to the MOF and assessedregularly.
17. A medium-term fiscal outlook would thus incorporate revenue policies and projections;projections of donor disbursement; analysis of all fiscal risks, and in due course a detailedmedium-term public expenditure plan, broken down by sectoral programs. Given the tradition of
iii

Vietnam Public Expenditure Review 2000
planning in Vietnam, it should be relatively easy to begin developing such programs. Themedium term fiscal outlook should be published with the annual budget, and used to informbudget formulation.
IMPROVING THE RECORDING AND REPORTING OF DATA AND INCREASINGBUDGET TRANSPARENCY
18. Reliable and timely information on spending-and adequate access to suchinformation-is needed to get the best results from public expenditure. Public expenditure needsto be accurately recorded and reported by different spending units, timely and reliable reportsneed to be generated and be accessible across spending agencies and ministries, and sufficientbudgetary information needs to be published to enable businesses and citizens to understand howpublic resources are being deployed. Vietnam has made considerable progress in these areas inrecent years. Enactment of the budget law, regular fiscal reporting and the adoption ofinternational economic classifications, the removal of budgetary information from the secrecylaw, and the publication of some of that information reflect such progress. Preparation of thisjoint PER in a participatory manner and its publication also reflects significant progress.Nevertheless, further improvements in reporting budgetary data and in making data accessible bygovernment agencies and the public are required if Vietnam is to be on a par with other countriesin the region.
19. The detailed data used for this PER was available in much greater details than theGeneral Statistical Office publication of budgetary information for the first time in June 1999.The sectoral breakdown of total budget spending, which covers three-quarters of totalexpenditures, details spending by type (capital or recurrent, wage and wage-related, operationsand maintenance) and by level of government
20. The lack of a consolidated budget makes it difficult to determine total revenues andexpenditures. The PER covers recurrent and capital spending funded from the Government'sown revenues, Official Development Assistance (ODA) grants not on-lent, and borrowing(domestic and external concessional ODA loans that are not on-lent). It does not cover recurrentand capital expenditures from off-budget funds or on-lent ODA funds or capital spending bystate-owned enterprises, nor all spending by communes.
21. Data recording and reporting are inconsistent across ministries, and many gapsexist. The data used in this report were developed from data provided by the MOF, MPI, andindividual sector ministries. Reconciling their different figures revealed several gaps in reportingand recording of budgetary data. First, where sector ministries record expenditures from ODA,they are not classified according to budget codes. Differences in estimates of capital spending bythe MOF, MPI and sectoral ministries stem partly from this, and partly from differences inclassifying capital and recurrent expenditures. Second, there are also classification anomalies, forexample, in recurrent versus capital expenditures in the transport sector, curative versuspreventive expenditures in the health sector, salary versus nonsalary expenditures in theeducation sector. Third, comparison of budgeted and actual spending at a disaggregated level isnot possible, because budget allocations and Treasury releases are made using I I categories,while spending agencies and the MOF report expenditure using full budget classification. Fourth,reporting by state-owned enterprises is uneven. Not all large state-owned enterprises submitaudited financial statements, and many smaller state-owned enterprises do not regularly report to
iv

Executive Summary
the MOF. Fifth, a detailed classification of spending on social transfers is not available in a formthat permits analysis of its impact.
22. More and better information is needed on the impact of public expenditures.Linking expenditures and outcomes to assess the effectiveness or efficiency of public spending isdifficult even in advanced economies. Vietnam may thus need to proceed gradually in thisrespect. Nevertheless, many sectors have information bases that could be used to develop keyperformance indicators. Data will gradually need to be improved and linked with budgetarydecision-making and with the development of medium-tern sectoral plans.
23. Over time, a consolidated budget statement will be needed to accurately reflect thecountry's fiscal situation. Such a statement would include the activities of all off-budget funds,improve budgetary reporting by communes, obtain regular reports from state-owned enterprises,and ensure better coverage of expenditures funded by ODA.
24. Adopting the following actions would help the Government improve its budgetaryreporting:
* Designate the Treasury as the department responsible for maintaining comprehensivecentral public accounts, and consider developing a fully integrated managementinformation system within the Treasury.
* Channel agency payments from ODA through the Treasury so that all transactions arerecorded using the same budgetary classifications.
* Adopt functional classifications in line with international practice.
* Ensure that all ministries adopt a uniform classification for capital and recurrentexpenditures.
* Develop a detailed classification of spending on social transfers.
* Require large state-owned enterprises to submit audited financial statements, to bereviewed by the Ministry of Finance and the appropriate sectoral ministry.
* Develop key output and outcome measures in one or a few sectors, as a first steptowards developing a comprehensive set of performance measures.
25. MOF has expressed a strong interest in implementing an integrated financial managementsystem in the Treasury and will seek technical assistance from the World Bank to do so. Suchassistance will be most productive if the Ministry also considers significantly reorganizing itsfunctions to ensure greater coherence and focus in its policy formulation and policyimplementation roles.
26. More systematic and frequent sharing of budgetary information across spendingagencies is needed. The process of interagency consultations for this PER revealed that sectoralministries lack adequate information on expenditures by provinces to exercise their policy role.Ministries also lack information on related expenditures by other ministries.
27. The system of local fees and "voluntary" contributions is nontransparent, andinsufficiently accountable. The bases of these charges, which generate between 23 and 61percent of revenues in four of the six communes studied, are so complex that households oftendo not understand how their payment is calculated. None of the six communes publishes a
v

Vietnam Public Expenditure Review 2000
budget indicating what charges have been collected from households and how those funds havebeen spent, leading to dissatisfaction among commune residents.
28. To increase transparency and improve budgeting and decisionmaking, the Governmentshould consider taking the following steps:
* Enhance the flow of budgetary information across all government ministries, agenciesand provinces. MOF should ensure appropriate involvement of sectoral ministries inreviewing provincial government expenditures in each sector, while preservingexisting provincial autonomy.
* Provide donors and international organization with more comprehensive informationon budgetary outcomes and processes in order to increase donor understanding ofVietnam's public finances. Better infornation could also strengthen partnershipsbetween the Government and donors, and could lead to programmatic funding bydonors in different sectors.
* Consider regularly publishing the sectoral breakdown for the more than 75 percent oftotal spending as contained in this PER, based on data on all four levels ofgovernment. MOF should also publish the annual budget and final accounts figuresfor each sector, including relevant intrasectoral detail. Each province, district, andcommune should publish its own annual budget and final accounts.
* Ensure that existing requirements for transparency in imposing commune fees and"voluntary" contributions are observed. Implementing decrees on "grassrootsdemocracy" and annually publishing commune budgets would be one way ofaddressing this.
CREATING EFFECTIVE PROCESSES FOR PRIORITIZING EXPENDITURES
29. The Government has succeeded in promoting economic growth and reducing poverty,including improving the equity of health and education spending. But there is considerable scopefor further improving the effectiveness of public spending. Better processes are needed forprioritizing recurrent and capital spending; recurrent spending needs to account for a larger shareof total spending, so that more efficient use is made of the capital stock; sectoral ministries needto play a larger role in prioritizing spending in their sectors; the system of recurrent expenditurenorms needs to be simplified; local authorities need more flexibility to allocate funding to theirpriorities; and a formal budget process that better integrates capital and recurrent budgets isneeded.
30. Prioritizing recurrent and capital spending has been difficult, for several reasons.Prioritization is carried out separately for capital spending by the MPI and for recurrent spendingby the MOF. Coordination is insufficient to ensure that the recurrent budget implications ofplanned capital spending are fully analyzed or that appropriate balance between recurrent andcapital spending is attained. The current processes in MPI for evaluating and prioritizing PIPprojects need significant strengthening. There is a need to improve the evaluation criteria forprojects, develop the skills of MPI staff and streamline PIP approval process. A fixed five-yearPIP does not permit the prioritization of capital spending to be responsive to changes in the
vi

Executive Summary
economic situation or the availability of resources. These problems are recognized by MPI andefforts are underway to address them.
31. There is an imbalance between capital and recurrent expenditures. It is Governmentpolicy that recurrent expenditures should not increase faster than investment expenditures. As aresult recurrent spending is too low, implying inefficient allocation and inadequate use of thepublic capital stock, For example, a significant proportion of irrigation capacity is not usedbecause of inadequate operations and maintenance (O&M) expenditures. Routine maintenance ofroads (and inland waterways) is insufficient even though it is much more expensive torehabilitate roads once they become unusable.
32. Sector ministries play too small a role in prioritizing spending in their sectors. Sectorministries prepare five-year targets and goals, but these are not linked to an affordableexpenditure plan. Each sector submits an annual plan for capital spending to the MPI and anannual plan for recurrent spending to the MOF. Because coordination among the three ministriesin the finalization of these plans is inadequate, the process for prioritizing all expenditures withina sector remains fragmented. There also appears to be limited scope for evaluating expendituresand reviewing policies, because sector ministries do not receive detailed reports on actualexpenditures in their sectors, especially by the provinces.
33. Given that O&M spending is insufficient to make adequate use of the capital stockin several sectors, further work is needed to determine what reallocation of recurrentspending between wage and wage-related expenses and O&M expenses may be needed.Wage and wage-related expenses do not appear to be crowding out O&M expenditures, as theydo in many other countries. However, anecdotal evidence suggests that wage and wage-relatedexpenses may be underreported, due to misclassification. Moreover, civil service wages inVietnam are unsustainably low, and pressures for wage increases are substantial.
34. The system of recurrent expenditure norms, which guides the allocation of resourcesto and within sectors is complex and some norms are mutually contradictory. Actualspending and service delivery standards in provinces and communes are sometimes inconsistentwith stated Government priorities. The use of population-based norms for allocating resources toschools, for example, does not take into account varying enrollment rates or adjust fully fordifferent geographical conditions or cost disadvantages. As a result, poorer provinces and remoteareas are often inadequately funded.
35. Local authorities, especially the communes, have insufficient flexibility to prioritizetheir own spending. Poorer provinces depend on cash transfers to meet minimum servicedelivery standards, but the existing transfer system is unable to meet their requirements. Districtsand communes receive a share of those transfers, but they are often inadequate to meet thenonwage costs of service delivery. This limits their flexibility in responding to local needs,except to the extent that their revenues exceed budget estimates or they are able to resort to feesand voluntary contributions for a significant share of their revenue, which they allocate in linewith local preferences. Consideration could be given to providing local governments withadditional revenue sources
36. A formal budget process needs to be established that better integrates capital andrecurrent budgets and promotes prioritization that maximizes the impact on growth andpoverty reduction. Several actions would help achieve this:
vii

Vietnam Public Expenditure Review 2000
* MPI and the MOF should improve existing mechanisms for coordinating capital andrecurrent expenditure. This should involve ministries and provinces submittingintegrated capital and recurrent budget requests to both the MOF and the MPI, and allparties should participate in future discussions on these budget requests.
* Develop medium-term sector expenditure programs as the basis for developingannual sectoral budget requests.
* Strengthen the MPI's processes for evaluating investment projects. Developingcapacity, adopting more rigorous evaluation criteria, and turning the PIP into a rollingfive-year expenditure plan that is adjusted each year would improve the MPIscapacity to assess the appropriateness of investment priorities.
* MOF, together with the provinces and sector ministries, should review the currentexpenditure norms-both the budget allocation norms used to guide expenditure tosectors and the budget transfer norms goveming cash transfers to the provinces. Inreviewing the latter consider adopting a new, more equitable formula-based system;and consider assigning some revenue-raising powers to lower levels of government.(The Government believes that assigning such powers would not be appropriate atthis time but will undertake work to assess the pros and cons of such an action.)
ENHANCING THE PRO-POOR BIAS OF PUBLIC SPENDING
37. There is considerable evidence that the Government's public expenditure program playsan important redistributive role and helps the poor. Although national safety net programs are notparticularly effective, cash transfers to poorer provinces and the distribution of health andeducation sector spending are redistributing income. But considerable scope remains forimproving the impact of public spending on the poor, particularly by better targeting socialexpenditures and developing alternative mechanisms for increasing income transfers to thepoorest.
38. Targeting of spending on public health and education, especially on education, hasimproved over time, and public social expenditures are now more equally distributed thanhousehold expenditures. For example, the poorest quintile received 18 percent of total spendingon public education in 1997/98 (a 2 percentage point increase over 1992/93) and 26 percent ofspending on primary education (a 6 percentage point increase).
39. Cash transfers to poorer provinces are performing a useful redistributive role, andallowing these provinces to support a higher level of service delivery. In 1998 at least 41provinces received cash transfers. Although richer provinces still spend more than poorerprovinces, provincial per capita expenditures are more equally distributed across provinces thanare per capita revenue collections, and they have become more equally distributed over time.Nevertheless, the fact that the size of these cash transfers is only weakly related to the depth andincidence of poverty in the provinces suggest that there is room for improve targeting.
40. To enhance the pro-poor bias of public spending, four types of actions are recommended:
. Target social spending more effectively at the poor. In primary health care, forexample, spending could be reallocated from certain types of curative care topreventive care. Reallocating expenditure to rural roads will also assist the poor.
viii

Executive Summary
* Improve the operation of the existing system of user fee exemption for primaryschools and certain types of hospital care. The existing system does not work in aparticularly pro-poor way and forces schools and clinics to fund exemptions fromtheir own resources. The goal would be to reduce the level of out-of-pocket paymentsmade by poor households, which appears to be very high relative to their incomes.One option would be to provide direct funding to some institutions to cover the costof these exemptions
* Examine other mechanisms for increasing income transfers to the poorest. One optionmight be to target income transfers to poor parents of primary school children, manyof whom are funding nearly half the cost of primary schooling from their own meagerresources. A program (such as that successfully adopted in Indonesia) which providesscholarships to children from poor families, could be an effective targetingmechanism.
* Adopt a formula-based system for determining the amount of cash transfers to poorerprovinces, in order to ensure that transfers are more closely related to their needs.Further work should be undertaken to explore the implications of alternativeformulas, develop consensus around a particular formula, and then adopt it in therevised budget law.
REALLOCATING SPENDING WITHIN SECTORS
41. Three of the four sectors examined suggest the need for reallocating spending to improveoutcomes-education is the exception. Given the limited scope for raising total spending,reallocation is likely to be the main source of improvement in the medium term.
Agriculture
42. Public expenditure on agriculture accounts for about 6 percent of the state budget and 1.3percent of GDP. Although this is much lower than in China, India, or Thailand (which spend 8-16 percent of their budgets on agriculture), the sector growth has been one of the strongestamong developing countries.
43. Given that most growth in the sector is expected to come from crop diversification andincreases in yields, improving irrigation, extension, and research will be important. Irrigationcurrently accounts for half of agricultural expenditure, but the imbalance between capital andrecurrent spending means that a significant share of irrigation facilities are not used because ofinadequate O&M. Public spending on research is very small and increased its spending (thereturns to which are very high worldwide) could raise agricultural productivity and enhance theinternational competitiveness of Vietnamese agricultural products.
44. Several reforms could improve performance in the sector:
* Increase public spending on agricultural research and extension, especially in thepoorest communes. Funding of this additional spending could come fromreallocating state subsidies, transfers, and investments from some loss-making state-owned enterprises.
ix

Vietnam Public Expenditure Review 2000
* Improve linkages between research and extension, and involve farmers and agro-industry representatives in the management of these services.
* Improve irrigation service delivery and cost recovery by basing irrigation charges onwater consumption and improving the collection system.
* Extend pilot projects for developing water user associations.
* Improve the performance of reforestation programns.
Health
45. Public spending on health grew rapidly over the past five years, reaching 7 percent of thebudget in 1998 (about 1.4 percent of GDP), although still relatively low by internationalstandards. Nearly two-thirds of spending on health is carried out by provinces, communes, anddistricts. Curative care absorbs a disproportionate 70 percent of the health budget, whilepreventative care receives just 15 percent; another 7 percent goes to family planning.
46. Although public expenditures on health have risen rapidly since the early 1990s,households finance nearly 80 percent of total health care spending. Out-of-pocket payments forthe poor are very large relative to their incomes. A fee exemption mechanism for poor patientsexists, but it appears not to function well.
47. Increases in public spending on health have been accompanied by impressive gains in thehealth status of Vietnam's population, but there is scope for improving delivery of healthservices by reallocating spending. Several reforms could help improve health care delivery:
* Shift from high-cost hospital based services to more cost-effective commune healthcenters.
* Establish a national strategy for assistance to the poor with their health care costs.This may include improving the system of user fees exemption for the poor, andensuring that it functions effectively.
* Once such a strategy is in place the Government should consider raising user fees athospitals, to reduce budgetary subsidies to hospitals.
* Develop mechanisms for ensuring that provinces make their health spending patternsconsistent with national health priorities and strategies.
* Improve the budget transfer norms (used in determining transfers to the provinces) forhealth sector public spending to reduce disparities among provinces in the delivery ofminimum services.
* Consider expansion of the health insurance program, especially the voluntary scheme,as a means of reducing health costs to the budget.
* In the longer run, rethink the role of the state in the health sector. It may make moresense for the governrment to reduce its role in the direct provision of curative,hospital-based health services and focus instead on providing high-quality preventivehealth services; financing health expenditures, especially for the poor; and improvingregulation and monitoring of the growing private health sector.
x

Executive Summary
Education
48. Vietnam has made considerable progress in increasing educational enrollments at alllevels and improving the efficiency and equity of education spending. Total education andtraining expenditure has grown significantly over the past five years, reaching 17 percent of totalpublic spending (exclusive of amortization) (about 3.5 percent of GDP) in 2000. As a result, thenumber of teachers and the average duration of studies have risen, albeit from relatively lowlevels. However, additional public spending will be necessary given the likely growth inenrollments in lower secondary schools, flowing through from increased primary enrollments.Raising pupil/teacher ratios can reduce but not eliminate the need for such increases.
49. Spending on education is highly decentralized, with more than 73 percent of totalspending carried out by provinces, districts, and communes. School education represents 62percent of total spending on public education, with 36 percent of spending allocated to primaryeducation and 18 percent to lower secondary education. This intra-sectoral allocation appears tobe appropriate and should be maintained. The balance between wages and non-wage expenditureis also reasonable, although there is some evidence of misclassification of non-wage spending.Nearly half of total spending on primary education is financed by households, which implies anundue burden on the poor.
50. There is little scope for reallocating of public spending across primary, secondary, andtertiary education services without damaging service delivery. But there is a need to reduceexisting regional variations in expenditures and quality by reviewing the system of budgettransfer norms.
51. Several reforms could improve the effectiveness of spending on education:
* Consider gradually increasing spending on education from 15 percent of publicexpenditure to around 20 percent by 2005.
* Simplify the system of allocative norms for education expenditures, and replace themwith guidelines under which local management has discretion as long as educationaloutcomes are achieved and the budget allocation not exceeded.
* Address existing regional variations by reviewing the present system of norms budgettransfer for allocating education funds to the provinces.
* Increase pupil/teacher ratios at all levels as enrollment rates rise.
* Consider establishing a revolving fund that would leverage expenditure on schoolconstruction by lending school funds for construction.
* Develop outcome indicators to assess the impact of expenditures by testing studentattainment on a regular basis.
Transport
52. Public spending on transport increased significantly over the past decade, but theefficiency of the sector remains low. The poor state of the country's roads imposes economiccosts on users of about $160 million a year, according to the World Bank. Problems with portsand railways exist as well. Expenditure priorities have focused on rehabilitation andmodernization of transport infrastructure, especially roads
xi

Vietnam Public Expenditure Review 2000
53. Nearly 11 percent of total public spending (about 2.2 percent of GDP) goes to transport-a figure that is comparable to other countries-with over 90 percent going to roads. Nearly athird of road expenditure is in the growth corridors of Ho Chi Minh City (Ba Ria Vung Tau andHanoi-Haiphong). But recurrent spending represents only about 12 percent of total roadspending, and road maintenance has remained under-funded relative to capital investment.Progress in improving rural roads has been slow.
54. To address these problems, the Government will consider several reforms.
* For recurrent spending, it will consider reallocating expenditures to increase roadmaintenance to an adequate level, possibly by establishing an earmarked road fundfinanced by a levy on gasoline and other charges.
* It will also consider increasing spending on maintenance of inland waterways.
* For capital spending, the Government will consider reallocating spending towardrural roads. It will also improve processes to ensure better quality and management oftransport infrastructure projects.
ASSESSING THE SCOPE FOR SHIFTING SERVICES TO THE PRIVATE SECTOR
55. Given the pressures on the budget, there is a need to reassess the scope for privatedelivery of services in education, health, and infrastructure. Doing so could reduce demands onthe budget without reducing the services needed for growth and poverty reduction. Some growthin private services in health and education has already occurred, mainly in urban areas, but littleprivate investment has been made in infrastructure, except in water supply. More private sectorinvolvement will be needed if the availability of public resources is not to be a constraint toachieving Vietnam's potential. The Government may consider undertaking a detailed assessmentof the scope for gradually shifting services to the private sector.
56. It may also be necessary to expedite the pace of state-owned enterprise reformparticularly in the transport and agriculture sectors and especially for troubled enterprises, inorder to reduce the fiscal risk borne by the Government. While state-owned enterprises no longerreceive direct or cash subsidies in Vietnam, some continue to receive on implicit subsidies fromthe budget in the form of loans at concessionary interest rates, debt and interest forgiveness, andtax exemptions. The full extent of this support is not known. Moreover, with Vietnam'sintegration into AFTA and the consequent reductions in import protection, some of these state-owned enterprises are likely to begin to require cash and direct subsidies.
57. Increased private sector participation could occur through new entry of private firms andthrough shifting ownership by equitizing and divesting state-owned enterprises. Private sectorinvolvement in operations (e.g. of ports and airports), need not be inconsistent with theGovernment's objective of retaining strategic control of these activities. As privatizationproceeds, sector ministries will need to strengthen their monitoring and policymaking role toexercise this strategic control.
xii

Executive Summary
WHAT IS DOABLE IN THE SHORT AND MEDIUM TERM?
58. The attached Timetable of Next Steps sets out the possible time frame of the mainrecommendations of this PER on the basis of short-term or medium term.
59. Preparation of the 2001 budget provides the Government with the opportunity to institutesome of the changes in spending suggested in this PER and to consider some of the suggestionsfor improving the budgetary process. However, some expenditure reallocations have institutionalpreconditions, suggesting that major expenditure reallocations may have to be phased ingradually. The development of the 2001-05 PIP also provides an opportunity for considering thefindings and options suggested in this PER, on both expenditure allocations and improvements inPIP processes. The Government's intention to review the operation of the budget law in 2000will also provide the opportunity for many of the recommendations on improving budgetaryprocesses and public expenditure management to be considered.
60. The need to improve information and prioritization and to determine affordability createcommon institutional requirements across sectors, such as developing an aggregate medium-termfiscal plan and medium-term strategies. Developing such plans and strategies will require that theGovernment commit itself to a significant program of policy analysis and development and toimproving the budgetary and expenditure management system. Developing this institutionalcapacity will take time. A shared commitment to and understanding of this process throughoutthe Government (including the Office of Government, MOF, MPI sectoral ministries, provincialgovernments, and the National Assembly) is an important precondition.
61. In considering these issues, the Government can build on the extensive consultativeprocess already developed for this PER. Apart from the National Assembly, the provinces, andother sub-national levels of government it could also consider consulting representatives of themedia and civil society wherever possible. The World Bank stands ready to provide assistance inthese consultations.
xiii

Vietnam Public Expenditure Review 2000
VIETNAM PUBLIC EXPENDITURE REVIEW-2000
TIMETABLE OF NEXT STEPS
Goals Steps Time Frame
1: Adopt nfeasures specid in PER
1. To make a. Make an inventory of all "off-budget" funds and accounts Short-termbudgetary data in existenceand information b. Prepare and publish annual receipts-and-expenditure Short-termmore reports on all "off-budget" funds/accountscomprehensiveand consistent c. Develop a proper reporting and a management- Short-to-Medium
information-system for SOEs term
d. Report and record aid-disbursements according to budget Short-termclassification
e. Record disaggregated "social transfer" expenditures to Short termpermit assessment of benefits
f. Designate treasury as department responsible for Mediummaintaining comprehensive public accounts andimplement a fully integrated MIS and an accountingsystem in treasury Medium
g. Adopt functional classification in line with internationalpractice (e.g. GFS type)
2. To improve a. Adopt measures to enhance flow of budgetary Short-termtransparency of information among Government agencieshudgetary b. Publish annually detailed information on the budget for Short terminformation sectors and other categories covering more than 75% of
total spending, as provided in the PER
c. Publish annually, provincial budgets by sectors and Short term tocategories (by the Provinces) Medium
d. Post commune budgets outside commune offices Short-term
e. Submit a medium-term fiscal outlook in combination with Mediumthe annual budget
3.Prioritization a. Require sector-ministries and provinces to submit Short termintegrated capital-recurrent spending requests duringbudget-formulation
b. Require sector ministries to assess annually the Short term
xiv

Executive Summary
Goglh Tini Framneeffectiveness of sectoral public spending in achievingsector objectives based on reports of all spendingagencies, including provinces
c. Require provinces and cities to assess (maybe every two Mediumor three years) the effectiveness of provincial publicspending in achieving objectives of Provinces
d. Identify one or two "pilot" sectors for developing Short termmedium-term sector expenditure programs
e. Develop a medium-term sector expenditure for the Medium termEducation sector
4. Medium- a. Implement measures to raise revenue-collections in the Short-termTerm Fiscal medium-termSustainabiity b. Estimate cost of recent and future wage increases and Short-term
assess impact on budget
c. Estimate cost of planned banking and SOE reform Short-term
d. Compile data on goverunent guarantees and assess likely Short-termrisks Medium
e. Prepare a medium-term fiscal outlook, making allassumptions explicit.
5. Enhancing a. Reallocate spending from certain type of curative care to Mediumpro-poor bias of preventive carepublic spending b. Ensure adequate expenditures on reproductive health Short tern
6. Re-allocating a. Take steps to raise budget allocation for 0 & M expenses Short-termspending within for irrigation, road and inland waterways maintenance,Sectors agricultural extension and research activities, rural road
investment
b. Adopt the principle of linking irrigation user charges to Short termthe volume of water-use and develop plan to implementthis principle
c. Implement the principle of farmers' irrigation-user- Mediumcharges based on actual water-use in phases
d. Implement measures to improve the performance of Short termirrigation management companies (through, for example:cutting costs, water losses)
xv

Vietnam Public Expenditure Review 2000
Goals Steps Time Frpe
e. Encourage the creation of and increase the number of Short-termwater user associations.
f. Implement new measures to improve the "exemption Mediumsystem" of user fees for the poor and ensure its effectivefunctioning, once this has been done, rise user fees inhospitals so as to reduce budgetary subsidies to hospitals
g. Consider expansion of the health insurance program, Mediumespecially the voluntary scheme, as a mean of reducinghealth costs to the budget, while minimizing adverseselection problem and ensuring its financial sustainability
h. Review the existing systems of allocative norms for Mediumeducation and health expenditures and adopt the new oneswith a view to reducing regional disparities in educationand health spending;
i. Increase overall pupil teacher ratios as secondary school Mediumenrollment rates rise
II: Undertake work for desguifg specific measures to address problems iMtiRed in PER
1. Prioritization a. Develop an effective process for integrating capital and Mediumrecurrent budget-formulation and budget-execution, so asto minimize waste of existing public capital stock
b. Formulate new norms for recurrent spending (through a Mediumconsensual process involving sector ministries andprovinces) to ensure that Govt.'s stated goals are achieved
c. Consider establishment of a road fund Medium
d. Assess design of a revolving fund for school Mediuminfrastructure improvement
e. Assess the impact of agriculture SOEs on the economy, Short-termincluding their net contribution of the state budget
2. To enhance a. Develop & adopt mechanisms to provide adequate Short-termpro-poor bias of funding to primary schools, clinics and certain types ofpublic spending hospitals for exempting fees for the poor
b. Develop and adopt formula-based system for determining Mediumthe size of cash transfers to poorer provinces
c. Examine alternative mechanisms for protecting the Short-termnpoorest and increasing their incomes
xvi

Executive Summary
GOals Steps Time Frame
d. Implement measures to enhance gender balance (by Mediumenhancing girl access to primary education in regionswith poor access, raising female enrolment rates insecondary education)
3. Scope for a. Initiate examination and assessment of the scope for Short-termshifting services gradual shifting the provision of some services to theto Private Sector private sector
HII: Examine issues not analyzed in PER
a. Conduct overall benefit incidence analysis for taxes and Short-termexpenditures system
b. Undertake evaluation of national targeted programs Short-term
c. Develop an improved gender focus in the budget process Medium term
d. Examine other issues in fiscal decentralization Short-term
e. Conduct PER in four provinces Medium
f. Conduct a further PER Medium
xvii


Chapter I - Fiscal Sustainability and Transparency
CHAPTER 1FISCAL SUSTAINABILITY AND TRANSPARENCY
CURRENT SITUATION
1. 1 Vietnam has a history of fiscal prudence with relatively small budget deficits (generallyless than 1 percent of GDP, excluding on-lending) and low debt (both domestic and foreign) as ashare of GDP. This is reflected in the level of interest payments in the budget of about 3 percentof total expenditure. The Budget Law permits borrowing for only investment expenditures andNational Assembly decision limits budget deficit to less than 5 percent of GDP.
1. 2 However, the fiscal balance does not fully cover all government spending i.e.consolidated general government. It excludes a number of significant off-budget accounts asdiscussed in paragraph 1.11. Significant quasi fiscal activity involving finance from the bankingsystem to State Owned Enterprises (SOEs) is also not included. It also excludes on-lending ofODA funds to SOEs.
1. 3 The following table summarizes key fiscal trends 1995-1999.
Table 1.1: Government Budget (percent of GDP)
Government budget 1995 1996 1997 1998 1999 1999 2000 2000(percent of GDP) (Govt.'s (IMF's Budget (IMF's
Est.) Est.) Est.)
Revenue (excluding 22.6 22.4 20.3 19.6 18.1 18.2 16.4 18.5grants)
Grants 0.7 0.6 0.8 0.6 0.5 0.5 0.4 0.5
Total expenditure 23.8 23.1 22.0 20.4 21.1 19.8 19.7 21.2(excluding on-lending) _
Current expenditure 18.6 17.4 16.2 14.4 13.3 13.2 13.5 14.2
Overall fiscal -0.5 -0.2 -0.8 -0.1 -2.5 -1.1 -2.8 -2.2balance (includinggrants, excluding on-lending) _
Source: IMF-World Bank and MOF
1. 4 There has been some loosening in the Government's fiscal stance in 2000, where theoverall fiscal deficit, excluding on-lending, is estimated officially as 2.8 percent of GDP (2.2percent based on recent IMF estimates). This increase in deficit reflects mainly a civil servicewage increase (0.8 percent of GDP) and the carry-over of under-spent capital expenditureallocations from 1999 as a modest fiscal stimulus.
1. 5 The medium term fiscal position envisages overall deficits of around of 2 percent of GDPfor the years 2001-2003. However the actual size of the deficit will also depend on the pace andscope of structural reforms and the cost of those reform.
1

Vietnam: Public Expenditure Review 2000
POTENTIAL RISKS TO FISCAL SUSTAINABILITY
1. 6 The potential risks to fiscal sustainability faced by Vietnarn are manageable in the nearterm. Declining revenue and new pressures for raising expenditure suggest the need for anaccurate assessment of trends and certain actions to mitigate these risks.
Thus some fiscal adjustment will be required in the medium-term to ensure that theenvisaged deficits are not exceeded The Government needs to develop these measures nowto ensure an easy adjustment as part of its fiscal strategy
1. 7 Revenue collections as a percentage of GDP has fallen by over 4 percent of GDP over theperiod 1996-1999 as indicated in Table 1.1. This erosion in revenue reflects a range of factorsincluding reduction in economic growth, a reduction in imports, poorer SOE performance (SOEpayments are a substantial part of budget revenues) and some weaknesses in tax administration.
1. 8 Strong revenue efforts will be needed to increase revenue collections as a share ofGDP- to around 19-20 percent of GDP-otherwise medium term fiscal sustainability may bethreatened. This increase could be achieved by broadening the revenue base, removingdiscretionary exemptions for VAT and further strengthening of the tax administration.Strengthening SOE profitability must be part of this revenue improvement strategy. Any futuretrade reform will also have revenue implications, which should be allowed for in theGovernments fiscal strategy.
1. 9 Expenditure pressures arise from at least four different sources. First, low wage rates ofthe civil service is being addressed An initial increase of 25 percent in 2000 is expected to befollowed by further increases in future years (the 2001 budget plan currently under preparationenvisages an increase of about). Unless the Government's proposal for downsizing generaladministration by 15 percent is implemented, these increases will squeeze out other expenditures.The Government needs to develop full cost estimates of recent and planned future wageincreases, together with alternative scenarios of employment reductions to ascertain its medium-term implications. Second, the likely costs of SOE and banking reform will contribute to thehigher budget deficit for each of the next three years (see Box 1.1)1, though this should be easilyfinanceable by prospective external donor support While capital costs of reform will besubstantial, the current cost - the annual charge on the budget - will not exceed 1-2 percent ofGDP a year. However, more work will be needed to pin down these estimates and build theminto its medium term fiscal strategy. Because the necessary financial data to make a completeassessment of the extent of NPLs has not been available and banks are yet to fully adopt newloan classification and provisioning, current estimates could well be under-estimates. Thecurrent estimates for NPLs is around VND35 trillion.
Critical details of the Government's SOE reform plans are not yet available to enable a more precise costing of thepotential fiscal burden. Under tentative reform scenarios, Bank-Fund estimates that the current costs of reform couldstart at 0.5 percent of GDP in 2000, and average about 1 percent of GDP annually over 2000-03.
2

Chapter I - Fiscal Sustainability and Transparency
Box 1.1: Fiscal Costs of SOE and Banukbg ReformTentative estimates of total costs are projected to total 12-13 percent of GDP, comprise:
The capital costs of SOE debt resolution and bank re-capitalization totaling 8 percent of GDP overfour years. Debt resolution alone is expected to ct about 5.5 pement of GDP, and the assetmanagement company (AMC) together with the reidua bank re-capitalion about 2.5 percent ofGDP;
, The additional interest cost of newly issued government debt for bank re-capitalization totaling 2.5percent of GDP over the next four years, starting at 0.2 percent of GDP in 2000 and rising to 1percent of GDP by 2003; and
. The cost of severance pay to affected workers totaling 2 pement of GDP.
In 2000, the capital costs of SOE and banking sector refonn would be about 2.5 - 3 percent of GDP,mainly related to setting up the AMC and clearing frozen SOE loans. Total current costs (includingthe safety net) would amount to 0.7 percent of GDP.
Under this reform scenario and with the curihnent of new SOE losses, the public sector debtdynamics would remain manageable. Currently, the level of public sector debt of Vietnam is about 65percent of GDP (Fund-Bank estimate), including bank debt of SOEs. The government's domesticdebt is very snall (3 percent of GDP), and its extemal debt is all on concessional terms. Reformingthe SOE sector would result in the government taking on some SOE debt, which by itself would notincrease the level of debt of the public sector as a whole. Public sector debt would peak at 73 percentby 2002, and begin to stabilize thereafter.
1. 10 Third, declining revenue and higher wage bill has squeezed non-wage currentexpenditures. This is evident from the fact that total government expenditure has declined inrelation to GDP, but investment expenditure has not given National Assembly's priority toinvestment expenditure. This has resulted in a backlog of operations and maintenanceexpenditures. Chapter 3 finds inadequate operations and maintenance funding for transport andirrigation with resulting adverse impact on service delivery. Fourth, announced Governmentpolicies in various areas suggest other demands for public expenditure for both investment andrecurrent. For example, as discussed in chapter 3.
* impressive enrollment results in primary education will raise demand for additionalexpenditure in lower secondary education;
* transport master plan envisages additional recurrent and capital expenditures in thatsector;
* the low level of expenditures on social safety net programs call for higher expenditurein the medium-term.
2This staff calculation is based on (i) an SOE reform scenario involving about one-third of SOE, which would beclosed, equitized, and divested over three years, (ii) an estimated D 35 trillion of nonperforming loans, as the basisfor the SOE bank debt to be resolved by the government, which represents the main component of bankrestructuring costs; and (iii) an average ratio of workers to be laid-off from these SOEs assumed at 30 percent, withtwo years' salary as severance pay. The cost estimates should be considered a lower bound since they do not accountfor nonbank debt of SOEs, which is believed to be substantial but is poorly documented.
3

Vietnam: Public Expenditure Review 2000
1. 11 On the other hand this PER also identifies areas which might provide further resources orreduce expenditure demands on the budget. Apart from improving the performance of SOEs, asdiscussed above, these include
* reviewing the role of the state in areas where the private sector may be able toadequately provide services;
* placing more emphasis on user charges, for example in areas of hospitals (withappropriate assistance strategies for the poor), road expenditure and irrigation.
1. 12 No comprehensive or regular financial information is available on the off-budgetaccounts but there are at least seven off-budget accounts in existence:
* social Security Insurance Fund;
* health Insurance Fund;
* national Development Support Fund (to support policy-based lending);
* export Support Fund (formerly the Price Stabilization Fund);
* SOE Restructuring Support Fund (to cover the cost of workers made redundant bySOE reform, to resolve SOE debt, and to provide support for SOE investment);
* sinking Fund (for repayment of foreign debt, on-lent by government);
* re-forestation Program Lending Fund.
1. 13 According to MOF, transactions in these accounts amount to only about one percent ofGDP and most of these are self financing i.e. dependent on specific sources of revenue, and theaccounts cannot go into deficit by law. Thus fiscal risk arising from these funds is limited.
1. 14 The only exception is the National Development Support Fund, established to provideconcessionary loans to priority activities, as directed by the Government. As this fund mayborrow beyond its initial funding provided from the budget, there is a risk that is fund borrowsexcessively and its loans perform poorly. Transparency concerning the operations of this fund istherefore particularly important.
Nevertheless the Government should ensure that off-budget accounts are limited as far aspossible, that it has adequate information on their operations to limit any fiscal risk, thattheir operations are integrated as far as possible into overall budgetary decision makingand that there is adequate reporting of their activities.
1. 15 Management of contingent liabilities in the form of loan guarantees is also important. Thegovernment has provided data on explicit loan guarantees of 14 credits totaling US$345 millionfor the three years 1996-98. However, a comprehensive data base will need to be developed andupdated regularly by MOF to adequately monitor these fiscal risks.
Assessing Fiscal Sustainability
1. 16 This section highlights a few areas where the government of Vietnam needs to focus inorder to develop a framework for determining sustainability of the country's current fiscalstance. The findings and recommendations are intended to assist Vietnam in developing a clearerpicture of potential fiscal risks, so as to improve the effectiveness of fiscal policy. A forward
4

Chapter I - Fiscal Sustainability and Transparency
looking process will be key to properly assessing the budgetary costs associated with envisagedstructural reforms. Taking the necessary steps to make a complete assessment of fiscalsustainability might also form the basis for formulating a medium-term expenditure framework,which could be an important tool for improving expenditure management.
1. 17 Fiscal sustainability addresses the issue of whether the current fiscal position can bemaintained over the medium term without excessively raising the overall debt burden andundermining macroeconomic stability. Various models have been developed to assess fiscalsustainability, which typically involve comparing expected primary deficits (deficit beforeinterest charges) with sustainable primary deficits.3 If current and future policy stances, asembodied in the expected primary deficits, require untenable levels of debt-both domestic andforeign, fiscal adjustment would be necessary in order to return a country to a sustainable fiscalpath. Typically, models for assessing fiscal sustainability incorporate country-specificassumptions and a sensitivity test of expected fiscal deficits to changes in policies-bothdirectly through new revenue and expenditure measures and indirectly through other changes inmacroeconomic policies and implementation of structural reforms. Moreover, fiscalsustainability would be sensitive to changes in the external environment.
Fiscal sustainability in Vietnam
1. 18 The analysis of whether Vietnam is on a sustainable fiscal path is a backward andforward looking exercise and would need to incorporate a number of factors. First, the impact ofpotential changes in macroeconomic policies and in the pace, cost and scope of structuralreforms must be reviewed in terms of their direct and indirect effects on fiscal performance.Second, the current and projected level and composition of revenue. and expenditure must beexamined closely to see whether they are consistent with overall policy objectives such as highrates of sustained economic growth, low inflation, and broad-based poverty reduction. A thirdand related consideration is an assessment of the vulnerability of current fiscal policies to shocksso as to ensure overall fiscal performance is not tied excessively to factors beyond Vietnam'scontrol, such as terms of trade shocks (e.g. oil price changes), exchange rate realigmnents, orunanticipated climatic changes. For factors that can be potentially controlled, a full appraisalwould need to be made as to whether the government of Vietnam had the resources and capacityto properly forecast and manage its primary deficit (e.g. through establishing a medium-termexpenditure framework and supporting systems for accounting for, monitoring, and hedgingagainst fiscal risks, etc.)
1. 19 Box 1.2 sets out key issues in assessing fiscal sustainability
3 The sustainable primary deficit is defined as the deficit level that can be financed without adding to a country'soverall debt burden. It would typically be examined in termns of the ratio of official debt to GDP.
5

Vietnam: Public Expenditure Review 2000
Box 1.2. Assessing fiscd sustainability in VietnamOn changes in macroeconomic policies and structural reforms:
* Is the impact of the government's new policies and prospective reforms properly captured in themedium-term fiscal stance envisaged by the government of Vietnam, including the direct and indirectbudgetawy costs associated with the (i) civil service wage increase (and possible civil service refonn), (ii)SOE reform program, (iii) state-owned commercial bank (SOCB) and joint stock bank restructuringplans, including eventual bank re-capitalisation, and (iv) trade refonn? On SOE reform, the envisagedmedium-term program will still find the presence of state-owned enterprises in key sectors of theeconomy. As a result, the risk of fiscal burdens arising from loss-making activities will still be present,which will need to be monitored and managed closely. On trade reform, not only would any directpotential revenue impact need to be captured, (which with proposed tariffication of non-tariff barrierswould be expected to be positive), but also the impact on stimulating new economic activity, and its effecton tax collections.
* In formulating the medium-term fiscal stance, has the scope and likelihood of potential fiscal risksbeen sufficiently assessed, so as to avoid large unforeseen costs that might undermine fiscal sustainability(i.e., the size of contingent liabilities, the transfers to and uses of extra-budgetary funds, the scope ofquasi-fiscal activities)? However, a more comprehensive data base will be need to be developed andupdated regularly by MOF in order to monitor fiscal risks. This is a critical first step to assess the impactof these risks on fiscal sustainability.
On the level and composition of revenue and expenditure and vulnerability to shocks:. Does the degree of taxation burden excessively burden any single sector or activity so as to dampenoverall growth prospects? Is the overail tax base sufficiently broad and equitable so as to reduce thevulnerability of total revenue collections to large macroeconomic shocks or necessary structural reforms?How buoyant is the tax system? How effective is tax administration. How significant are taxexpenditures in Vietnan ?
* How reliable are foreign aid inflows, and to what extent will their availability change over themedium term?
* Is the level and composition of expenditure sufficient to provide high rates of sustained economicgrowth and broad-based poverty reduction? Are sufficient resources being devoted in the budget tomaintaining new and existing physical infirastructure? Does the allocation of expenditure on human andphysical capital development ensure that Vietnam will be able to remain competitive in global markets orcontinue to attract foreign direct investment?
* In the course of developing new policies to effect growth and poverty reduction, has the risk ofneeding to expand existing or introduce new government programs been properly reflected in theexpected fiscal stance? For example, will the development of transitional social safety nets and othersocial programs lead to the expansion of existing activities (eg. pensions) or introduction of new ones(e.g. unemployment insurance, workplace accident insurance, health insurance, etc.)? To what extentwould these new programs be self-financing (e.g. from payroll taxes)?
What is the share of discretionary spending in total expenditure (e.g. in the event that unanticipatedspending pressures arise, such as from recent flooding in central Vietnam, which are expected to cost D0.7 trillion and D 1.7 trillion in additional government expenditure in 1999 and 200.all of which isexpected to be covered by domestic resources), or are budget reserves pre-committed to new or existingprograms?
1. 20 There are three other key actions for the Government to consider:
6

Chapter 1 - Fiscal Sustainability and Transparency
* it should devote more resources to comprehensively review its fiscal sustainabilityand to link this with a medium term fiscal strategy (as discussed below).
* it should develop improved arrangements for the managing of fiscal risk. These couldinclude requirements such as centralization (desirably in the MOF ) for the approvalof guarantees and for transparent operations of SOEs, which fully reflect theirfinancial results and position and the amount of any government assistance to them.This issue is further discussed below.
* moving beyond this it should develop its own capacity in the MOF to manage fiscalsustainability and risk, through developing a medium term fiscal outlook. This isfurther discussed below.
A MEDIUM TERM FISCAL OUTLOOK
1. 21 Fiscal sustainability is thus almost by definition a medium and long-term issue. Itinvolves both a backward look (e.g. to determine the current financial position) and a forwardlook. Vietnam already has a forward look in the area of public expenditures through its FiveYear Plan, and the related Public Investment Program (PIP). The Plan sets output and growthtargets as determined by the National Assembly. The PIP reflects the investment expendituresassessed as needed to achieve these targets. It incorporates likely sources and amounts offunding, and also acts as a vehicle to mobilize funds from donors.
1. 22 But this falls short of a full medium term fiscal outlook. Using the best available forecastsof economic growth, a medium-term fiscal outlook includes a full assessment of likelygovernment revenues and expenditures, both recurrent and investment expenditures, coveringover a medium term period and their expression in an aggregate medium-term fiscal plan,incorporating the government's fiscal targets. This plan would be regularly updated and rolledover annually, forming the starting point for the preparation of the annual budget. While thebudget and allocations would remain on an annual basis, they are made within a medium-termframework.
1. 23 Developing such forward looking fiscal approach is obviously not easy. In particularfuture uncertainty may make it difficult to forecast reliably, particularly on the revenue side. Onthe other hand it may be argued that it is precisely because of this uncertainty that a forward lookis necessary, and that such a plan will assist in developing strategies to deal with a range offuture scenarios.
1. 24 A number of countries have found it useful to deepen this into a fiscal plan at the sectorallevel, providing the basis for the development of costed sectoral plans, as discussed in Chapter 2of this PER.
The Government should therefore commence development of a medium term fiscal strategy, inthe context of a medium term fiscal plan.
FISCAL TRANSPARENCY
1. 25 Fiscal transparency is important for accountability to citizens for the use of governmentrevenues and accountability for the quality of overall fiscal management. It is also important to
7

Vietnam: Public Expenditure Review 2000
donors, who obviously are not comfortable providing financial assistance, without adequate andreliable information to assess how and how well funds are being spent. External marketparticipants are demanding more transparency in fiscal operations as a basis investment orlending. But fiscal transparency is equally important for the government itself especially for allits agencies and ministries in order to undertake effective fiscal management.1. 26 A 1998 joint IMF/World Bank report on fiscal transparency in Vietnam highlightedinsufficient transparency in Vietnam's fiscal and quasi-fiscal operations. Since then Vietnam hasmade progress in improving fiscal transparency. From being a State secret, the budget is nowpublished, albeit in a highly aggregated form. Vietnam's public finance data is now published inthe IMF Government Finance Statistics GFS yearbook. There have been improvements in thefiscal information provided to international organizations and donors, and some improvements inreporting by agencies of self-raised revenues and external grants and their associatedexpenditures (see box 1.3).
Box 1.3: Reott Measues to Improve Transparency* On June 4, 1999 published 1997 final accoumts and the 1999 budget plan by the Generl SatW iOffice ((SO), in the form of a booklet that is fieely available4 This booklet contas informatlontotal, investment and recurent expenditure for the state and for each of the 61 provinces,, on recentexpenditure in education and in health for the state and, for eah of the 61 provinces, and! onexpenditures in each ofthe 116 agencies including ministries and mass organizations;.Asked communes to post budgets by outide commune offices;.Provided fiscal infonmaton to international oranizato and donors in a GFSwonsistent format aswell as to all re}evant government agencies;5
* improved fiscal management by requiring improved accounting of foreign grants and clarficationof roles in management of external deb and in debt monitorig;6
, Clarified processes for managing fees, charges and revenues raised and spent by spendingagencies.7
4 Issued Decision 225/1998/QD-TTg (Nov. 20, 1998) on fiscal publication for various state budgetary levels,spending units, state owned enterprises, and funds contributed by people; Circular No. 188/1998/TT-BTC (Dec.30, 1998) to guide the publication of the national and provincial budget; and Circular 29/1999/TT-BTC (Mar. 19,1999) guiding the implementation of fiscal transparency with regard to funds contributed by people.5Issued Decision 225/1998/QD-TTg (Nov. 20, 1998) on fiscal publication for various state budgetary levels,spending units, state owned enterprises, and funds contributed by people; Decision 1581/1998/QD/BTC (Nov. 11,1998) to guide the provision of fiscal data to external agencies.6 Issued Decree 90/1998/ND-CP (Nov. 7, 1998) to clarify roles of govermment agencies in external debtmanagement and in debt monitoring, and Circular 22/1999/TT-BTC (Feb. 19, 1999) to ensure that all foreigngrants are accounted in the state budget according to the budget classification.
Issued Decree 04/1999/ND-CP (Jan. 30, 1999) to manage fees and charges under state budget, and Circular54/1999/TT-BTC (May 5, 1999) to guide implementation of Decree 04.
8

Chapter I - Fiscal Sustainability and Transparency
Transparency Agenda for Government
1. 27 Nevertheless, Vietnam still has some distance to go to meet the minimum standards ofthe IMF Fiscal Transparency Code. The following issues should be addressed in the future
* Increasing the amount of information in the budget and the public accounts, which arecurrently published in a highly aggregated form. Deepening this information is aparticular priority for international donors. An important starting point would be topublish on an annual basis, the information provided to and published in this PERreport. Beyond this, it would also be desirable to consolidate information alreadyavailable on public expenditures at the four levels of government into one or morepublications, to provide as far as possible a comprehensive national picture ofGovernment expenditures.
* Improving the comprehensiveness of the budget and public accounts - significant offbudget accounts, quasi fiscal transactions and contingent liabilities are not covered.
* Providing a comprehensive and detailed medium-term fiscal or economic outlooktogether with the annual budget, to provide context to the budget and to fiscal policiesgenerally. Such a report would indicate key macroeconomic forecasting assumptions,macroeconomic and sectoral policies to be reflected in the budget, as well as relevantinformation on fiscal sustainability
* Improving the classification system, which differs from the international GFSclassification in some areas, including the functional classification and definition ofthe boundaries between the government, SOE and banking sector.
* Deepening the classification system to provide more detailed information onexpenditures below the functional or sub-function level, particularly at the activity orprogram level. Lack of such a classification limits the ability to analyze theeffectiveness of government programs and their efficiency of operation.
* Improving the financial reporting of SOEs, so that their financial results and positioncan be assessed in accordance with international accounting standards
* Addressing the lack of an adequate, and by international standards, independentexternal audit function to provide assurance that internal controls over revenue andexpenditure are operating adequately, and that published fiscal information isaccurate and reliable
1. 28 Fiscal transparency at the level of provinces, districts and communes is equally importantin terms of accountability and fiscal management. While there are clear Governmentrequirements for the publication of budgets and public accounts at these levels, there is someevidence from this PER, as discussed in the section on fees and contributions in Chapter 2, thatthis is not always observed.
1. 29 While key issues listed above have yet not been addressed, it is accepted that theirimplementation will take time and Government agencies are developing a timetable for theirconsideration and possible implementation. Some could be done immediately, such as thepublication of more detailed information in the budget and public accounts. Some, such as
9

Vietnam: Public Expenditure Review 2000
developing a Fiscal and Economic Outlook publication would require some capacitydevelopment in the Ministries of Planning and Investment and Finance.
1. 30 Particular priority should be given to increasing public informnation concerning the budgetand public accounts. As a first step the Government plans to provide on an annual basis theinformation contained in this PER report. The Government also plans to consolidate existingpublic information on expenditures at all four levels of government into one or more publication,to provide as far as possible a comprehensive national picture of public expenditures. A first stepin this direction would be for MOF publish separately the budget and final accounts figures foreach of the sectoral ministries and for each provinces to publish budget and final accountsinformation covering its departments and lower levels of government.
1. 31 A number of these recommendations on fiscal transparency relate closely to budget andpublic expenditure management issues, and are further discussed below in Chapter 2.
Agenda for State-Owned Enterprises
1. 32 Vietnam has a substantial number of SOEs, ranging from major national enterprises toprovincial enterprises and public utilities and small local undertakings. The past budgetaryimpact of SOEs both implicit and explicit is not fully known. Nor is the budgetary impact of theto-be-announced SOE reform program well estimated. Such factual information is crucial tofuture budgetary management and to assessing fiscal sustainability.
1. 33 Financing of SOEs investment expenditures has been undertaken through the PIP, usinggovernment financing retained earnings and donor funds. The banking system has also providedmedium and long term loans on a concessionary basis. With many SOEs performing poorly andoperating at a loss the banks have accumulated considerable non-performing loans. As a resultthe envisaged banking reforms will likely entail sizeable debt restructuring tools over themedium term.
1. 34 The Government is therefore developing, through the National Enterprise RestructuringCommittee, a program of SOE reform, involving divestiture, closing and restructuring ofenterprises on a more commercial basis. Although details of this program are not yet available, itis envisaged that the SOE sector will be downsized by at least one third over three years,reducing the number of SOEs from about 6,000 currently to around 3,000 in the medium termthrough equitization, sale and closure. Apart from appropriate safety nets for displaced workersthis program will also require resolution of the SOE debt problem and more transparentprocedures for equitization.
1. 35 The SOE reform program that is being finalized will have fiscal impact in various ways.The program when implemented will require budgetary funding for redundancies and for debtrestructuring. There will also be losses in SOE revenues, but this is likely to be offset by revenuefrom restructured and profitable enterprises, whether equitized or divested. Also many SOEsreceived implicit subsidies, which will no longer be required, e.g. tax exemptions. AlthoughSOEs received no explicit subsidies from the budget to cover operating losses, some cashtransfers are made from the budget to SOEs, in the form of agricultural price supports orsubsidies designed to assist the producer or consumer.
1. 36 For the future, it would be desirable for the financial relationship between the budget andSOEs to be both transparent and standardized. The present system appears to have considerablevariation in terms of types and levels of charges on and exemptions for SOEs. A new approach
10

Chapter I - Fiscal Sustainability and Transparency
would include a transparent and consistent basis for payments from SOEs to the budget, and forany budget support to SOEs. This would flow from establishing a commercially based operatingframework for continuing SOEs based on clear financial targets, management autonomy toachieve these targets, transparency of any directives from the Government to management, acommercial accounting system to report performance against targets. There will also need to beappropriate capacity to monitor SOE operations in sectoral ministries and centrally in theMinistry of Finance.
11

Vietnam: Public Expenditure Review 2000
CHAPTER 2BUDGETING AND PUBLIC EXPENDITURE MANAGEMENT
GENERAL POSITION
2.1 There have been significant achievements in the budgeting and public expendituremanagement system in Vietnam in recent years. The adoption of the Budget Law in 1996, withan further revision in 1998 to establish a clearer division of responsibilities between the centerand the provinces, has provided an important framework for an orderly budget system. Howeverit is important that this framework be capable of easy amendment, so that it is not a barrier tonecessary changes.
2. 2 The preparation of the first Public Investment Program (PIP) covering the period 1996-2000 has made the processes for determining investment expenditures more orderly and realistic.It has related proposed expenditures to assumptions about available financing, as well as actingas a means of mobilizing finance. But there have been problems concerning over-optimism onproject implementation and on absorptive capacity, including too many projects being includedin the PIP and lack of adequate criteria for evaluation and ranking of projects. These issues arebeing addressed in the new arrangements for the preparation of the 2001-2006 PIP.
2. 3 Overall the budgeting and public expenditure management system provides for goodaggregate control of expenditures within years. There have been no significant over-runs ofexpenditure, release of funds has been tightly controlled and there has been no problem ofexpenditure arrears.
2. 4 Because of the relative complexity of the budget system (see Box 2. 1), it is difficult fromthe outside to determine the way the budget process works in practice-in terms of how decisionsare made, and with what information. However there is considerable anecdotal evidence whichsuggests that there may not be significant coordination and consultation between the differentplayers to make the system work effectively. In particular, the role of sectoral ministries appearsunclear. The lack of a computerized network through which all parties could access the samebudget information further limits consultation, coordination and dissemination.
2. 5 There is also a need for greater capacity building in the Ministry of Finance, the Ministryof Planning and Investment, relevant sectoral ministries, and in particular at provincial, districtand commune level, in respect of budgeting, accounting, program and project evaluation.
2. 6 The major issues in terms of improving the present budgeting and public expendituremanagement system relate to;
* improving expenditure prioritization
* improving monitoring of expenditures on a timely basis throughout the year
12

Chapter 2 - Budgeting and Public Expenditure Management
Box 2.1: The budgetary process in Vietnam
The budget system is relatively complex, reflecting a unitary or national budget covering the fourlevels of government-national, provincial, district and commune, although in practice littleinformation on the lowest level of government is available at the center, and not all commuweexpenditures are included in the national budget. It provides for a system of top-down and bottom up
coordination at each level, requiring considerble coordination and consultation between levels, It alsorequires significant coordination between the Ministry of Finance, responsible for the recurrentbudget, and the Ministy of Planning and Investment, responsible for the investment budget.
The 1996 Budget Law created the framework for the current system of financial relationsbetween the national government and lower levels of govemment - 61 provinces, 598 districts and10500 communes, wards and district towns. These fiscal arrangements reflect a decentralized systemof service delivery within a unitary system of government, under which national authority is delegatedto the lower levels of government. Thus local budgets are required to be approved by the higher levelof govemnment, although there is considerable autonomy in actual implementation. The assignment offunctions is well illustrated in the health sector-national hospitals are the responsibility of theMinistry of Health, provincial hospitals of the provinces, district hospitals of districts and loal healthcenters of the communes. Lower levels of Government may also operate their own SOEs, Theseinclude local services such as water and electricity supply, waste disposal and transportation.
At each level, budget preparation and submission to the higher level, and implementaion of thebudget is the responsibility of the People's Council.
The secoral ministries (Agriculture and Rural Development, Education and Training, Health andTransport) are also involved in the budgetary process on their national expenditures and on provincialgovernment expenditures. At the provincial and district level similar coordination is also requiredbetween the provincial Department of Finance and Department of Planning and Investment andprovincial sectoral departments (health, education, etc). Within the sectoral ministries budgetresponsibility also generally involves separate finance and planning and investment departments.
IMPROVING EXPENDITURE PRIORITIZATION
2. 7 The prioritization issue has a number of dimensions
* a government policy favoring investment expenditures rather than recurrent
expenditures.
2. 8 This priority is reflected in the recent squeeze on recurrent expenditures, while
investment expenditures have been maintained, as set out in Table 1.1 in Chapter 1. It is also
incorporated in a resolution adopted by the National Assembly for the period of 1996-2000
which stipulates that the rate of growth of recurrent expenditures at any stage during this period
must not exceed the rate of growth of investment expenditures.
2. 9 In the World Bank's view this policy encourages an imbalance between recurrent and
investment expenditures and should be reviewed by the Government for at least three reasons.
First, this policy can impact adversely on service delivery. With a major component of recurrent
expenditures being civil service salaries (which increases with wage increases), other
expenditures such as consumables and travel necessary to deliver services, may be too low.
Second, this squeeze on recurrent expenditure limits maintenance expenditures, leading to
13

Vietnam: Public Expenditure Review 2000
deterioration of assets and higher operating costs in the longer run. In adequate maintenanceexpenditure is a problem in roads, inland waterways and irrigation schemes. Third, it mayoverlook key priorities in service delivery, particularly in the social services. For example anincreased number of trained nurses and teachers may be equally important in improving servicedelivery in health and education as more hospital and school buildings. But a pre-determinedemphasis on capital expenditures, prevents additional spreading on nurses and teachers. In short,if priorities are determined as part of the development of a medium-term sector expenditurestrategy, with no bias for capital spreading, an appropriate expenditure allocation is more likely.
* adequate coordination between the recurrent and investment budgets.
2. 10 Though both MOF and MPI consider the existing institutional arrangement - where ajoint MOF/MPI committee considers all major projects - adequate, there are ways in which thiscould be further improved. For example in discussions on major investment projects (Group A),the recurrent as well as capital costs of the project could be reviewed at the same time rather thanseparately. The development of a medium term fiscal framework, both at an aggregate and asectoral level, could be also an important tool in improving this coordination. Anecdotalevidence suggest that this lack of coordination may be a particular problem in of provincial anddistrict budgets, where such consultation between the local Department of Finance andDepartment of Planning and Investment may be limited.
Box 2.2 Better integrating the capital and recurrent budgetsBy separating the capital from the recurrent budgets, govemnments frequently do not forecast the
current expenditures associated with today's investment program. Recently, in one developingcountry a forward estimate of the investment program showed that recurrent expenditures arisingfrom this investment program would exhaust 1 10 percent of the govemnment's future revenues.
One simple way of strengthening this link is to ensure that the budget office is involved inreviewing the total costs of projects when they are first submitted to the planming ministry by lineministries. Yet another way to properly allow for the future cost implications of new projects is tointroduce a multi-year rolling budgetary planning exercise. This unifies capital and recurrentexpenditures into a single budget and projects this forward for three to five years in a medium-termexpenditure framework (MTEF), so that total costs can be evaluated alongside the country's projectedrevenues. A number of developing countries (including Ghana and South Africa) and developedcountries (Australia and New Zealand) have adopted this approach.
* involvement of sectoral ministries in budget discussions, particularly on provincialexpenditures, and receiving information on expenditure allocations and actualexpenditures
2. 11 Sectoral ministries have a clear role in policy formulation and assessment in their sectors.For example the MOET formulates education policy relating to issues such as pupil-teacherratios, education fees and contributions, assistance to disadvantaged localities through nationalprogram and so on. MOET also works with MOF to determine budget norms to guide theallocation of public education funds (as discussed in Chapter 3). It is also responsible fordeveloping five-year sectoral strategies. Sectoral ministries have the right to be involved in allbudget discussions with the provinces, and provinces are required to submit their expenditureproposals through the relevant sectoral ministry and to inform sectoral ministries of their actualspending in that sector. But in practice sectoral ministries are not fully participating in the budget
14

Chapter 2 - Budgeting and Public Expenditure Management
discussions (which may focus on aggregate expenditure issues rather than on allocation withinsectors), and are either not receiving or not making an effort to obtain detailed information onactual expenditures by provinces and lower levels of Government. The current mechanism offinal accounts reporting does not provide a ministry with adequately detailed information onwhat is actually spent in that sector by lower levels of government. The sectoral ministry is thusunable to assess whether actual spending by provinces and lower levels of Government has beenconsistent with the sectoral policies, and if not - whether there are sufficient grounds to changethe sectoral policy. While local governments should have the independent and flexibility torespond to local conditions, their spending behaviour needs to be broadly consistent withnational policy.
2. 12 Therefore it is important to provide access by sectoral ministries to information on budgetallocation and expenditures within their sector by lower levels of government, as well as toavailable information on expenditure outputs and outcomes. But it is important to distinguishaccess to information from control. The Vietnamese system of government provides considerableautonomy to provincial and other levels of government in determining their expenditures, andaccess to information by sectoral ministries should not change this autonomy.
* the need for clearly articulated medium-term sectoral strategies which reflectreasonable assumptions about what is affordable.
2. 13 The medium term or five-year development plans and goals which sector ministries arerequired to submit to the National Assembly are not tightly linked to available resources or topolicy and institutional changes needed to achieve them. The development of medium-termcomprehensive and costed sectoral strategies, articulating required policy and institutionalchanges should therefore be a medium term objective. The lack of such strategies is anotherfactor limiting good prioritization of expenditures. Indeed, the development of such five-yearsectoral strategies would be the inputs into the country's Five-Year Plan. Such a transport planis being prepared and an education draft strategy paper covering the period 2001-2005 is alsobeing developed. These present an opportunity to develop realistic strategies to guide the futureallocation of resources in these sectors, including facilitating better integration of recurrent andcapital expenditures. Box 2.3 sets out a general approach to medium-term planning andbudgeting.
2. 14 The development of a fiscal envelope within which each sectoral strategy is developed,requires a medium term fiscal framework for the whole government budget, as discussed inchapter 1. Developing realistic sectoral strategies is a complex task, involving considerableconsultation on sectoral objectives as well as costing of alternative proposals. It also requiresrelevant output and outcome information, which may be difficult to obtain. The need forimproved information both on expenditures and their impact, to guide future expendituredecisions, is a recurring theme of this report. One difficulty in developing a medium-termsectoral strategy arises from the work of other sectoral ministries in the same sector. For examplea number of ministries apart from MOET operate educational institutions, and many of thesemay not be fully consistent with to overall educational priorities or strategies.
2. 15 The importance of an overall medium term fiscal framework is that it encourages orforces governments to more carefully prioritize between sectors. The importance of a mediumterm fiscal envelope for each sector is that it encourages or forces prioritization within the sector,but at the same time may provide the incentive to each ministry of some reasonable indication of
15

Vietnam: Public Expenditure Review 2000
medium-term funding within which the sector can plan its operations. A realistic sectoralstrategy may also encourage donor funding to that sector.
2. 16 Given the prior work needed for such an approach which has already been done for theeducation sector, it may be appropriate to use this sector as a pilot for developing a medium-termsectoral strategy. Alternatively the transport sector might be used, based on the draft transportmaster plan. However such an exercise would require full support and understanding by MOETor MOT, as well as by MOF and MPI and the Office of Government. It would be appropriate forVietnam to commence work on such a medium term framework for one sector, on a pilot basis.
Box 23 Medm-term planning and budgetingThe medim-term plannmg and budgetary process consists of three steps
* Macroeconomic and fiscal analysis. Focussing on fiscal sustainability, the budget plan isformulated within a three to five year time horizon which reflects the governmenfs fiscal targets andmacroeconomic forecasts on growth and revenues. This budget plan is updated and rolled over atleast every year, to form the basis for the detailod construction of the following years budget.
* Expenditure policy formulation. Within the aggregate expenditure figures the government decideson new policies and sectoral spending limits over the three to five year period and discusses these inadvance with the legislature. Sectoral spending limits will nornally reflect the spending policies andpriorities set out in the medium term strategy adopted for each sector. They are indicative medium-tern allocations to sectors, not multi-year budget appropriations.
* Detailed budget preparation. Within the broad sectoral limits and any decisions made on newpolicies, individual line ministries prepare their annual budgets. These budgets cover both capital andinvestment expenditures. The budget proposals may cover results statements concerning outputs oroutcomes of the expenditures achieved in the previous year, and proposed for the ensuing year. Thebudget office does not need to negotiate down unrealistic demands for funding by sectoral ministriesas ministries need to stay within the overall forward budget limits previously indicated to them.
REVIEW OF EXPENDITURE NORMS
2. 17 The allocation of funds to and within sectors is guided by a complex set of expenditurenorms, as discussed later in this chapter on fiscal decentralization, in Chapter 3 as well as in thehealth and education Annexes. The norms, which influence the allocation of expenditures withinsectors, once provinces receive their aggregate allocation are referred to as budget allocationnorms. For example the allocation of funds within the education sector by provinces is supposedto reflect a standard pupil teacher ratio and minimum expenditure levels per pupil are set for suchitems as books or equipment. These norms are in some cases inconsistent or impossible toachieve within available funding, are focussed more on inputs than results, and were in manycases determined years ago. They may therefore no longer be appropriate in terms achievinggood prioritization of expenditures.
2. 18 The Ministry of Finance together with the relevant sectoral ministries and the provincesshould therefore undertake a review of allocation norrms, to ensure their continuing relevance inachieving good prioritization of expenditures.
16

Chapter 2 - Budgeting and Public Expenditure Management
IMPROVING THE PUBLIC INVESTMENT PLAN (PIP) PROCESS
2. 19 In the development of the PIP there are several additional issues concerning prioritizationof expenditures. The lack of clear evaluation criteria and of evaluation capacity have beenreferred to above. A further issue referred to is some investment decisions which have lackedeconomic or social justification, in some cases because decision makers have not been presentedwith available project evaluations. It is important that to assist their decision making, decisionmakers be presented with relevant technical and economic evaluations of proven investmentexpenditures and their suggested ranking against other proposals.
2. 20 A further issue concerns the influence of donors on the composition of investmnentexpenditure. Donor interests, which may not reflect national priorities are a problem in manydeveloping or transitional economies. The best response to this problem is well developed andarticulated government policies and priorities, set out in costed medium-term sectoral strategies,as discussed above.
2. 21 More generally there are other ways in which the PIP process might be improved. AnnexA of this PER discusses in more detail the experiences of the 1996-2000 PIP and the lessonslearned, which may be used to improve processes for the forthcoming 2001-2005 PIP, includingan assessment of these issues prepared by MPI. Illustrations given in the discussion of transportsector expenditure in chapter 3 of this report indicate the top heavy and repetitive nature of theproject approval process. They also identify lack of ex post evaluation to review the extent towhich projects achieved their objectives.
2. 22 The discussion of the PIP process in this PER thus indicates a number of areas where thedevelopment and implementation of the PIP can be improved. Many of these issues are alreadybeing addressed in procedures for formulating the PIP for 2001-2005. A key issue is avoidingover optimism about the level of costs and benefits of projects and about the capacity and timeto implement them. A related point is ensuring that not too many projects are included in the PIP,or are commenced. There is also considerable scope for streamlining processes both forevaluation and implementation of projects, including encouraging donors to accept standardizedprocesses, rather than impose their own diverse requirements. There is also a need for better expost evaluation of results achieved from projects, to improve future decision making.
2. 23 The PIP covers a five year period and is fixed plan except that a mid-period review wasundertaken during the course of the 1996-2000 PIP. This was a response to the regionaleconomic crisis and resulted in changes in both the total and allocation of PIP expenditures toreflect these changed circumstances and priorities. MPI has stated that during the comingplanning period it will conduct an annual review of the PIP and adjust it in the light ofimplementation progress and changing economic circumstances.
IMPROVING BUDGET IMPLEMENTATION AND MONITORING
2. 24 Actual payments are made for all levels of government by local offices of the NationalTreasury Department (part of the Ministry of Finance) which has an office in each province ormajor city. In turn each provincial treasury office has sub-offices in each district. Paymentinformation is sent from each of district treasuries daily to the provincial Treasury-by computerlink in the case of 20 provinces and by telegram in the case of the others. Payment information isalso sent daily from provincial treasuries to the National Treasury by computer files. This
17

Vietnam: Public Expenditure Review 2000
provides reasonable information for monitoring of expenditures at an aggregate level and foroverall cash management. Provincial and district governments receive their paymentsinformation from the Treasury for their own monitoring purposes. Linking of the districttreasuries of remaining provinces into the provincial network is planned for 2000 with a linkbetween the National Treasury and provincial goverirnents planned for 2002.
2. 25 Expenditure monitoring at the level of budget items for each ministry is less satisfactory,reflecting limitations in budget preparation. Spending units find difficulty in preparing theirbudgets based on 23 major budget line items (as currently required by law), and in practice only11 of these items are used. Furthermore, as actual expenditures are recorded against the fullclassification, it is difficult to monitor actual expenditures against budget allocations at the lineitem level. The expenditure information at this level is only available after the end of the year.Improvements are needed in budget preparation, particularly capacity in using the classificationsystem, to overcome this problem.
2. 26 There is thus often a considerable divergence between budgeted and actual expenditures.In the case of investment expenditures this may also indicate over-optimism about the ability toimplement projects, as discussed above under PIP processes. At the provincial level thisdivergence also occurs between budget and actual expenditures at the aggregate level, as well asthe composition of expenditures. This appears to reflect the considerable flexibility enjoyed byprovinces in implementing the budget once it is passed, and the incentive for under-estimation ofrevenues by provinces, under which they may retain the additional revenue collected for furtherexpenditure.
2. 27 There are a number of difficulties in obtaining reliable information on details ofexpenditure in Vietnam, reflecting different data formats between ministries and inappropriateclassification or insufficiently deep classification systems, which need improving. For example,it is difficult to reconcile differing figures for transport expenditure between MOF and MOT andMOF and MPI report differing investment expenditure figures. There are classificationanomalies or limitations in a number of important expenditure areas, for example recurrentversus capital expenditure in the transport sector, curative versus preventive expenditure in thehealth sector and salary versus non-salary expenditures in the education sector, identified in thisPER. In addition information concerning social safety net expenditures lacks a sufficientlydetailed classification, making it difficult to make any policy assessment in this area.
2. 28 To overcome these data limitations and improve budget execution and monitoringgenerally, the Government wishes to develop a more extensive, integrated information system,based on a national computer network and including the revenue departments (there are currentlythree different information systems covering revenues-the budget, treasury and tax departmentsystems, which frequently report different revenue figures). It has indicated it will seek technicalassistance and loans from the World Bank to do this.
2. 29 In the current approach of moving gradually to expand the existing treasury system anddeveloping communication links it is important that there be close liaison between the Budgetand Treasury Departments to ensure consistency between any developments in the budgetpreparation system and the treasury system.
2. 30 In the medium term the Government wishes to develop an integrated budget andfinancialmanagement system and has indicated it will seek technical assistance from the World Bank forthis.
18

Chapter 2 - Budgeting and Public Expenditure Management
FISCAL DECENTRALIZATION AND PUBLIC SPENDING
2. 31 Overall 43 percent of total expenditures (1998 figures) are undertaken at sub-nationallevel; this includes 73 percent of education expenditures and 63 percent of health expenditures.This decentralization of expenditure has shown a steady increase since 1992, when 26 percent oftotal expenditures were undertaken at the sub-national level.
2. 32 The Budget Law specifies the taxes that are assigned to each level of government.However, determining the rate structure of all taxes rests with the center although provinces havesome ability to influence collections by changing the base within a framework set by the center.Tax collection is undertaken by the center through the General Taxation Department (GTD). Butlocal governments can retain all or part of collections in excess of the budget figure, creating anincentive to underestimate revenues and to encourage GTD to fully collect these taxes. This alsotends to skew resources in favor of better-off provinces. Thus these taxes are assigned to lowerlevels only in an accounting sense - they do not represent revenue raising powers.
2. 33 While local governments thus have little revenue raising power although they have beengiven the power to raise revenue from some fees, charges and tolls and to obtain voluntarycontributions for the provision of particular services. The operation of these local fees andcontributions which are particularly important at the commune level, is further discussed in thefollowing section of this chapter and in Annex C.
2. 34 The distribution of revenue collections and allocations shows that a substantial proportionof revenues collected in the richer provinces is redistributed to the poorer provinces for spending.However the issue is whether this level of revenue equalization is sufficient to offset the revenueand cost disabilities of the less well-off provinces. In addition the ability of provinces to retainsome revenues in excess of budget estimates may create further inequity between provinces byadvantaging provinces with greater revenues.
2. 35 It is not clear that allocations to provinces are based on a clear assessment of needs, orthat they show equity between provinces. The cash transfers made to poorer (deficit) provincesreduce any inequity but overall there is considerable variation in local, (as opposed to national)per capita expenditures between provincial provinces, with a significant correlation between percapita expenditures and provincial per capita GDP. However there has been some narrowing ofthe gap between richer and less well-off provinces, for example in per capita spending on health.But richer provinces still spend more per head. In part this reflects the system of allocating fundsto provinces using "transfer norms", in which population based norms dominate. These takeaccount of differing geographical conditions between provinces, but not enough to offset revenueand cost disadvantages and to take account of different need factors. Apart from the officialnorms other criteria may be used by MOF during the budget negotiating process. There istherefore a need to make transparent the full criteria used in allocating funds to the provinces.
2. 36 There also appears to be considerable inequality in the provincial distribution of stateinvestment expenditures, reflecting the fact that investment expenditures have previously beenmore growth than equity oriented, with significant concentration in the growth regions of Hanoi-Haiphong and Ho Chi Minh city, although there has been some re-balancing of this since the firsthalf of 1998.
2. 37 The result of this system is that despite their autonomy lower levels of government lackflexibility in their expenditure patterns. Civil service salaries are a first call on funds and
19

Vietnam: Public Expenditure Review 2000
constitute the great bulk of expenditures. This lack of flexibility is particularly true for the lesswell-off provinces, which raise lesser amounts of local revenues.
2. 38 About 4 percent of the budget is allocated to National Programs, which aim to ensure thatminimum levels of expenditure are undertaken on important national priorities - for examplecombating AIDS, providing clean drinking water and increasing literacy. Some of the nationalprograms are particularly important to disadvantaged groups in remote or mountainous areas.The programs are mainly implemented through local govemrnments. However the amountsinvolved are small and achieving the program objectives may require some increase in spending,or alternatively consolidating them into a more general program. Also to avoid substitution forlocal government's own expenditure there is a case for requiring matching financial contributionsfrom local governments. It is also important to ensure that once National Program objectives areachieved that programs are discontinued. The programs should therefore be regularly reviewedto determine whether they are still necessary.
2. 39 Discussion in the health section of this report indicates that the allocations under healthnational programs appear to be more or less evenly distributed across provinces with littleaccount of the specific disease profile of a province. This may indicate that they are not welltargeted.
2. 40 There are a number of possible options in improving the system of inter-governmentalfiscal relations.
* in the Bank's view the government should consider assigning additional revenuepowers to the provinces. These might include such locally based taxes as land andhousing tax, license tax, tax on property transfers, agricultural taxes and commoditiestax (amounting to about 6 percent of total revenues in 1999). Local based collectionmight also significantly increase their yield. This could begin with the urbanprovinces, before being extended to all provinces. However the government believethat it would not be appropriate to consider this at the moment.
* develop a new formula based system for the budget transfer norms governing theallocation of funds to the provinces, providing for a more transparent and equitablebasis. There are several possible approaches. Firstly the formula could reflect costsrequired to deliver a standard level of services in each region, allowing for theirdifferent level of needs in sectors such as health and education, and allowing for costdifferentials. Altematively there could be a much simpler overall formnula. In eithercase a more equitable system of allocating investment expenditures should beconsidered.
* reviewing the current arrangements under which provinces may retain some revenuesin excess of budget estimates, for further provincial spending.
* reviewing the existing National Programs, to determine whether they areappropriately targeted and to what extent some of them are still needed.Consideration could also be given to possible increases in expenditure orconsolidating them into larger programs, requiring matching contributions from localgovernments.
20

Chapter 2 - Budgeting and Public Expenditure Management
LOCAL FEES AND CONTRIBUTIONS
2. 41 Local governments, mainly at the commune level, collect certain fees and voluntarycontributions for local services. These cover services such as water and electricity, educationalcontributions, contributions to local infrastructure, child assistance and the local militia. It isimportant to study the level and structure of these charges in terms of their impact on povertyand the institutional accountability arrangements. In this PER study was therefore undertaken in6 communes covering three provinces-Quang Binh, Ha Tinh and Ha Tay. VLSS and otherrecent studies suggest that the level of fees and contributions raised by communes is higher inthese provinces than elsewhere. However the general issues are likely to be similar even in areaswhere lesser amounts are collected.
2. 42 These charges comprise a significant proportion of commune revenue-ranging from 23percent to 61 percent in the four of the six communes studied. The number and range of feesmakes up a complex system of revenue raising. Specific points emerging from the study were
* although they are in theory levied separately, in practice many of the charges aretreated fungibly, as general revenue for the commune (or in some cases village)budget.
* despite the requirements of Decree 29 none of the six communes publishes its budgetor actual revenues and expenditures, indicating what charges have been collected andhow they have been spent
* individual taxpayers or households have difficulty in determining whether they arepaying the correct amount or in querying the amount of any charge
* there is provision for exemption from fees and contributions, but these are governedby complex regulations which appear to be applied differently between communes
* there is therefore a need to improve transparency and accountability in both theraising and spending of these fees and contributions
* poor households pay disproportionately more as some fees and contribution are leviedper head
The following recommendations therefore arise:
* simplification, by reducing the number of separate fees and contributions
* clearer criteria for exemptions from fees and contributions
* for utility charges such as electricity and water, relating fees as far as possible tohousehold consumption, to encourage efficiency of use
* for other charges, restructuring the charging system so that overall the fees andcontributions system becomes significantly more progressive
* ensuring transparency of how individual household assessments for fees andcontributions are calculated, of the total amounts raised and the way they have beenspent through enforcement of Decree 29, possibly raising this to the level of anOrdinance, to ensure it is fully observed
21

Vietnam: Public Expenditure Review 2000
* strengthening the implementation of Decree 225, which provides a mechanism forhouseholds to raise questions about commune financial issues
* establishing a mechanism for households to seek further clarification fromappropriate authorities outside the commune, if these questions are not satisfactorilyanswered.
22

Chapter 3 - Inter and Intra-Sectoral Composition of Expenditures
CHAPTER 3INTER AND INTRA-SECTORAL COMPOSITION OF EXPENDITURES
COVERAGE OF THE PER DATA
3.1 As reflected in the Government's final accounts8 of actual budgetary expenditures for1997 and 1998, the PER covers recurrent (i.e., wage and wage-related expenditures plus goodsand service expenditures used for operations and maintenance) and capital expenditures that arefunded by a combination of Government's own resources, grants under Official DevelopmentAssistance (ODA) and borrowing (either domestic or external concessional ODA loans). It doesnot cover recurrent or capital spending by ministries from "off-budget-funds"9. This reflects thefact that Vietnam's budget is not fully comprehensive. Expenditure by communes is alsoexcluded, except to the extent of payments made to them by higher levels of government.
3. 2 More specifically, PER figures for Government capital expenditures do not includeinvestments (e.g. infrastructure investments) presently funded by the General Department forDevelopment and Investment's credit (and in the future by the National Development SupportFund) or by SOE's retained earnings or by SOEs using on-lent ODA. Thus roads constructed bythe Ministry of Transport and funded by ODA are included in the capital spending shown in thePER, but power-generation projects constructed by Electricity of Vietnam (EVN) and funded byon-lent ODA are not. While capital spending by SOEs is part of in the PIP, it is not included inGovernment capital expenditure.
ALLOCATION DECISIONS
3. 3 Both theory and international experience suggest that deciding how much to spend ondifferent activities is the most difficult aspect of public-sector budgeting. There is no optimal (orunique) allocation of public goods and services. Beyond the "pure" public goods like nationaldefense, fire services or street lighting, decisions on prioritizing of public expenditures requiredetailed assessment in each country and in all cases have a large "political" component.However, a technocratic approach under which policymakers consider explicitly the objectivesof public sector provision of goods and services, the appropriate instrument for such provision,the competing claims on the budget and, the likely outputs or outcomes of alternativeexpenditure allocation, can be used to take better decisions. Box 3.1 below sets out a decisiontree involving such an approach.
3. 4 Expenditure allocation involves two dimensions: recurrent versus capital expenditure andthe inter and intra sectoral composition of expenditures.
8 The "final accounts" of actual budgetary spending are approved by the National Assembly 11 months after thefiscal year ends.9 As discussed in Chapter 1, the amount of expenditures through off-budget funds is not known although MOFestimate them as I percent of GDP.
23

Vietnam: Public Expenditure Review 2000
Recurrent Versus Capital
3. 5 In Vietnam-as is the case in a majority of developing countries-the rates of return onmany nonwage operations and maintenance (O&M) activities are estimated to be quite large inseveral sectors. Yet the O&M budget has not been adequately funded in those sectors.
3. 6 For example surveys indicate that almost half of the national road network is in poor tovery poor condition and one quarter of the bridges have considerably reduced load bearingcapacity. The situation of the provincial, district and commune networks is even worse. WorldBank estimates suggest that around US$160 million annually is imposed on the economy in theform of higher vehicle operating costs. Furthermore, most of the roads are eventuallyrehabilitated at a cost several times than that of a proper operation and maintenance strategy.Maintenance has also been inadequate in inland waterways, which has led to siltation and loss ofwater depth, hampering the operation of larger vessels and increasing transport costs. In theirrigation sub-sector, consistent under-funding of O&M has led to poor maintenance and under-utilization of existing capacity.
3. 7 There is a better balance of recurrent and capital spending in the health and educationsectors in Vietnam. For example, the findings from the health sector indicate that adequatefunding of medical equipment and drugs has contributed significantly to improved delivery ofservices and better health sector outcomes in Vietnam.
3. 8 The above findings indicate that an appropriate balance between capital and recurrentexpenditures, including a well formulated non-wage operations and maintenance strategy, isimportant in making good use of public resources. Achieving this balance is not easy under the"dual budgeting" approach, with two separate ministries managing the recurrent and investmentbudgets, as is the case in Vietnam and many developing countries. In addition Vietnam has apolicy under which the rate of growth of recurrent expenditure may not exceed the rate of growthof investment expenditures. In the World Bank's view this policy should be re-examined by theGovernment.
3. 9 A bias towards investment as opposed to recurrent expenditures may also reflect donorpriorities since donors, generally prefer to fund capital investments in most sectors. Yet havingadequately trained teachers and adequate textbooks (recurrent expenditure) may be equallyimportant to improving educational attainment as new classrooms (investment expenditure).
3. 10 Analysing the balance between recurrent and central expenditures in Vietnam iscomplicated by Vietnam's classification system being different to the international GFSclassification. For example in Vietnam major repairs are generally classified as recurrentexpenditure and handled in the recurrent budget, rather than classified as capital expenditure aswould be the case under GFS. Thus in international comparisons Vietnam's recurrent expenditurewould be overstated and capital expenditure understated, and the balance in favor of capitalexpenditure is even higher. However in the roads sub-sector part of major repairs are classifiedas capital expenditure.
24

Chapter 3 - Inter and Intra-Sectoral Composition of Expenditures
Box 3.1: Evaluating Public Expenditure Program
Evaluating public expendit programs requires a decision tee approach (as in the Figr 3.1).Such an evaluation of resource allocation within (and across) secors proceeds by asking three questions:(1) What is the rationale for public intervention? (2> What is the right istument for such intervention?(3) What arm the budgetary costs of intrvention?
Figure 3.1: Decision Tree for Evaluating Publie Proams
Md l e rret fa,lure (extrmlibtes, cu rren t land cc fosiqi rRedis(lbution
thlsres tet Foa exam pubhc Prleisi:n
A fertilizer subsidy program may be intended to benefit poor farmers. Howevry (iferallocaVtedWto l
;fn tnan nraienab Wiagemes, it w Insuarmce a e area th fisals postsl [ Fennx~~~~~~~~~~~~~~itee aaFurit n -cange l udofbsenct)
Ideally each prigram in toe budget, toveming boenfi cir and capbe tal expep ditui should bescrutinized to detemine whether ere is a reason for goverment intrienton. Shadn of publiec goodsand conie i for so(ialv quit or rexistribtion hncluding equanl oppony of acess fr basic goods andservibesr provide two posstbr e reasons for ithevention. However, some govertment expenditrmes fail
mais test. For examhie b
* A fegtilizer subsin programs may be intended to benefit poor frmers. However if tallonaef to allfarners on an ahem basis it will also asstst riyher fanners, who erm a gweter area. It is alch possiblenat somee obenficreunds will be wast on poor di ans iniste on of the substi scheme. -lso, if te
price paid tarte fo tertihizer is too high, te main beneficimo may be the supplier o
* In Malaysia, an increase in the number of public doctrs in a district had no effiect on infantmonualitesbeasea ywe pro rowding out tae private doctorsgwt ereas spending on safe waterand sanitation (involving large extemalities) ha a misuaal effee
d Many Goveainvts have Sa Es covertng acnivdra as diverse as beer prodnceon. air services etc,but tere io litee SntgC rewi n for "se atvitre to b d uneren by th GovemmentPrivate selopr cacity exists to provide such product or servicesl and any social or oe wjenvesmay be actieved by regulasion of ptrivat sedorprovision.
i Some govement progu ms can ono be - ustified in terms of dctir redhstaibution effemu. MIosttransfer schemes fall under his category. The man issue hem is whede such programs r heirintended beneficiaries-he poor. In the Indian stote of Andbra Pradesh,7 the rice subsidy scheme-ostensibly targeted fior te poor and needy-eaches more than 65 percent of the population andCOnsumes a sizeable proportion of thie stae's annual budget, leaving fewer resources for othierdesirable activities such as basic healthi ansd road maintenance.
Allocation between and within sectors
3). lI1 Developing the state budget requires a strategic allocation of resoturces betweeni andwithin seetors, such as agriculture, health, education and transport. Some of these decisionsinvolve judgements about social choice-does society value education and health care more than
25

Vietnam: Public Expenditure Review 2000
rural roads that improve market access for the poor? Experience suggests that applying a fewsimple principles can assist decision makers to focus on a few crucial tradeoffs, as set out in Box3.1 above.
3. 12 Looking at the functional composition of the state budget of Vietnam it appears that thegovernment is rightly emphasizing activities where the benefits to society are likely to be higher.Figure 3.2 below shows the inter-sectoral composition of the state budget of Vietnam over thetwo years for which such data are available. These data indicate that the government is focusingmore on the agriculture, education and training, health and transport sectors. Each of thesesectors was given proportionately more resources in 1998 as compared to the previous year.
Figure 3.2. Inter-sectoral composition of public expenditures
Composition of the Budgetin 1997 Coinposition of the Budget in 1998(Functional Classification) (Functional Classifiation)
Agri.forestry& Agri,foestty&
Ouber inigation Ttansponation ther Fshery TmmportatcinOther 5% ID% ki~~~~dustry Ohr6 I
_t 4% hiusyexestpa)tent 4%k terestpamnet Educaiion& 3%
3 % Train I niEcatbn&Public Admin PubEcAdmir hn
10% _ _H'dealth 9% D7%Science,tech. 6%~Sbsie Scienrcjech.St& Sc idui:s J~&environ Cukure &Spons Senvnnott &sponS 12% 7%
1% 4% 13% 1% 4%
3. 13 What is not covered, but is important to analyze at sub-sector or program level, is whatthese resources are actually buying in each sector (e.g., primary vs. secondary vs. tertiaryeducation, preventive vs. curative health care vs family planning, agriculture research andextension vs. non targeted agriculture subsidies). Only at this level can an analysis be made ofwhether the state budget is properly targeting its expenditures to achieve growth or equity,efficiently delivering its services or providing an enabling environment to the private sector toimprove growth. Examples from other developing countries confirm that allocating and spendingresources on social activities does not always ensure that the intended beneficiaries receive thebenefits.
26

Chapter 3 - Inter and Intra-Sectoral Composition of Expenditures
Table 3-1-A: Budget expenditure by economic types and by sector, by central and localgovernment 1997
State Budget Expenditure State BudgetExpenditure
Current ExpenditureTotal Capital of Which *
Expenditure Central LocalExpenditure ** Total Salaries and O&M
WagesTotal in Bil. VND 70,749 21,924 48,424 18,518 16,589 42,710 28,039Agriculture, forestry & 3,712 2,709 1,003 141 694 2,071 1,641irrigationFishery 103 61 42 8 33 42 60Transportation 7,070 6,150 920 112 758 4,316 2,754Industry, of which: 2,583 2,397 186 2 135 1,399 1,183
Energy 514 498 15 0.3 3 237 287Water 699 694 5 1 4 23 676
Education & Training 9,979 2,212 7,767 4,308 2,270 2,340 7,638Health 4,329 925 3,404 939 2,308 1,489 2,839Social Subsidies 9,372 206 9,166 4,037 601 8,547 825Culture & Sports 2,578 1,374 1,203 253 883 1,210 1,366Science, technology & 890 238 651 111 525 670 190environmentPublic Administration 7,138 N/A 7,138 1,583 5,555 N/A N/AInterest payment 1,916 1,916Others 21,079 5,652 15,028 7,024 911Share of total by economic types, % Share in total sectoral
expenditure, %Total 100 100 100 100 100 60 40Agriculture, forestry & 5.25 12.4 2.1 0.8 4.2 56 44irrigationFishery 0.1 0.3 0.1 0.04 0.2 41 58Transportation 10.0 28.1 1.9 0.6 4.6 61 39Industry, of which: 3.7 10.9 0.4 0.01 0.8 54 46
Energy 2.4 2.3 0.1 0.0 0.0 1.1 1.3Water 3.2 3.2 0.0 0.0 0.0 0.1 3.1
Education & Training 14.1 10.1 16.0 23.3 13.7 23 77Health 6.1 4.2 7.0 5.1 13.9 34 66Social Subsidies 13.2 0.9 18.9 18.9 3.6 91 9Culture & Sports 3.6 6.3 2.5 1.4 5.3 47 53Science, Tech. & 1.3 1.1 1.3 0.6 3.2 75 21Envirmt.Gen. Public 10.1 N/A 14.7 8.5 33.5 N/A N/AAdministrationInterest payment 2.7 4.0Other 29.8 25.8 31.0 37.9 5.5Source: Ministry of Finance
Note: * not including expenditure for social support, price subsidies, additional transfers to the lower levels, interestpayment and other current expenditure. ** Including data on major repair.
N/A- Data not yet available
27

Vietnam: Public Expenditure Review 2000
Table 3-1-B: Budget expenditure by economic types and by sector, by central and local government1998
State Budget Expenditure State BudgetExpenditure
Current Expenditure
Total Expenditure of which Central LocalExpenditure ** Total Salaries and O&M
Total in Bil. VND 74,761 23,421 51,340 21,070 16,751 42,953 31,808Agriculture, forestry & 4,591 3,493 1,099 168 708 2,577 2,014irrigationFishery 483 453 30 6 19 426 57Transportation 8,065 6,959 1,106 113 927 4,852 3,213Industry, of which: 2,775 2,708 67 2 12 1,759 1,016
Energy 422 394 29 0.3 4 61 361Water 612 604 7 1 4 227 385
Education & Training 12,750 3,551 9,199 5,544 2,653 3,393 9,357Health 5,207 1,342 3,864 1,060 2,553 1,930 3,277Social Subsidies 8,713 203 8,510 5,135 69 7,902 810Culture & Sports 2,745 1,448 1,297 285 885 1,012 1,733Science, technology & 1,067 353 714 111 583 836 231environmentPublic 6,741 N/A 6,741 1,743 4,998 N/A N/AAdministrationInterest payment 2,050 2,050Others 19,573 2,911 16,662 6,904 1,295Share of total by economic types, % Share in total sectoral
expenditure, %Total 100 100 100 100 100 57 43Agriculture, forestry 6.14 14.9 2.1 0.8 4.2 56 44& irrigationFishery 0.6 1.9 0.1 0.03 0.1 88 12Transportation 10.8 29.7 2.2 0.5 5.5 60 40Industry, of which: 3.7 11.6 0.1 0.01 0.1 63 37
Energy 0.6 1.7 0.06 0.0 0.07 14 86Water 0.8 2.6 0.01 0.0 0.02 37 63
Education & 17.1 15.2 17.9 26.3 15.8 27 73TrainingHealth 7.0 5.7 7.5 5.0 15.2 37 63Social Subsidies 11.7 0.9 16.6 24.4 0.4 91 9Culture & Sports 3.7 6.2 2.5 1.4 5.3 37 63Science, Tech. & 1.4 1.5 1.4 0.5 3.5 78 22Envirmt.Gen. Public 9.0 N/A 13.1 8.3 29.8 N/A N/AAdministrationInterest payment 2.7 4.0Other 26.2 12.4 32.5 32.8 7.7Source: Ministry of FinanceNote: * not including expenditure for social support, price subsidies, additional transfers to the lower levels, interestpayment and other current expenditure. ** Including data on major repair.
N/A- Data not yet available
28

Chapter 3 - Inter and Intra-Sectoral Composition of Expenditures
3. 14 The four sectors, agriculture, education and training, health and transport togetheraccounted for 42 percent of the total state budget in 1998 compared to 35 percent in 1997. Abreakdown of social transfers category, which accounted for over 13 percent of the state budgetin 1997 and nearly 12 percent in 1998 is not available.
3. 15 Little information is available on the residual category "other", covering 25 percent of the1998 budget. Though size of this residual is not exceptional compared to many countries of theregion, more detailed breakdown of this item would make the analysis of public expendituremore complete and useful.
3. 16 Tables 3.1-A, 3.1-B provides a more detailed analysis of 1997 and 1998 expenditures.
REDISTRIBUTIVE ROLE OF PUBLIC EXPENDITURE
3. 17 Although information on the overall benefit incidence of total public spending isinadequate, there is evidence to suggest that Government's existing public expenditures play animportant re-distributive role and helps the poor. However, the designated national safety netprograms are not particularly effective in doing this. On the other hand, the distribution of healthand education-sector spending as well as cash-transfers to poorer provinces are performing thisredistributive role. There remains considerable scope for further improving the favorable impactof public spending on the poor. Better targeting of social expenditures to the poor, throughreallocations within health and education sectors-as discussed later in this chapter-as well asdeveloping alternative mechanisms for increasing income-transfers to the poorest, would help.
Figure 3.3: Lorenz curve for public spending on education, health and householdconsumption, 1998
I 0 0--- 45 degree line
8 40 8 | S | | 2 X | i i | "_l | ~~~~~~Public spending|
Pro-Poor Health & Education Spending~n eduatio
85 0
CL
3. 18Targeing o publc heath ad eduationspendng, epeeialye ueation spending, a
40 on ealth
E
o 20 -**-Household
0 2 0 40 6 0I 0
C urnulative population(%
Pro-Poor Health & Education Spending
3. 18 Targeting of public health and education spending, especially education spending, hasimproved over time and currently total public social expenditures are more equally distributedthan household expenditures. For example, in education, according to VLSS 1998, the poorestquintile receive 18 percent of total public education expenditures (a two percentage point jump in
29

Vietnam: Public Expenditure Review 2000
1997/98 relative to 1992/93) and 26 percent of primary education expenditures (a six percentagepoint jump). Figure 3.3 shows that both health and education public spending is more equallydistributed than household spending. When expenditures from national safety net programs areadded to this, the distribution of total social spending (including safety nets) does not changemuch, because national safety-net programs (excluding pension) comprise a small share of totalpublic spending relative to health and education spending, and its benefits are unequallydistributedl°.
Redistributive Cash Transfers to Poor Provinces
3. 19 Cash transfers to poorer provinces are also performing a useful re-distributive role;supporting a higher level of service delivery than could be funded by their own availablerevenue. In 1998, at least 41 provinces received cash transfers. First, provincial per capitaexpenditures are more equally distributed across provinces than are provincial per capitarevenue-collections. Second, over time (e.g. between 1994 and 1998), provincial per capitaspending has become more equally distributed across provinces. Thus a substantial portion ofrevenues collected in the richer provinces is redistributed to the poorer provinces for spending.However, the issue is whether this level of revenue equalization is sufficient to off-set therevenue and cost disadvantages of the poorer provinces. Rich provinces spend more per capitathan provinces. The fact that the size of these cash transfers are relatively weakly related to thedepth and incidence of poverty in the provinces, suggest that there is room for better targetingthese transfers. Overall it is not clear that there is equity in allocations between provinces.
Other Discussion of Pro-poor issues in this PER
3. 20 More specific issues concerning the "pro-poor" emphasis in public expenditures arediscussed in other parts of this PER. These conclusions are:
* in health, the large share of health care spending financed by individuals orhouseholds has inherent inequities. The burden of user charges on poor households ishigh, and the system of exemption from some fees and charges does not appear tooperate in a pro-poor way. A strategy needs to be developed to assist the poor withtheir health care costs, particularly if there is to be an increase in certain user fees,such as for hospitals.
* in health, the high level of expenditure on curative programs is inequitable, as muchof it is focussed on hospitals, which have disproportionately large numbers of usersfrom the more affluent sections of the community.
* in health, the health insurance program does not benefit many poor or rural dwellers.
* in education, the greatest improvements in participation (enrolment) rates have beenin the lower income groups. Regional variations in enrolment rates have alsonarrowed, but remain high. The level of attainment varies significantly across regionsand may reflect poorer quality education in poor and remote areas.
10The report "Attacking Poverty" shows that the household coverage of the social welfare programs are low and thedistribution of these payments/transfers are very unequal with the lowest quintile receiving only 5 percent of theseincome-transfers (p-125)
30

Chapter 3 - Inter and Intra-Sectoral Composition of Expenditures
* in education, the level of costs borne by parents, both directly and through fees ishigh, and the system of exemption from fees operates in a manner which is far frompro-poor. Higher education is restricted to those who can afford to pay.
* in education, the system of budgetary transfer norms and allocation norms, used toguide the allocation of funds to and within the education sector may not be achievingan equitable allocation of resources between provinces.
* in transport, slow progress in improving rural roads has particularly affected the poor.The inadequate maintenance of rural roads and of inland waterways in the deltaregions has also particularly impacted on the poor.
* the system of local fees and contributions, particularly important at the communelevel, needs to be redesigned to have a more progressive impact overall. It appears tooperate in a somewhat randomly regressive manner.
* in general there appears to be considerable inequity in the provincial distribution ofstate investment expenditures , reflecting their concentration in the economic growthregions of Hanoi-Haiphong and HCM City.
GENDER ISSUES IN PUBLIC EXPENDITURES
3. 21 Gender balance in both expenditure outcomes and processes is another aspect of equity inpublic spending. Vietnam has made great progress in providing education and health careservices to all citizens, regardless of gender. However, that should not distract attention from thefact that there remain gender imbalances in Vietnamese society and in the functioning of theVietnamese economy.
3. 22 This PER thus attempts to examine gender outcomes in the various sectors to the extentthat there is information, the need for additional intervention through public spending and theinstitutional environment which public spending decisions are made. Some conclusions are givenbelow.
3. 23 Knowledge of the institutional environment of decision making offers the possibility ofcorrective action. The greater transparency of public spending allocations advocated in this PERis important, because it would permit the Vietnam Women's Union (VWU) and NationalCommittee For the Advancement of Women (NCFAW) to provide inputs into public spending-decisions.
Agriculture
3. 24 It is difficult to determine how agricultural expenditure and the possible changesdiscussed in this PER impact men and women differentially since both work side by side inagricultural production.
3. 25 The desirability of more spending on agricultural research and extension has been raisedin this PER. To promote greater efficiency and equity, there are two options worth considering.Firstly, women undertake most of the animal husbandry activities and so more research onanimal husbandry-improving the genetic stock through artificial insemination, and selectivebreeding practices-would directly benefit women, by increasing their incomes. Secondly, andmore importantly, targeting agricultural extension contacts to both men and women would be a
31

Vietnam: Public Expenditure Review 2000
step in the direction of promoting (information) equity. It would also promote more efficientutilization of resources, because over the past few years male migration to cities has increasinglyfeminized agriculture in Vietnam.
3. 26 Finally, any moves to reduce the number of agricultural SOEs could promote greatergender equity. Women are very active in the small scale non-agricultural self-employed sector,and might well benefit from withdrawal of SOEs from activities that are particularly suited to thesmall scale private sector activity.
Education
3. 27 Vietnam has made remarkable progress in raising literacy and universalizing primaryeducation in just three decades. Primary enrolment rates do not exhibit large differences betweengirls and boys. Pockets of gender imbalance exist in some regions, but given the stronggovernment commitment to universalize primary education these do not require any publicintervention beyond exhorting parents to enroll all children in primary school. Although out-of-pocket costs of primary education remain significant, (which might then result in parentspreferring to spend money on boys rather than girls education) there is no evidence of genderimbalance at this level of education.
3. 28 The earlier gender-gap in lower secondary schools has closed between 1992-1993 and1997-1998 and there is little difference between girls and boys enrolments, but there may beneed to monitor these recent gains carefully. The opportunity costs of children's time risedramatically beyond primary education, as children are at an age where they can begin to makemeaningful contributions to house work and small contributions to household income. Therewould be a need to seriously consider intervention to maintain parity between girls and boys inthe event of any gender gap developing.
3. 29 Higher levels of education-upper secondary, higher, vocational, and university-exhibitlarger imbalances, with lower female enrolment, but the case for public intervention getsprogressively weaker as one moves up the education ladder. Low female and overall enrolmentsuggests that there is failure in the market for female education and that the state could undertakemeasures to make the financing system work better. At the highest levels of education this mightinvolve greater access of women to loans and at upper secondary level scholarships could be acost-effective way of intervening in this market.
Health
3. 30 Indicators of mortality, morbidity, and nutritional status, on the whole, do not suggestparents actively discriminate between boys and girls. Health care "needs" (loosely defined) aresimilar for boys and girls, at least until they reach puberty. User fees at health care facilities,public and private, are not differentiated on the basis of gender so both the supply and demandside of the children's health care market do not justify gender-based public intervention.However there are several reasons for being watchful.
3. 31 Health contact rates for boys 0 to 4 years of age are consistently higher than those forgirls of the same age but morbidity differences (which define the "at risk" group for curativecare) in this age group are minimal. Further analysis is needed to determine whether thisdifference reflects a parental preference for spending on boys health care, compared with girls.
32

Chapter 3 - Inter and Intra-Sectoral Composition of Expenditures
3. 32 Adult health "needs" are different for men and women, owing largely to the physicaldemands placed on women by the reproductive process. Higher levels of (self-reported) illnessamongst women confirm this difference. For this reason the higher health contact rates observedfor women of all ages in Vietnam should not be viewed as being necessarily advantageous towomen. Nutritional deficiencies amongst adult women are evident in high rates of anemia (53percent), Vitamin A deficiency, and poor maternal nutrition (40 percent chronically energydeficient in 1994). There is, therefore, little doubt that women are at higher risk than men ofbeing sick.
3. 33 In Vietnam maternal mortality is around 160 per 100,000 live births which is quite low incomparison with other countries in the region, but in the mountainous areas-the NorthernHighlands and Central Highlands-it is at least twice the national figure. Utilization of antenatalservices is not comprehensive (28 percent do not use), and reproductive tract infections are amajor cause of maternal morbidity. Moreover, contraception mix is heavily weighted towardsuse of IUD which is associated with severe side effects. Partly as a result of this limited choice ofcontraception, an average Vietnamese woman has roughly 2.5 abortions in her life time, aninordinately high figure by any standards.
3. 34 Thus more can be done to improve reproductive health in Vietnam. Vietnam's familyplanning program has been largely geared towards controlling the rate of population growth,although the focus is now shifting towards reproductive health. There is a need to assess publicspending on reproductive health and utilization of these services independently of othermorbidity factors.
3. 35 Spending on family planning services has shown a marked increase in the past decade,with the share of family planning in total ODA grants and loans for health quadrupling between1996 and 1998. National budget allocations have also increased, but there has been little changein local spending on these services. There is little separate information on reproductive healthinterventions, so it is difficult to determine how public spending on reproductive health meetswomen's needs. But it is fairly clear that there is scope for increasing public spending on thisarea.
Transport
3. 36 Much of public spending in the transport sector is on public goods such as roads andinland waterways, and it is difficult to ascertain individual benefits associated with this type ofspending. There are no obvious gender differences in user charges and no overt discrimination inthe allocation of public spending. Nevertheless one can make some general inferences byexamining the type of economic growth promoted by improvements in transport infrastructure.
3. 37 Improvements in rural roads are likely to have proportionally larger benefits for womenbecause women are very active in marketing farmn output. Increases in farm gate prices lead todirect increases in the cash incomes women receive from sales of farm output. While theseincomes may be actually pooled with other household incomes the actual receipt of theseincomes by women increases their position within the household. Increased investments in ruralroads is therefore likely to benefit women more than men.
3. 38 Another aspect of increased spending on rural roads is its significant use of labor-muchof it provided by women. In some cases this may be "voluntary" contributions. In cases wherewage labor is used, this may provide increased earning opportunities for women.
33

Vietnam: Public Expenditure Review 2000
AGRICULTURE SECTOR
3. 39 Vietnam's agricultural sector provides approximately one-quarter of the country's GDP,generates more than a third of its exports (in value terms) and employs over two-thirds of itslabor force. Although its share has been gradually declining as farm households diversify theirproduction, rice still accounts for almost half of the gross value of agricultural output. Other foodcrops account for another 15 percent, industrial crops for 16 percent and livestock for 17 percent.Agricultural production hit record levels in 1998 and 1999 and Vietnam has moved from being anet food importer in the mid 1980s to being the second largest exporter of rice in the world.
3. 40 The Government of Vietnam (GOV) recognizes the important role of agriculture in thesustainable development of the country and as an engine for broad-based poverty reduction andincome growth. In particular, it considers agricultural processing and off-farm rural serviceactivities as a means of achieving its long-term development goals. The agricultural sector hasbeen performing well despite the recent slow down in the national economy. The average annualgrowth rate in the past five years was between 4 and 5 percent, fuelled by diversification intohigh-value crops (e.g., coffee, cashew nuts, rubber), increases in rice productivity, and expansionof cultivated area including irrigated rice. As a consequence, agricultural income rose by 61percent between 1993 and 1998 and was the main source of poverty reduction in rural areas.
Public Spending in the Agricultural Sector
3. 41 Public spending in agriculture, if properly allocated and managed, can improveagricultural productivity and provide beneficial spill-over effects, inducing more privateinvestment in the sector. Research has shown that public spending on rural roads, andagricultural research and extension is positively associated with agricultural productivity growthand poverty reduction. However if public spending in agriculture is poorly targeted, it cancrowd-out private investment and lead to inefficiencies. Examples of these include subsidizinginefficient crop sub-sectors or investing in marketing or processing activities that can beeffectively managed by the private sector.
3. 42 Despite the increase in recent years, public spending on agriculture is still relatively lowand accounts for roughly five to six percent of the state budget (6.3 percent in 1998). This islower than several Asian countries such as China, India and Thailand, where the budget share foragriculture was between 8 and 16 percent in 1990-93. As a share of GDP, public expenditureson agriculture were 1.3 percent in 1998.
3. 43 The comparisons, however, do not necessarily constitute an argument for a higher levelof public spending in agriculture. The performance of the agricultural sector is related not only topublic expenditures in the sector, but also to public expenditures in transport, education, andhealth in rural areas. In spite of the comparatively low level of public expenditures inagriculture, the agriculture sector has performed well when compared to other countries in theregion. With the exception of China, Vietnam's agricultural growth has been the strongestamong a wide range of developing, and developed countries. Before advocating a higher level ofexpenditures in agriculture, it would be appropriate to see if the composition of capital andcurrent expenditures reflects the overall objectives and priorities established by the government.
34

Chapter 3 - Inter and Intra-Sectoral Composition of Expenditures
Table 3.2. Public Expenditures In Agriculture
1992 1995 1997 1998
Public Expenditures in Agriculture (in 1current VND billion)
1,125 3,495 3,712 4,591
Capital Expenditures 861 2,782 2,709 3,493
Current Expenditures 1 1 9__________________________264 713 1,003 1 ,099
Public Expenditures in Agriculture (in 1994constant VND billion)
1,358 2,884 2,567 2,855
Capital Expenditures 1,039 2,295 1,873 2,172
Current Expenditures 319 588 694 683
As a percentage of the State Budget5.4% 7.2% 5.2% 6.3%
As a percentage of total GPD
1.0% 1.6% 1.2% 1.3%
As a percentage of agricultural GDP
3.0% 5.6% 4.6% 4.9%
Per agricultural person (in 1994 VND)! _________________________ na 57,113 49,221 54,020
Per unit of agricultural labor (in 1994|VND) na 119,590 103,465 112,437
Sources: Data from 1992 to 1995 are from UNDP (1996), several tables.
Data from 1996 are from the World Bank (1999b) - Table 5.5
Data for 1997 and 1998 are from the Ministry of Finance.
3. 44 The following observations can be made on the composition of public spending in
agriculture.
D The irrigation sub-sector accounts for 50 percent of the agricultural budget; two
national programs on reforestation and land reclamation roughly account for 14 and
17 percent, respectively, and forestry services and forestation about 10 percent. The
following table 3.3 sets out the position.
* On average, the capital-current mix is about three to one. Irrigation receives the major
share of capital expenditures (about 50 to 80 percent) whereas current expenditures
are more evenly distributed between various subs-sectors with the largest share going
to forestry and related services (about 20 percent).
* For 1997 and 1998, current expenditures were used for goods and services (about 70
percent), salaries and wages (around 15 percent) and subsidies and transfers (around
15 percent). Little information is available on the purposes and results of these
subsidies and transfers. Between 56 and 60 percent of total agricultural expenditures
were spent at the central level; the rest was spent by local governments.
35

Vietnam: Public Expenditure Review 2000
Table 3.3 Capital and current expenditures by agriculture sub-sector 1997-1998
(in million VND); (shares of total expenditure appear below each entry)1997 1998
Total Total Total Total Total TotalExpenditwe Capital Current Expenditure Capital Current
Expenditure Expendthure Expenditure ExpenditureTotal 3,712,494 2,709,279 1,003,215 4,591,435 3,492,647 1,098,778
100% 73% 27% 100% 76% 24%Of which: Cultivation 130,725 72,758 57,967 189,373 111,623 77,750
4% 2% 2% 4% 2% 2%Animal husbandry 85,448 52,669 32,749 77,416 49,143 28,272
2% 1% 1% 2% 1% 1%Veterinary activities 65,970 17,898 48,072 68,917 18,114 50,804
2% 0% 1% 2% 0% 1%Forestry and relatedactivities 315,235 104,775 210,460 363,703 130,682 233,021
8% 3% 6% 8% 3% 5%Forestation 48,815 26,459 22,356 85,863 75,806 10,057
1% 1% 1% 2% 2% 0%Fixed cultivation andrelated activities 270,289 194,414 75,875 188,721 66,188 122,533
7% 5% 2% 4% 1% 3%Irrigation and relatedactivities 1,806,371 1,651,112 155,259 2,469,736 2,307,102 162,634
49% 44% 4% 54% 50% 4%National programs onreforestation and landreclamation 642,702 489,576 153,126 642,702 489,576 153,126
17% 13% 4% 14% 11% 3%Services for cultivationand animal husbandryincluding extensionservice 280,000 405,000
7,5% 9%Other national targetedprogram and expenditure 66,939 100,104
1,5% 1%
Source. Ministry of Finance (MOF)
Regional distribution of public expenditures
3. 45 In 1997 and 1998, 56 to 60 percent of total agricultural expenditures were spent at thecentral level; the rest was spent by local authorities. For irrigation, fixed cultivation andsedentarization (re-settlement), and the two national programs on forestation and landreclamation, a higher percentage is spent at the central than the local level. However, for othersub-sectors, such as cultivation or animal husbandry, the largest share of the public expendituresis spent at the local level.
36

Chapter 3 - Inter and Intra-Sectoral Composition of Expenditures
3. 46 As Figure 3.4 demonstrates, there seems to be a positive, albeit not very strongrelationship between provincial per capita agricultural GDP and provincial per capita agriculturalexpenditures. This may suggest that state expenditures do not significantly contribute toredistribution among the provinces to alleviate poverty. For example, in 1998 agriculturalexpenditures in Quang Binh were VND 35,875 per agricultural person (about $2.5 per person)whereas in Ho Chi Minh City (HCMC) agricultural expenditures were VND 187,600 peragricultural person (about $13.4 per person). This suggests that better-off provinces spend moreon agriculture than poorer ones. Poor provinces, such as Quang Binh, are dependent on the statefor a large share of their expenditures and resources and therefore have less control over theirinter and intra-sectoral expenditures, except through voluntary contributions. Better-offprovinces, such as HCMC, which generate surplus revenues above the targets set by thegovernment, have more fiscal flexibility because they can allocate their surplus revenuesaccording to their own priorities. This also means that the quantity and quality of agricultural andrural services vary significantly between provinces.
Figure 3.4: Per capita Agric Spending vs. Per capita AG GDP by province, 1998 (VND'000)
Ag
Spn 100 __
ding 80
pe _ ___
Pe
Ca 0i __ _ _ _
20*
0 500 1,000 1,500 2,000 2,500 3,000 3,500
per capita Ag GDP
Data Source: Ministry of Finance
3. 47 Another important issue is that once the provinces receive their transfer from the statebudget, the trickle down to the districts and communes is not very transparent. Even if the stategovernment allocates more funds to poorer provinces, these funds will not necessarily reach thepoorest communes or districts.
3. 48 However, other GOV mechanisms of public expenditures are currently in place to targetpoverty, taking into consideration regional disparities. The HEPR (Hunger Eradication andPoverty Reduction Program) the Poorest Communes Program, the recently initiated five millionhectare Reforestation Program and other programs are more comprehensive approaches topoverty issues in less favored regions, as opposed to more specific agricultural sector programs.
Research and Extension Services
3. 49 It is widely recognized in agriculture economics literature that agricultural research andextension services are public goods. Moreover, in Vietnam there is evidence that it providesbenefits to poor farmers. Vietnam also has a lot of potential to increase its crop productivity.
37

Vietnam: Public Expenditure Review 2000
3. 50 Yet the state contributes very little to research. In the three years 1997-1999, MARDspending on agricultural research was about VND 80 billion, which is equivalent to 1.7 percentof the public agriculture expenditures. In comparison, China spends about 6 percent of itsagricultural expenditures on research, while Malaysia and Thailand invest about 10 percent;other Asian countries spend at least 3 percent.
3. 51 Returns to investment in agricultural research are known to be very high world-wide.Thus, one possible way of raising agricultural productivity in Vietnam and enhancing itscompetitiveness in world agricultural markets, is to increase investment in agricultural research.
3. 52 There are about 30 agricultural research institutions of which about 18 are operated byMARD, and the rest by agricultural SOEs or by autonomous but state funded institutions. Buteach institution has a fairly narrow research focus, a small budget and staff and littlecoordination with other research institutions. A 1996 GOV decision to substantially re-organizethe agricultural research system has been only partially implemented.
3. 53 With regard to extension services, according to MOF total public expenditure onagricultural extension in 1998 was VND 405 billion of which MARD spent 27 billion. Howeverreflecting classification problems, this figure is known to include expenditures on other activitiesand the exact amount relating to agricultural extension is unknown although it comprises thebulk of this amount. Extension services assist the adoption of improved technology by farmers.The national extension service suffers from a scarcity and poor training of staff and limitedefficiency. Only 70 percent of districts have an extension station and only 30 percent ofcommunes have an extension unit. A total of 2,757 extension workers at the province and districtlevel serve a farming population of 10 million households. The extension budget should beincreased at least to expand extension services to all districts and communes, starting from thepoorest communes.
3. 54 To achieve better results any budget increase would need to be accompanied byinstitutional strengthening that includes strong linkages between research and extension, areorganization of extension services that avoids the current practice of extension staff beinginvolved in commercial activities such as selling inputs (e.g. fertilizer) to farmers and ensuresparticipation of farmers and agro-industry representatives in extension advisory boards.
Irrigation Sub-Sector
3. 55 About 80 percent of the 7 million ha. of cultivated land area in Vietnam is equipped withsome sort of irrigation, the majority of which is dedicated to rice. The Ministry of Agricultureand Rural Development (MARD) is responsible for primary irrigation infrastructure provision,which is then operated by local government, while local governments (provinces, districts andcommunes) are responsible for secondary and tertiary infrastructure. Large and medium scaleirrigation works are managed by 172 Irrigation Management Companies (IMCs). MARD alsodirectly manages three inter-provincial irrigation schemes.
3. 56 Of the four million hectare of cultivated paddy, three million are equipped with somekind of irrigation. However, due to incomplete systems, planning or design deficiencies,deterioration, lack of water and poor operations, only 2 million hectare are actually irrigated.While total public spending on irrigation has almost doubled since 1992, the share dedicated torecurrent expenditures shrank from about 20 percent in 1992/93 to 10 percent in 1997/1998.Although about 50 percent of operation and maintenance (O&M) costs are now covered by the
38

Chapter 3 - Inter and Intra-Sectoral Composition of Expenditures
IMCs-the expenditures of which are not included in the state budget-the allocation to coverthe remaining portion of O&M costs is not enough to effectively maintain the existing systems,resulting in deteriorating infrastructure and low capacity utilization.
3. 57 According to MARD experts, the total estimated value of irrigation works in 1994 priceswas VND 60 trillion. The estimated regular O&M cost needs of the existing irrigation system areVND 1,200-1,500 billion per year. Irrigation fees collected from water users represent aboutVND 600 billion per year. The shortfall between irrigation O&M costs and user fees is partiallycovered by the budget through state subsidies to the IMCs of about VND 100 billion per year,and donor grants. But even after allowing for voluntary contributions from farmers (either inlabor or in cash) to maintain and repair tertiary canals in the villages there is frequently amaintenance gap which results in deterioration of the system.
3. 58 Irrigation fee. The basic guidelines for charging water fees were set in Decree No.112enacted in 1984 at the rate of 3 to 8 percent of paddy yields (payable in paddy or in equivalentcash terms). The rates vary by type of irrigation and drainage system used, quality of servicedelivery, and by season. They are approved by each Province People's Committee and can varyquite substantially between regions. While most IMCs incur losses, some have much higherlevels of cost recovery than others.' 1
3. 59 According to the MARD, the irrigation fee would have to be doubled to cover thecurrent needed level of regular O&M costs. But financial and organizational reforms to improvecost recovery and system performance may avoid or reduce the need for an increase in the levelof fees. The collection system itself needs improvement and farmers' willingness to pay wouldbe increased by an improved quality of service. Raising the irrigation fee should only beinstituted once the current collection system and quality of service are improved.
3. 60 On the financial side, several measures could be considered.
- The irrigation fee is based on the volume and type of crop production12 rather than onthe volume of water use, resulting in excessive and inefficient water usage. Basingthe fee on volume of water consumed would be preferable-as has already beensuccessfully implemented in some localities.
- Commodity targets by which farmers are encouraged to grow certain crops such aspaddy through increased public investment and support discourage the allocation ofwater to those crops with the highest returns from water use and reduce farmers'willingness to pay the fee. The need for commonly targets should be reviewed.
* The water fee is collected in paddy or its equivalent in cash. The local councildetermines the price at which measures of rice are converted to cash and sets the priceat 10 percent below the market price to encourage payment in cash. This means thatthe fee varies with the price of paddy rather than being determined by the supply anddemand for water. It would be preferable to have payment in cash only.
1' According to a MARD official, a pumping station in Ha Giang Province was recently sold to a private company.In 1998, this company turned in substantial profits by raising the water fee and improving its collection. This couldbe an example to set for other IMCs which could be privatized or their management contracted out to privateenterprises.12 The water fee for other crops (such as vegetables or sugar cane) is priced at 40 percent of the fee charged forpaddy production.
39

Vietnam: Public Expenditure Review 2000
3. 61 On the organizational side, institutional reform is needed, so that farmers participate inand contribute to operation and management. At present there is no incentive for the farmers topay their fee in full and there is equally no incentive for the local authorities or the IMCs tocover all their O&M costs. An efficiently functioning system would link water users rights andresponsibilities with the benefits and costs of the system. One way is to have water userassociations where farmers are responsible for financing, operating, and maintaining the systemand where the benefits from the schemes accrue to them directly.'3
Forestry Sub-Sector
3. 62 GOV programs in the forestry sub-sector relate to developing sustainable use ofVietnam's forests, which are located mainly in poor upland areas, and preventing deforestation.The last decade has seen a proliferation of policies and programs dealing with to the relatedissues of forestry, watershed and soil management. In 1993 the Government established the"Regreening the Barren Hills" program, covering extensive areas of the northern uplands andcentral highlands. This involved transferring parcels of land to householders who were then to bepaid by the state for forest protection and replanting. However the program experiencedimplementation difficulties, with high costs in relation to the number of trees planted, althoughthe number of trees planted was quite large.
3. 63 A new and more ambitious program to speed up reforestation , the Five Million HaReforestation program, was launched in 1998. However a number of issues appear to needaddressing for more effective implementation, including criteria for selecting the land to be used(given possible alternative uses in agriculture or agroforestry activities) and how to provideappropriate incentives to households for sound forestry management.
3. 64 Careful management of this program is needed to ensure it contributes to economicgrowth and the reduction of poverty in the highland regions, and does not lead to unsustainableagricultural practices and environmental degradation and a widening gap between highland andlowland incomes.
Contribution To Agricultural Production And Processing Activities
3. 65 Rural farm households provide the bulk of agricultural output, but agricultural processingand marketing activities for export are dominated by SOEs. Central and local government ownover 1,400 enterprises in the agricultural sector.
3. 66 These are involved in a variety of activities including the production and processing ofsugar, rubber, coffee, tea, seeds, livestock breeds, fertilizers, etc. While these SOEs no longerreceive direct subsidies from the budget, they receive indirect subsidies such as loans atconcessionary interest rates, debt forgiveness, and tax exemptions. A major problem is a lack ofinformation concerning their amounts and purposes of such indirect subsidies. Other indirectsubsidies include trade restrictions on some commodities to protect local SOEs. For example, the
13 Water user organizations have already been successfully implemented in parts of Vietnam. In Tuyen QuangProvince, irrigation systems are now successfully managed and maintained by a water user association that tookover the responsibilities of the previously existing IMC. Similarly, a water user association project that manages theirrigation systems of North Nghe An and Son Chu, has received very high performance ratings. These schemes havebeen highly effective in terms of increasing farmers' productivity due to more reliable water supply, reducingmaintenance costs, increasing collection of water fees, improving water use and irrigation efficiency, and decreasingsubsidies required from the state.
40

Chapter 3 - Inter and Intra-Sectoral Composition of Expenditures
sugar industry is indirectly subsidized through local policies favoring conversion of land to sugarcane production and restrictions on imported sugar which is cheaper than locally produced sugar.According to analysis by Goletti and Rich (1998), the net cost to society of the government'sprotection of the sugar industries is about USD 92 million per year, mainly through higherconsumer prices.
3. 67 Evidence from different studies suggests that many of the SOEs in some agriculture sub-sectors are loss-making and are inefficient. In the sugar sector for example, many refineries arenon-competitive and are located in areas where not enough sugar is being produced, resulting inunder-utilized capacity. The Government itself recognizes that in the countryside, agriculturaland industrial facilities operate inefficiently (sugar companies, cement, brick making, state-owned farms).
3. 68 Table 3.4 shows state budget transfers to support certain SOEs. For example, fertilizerimporting SOEs received an interest rate subsidy of 22 billion VND in 1998, an amount almostequal to the total MARD budget on agricultural extension in that year. Total subsidies in 1997for the three types of SOEs shown below were higher than the state budget on agriculturalresearch. On the other hand, SOEs are still a significant source of revenue to the state. Forexample, in 1998, budget revenues from agricultural SOEs amounted to almost VND 1.3 trillion.It remains to be determined, however, what is the net contribution of these SOEs-net ofefficiency losses to society involved in supporting SOEs in this variety of ways, including pricesupport to farmers. These questions need to be addressed in a future study.
Table 3.4: Budget support to SOEs (in million VND)
Type of Support 1996 1997 1998
1. Interest rate subsidies for food 67,400 30,250 18,310
2. Interest rate subsidies for imported fertilizer 21,687 50,160 21,629
3. Payment for maintaining national hybrid livestock and 6,000 9,000 11,000poultry
Total 95,087 89,410 50,940
Source: MOF, Department of SOEs
3. 69 Supporting loss-making SOEs leads to two kinds of problems: (a) SOEs do not face ahard commercial constraint, which reduces their incentives to increase efficiency; and (b) theprivate sector does not face a level playing field and is discouraged from investing in these areas.More specifically, state support for agro-food processing SOEs in Vietnam crowds out capital tosmall and medium scale rural enterprises. For example, of the Vietnam Bank for Agricultural andRural Development's portfolio of medium and long-term loans, 85 percent is currently allocatedto SOEs and only 15% to non-SOEs or private organizations (see ANZDEC-IFPRI, 2000).
3. 70 Within the central SOEs engaged in agriculture, about 17 percent were making losses in1998 (see Table 3.5). It appears that in 1998 that large losses made by a few SOEs are more thanoffsetting the profits made by the majority of SOEs, with total net losses (total losses-totalprofits) amounting to VND 288 billion. (These figures need to be treated with some caution as itis not known on what basis they were calculated.)
41
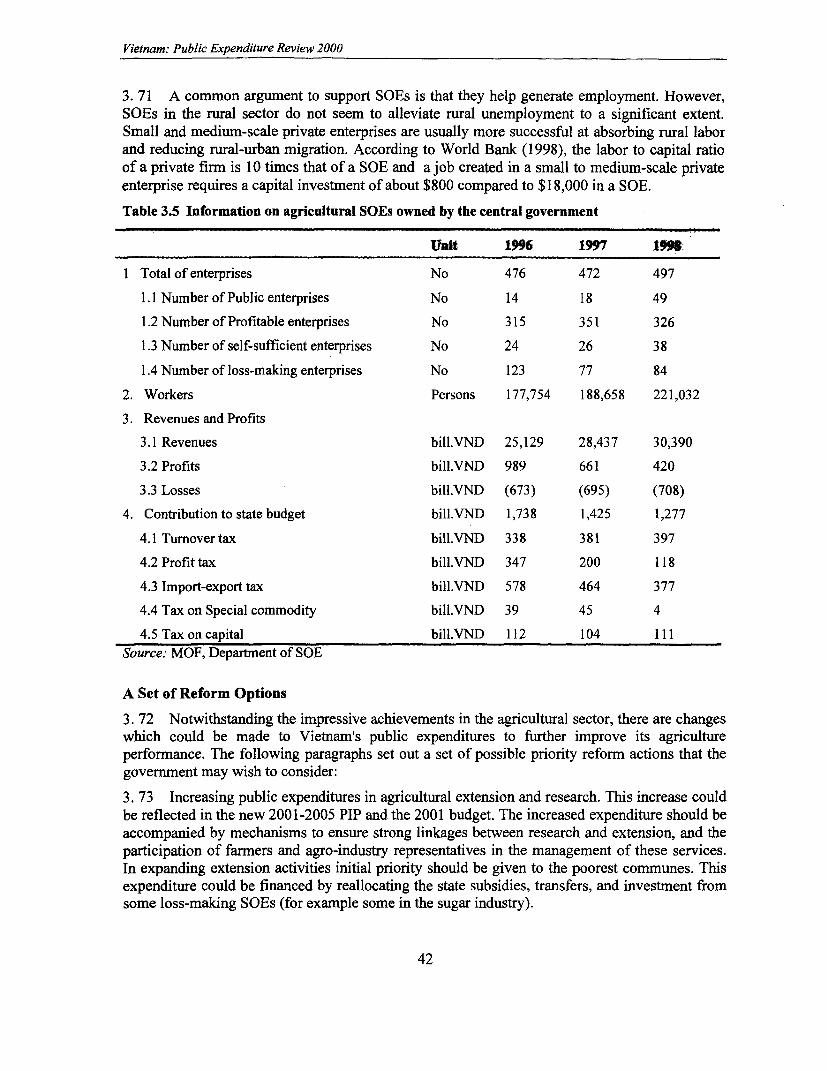
Vietnam: Public Expenditure Review 2000
3. 71 A common argument to support SOEs is that they help generate employment. However,SOEs in the rural sector do not seem to alleviate rural unemployment to a significant extent.Small and medium-scale private enterprises are usually more successful at absorbing rural laborand reducing rural-urban migration. According to World Bank (1998), the labor to capital ratioof a private firm is 10 times that of a SOE and a job created in a small to medium-scale privateenterprise requires a capital investment of about $800 compared to $18,000 in a SOE.
Table 3.5 Information on agricultural SOEs owned by the central government
Unit 196 1997 1998
I Total of enterprises No 476 472 497
1.1 Number of Public enterprises No 14 18 49
1.2 Number of Profitable enterprises No 315 351 326
1.3 Number of self-sufficient enterprises No 24 26 38
1.4 Number of loss-making enterprises No 123 77 84
2. Workers Persons 177,754 188,658 221,032
3. Revenues and Profits
3.1 Revenues bill.VND 25,129 28,437 30,390
3.2 Profits bill.VND 989 661 420
3.3 Losses bill.VND (673) (695) (708)
4. Contribution to state budget bill.VND 1,738 1,425 1,277
4.1 Turnover tax bill.VND 338 381 397
4.2 Profit tax bill.VND 347 200 118
4.3 Import-export tax bill.VND 578 464 377
4.4 Tax on Special commodity bill.VND 39 45 4
4.5 Tax on capital bill.VND 112 104 111Source: MOF, Department of SOE
A Set of Reform Options
3. 72 Notwithstanding the impressive achievements in the agricultural sector, there are changeswhich could be made to Vietnam's public expenditures to further improve its agricultureperformance. The following paragraphs set out a set of possible priority reform actions that thegovernment may wish to consider:
3. 73 Increasing public expenditures in agricultural extension and research. This increase couldbe reflected in the new 2001-2005 PIP and the 2001 budget. The increased expenditure should beaccompanied by mechanisms to ensure strong linkages between research and extension, and theparticipation of farmers and agro-industry representatives in the management of these services.In expanding extension activities initial priority should be given to the poorest communes. Thisexpenditure could be financed by reallocating the state subsidies, transfers, and investment fromsome loss-making SOEs (for example some in the sugar industry).
42

Chapter 3 - Inter and Intra-Sectoral Composition of Expenditures
3. 74 A move towards improving irrigation service delivery and the rate of cost recovery. Thiswould involve basing irrigation charges on water consumption and improving the collectionsystem.
3. 75 Extension of pilot projects for developing water user associations. The benefits of wateruser organizations in terms of water use efficiency, cost recovery, and improvement in servicedelivery have been proven in Vietnam and elsewhere. The provincial pilot programs of TuyenQuang and North Nghe An and Son Chu could be extended to other areas.
3. 76 This PER indicates areas where further information and or analysis is desirable. Theseinclude:
* who are the beneficiaries of public spending in the agriculture sector, including ananalysis of whether or not the intended beneficiaries-particularly those living in theremote and mountainous regions-are benefiting from irrigation, fertiliser and pricesupport subsidies;
* the impact of the agriculture SOEs on the economy including their net contribution tothe state budget.
HEALTH SECTOR
3. 77 Vietnam has made impressive progress in improving the health of its population duringthe last 3-4 decades and its health indicators and much better than would be expected for acountry at its level of income per capita. But the analysis below suggests that both greaterefficiency and equity can be achieved by policy and expenditure changes.
Health Indicators in Vietnam
3. 78 Vietnam has achieved impressive gains in the health status of its population:
* Infant Mortality. There has been a sharp decline in the infant mortality rate during thelast four decades-from about 160 per 1,000 live births in 1960 to 90 in 1975-80, 75in 1983, 45 in 1989, and to 44 in 1989-1993 and the rate may have declined further to28.2 per for the period 1992-96. Vietnam's current level of infant mortality is amongthe lowest in the East-Asia region and comparable to countries with substantiallyhigher levels of per capita income. However there are large rural-urban, regional andincome disparities, mainly due to differences in access to health services, childnutrition, and environmental health (such as availability of safe drinking water andsanitation).
* Morbidity. During the last 20 years there has been a major decline in the share ofcommunicable diseases in morbidity, from 50-56 percent of morbidity in 1976 to 27percent in 1997. This reflects the success of communicable disease-control programs,especially the expanded program of immunization. Despite the relative decline in theincidence of infectious diseases, the latter still remain a public health problem,particularly some new or reemerging diseases, such as tuberculosis, HIV infections,dengue fever and Japanese encephalitis. Malaria remains a major public healthproblem in the mountainous and ethnic minority areas of the country.
43

Vietnam: Public Expenditure Review 2000
* Child Malnutrition. But Vietnam's performance in the area of child malnutrition hasbeen less than impressive. Child malnutrition rates in Vietnam are among the highestin the region. A recent national survey of nutrition indicates that 39 percent ofchildren under the age of 5 years are malnourished in terrns of weight-for-age and 34percent are undernourished in terms of height-for-age.
Principles of health service provision in a transition economy
3. 79 In a market economy the public sector is not the exclusive provider or financier of healthservices. As private health providers and drug vendors enter the market, the government needs toestablish the legal framework for the private sector, setting minimum quality-of-care standards,promulgating laws and decrees that govern private and public providers, and enforcing thesethrough a system of regular inspections and monitoring.
3. 80 In the transition to a market economy as in Vietnam, out-of-pocket payments byhouseholds or individuals for utilizing health services typically increase sharply. This oftenleaves the poor in a vulnerable position, unless there are well-functioning mechanisms forexempting the poor from the increase in health-care costs. It is therefore important for thegovernment to take on a direct role in financing health-care expenditures of the poor.
Health Service Delivery in Vietnam
3. 81 Service Provision. Service delivery is organized along a four-tiered pyramid, withcommune health centers at the bottom of the pyramid. Above these are the inter-communalpolyclinics and their referral organizations (i.e. the district hospitals), both of which are run bythe district health bureaus. Provincial hospitals form the second tier in the pyramid, and at thevery top are central hospitals and specialty institutes, which are run directly by the Ministry ofHealth. One of Vietnam's major achievements over the last 30 years has been the establishmentof an extensive network of commune health centers throughout the country. With 7,019 personsserved by a commune health center on average, Vietnam's ratio is significantly better than that ofneighboring Cambodia (15,000) and comparable to that of Thailand (6,762)-a country havingfour times its per capita income.
3. 82 In the last ten years there has been an significant growth of private health services.According to VHSR, 1999, most of these providers-about 18 percent-are drug commissionsellers, followed by general practitioners' clinics (16 percent), traditional medicine clinics (14percent), private pharnacies (14 percent), and nursing homes (12 percent). Most private healthfacilities are located in urban areas, although many rural areas have significant numbers ofprivate health providers as well. While the private provision of primary health services hasexpanded rapidly, that of secondary and tertiary health services has increased relatively littleduring the last 10 years. It is estimated that there are only six private hospitals in the entirecountry.
3. 83 Service Utilization. Improved health outcomes do not depend on the availability of healthservices, but their utilization. Data from health facilities indicate that each Vietnamese has anaverage of 1.7 annual consultations with the public sector health services, and that the annualhospital inpatient admission rate is 68 per 1,000 persons. This public-sector contact rate of 1.7per person compares favorably with those countries in the region. Vietnam's utilization rate is
44

Chapter 3 - Inter and Intra-Sectoral Composition of Expenditures
lower than that of Sri Lanka, China and Singapore-all countries that have substantially higherper capita income levels-but greater than that of India, Pakistan, Cambodia and Malaysia.
3. 84 Users of Public Health Facilities. Available data from VLSMS indicate that the users ofpublic hospitals are largely drawn from the highest income quintiles, while commune healthcenter users are drawn disproportionately from the poorest quintiles. For instance, in 1998, 36percent of all public hospital users were drawn from the 20 percent of the highest incomepopulation and 61 percent were drawn from the 40 percent of the highest income population. Onthe other hand, the poorest quintile were heavily under-represented among hospital users relativeto their share in total population, constituting only 8 percent of total hospital users.
3. 85 Several factors are responsible for this pattern of usage. First is the urban location of themajority of hospitals, which improves geographical access to hospitals for urban dwellers, whoare typically better-off than rural residents. Second, because the direct private cost of usinghospital services is large, they tend to be used by higher income individuals. Third, the spread ofhealth insurance between 1993 and 1998 may have reinforced this position, since individualswith health insurance coverage tend to be better off than those without insurance coverage andthe health insurance agency largely reimburses hospital costs, but not commune health centercosts.
Levels of and Trends in Health Expenditure
3. 86 Total health expenditure-both public and private (household) -was estimated at VND28,773 billion or VND 383,226 per capita for 1998. This is equivalent to US$27.41 per capita or8 percent of GDP and places Vietnam among those countries in Asia that spend the most onhealth care. Only Malaysia, Thailand and South Korea spend more on health per capita thanVietnam.
3. 87 Public health expenditure. The public expenditure data show an impressive increase inpublic spending on health over the 1991-98 period. Both total and per capita public spending onhealth increased more than two-fold in real terms representing an annual rate of growth ofaround 12-14 percent, while health spending as a share of GDP and as a share of totalgovernment expenditure also increased, albeit at more modest rates. Such high growth rates inpublic spending on health reflect a high level of commitment by the government of Vietnam tothe health sector.
3. 88 But even after these increases, which come on a low base, per capita public healthspending in Vietnam was only VND 80,844 ($5.78)-or 1.4 percent of GDP and 7.0 percent oftotal government expenditure-in 1998 (if health insurance expenditure and hospital user feesare excluded). In absolute terms, Vietnam's public health expenditure of $5.78 is less than one-half of the $12 recommended by the World Development Report 1993 as being needed to financean essential package of health services, including public health, for a low-income country. Toachieve this level of spending, Vietnam would need to spend an additional US$468 millionannually.
3. 89 Sources of Financing. While the government is a large provider of health services in thecountry, its role in the financing of health expenditures is modest. In 1998, the publicexpenditure share in aggregate health spending was only about 20 percent, with householdsaccounting for the remaining 80 percent. One consequence of this heavy reliance on privatefinancing is that the poor have to bear the burden of high user charges at public health facilities.
45

Vietnam: Public Expenditure Review 2000
In 1998, the bulk of the public spending on health was undertaken by provincial governments,followed by the central government, health insurance and communes.
Figure 3.5: Total Public Spending on Health, Vietnam, 1991-98
9 70,000Ca-o 8 .e q 1 | " | - l | | l | 60,000
S !, Fi | | E s E S I I ~~~~~~~~50,000' 0ec 40,000>
4c3 30,000
c: 2 |ll|_0,000>2>
1000
0 0 M T .1991 1992 1993 1994 1995 1996 1997 1998
Cost-Effectiveness of Public Spending
3. 90 The number of public-sector service consultations and inpatient days per million of VNDof public health spending (measured in constant 1994 VND) has decreased over the period 1992-98, despite a recent upward trend. This decrease in productivity does not appear to reflectimproved quality of contact or the impact of preventive health programs. This suggests it may bepossible for Vietnam, with policy changes and expenditure reallocation, to obtain superior healthoutcomes without a large increase in health spending.
Composition of Government Health Expenditure.
3. 91 There are two important observations to be made on the economic composition of publicspending on health.
* First, capital spending appears comprises a large share of the state health budget,although this share has declined from 28 percent in 1991 to 21 percent in 1998.Nearly one-half of capital spending over the years (but rising to 82 percent in 1998) ison construction, which is again very large share in comparison to the health budgetsof most developing countries. However, little information is available on thecomposition of this construction spending.
* Second, only about 29 percent of the recurrent health budget is spent on salaries andwages, while 59 percent is spent on goods and services. In this sense, Vietnam isunlike other developing countries which spend the majority share of their recurrenthealth budget on salaries and wages, and have very little to spend on consumablessuch as medical supplies and drugs.
46

Chapter 3 - Inter and Intra-Sectoral Composition of Expenditures
3. 92 In tenns of sub-sectoral spending-preventive, curative, and family planning-twoobservations can be made:
* First, curative care takes up a disproportionately large share of public spending onhealth. The curative share has hovered in the range of 66-74 percent over the period1991-98, while the preventive share has had a wider range-I 1 percent to 19 percent.However, there has been an increase in the share of family planning in total publichealth spending -- from 3.5 percent in 1991 to 10.3 percent in 1998.
* Second, the relative constancy of the curative share in total public health spendingmasks important changes in the curative share of central, as opposed to localgovernment expenditures. The proportion of central health spending on curativeinterventions fell very sharply between 1993 and 1998-from 83.3 percent to only31.2 percent. Correspondingly, the shares of preventive programs and familyplanning increased-from 6.6 percent to 22.9 percent in the case of preventiveprograms and 9.5 percent to 25.7 percent in the case of family planning. Indeed, overthis period, central spending on hospitals and curative care declined even in nominalterms. In contrast, the proportion of local health spending on curative interventionsincreased from 66.7 percent in 1993 to 81.5 percent in 1998.
3. 93 Although budgetary data in Vietnam does not readily indicate the division ofexpenditures between service levels-primary, secondary and tertiary care, it appears thathospitals take up a disproportionately large share (75-87 percent) of the recurrent state healthbudget. This may be understated in that it excludes expenditures funded by donors user fees andhealth insurance. On the other hand some expenditures by hospitals are for primary care. Buteven allowing for this, expenditures on secondary and tertiary hospitals remains very high andthe commune health center share remains low.
Figure 3.6: Persons per hospital bed, selected Asian countries, 1995
3839
3265
1500 1503 1522 1582
1037791
579 591 m208 215 276 283 360 380 427 L | |
Taiwan Korea Sri Lanka China Malaysia Philippines Bhutan Pakistan Bangladesh
Hong Kong Singapore Vietnam Thailand Cambodia India Indonesia Myanmar Nepal
47

Vietnam: Public Expenditure Review 2000
3. 94 Thus, even though the per capita availability of hospital beds in Vietnam has declinedover time, it is among the highest in the region. The only countries having a lower ratio ofpopulation to hospital beds than Vietnam are Taiwan, Hong Kong, South Korea, Singapore andSri Lanka, all of which have considerably higher GNP per capita than Vietnam. Indeed, evenMalaysia, Thailand and the Philippines have higher population to hospital bed ratios. Prima faciethis suggests that there may be further scope for reducing the per capita number of hospital bedsin Vietnam, primarily by holding back any expansion in the aggregate supply of hospital beds.
3. 95 This emphasis on curative expenditure is both inefficient and inequitable. It is inefficientin that preventive care interventions should have first claim on public resources in view of theirsubstantial externalities. It is inequitable in that curative spending is focussed mainly onhospitals, which have a disproportionately large number of users from the more affluent sectionsof the population.
Provincial Distribution of Health Expenditures
3. 96 Provincial per capita spending on government health varies greatly across provinces (butwith the vast majority of provinces having a public spending level of VND 24,000-50,000), andis strongly related to provincial GDP per capita. This is not unexpected, as a portion ofgovernment health expenditures is financed by provinces out of their own revenue sources,allowing richer provinces to spend more. Provinces having higher levels of private spending onhealth per capita also have higher levels of government spending per capita. This means thatgovernment spending is not being used as a tool to reduce the inequities inherent in a large shareof health-care spending being financed by individuals or households.
3. 97 While provincial variations in per capita public spending on health have narrowedbetween 1991 and 1998, this trend needs to be accelerated, by reviewing the norms used inallocating state health expenditures across provinces.
Public Expenditure Decision-Making Processes in Health
3. 98 In Vietnam, the public health budget covers four levels of government: the central andthe three levels of local governments: provincial, district and commune. Since some expendituresby communes from their own resources are not included in the State budget, a comprehensivedatabase which aggregates the four levels into a consolidated statement of sectoral expenditure islacking. However, central, provincial and district governments account for about 90 percent ofthe national budget
3. 99 The Ministry of Finance (MOF) and the Ministry of Planning and Investment (MPI)determine the expenditure allocation with limited inputs from the Ministry of Health. (MOH).The overall level of recurrent spending on health is determined by projected growth rates of totalrevenue and of total recurrent expenditures (after subtracting estimated expenditures for newpolicies, such as increased salaries, etc.) and the share of health in total recurrent expenditures.This type of incremental budgeting pays little attention to health goals and health priorities set byMOH.
3. 100 While MOH is in charge of setting health priorities and goals for the country it does notcontrol or even have adequate information on the way provinces allocate their health spending.While it is not desirable that central controls by the MOH should replace provincial autonomy inexpenditure decisions, it is important that mechanisms be developed to provide MOH with
48

Chapter 3 - Inter and Intra-Sectoral Composition of Expenditures
adequate information to assess health outputs and outcomes at the local level , so that it canexercise its policy role. (This issue is discussed more generally in chapter 2 of this PER inrelation to the role of sectoral ministries.)
3. 101 Resource allocation by norms. The overall budgetary resources allocated to the healthsector are allocated on the basis of certain norms across two dimensions: functional (curativeversus preventive) and sectoral (Ministry of Health, other sector ministries, and the provinces).These budget transfer norms are based either on the number of hospital beds belonging to aministry (for curative expenditures) or on the population of the province (for both curative andpreventive expenditures). These amounts are supposed to cover salaries for a centrally-determined number of health workers in the provinces, fees and drug exemptions for the poor,and other recurrent expenses. The allocation norms vary across five geographical regions,presumably to capture variations in the unit cost of delivering services in different geographicalregions. In general, the norm for curative expenditures is about 3 times as high as that forpreventive expenditures, reflecting the higher unit cost of curative interventions.
3. 102 In the annual budget allocation document sent to provinces, only an aggregate recurrentbudget is provided-not its composition across sectors. Thus, provinces make their ownspending decision on each sector, including health. The provinces also can spend on health out oftheir own revenues which is the main reason for large variations in government healthexpenditure per capita across provinces, as richer provinces are able to spend more than poorerprovinces.
3. 103 In addition, the provinces receive funds from the various national health programs suchas the Expanded Program of Immunization, the Tuberculosis Program, etc which are designed toachieve national standards in key areas. However, according to a recent study by a group ofMOH experts'4 , the allocations appear to be more or less evenly distributed across provinceswithout account of the specific disease profile of a province. This suggests that these programsshould be reviewed to ensure they are adequately targeted.
Health Financing Policies
3. 104 In the last decade, the government has vigorously pursued two important policies forimproved financing of the health sector-greater cost recovery through higher user fees andexpanding health insurance coverage.
3. 105 User Fees. Basic health care was formerly free for all, regardless of a patient's ability topay some or all of the cost of care. In 1989, a fee system was introduced in the three higher(district, provincial and national) levels of the health-care delivery system, requiring thosepatients who are able to do so to pay at least a minimal part of their health care. In 1995, theMinistry of Health issued user fee schedules for each type of consultation and each type ofdiagnostic test and procedure performed in clinics and hospitals. All fees are required to be paidin advance by non-insured patients and patients not eligible for fee exemption. For the most part,patients are responsible for the purchase of drugs themselves, either from a private pharmacy or apharmacy run by the public facility on the public premises. In 1998 user fees accounted for about7.4 percent of total public expenditures on health. There are four important observationsregarding user fees
14 National Health Support Project, Sub-component 3.1.2, "Evaluation of Current Status and Impact of SomeNational Program", Draft Report, December 1999.
49

Vietnam: Public Expenditure Review 2000
* First, because the price schedule issued by the Ministry of Health only indicates arange of fees, provinces have discretion over the level of user fees charged, especiallyfor technical services and laboratory tests.
* Second, the user fee schedule has not been adjusted since 1995, although the generalprice level has increased by about 23 percent since then. Total user fee collectionshave grown rapidly over time, in part because of an increase in the number of patientsseen at public facilities.
* Third, even though user fee levels may be low, average out-of-pocket costs for publichealth services-particularly, public hospitals-are large, and onerous for the poor.For instance, even a single visit to a public hospital takes up 22 percent of all non-food expenditure for a year for a typical person in the poorest quintile. A visit ofstandard (national average) quality would constitute 45 percent of annual non-foodexpenditure for an individual in the poorest quintile. In contrast, a person in thehighest income quintile would pay only 4 percent of his or her nonfood expenditureon a public hospital visit of standard quality.
* Fourth, although there is a formal mechanism in Vietnam for exempting certainclasses of people, such as the poor, handicapped, war veterans, orphans, andindividuals suffering from certain ailments (such as tuberculosis and leprosy), fromuser fees, it does not work well in practice. One 1996 study found virtually nocorrelation between fee exemptions and household income. Data from the VLSS 1998show that exemptions from payment for drugs are non-existent in both communehealth centers and public hospitals, although MOH receives reports from hospitalsindicating that exemptions from user fees are granted, which include fees for drugs.The Government has agreed to conduct a review on how the exemption mechanism isworking in practice.
3. 106 Health Insurance. Formal health insurance began in Vietnam in 1993, and comprises: (i)a compulsory scheme covering primarily current and retired civil servants and employees of stateand large (i.e., having more than 10 employees) private enterprises, and (ii) a voluntary schemeaimed at the remainder of the population. Premiums in the compulsory scheme are paid from a 3percent payroll tax, which is shared by employers (two-thirds) and employees (one-third).Enrollees in the voluntary scheme pay fixed annual premia that vary across provinces andaccording to benefit coverage chosen. Currently health insurance covers about 12 percent of thecountry's population and in 1998 financed 11 percent of total public expenditures on health.
3. 107 There are two main issues:
* First, the health insurance program does not benefit many poor or rural dwellers asenrollees in the compulsory health insurance scheme are civil servants and salariedemployees of state and large private enterprises, most of whom are middle-classurban residents. Thus, if the social health insurance program is to benefit the poor inVietnam, there will need to be substantial expansion in coverage of the ruralpopulation by the voluntary insurance scheme, which is in its infancy and covers onlyfive percent of its target population.
* Second, the health insurance program has run into financial problems, in part becauseof uncontrolled growth of insurance reimbursements. In 1996 and 1997, many of the
50

Chapter 3 - Inter and Intra-Sectoral Composition of Expenditures
provincial health insurance funds were overdrawn in comparison to the premiumsreceived during that year. Although the overall financial integrity of the insurancefund was not in jeopardy, such problems are likely to recur. To avoid possible over-servicing arising from consumer and provider moral hazard some limitations onreimbursement and a twenty percent co-payment requirement have been introduced.
Improving Health Information
3. 108 The information base for analyzing the composition of public health spending and itsincidence is weak. Improvements are needed in the expenditure classification system, forexample between preventive and curative activities and between primary, secondary and tertiarylevels. In addition to weaknesses in expenditure information, information on health serviceutilization and the health status of different groups in the population has been lacking untilrecently. The 1998 VLSS and the forthcoming National Health Survey are importantdevelopments in improving this information. However a regular system of household surveyswould enable MOH to more fully monitor the impact and benefit incidence of public healthexpenditures
A Menu of Reform Options
3. 109 The above analysis provides a number of reform options for the Government of Vietnamto achieve its stated policy objectives and build upon its remarkable achievements in improvingthe health status of its peoples. The options that the government may wish to consider are:
- A shift from high-cost, hospital-based services to more cost-effective communehealth centers - and clinic-based health services to improve the cost effectiveness ofhealth spending. This current pattern of public spending is also inequitable as thelarger public subsidies go to hospitals which are used more by higher income groupsbenefit the rich, while facilities more used by the poor, such as commune healthcenters, are subsidized to a very small extent by the state budget. The governmentmay wish to further reduce public subsidies to hospitals, especially at provincial(secondary) and central (tertiary) levels.
* Establishing a national strategy for assistance to the poor with their health-care costs.Available data suggest that actual out-of-pocket payments made by poor patients arevery large in relation to their incomes. While a formal mechanism for exempting poorpatients from user fees exists, it appears note work well in practice. The govermnenthas already begun moving in this direction-the Ministry of Health, the Ministry ofLabor, War Invalids and Social Affairs (MoLISA), and the Ministry of Finance haveissued an inter-ministerial circular, outlining a consistent mechanism for providingfree medical services to the poor.
* Once such a strategy is in place, the Government should consider raising hospital feesto reduce its subsidies to hospitals.
* A mechanism for ensuring that provinces make their health spending patternsconsistent with national health priorities and strategies is needed. Two-thirds of thestate health budget spending takes place at the local (provincial) level. The highproportion of curative as opposed to preventive expenditure in provincial government
51

Vietnam: Public Expenditure Review 2000
health expenditures is symptomatic of this general problem of provincial expenditureallocations not reflecting practices established at the national level.
* Expansion of the health insurance program, especially the voluntary scheme shouldalso be considered as a means of reducing health costs to the budget
* There is also a need to use public spending as a policy tool for reducing inter-provincial disparities in private health-care spending and access to health care.Currently, government health expenditure reinforces, rather than compensates for,provincial disparities in private health spending. It should be possible for the centralgovernment to reduce these disparities by adjusting the formula (transfer norms)covering health expenditures, used by the center in determining transfers to theprovinces
* In the longer run (next 5-10 years), the government may want to rethink its roles inthe health sector. It may make more sense for the government to reduce its role in thedirect provision of curative, hospital-based health services, and focus on (i) provisionof high-quality preventive health services, (ii) greater financing of healthexpenditures, especially for the poor, and (iii) improving regulation and monitoring ofthe growing private sector in health.
EDUCATION SECTOR
Education Provision in Vietnam
3. 1 1 0 There are four levels of schooling in Vietnam, pre-primary, primary (five years from age6), lower secondary (four years), and upper secondary (three years). Vocational education isoffered in a variety of institutions, and is available after primary and lower secondary. Highereducation is offered in colleges and universities, offering respectively three and four yearcourses.
3. 111 The Ministry of Education and Training (MOET) has policy responsibility for theeducation sector and also manages higher and some vocational institutions: Provinces managesecondary schools, and districts and communes primary schools and pre-primary facilities. Asmall, but increasing element is in semi-public schools where government provides the facilities,but parents meet the operating costs including salaries. The private sector remains a smallprovider. Some specialized educational institutions are operated by other sectoral ministries.
Education Achievements
3. 112 Vietnam has quite rapidly achieved better education for its citizens and has madeconsiderable progress in increasing enrolments and improving the efficiency and equity ofeducation expenditures. In the past decade net enrolments have improved significantly, drop outand repetition rates have fallen, gender balance has improved and the balance of public sectorspending has shifted more towards the early grades and thus the poor. The government'seducation policy objectives and targets are quite realistic and achievable. Nevertheless there areissues needing to be addressed. For example, in terms of educational quality, the school day isshort, there is little information on the quality of educational outcomes, there are considerableregional variations in expenditures and results and low teachers salaries are a continuing concern.
52

Chapter 3 - Inter and Intra-Sectoral Composition of Expenditures
3. 113 Enrolments: Vietnam has high enrolment ratios compared to countries of a similar levelof economic development. Table 3.6 shows the evolution of participation ratios. The primaryGross Enrolment Ratio (GER) declined as less over age children enter school, while the NetEnrolment Ratio has risen.15 The post primary enrolment ratios have risen substantially. At thelower secondary level Vietnam also has a relatively high GER, indicating a strong effort to enrollchildren in a basic cycle of nine years of education. There is a fairly even balance between maleand female enrolments in primary and lower secondary education, and girls' participation inupper secondary education is increasing as the improved gender balance at the lower levels feedsthrough. The greatest increases in participation rates have been among lower income groups,although remaining higher overall amongst the wealthier groups. Regional variations inenrolment have narrowed but remain large.
3. 114 Dropout and repetition rates are also falling and the transition rates between the primary,lower secondary and upper secondary levels have been rising, with a consequent rapid growth inpost primary numbers. Clearly this development creates future expenditure pressures, asdiscussed below.
Table 3.6: Gross and net enrolment ratios
1993 1998
Gross Enrolment RatioPrimary 120 115
Lower Secondary 42 78Upper Secondary 9 36
Net Enrolment RatioPrimary 87 91
Lower Secondary 30 62Upper Secondary 7 29
Source: Ministry of Education and Training
3. 115 Quality of education/Education outcomes. A number of sample studies of studentattainment have been carried out in recent years. The results of one such test are shown in Table3.7
15 Gross Enrolment Ratio is the ratio of all children, including children over school age, in school at a given level tothe relevant school age population; Net Enrolment ratio is the share of school age children enrolled in school,excluding over age children.
53

Vietnam: Public Expenditure Review 2000
Table 3.7: Attainment test in mathematics and language (in %)
At Giade 3 At GrAde 5
Male Female I Male f0esake1. Mathematics
Hanoi 70 74 72 78Yen Bai 31 39 34 37Thanh Hoa 23 32 17 16Quang Nam 18 20 22 17Vinh Long 24 25 13 18
2. Vietnamese LanguageHanoi 67 79 75 83Yen Bai 47 50 50 58Thanh Hoa 20 30 27 31Quang Nam 25 27 16 24Vinh Long 31 36 21 27
Source: Monitoring Vietnamese and Mathematics 1998 - Phase 1 Report
3. 116 These results suggest that (a) the level of attainment outside major cities like Hanoi ispoor and (b) the attainment results vary considerably across regions. Unfortunately, there seemsto have been no systematic follow up to any of these measures and therefore no data areavailable to demonstrate whether levels of attainment are improving or falling.
Levels of and trends in public education spending
3. 117 During the last decade education spending has increased significantly. The number ofteachers has grown considerably and investment levels have increased. Total education andtraining expenditure (recurrent and capital) currently amounts to about 17 percent of total publicexpenditure (excluding amortization). Recurrent expenditure on education is about 19 per cent ofdiscretionary recurrent expenditure (total recurrent expenditure less interest payments). Thegovernment has set a target of 15 per cent of total public expenditure (including expenditure onamortization) for the education sector by 2000. However, the draft policy statement prepared byMOET for submission to the National Assembly perceives a need for this to increase to 20 percent by 2010.
Table 3.8: Growth of public expenditure on education
Year 1992 1994 1q98Percentage Education Expenditure of GDP 2.2 3.5 3.5
Percentage Education Expenditure of Total Public expenditure (excluding 10.9 14.1 17.1amortization)
Source: Calculation based on MOF data
3. 118 The share of education expenditure in GDP rose significantly between 1992 and 1994-from 2.3 to 3.5 percent. Table 3.9 shows Vietnam to be spending a lower share than the averagefor developing countries, but it is also likely that the average duration of studies in Vietnam isalso shorter. However there are many factors which influence the share of national output
54

Chapter 3 - Inter and Intra-Sectoral Composition of Expenditures
allocated to education. For example some countries have longer compulsory education cyclesthan others, and wages and salaries are higher in some countries than in others in relation to percapita output.
Table 3.9 International comparison of education expenditure
Primary Seconday Education Share in total Share of scioolGER GER Expendire spending edution in
as % GDP 1091-:95 edncatin .idget1. Industrial countries 100 99 5.2 12 71
2. Other developing countriesHong Kong, China 96 75 2.8 17 56Malaysia 91 57 5.3 15 76Republic of Korea 101 101 3.7 17 79Thailand 87 55 4.2 20 72Philippines 116 79 2.2 10 n/aIndia 100 49 3.5 12 64SriLanka 113 75 3.1 8 73
Vietnam 1998 118 32 3.5 17 68
Source: UNDP Human Development Report; World Bank World Development Report.
3. 119 Another ratio for international comparison is the average expenditure per pupil in relationto per capita GDP. In 1998 the figures in Vietnam for in primary, lower secondary and uppersecondary levels were 6.8, 8, and 15 per cent respectively of per capita GDP. In East Asia in1990 the average expenditure per primary pupil was 8 per cent, with Korea reaching 12 per centand Malaysia 15 per cent.
3. 120 Taking into account the underlying growth in student numbers from demographicpressures, increasing participation rate, as well as needed quality improvements such asincreasing total instruction time and raising teachers' real salaries, it is likely that the share ofnational output allocated to education will have to increase. An appropriate target over the nextfive years could be to raise the share of education in GDP to 4 per cent, or as a percentage ofpublic expenditure to move towards the upper end of the broad 15-20 percent range as indicatedby international comparisons.
Composition of Educational Spending
3. 121 Sub-sectoral allocations. Primary education takes up about 36 percent of total educationand training expenditure, and lower secondary about 18 percent: basic education thereforeaccounts for 54 percent of education and training expenditure. When upper secondary educationexpenditures are added, total school education accounts for over 62 percent of the totaleducation budget. Training expenditures account for the remainder.
55

Vietnam: Public Expenditure Review 2000
Table 3.10: Sub-sectoral percent shares of education expenditure (%)
192 .1994 199*
Pre-school 3.2 4.4 6.3Primary 40 29.6 36.4Lower secondary 14.8 17.7 17.6Upper secondary 6 8.6 8.3Vocational 13.9 11.2 6.7Higher 16 12.5 13Other 6.1 4.6Total 100 100 100
Source: Ministry of Finance.
3. 122 In general, Vietnam's fiscal effort on education, as well as its education expenditurecomposition are in line with international comparisons, particularly when associated with schoolenrolment ratios. There may be relatively little room for reallocation between sub-sectors, andadditional funding will depend on overall economic and revenue growth, and efficiencymeasures within the education sector.
3. 123 Composition of school education expenditures. It is normal in education sectors,particularly at the lower levels, for expenditures to be dominated by salaries, because educationis a very labor intensive industry. Developing countries typically spend over 95 percent of theirprimary education, and 60 to 80 percent of upper secondary recurrent budgets, on salary costs.Although Vietnam appears to have maintained a reasonable level of non-salary expenditure inthe recurrent budget this may be misleading because of the inappropriate classification of someexpenditure items (e.g. contract salaries as non-salary expenditure). In practice there is evidenceof very low non-salary expenditures at the local level in many provinces.
3. 124 It is widely accepted in Vietnam that teachers' salaries are still low. This has led toseveral problems including short teaching hours and of teachers supplementing their incomethrough private tuition or through various entrepreneurial activities. Indeed, average teachers'salaries expressed as a multiple of GDP per capita, have been low relative to other countries. Thegovernment has recently raised the basic minimum wage by 25 percent from VND 144,000 permonth to VND 180,000. This will raise the ratio of salary to GDP per capita to nearer theinternational average.
3. 125 The composition of non-salary recurrent expenditure is also important. Vietnam hasmaintained significant self funded capital expenditure levels, unlike many countries at a similarlevel of economic development which depend entirely on foreign aid for capital expenditures.Nevertheless, there is an acute shortage of classrooms and major maintenance requirementsthroughout the system.
Equity of Resource Allocation
3. 126 Transfer Norms. In determining the overall allocation of funds to the provinces, there arefew norms used which relate specifically to the education sector. The education component is aresult of negotiations between MOF and MOET and the provinces, but is primarily based onpopulation and unrelated to the number of actual students. Apart from official norms othercriteria may be used. For example, based on funding availability, MOF in 1997 and 1998 also
56

Chapter 3 - Inter and Intra-Sectoral Composition of Expenditures
decided that for education there should be a certain ratio of salary to non-salary expenditure forall provinces (set at 80:20 for 1998). This had the effect of adjusting the education allocation forall provinces, generally resulting in greater equality between the provinces.
3. 127 Allocative norms. The allocation of funding within the education sector is based in parton a large number of norms. For the education sector these norms set guidelines on pupil teacherratios (PTRs), class sizes, and on the ratio of salary to non-salary spending. In practice, some areof a mandatory nature and a few appear to be more advisory in nature. In some cases thedifferent norms potentially conflict and are not mutually achievable within overall resourceconstraints. Guidelines on target expenditures per pupil in the five geographic regions are issued,but no data are collected to determine whether actual expenditures reflect the guidelines.
3. 128 From the points of view of efficiency, effectiveness and equity, the present norm basedresource distribution system-both transfer and allocative norms, may not be achieving thegovernment's education objectives. The population based formula clearly aims to distributeresources equitably, but as discussed below this may not be achieved.
3. 129 A recent review 6 of how budgetary resources cascaded through the education systemshowed how decisions about the mix of resources may be affected by the allocative mechanismsused at the different levels of government rather than conscious decisions about what mix willproduce the best service. In particular, staff related costs are treated at each level in the cascadeas fixed by the current and planned number of teachers. Investment expenditure is subject to aseparate, parallel, and sometimes unrelated allocative process from recurrent expenditure. As aresult, other important expenditure such as teaching and learning materials, teacher aids,furniture and equipment and building maintenance are treated as residual items and are highlyvulnerable to overall resource constraints.
3. 130 Geographical distribution. There is significant variation between and within provinces inthe share of school age children in the total population. Thus, a resource transfer formula basedon population will tend not to provide an equal level of funding per student resource in theabsence of adjustment factors to fully compensate for those variations. This is confirmed inTable 3.11, where wide variations in average budgeted expenditure per pupil are seen betweenand within the provinces, with little clear correlation with per capita GDP.
3. 131 There are a few positive aspects of the population-based assessment of spending needcurrently applied by the center in budget negotiations with provinces. It is relatively simple forthe Ministry of Finance to operate and calculate. It also leaves greater freedom to makeexpenditure decisions at the local level and in principle resources are available to funddevelopment and improvement expenditure in areas with low participation in order to encouragegreater participation. On the other hand, the per capita norm creates some potentially perverseincentives. In particular, higher pupil numbers do not attract additional resources so there is noincentive to increase enrolments, both of which may be seen as unfair by managers.
16 Education Financing Study: Primary Education in Vietnam, A DFID Report, September 1999.
57

Vietnam: Public Expenditure Review 2000
Table 3.11: Regional differences in average school expenditure
Province Per capita GDP Averagexpendirs (i '00O NT))('000 VND~)
Primary Junior Secondary SenirSRed River Delta 4,010 340 417 809North East 2,321 374 466 956North West 2,113 490 444 783North Central Coast 2,368 315 346 742South Central Coast 2,998 348 459 1046Central Highlands 3,355 421 325 1124North East South 8,598 423 484 1365Mekong River Delta 3,811 340 401 930
Source: Calculation based on MOF data
3. 132 To deliver an acceptable level of service across the country the following changes seemappropriate:
* Simplifying and changing the role of the norms, making them guidelines, with localmanagement having discretion as long as educational outcomes are achieved and budgetallocations are not exceeded. As such, ex-post analysis of expenditure in relation toeducational outcomes rather than ex ante expenditure norms would become the focus.
* Possibly providing funding on the basis of a core or minimum cost per student which reacheseach school level throughout the country. Separate funds could be allocated for attractingnew students, tackling local problems of access and participation and enhancing servicequality. These separate elements should have a pro-poor bias-relating them to provincialGDP per capita may be appropriate. Setting minimum expenditure per student on non-salaryexpenditures and maintenance would also be appropriate.
3. 133 Incidence ofpublic expenditure. The analysis of VLSS data suggests that there has been ashift towards the poor in the benefits from public expenditure on education since 1992, thoughbenefits at post primary levels continue to favor the better-off. Not only have participation ratesof the wealthy and the poor moved closer across all grades but the balance of subsidy has shiftedtowards lower grades where participation by the poor is strongest. Further improvements can beexpected as the pupils in the lower levels containing larger numbers of students from poorfamilies, eventually move through the system-but provided policies to improve access to highergrades of education by the poor continue.
3. 134 Cost sharing with parents. A high proportion of the total cost of education at all levels isborn by parents through a variety of charges, or directly in meeting costs such as textbooks.However the government meets a greater share of basic education expenditures and a lesser shareof expenditure at other levels, as shown in the following table 3.12.
3. 135 In addition, it is well known that many teachers provide supplementary education on aninfornal basis for parents who pay. Over 11 per cent of total expenditure per primary childappears to be accounted for by private tuition charges, with richer households paying on averagetwice that percentage. In many provinces some semi-public places are occupied by those children
58

Chapter 3 - Inter and Intra-Sectoral Composition of Expenditures
who fail graduation tests. Furthermore, post primary level fees are used by some schools tosupplement teachers' salaries.
3. 136 While there is provision for exemption from charges, the incidence of exemptions is stilllimited and far from pro-poor, with exemptions spread over all consumption quintiles (VLSS,1993 and 1998). Further narrowing the participation gap will be hindered unless measures aretaken to enhance the ability or incentive to waive charges for the less well-off.
3. 137 The higher education and vocational sub-sectors have also seen a rise in cost sharing withparents. In common with higher education institutions, TVET schools generate additionalrevenues through privately paying students, contract training and sales of goods and services.Some schools earn over 75 percent of their operating expenditures in this way. A significantproportion of fees goes to supplementing teachers' salaries. Fees are charged for all shortcourses, and are paid by employers or students themselves. In addition students are expected toprovide their own books and learning materials.
Table 3.12: Shares of expenditure in total expenditure (in %)
1993 19981. Primary
Public Subsidies 45 61Tuition fees 3 1Direct costs to parents. 52 38
2. Lower SecondaryPublic Subsidies 34 42Tuition fees 9 7Direct costs to parents. 57 51
3. Upper SecondaryPublic Subsidies 40 33Tuition fees 10 13Direct costs to parents. 50 54
4. Higher and VocationalPublic Subsidies 71 46Tuition fees 9 18Direct costs to parents. 20 36
3. 138 LSMS data show that in practice higher education is restricted to those who can afford topay. In some technical training institutions fees are charged according to ability of students topay and in others students are awarded grants according to academic performance. Other schoolscharge all students a flat fee. Expenditure in universities and colleges on scholarships (for whichfinancial need is one criterion) was in 1998 equivalent to 15 per cent of fee income, but theimpact of scholarships on access of the poor to higher education appears to be slight.
Efficiency and Effectiveness of Resource Use
3. 139 Measures which reduce unit costs can make education more accessible to poor people.Education budgets are dominated by staff related costs, more so at the lower levels of the system.The two critical variables which influence the unit cost per pupil are the average salary of ateacher, and the number of pupils taught by each teacher (PTR). From the point of view ofeducational outcomes, the issues revolve around how the budgetary variables and outcomes
59

Vietnam: Public Expenditure Review 2000
relate. Is the teacher remuneration structure consistent with incentives to teach well; are classestoo large or not large enough; is the curriculum too extensive, or too narrow?
3. 140 Salaries. The average teacher salary across any given location-region, province,commune, school-is the first critical variable. The variations in average expenditure per pupilacross regions suggest that there may be a variation in the average expenditure per teacher. Thegovernment is currently considering the school teacher remuneration structure, and in doing sowill need to relate any changes to the effect on averages expenditures in regional budgets. Somelocal discretion in respect of average salary would be appropriate. At the higher levels ofeducation the degree of salary supplementation from outside sources is considerable, and needsto be taken into account when developing a remuneration policy.
3. 141 Pupil teacher ratio (PTR). Pupil teacher ratios are one of the most difficult (andneglected) aspects of education management, but they arc at the heart of resource allocationissues. There is always a trade-off between the number of pupils per teacher, and the availabilityof resources to finance non-salary items essential for learning and good teaching. Whereresources are severely limited, as in Vietnam, management of the PTR is a critical factor.
3. 142 Internationally, PTRs-where they have been fairly high-decline slowly as resourcesbecome available. However, countries with low PTRs have high salary shares in their budgets,often accompanied by problems of financing other learning inputs. At the primary educationlevel in Vietnam there is more or less one teacher per class: in other words the PTR is roughlythe same as the pupil class ratio. This is because teachers teach all subjects. At lower secondarylevel in 1998 the ratio was 1.45 teachers for every class, and upper secondary was 1.6. In otherwords, post-primary PTRs are curriculum driven, as well as being influenced by total enrolmentsin each school.
3. 143 Overall the picture in Vietnam is one of increasing PTRs at post primary levels andrelatively static ratios at the primary level. This tendency for PTRs to increase in secondaryeducation likely reflects rapid enrolment growth outstripping teacher availability. MOET policyis to train secondary teachers to teach more than one subject which will also cause the PTR. torise.
3. 144 More efficient utilization of staff has helped enrolment growth in higher education in thatboth teaching hours and class sizes have increased. But there is scope to rationalize resourcesused in some areas of vocational and higher education in where pupil teacher ratios continue tobe low and establishments are small and inefficient.
3. 145 Quality of Teaching and Teacher Motivation: Teacher salaries need to be set at a levelwhich encourages teachers not to seek other work. New salary structures and increases in thegeneral level of salaries should be related as far as possible to improved competence and workpractices.
3. 146 Infrastructure: Infrastructure costs are reduced by the short-school day, which providestwo shifts per day at schools. In spite of the levels of investment spending there are clear signthat infrastructure is failing to keep pace with the increased participation in education. VLSSshows high percentages of classrooms in poor condition, but with considerable variation betweenregions. One way of obtaining additional leverage from construction funds could be to providesuch capital funds on a repayable basis to schools and communities. This would involveestablishing a revolving fund administered by each province. The initial Fund contribution would
60

Chapter 3 - Inter and Intra-Sectoral Composition of Expenditures
be replenished by regular re-payments from the school or community, providing funds to be re-lent on an ongoing basis for further construction spending.
An Agenda of Reform Options
3. 147 The main objective of this sectoral analysis is to help the govermnent in better achievingits national policy objectives. To this end, the following reform options should be considered:
a. To achieve the develop of the education sector planned by the Govermment there maybe a need to gradually increase public education spending over the period to 2005 toaround 4 percent of GDP (from the current 3.5 percent level) or to move educationexpenditures as a percentage of public expenditure from the current level of 15 percentto around 20 percent. The additional resources could be used to improve salaries fundhigher participation in secondary and higher grades flowing through from theincreased primary enrolments, and to improve service quality at all levels.
b. There is little scope to shift resources between education sub-sectors withoutdamaging service levels. It is necessary to ensure that the higher salary levels do notsqueeze out non-salary and investment expenditures
c. Existing regional variations need to be addressed by reviewing the present system ofnorms. Allocative norms should become more advisory in nature. Funding for studentsin the system should take account of geographic factors such as sparse population. Indoing so a minimum amount of funding per student could be guaranteed. Separatefunding for developmental and improvement expenditure should reflect a pro-poorbias (provincial GDP per capita is a good measure for this). An element of this lattercomponent of funding could include a fund for measures to attract and retain newpupils. Such a more equitable base of funding would enable more and better targetedwaiving of fees at the local level.
d. There is scope for increasing pupil/teacher ratios at all levels. This would help inrestraining the cost of govermnent's (desirably) ambitious education policies. Methodsof achieving higher ratios at post primary levels include increasing the number ofsubjects a teacher can teach, and the number of hours taught. The opportunity could betaken when increasing teacher salaries to relate increases to improved competence andto better working practices.
e. There may be scope for leveraging expenditure on school infrastructure throughestablishing a revolvingfund under which schools or communities would be lent fundsfor construction. Repayments would be used on an ongoing basis to fund furtherconstruction.
f. Testing student attainment-external objective tests of pupil skills-on a sample basis,is important. This outcome information is vital to effective policy development andplanning through building up a time series have. For example existing informationsuggests considerable variations between regions in education attainment and the needto ensure greater evenness in educational quality. The focus could be both on output(students served) and attainment (level and usefulness of skills achieved). Analysis oflinks between expenditure allocations and educational outcomes will assist in betterallocation of education expenditures.
61

Vietnam: Public Expenditure Review 2000
TRANSPORT SECTOR
The Current Transport Infrastructure
3. 148 Due to Vietnam's geographical features, and concentration of population and economicactivity, the transport network is quite concentrated and traffic density is highest in and aroundthe urban centers in the northern and southern delta areas.
3. 149 Roads: Roads are by far the most important transport mode. The country has a extensiveroad network of over 209,000 km, comprising national roads, provincial district, commune andvillage roads. With a road density of 0.3 km/sq.km, Vietnam's coverage equals that of the moredeveloped ASEAN countries of Thailand, Philippines and Brunei. However in terms of quality,Vietnam's road network is not so good. Surveys indicate that almost half of the national roadnetwork is in poor to very poor condition. Moreover, close to one quarter of the bridges havereduced bearing capacity and need to be rehabilitated or replaced. The situation of the provincial,district and commune roads is even worse. Earth roads account for the bulk of rural roads, someof which become impassable during the rainy season. In addition more than 600 communes haveno road access to district centers.
3. 150 Water transport. In the northern and southern deltas of the country, inland waterwaysplay an important role as a low cost mode of transportation for bulk commodities such as coal,building materials and rice and for the rural population generally. About one quarter of thecountry's total land freight is transported by inland waterways, which are complementary to roadtransport. There are about 41,000 km of inland waterways for informal and small scalecommercial transport but of these, only about 10 percent are of sufficient depth to allowindustrial type transport vessels of 50 dwt or more. Maintenance has been inadequate which hasresulted in siltation and loss of water depth. In turn, this has hampered the utilization of largevessels and has led to increased transport costs, particularly to the rural poor.
3. 151 Railways. Vietnam Railways (VR) operates a network of 2,832 km from Lao Cai at theChinese border and Haiphong in the north to HCMC in the south. The bulk of the railwayinfrastructure and rolling stock have deteriorated and are in need of replacement/repair. The mainshort term problem is the large number of deteriorated bridges, some of which are now beingrepaired with assistance from Japan. VR's share of total land traffic in 1998 was about fivepercent for freight (17 percent in ton-km) and 1.3 percent for passengers (12.5 percent inpassenger km). The provision and upkeep of the rail infrastructure is funded from the budgetwhile VR is responsible for rail operations.
3. 152 Sea Ports. Vietnam has seven national sea ports administered by MOT, 20 municipal andprovincial sea ports, administered by localities and a number of ports that are operated by otherministries, including the navy. The most important ports are Haiphong, Da Nang and HCMCwhich in 1997 handled almost 50 percent of all port throughput. Shallow water depths, longaccess channels (Haiphong and HCMC), narrow port areas, outdated equipment and poormanagement have all contributed to low port productivity, high operating costs and underutilization of capacity.
3. 153 From 1994 to 1999, traffic on all land transport modes rose by an average of 10 percent ayear for freight and over three percent for passengers. Among the different modes maritimefreight traffic increased at a rate of over 25 percent per year, inland waterways at 20 percent peryear (7.5 percent for passengers), road transport at close to 10 percent (7.2 percent for
62

Chapter 3 - Inter and Intra-Sectoral Composition of Expenditures
passengers) and rail transport roughly three percent for both freight and passengers. Throughputof the country's seaports rose by an average 15 percent per year from 1995 to 1999, reflectingthe Vietnam's successful re-integration into world trade.
Sector performance
3. 154 Low transport productivity: Notwithstanding recent progress, the efficiency of thetransport sector remains quite low. The potential for transport cost reductions is considerable,provided management and operations are improved and infrastructure and equipment continuesto be modernized.
3. 155 In the road sub-sector, the average speed is between 20 to 25 km per hour for freight and30 km per hour for passengers. The average carrying capacity of a truck is also relatively low,truck sizes being limited by road conditions which increases unit costs. The poor state of roadscauses additional economic costs to users estimated by the World Bank at up $160 millionannually. In addition inadequate maintenance means that roads eventually have to berehabilitated at much higher cost.
3. 156 A similar picture emerges for sea-ports. The country's two main port complexes ofHaiphong and HCM operate at low capacity, are often congested in storage areas and are poorlyconnected with the land transport network. Shallow drafts limit ship size and thus raise shippingcosts. The present system of national/regional tariffs and the cross-subsidization of the nationalshipping line by foreign shipping hamper desirable competition between ports. Absence of aresult oriented and accountable management exacerbates the situation. All these factorscontribute to lower port productivity, thereby reducing Vietnam's international competitiveness.According to a recent survey Vietnam's ports are among the highest cost ports in the SoutheastAsian region. For example, transporting of a twenty foot container from Tokyo to one of thethree economic zones in Vietnam can cost up to US $1,000 more than the cost of transportationto Manila or Bangkok.17
3. 157 Vietnam Railways is roughly comparable to most of the other smaller railways in theregion. Although well run in an engineering sense, VR's labor and locomotive productivity areamong the lowest in the region, as is its average traffic density.
3. 158 In inland waterways the backlog of dredging and lack of navigation aids to permit nightnavigation has reduced the size and speed and thus the productivity of inland waterway vessels.
Government Objectives and Priorities
3. 159 The rehabilitation and modernization of the country's dilapidated transport infrastructurehas correctly been the main policy objective of the Government's Public Investment Program(PIP) 1996-2000. Priority was assigned to transport infrastructure in the three strategic economiczones of (i) Hanoi-Haiphong corridor in the north; (ii) Da Nang in the center; and (iii) HCMC-Vung Tau corridor in the south. Other priorities included creation of links with neighboringcountries; integration of transport systems, including port development to facilitate internationaltrade; and development of urban infrastructure and public transport services to reducecongestion.
7 World Bank, Country Frarnework Report on Private Participation in Infrastructure: The Case of Vietnam, 1999.
63

Vietnam: Public Expenditure Review 2000
3. 160 These objectives were ambitious and their realization required a large investmentprogram. It soon became obvious that this development program could not be implementedduring the 1996-2000 plan period and had to be broken down into more manageable sub-programs which could then be implemented over a period of 10-1 5 years. During 1996-2000, themain emphasis was on upgrading the trunk roads and other basic infrastructure in the growthtriangles of northern, central and southern regions. In 1997 these regions generated about 75percent of the country's GDP, attracted more than 80 percent of foreign direct investment andaccounted for 75 percent of the country's exports/imports, so this prioritization reflected anemphasis on economic growth and efficiency. Some provincial or rural projects justified more onequity grounds, had to be deferred.
3. 161 Thus progress in improving the nation's rural roads network has been slow and is areflection of the resource constraints faced by the Government-both central and local. Someareas in the Mekong Delta, the North Central Coast and other regions are still completelyinaccessible by road. Despite the resource constraint, the Government, with the active assistanceof the local population, has managed to improve about 11,000 km of rural roads, although inmany cases insufficient attention has been paid to quality. To address this and other relatedissues, the Government (assisted by the donor community) is finalizing a comprehensive ruralroads strategy. It is likely that significant increases in investment in rural transport will beproposed in the PIP for the 2001-2005 period. Recent ODA funding for local entities has beenused for large A-type projects in agriculture and rural development, in which transportinfrastructure repair comprises a large or even dominant role. However, the amount of thisexpenditure in rural roads is not separately reported, or known to MOT.
3. 162 Investment in the railway system has so far been small and is focussed in keeping thesystem operating safely. Urban transport improvement has received little funding so far.
Levels of and trends in state transport spending
3. 163 The importance that the GOV attaches to the modernization of the nation's transportinfrastructure is reflected in the State's overall expenditure patterns for the sector. There hasbeen a marked shift of public resources in both nominal and real terms towards transport sincethe early nineties and both capital and recurrent expenditures in transport have increased fasterthan in other sectors, as set out in table 3.13. The increase from 1993 to 1994 reflects theincreased flow of ODA into Vietnam and the priority attached by both donors and GOV torehabilitating the basic transport infrastructure. The split of total transport expenditure betweencentral and local spending units shifted slightly in favor of local spending entities. About 85percent of all transport expenditure is capital expenditure. More than one half of 1997 and 1998capital expenditure by the central level was funded by ODA while that of the local entities wasmainly funded by the Government's own funds and contributions by the people.
64

Chapter 3 - Inter and Intra-Sectoral Composition of Expenditures
Table 3.13: State transport expenditures (in %)
1993 1994 1997 1998
Capital Expenditure/Total Transport/State Capital 18.8 27.2 26.3 29.0Expenditure.Capital and Recurrent Expenditure: 6.5 9.0 9.5 10.8Transport/StateLocal Transport Expenditure: Share of total 44 64 59 60expenditureTransport Capital and Recurrent Expenditure as 1.7 2.3 2.1 2.2percent of GDP
Source: Ministry of Finance.
3. 164 It should be noted that the following analysis is based on expenditure information fromMOF and is not consistent with information held by MOT. The expenditure figures from MOTare significantly higher than those reported by MOF, indicating the use of different data formatsby the two ministries. In addition not all state transport expenditure, particularly that undertakenby other ministries such as MARD, can be easily identified in the budget.
Table 3.14: State transport spending by mode, locality and spending category (in billion VND)*
Mode Exp. 1994. 1997 .998categoy Tol Cel ocal Tota wal Lq Total centl Lo A1H
Roads Capital 2,456 1,296 1,164 5,219 2,879 2,340 5,955 3,308 2,647Current 513 331 182 668 425 244 814 482 333Total 2,969 1,627 1,346 5,887 3,303 2,584 6,769 3,790 2,980
Inland Capital 97 93 5 97 73 24 139 111 28Water Current 36 29 7 36 29 8 85 29 56
Total 133 122 12 133 102 32 224 140 84Rail Capital 223 213 10 128 126 2 312 310 2
Current 22 20 2 152 148 4 150 150 0Total 245 223 12 280 274 6 463 460 2
Sea & Capital 131 120 11 91 40 51 146 123 24Coast Current 76 75 1 2 0 2 5 3 2
Total 207 195 12 93 40 53 151 126 26Air Capital 272 272 0 100 99 2 133 133 0
Current 0 0 0 ] 0 0 20 0 0Total 272 272 0 101 99 2 153 133 0
Other Capital N/A. n.a. n.a. 123 100 23 117 66 50Current 50 20 30 43 23 20Total 173 120 53 160 89 60
Grand Capital 3,198 2,000 1,198 5,760 3,316 2,444 6,803 4,052 2,751Total Current 661 464 197 909 622 287 1,098 686 412
Total 3,859 2,464 1,395 6,669 3,938 2,731 7,901 4,738 3,163
Source: Ministry of Finance.
* This does not include expenditure by communes from their own revenues.
3. 165 Sub-sectoral allocation. Consistent with its stated objectives and strategies forimplementation, the Government has given priority to the rehabilitation and modernization of the
65

Vietnam: Public Expenditure Review 2000
country's trunk road network. Roads have received the bulk of transport funding, accounting for94 percent of total transport spending in 1998, up from 74 percent in 1994. Spending on railinfrastructure accounted for about 5 percent of total spending in each of the years of 1994-1998.The other sub sectors- inland waterways, sea and coast, air, received between 2 and 3 percent oftotal transport expenditure. However, this may not show the full picture in that some transportSOEs may receive also investment funding from the banking system, as well as the budget. Theextent of any such borrowing is not known.
3. 166 With the exception of spending on inland waterways (and possibly rural roads, asdiscussed later) it appears that the sub-sector allocation is appropriate in relation to the role thesemodes play in the transport sector. Inland waterways as the second most important mode oftransport still appear under-funded, despite the increases between 1994 and 1998. Maintenanceexpenditure, at about 2 million VND per network km is too low to permit regular dredging andother maintenance work, let alone reduce the accumulated maintenance dredging. Improvinginland waterways in the northern and southern deltas would be the fastest and most cost effectivemeans of support for the poor rural delta regions.
3. 167 Allocation by regions. In terms of local transport expenditures by the provinces, roughly20 percent of the total was spent in the southern growth area HCMC-Ba Ria Vung Tau, andsome 10 percent in the northern growth corridor Hanoi-Haiphong. The majority of theremaining provinces spent between one and two percent each. Roads received the bulk of thebudget even in those provinces where waterway transport dominates. A few preliminaryobservations can be made.
- The economic growth areas spend less on local transport in proportion to theirrevenue generating power while many of the poorer provinces spend more. This maybe an indicator that the revenue transfer mechanisms between Government entities(central and provincial) are functioning in that poorer provinces/districts receivefunds to undertake higher spending. However, growth areas also benefited most fromcentral Government transport expenditure in the form of spending on large "A" typeprojects.
- Second, there is a tendency to distribute funds equitably across "deficit" provinces,reflecting some emphasis on equity as well as economic growth or efficiency criteria.
Current Expenditure
3. 168 Expenditure on roads accounts for about 80 percent of total current expenditure in thetransport sector, and in 1998 was about 482 billion dong (MOF figures). It appears that periodicmaintenance for national roads covers less than two thirds of the requirement . There is lack ofinformation on current expenditure at the local level, but it appears that many district andcommune roads are not regularly maintained.
3. 169 A number of studies of the Vietnamese road sub-sector have shown that there is potentialfor savings of public funds through better cost recovery in the road sector which would alsoincrease efficiency. The principle that road users should pay for the use of the road provided bythe state and their maintenance is accepted by the Government and partially applied in the formof tolls charged for the maintenance of specific rehabilitated or new roads. In addition theGovernment charges a transport fee in the form of a surcharge of 500 dong per liter of gasoline,but it is not specifically allocated to road maintenance and does not guarantee the proper
66
Chapter 3 -Inter and Intra-Sectoral Composition ofExpenditures
maintenance of the road network. The present toll system is inefficient, costly and covers only asmall amount of the road network.
3. 170 MOT is therefore considering to submit to Government a proposal based on the principlethat the road user should pay for the maintenance of the road network and have a voice in theadministration and use of the funds. The proposed instrument is a levy on gasoline (similar to theone already in place) that would replace the existing tolls and whose proceeds would flow into aseparate road maintenance fund (as is done in the Philippines and is under consideration inLaos), jointly managed by the Government and the representatives of the road users. The fundwould be built up gradually so as to minimize economic dislocation. Initially the Governmentwould transfer from the budget to the road fund the resources it now allocates for roadmaintenance and the road levy would supplement these resources. In the final stage the road fundwould be entirely funded by the levy on road users and eliminate the need for transfers from thebudget. The net impact on consumers and producers of introducing a road fund should bepositive, given the substantial net savings that are expected from improved road conditions. Ithas been estimated that the budget required for road maintenance would need to be on the orderof US$11 8-190 million per year if Vietnam's roads were maintained properly.
3. 171 There is a range of ways in which such a fund might be structural in terms of which roadsand which costs might be covered, which are set out in the Transport Annex of this report. Thegovernment should consider this proposal as a way of ensuring future adequate maintenance ofthe road network.
Improving the Quality and Management of Transport Infrastructure Projects
3. 172 Based on the work for this PER as well other recent work done in the transport sector inVietnam, there are a number of ways in which recognized problems in this area may beaddressed.
- Projects should be ranked in order of priority (aided by the economic rate of returncriteria) in the PIP. This implies that Type A projects to be included in the PIPshould be well evaluated before being submitted for PIP inclusion. In view of thecapacity constraints, Category B and C projects could be subject to a simplifiedevaluation methodology, but there should be a clear rank ordering.
* Line ministries and localities should be given-by MOF and MPI-an estimate of thelikely funding available over a longer period (a desirable period would be five yearsbut a three-year period could be more realistic) which would help these agencies toformulate investment programs based on the likely resource constraints.
* All publicly funded projects need to be better coordinated between differentgovernment entities-national, provincial and local-before they are included in thePIP. Coordination of projects between the center and sub-national entities isunsatisfactory at present. There also needs to be better horizontal coordinationbetween ministries. For instance, MOT has responsibility for all transport planningmatters but is rarely consulted on projects of other line ministries (such as a portproject or rural roads project). Similarly, district or provincial planning entities arerarely consulted about or concerned with plans and projects of neighboring localgovernments.
67

Vietnam: Public Expenditure Review 2000
* Capital and current expenditure planning should he better integrated and be subjectto the same planning cycles. For example, within MOT a five year road maintenanceprogram should be formulated at the sarne time as its PIP proposals. This wouldenable MOT planners to take into account the tradeoffs between current and capitalexpenditure and to avoid the present bias for capital expenditure. This would alsoassist in ensuring that projects are not proposed unless adequate operations andmaintenance funding is likely to be available. This also needs to be complemented bybetter coordination between MOF and MPI in the development of the recurrent anddevelopment budgets.
* The skills of individuals responsible for the planning and programming process at thecentral and local levels should be upgraded This requires both increased funding andthe development of training programs. Poorly prepared projects lead to inferior outputand ultimately to a much higher cost. A fraction of this cost could be spent inupgrading the skills of those who are responsible for project preparation as well asthose who select them. Finally specific funding allocations are need for projectpreparation costs.
* Planning and programming should avoid over optimism. Both about stated benefits ofprojects and capacity for implementation. Full account needs to be taken oflimitations on absorptive capacity. This requires a change in "mind-set" by officials.
* The project approval process could be streamlined by removing unnecessary layersin the process. The current project approval process is top heavy and repetitive anddifferent funding agencies (including donors) have different requirements. Onepossible remedy is that once the PIP is approved line ministries and local entitieswould be responsible and accountable for project implementation without the need topass all projects through further detailed processes of review and approval. Differingfunding and review agencies should also work together to harmonize theirrequirements.
* MPI should consider expanding its program monitoring beyond expenditure controlto monitor the efficiency of implementation as well as outcomes. The line ministryand the local entities should do the same at the project level. This information couldbe compiled into a periodic implementation progress report (e.g. annual) whichshould also flag implementation issues that might have arisen or possible future risks,and be submitted to the Prime Minister for review. Moreover, procedures should bedeveloped to ensure that the lessons learned are systematically incorporated inongoing programs/projects and future plans. Independent audit of all large projectsand a sample of smaller (B and C) projects of the center and localities should also beundertaken.
The Evolving Role of the Private Sector in Transport
3. 173 Vietnam is in transition from a command economy to a more market based model and thepublic/private mix in the transport sector is still evolving. This has major public expenditureimplications. On the one hand, divestiture/equitization of public enterprises will result in aninitial reduction in revenue (payments to the budget from SOEs) that is likely to be replaced byhigher tax revenues in the long run. On the other, the sectoral claims on the state's resources for
68

Chapter 3 - Inter and Intra-Sectoral Composition of Expenditures
subsidies and investment capital will also be reduced. However the current overall budgetaryimpact of transport SOEs is not known, nor is the potential impact of divestitures.
3. 174 There appears to be scope to re-balance the public/private mix in transport to reduce thetransport sector's demands on state resources and increase economic efficiency by reducingoperating costs, while preserving the role of the state as regulator and guardian of publicinterests.
3. 175 Vietnam's transport sector has undergone significant changes since the move to a moremarket based economy. For example, in 1998 about 98 percent of the freight, 94 percent ofpassenger road vehicles and 71 percent of inland waterway vessels were operated by non-stateentities. In contrast air, rail and sea transport remain dominated by public enterprises and privatesector participation is negligible.
3. 176 This situation is partly a reflection of market realities and partly due to the slow processof transformation. After the barriers to private ownership were removed, the private sector hasquickly taken hold in markets with low entry barriers such as truck and bus operations in roadtransport and small vessels in inland waterway transport. While the Government has decided todivest the majority of its transport SOEs, only a few have been divested to date. There are anumber of reasons for this slow progress including (i) incomplete or inappropriate legalframework; (ii) lack of experience in the divestiture process; (iii) lack of interest and financingcapacity in the private sector and (iv) concern about the social consequences of redundancy andlack of social safety nets. Major cities such as HCMC, Hanoi and Haiphong have been able todivest a number of their enterprises, but little progress seems to have been made in the provinces.However it is expected that the divestiture process will accelerate over the next year as theminister has given it highest priority. In addition, as discussed in Chapter 1, the Government isabout to announce a major program for SOE reform, which will include the transport sector.
3. 177 The Government has decided to retain in state ownership, the country's basic transportinfrastructure and the related enterprises, which it considers of strategic importance (e.g. ports,airports, sea transport). But at the same time the Government's aim is to improve the functioningand efficiency of these transport modes. The challenge is to ensure that the principle of economicefficiency is applied in the management of transport enterprises regardless of ownership andindustrial organization. This means that the Government could consider: (i) expediting thedivestiture of non-strategic enterprises; (ii) holding the SOEs remaining in the state sector to thesame standards, incentives and disciplines of the marketplace as private sector companies; (iii)ensuring that transport markets are not hampered by restrictive regulations or practices andfocussing the role of the Government on establishing a regulatory framework that fostersefficient markets and fair competition between all market participants.
3. 178 If the GOV objective is to exercise overall control of perceived strategic activities-suchas sea or air transport, ports and airports-this may be achieved by continuing governmentownership, but with some operations contracted out to private interests, who operate the serviceon a commercial basis. This would help improve the efficiency of these activities. For exampleprovided Vietnam's sea ports are allowed to compete with each other, private operation or BOTtype arrangements could be considered by the Government, particularly when considering newinvestments for port modernization, rehabilitation and expansion. Examples of this possibility inVietnam are the small Baria-Serese port complex and the Thuon Dong container port near
69

Vietnam: Public Expenditure Review 2000
HCMC. The Government may thus wish to gradually involve the private sector in operating andmaintaining ports.
3. 179 In those SOEs where the Government wishes to retain both ownership and operation, itshould consider establishing a performance framework for their operation. This would includeperformance targets (financial and service targets), and management autonomy andaccountability in achieving these targets. Payment for any social obligations would be negotiatedwith the SOE management and paid from the budget.
3. 180 Funding requirements for road rehabilitation, modernization and maintenance are a heavyburden on the state budget in Vietnam and only part of these requirements can be funded throughthe budget. The Government has therefore offered a number of roads to the private sector forfunding and operation. So far only a few small domestic contractors are involved in BOTschemes for small bridges and highway sections, for which they have the right to collect tolls.However foreign enterprises have been reluctant to invest in road infrastructure in Vietnam dueto low traffic levels and ability of users to pay, lack of an enforceable legal framework and therisks thus involved, high up front costs and the relatively low (risk adjusted) returns to be earned.Only one local/foreign partnership (between a Taiwanese company and the city of HCMC) hasmaterialized so far in the form of a 17.8 km tolled highway between Tan Thuan ExportProcessing Zone and highway No. 1.
Future Expenditure Strategy
3. 181 In conjunction with the preparation of the 2000-2005 PIP a transport master plan,covering all inter-urban transport, plus separate but related strategies for rural roads and urbantransport are being formulated. The master plan addresses the proposed ranking of major projectsand sets out a broad strategy for future transport spending over a ten year period. Full costestimates are incorporated in all these proposed strategies.
3. 182 This strategy set out in Box 3.2 is broadly appropriate, but much depends on the availablelevel of future funding. It is unrealistic to assume that there can be a substantial increase in statebudget funding for transport and therefore much will need to come from ODA. It is alsoimportant that the Government not overcommit itself to, or overestimate its ability to implementa range of large projects.
3. 183 Given likely limitation of resources, it is suggested that the Government should considerthe following options to maximize use of the limited transport budget.
* Consider an increased role for private operation in the transport sector
* Accelerate the reform of SOEs, including divestiture where appropriate, and developa commercial performance framework for those SOEs to continue in governmentownership.
* Consider the establishment of a earmarked road fund to provide for user charges inthe form of a gasoline levy to fund future road maintenance
* Consider increasing levels of maintenance for inland waterways
* Consider increasing expenditures on the construction and maintenance of rural roads.
70

Chapter 3 - Inter and Intra-Sectoral Composition ofExpenditures
* Improve budgets and management processes to ensure better quality and managementof transport infrastructure projects.
Box 3.2: Broad Stratgy for Future Speuding
Abo 20 percen of the budget envelope should be allocated to maintenance and minorimprovements.
About 8-8.5 percent of the budget envelope should be allocated to improvement ofaccessibiity in rural (remote and mountainous) areas. Communes which are presentlyinaccessible should be provided with adequate acess.
Priority should be given, to proets ta remove taff bottlenecks and stengtn thenetwork to meet traffic demand.
Strategic transport infrastrucre for land, water and ai transport in and between thenorth, center and south growith dors shod be imroved and integrated with tasportlinks to the region and global makets.
Urban transport should be improved so as to reduce cowngesion and to support the urbancelters' function as engines of growth and gateways to regional and intemationai markets.
Source: Adapted from VITRANSS Master Plan Study. Final Draft, July 2000.
SOCIAL SAFETY NET EXPENDITURES
Introduction
3. 184 Safety net programs encompass a wide array of public interventions aimed at raising theeconomic well-being of the poor and protecting them from adverse outcomes. Cash and in-kindtransfers, price subsidies, public works, and credit-based income programs are all examples ofpublic interventions whose objective is raising standards of living. Pension schemes, healthinsurance and other types of social insurance are examples of programs that prevent largedeclines in income and well-being.
3. 185 The term "safety nets" itself is not uniquely defined but broadly speaking programs canbe classified as either of the social assistance type (assistance to raise well-being) or the socialinsurance type (to prevent large declines in well-being).
3. 186 There is a wide mix of social assistance and social insurance programs in Vietnam. TheContingency Fund for Pre-Harvest Starvation and Disaster Relief and the Social Assistance Fundfor Regular Relief are two social assistance programs that provide assistance to those who areeither unable to provide for themselves or require temporary assistance on account of unforeseenadversity. A third "social subsidy" program is the Social Guarantee Fund which provides incometransfers to those who contributed to the re-unification efforts. This Fund is not and is notintended to be a need based program, although many of the recipients may be poor.3. 187 Total spending on these "social subsidies" made up 13.2 percent of the budget in 1997and 11.9 percent in 1998. For a country at Vietnan's level of economic development that isimpressive. But not all expenditures classified as social subsidies are "safety net" expenditures.On the other hand there are a significant number of social safety net programs not included in the"social subsidies" item in the budget. These include elements of the Hunger Eradication and
71

Vietnam: Public Expenditure Review 2000
Poverty Reduction Program (HEPR) and National Target Program on Employment (NTPE) aswell as the Vietnam social and health insurance schemes, discussed later in this section.
Table 3.15: Social Subsidies(Unit: in million VND)
No. EWEJ: e 1- 7 19--
1 Payment to Social Insurance and Health Insurance schemes 5,184,244 5,334,714and other assistance for pre-1995 pensioners
2 Expenditure for Social Guarantee and Protection Centers 2,724,338 2,376,4833 Direct transfers and other expenditures for Social Guarantee 1,463,774 1,726,473
and ProtectionTotal 9,372,356 8,712,585(Excluding expenditure by communes out of transfers fromcentral government to communes and their own revenue)
Source: Ministry of Finance
3. 188 The two main social insurance programs - the Vietnam Social Insurance scheme, and theVietnam Health Insurance scheme, constitute important sources of social protection. Both areoperated through off-budget funds. These are very young programs (both started in 1995) andtheir coverage beyond the formal wage economy is very limited. But both programs intend toexpand their coverage into rural areas and the non-wage sectors and in the medium to long termthey will be important components of the country's social protection system.
3. 189 There are several other safety net programs that command attention. These aredevelopment programs under the Hunger Eradication and Poverty Reduction Program (HERP),credit-based employment initiatives under the National Target Program on Employment (NTPE)and rural public works which aim to raise incomes of the poor. Some elements of these programsare more geared towards general development assistance and income growth, but most havesome focus on poverty alleviation.
3. 190 Assessing public spending on safety net programs involves reviewing programobjectives, targeting of beneficiaries, the incentives beneficiaries face, distortionary costsintroduced by program interventions, costs of administering the programs, and alternativedelivery mechanisms. The information and resource requirements of such a comprehensiveanalysis are beyond the scope of this review.
3. 191 This section identifies a range of social safety net programs in Vietnam, which arediscussed in more detail below. However it has not been possible because of limitations in theexpenditure classification systems to obtain expenditure figures on all these programs, and thusto make an assessment of Vietnam's expenditure on social safety nets.
Social Protection Fund for Regular Relief
3. 192 This is a mix of regular and temporary social assistance transfers, funded by the centralgovernment with additional funds provided by local authorities. Regular monthly benefits areprovided to three groups of beneficiaries who are considered to be unable to assist themselves.These are the elderly who are poor and live alone and have no other source of support, orphan,and civilians who are disabled. A subset of these beneficiaries is also placed in Social ProtectionCenters. Temporary benefits are provided to a small set of homeless people. Beyond these two
72

Chapter 3 - Inter and Intra-Sectoral Composition of Expenditures
types of benefits, the Fund also provides assistance to rehabilitation programs dealing with the"social evils" of drug abuse, prostitution, and HIV/AIDs, and some other types of supplementaryassistance for schooling expenses and health care.
3. 193 The elderly and disabled groups together account for around three quarters of allbeneficiaries, with orphans accounting for another 24 percent. The elderly are most likely toreceive assistance, but it is worth noting that the number of elderly receiving assistance make uponly about 1 percent of the elderly in Vietnam; for the vast of the elderly majority the extendedfamily is the main source of support. At the same time, the lower benefit grant rate (the percentof those eligible who receive benefits) for the disabled reflects the fact that a large proportion ofthem receive assistance from the Social Guarantee Fund.
3. 194 As the primary (regular) component of the official safety net programs, the SocialProtection Fund for Regular Relief is extremely limited, both in its coverage and in the size ofindividual payments. Average transfers are barely adequate to meet basic food needs, and in1998 only 20 percent of the eligible population was covered by the Fund'8. This represents onlyabout 0.2 percent of the total population. At the same time the number of beneficiaries has grownby 41 percent in 3 years. Available data do not permit any assessment of the extent to whichineligible beneficiaries receive payments, although this may occur in better off provinces.However, there is considerable variation in payments across communes and provinces. Somewealthier communes may also pay higher benefits. But all communes must meet the minimumstandards set by the government.
3. 195 As the recently completed study on safety nets by ILO concludes, "In effect, the SocialProtection Fund for Regular Relief is in a state of dynamic tension over beneficiary numbers.Government policy appears to be to keep numbers at low levels. However, the communes keepidentifying large numbers of people who appear to be eligible for benefits under the existingcriteria laid down by the government" (p. 56). In response to this the govermment has tried tolimit the number of beneficiaries by clarifying criteria, providing guidelines for prioritizing, andfixing financial allocations. At the same time, though, increasing pressure from the communesand improved financial conditions have permitted greater allocations to the Fund.
3. 196 It appears that there is a need for a specialized agency, or specialized personnel toadminister the fund and evaluate its performance. At the current level of funding, however, thehigher administrative costs would probably not be justifiable.
Contingency Fund for Pre-Harvest Starvation and Disaster Relief
3. 197 This is the primary safety net program which covers the majority of the population. It hastwo components, covering natural disasters and "pre-harvest starvation".
3. 198 Natural disasters, such as floods, typhoons, droughts, etc. are fairly frequent occurrencesin Viet Nam. The Contingency Fund aims to mitigate some of the hardship caused by theseperiodic natural disasters, by compensating family members for the loss of life and property.Each disaster-related death is compensated by a payment of 1 million Dong. With propertydamage there is partial compensation based on damage assessments undertaken by localauthorities, but subject to availability of funds. Compensation for other types of losses due to
18 "Statistics on Social Safety Nets in Vietnam"-Labor and Social Affairs Publishing House, November 1999.
73

Vietnam: Public Expenditure Review 2000
flood damage to land and crops is less likely, though concessional development loans might bemade available through other sources.
3. 199 Obviously, total expenditures on disaster relief vary with the 'extent of disasters. Forexample, in 1996, total expenditures were 71, 270 million Dong, but in 1997 and 1998 they weremore than 5 times as much at 400, 000 million and 364, 910 million Dong respectively. Much ofthis expenditure is from the state budget.
3. 200 The "pre-harvest starvation" element of the Contingency Fund mainly covers grants tofamilies at risk of starvation in the pre-harvest period, though it also covers some food aid givento poor families for the Tet festival. About one half of all who seek assistance for this element ofthe program are granted assistance. The amount of assistance varies from one commune (andprovince) to another, but the average level of the grant seems to be around 50,000 Dong. The lowcoverage of the "pre-harvest starvation" element and the very small amount of assistance limitthe ability of the program to provide meaningful protection to the rural population.
3. 201 Other than administrative convenience, it is not clear why these two quite differentaspects of income variability are addressed in the same program. A separation would assist tofurther development of specialized administrative capacity, since (disaster) damage assessment isquite different from the targeting and beneficiary-needs skill requirements of more typical socialassistance programs.
Development Assistance Programs under HEPR
3. 202 The Hunger Eradication and Poverty Reduction Program encompasses a range of policyand program initiatives aimed at reducing poverty and increasing incomes. There are nineprogram components:
* construction of basic commune infrastructure
* promotion of agricultural and off-farm production and employment
* credit for the poor
* health care for the poor
* education for the poor
* extension services for agro-forestry and fishing
* training of HEPR staff
* sedenterization, (re-settlement) internal migration, and new economic zones
* assistance to ethnic minorities
3. 203 The Ministries of Education, Health, Agriculture, and Labor and Social Welfare, areinvolved in this effort as are other organizations such as the Vietnam Bank for Agriculture andRural Development, Vietnam Bank for the Poor, Vietnam Women's Union, and the Committeefor the Ethnic Minority and Mountainous Areas.
3. 204 The focus of the HEPR program is poverty eradication, and in a sense all programcomponents contribute towards this goal. Some of these components, however, are moregeneralized development initiatives which, while certainly helping the poor, may not always
74

Chapter 3 - Inter and Intra-Sectoral Composition of Expenditures
viewed as part of safety net programs. For example, non-targeted agricultural services(promotion and extension), environmental efforts aimed at re-greening mountainous areas, landallocation policy, and prevention of drug abuse all have a broader development focus. But it canbe argued that as they aim to prevent people falling into poverty they are appropriately part ofsocial safety nets. On the other hand, the more targeted HEPR programs, such as subsidizedcredit, fee exemptions for education and health are clear candidates for inclusion in the safety netcategory. In a similar vein employment oriented programs that mitigate the effects ofrestructuring of state owned enterprises or create employment via public works also form part ofthe government's effort to provide protection to those with inadequate incomes and those whoare most likely to suffer downturns in income.
3. 205 One of the major component of the HEPR has been provision of collateral-free,subsidized loans to the poor for income-generating activities. Implementation at the communelevel, by People's Committee officials, permits closer monitoring of activities. However, thereare concerns about the adequacy of targeting of the poor, and the long term sustainability of theincome-generating activities for which funds are borrowed. GSO data suggest that only 20percent of all loans from the Vietnam Bank for the Poor were allocated to the poorest 40 percentof households, while the better off 40 percent of households received 30 percent of all loans.Female-headed households were also less likely to receive loans. There appears to be excessivereliance on credit-based programs, without due attention to skills training and other technicalassistance. Recent studies suggest that the efficacy of the credit-based approach needs to beevaluated.
National Target Program on Employment19
3. 206 The National Target Program on Employment (NTPE) is a key component of thegovernment's effort at increasing employment during the transition to a market economy.Initiated in 1998, the program aims, in the short term, to create 1.3 to 1.4 million jobs annually,reduce urban unemployment from 6 percent to 5 percent (by the year 2000), and reduce ruralunderemployment from 30 percent to 25 percent.
3. 207 This is a general employment-oriented program financed by the National Fund forEmployment Promotion (NFEP) and it works primarily by providing subsidized credit for self-employment in small scale enterprises such as handicrafts and agro-processing. The programalso supports Centres for Employment Service which provide skill training to job seekers, andserve as bases for matching them with potential employers.
3. 208 Roughly two-thirds of the funds from NFEP are allocated to rural areas, and to the extentthat animal husbandry activities and small scale handicrafts account for two-thirds of totalallocations, the program probably benefits women more than men, because women tend to moreinvolved in these activities.
3. 209 The NTPE's role as a safety net for the poorest is limited because credit provision isbased on viable proposals, on the borrowers being credit worthy and on seed money from theborrower (almost equal to the borrowed sum). At the same time, the fact that there is preferentiallending to women, the poorest groups, and the unemployed - provided the project proposaldemonstrates employment creation potential -makes it reasonable to include this program in the
'9 This section draws heavily on the recently completed ILO study on labor markets and National Target Program onEmployment and the Hunger Eradication and Poverty Reduction Program (ILO, 2000).
75

Vietnam. Public Expenditure Review 2000
safety net category. But it would be worth focussing greater attention in the NTPE on skilltraining, and this could be more targeted to poor households and women.
Social Insurance
3. 210 The two main social insurance programs in Vietnam are the Vietnam Social Insurance(VSI) scheme and the Vietnam Health Insurance (VHI) scheme. These are relatively newprograms, though VIS builds on an earlier social security scheme that covered state employeesand the armed forces. Current coverage of both programs is largely restricted to the formal wage-income sector, though efforts are underway to extend them to the much larger self-employedsector. In addition to these two programs, there are other small-scale pension and insuranceschemes that operate at the commune level. Since the focus of this report is more on socialassistance and less on social insurance, attention is restricted to the two main insuranceprograms.
3. 21 1 Vietnam Social Insurance Scheme. (VSI) A new self-financing social insurance systemwas established in Vietnam in 1995. It covers the civil service, armed forces, employees of stateinstitutions and SOEs, Vietnamese staff in joint ventures and employees in non-state enterpriseswith 10 or more workers.20 In 1998, there were 3.2 million contributors to the new scheme, andaccording to MOLISA these make up roughly 14 percent of the labor force.
3. 212 The scheme covers sickness, maternity, employment injury, retirement, and survivorship.A brief summary of the coverage provided is as follows:
* Sickness benefits, equal to 75 percent of insurable earnings and ranging from 30-60days a year depending on type of occupation and length of insurance.
* Maternity benefits, for 4-6 months based on 100 percent of insurable earnings.
* Employment injury and occupational disease benefits based on minimum wages, withbenefits up to 1.6 months, along with death and funeral benefits where appropriate.
* Retirement pensions are paid at the rate of 45 percent of average eamings for 15years, thereafter rising at the rate of 2 percent up to a maximum of 75 percent, subjectto contributions having been paid for at least 20 years. The pensionable age for atleast 20 years women is 55 as against 60 for men.
3. 213 Employers pay 15 percent of basic salaries, of which 10 percent is allocated to pensioninsurance and 5 percent to sickness, maternity, and employment injury benefits. Employeescontribute 5 percent which goes towards pension insurance.
3. 214 The scheme is a small beginning in the government's objective of providingcomprehensive social security protection for the entire population. In the past few yearsconsiderable technical assistance has been provided to assist MOLISA in developing a SocialSecurity Act, which would set out a more comprehensive system of coverage. This work isscheduled to be finalized in 2000.
20 This new scheme builds on the earlier scheme, which covered only State (government staff and SOE personnel)employees, and Armed Force personnel, but was an extension of the State employment system and had to rely on thebudget to meet deficits: the state is still responsible for pensions arising before 1995.
76

Chapter 3 - Inter and Intra-Sectoral Composition of Expenditures
3. 215 Vietnam Health Insurance scheme (VHI ). Health insurance is a relatively recent
phenomena, having begun in 1993, but it has grown rapidly since its inception. (This issue is alsodiscussed in the section of this chapter covering health expenditures).
3. 216 There are two components to the Vietnam Health Insurance program: (a) a compulsoryscheme that covers current and retired civil service personnel, and employees of large state andprivate enterprises, and (b) a voluntary scheme that seeks to cover the rest of the population.Premiums for the compulsory scheme are based on a 3 percent payroll tax (employers 2 percent,and employees 1 percent). Premiums for the voluntary scheme are fixed annually, but vary byprovince and type of coverage chosen.
3. 217 The VHI is administered by the Vietnam Health Insurance Authority (VHIA), withprovincial health insurance offices recently brought under the control of the VHIA. Facilities arepaid on a fee-for-service basis and until recently services at only public facilities were coveredby the plans. A natural outcome of insurance is that there are incentives for both users andproviders to increase service provision. Indeed since its inception, utilization rates of the insuredhave been too high in relation to the revenues of the VHIA and have threatened the financialviability of the program. As a result some remedial measures have been included to restrainpayments
3. 218 Given the importance of health expenses in household budgets there is little doubt that awider definition of social protection requires assessing how unexpected health expenses are metby households. The inception of the health insurance package in the past decade attests to therecognition, in Vietnam, that society-wide provision of health insurance is necessary. The realquestions are, therefore, how this is to be achieved, how the system's financial viability is to bemaintained, and how the twin (insurance) issues of moral hazard and adverse selection arehandled.
3. 219 Compulsory coverage has expanded rapidly and already covers roughly three fourths ofits target population. The real challenge is extending voluntary coverage, especially in ruralareas, where agricultural activities are largely of a self-employed nature. The current inequity incoverage of the poor and rich stems largely from the nature of income-earning activities and therural-urban locational difference. As the system addresses its existing financial viabilityproblems (arising from over-prescription and over-utilization), it is likely to gradually developthe financial capacity and the technical and administrative skills to extend voluntary coverage torural areas.
Conclusions
3. 220 In a country with 30 to 40 percent poverty, the need for public provision of socialprotection is self-evident. Providing safety net programs that serve a redistributive role directlyaddresses humanitarian concerns about poverty and deprivation. In addition to equity, there areefficiency considerations. Programs that help the poor weather income shocks prevent assetdecumulation, and promote more widely dispersed growth. The role of the state in this area is,therefore, quite clear. The real questions are those concerning the choice of programs, the extentof coverage, and the degree of assistance provided by the state.
3. 221 Vietnam's approach to safety nets considers that responsibility for poverty alleviation liesnot just with the government, but also with the community, and the poor themselves. As a resultmuch of the development effort relies on commune-delivered credit, and safety nets are
77

Vietnam: Public Expenditure Review 2000
essentially minimalist transfers to those who are really destitute and vulnerable. The effort atpromoting self-help, and avoiding welfare dependency is clear.
A Menu of Reform Options
3. 222 As discussed above the coverage of the main social assistance programs is low and theamounts provided are low as well. Existing evidence suggest that these assistance programs arenot reaching the poor very effectively.
3. 223 A final observation concerns the existing system of beneficiary identification andassistance delivery. Commune-level identification of potential beneficiaries and delivery ofassistance does make for better use of information, but it has limitations. There is some cross-commune inconsistency in the way in which beneficiaries are identified, and there tend to belarge differences in the amount of the assistance itself between different communes. Changes inprogram administration that maintain commune-level identification and assistance-delivery butalso ensure transmission of information up to the province and central level are worthconsidering.
78