report no. 2013-01 - philippine statistics authority 4 1 3 0 0 2 0 3 5 9 0 6 7 7 9 7 2 agricultural...
TRANSCRIPT

AGRICULTURAL CREDIT
BUREAU OF AGRICULTURAL STATISTICS
REPORT No. 2013-01
ISSN-2012-0435
AGRICULTURAL CREDIT
BUREAU OF AGRICULTURAL STATISTICS
TERMS OF USE Agricultural Indicators System (AIS) Report is a publication of the Bureau of Agricultural Statistics (BAS), Department of Agriculture. The BAS reserves exclusive right to reproduce this publication in whatever form. Should any portion of this publication be included in a report/article, the title of the publication and the BAS should be cited as the source of data. The BAS will not be responsible for any information derived from the processing of data contained in this publication.
ISSN-2012-0435
Please direct technical inquiries to the Office of the Director BUREAU OF AGRICULTURAL STATISTICS Ben-Lor Building, 1184 Quezon Avenue, Quezon City, Philippines 1100 Email : [email protected] Website : www.bas.gov.ph
Design and Layout Information and Dissemination Services Section (IDSS)

AGRICULTURAL CREDIT
BUREAU OF AGRICULTURAL STATISTICS
FOREWORD
The Agricultural Indicators System (AIS) is one of the statistical
frameworks maintained by the Bureau of Agricultural Statistics (BAS). It has twelve (12) modules and these are being updated and released annually. This is the first module entitled Agricultural Credit. It provides information on loans for agricultural production granted by private and government institutions. The reference years are 2008 to 2012 The AIS hopes to cover more agricultural development indicators to support the information needs of BAS clientele and stakeholders. Hence, the readers are encouraged to give their comments and suggestions on the improvement of the AIS, in general, and the report, in particular.
The BAS would like to acknowledge the Agricultural Credit Policy Council (ACPC) for providing the basic data on agricultural credit. ROMEO S. RECIDE Director
Quezon City. Philippines June 2013
i

AGRICULTURAL CREDIT
BUREAU OF AGRICULTURAL STATISTICS
TABLE OF CONTENTS
iii 8
Table 5.
Agricultural production loans to output (GVA) ratio, Philippines, 2008-2012(in percent)
COMMODITY 2008 2009 2010 2011 2012
% of Agricultural Production Loans to GVA in Agriculture 15.92 20.26 18.54 18.47 19.77
Agricultural Crops Palay 12.79 14.99 14.81 15.00 14.45 Corn 2.72 3.02 3.53 5.59 6.15 Coconut 7.83 14.86 8.14 5.68 7.95 Sugarcane 27.63 37.33 32.42 20.85 39.32 Rubber 0.58 1.61 0.16 0.29 0.42
Livestock and Poultry 10.92 12.21 11.47 12.61 13.20
Fisheries 3.15 3.67 2.86 2.85 2.85
Forestry 4.36 5.25 12.93 8.15 10.25
FOREWORD i
LIST OF TABLES i i i
AGRICULTURAL CREDIT
Table 1. Share of agricultural production loans in agriculture and total loans, Philippines, 2008-2012 4
Table 2. Percentage distribution of agricultural production loans granted by institution, Philippines, 2008-2012 5
Table 3. Growth rates of agricultural production loans (at current prices) granted by institution, Philippines, 2008-2012 6
Table 4. Percentage share of production loans by commodity in total production loans, Philippines, 2008-2012 7
Table 5. Agricultural production loans to output (GVA) ratio,Philippines, 2008-2012 8

AGRICULTURAL CREDIT
BUREAU OF AGRICULTURAL STATISTICS
6
AGRICULTURAL CREDIT
Table 3.Growth rates of agricultural production loans (at current prices) granted by institution, Philippines, 2008-20112(in percent)
FINANCIAL
INSTITUTION2008 2009 2010 2011 2012
Government Banks 80.08 47.71 -0.95 13.10 19.88 DBP 37.43 337.93 -73.05 -38.89 9.99 LBP 83.14 32.10 11.91 15.33 20.11
Private Banks 0.70 28.51 -3.73 10.70 6.69 PKBs 36.29 44.41 -11.87 11.25 3.94 PDBs 273.57 -13.24 50.61 2.21 2.21 SMBs -69.03 138.76 -3.43 8.62 8.62 SSLAs 158.31 43.86 -15.37 4.07 4.07 RBs 8.37 -10.97 -3.71 18.37 11.34
ALL BANKS 5.85 30.63 -3.38 11.00 8.41
AGRICULTURAL CREDIT
BUREAU OF AGRICULTURAL STATISTICS
1 4
Agricultural Production Loans
Indicators of agricultural credit provide information on credit needs of the
farmers and fishermen in financing their production activities and the
extent of loans provided by the different financial institutions. These are
important statistical information for planners and policy makers to
support the implementation of credit programs and policies geared
towards achieving the development of the agricultural sector.
The agricultural loans granted to farmers in 2012 amounted to P705.11
billion. About 35.1 percent of the agricultural loans or P247.30 billion at
current prices were intended for production purposes. This amount of
production loans was higher by 8.4 percent from the 2011 record. At
constant 2000 prices, production loans surged by 10.1 percent to P138.21
billion in 2012 (Table1).
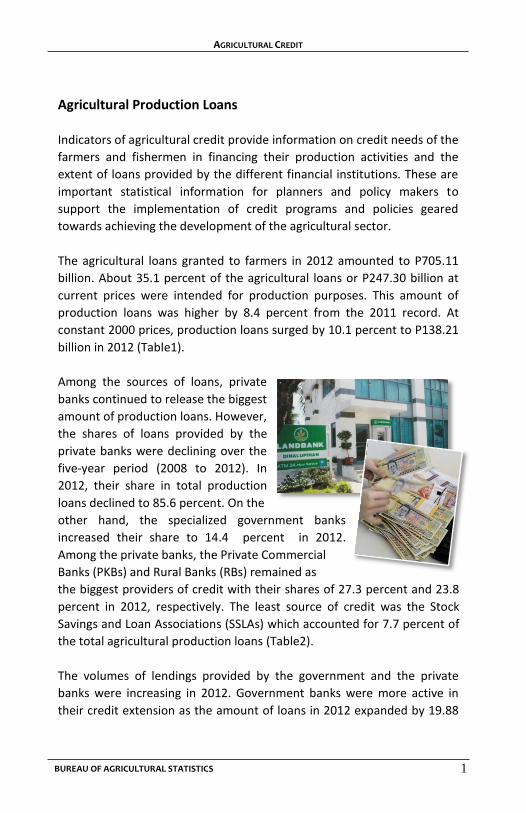
Among the sources of loans, private
banks continued to release the biggest
amount of production loans. However,
the shares of loans provided by the
private banks were declining over the
five-year period (2008 to 2012). In
2012, their share in total production
loans declined to 85.6 percent. On the
other hand, the specialized government banks
increased their share to 14.4 percent in 2012.
Among the private banks, the Private Commercial
Banks (PKBs) and Rural Banks (RBs) remained as
the biggest providers of credit with their shares of 27.3 percent and 23.8
percent in 2012, respectively. The least source of credit was the Stock
Savings and Loan Associations (SSLAs) which accounted for 7.7 percent of
the total agricultural production loans (Table2).
The volumes of lendings provided by the government and the private
banks were increasing in 2012. Government banks were more active in
their credit extension as the amount of loans in 2012 expanded by 19.88
percent. Specifically, the Land Bank being the biggest financing arm of
Tab
le 1
.Sh
are
of
agri
cult
ura
l pro
du
ctio
n lo
ans
in a
gric
ult
ure
an
d t
ota
l lo
ans,
Ph
ilip
pin
es,
20
08
-20
12
20
00
CU
RR
ENT
PR
ICES
PR
ICES
20
08
48
2.4
73
3.7
20
09
62
8.5
13
3.8
20
10
64
7.4
53
1.7
4
20
11
65
5.7
23
4.8
20
12
70
5.1
13
5.1
SHA
RE
IN
TOTA
L
LOA
NS
(%)
AG
RIC
ULT
UR
AL
LOA
NS
GR
AN
TED
(A
MO
UN
T IN
BIL
LIO
N P
)
YEA
R
SHA
RE
IN
TOTA
L
AG
RIC
ULT
UR
AL
LOA
NS
(%)
TOTA
L
LOA
NS
GR
AN
TED
(A
MO
UN
T IN
BIL
LIO
N P
)
AG
RIC
ULT
UR
AL
PR
OD
UC
TIO
N L
OA
NS
GR
AN
TED
AM
OU
NT
(BIL
LIO
N P
) G
RO
WTH
RA
TE (%
)
CU
RR
ENT
PR
ICES
20
00
PR
ICES
16
2.8
31
06
.46
5.9
-8.0
21
2.7
13
4.4
73
0.6
26
.3
20
5.5
12
2.8
3-3
.4-8
.7
22
8.1
21
25
.57
11
.02
.2
24
7.3
13
8.2
18
.41
0.1
16
2.8
31
06
.46
5.9
-8.0
21
2.7
13
4.4
73
0.6
26
.3
20
5.5
12
2.8
3-3
.4-8
.7
22
8.1
21
25
.57
11
.02
.2
24
7.3
13
8.2
18
.41
0.1
0.9
1.0
0.7
0.7
0.7
18
84
5.8
3
22
03
0.9
5
30
30
3.4
6
33
61
0.7
9
35
85
7.1
2
16
2.8
3
21
2.7
0
20
5.5
0
22
8.1
2
24
7.3
0
AGRICULTURAL CREDIT
BUREAU OF AGRICULTURAL STATISTICS
peso of sugarcane output. The credit support for palay was P0.14 while
for corn, P0.06. Rubber had lower loan assistance with a ratio of 0.13
percent.
Livestock and poultry continued to increase utilization of loans at a ratio
of 13.20 percent in 2012. It was 2.85 percent for fisheries (Table5).
percent. Specifically, the Land Bank being the biggest financing arm of
the government increased their supply of loans by 20.11 percent
compared to last year’s 15.33 percent. Private banks slowed down their
loan releases by 6.69 percent. Rural Banks (RBs) recorded the highest
increase in lendings at 11.34 percent. However, it was lower compared to
the 2011 growth rate of 18.37 percent. The Private Commercial Banks
(PKBs ), likewise, recorded sluggish growth in their credit assistance by
3.94 percent from the previous year’s growth at 11.25 percent (Table 3).
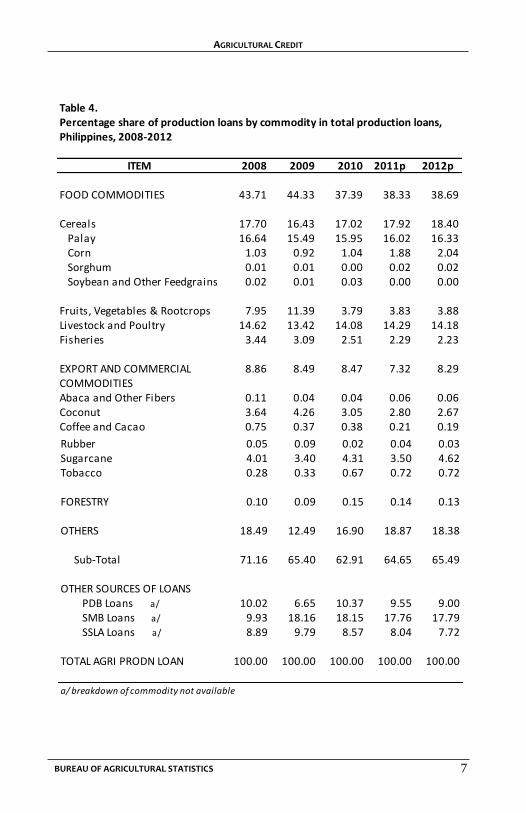
The biggest amount of agricultural
production loans was utilized to finance the
food commodities. In 2012, 38.69 percent
of the production loan were allocated for
food production, of which 16.33 percent
were intended for palay and 14.18
percent for livestock and poultry. Fruits, vegetables and rootcrops
had a credit share of 3.88 percent. Loans to finance the production of
export and commercial commodities comprised 8.29 percent. Of this
share, 4.62 percent went to sugarcane and 2.67 percent to coconut (Table
4).
Ratio of Agricultural Production Loans to GVA in Agriculture
The ratio of production loan to GVA in agriculture is an indicator of loan
to output ratio which measures the portion of the agricultural output that
is absorbed by bank for credit availment. It provides information on the
most and least financed sectors or commodities.
The ratio of production loan to GVA
in agriculture increased to 19.77
percent in 2012. This means that for
every peso value of agricultural
output, P0.19 was financed by bank
loans. Among the crops, sugarcane
was the most financed crop
indicating a ratio of 39.32 percent or
P0.39 of credit assistance for every
3 2
indicating a ratio of 39.32 percent or P0.39 of credit assistance for every
peso of sugarcane output. The credit support for palay was P0.14 while
AGRICULTURAL CREDIT
BUREAU OF AGRICULTURAL STATISTICS
peso of sugarcane output. The credit support for palay was P0.14 while
for corn, P0.06. Rubber had lower loan assistance with a ratio of 0.13
percent.
Livestock and poultry continued to increase utilization of loans at a ratio
of 13.20 percent in 2012. It was 2.85 percent for fisheries (Table5).
percent. Specifically, the Land Bank being the biggest financing arm of
the government increased their supply of loans by 20.11 percent
compared to last year’s 15.33 percent. Private banks slowed down their
loan releases by 6.69 percent. Rural Banks (RBs) recorded the highest
increase in lendings at 11.34 percent. However, it was lower compared to
the 2011 growth rate of 18.37 percent. The Private Commercial Banks
(PKBs ), likewise, recorded sluggish growth in their credit assistance by
3.94 percent from the previous year’s growth at 11.25 percent (Table 3).
The biggest amount of agricultural
production loans was utilized to finance the
food commodities. In 2012, 38.69 percent
of the production loan were allocated for
food production, of which 16.33 percent
were intended for palay and 14.18
percent for livestock and poultry. Fruits, vegetables and rootcrops
had a credit share of 3.88 percent. Loans to finance the production of
export and commercial commodities comprised 8.29 percent. Of this
share, 4.62 percent went to sugarcane and 2.67 percent to coconut (Table
4).
Ratio of Agricultural Production Loans to GVA in Agriculture
The ratio of production loan to GVA in agriculture is an indicator of loan
to output ratio which measures the portion of the agricultural output that
is absorbed by bank for credit availment. It provides information on the
most and least financed sectors or commodities.
The ratio of production loan to GVA
in agriculture increased to 19.77
percent in 2012. This means that for
every peso value of agricultural
output, P0.19 was financed by bank
loans. Among the crops, sugarcane
was the most financed crop
indicating a ratio of 39.32 percent or
P0.39 of credit assistance for every
3 2
indicating a ratio of 39.32 percent or P0.39 of credit assistance for every
peso of sugarcane output. The credit support for palay was P0.14 while

AG
RIC
ULT
UR
AL C
RE
DIT
BU
RE
AU
OF A
GR
ICU
LTU
RA
L ST
AT
IST
ICS
1
4
Agricu
ltural P
rod
uctio
n Lo
ans
Ind
icators o
f agricultu
ral credit p
rovid
e info
rmatio
n o
n cred
it need
s of th
e
farme
rs and
fisherm
en in
finan
cing th
eir pro
du
ction
activities an
d th
e
extent o
f loan
s pro
vided
by th
e differen
t finan
cial institu
tion
s. The
se are
imp
ortan
t statistical
info
rmatio
n
for
plan
ners
and
p
olicy
makers
to
sup
po
rt th
e im
plem
entatio
n
of
credit
pro
grams
and
p
olicie
s geared
tow
ards ach
ievin
g the d
evelo
pm
ent o
f the agricu
ltural secto
r.
The agricu
ltural lo
ans gran
ted
to farm
ers in 2
01
2 am
ou
nted
to P
70
5.1
1
billio
n. A
bo
ut 3
5.1
percen
t of th
e agricultu
ral loan
s or P
24
7.3
0 b
illion
at
curren
t price
s we
re inten
de
d fo
r pro
du
ction
pu
rpo
ses. Th
is amo
un
t of
pro
du
ction
loan
s was h
igher b
y 8.4
percen
t from
the 2
01
1 reco
rd. A
t
con
stant 2
00
0 p
rices, pro
du
ction
loan
s surged
by 1
0.1
percen
t to P
13
8.2
1
billio
n in
20
12
(Table1
).
Am
on
g the so
urce
s of lo
ans, p
rivate
ban
ks con
tinu
ed to
release the b
iggest
amo
un
t of p
rod
uctio
n lo
ans. H
ow
ever,
the sh
ares o
f loan
s pro
vide
d b
y the
private b
anks w
ere declin
ing o
ver the
five-year p
eriod
(2
00
8
to
20
12
). In
20
12
, their sh
are in to
tal pro
du
ction
loan
s declin
ed to
85
.6 p
ercent. O
n th
e
oth
er h
and
, th
e sp
ecialized
go
vernm
ent
ban
ks
increased
th
eir sh
are to
1
4.4
percen
t
in
20
12
.
Am
on
g the p
rivate ban
ks, the P
rivate Co
mm
ercial
Ban
ks (PK
Bs) an
d R
ural B
anks (R
Bs) re
main
ed as
the b
iggest p
rovid
ers of cred
it with
their sh
ares of 2
7.3
pe
rcent an
d 2
3.8
percen
t in 2
01
2, re
spectively. Th
e least so
urce
of cred
it was th
e Stock
Savings an
d Lo
an A
ssociatio
ns (SSLA
s) wh
ich acco
un
ted fo
r 7.7
percen
t of
the to
tal agricultu
ral pro
du
ction
loan
s (Table2
).
The vo
lum
es o
f lend
ings p
rovid
ed b
y the go
vernm
ent an
d th
e private
ban
ks were in
creasing in
20
12
. Go
vernm
ent b
anks w
ere m
ore active in
their cred
it exten
sion
as the am
ou
nt o
f loan
s in 2
01
2 exp
and
ed b
y 19
.88
percen
t. Specifically, th
e Land
Ban
k bein
g the b
iggest finan
cing arm
of
Table 1.Share of agricultural production loans in agriculture and total loans, Philippines, 2008-2012
2000 CURRENT
PRICES PRICES
2008 482.47 33.7
2009 628.51 33.8
2010 647.45 31.74
2011 655.72 34.8
2012 705.11 35.1
SHARE IN
TOTAL
LOANS (%)
AGRICULTURAL
LOANS
GRANTED (AMOUNT IN
BILLION P)
YEAR
SHARE IN
TOTAL
AGRICULTURAL
LOANS (%)
TOTAL
LOANS
GRANTED (AMOUNT IN
BILLION P)
AGRICULTURAL PRODUCTION LOANS
GRANTED
AMOUNT (BILLION P) GROWTH RATE (%)
CURRENT
PRICES
2000
PRICES
162.83 106.46 5.9 -8.0
212.7 134.47 30.6 26.3
205.5 122.83 -3.4 -8.7
228.12 125.57 11.0 2.2
247.3 138.21 8.4 10.1
162.83 106.46 5.9 -8.0
212.7 134.47 30.6 26.3
205.5 122.83 -3.4 -8.7
228.12 125.57 11.0 2.2
247.3 138.21 8.4 10.1
0.9
1.0
0.7
0.7
0.7
18845.83
22030.95
30303.46
33610.79
35857.12
162.83
212.70
205.50
228.12
247.30

AG
RIC
ULT
UR
AL C
RE
DIT
BU
RE
AU
OF A
GR
ICU
LTU
RA
L ST
AT
IST
ICS
5
Table 2.Percentage distribution of agricultural production loans granted by institution, Philippines, 2008-2012
2008 100.0 11.0 89.0 28.2 9.9 10.0 8.9 32.0 162,829.1
2009 100.0 12.5 87.5 31.1 18.2 6.7 9.8 21.7 212,699.9
2010 100.0 12.8 87.2 28.4 18.1 10.4 8.6 21.7 205,503.8
2011 100.0 13.0 87.0 28.5 17.8 9.5 8.1 23.1 228,115.7
2012 100.0 14.4 85.6 27.3 17.8 9.0 7.7 23.8 247,298.8
Private Institutions: Specialized Government Banks include:
PKBs - Private Commercial Banks PNB - Philippine National Bank
SMBs - Savings and Mortgage Banks DBP - Development Bank of the Philippines
PDBs - Private Development Banks LBP - Land Bank of the Philippines
RBs - Rural Banks
SSLAs - Stock Savings and Loan Associations
TOTAL
AGRICULTURAL
PROD'N LOAN (Million P)
YEAR TOTAL
TOTAL
SPECIALIZED
GOVERNMENT
BANKS
TOTAL
PRIVATE
BANKS
PRIVATE BANKS
PKBs SMBs PDBs SSLAs RBs

AGRICULTURAL CREDIT
BUREAU OF AGRICULTURAL STATISTICS
6
AGRICULTURAL CREDIT
Table 3.Growth rates of agricultural production loans (at current prices) granted by institution, Philippines, 2008-20112(in percent)
FINANCIAL
INSTITUTION2008 2009 2010 2011 2012
Government Banks 80.08 47.71 -0.95 13.10 19.88 DBP 37.43 337.93 -73.05 -38.89 9.99 LBP 83.14 32.10 11.91 15.33 20.11
Private Banks 0.70 28.51 -3.73 10.70 6.69 PKBs 36.29 44.41 -11.87 11.25 3.94 PDBs 273.57 -13.24 50.61 2.21 2.21 SMBs -69.03 138.76 -3.43 8.62 8.62 SSLAs 158.31 43.86 -15.37 4.07 4.07 RBs 8.37 -10.97 -3.71 18.37 11.34
ALL BANKS 5.85 30.63 -3.38 11.00 8.41
AGRICULTURAL CREDIT
BUREAU OF AGRICULTURAL STATISTICS
7
Table 4.Percentage share of production loans by commodity in total production loans, Philippines, 2008-2012
ITEM 2008 2009 2010 2011p 2012p
FOOD COMMODITIES 43.71 44.33 37.39 38.33 38.69
Cereals 17.70 16.43 17.02 17.92 18.40 Palay 16.64 15.49 15.95 16.02 16.33 Corn 1.03 0.92 1.04 1.88 2.04 Sorghum 0.01 0.01 0.00 0.02 0.02 Soybean and Other Feedgrains 0.02 0.01 0.03 0.00 0.00
Fruits, Vegetables & Rootcrops 7.95 11.39 3.79 3.83 3.88Livestock and Poultry 14.62 13.42 14.08 14.29 14.18Fisheries 3.44 3.09 2.51 2.29 2.23
EXPORT AND COMMERCIAL 8.86 8.49 8.47 7.32 8.29COMMODITIESAbaca and Other Fibers 0.11 0.04 0.04 0.06 0.06Coconut 3.64 4.26 3.05 2.80 2.67Coffee and Cacao 0.75 0.37 0.38 0.21 0.19Cotton -Rubber 0.05 0.09 0.02 0.04 0.03Sugarcane 4.01 3.40 4.31 3.50 4.62Tobacco 0.28 0.33 0.67 0.72 0.72
FORESTRY 0.10 0.09 0.15 0.14 0.13
OTHERS 18.49 12.49 16.90 18.87 18.38
Sub-Total 71.16 65.40 62.91 64.65 65.49
OTHER SOURCES OF LOANS PDB Loans a/ 10.02 6.65 10.37 9.55 9.00 SMB Loans a/ 9.93 18.16 18.15 17.76 17.79 SSLA Loans a/ 8.89 9.79 8.57 8.04 7.72
TOTAL AGRI PRODN LOAN 100.00 100.00 100.00 100.00 100.00
a/ breakdown of commodity not available

AGRICULTURAL CREDIT
BUREAU OF AGRICULTURAL STATISTICS
TABLE OF CONTENTS
iii 8
Table 5.
Agricultural production loans to output (GVA) ratio, Philippines, 2008-2012(in percent)
COMMODITY 2008 2009 2010 2011 2012
% of Agricultural Production Loans to GVA in Agriculture 15.92 20.26 18.54 18.47 19.77
Agricultural Crops Palay 12.79 14.99 14.81 15.00 14.45 Corn 2.72 3.02 3.53 5.59 6.15 Coconut 7.83 14.86 8.14 5.68 7.95 Sugarcane 27.63 37.33 32.42 20.85 39.32 Rubber 0.58 1.61 0.16 0.29 0.42
Livestock and Poultry 10.92 12.21 11.47 12.61 13.20
Fisheries 3.15 3.67 2.86 2.85 2.85
Forestry 4.36 5.25 12.93 8.15 10.25
FOREWORD i
LIST OF TABLES i i i
AGRICULTURAL CREDIT
Table 1. Share of agricultural production loans in agriculture and total loans, Philippines, 2008-2012 4
Table 2. Percentage distribution of agricultural production loans granted by institution, Philippines, 2008-2012 5
Table 3. Growth rates of agricultural production loans (at current prices) granted by institution, Philippines, 2008-2012 6
Table 4. Percentage share of production loans by commodity in total production loans, Philippines, 2008-2012 7
Table 5. Agricultural production loans to output (GVA) ratio,Philippines, 2008-2012 8

AGRICULTURAL CREDIT
BUREAU OF AGRICULTURAL STATISTICS 9 23
Modules of the Agricultural Indicators System
1. Agricultural Credit
2. Agricultural Structures and Resources
3. Output and Productivity
4. Food Self-sufficiency and Security
5. Agricultural Exports and Imports
6. Population and Labor Force
7. Food Consumption and Nutrition
8. Gender-based Indicators of Labor and Employment in Agriculture 9. Redistribution of Land
10. Economic Growth
11. Inputs
12. Prices and Marketing of Agricultural Commodities

AGRICULTURAL CREDIT
BUREAU OF AGRICULTURAL STATISTICS
TERMS OF USE Agricultural Indicators System (AIS) Report is a publication of the Bureau of Agricultural Statistics (BAS), Department of Agriculture. The BAS reserves exclusive right to reproduce this publication in whatever form. Should any portion of this publication be included in a report/article, the title of the publication and the BAS should be cited as the source of data. The BAS will not be responsible for any information derived from the processing of data contained in this publication.
ISSN-2012-0435
Please direct technical inquiries to the Office of the Director BUREAU OF AGRICULTURAL STATISTICS Ben-Lor Building, 1184 Quezon Avenue, Quezon City, Philippines 1100 Email : [email protected] Website : www.bas.gov.ph
Design and Layout Information and Dissemination Services Section (IDSS)

AGRICULTURAL CREDIT
BUREAU OF AGRICULTURAL STATISTICS
Department of Agriculture
BUREAU OF AGRICULTURAL STATISTICS 1184 Ben-Lor Bldg., Quezon Avenue, Quezon City
Tel. No.: +63(2) 372-3820 Fax. No.: +63(2) 372-3820
URL: http://bas.gov.ph
REPORT No. 2013-01
ISSN-2012-0435