report - investor relations - investor relations/media/minisites/investors/...2 summary of...
TRANSCRIPT

Infrax cvba, network company for natural gas, electricity, cable TV and sewerage Koning Albert II-laan 37, B-1030 Brussels | www.infrax.be Infrax is the operating company for the network companies Infrax Limburg, Infrax West, Inter-aqua, Inter-energa, Inter-media, Iveg, PBE and Riobra.
report
Document number
Issue date 05/06/2015
INFRAX GROUP Aggregated Financial Statements for the year ended on 31 December 2014

2│36 Aggregated Annual Accounts | 05-06-2015
Content
1 Information on the company 4
1.1 New CEO of Infrax CVBA 4
1.2 New General Manager of Infrax West 4
2 Summary of significant accounting policies and valuation rules 4
2.1 Principles of aggregation 5
2.2 General valuation rules 5
Formation expenses 5
Intangible fixed assets 6
Property, plant and equipment 6
Financial fixed assets 9
Stocks - work in progress 9
Accounts receivable and accounts payable 10
Investment grants 10
Financial instruments 10
Rating A with stable outlook 11
3 Aggregated income statement 12
4 Aggregated balance sheet 13
5 Aggregated statement of changes in equity 14
6 Aggregated cash flow statement 15
7 Notes to the aggregated financial statements 16
7.1 Operating Income 16
Turnover 16
Regulatory transfers 17
Other operating income 17
7.2 Operating charges 18
Trade goods and raw materials 18
Services and other goods 18
Remuneration, social security and pensions 19
Amortization and depreciation of non-current assets 19
Impairment stocks, work in progress and trade receivables 19
Provisions for liabilities and charges 20
Other operating charges 20
7.3 Financial income 21
Income from financial fixed assets 21
Income from current assets 21
Other financial income 22
7.4 Financial charges 22
Debt charges 22
Other financial charges 22
7.5 Extraordinary income 23
Reversal of amortization and depreciation of non-current assets 23

3│36 Aggregated Annual Accounts | 05-06-2015
Reversal of provisions for extraordinary liabilities and charges 23
Capital gains on derecognition/sale of fixed assets 24
Other extraordinary income 24
7.6 Extraordinary charges 24
Capital losses on disposal/retirement of fixed assets 24
Other extraordinary charges 25
7.7 Taxes 25
7.8 Formation expenses 25
7.9 Intangible fixed assets 26
7.10 Property, plant and equipment 27
7.11 Financial fixed assets 27
7.12 Stocks and work in progress 28
7.13 Trade and other receivables 29
7.14 Current investments, cash and cash equivalents 30
7.15 Deferred charges and accrued income 30
7.16 Capital 31
7.17 Provisions 33
7.18 Non-current liabilities 34
EMTN - Euro Medium Term Note 35
7.19 Current liablities 35
7.20 Accruals and deferred income 36

4│36 Aggregated Annual Accounts | 05-06-2015
1 Information on the company
On 7 July 2006, three public mission entrused companies (“opdrachthoudende verenigingen”) -
Infrax Limburg, Iveg and Infrax West - established the joint operating company known as Infrax
cvba. Afterwards we also saw the accession thereto of the Provinciale Brabantse
Energiemaatschappij (PBE) with effect from 1 July 2010 and of Riobra with effect from July 1, 2011.
In the name and on behalf of its shareholders, Infrax performs the following tasks, among others:
- In general the supply of management and other services and the provision of the know-how
to its shareholders.
- The preparation and the implementation of the decisions of the governing bodies of its
shareholders.
- All operational tasks within the framework of the operation, maintenance, and the
development of the grids and installations.
- The provision of all services to the distribution grid users within the framework of the
activities of its shareholders at technical, administrative and commercial level.
- The promotion of cooperation between the shareholders.
- The creative development of new products and services.
So Infrax cvba has five partners: Infrax Limburg, Infrax West, Iveg, PBE and Riobra.
The company is, within the framework of the policies as set out by its partners, responsible for the
operation, maintenance and development of the grids in the disciplines of electricity, natural gas,
cable TV, communications and sewerage.
1.1 New CEO of Infrax CVBA
With effect from July 1, 2014, the Board of Directors of Infrax appointed Mr Frank Vanbrabant as
CEO of Infrax, succeeding Paul De Fauw, who has reached the age of retirement. Mr Frank
Vanbrabant previously held the post of Director of Operations and Customer Service.
1.2 New General Manager of Infrax West
With effect from March 1, 2015, the Board of Directors of Infrax appointed Mr Tom Ceuppens as
General Manager of Infrax West, succeeding Paul De Fauw. Mr Tom Ceuppens takes up within
Infrax the position of Director of Customer Service and Purchase & Logistics.
2 Summary of significant accounting policies and valuation rules
In the paragraphs below, a summary of the accounting policies (as applied by the different DSOs1)
and valuation rules (determined by the board of directors of the different DSOs) under Belgian
GAAP is given.
1 Distribution System Operator

5│36 Aggregated Annual Accounts | 05-06-2015
For the activities regulated by the CREG, the rules provided for in the abolished Royal Decrees of 2
September 2008 are applied. The distribution grid tariffs from 2015 onwards will be set by the
regional regulators. The CWaPE has indicated for the Walloon region to continue the previous
regime, and hence the existing accounting rules, for the years 2015 and 2016. From 2017 onwards,
the CWaPE may impose different accounting rules. The VREG for its part will apply a “revenue-
cap”regime instead of a corrected “cost-plus” regime. This presumably implies different accounting
rules from those set out in the abolished Royal Decrees of 2 September 2008.
2.1 Principles of aggregation
The aggregated financial statements include all DSOs of the Infrax group. These are unaudited
aggregated figures, which means that this is an aggregation of the audited individual financial
statements for the years ended 31 December 2014, 2013 of each DSO and adjusted for a number of
eliminations and adjustments.
The aggregated figures cannot be considered as consolidated figures of the Infrax group for the
following reasons, among others:
i. Accounting treatments and valuation rules are not identical in each of the entities of the
Infrax Group (see below).
ii. Although elimination of the material intragroup transactions are considered, not all
intragroup transactions are eliminated.
The term aggregation is thus used for (i) adding the individual audited financial statements of each
member of the Infrax Group, and (ii) eliminating the material intragroup transactions.
The information for the financial years ended 31 December 2014, 2013 has been extracted from the
audited financial statements of the members of the Infrax group for the years ended 31 December
2014, 2013. These audited statements have all been prepared in accordance with Belgian GAAP.
The audited figures of the various DSOs have already been presented to the members of the
various Boards of Directors but must still be approved by the General Meeting of the various DSOs.
Since Belgian GAAP do not require cash flow statements and since the annual audited financial
statements of the members of the Infrax group thus do not include such statements, an overview of
sources and application of funds has been prepared. The table containing this cash-flow information
for the financial years 2014, 2013 is based on the audited financial data of the different DSOs of the
said years and is, in relation to the method of calculation, based on the formulas as used by the
FIRST software (software used to file statutory accounts in Belgium).
2.2 General valuation rules
Formation expenses
Costs incurred prior to starting trading and various costs relating to fixed assets under construction
are recorded at their acquisition value and amortised over up to five years.

6│36 Aggregated Annual Accounts | 05-06-2015
Intangible fixed assets
Intangible fixed assets include the cost of software licences, research and development costs,
concessions, patents and costs of making the inventory and modelling of sewerage networks and
are valued at acquisition value.
The cost of software licences are amortized on a straight-line basis over a period of 5 (10) years, the
cost of making the inventory and modelling of sewerage networks are amortized on a straight-line
basis over a period of 10 (5) years.
The VREG will apply a depreciation rate of 20% (5 years) on research and development,
concessions, patents, licences, knowhow, trademarks and other intellectual rights, and a rate of 0%
on advance payments. The VREG has indicated that it will not allow depreciations on goodwill.
The CWaPE will apply a depreciation rate of 20% (5 years) on software in 2015 and 2016.
New depreciation rates may be set by the VREG and/or the CWaPE from 2017 onwards.
Property, plant and equipment
As provided for in the Royal Decree of 30 January 2001 implementing the Belgian Companies Code,
property, plant and equipment, including additional costs as the case may be, are recorded at their
acquisition or contribution value, except fixed assets the company produces itself, which are valued
at production costs, established in accordance with Article 37 of the Royal Decree of 30 January
2001 implementing the Companies Code.
2.2.3.1 Revaluation
It should be noted that further to the Flemish Community (Department of Domestic Affairs) circular
BA 2003/02 of 25 April 2003, the boards of directors of the different DSOs have decided to cease re-
valuing property, plant and equipment annually as of the financial year 2003. Re-valuations that
were made in the past, were retained in the annual accounts and will continue to be depreciated
using the depreciation methods which were used in the past.
2.2.3.2 Valuation of the RAB, for the distribution grids for electricity and natural gas
RAB stands for ‘regulated asset base’ (“gereguleerd actief”). It is the basis for calculating the fair
beneficiary margin (“billijke winstmarge”). According to the abolished Royal Decrees of 2 September
2008, upon which the current tariffs and deprecation rules are still based, the RAB value is
composed of the sum of the net economic reconstruction value (“netto economische
reconstructiewaarde”) of the regulated property, plant and equipment (iRAB or initial RAB value
increased with the surplus value) and the need for net working capital of the Distribution System
Operators. The economic reconstruction value of the regulated fixed assets is based on a detailed
technical inventory of all network components, valuated in accordance with current reference prices
to construct a new distribution grid and taken into account the age profile of the distribution grid.

7│36 Aggregated Annual Accounts | 05-06-2015
The RAB value is calculated each year taken into account the flows in the value of the distribution
grid and the need for working capital. The economic reconstruction value evolves with the following
flows:
- Plus
o new investments.
- Less
o contributions paid by customers;
o investments grants;
o depreciation;
o sales and disposals;
disposal of assets at their historical acquisition value added with;
2% annual depreciation of the revaluation surplus (approximately equal to
the average annual disinvestment).
By decision(s) of the CREG of 16 December 2010, the new RAB values were set at:
RAB as at 1.1.2011 Inter-Energa Infrax West Iveg PBE
Transmission 70kV 65,549,104
Electricity 564,999,685 176,544,941 92,023,968 153,756,231
Gas 399,976,878 81, 869,722 73,425,136
The calculation was established and documented by KPMG.
The VREG will allow each DSO to use its own valuation method. The valuation method must
however be adequately explained in the annual statement of account.
Any change in the valuation method must furthermore be notified to the VREG in advance.
The CWaPE makes a distinction in its draft transitory tariff methodology between the “actif régulé
primaire” (primary RAB) and the “actif régulé secondaire” (secondary RAB). Investments made
before 1 January 2014 will be inserted in the primary RAB; investments made after 1 January 2014
will be inserted in the secondary RAB. Both the primary and the secondary RAB will be calculated
pursuant to the abolished Royal Decrees of 2 September 2008, although the
different parameters will be updated.
2.2.3.3 Depreciation
Depreciation is based on the acquisition value less contributions by customers.
Revaluation surpluses on the regulated assets are depreciated at 2% p.a. in accordance with CREG
rules and the provisional VREG and CWaPE rules.
Depreciation is applied on a straight line basis using the percentages specified below.
Depreciation is calculated pro rata temporis from the date when the assets concerned are put into
service.
No depreciation is applied to fixed assets under construction (work in progress) or land.
Depreciation tariffs on transmission grids (36kV/70kV) are applied in accordance with CREG rules
as laid down in the Royal Decree on long-term tariffs of 8 June 2007:
- 2% (50 years) on electricity transmission cables and lines with a tension 36kV, 70kV;

8│36 Aggregated Annual Accounts | 05-06-2015
- 3% (33 years) on industrial buildings, posts, cabins, stations and equipment 36kV, 70kV;
- 20% (5 years) on other equipment and furniture;
- 20% (5 years) on vehicles and IT.
Depreciation rates on distribution grids are applied in accordance with the rules set out in the Royal
Decrees of 2 September 2008 for the distribution grid tariffs 2013-2014:
- 2% (50 years) on administrative buildings;
- 2% (50 years) on electricity distribution cables and lines and natural gas distribution
pipelines and sewerage installations;
- 3% (33 years) on industrial buildings, posts, cabins, stations, connections and electricity
and natural gas distribution metering equipment;
- 3% (33 years) on headends, supertrunck grids and cable TV distribution fibre optic cables;
- 5% (20 years) on distribution grids (primary and secondary grids) and cable TV-lines and
cable TV-connections;
- 10% (10 years) on remote read and budget meters, CHP installations, telecoms
transmission and fibre optic cables, CAB, remote control and dispatching equipment, lab
equipment, tools and furniture, electronic cable TV equipment and other property, plant
and equipment;
- 5% (20 years) on public lighting;
- 6.66% (15 years) for electronic and mechanical equipment of pumping stations, tank and
drain equipment (sewerage);
- 20% (5 years) on vehicles;
- 33% (3 years) on administrative equipment (IT and office equipment).
The VREG will apply the following depreciation rates in 2015 and 2016:
- 0% on land;
- 3% (33 years) on industrial buildings;
- 2% (50 years) on administrative buildings;
- 2% (50 years) on electricity distribution cables and lines and natural gas distribution
pipelines;
- 3% (33 years) on posts, cabins, stations, connections and electricity and natural gas
distribution metering equipment;
- 6,67% (15 years) on re-used cabin equipment;
- 10% (10 years) on tools and furniture, telecoms transmission and fibre optic cables, CAB,
remote control and dispatching equipment, lab equipment, remote read and budget
meters, CHP installations, and other tangible fixed;
- assets (also single operator);
- 20% (5 years) on vehicles;
- 33% (3 years) on administrative equipment (IT and office equipment);
- 20% (5 years) on project smart metering, project clearing house and project smart grids.
The CWaPE will apply the following depreciation rates in 2015 and 2016 (cf. accounting rules
applied by the CREG pursuant to rules set out in abolished Royal Decrees of 2 September 2008):
- 3% (33 years) on industrial buildings;
- 2% (50 years) on administrative buildings;

9│36 Aggregated Annual Accounts | 05-06-2015
- 2% (50 years) on electricity distribution lines and natural gas distribution pipelines, and
connection lines and cables;
- 3% (33 years) on posts, cabins, transformation stations and metering equipment;
- 10% (10 years) on telecoms transmission and fibre optic cables;
- 20% (5 years) on vehicles;
- 10% (10 years) on remote read and budget meters, CHP installations, CAB, remote control
and dispatching equipment, lab equipment, tools and furniture, electronic cable TV
equipment and other property, plant and equipment;
- 33% (3 years) on administrative equipment (IT and office equipment);
New depreciation rates may be set by the VREG and/or the CWaPE from 2017 onwards.
2.2.3.4 Cost price components
The capitalised costs of contractors, labour and materials are increased by an allowance for indirect
costs at a flat rate of 16.5 % for all disciplines except for sewerage, for which the flat rate is equal to
5% (except for Riobra).
These indirect costs comprise that part of general administrative and operational costs that cannot
be directly attributed to investment expenses.
Financial fixed assets
The financial fixed assets are recorded at acquisition value, and impaired if their value is reduced
permanently.
Stocks - work in progress
The stocks in the warehouses are recorded on the balance sheet at their rolling average prices.
Work in progress is shown at cost price. Advance payments are recorded in the balance sheet
under the section 46.
Rules to provide for obsolete stock are based on the rotation speed of the stock.
The calculation is made as follows:
Stock items not moved during the last 12 months:
a provision of 33% of the value as recorded in the inventory of stocks.
Stock items not moved during the last 24 months:
a provision of 66% of the value as recorded in the inventory of stocks.
Stock items not moved during the last 36 months:
a provision of 100% of the value as recorded in the inventory of stocks.

10│36 Aggregated Annual Accounts | 05-06-2015
Accounts receivable and accounts payable
The accounts receivable and payable are booked at their original value. On 31 December 2014
there were no receivables or payables in foreign currencies.
Outstanding receivables are derecognized after the end of the collection procedures.
Potential doubtful debtors are defined as:
- Customers or debtors who have been made insolvent or sought protection from their
creditors.
- Debtors for whom delivery was suspended for non-payment.
- Claims on customers who have moved and are unreachable.
Rules to provide for doubtful debtors are based on the balance sheet as at 31 December of the
financial year.
These receivables are in Infrax’s annual accounts (as it invoices for and on behalf of the Distribution
System Operators), distinguishing between reduced rate customers (social customer) on the one
hand and non-reduced rate customers (other customers) on the other, and calculating for each of
these customer groups as follows:
Reduced rate customers (Infrax acts as social provider)
- For reduced rate customers with payment agreement, a provision is made of 50% of the
total outstanding balance excluding VAT.
- For customers with collective debt settlement, a provision is made of 100% of the total
outstanding balance excluding VA.
- For all other receivables, a provision of 100% is made for those balances excluding VAT
which are outstanding for more than half a year (180 days).
Non-reduced rate customers - other customers
The percentages used in calculating the provision on the other receivables are as follows::
- outstanding balances excluding VAT due < 60 days: 0%;
- outstanding balances excluding VAT due > 60 days and < 180 days: 20%;
- outstanding balances excluding VAT due > 180 days and < 365 days: 40%;
- outstanding balances excluding VAT due > 365 days and < 730 days: 60%;
- outstanding balances excluding VAT due > 730 days: 80%.
Investment grants
Because of the uncertain nature of both receipt, date of receipt and the size of the investment grant,
these are booked at time of receipt.
Investment grants for investment in sewage systems received from various Authorities:
27,056,723.69 euros in financial year 2014.
Financial instruments
For the full coverage of interest on some of its long term loans, the DSOs engaged an IRS (interest
rate swap) to swap the floating interest rate EURIBOR to a fixed IRS-rate for the whole maturity of

11│36 Aggregated Annual Accounts | 05-06-2015
such long term loans. At 31 December 2014, an IRS was outstanding for the following long term
loans:
- bank loan Infrax (2011-2031): 70 million EUR - (8.951.835,66) euro MTM value at 31
December 2014;
- bank loan Infrax (2012-2015): 40 million EUR – (128.937,84) euro MTM value at 31
December 2014;
- bank loan Infrax West (2012-2022): 30 million EUR – (840.088,83) euro MTM value at 31
December 2014;
- bank loan Iveg (2012-2022): 10 million EUR – (280.030.55) euro MTM value at 31
December 2014;
- bank loan PBE (2012-2022): 10 million EUR – (280.030.55) euro MTM value at 31 December
2014;
- bank loan Inter-energa (2012-2022): 40 million EUR - (1.225.468,96) euro MTM value at 31
December 2014;
- bank loan Inter-aqua (2012-2022): 20 million. EUR – (612.734,48) euro MTM value at 31
December 2014;
As these financial instruments are only used for interest rate hedging, the marked-to-market value
(the “MTM Value”) has not been recorded in the annual accounts in accordance with Belgian GAAP,
but mentioned in the comments on the annual accounts.
The MTM Value is subject to strong fluctuations in the interest markets, as the actual interest rates
are historically low. The negative value of the IRS-contracts is largely compensated by the extremely
low Euribor rates on which the loan-contracts are based.
For further information on the MTM Value of these instruments, please see the comments in the
individual annual accounts of the different DSOs in this respect.
Rating A with stable outlook
On October 16, 2014 the rating agency Fitch granted Infrax an A-flat-rating with stable outlook.
Thanks to the strong link with the public shareholders and the Flemish government there was an
uplift of 1 'notch': of A- to A. This qualitative rating on the one hand reflects the solid financial basis
and, on the other hand, the confidence of stakeholders in the strategy of the group.
A rating is an informed judgement on the creditworthiness of an issuer of bonds and is an important
criterion that institutional investors use.
The main reason why Infrax asked for a rating is that upon the first issuance of bonds in 2013 it
appeared that a rating has a significant impact on the interest rate.
A rating also gives more financing flexibility and strengthens the image of Infrax as a reliable
financial partner. In addition, the VREG bases itself on companies with an A-rating to determine the
'allowed' financing costs.

12│36 Aggregated Annual Accounts | 05-06-2015
3 Aggregated income statement
(In thousands of EUR) Note 31/12/14 31/12/13
OPERATING INCOME 831,164 758,058
Turnover 7.1.1 707,602 688,097
Change in the stock of work in progress 7.1.3 865 2,761
Fixed assets produced 7.1.3 1,384 -
Other operating income 7.1.3 121,313 67,199
OPERATING CHARGES 695,081 634,517
Trade goods and raw materials 7.2.1 52,566 59,226
Services and other goods 7.2.2 382,992 323,569
Remuneration, social security and pensions 7.2.3 146,146 144,308
Amortization and depreciation of non-current assets 7.2.4 110,082 107,037
Impairment stocks, work in progress and trade receivables 7.2.5 5,443 6,010
Provisions for liabilities and charges 7.2.6 - 5,360 - 5,949
Other operating charges 7.2.7 3,213 315
OPERATING PROFIT 136,083 123,542
FINANCIAL INCOME 24,128 23,358
Income from financial fixed assets 7.3.1 7,015 6,334
Income from current assets 7.3.2 324 345
Other financial income 7.3.3 16,790 16,679
FINANCIAL CHARGES 56,022 26,109
Debt charges 7.4.1 32,732 25,541
Other financial charges 7.4.2 23,290 569
EXTRAORDINARY INCOME 111,423 12,769
Reversal of amortization and depreciation of non-current assets 7.5.1 1,475 - 528
Reversal of provisions for extraordinary liabilities and charges 7.5.2 98,288 -
Capital gains on derecognition/sale of fixed assets 7.5.3 349 2,322
Other extraordinary income 7.5.4 11,310 10,975
EXTRAORDINARY CHARGES 31,720 26,131
Capital losses on disposal/retirement of fixed assets 7.6.1 4,947 3,546
Other extraordinary charges 7.6.2 26,773 22,585
PROFIT (LOSS) BEFORE TAX 183,892 107,429
TAXES 4 0
Income tax expenses 7.7 4 0
PROFIT (LOSS) FOR THE REPORTING PERIOD 183,888 107,428

13│36 Aggregated Annual Accounts | 05-06-2015
4 Aggregated balance sheet
(In thousands of EUR) Note 31/12/14 31/12/13
NON-CURRENT ASSETS 3,180,499 3,142,613
Formation expenses 7.8 595 1,072
Intangible fixed assets 7.9 25,965 29,889
Property, plant and equipment 7.10 3,072,371 3,030,273
Financial fixed assets 7.11 81,568 81,379
Affiliated enterprises 11,547 11,547
Other enterprises linked by participating interests 12,942 12,942
Other financial assets 57,079 56,890
CURRENT ASSETS 939,188 775,307
Long term receivables 7.13 165,666 149,131
Stocks and work in progress 7.12 36,561 40,269
Amounts receivable within 1 year 7.13 141,542 141,472
Current investments 7.14 141 134
Cash and cash equivalents 7.14 29,064 21,678
Deferred charges and accrued income 7.15 566,214 422,623
TOTAL ASSETS 4. 119,688 3,917,921
(In thousands of EUR) Note 31/12/14 31/12/13
SHAREHOLDERS’ EQUITY 7.16 2,632,290 2,616,286
Capital 1,054,202 1,054,068
Share premium account 112,948 112,948
Revaluation surpluses 548,080 559,739
Reserves 761,269 756,860
Investment grants 155,790 132,671
Provisions for liabilities and charges 7.17 25,245 128,893
LIABILITIES 1,462,153 1,172,741
Non-current liabilities 7.18 992,512 813,627
Financial debts 986,644 803,667
Other debts 5,867 9,960
Current liabilities 7.19 469,641 237,787
Current portion of long term payables 66,872 45,047
Financial debts 7.19 17,500 50,750
Trade payables 59,834 68,030
Advance payments on work in progress 9,510 6,026
Taxes, remuneration and social security 18,591 18,805
Other amounts payable 174,885 49,129
Accruals and deferred income 7.20 122,449 121,327
TOTAL LIABILITIES 4,119,688 3,917,921

14│36 Aggregated Annual Accounts | 05-06-2015
5 Aggregated statement of changes in equity
(In thousands of EUR) Share
Capital
Share
premium
account
Revaluation
surpluses Reserves
Accumulated
profits* Investment grants Total
Total on January 1, 2013 1,046,749 112,948 576,460 715,554 - 106,736 2,558,448
Total income for the reporting
period
7,319 -16,721
107,428 25,935
123,961
Addition/decrease reserves
13,332
13,332
Dividends paid
-
79,454
-
79,454
Total on December 31, 2013 1,054,068 112,948 559,739 728,886 27,974 132,671 2,616,286
Total income for the reporting
period
135 -11,659
183,888 23,119
195,483
Addition/decrease in reserves
21,537
21,537
Dividends payable
-
201,016
-
201,016
Total on December 31, 2014 1,054,203 112,948 548,080 750,423 10,846 155,790 2,632,290
* the sum of the accumulated profits and the reserves corresponds to the total reserves on the
balance-sheet.

15│36 Aggregated Annual Accounts | 05-06-2015
6 Aggregated cash flow statement

16│36 Aggregated Annual Accounts | 05-06-2015
7 Notes to the aggregated financial statements
7.1 Operating Income
Turnover
The group achieved most of its revenue from the remunerations of the distribution and transport of
electricity and gas through its distribution grids.
These revenues must be evaluated together with the regulatory transfers (see further).
The other sales in electricity and gas on the one hand include the supply of energy to persons who,
because of payment difficulties, cannot find a supplier of energy on the market and, on the other
hand, the adjustments in the turnover as a result of the regulatory assets and liabilities.
The income from the sewerage business includes the remuneration received from the drinking water
companies for our sewage-services.
The income from the cable television distribution business consists mainly of the Telenet fees
received via Interkabel Vlaanderen. This concerns the payments for the conversion of the cable
network into an interactive telecommunications network on the basis of the previous agreements of
1996 - namely, an annuity payment and 'clientele fee'. The income from the cable television
(In thousands of EUR) 2014 2013
Electricity
Distribution 303,446 319,996
Injection 1,878 1,767
Transportation costs, Elia 143,807 95,761
Others 79,761 95,066
Total electricity 528,892 512,590
70KV/ 36KV
Revenues 14,963 15,123
Total 70KV/36KV 14,963 15,123
Gas
Distribution 75,142 89,724
Others 17,596 -3,034
Total gas 92,738 86,690
Sewerage
Sewage charges 58,510 59,705
CTV
Fees 10,096 10,922
Others
Other sales 2,402 3,066
TOTAL 707,602 688,097

17│36 Aggregated Annual Accounts | 05-06-2015
distribution business also includes the proceeds with respect to Infra-X-net and Infra-GIS. The other
sales concern various charges to third parties.
Regulatory transfers
(In thousands of EUR) 2014 2013
Addition of transfers 82,431 76,642
Recovery of transfers -2,500 -2,500
TOTAL 79,931 74,142
The regulatory framework according to the (now abolished) Royal Decree of 2008 on multi-year tariff
methodology applies until the end of 2014. This Royal Decree provided for a distinction between
'manageable' and 'non-manageable' costs. Non-manageable costs are broadly defined here, and
also include for example the depreciation and financing costs. The difference between the estimated
and the actual incurred non-manageable costs is considered as a liability or receivable towards the
customer and is therefore settled via the tariffs for a following regulatory period. The difference
between the estimated and actual volumes of transported energy is also settled via the tariffs for a
following regulatory period. These differences result in an increase or a decrease in the future
tariffs. This receivable/liability is booked as an accrued income ('regulatory assets' ) /deferred
income ( 'regulatory liabilities') in the balance sheet and increases/decreases the turnover for the
year.
The revenues in the table above relate to additional turnover booked in respect of eliminating the
difference between the estimated and the actual incurred non-manageable costs on the one hand
and, on the other hand, the estimated and actual sales volumes.
Other operating income
(In thousands of EUR) 2014 2013
Change in the stock of work in progress 865 2,761
Fixed assets produced 1,384 -
Other operating income 121,313 67,199
TOTAL 123,562 69,961
The other operating income mainly concerns the Telenet opex retribution received (20,678 K euro),
the sale of 'Green Power Certificates (“GPC”)' and Combined Heat and Power production (“CHP”)
certificates (52,862 K euro), the revenue received in the framework of the annual solidarisation of
GPC and CHP certificates (24,630 K euro) and the recuperations with respect to premiums paid out
for rational use of energy (15,400 K euro).

18│36 Aggregated Annual Accounts | 05-06-2015
7.2 Operating charges
Trade goods and raw materials
(In thousands of EUR) 2014 2013
Purchase of energy 37,536 42,417
Purchase of grid losses 15,030 16,809
TOTAL 52,566 59,226
The purchase of energy concern the purchases of electricity and gas for the reduced rate customers
and the yearly 100 kWh free of charge.
The purchase of grid losses are paid by Infrax towards the energy suppliers for electricity.
Services and other goods
(In thousands of EUR) 2014 2013
Contractors' costs for construction and maintenance of grids 140,769 156,409
Fees including use of installations 3,224 2,088
Advertisements, information, documentation, etc. 2,058 1,938
Public service obligation 216,777 206,425
Contracts and management costs 5,168 3,255
Consultancy and other services 8,673 7,956
Staff of third parties 10,305 8,448
Transportation fee for Elia 128,627 92,146
Others 84,214 92,800
Transfer to fixed assets -216,824 -247,896
TOTAL 382,992 323,569
Services and other goods increased by 59,423 K euro compared with 2013.
This increase is mainly the result of the increase in the transportation costs paid towards Elia and
the costs relating to public service obligations.
The latter includes the costs for rational use of energy and costs related to GPC and CHP
certificates.

19│36 Aggregated Annual Accounts | 05-06-2015
Remuneration, social security and pensions
(In thousands of EUR) 2014 2013
Salaries
102,387
103,082
Employers' contributions to social insurance 34,623 33,272
Charges for pension schemes and supplementary insurance 82 531
Other personnel costs 9,054 7,423
TOTAL 146,146 144,308
The personnel costs amounted to 146,146 K euro in 2014, an increase of 1.3% compared to 2013.
The average number of members of staff came to 1,506.25 FTE's in 2014.
Amortization and depreciation of non-current assets
(In thousands of EUR) 2014 2013
Amortization and depreciation of non-current assets 110,082 107,037
TOTAL 110,082 107,037
The amortization of intangible fixed assets increased by 667 K euro mainly as a result of the
investments in the smart meters project.
The depreciation on property, plant and equipment increased by 2,377 K euro.
Impairment stocks, work in progress and trade receivables
(In thousands of EUR) 2014 2013
Impairment stocks 181 1,566
Impairment trade receivables < 1year 5,261 4,444
TOTAL 5,443 6,010
In 2013 Infrax for the first time booked a provision for obsolete stock, which amounted to 1,566 K
euro. This means that the impact on the profit and loss accounts in 2013 is equal to the amount of
the provision booked. In 2014, the provision for obsolete stock was 1,747 but the 2013 provision
was also reversed, which means that the net impact in the profit and loss accounts amounts to only
181 K euro.
Impairment trade receivable relate to definitively irrecoverable receivables. The amount of 4,933 K
euro is withdrawn from the provision for doubtful debtors - see further.

20│36 Aggregated Annual Accounts | 05-06-2015
Provisions for liabilities and charges
(In thousands of EUR) 2014 2013
Provision for length of service premium -28 54
Provision for major repairs -870 -1,104
Provision for pending disputes - -32
Provision for doubtful debtors -2,653 -4,867
Others -1,809 -
TOTAL -5,360 -5,949
The provision for length of service premium concerns, on the one hand, the creation of the provision
(annual fixed amount) and, on the other hand, reversal of the provision for the length of service
premium actually paid out in 2014. 2014 shows a credit balance, since this year more bonuses were
paid out than provided for each year. The actual premiums paid out are also part of the total
remuneration cost. The structure of the provision with an annual fixed amount and the reversal of
the provision with the amount of the premiums actually paid out, is to spread out in time the total
costs of the length of service bonuses, on the basis of the existing workforce.
The reversal of the provision for major repairs concerned on the one hand the use of 420 K euro for
the construction of the new offices in our buildings in Lubbeek. On the other hand, there is a reversal
of the provision for maintenance of sewerage for an amount of 450 K euro.
The provision for doubtful debtors amounting to (2.653) K euro concerns:
- the reversal for the amount of the write-off of the definitively irrecoverable receivables,
(4,933) K euro in 2014 (see above);
- additional provision for doubtful debtors 2014 for an amount of 2,280 K euro.
The other provisions (1,809 K euro) relate to:
- provision (creation and reversal) for holidays not taken up, totalling 731 K euro;
- the use of the energy fund for various energy projects (1,078 K euro).
Other operating charges
(In thousands of EUR) 2014 2013
Various taxes 393 315
Sewerage fund 2,820 -
TOTAL 3,213 315
The various taxes section mainly covers the "Redevance de voiries" , the Fairness tax, corporate tax
and property tax.
21│36 Aggregated Annual Accounts | 05-06-2015
In his circular of April 2014 minister Joke Schauvliege stated that the municipal sewage revenues
may only be used for (new) investment and maintenance expenditure on sewerage. The term
'investments' is also taken to mean the restoration of the superstructure or the construction of a new
superstructure.
The Boards of Directors of Inter-aqua, Riobra, Infrax West and Iveg are meeting that demand and
will therefore no longer pay dividends from the sewerage business.
Any profits will be reserved and kept available in sewerage funds. The creation of a sewerage fund
there will also provide a major impetus for additional investment in sewage infrastructure.
In 2014, Inter-aqua has already created a sewerage fund amounting to 2,820 K euro.
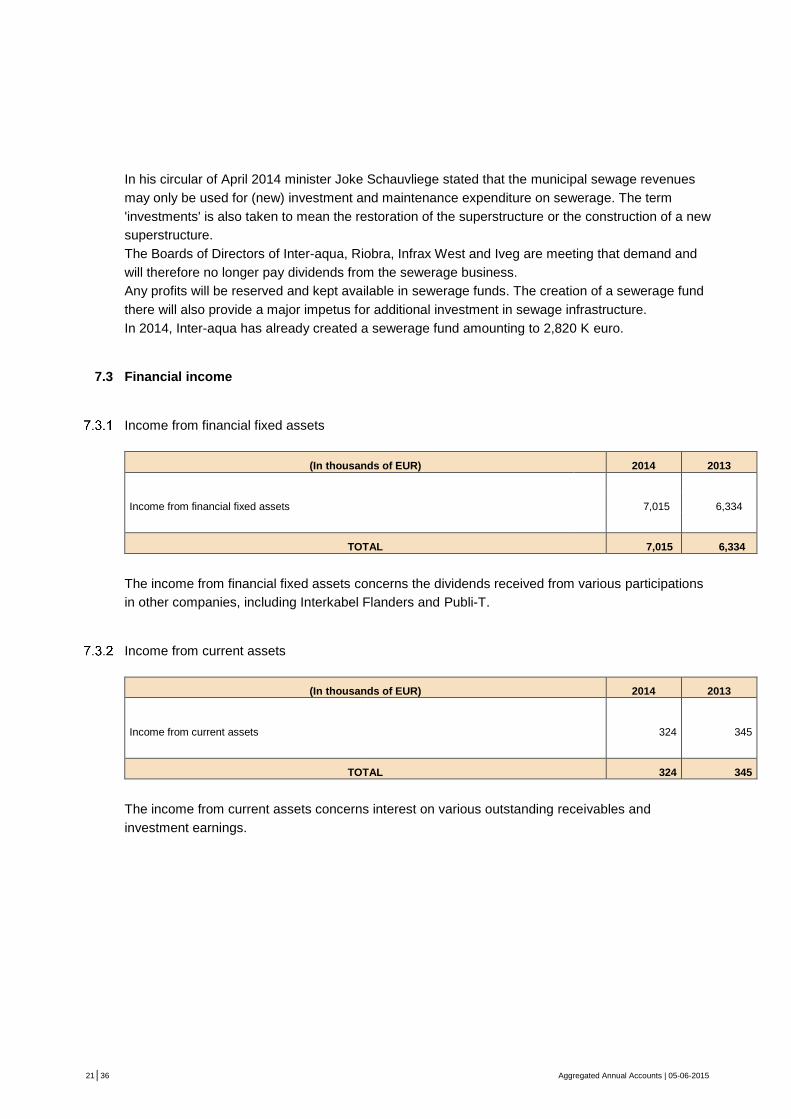
7.3 Financial income
Income from financial fixed assets
(In thousands of EUR) 2014 2013
Income from financial fixed assets 7,015 6,334
TOTAL 7,015 6,334
The income from financial fixed assets concerns the dividends received from various participations
in other companies, including Interkabel Flanders and Publi-T.
Income from current assets
(In thousands of EUR) 2014 2013
Income from current assets 324 345
TOTAL 324 345
The income from current assets concerns interest on various outstanding receivables and
investment earnings.

22│36 Aggregated Annual Accounts | 05-06-2015
Other financial income
(In thousands of EUR) 2014 2013
Investment grants 3,516 2,741
Other various financial revenues 13,274 13,938
TOTAL 16,790 16,679
The other financial income concern, on the one hand, the depreciation on the investment grants and,
on the other hand, the income from the long term lease payments paid by Telenet.
Under the 2008 agreement with Telenet, Infrax receives a fair beneficiary margin (6.25 %) on the
value of the cable network that has been leased to Telenet until 2046.
7.4 Financial charges
Debt charges
(In thousands of EUR) 2014 2013
Leasing debts 694 889
Interest charges from long and short-term loans 32,038 24,652
TOTAL 32,732 25,541
The interest charges from long and short-term loans concern mainly the financial costs related to
bank loans. On the other hand, the costs relating to the issuance of bonds (EMTN programme) are
also included for an amount of 11,438 K euro. These costs relate to both the interest charges and
the costs relating to the issuance of bonds at a discount and the other financial costs related to the
issuance of bonds in 2013 and in 2014.
Other financial charges
(In thousands of EUR) 2014 2013
Bank costs 48 22
Other various financial charges 23,242 547
TOTAL 23,290 569
The other various financial charges include mainly the costs relating to the realisation of a hedging
contract. That cost amounted to 23,201 K euro.

23│36 Aggregated Annual Accounts | 05-06-2015
7.5 Extraordinary income
Reversal of amortization and depreciation of non-current assets
(In thousands of EUR) 2014 2013
Reversal of amortization and depreciation of non-current assets 1,475 528
TOTAL 1,475 528
The reversal of amortization and depreciation relates mainly to the correction of the economic
reconstruction value of the Infrax West 36 KV transmission grid .
Reversal of provisions for extraordinary liabilities and charges
(In thousands of EUR) 2014 2013
Reversal of provisions for extraordinary liabilities and charges 98,288 -
TOTAL 98,288 -
The reversal of provisions relates primarily to:
- reversal of provisions accrued in the past regarding deficits in the non-manageable costs for
the amount of 59,081 K euro.
Until 2012, provisions were made to compensate for the regulatory assets. With regard to the
Flemish coalition agreement for 2014-2019, which states that the deficits in non-manageable costs
from the past must be eliminated in the short term and with regard to the decision of the VREG to
offset the balances from 2008 and 2009 in the tariffs for 2015 and 2016, it can reasonably be
assumed that these provisions have become irrelevant.
- The reversal of the provisions accrued in the past for the delta real opex cable television
versus opex-retribution Telenet amounting to 37,699 K euro.
The provision created in the past for the delta real opex cable television versus opex-retribution
Telenet, as contractually agreed for the period 2008-2014, will be entirely reversed in 2014. From
October 2014, the fee will be determined partly on the basis of evolutions in the operating costs of
Telenet and partly on evolutions in the salary costs on the basis of the Agoria index.

24│36 Aggregated Annual Accounts | 05-06-2015
Capital gains on derecognition/sale of fixed assets
(In thousands of EUR) 2014 2013
Realisation of capital gains on derecognition/sale of fixed assets 349 2,322
TOTAL 349 2,322
The largest part of the capital gains relates to recall of articles in stock. This revenue is neutralized
by the same amount in the operating charges (Trade goods and raw materials). In 2013 additional
capital gains were realized with respect to:
- the sale of the office building in Bruges to the value of 673 K euro;
- the sale of the office building in Kampenhout for 140 k euro;
- the sale of the Beringen building for 145 k euro.
Other extraordinary income
The extraordinary income relates to receivables concern payments which are received for which the
outstanding receivable was already written off since it was no longer considered recoverable in the
past.
The other extraordinary income relate to the financial reconciliation for an amount of 2,924 k euro,
the adjustment of the outstanding Sibelgas payable in the context of the takeover of Steenokkerzeel
and the settlement regarding the investments charged to Telenet for the period 2008-2013.
7.6 Extraordinary charges
Capital losses on disposal/retirement of fixed assets
(In thousands of EUR) 2014 2013
Capital losses on disposal/retirement of fixed assets 4,947 3,546
TOTAL 4,947 3,546
(In thousands of EUR) 2014 2013
Extraordinary income related to receivables 131 234
Other extraordinary income
11,179
10,741
TOTAL 11,310 10,975
25│36 Aggregated Annual Accounts | 05-06-2015
The booked capital loss in 2014 relates mainly to the decommissioned assets, valued at 4,811 k
euro.
The rest of the balance relates primarily to derecognizing the Brussels office building for an amount
of 126 k euro and the transfer of intangible fixed assets to the result for an amount of 321 k euro.
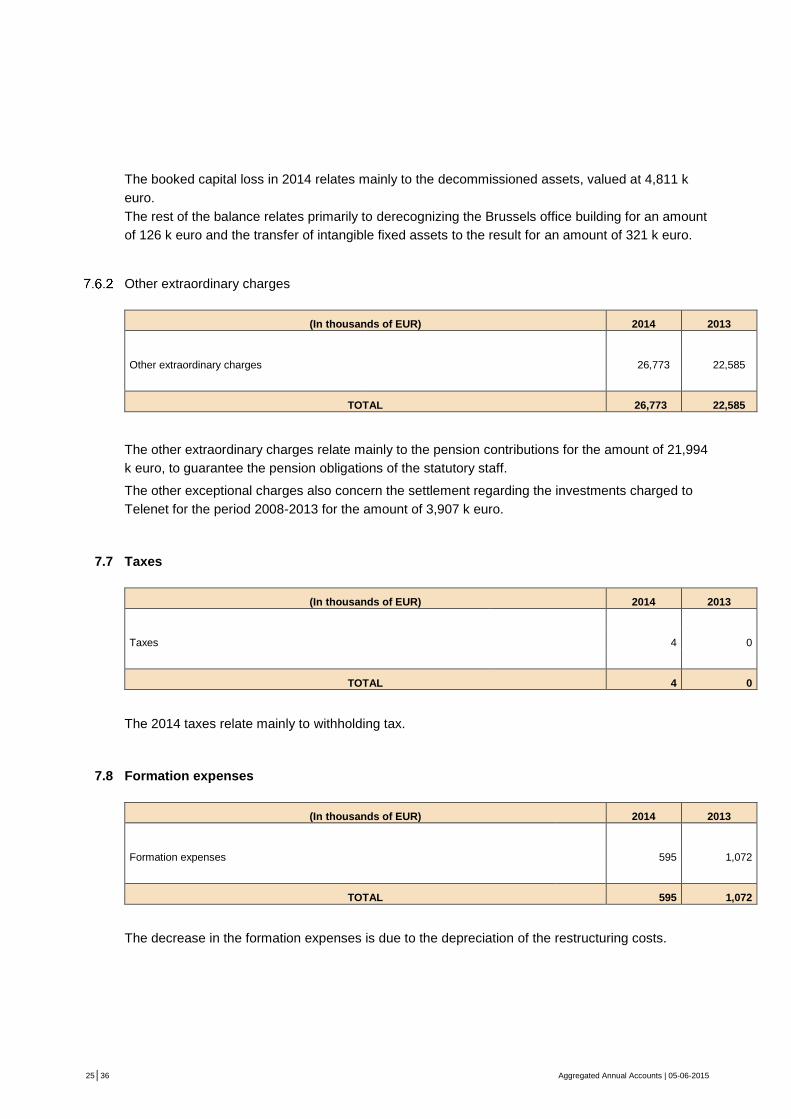
Other extraordinary charges
(In thousands of EUR) 2014 2013
Other extraordinary charges 26,773 22,585
TOTAL 26,773 22,585
The other extraordinary charges relate mainly to the pension contributions for the amount of 21,994
k euro, to guarantee the pension obligations of the statutory staff.
The other exceptional charges also concern the settlement regarding the investments charged to
Telenet for the period 2008-2013 for the amount of 3,907 k euro.
7.7 Taxes
(In thousands of EUR) 2014 2013
Taxes 4 0
TOTAL 4 0
The 2014 taxes relate mainly to withholding tax.
7.8 Formation expenses
(In thousands of EUR) 2014 2013
Formation expenses 595 1,072
TOTAL 595 1,072
The decrease in the formation expenses is due to the depreciation of the restructuring costs.

26│36 Aggregated Annual Accounts | 05-06-2015
7.9 Intangible fixed assets
2014
(In thousands of EUR)
Franchises, patents,
licenses, trade marks
Cost at January 1, 2014 76,075
Acquisitions 5,549
Other -3,204
Cost at December 31, 2014 78,420
Amortization on and impairment at January 1, 2014 46,186
Amortization 7,210
Other -941
Amortization and impairment at December 31, 2014 52,455
Net book value on 31 December 2014 25,965
The investments for projects such as smart meters and grids, Meta-PV, Linear, Resilient, I-move
and clearing house are booked as intangible fixed assets.
Intangible Fixed Assets also include the software licensing costs and costs for the inventory and
modelling of sewerage networks.

27│36 Aggregated Annual Accounts | 05-06-2015
7.10 Property, plant and equipment
2014
(In thousands of EUR)
Land and
buildings
Plant,
machinery
and
equipment
Furniture
and vehicles Other*
Cost at January 1, 2014 145,892 4,671,014 102,474 318,788
Acquisitions 3,001 227,786 3,129 100,353
Sales and disposals -329 -15,874 -474 -185,790
Cost at December 31, 2014 148,564 4,882,926 105,129 233,351
Depreciation and impairment at January 1, 2014 61,296 2,046,561 90,766 9,271
Depreciation 2,541 92,017 4,253 2,774
Sales and disposals -68 -10,679 -482 -650
Depreciation and impairment at 31 December 2014 63,769 2,127,899 94,537 11,395
Net book value on 31 December 2014 84,795 2,755,027 10,592 221,956
* Leasing and similar rights, other property, plant and equipment and assets under construction and
advance payments.
The acquisitions in the heading "Plant, machinery and equipment" mainly relate to investments in
the distribution grids for electricity, gas, sewerage and cable TV.
The net book value includes such things as the contributions paid by customers with respect to
certain assets (contributions paid by third parties) and corresponds to the actual value of the
distribution grids of Infrax.
7.11 Financial fixed assets
(In thousands of EUR) 2014 2013
Affiliated enterprises 11,547 11,547
1. Participating interests 11,547 11,547
2. Amounts receivable - -
Other enterprises linked by participating interests 12,942 12,942
1. Participating interests 12,942 12,942
2. Amounts receivable - -
Other financial assets 57,079 56,890
1. Shares 56,821 56,821
2. Amounts receivable and cash guarantees 258 69
TOTAL 81,568 81,379

28│36 Aggregated Annual Accounts | 05-06-2015
The participation in affiliated enterprises concerns the 99.98% holding of the Provinciale Brabantse
Energiemaatschappij in Intergas. Intergas is the Intermunicipal cooperative for gas distribution in
Flemish Brabant and is also a participant in Inter-energa. Since mid-2003, Intergas has been
transformed from an operating company (gas) into a participating company.
The operating activities were transferred to the grid operator Inter-energa. In addition to the financial
monitoring of its assets, Intergas acts as the reference shareholder of Inter-energa and represents
the interests of its 16 Flemish-Brabant municipalities.
The enterprises with which there are participating interests are Interkabel and Inter-regies.
Interkabel Vlaanderen consists of the mission entrusted companies, namely Infrax West, PBE, Inter-
media and Integan, which represents a third of the Flemish cable market.
In addition to the major telecom-section, Interkabel also remains active in the implementation of
projects in the field of cable TV. Thus, the headends of the cable companies are linked together with
fibre optic. This backbone ring transports the signals of a number of TV and radio stations. In
addition, Interkabel coordinates the investments of the mission entrusted companies in Telenet.
Inter-regies is the umbrella association of the public electricity, gas and cable distribution sector,
established on October 22, 1955 in Brussels, initially under the name "Interpublic". Inter-regies
represents Belgian companies active in:
- the management of the electricity distribution grids;
- the management of the gas distribution grids;
- cable TV.
The other financial assets mainly concern shares in Publi-T (56,354 k euro).
Publi-T has the purpose of managing the share of the Belgian local authorities in Elia, the national
transmission grid operator, as well as the regional administrator of some distribution grids. Publi-T,
as strategic shareholder constantly monitors the interests of the municipal sector in this market
segment.
The increase in the financial fixed assets can be explained by the rental guarantee of the new Zenith
office building in Brussels. Increasing activities meant that the available space in the head office at
Koningstraat 55 had become too small. After a comparative search it was decided to move both the
administrative and the registered office of Infrax cvba to the Zenith building, Koning Albertlaan 37,
Brussels. The new offices were in use on September 1, 2014.
7.12 Stocks and work in progress
(In thousands of EUR) 2014 2013
Raw materials and consumables 28,400 32,829
Impairment of stocks -1,747 -1,566
Projects in progress 9,908 9,006
TOTAL 36,561 40,269

29│36 Aggregated Annual Accounts | 05-06-2015
In 2014, an additional impairment loss of 181 k euro was booked.
The projects in progress relate to the current Esco projects and the projects with regard to public
lighting for the municipalities.
Energy Service Company (ESCO) offers a complete package of energy services to promote the
energy efficiency of municipal buildings.
7.13 Trade and other receivables
(In thousands of EUR) 2014 2013
Receivables outstanding more than one year 165,666 149,131
Amounts receivable within one year 141,542 141,472
TOTAL 307,208 290,603
Receivables outstanding more than one year mainly concern the receivables towards Telenet
(161,585 k euro) in the context of the long-term lease agreement concluded in 2008 under which the
full bandwidth (excluding bandwidth reserved for Infra-X-net) of the cable network was leased
exclusively to Telenet up to the year 2046. Infrax retains the "bare" ownership of the cable network;
Telenet has obtained the usufruct on the cable network. The lease fee is a recurring annual fee on
the initial value of the cable network at the start of the agreement on the one hand and, on the other
hand, a fee for the annual additional investments in the cable network. This long-term lease
agreement is an "expansion lease" - i.e., it increases annually with the amounts of the investments
made.
These investments are paid back by Telenet over a period of 15 years plus the fair beneficiary
margin of 6.25 %.
The amounts receivable within one year consist of:
(In thousands of EUR) 2014 2013
Trade receivables from distribution grid activities 50,172 55,090
Trade receivables social customers 7,517 10,188
Other trade receivables 58,108 56,880
Other receivables 25,745 19,313
TOTAL 141,542 141,471
The other trade receivables consist mainly of receivables with respect to work carried out and
services provided, and costs passed on to third parties.

30│36 Aggregated Annual Accounts | 05-06-2015
The other receivables relate mainly to the funds to be received in 2015 from Telenet in
implementation of the long-term lease agreement.
7.14 Current investments, cash and cash equivalents
(In thousands of EUR) 2014 2013
Current investments 141 134
Cash and cash equivalents 29,064 21,678
TOTAL 29,205 21,812
The total of cash and cash equivalents include bank balances, cash accounts and investments in
funds which can immediately be converted into cash. All funds are expressed in euro.
7.15 Deferred charges and accrued income
(In thousands of EUR) 2014 2013
Regulatory differences on non-manageable costs and volumes 327,078 245,620
Stock of GPC and CHP + solidarisation 234,421 164,272
Miscellaneous 4,715 12,731
TOTAL 566,214 422,623
The details of the regulatory differences at the end of 2014 are as follows:
(In thousands of EUR) 2014 2007 - 2013
Electricity 71,678 237,775
Natural gas 12,188 2,536
70 KV - 2,900
TOTAL 83,866 243,211
The unexpected increase in PV installations has led to important shortages in the non-manageable
budget for the electricity business.
Under the buying-up commitment the grid operators must buy more Green Power Certificates than
provided for when the budgets were being drawn up that were the basis of the tariffs applied in
2014, the result being an increase in the operating deficits for electricity.

31│36 Aggregated Annual Accounts | 05-06-2015
For natural gas - where we do not have to deal with rising public service obligations - there are,
however, some quite significant surpluses - see further.
The operating differences for the years 2008 and 2009 are deficits to be offset against the tariffs for
2015 and 2016.
On the amounts relating to the years 2010 to 2014 decisions must still be taken with regard to the
offset in future tariffs.
It should however be mentioned that, as a result of the abolition of the Royal Decree on multi-year
tariffs in early 2012, the legislative framework has become unclear and thus also the manner and
timing of the offset in the tariffs of the operating differences for the period 2010-2014.
Stock of Green Power Certificates + solidarisation
In 2014 there was once again a surplus of Green Power Certificates and Combined Heat and Power
Production certificates in Flanders, such that only a limited proportion of the certificates could be
sold by the grid operators.
At the end of 2014, the stock of GPC and CHP certificates represented 210,1 million euros for the
Infrax Group. The GPC were valued at 93 euros per banked certificate and at 88 euros for the non-
banked certificates . For the CHP that was respectively 27 and 20 euros.
By its decision of 10 January 2014, the Flemish government stipulated that the grid operators must
immobilise (“bank”) 1.5 million certificates for a number of years, i.e. not offer them on the market in
order to rectify supply and demand.
The banking for Infrax involves 466.238 GPC and 118.875 CHPC.
The Flemish government guarantees the banked certificates (93 euros per banked GPC and 27
euros per banked CHP certificate), or in total 46.6 million euros and has compensated the financing
costs for 2014..
For the non-banked certificates there is possibly a risk that they will not be able to be sold on the
market in the future at the price of 88 euros or 20 euros respectively, which could mean an
additional deficit in the non-manageable costs of the grid operators. The stock value of the non-
banked certificates is approximately 163.5 million euros.
7.16 Capital
The various components of the share capital, together with the changes between 01 January 2013
and 31 December 2014 are shown in the "Aggregated statement of changes in equity".
The share capital amounted to 1,054,202 k euro at the end of 2014 and increased slightly by 135 k
euro compared with 2013. The issued capital amounts to 1,054,286 k euro and the uncalled capital
amounts to -83 k euro. The table below gives an overview of the number of shares per activity in the
capital (in units) of each DNB at the end of 2014.

32│36 Aggregated Annual Accounts | 05-06-2015
Electricity Gas Sewerage CTV Public lighting
Number of shares
Inter-aqua 15,131,659
Inter-energa 3,342,239 601,416 886,318
Inter-media 758,704
Infrax Limburg 880,928 152,943 54,392
Infrax west 3,109,612 480,000 5,501,149 529,575
Iveg 15,216 7,109 10,929
Riobra 5,348,324
PBE 4,926 852
The table below gives an overview of the capital in euros per activity in the capital (in units) of each
DNB at the end of 2014.
Electricity Gas Sewerage CTV Public lighting
Capital in euros
Inter-aqua 378,291,475
Inter-energa 82,854,105 65,796,361 21,971,823
Inter-media 18,808,272
Infrax Limburg 21,835,667 3,823,575 1,347,895
Infrax west 77,740,300 12,000,000 137,528,725 13,239,375
Iveg 38,040,000 17,772,500 27,322,500
Riobra 135,838,649
PBE 63,142 11,227
In 2014, there was a capital increase in Infrax West amounting to 135 k euro by creating additional
shares in response to installing grids underground.
The share premium account remained unchanged in 2014.
The revaluation surpluses fell by 11,659 k euro.
The revaluation surpluses relate on the one hand to historic capital gains and to the RAB (regulated
Asset Base) capital gains.
The RAB value represents the value of the capital invested in the distribution grids for electricity and
gas.
The initial surplus value on the regulated assets are the subject of an annual evaluation and are
depreciated at 2% per year according to the guidelines of the CREG. Every 4 years the depreciation
on the RAB surplus will be tested against the actual value with respect to the depreciated assets and
the necessary corrections will if necessary be made to the currently used percentage of 2%.
The revaluation surplus is transferred annually to an unavailable reserve account in proportion to the
depreciation amounts on the revalued portion of the installations booked against the profit and loss
account.

33│36 Aggregated Annual Accounts | 05-06-2015
The overview of the reserves is as follows:
(In thousands of EUR) Legal reserves Reserves not
available Untaxed reserves
Available
reserves
Total on January 1, 2013 45,583 343,802 326,169
Endowment/decrease in reserves
2,786 19,550 18,970
Total on December 31, 2013 48,369 363,352 - 345,139
Endowment/decrease in reserves 3,106 18,508 327,935 -345,139
Total on December 31, 2014 51,475 381,860 327,935 0
A legal reserve was created in relation to a profit to be allocated, amounting to 5% up to a maximum
of 10% of the fixed portion of the capital as determined by the articles of association.
Since 2008 amounts have been recorded as reserves not available equal to the depreciation of the
(RAB-surplus) revaluation surplus in accordance with the settlement with the Creg.
With regard to the provisions of Article 26 of the programme law of December 19, 2014, the amount
of 327,935 k euro was allocated to the untaxed reserves as a protective measure.
In 2014, an amount of 17,204 k euro was withdrawn from the available reserves to make it possible
to pay out the promised dividends.
7.17 Provisions
(In thousands of EUR) 2014 2013
Telenet - Belgacom provision 14,090 14,090
Opex Telenet - 37,699
Creg provision (regulatory asset) - 59,081
Provision for doubtful debtors 6,169 8,823
Provision for social liabilities 4,061 4,790
Others 925 4,410
TOTAL 25,245 128,893

34│36 Aggregated Annual Accounts | 05-06-2015
The Telenet -Belgacom provision concerns a procedure set by Belgacom against Telenet and
various cable companies, including Infrax, in the context of the transfer of the full television customer
base of Infrax (and other cable operators united in Interkabel) to Telenet in 2008. Belgacom is
provisionally claiming, among other things, the annulment and damages of 1 euro.
The provision created in the past for the delta between the actual operating costs versus the opex-
retribution Telenet, as contractually agreed for the period 2008-2014, will be entirely withdrawn in
2014. From October 2014, the fee will be determined partly on the basis of evolutions in the
operating costs of Telenet and partly on evolutions in the salary costs on the basis of the Agoria
index.
Until 2012, the regulatory asset provisions were created as compensation. With regard to the
Flemish coalition agreement for 2014-2019, which says that the balances from the past must be
eliminated in the short term and with regard to the decision of the VREG to offset the balances from
2008 and 2009 in the tariffs for 2015 and 2016, it can reasonably be assumed that these provisions
have become irrelevant. The provisions created in the past to compensate for the regulatory assets
amount to 57.7 million euros for electricity and 1.3 million euros for natural gas and will be withdrawn
in the financial year 2014.
The provision for doubtful debtors fell in 2014 by 2,654 k euro. The main reason is the reduction in
old outstanding receivables. For a calculation of the provision, we refer to the accounting policies.
The provision for social liabilities concerns the holidays not taken up in 2014.
The other provisions mainly concern provisions for length of service bonuses, pensions and
maintenance.
7.18 Non-current liabilities
(In thousands of EUR) 2014 2013
Financial debts 986,644 803,667
Other debts 5,867 9,960
TOTAL 992,512 813,627
The financial debts consist of:
- leasing debts for an amount of 5,146 k euro;
- long term EMTN-bonds outstanding (see note below this detail) amounting to 498,349 k
euro
- bank loans with a balance of 483,149 k euro.

35│36 Aggregated Annual Accounts | 05-06-2015
The other debts amounting to 5,867 k euro - these relate to the takeover of the Sibelgas grids of
Kampenhout and Steenokkerzeel.
EMTN - Euro Medium Term Note
With a view to financing the investment expenditure in electricity, TV distribution, natural gas and
sewerage networks and the financing of the working capital, Infrax cvba started an EMTN
programme in 2013 for the issue of bonds for a total amount of 500,000,000 spread over 4 years.
This program is part of a diversification of financing sources, in addition to the existing conventional
financing through bank loans, short-term credit lines and issuing commercial papers.
The programme, approved by the FSMA on October 1, 2013, is fully guaranteed by the partners of
Infrax cvba.
In 2013, the first issue took place amounting to 250 million EUR with a nominal interest rate of
3.75% and a duration of 10 years.
After obtaining the rating in October 2014, Infrax released the second issue of bonds. The updated
prospectus was approved by the FSMA on October 22, 2014. The issue was very successful now as
well. 250 million EUR in bonds were issued for a duration of 15 years at a nominal interest rate of
2.625 %.
Because of the rating there was more international interest than during the first issue in 2013.
In addition to this EMTN programme Infrax also has a commercial paper programme of up to 200
million EUR - see amounts payable within 1 year.
7.19 Current liablities
(In thousands of EUR) 2014 2013
Current portion of long term payables 66,872 45,047
Financial debts 17,500 50,750
Trade payables 59,834 68,030
Advance payments on work in progress 9,510 6,026
Taxes, remuneration and social security 18,591 18,805
Other amounts payable 174,885 49,129
TOTAL 347,192 237,787
The increase in debts at a maximum of one year has mainly to do with an increase in the other
amounts payable.
The other payables relate mainly to the allocated dividends for an amount of 156,623 k euro in 2014.
During the processing of the result in 2014, dividends were already allocated which will be paid out
in the period 2015 - 2019.

36│36 Aggregated Annual Accounts | 05-06-2015
These serve to guarantee the dividend expectations of the municipal shareholders so that these
municipal shareholders can be offered certainty with respect to future cash flows (2015-2019).
The heading Financial Debt relates to the commercial papers which expire in 2015.
For a summary of the current portion of long term liabilities we refer to the explanatory notes on
‘Long term payables - Financial debts’ on top.
The balance of financial debts at a maximum of one year concerns the current portion of the debt to
financial institutions that have to be repaid within the year.
The section relating to trade payables remained virtually unchanged in 2014.
The advance payments on work in progress relate to the invoiced advances in connection with
works to be carried out by Esco.
Debts relating to taxes, remuneration and social security charges fell slightly.
7.20 Accruals and deferred income
(In thousands of EUR) 2014 2013
Operating differences (regulatory transfers) 71,126 70,450
Turnover - energy in the meters 27,862 20,255
Miscellaneous 23,461 30,622
TOTAL 122,449 121,327
Operating differences contains the surpluses, mainly gas, which will be offset in the future tariffs.
The heading turnover - energy in the meters relates to the demarcation of the turnover in the context
of the energy supplied but not yet invoiced to the customers offset with the advances received.
The Miscellaneous balance concerns primarily the amounts still to be settled with respect to the
public service obligation 100 kWh free of charge and charges still to be paid .