report - home page | unicef · they include garbage disposal, ... unicef and partners should...
TRANSCRIPT

1
Report
Assessing WASH Package
Interventions in 5 Counties
of Liberia
Stephen Ntow
October 2010

2
Acknowledgement I am extremely grateful to the UNICEF WASH team the very conducive atmosphere they created for this work to the carried out. I am also grateful to all the WASH sector stakeholders and the implementing partners for the time and attention devoted to this work. I received tremendous support from the administrative staff and the members of the operations section. Special thanks to data collection team. They have been up to the task. I am so grateful to them all. Stephen Ntow, MSc. (WASH/Social Development Consultant & BCC Specialist)
WASHealth Solutions P. O. Box AC 107, Art Centre Accra. Ghana. [email protected] / [email protected] Cel: + 233 244 802 265 Tel: + 233 302 417 204

3
Executive Summary Following nine months of implementing Water access, Sanitation and Hygiene (WASH) Package Approach in selected counties of Liberia, the program has been assessed and found to have met most of its objectives. The results and other outcomes of the evaluation which took place in Grand Cape Mount, Margibi, Grand Bassa, Grand Gedeh and Maryland have been compiled as the central theme of this report. Purpose of the evaluation The purpose of the evaluation is to assess the WASH package approach, its impact on target population and key lessons learnt in order to improve the design of subsequent projects. The evaluation is expected to look at the project efficiency, effectiveness, sustainability and appropriateness. Background of WASH situation in Liberia The 2007 Liberian DHS estimates that only 65% of Liberian households have access to an improved water sources according to the classification of improved and unimproved water sources by the WHO/UNICEF Joint Monitoring Program for Water Supply and Sanitation. The LDHS showed that 16% of households reported treating their drinking water with bleach or chlorine and 80% of household report doing nothing to treat their drinking water. (Blanton 2008). The survey also pointed out that treatment frequency is not standardized, and monitoring of residuals typically does not occur. Health indicators show very high mortality rates for children under-five years old at 110 per 1,000 live births (LDHS, 2007) - 20th lowest in the world (UNICEF, 2009). Preventable childhood diseases including diarrhea, malaria, and acute respiratory infections continue to be major killers. The Liberia Demographic and Health Survey (LDHS, 2007) reported that 29% of children between the ages of 6-11 months had diarrhea in the 2 weeks preceding the survey. Cholera is endemic in Liberia. This situation, partly accounts for UNICEF‟s resolve to adopt measure that will rapidly increase access to WASH facilities and services in an integrated fashion, and with the potential reducing diarrheal diseases (especially among children) including cholera through its WASH Package approach. A program which seeks to promote:
Household water treatment and safe water storage (HWTS) using a chlorine based product distributed under the brand name “WaterGuard”.
Improved personal hygiene with emphasis on hand washing with soap (HWWS), and
Improved access to sanitation through Community - Led Total Sanitation (CLTS). Methods A multi-stage random sampling process was adopted and following the conduct of 743 structured interviews with mothers of children five years or less, 34 Focus/Group Discussions, 87 Key Informants Interviews with community leaders and volunteers, 98 non-obtrusive semi-structured observations in both intervention and non-intervention communities, and testing of 350 water samples, relevant information was generated to meet the objectives of the evaluation. Key findings All major objectives of the projects have been achieved. The implementation and management arrangements have been effective. The collaborative networks have been supportive of the processes and community management structures have been put in place to ensure sustainable

4
access to water, sanitation and hygiene promotion. Some challenges have been identified and so have lessons been derived to guide future programs. Majority of study population 77% (570) reported hand-dug-well with pump is their source of drinking water compared to 30% at baseline. About 75% (386) in project communities treated their drinking water with WaterGuard which is over and above the program target of 30%. Another 62% (318) and 5% (9) in project and non-project populations reported using some form of chlorine products including WaterGuard as a result of education received through program activities. This is higher than 40% target set at the start of the program. Samples of drinking water tested for Free Residual Chlorine (FRC) equal to 0.2 mg/L or more in the project communities recorded an average of 63% for the 5 counties with the highest prevalence 93% in Grand Cape Mount County. All samples collected in non-project communities tested negative for FRC. About 60% (307) of the project communities stored water in the r recommended 20 liter container called “gallon”. This compares favorably with 75% (57) reported in a PSI study by Blanton (2008). The CLTS approach seeks to sensitize project communities to abandon open defecation. So far, 60 of these have been triggered. Ten (10) communities have been certified as open defecation free (ODF). About 54% (95) of respondents in non – project communities practice open defecation compared to 38% (295) project communities using various techniques. Access to household latrines is highest in project communities than non-project communities 32% (166) and 18% (32) respectively. About 95% (501) of the study population reported regular hand washing with soap. This is an improvement over 71% reported in the PSI study (cited) which was adopted as the benchmark for assessment. School WASH component has been given a big boost. The program schools were provided Hand-dug-wells (HDWs) fitted pumps, institutional latrines, hand washing facilities, supply of WaterGuard for water treatment and soap for hand washing. School health committees/Clubs have been formed and the members trained in the schools to promote WASH activities in both school and community. However, there are administrative and logistic challenges that prevent effective utilization of the facilities in some schools. Conclusions WASH package approach has made significant difference between project and non project communities. It has also made immense progress compared with benchmark statistics selected at the start of the program. In spite of the high levels of achievement, some potentials remain untapped just as other aspects have attracted marginal attention. They include garbage disposal, mainstreaming gender and HIV/AIDS (among other vulnerable groups) into WASH and development of profiles for expected hygiene behaviors at inception phase of the program. Program planning, implementation, monitoring, partnership arrangements and collaboration have been effectively done. These offer several lessons for scale up. However, most implementing partners have demonstrated limited capacity to deliver. There is likely potential to increase internal coordination between WASH and other units within the Child Survival (CS) section of UNICEF. Other possibilities exist for the WASH unit to receive technical support from the Communication and Education sections of UNICEF beyond the current levels. The difficult roads transport situation is another challenge.

5
Recommendations Sector learning and review of WASH package components
UNICEF and partners should disseminate achievements and lessons to facilitate learning among sector players.
They should also emphasize garbage (refuse) disposal component of the package.
Mainstream gender, HIV/AIDS and other sustainability considerations into future WASH program to optimize returns on investments, increase health outcomes in communities and to ensure sustainability of the program.
UNICEF and partners should compile expected hygiene behavior profiles at the design stage of WASH package program as part of baseline information.
WASH in Schools
School Health Committee/Clubs (SHC) committees should be assisted and encouraged to display action plans by placing them on school notice boards or walls. They should prepare updates on their activities as part of routine school reports. Education authorities should make school WASH assessment part of routine school inspections.
UNICEF and partners should institute a scheme for school authorities to ensure proper use the WASH facilities in general and hand washing facilities in particular.
Internal coordination and program management
Intensify efforts in Child Survival section of UNICEF to promote planning, implementation and coordination within and between other sections as planned. The activities of the Communication Working Group (CWG) is one of the platforms to be used.
The WASH unit should organize a review workshop on the current program planning and management processes with all stakeholders to validate its strengths, and share these as lessons to facilitate sector learning.
WASH unit should intensify its current monitoring arrangements of carrying out purposive visits aimed at spending more days with partners who may be in distress and so require extended support. This should be applied to partners performing very well in order to capture and share best practice with other sector players.
Improving partnership and collaboration
UNICEF should continue to implement WASH through government and NGO partners. However, there is need to select and build capacity of partners in both technical and management departments of WASH programs.
UNICEF should also Intensify WASH unit‟s innovative strategies in addressing inaction among some partners.
Community management structures and sustainability
WASH section of UNICEF in collaboration with Government and NGOs should work closely with communities leaders to develop a criteria for selecting volunteers for training after which they must be given definite periods to serve their communities.
The regular meetings and training programs for WASH committee members should be continued for not less than one year. It should offer the opportunity for members to present themselves for scrutiny and be accountable to the wider community.
Future programs should adhere to key sustainability factors at all stages of program design through implementation. They include; Financial, Technical, institutional, Environmental and Social/Cultural factors emerging from baseline assessments.

6
List of Acronyms and Abbreviations
CHT County Health Team
CLTS Community- Led Total Sanitation
CODES Community Development Services
ECREP Evangelical Children Rehabilitation Program
ERS Emergency Rehabilitation Services (Inc)
FAAL Foundation for All Ages Liberia
FGD Focus Group Discussion
HWTS Household Water Treatment and Storage
GCM Grand Cape Mount
GD Grand Gedeh
GB Grand Bassa
GPP Government Partner Project
HWWS Hand Washing With Soap
KAP Knowledge Attitude and Practice
KII Key Informant Interview
LDHS Liberia Demographic and Health Survey
LISGIS Liberia Institute of Statistics and Geo-Information Services
NGO Non-Governmental Organizations
SCODES Sustainable Community Development and Environmental Sanitation
PCA Program Cooperation
P / NP / GPP Project / Non-Project / Government Partner project
SHC School Health Committee
TRA Theory of Reasoned Action
WASH Water Access, Sanitation and Hygiene
WHO World Health Organization

7
Table of Contents
Acknowledgements ----------------------------------------------------------------------------- 2 Executive Summary ----------------------------------------------------------------------------- 3 List of Acronyms and Abbreviations ---------------------------------------------------------- 6 Table of Contents ----------------------------------------------------------------------------- 7 Chapter one (1): Introduction and Methods ------------------------------------------------- 10 1.1 Introduction ----------------------------------------------------------------------------- 10 1.1.1 WASH package approach --------------------------------------------------------------- 13
1.1.2 Purpose of evaluation ---------------------------------------------------------------------- 13
1.1.3 Objectives ----------------------------------------------------------------------------- 13
1.2.1 Methodology ----------------------------------------------------------------------------- 14 1.2.2 Sample size ----------------------------------------------------------------------------- 14 1.2.3 Sampling procedure ----------------------------------------------------------------------- 14 1.2.4 Household selection ------------------------------------------------------------------------ 15 1.2.5 Data collection methods and techniques ---------------------------------------------- 15 1.2.6 Interviewer training and pre-testing ----------------------------------------------------- 16 1.2.7 Data Collection ------------------------------------------------------------------------------ 16 1.2.8 Data processing and analysis ----------------------------------------------------------- 16
Chapter Two (2) Findings ----------------------------------------------- 17 2.1 Background information --------------------------------------------------------------------- 17 2.1.1 Description of respondents -------------------------------------------------------------- 17 2.1.2 Occupation and marital status of respondents ------------------------------------- 17 2.1.3 Housing and Income levels -------------------------------------------------------------- 17 2.2 Household water treatment and storage of drinking water ------------------------ 18 2.2.1 Source and storage of drinking water ------------------------------------------------- 18 2.2.2 Treatment of household drinking water with WaterGuard ----------------------- 19 2.2.3 Monitoring the use of WaterGuard ----------------------------------------------------- 20 2.2.4 Pool Test Results --------------------------------------------------------------------------- 20 2.2.5 Reasons for non-use of Water Guard ------------------------------------------------- 21 2.2.6 Frequency of household water treatment by community ------------------------- 21 2.2.7 WaterGuard and competition from other treatment agents ---------------------- 22 2.2.8 Willingness and ability to store and treat water safely ---------------------------- 23 2.2.9 Sustainability of protected water sources -------------------------------------------- 23 2.3 Sanitation: Human excreta and garbage disposal ----------------------------------- 23 2.3.1 Places of defecation ----------------------------------------------------------------------- 23 2.3.2 Potential to increase access to improved access to sanitation (latrines) ----- 24 2.3.3 Benefits of household latrines ----------------------------------------------------------- 25 2.3.4 Reported sanitation behavior change ------------------------------------------------- 25 2.3.5 Garbage disposal and inoculation against filth -------------------------------------- 25 2.4 Hand washing with soap (HWWS) -------------------------------------------------------- 26 2.4.1 Proximity of hand washing facility to latrines ---------------------------------------- 26 2.4.2 Low perception of risk --------------------------------------------------------------------- 26 2.4.3 Reported hand washing moments ----------------------------------------------------- 26 2.4.5 Willingness and ability to own and use hand washing facilities ----------------- 26

8
2.4.6 Perceived impact of on diarrhea episodes ------------------------------------------- 27 2.4.7 Sanitation and hygiene related behaviors in schools ------------------------------ 28 2.4.8 School health clubs and committees --------------------------------------------------- 29 2.4.9 Activities of WASH Committees and other volunteers ----------------------------- 29 2. 5 Assessing WASH behavior triggers ------------------------------------------------------ 29 2.5.1 Hygiene Education and levels of self efficacy ---------------------------------------- 29 2.5.2 Timing of sensitization activities versus missed opportunities ------------------- 29 2.5.3 Dependency syndrome --------------------------------------------------------------------- 30 2.5.4 Identifying secondary audiences --------------------------------------------------------- 30 2.5.5 Preferred communication channels ----------------------------------------------------- 30 2.5.6 Other innovative approaches suggested ----------------------------------------------- 31 2.6 Program implementation and management arrangements -------------------------- 31 2.6.1 Program management arrangements --------------------------------------------------- 31 2.6.2 Internal Coordination ------------------------------------------------------------------------ 31 2.6.3 Monitoring and support visits -------------------------------------------------------------- 31 2.6.4 Coordination and collaboration ------------------------------------------------------------ 32 2.6.5 Outputs and outcomes of WASH package --------------------------------------------- 32 2.6.6 Achievements ---------------------------------------------------------------------------------- 32 2.6.7 Challenges -------------------------------------------------------------------------------------- 33
Chapter Three (3): Conclusions and Recommendations ----------------------------- 34 3.1 Direct program activities and outcomes --------------------------------------------------- 34 3.1.2 WASH in Schools ----------------------------------------------------------------------------- 34 3.2 Program management and institutional arrangements -------------------------------- 35 3.2.1 Program Management ---------------------------------------------------------------------- 35 3.2.2 Community management structures ----------------------------------------------------- 36 List of Tables Table 1a. Summary of Sampled Data Sources / Techniques ----------------------------- 15 Table 1: Source of drinking water by Community Type ------------------------------------- 18 Table 2: Containers for storing water by community type ---------------------------------- 19 Table 3: Outcomes of education on HHWTS education by community type ----------- 20 Table 4 Reasons for not treating with WaterGuard by community ----------------------- 21 Table 5: Appropriate treatment of water --------------------------------------------------------- 22 Table 6: Regular places of defecation by project and non-project communities ------ 24 Table 7: Reported hand washing moments ----------------------------------------------------- 26 Table 8: Perception of diarrhea episodes in children <5yrs by community type ------- 28 Table 9: Potential list for secondary audiences ------------------------------------------------- 30 Table 10: Trusted source of information ---------------------------------------------------------- 31 Table 11: Favorite radio station --------------------------------------------------------------------- 32 List of Figures Fig1a : Distribution of respondents by community type ------------------------------------- 16 Fig 1: Length of Stay in Community -------------------------------------------------------------- 17 Fig 2: Educational Status of Respondents ------------------------------------------------------ 17 Fig 3: Occupation of respondents ----------------------------------------------------------------- 17 Fig 4: What is the marital status ------------------------------------------------------------------ 18 Fig 5: Housing - State of Occupancy ------------------------------------------------------------- 18 Fig 6: Income levels of respondents -------------------------------------------------------------- 19 Fig 7: Household drinking water storage containers ------------------------------------------ 20 Fig 7a: Perceive risk and Use of WaterGuard All Communities --------------------------- 21

9
Fig 8: Percentage of households with Free Residual Chlorine in Counties ------------ 21 Fig 9: Variance non-use and advice to use WaterGuard ------------------------------------ 22 Fig 10: Where households defecate -------------------------------------------------------------- 24 Fig 11: Perceived risk of not having household latrine --------------------------------------- 24 Fig 12: Willing and able to own HH Latrine ----------------------------------------------------- 25 Fig 13: Perceived benefits of HH latrines? ------------------------------------------------------ 25 Fig 14: Perceived benefits in HWWS versus willingness to acquire facility ------------ 27 Fig 15: Reported hand washing moments ------------------------------------------------------- 27 Fig 16: Reported diarrhea episodes ------------------------------------------------------------- 27 Fig 17: Observation – School latrines and hand washing behaviors by community type ------------------------------------------------------------------------ 29 Fig 18: Observation – School latrines and hand washing behaviors by county ------ 29 Boxes Box 1: Results of schools latrine observation and hand washing ----------------------- 28 References -------------------------------------------------------------------------------------------- 38 Appendixes ------------------------------------------------------------------------------------------- 39 Appendix 1: Data Collection Tools: Questionnaire -------------------------------------------- 39 Appendix 2: Water Quality (Pool Test Results) ------------------------------------------------ 49 Appendix 3: Table of outputs completed under WASH Package Approach program- 50 Appendix 4: List of Key Informants and Persons Contacted ------------------------------ 51 Appendix 5: List of participants at the dissemination/validation workshop -------------- 52

10
Chapter one (1): Introduction and Methods
1.1 Introduction
The WASH section of UNICEF in Liberia is currently implementing a Water Access, Sanitation and Hygiene promotion (WASH) Package Approach. It combines a set of activities including Household Water Treatment and Storage (HWTS), Community-Led Total Sanitation (CLTS), Hand Washing with soap (HWWS) in both community and schools. The aim is to optimize anticipated health outcomes and to impact positively on child survival in communities. As part of this initiative, a total of six (6) agencies consisting (5 NGO partners and a County Health Team (Government Agency) are implementing a WASH package in five (5) Counties of Grand Cape Mount, Grand Bassa, Margibi, Grand Gedeh and Maryland. After nine months of implementation and as part of implementation arrangements, it was considered essential to evaluate the strategy in order to improve upon the approaches and learn lessons in order to achieve better results in the future hence the commissioning of this assignment with the eye of an external assessor. Another expectation at the end of the evaluation is to use some outcomes to fine tune the learning processes and to add value to internal monitoring systems of the WASH section. In order to establish a basis for measuring progress, UNICEF adopted as a baseline study
Knowledge, Attitudes and Practices (KAP) on point of use household water treatment, hygiene
and diarrheal diseases conducted by CDC, PSI and the (LISGIS) in three counties and have
since extrapolated the findings as a proxy for measuring progress in the 5 project counties.
Other studies have also informed the design of the WASH Package intervention they include 1)
a Country context assessment on the feasibility of household water treatment strategy in Liberia
conducted in November 2008 by Centers for Disease Control (CDC) and Population Services
International (PSI). Highlights of the documents have been selected to form the benchmark for
measuring progress.
Highlights of the study conducted by PSI and LISGIS indicates that most common water sources in the rural areas were surface sources such as river or steam and unprotected spring. The majority of rural households surveyed from Grand Gedah had access to a protected well with pump. Only 30% (24) respondents in the rural areas transported water in the recommended 5 gallon containers. Majority of respondents in the rural communities, 71% (57) reported storing household drinking water in the recommended 5 gallon containers. About 28% (23) of the rural sample also indicated they have ever treated their household drinking water. Majority of the rural sample population 75% (60) reported practicing open defecation (bush, beach or river (possibly the banks). Less than half of the rural sample 45% (36) reported hand washing always or frequently. There are limitations in relying on a proxy baseline data. These include the fact that the study was mainly designed for urban populations; The sample size for the rural population was too small; The design omitted key behavior sustainability factors such as willingness and ability to pay for containers and water treatment agents among others; and has over relied on respondents‟ report (Blanton 2008).

11
The country context assessment in relation to the potential for household water treatment
strategy in Liberia consisted initially of a desk review of draft policies and existing chlorination
practices. Water quality testing was then performed for different types of water sources in order
to develop a suitable dosage regime. A local company capable of producing a high quality
sodium hypochlorite solution has been identified. Consultations were carried out with key
stakeholders to assess the practice and the acceptability of the household water treatment
approaches. This was a rich source document that provided an understanding of how
WaterGuard production started in Liberia. Another document which provided lessons from PSI‟s
review of household water treated with chlorine products in five African countries (USAID 2007)
yielded a wider scope of information the aided the analysis of results.
The 2007 Liberian DHS estimates that only 65% of Liberian households have access to an improved water sources according to the classification of improved and unimproved water sources by the WHO/UNICEF Joint Monitoring Program for Water Supply and Sanitation. The LDHS showed that 16% of households reported treating their drinking water with bleach or chlorine and 80% of household report doing nothing to treat their drinking water. In addition, it is common practice to use locally available calcium hypochlorite powder to “shock chlorinate” wells and hand pumps, a practice which has been shown to be ineffective for keeping water safe for more than 24 hours post-treatment. The survey also pointed out that treatment frequency is not standardized, and monitoring of residuals typically does not occur. Access to water and to sanitary facilities in Liberia is reported as among the lowest in Africa.
The safe water coverage rate is estimated at 25% while access to improved sanitation
infrastructure is around 14% (PRS, 2007). Open defecation is practiced by 49% of households
contributing hence to the burden of water related diseases especially among children (JMP,
2010).
From an estimated population of about three and a half million people (Census, 2008), nearly
two out of three Liberians live below the poverty line (63.8%). About three quarters of poor
reside in rural areas (LPRS, 2008). The effects of years of war were devastating to the existing
infrastructure in Liberia which was heavily damaged. The pipe-based water supply in the capital
city Monrovia is operating in 2010 at 27% of pre-war capacity (LWSC, 2010).
Health indicators show very high mortality rates for children under-five years old at 110 per 1,000 live births (LDHS, 2007) - 20th lowest in the world (UNICEF, 2009). Preventable childhood diseases including diarrhea, malaria, and acute respiratory infections continue to be major killers. The Liberia Demographic and Health Survey (LDHS, 2007) reported that 29% of children between the ages of 6-11 months had diarrhea in the 2 weeks preceding the survey. Cholera is endemic in Liberia, with regular outbreaks especially in Monrovia, the capital city. Annual admissions to the Cholera Treatment Unit in Monrovia averaged 2,605 between 1996 and 2009. Although the number of annual suspected cholera cases declined to 1,057 in 2009, all reported cases were in Monrovia. Chronic malnutrition level remains a major underlying cause of child deaths with 35% of children stunted (DHS, 2007).

12
The situation recounted above partly accounts for the UNICEF‟s resolve to adopt measure that will rapidly increase access to WASH facilities and services in an integrated fashion. It also has the potential reducing diarrheal diseases (especially among children) including cholera. 1.1.1 WASH package approach UNICEF is currently supporting Household water treatment and storage interventions with an initial focus on cholera hotspots in various counties of Liberia including the selected communities. The main activities in the package include:
household/point of use water treatment and safe water storage,
Improved personal hygiene on water use practices with emphasis on hand washing with soap, and
Community-Led Total sanitation towards open defecation free communities. The project is currently being implemented in selected communities located in 5 Counties of Liberia including health care facilities. The selection criteria of the beneficiary communities included: the prevalence of cholera and diarrheal disease over the last 3 years, safe water coverage, the existence of alternative water sources, past community-based interventions and existence of environmental health workers at district level. 1.1.2 Purpose of evaluation The purpose of the study is to evaluate the WASH package approach, its impact on target population and key lessons learnt in order to improve the design of subsequent projects. The evaluation is expected to look at the project efficiency, effectiveness, sustainability and appropriateness. 1.1.3 Objectives To evaluate the WASH package approach targeting the Counties of Grand Cape Mount, Grand Bassa, Margibi, Grand Gedeh and Maryland and will focus on the following:
Analyze the appropriateness/relevance of the approach: assess whether the project was in line with identified needs and priorities of the target population?
Analyze the efficiency of the project: measure the qualitative and quantitative outputs achieved in relation to the inputs and compare alternative approaches to see whether the most efficient approaches were used.
Examine the effectiveness of the project: measure the extent to which proposed objectives and results have been achieved
Analyze the community hygiene behavioral change as a result of the WASH package
Specifically, the Consultant is to design, train enumerators, process and analyze collected data and write a quality report for a quality KAP survey focusing on home water treatment, hand washing and excreta disposal practices.
In the Counties of Grand Bassa and Grand Gedeh, household water treatment and storage strategy will be particularly assessed to meet the requirement of the donor ECHO.

13
Evaluate the impact/effect of the project on beneficiary population- level of involvement, impact on them?
Provide lessons learnt, conclusions and recommendations. 1.2.1 Methodology The appreciative enquiry (AE) approach was adopted and as a response to the Terms of Reference (ToR). The ToR places emphasis on participatory methods of enquiry and seeks to place value on participation and learning. The process enables learning from the projects to be used in the development of similar endeavors. The approach and its application during the implementation of this assignment has been based on the under listed assumptions:
Every organization, team or individual has something that works well, and it is worth building upon.
What we understand to be reality arises from what we focus on and reality is created in the moment.
It is possible to create many realities and the language we use creates our reality.
Simply asking questions of an organization, group, team or individual does influence them in some way.
People or organizations have more confidence progressing into to the future when they take with them what has been most helpful and of value from the past.
It is important to value differences because we see the world through our own set of personal filters which is often different from shared realities.
The hygiene and behavior change components of the study was also based on Health Action Model (HAM) Tones and Tilford (1994), the Health Belief Model (HBM) Rosenstcok et al (1994) and the Theory of Reasoned Action (TRA) Adjen and Fishbein (1980), and Hygiene Improvement Framework by USAID to generate valid information in a systematic manner. The sanitation relied heavily on study deployed a combination of qualitative and quantitative methods.
1.2.2 Sample size A total of 743 structured household questionnaire were administered. This was considered adequate to assess any changes resulting from implementation of the WASH package approach project. The figure was arrived at after reviewing the relevant project documents including the baseline and country context assessment reports mentioned earlier. In consultation with UNCEF WASH team, some assumptions were made to determine the sample size for the quantitative aspect of the study: The expected percentage of households practicing HHWW and HWTS is 1%, 2% at follow-up, the confidence limit of 95%, with a power of 80% and design effect of 2%. 1.2.3 Sampling procedure: A multi-stage random sampling method was adopted as described below.
◦ All 5 counties in which WASH Package is currently being implemented were selected as the sampled population.
◦ From each county selected, one project (intervention) district was selected at random from which three beneficiary communities were also randomly selected.
◦ An adjacent district, a non-project (control) community was randomly selected.

14
In all 23 sample communities were selected as following:
o 18 Project Communities (Intervention)
15 NGO project Communities
3 Government partner project Communities
5 Non-Project Communities (Control) 1.2.4 Household selection In each sample community (both intervention and non-intervention), a sketch or layout plan was examined to determine the centre of the community. From not less than 4 houses at the approximate centre of each community, one of the houses was chosen after which every other house was selected. In very small communities as it turned out to be in some instances, every house was considered eligible from which one household with a woman who has a child <5year old was selected at random and interviewed.
1.2.5 Data collection techniques The following techniques were used to gather qualitative studies;
Quantitative
◦ Structured interviews with mothers of children five years or less (<5yrs)
◦ Semi-structured observations
Qualitative methods
◦ Focus group discussions (FGDs) and general group discussions were conducted with mothers of children 5 years old or less.
◦ Interviews with Key informants and key stakeholders including; Science teachers, Principals of schools, Students, Community WASH committee members, Town Chiefs, Community Health
Workers, Community Animators, NGO leaders. County Health Team members
◦ There was a structured observation of household latrines and persons using the facility to document the hand washing behaviors within various contexts.
Table 1a. Summary of Sampled Data Sources / Techniques
No. Data Collection Techniques Totals
1 Household Questionnaire 743
2 Key Informants Interview (74 Project + 13 Non-Project.) 87
3 Focus Group Discussions (23 Project + 11 Non-Project.) 34
4 HWWS / Hygiene behavior observations: -
5 - Home 98
6 - Schools 23
7 HHWT testing: (Pool Testers) 365

15
„ 1.2.6 Interviewer training and pre-testing A five day training session for 16 enumerators and the entire research team was organized. The topics taught helped to ensure timely collection of high quality data. Both quantitative and qualitative data collection instruments were tested in two communities Sackie Town and Frank Town. 1.2.7 Data Collection Data collection in all sampled counties and communities took place about the same period. Both enumerators and supervisors were in the field at the same time to ensure that maximum support was available to the former, coordination and quality checks were done almost simultaneously.
1.2.8 Data processing and analysis All forms of data gathered were cleaned, collated and triangulated during analysis. Both qualitative and quantitative sources were of information subsequently processed. These were disaggregated and analyzed to draw relevant conclusions that reflected the levels of knowledge and behavior. WASH. The software application selected for data processing and analysis were SPSS and MS Excel. These were used to generate relevant frequency tables and cross tabulations. Qualitative data gathered were categorized according to objectives of the study and emerging themes. The various themes have been further analyzed to validate and help derive meanings and relevant conclusions. Key recommendations were made as part of the preliminary findings and presented to major stakeholders (refer appendix 5 for list of participants) who provided feedback to finalize the report.

16
Chapter Two (2) Findings and Discussions
2.1 Background information 2.1.1 Description of respondents
All respondents 743 were mothers of children with children five year or less and have leaved in their respective communities less than 4 years. Majority 87% (639) have lived in those communities between 2- 3 years only as shown in the fig. 1 below. More than half 59% (439) of the respondents have not had formal education. The remaining 27% and 8% have had secondary and primary education respectively and presented in fig 2 Below.
2.1.2 Occupation and marital status of respondents Most respondents 51% (376) are farmers, 26% (196) are traders and 13% (97) are unemployed or are fulltime home keepers.
2.1.3 Housing and Income levels About 65% (481) of respondents live in their own houses, 13% (95) are tenants and 19% (141) as squatters. Most of them 56% (413), reported earning equivalence of US$30.00 or less in a

17
month but 28% (210) do not earn any income. Figs 5 and 6 below provide more details of housing and income levels.
2.2 Household water treatment and storage of drinking water Under this section the source, method of storage and treatment of drinking water at the point of use has been presented as reported by respondents, key informants and focus group participants. The educational background, occupation and incomes levels did not make any trends in responses. 2.2.1 Source and storage of drinking water Protected hand-dug-wells are the primary source of drinking water to about 77% (570) of sampled population. This sharply contrasts with findings in the KAP study conducted by PSI (Blanton 2008). There is also a difference between project and non-project communities. As captured in table 1 below, there is a higher dependence on unprotected water sources in the latter. The trend in Grand Gedeh 80% (108) is slightly higher that the mean but Grand Bassa 56% (107) falls below it. “We get water from the creek” - says an FGD participant in the Pleebo District - Maryland. Table 1: Source of drinking water by Community Type
Sources:
Community Type:
Total Freq. %
Non-Project Community
Gov’t Partner Project C’ty
What is your source of drinking water? Freq.
% Freq.
% Freq.
% Freq. %
Hand-dug-well fitted with hand pump 570 76.7
438 84.9
129 72.9 3 6
Unprotected wells 68 9.2 45 8.7 23 13 0 0
Surface water (River/stream etc) 90 12.1
20 3.9 24 13.6 46 92
Other 15 2 13 2.5 1 0.6 1 2
Total 743 100 516 100 177 100 50 100
Most respondents are themselves largely responsible for drawing and managing household drinking water. Although more than half of households reported storing water in the recommended “gallon” containers (20 liter container recommended for the transport and storage of household drinking water). This is higher than the 30% reported in the baseline document.

18
The rest use other open receptacles considered unsafe means of storing drinking water as shown in fig 7 below. In Grand Bassa the reported use was 49% (94) and 69% (93) in Grand Gedeh. The average for the entire study is 69% (93).
More than half of the sampled population stored water in Jerry cans with a cover as shown in fig 7 above. There is however a marked difference between project communities (59%) and non-project communities (31%)as shown in table 2 below. This is lower than the benchmark statistic of 71% (57) in the baseline report. On the contrary, FGD participants tend to mention other storage containers than “gallons”. “I do not have gallon, I have a pan” – says an FGD participant. “The same pan we get water in from the creek is the same pan we drink from” – says another participant.
Table 2: Containers for storing water by community type
Where do you store your drinking water?
Community Type
Total Project
Community Non- Project Communities
Gov’t Partner
Community
Freq % Freq % Freq % Freq %
Jerry can with cover 399 53.7 307 59.5 55 31.1 37 74
2.2.2 Treatment of household drinking water with WaterGuard There is fairly high level of awareness among the respondents about the need to treat drinking water as a result of which several methods of treating household drinking water has been documented. However, they demonstrate a low sense of susceptibility. This seem to have translated into a low level of willingness to improve quality of drinking water as shown in table 3 and graphically presented on fig 7a below. When the question was put, 59% (439) answered “yes” to treating household drinking water. This is higher that the baseline figure of 28% (23). The difference between project and non –project communities is also wide, 75% (386) and 6% (11) respectively.

19
Table 3: Outcomes of education on HHWTS education by community type
Issues:
Community Type
Total Project
Community Non- Project Communities
Gov’t Partner
Community
Freq % Freq % Freq % Freq %
Perceive risk due to the nature of your household drinking water. 166 22.3 82 15.9 68 38.4 16 32
Take action to improve water quality. 429 57.7 360 69.8 41 23.2 28 56
Treat water with WaterGuard. 439 59.4 386 75 11 6.3 42 85.7
Visits for FRC monitoring. 447 60.2 297 57.5 0 0 0 0
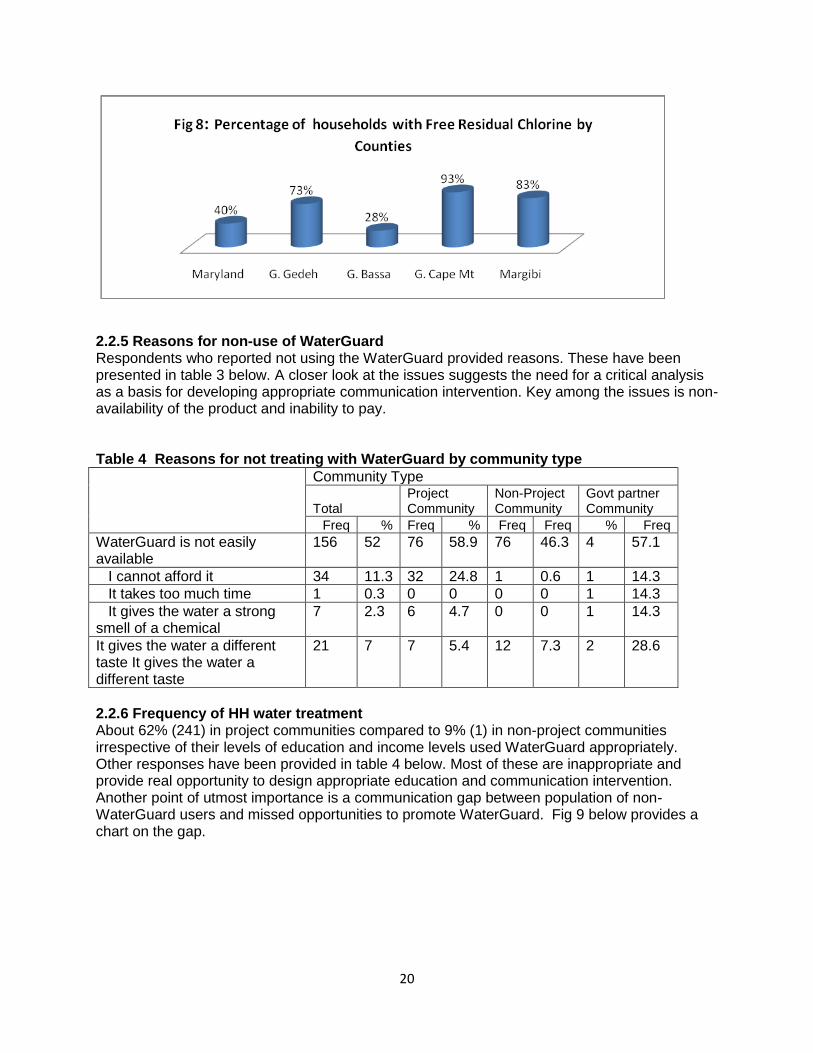
2.2.3 Monitoring the use of WaterGuard It is a regular project activity for NGO staff or volunteers trained under the WASH Package program to randomly visit households to carry out water quality test. They test for free residual chlorine 0.2mg/L as a sign of treating household drinking water with WaterGuard. In their response to a question, 57% respondents reported they have been visited and had their water quality tested. 2.2.4 Pool Test Results The outcome of water quality tests carried out during the survey revealed different levels of success (prevalence) in project communities ranging from a low of 28% in Grand Bassa to a 93% high in Grand Cape Mount as shown in fig 8 below. Community specific set of results have been provided in appendix 2. About 60% of respondents seem to apply WaterGuard appropriately. The remaining are either not using or are applying it inappropriately. All samples in non project communities tested negative.
20
2.2.5 Reasons for non-use of WaterGuard Respondents who reported not using the WaterGuard provided reasons. These have been presented in table 3 below. A closer look at the issues suggests the need for a critical analysis as a basis for developing appropriate communication intervention. Key among the issues is non-availability of the product and inability to pay. Table 4 Reasons for not treating with WaterGuard by community type
Community Type
Total Project Community
Non-Project Community
Govt partner Community
Freq % Freq % Freq Freq % Freq
WaterGuard is not easily available
156 52 76 58.9 76 46.3 4 57.1
I cannot afford it 34 11.3 32 24.8 1 0.6 1 14.3
It takes too much time 1 0.3 0 0 0 0 1 14.3
It gives the water a strong smell of a chemical
7 2.3 6 4.7 0 0 1 14.3
It gives the water a different taste It gives the water a different taste
21 7 7 5.4 12 7.3 2 28.6
2.2.6 Frequency of HH water treatment About 62% (241) in project communities compared to 9% (1) in non-project communities irrespective of their levels of education and income levels used WaterGuard appropriately. Other responses have been provided in table 4 below. Most of these are inappropriate and provide real opportunity to design appropriate education and communication intervention. Another point of utmost importance is a communication gap between population of non-WaterGuard users and missed opportunities to promote WaterGuard. Fig 9 below provides a chart on the gap.

21
Table 5: Appropriate treatment of water
How often do you treat drinking water?
Community Type
Total % P - Project
Community Non-Project Community
Gov’t Partner
Community
Freq % Freq % Freq % Freq %
Each time I fill the container
with in fresh water 261 59.5 241 62.4 1 9.1 19 45.2
As often as I feel there is a
need 51 11.6 46 11.9 1 9.1 4 9.5
Anytime I have access to the
WaterGuard 55 12.5 37 9.6 0 0 18 42.9
I do not treat my drinking water 7 1.6 1 0.3 6 54.5 0 0
Other 65 14.8 61 15.8 3 27.3 1 2.4
Not stated 0 0 0 0 0 0 0 0
2.2.7 WaterGuard and competition from other treatment agents Other treatment agents are used in the communities. These seem to be competing unfavorably with the recommended brand (WaterGuard). The chlorine in various forms of preparations are sold on bought off the market. It is reported that WFP – through ADRA is promoting the use of “Chlorax” in G. Bassa. The different strengths, volumes and price of the various brands is an issue that seem to negatively affect the attractiveness of WaterGurad. For example, “Chlora” is reported to be sold at LD 40.00 per 0.47 liter bottle compared to the WaterGuard which sells at LD 40.00 per 150 ml/bottle. Although it is reported to have been strategically thought through, the potential sustainability of WaterGuard will need some effectively tailored messages and structures on the ground now.

22
2.2.8 Willingness and ability to store and treat water safely Majority of respondents 61% indicated their willingness and ability to procure and use appropriate water storage “gallons“. This seems to be an indirect measurement of the level of sensitization reached due to sensitization to use of the container. Another 70% (500) respondents indicated that they are willing and able to buy and use WaterGuard treat household drinking water. However, some elements in all communities think both treatment agents and safe storage containers should be distributed at no cost to them. “We need help, we want them (referring to the NGO) to bring WaterGuard…” says a key informant. “We need gallons to save our water” – says a passionate mother. These comments raise issues associated with equity and inequality for design and implementation of sustainable WASH programs. 2.2.9 Sustainability of protected water sources Most of the communities had their water points broken down long before the current WASH package project began. “the pump got spoiled in 2008” - FGD participant in Gran Gedeh . It was expected that communities would be happy to discuss measures put in place to prevent a recurrence of the situation instead most key informants and community leaders have been asking for more facilities to switch to when the current points break down again. Others think the new water points are not enough. “We want more pumps and latrines because we do not have enough” - says a community leader. 2.3 Sanitation: Human excreta and garbage disposal 2.3.1 Places of defecation About 42% (312) defecate in the open using various tactics. “We go into the bush to toilet” – said an FGD participant. The difference between project (32% intervention) and non-project (18% non-intervention) communities is wide as captured in table 5. Only 28% (105) of respondents have access to and use household latrines. Other means of defecation have been described in Fig 10 below. Only 24% (n=430) are gender friendly (have access to latrines with separate cubicles for men and women). The difference between project and non- project communities is marginal 2.1% (58). Some of the factors likely to increase construction and appropriate use of latrine have been explored and captured in fig 11 below.

23
Table 6: Regular places of defecation by project and non-project communities
Where do you and your
household members defecate
regularly?
Community Type
Total Project
Community Non-Project Community
Gov’t Partner
Community
Freq % Freq % Freq % Freq %
Household latrine 212 28.5 166 32.2 32 18.1 14 28
Household latrine with hand washing facility 52 7 48 9.3 2 1.1 2 4
Public/Communal latrine 64 8.6 39 7.6 22 12.4 3 6
Public/Communal latrine with hand washing facility 19 2.6 10 1.9 6 3.4 3 6
Dig and bury 21 2.8 14 2.7 4 2.3 3 6
Open defecation; beach bush poly bags street corners 312 42 195 37.8 95 53.7 22 44
Others 63 8.5 44 8.5 16 9 3 6
Total 743 100 516 100 177 100 50 100
2.3.2 Potential to increase access to improved access to sanitation (latrines) So far, the education and sensitization provided by Community Health Volunteers (CHVs) and community animators (CAs) has tended to lean on the walls of health benefits. To increase the construction of household latrines as part of the CLTS approach, the central themes of education and communication should go beyond health benefits. They must address community needs and tailored around issues such as prestige, inconvenience and exposure to personal
dangers at night as mentioned in fig. 11 above. About10 communities have been declared open defecation free (ODF) under the CLTS sensitization component of the project. These will have to be sustained through socially engineered processes in addition to social marketing approaches.

24
2.3.3 Benefits of household latrines Most households have been sufficiently sensitized by the program and they intend to own and use latrines. However they are faced with challenges that prevent them from immediately owning and using one. The perceived benefits factors that prevent households from owning latrine are presented in the figs 12 and 13 respectively. The differences between project and non-project communities are mixed and sometimes the latter seem better motivated. This may be due to education given by other agencies or knowledge gained living in other communities. 2.3.4 Reported sanitation behavior change The CLTS program seems to make great strides as about 26% (194) of respondents reported they have stopped defecation in open places as a result of the education and sensitization. Majority 93% (184) of the respondents live in project communities compared with 1.6% (3) in non-project communities. However, this proportion only represents on 36% (516) of the sampled project population. 2.3.5 Garbage disposal and inoculation against filth Only 8% (58) and 31% (217) of respondents stored and disposed of household refuse (garbage) appropriately. Analysis of the statistics suggests that project communities are doing marginally better than their non –project counterparts. Despite the poor sanitation situation, most 80% (594) indicated that they are comfortable with the situation. The most comfortable respondents 83% lived in project communities compared to 68% in non-project communities. That notwithstanding, about half of the sampled population perceive the community will be willing to take appropriate actions to improve waste disposal in their communities. This level of perception could be considered high given that refuse disposal is not key in the promotion of CLTS implementation compared to human excreta.

25
2.4 Hand washing with soap (HWWS) 2.4.1 Proximity of hand washing facility to latrines Only 19% (104) of respondents reported having hand washing facility close (within an eye shot or 20 steps) from the latrine. Also, only 3 out of 10 households were reported as having hand washing facilities with soap or close to the point of use. These occur more in project communities than in non-project communities. This situation is likely to reduce opportunities for hand washing after using a latrine and also diminish health outcomes. 2.4.2 Low perception of risk There is a low perception of risk among the sampled population. About 36% (270) do not perceive themselves. Rather, 61% (454) perceive others to be at any risk for which they feel a compulsion to own and use hand washing facility with soap. The tendency is highest among households in project communities. This state of affairs demands special attention in the design of communication strategy and the development of hygiene promotion messages. 2.4.3 Reported hand washing moments Most respondents 87% (649) reported washing hands with soap after using the latrine (as presented in fig 15) but only 24% remembered to mention washing their hands with soap after eating which almost effortless. Project communities had an urge over others under all circumstances. The details are contained in table 7 below. 2.4.5 Willingness and ability to own and use hand washing facilities Almost all households are willing and feel enabled to acquire hand washing facilities. There are more willing respondents in project communities, 65% (333) than in non-project communities, 47% (83) who are willing, able to own and use hand washing facilities with soap. The overall sample results has been presented in table fig 14 below. Table 7: Reported washing moments
Under what circumstances would they wash their hands?
Community Type
Total P - Project Community
Non-Project Community
Gov‟t Partner Community
Freq % Freq % Freq % Freq %
Feeding a child 205 27.6 159 30.8 40 22.6 6 12
Before preparing/Serving a meal 285 38.4 215 41.7 53 29.9 17 34
After latrine 649 87.3 468 90.7 134 75.7 47 94
After cleaning a child's feces of changing dippers 227 30.6 178 34.5 35 19.8 14 28
After meals 184 24.8 136 26.4 44 24.9 4 8
Others 41 5.5 35 6.8 5 2.8 1 2

26
2.4.6 Perceived impact on diarrhea episodes Six months is a relatively short period to assess sustainable impact of public health intervention on population but some “proxies” (substitutes) have been sought relying on perceptions of respondents. Respondents were asked to call from memory the number of diarrhea episodes experienced by their less than (<5) year old child 6 months immediately before the interview. This was compared with reported episodes 6 months previously. A comparison between project and non-project communities shows a marked contrast. Whereas data from project communities indicate a consistent decline in all categories of diarrhea episodes except those who reported one diarrhea episode, the reverse is reported in the non-project communities as shown in Table

27
8 below. The government partner project which started far behind the NGO partner project communities has also reported minimal gains. Table 8: Perception of diarrhea episodes in children <5yrs by community type
Community Type Project
communities Non-Project communities
Govt Partner Project
Communities
None 6MP 317 73 23
None 368 63 26
Once 6MP 56 24 14
Once 74 43 7
Twice 6MP 69 37 8
Twice 46 50 6
Thrice 6MP 32 14 3
Thrice 9 10 5
> thrice 6MP 39 28 1
> thrice 17 6 5
Others 6MP 3 1 1
Others 2 5 1
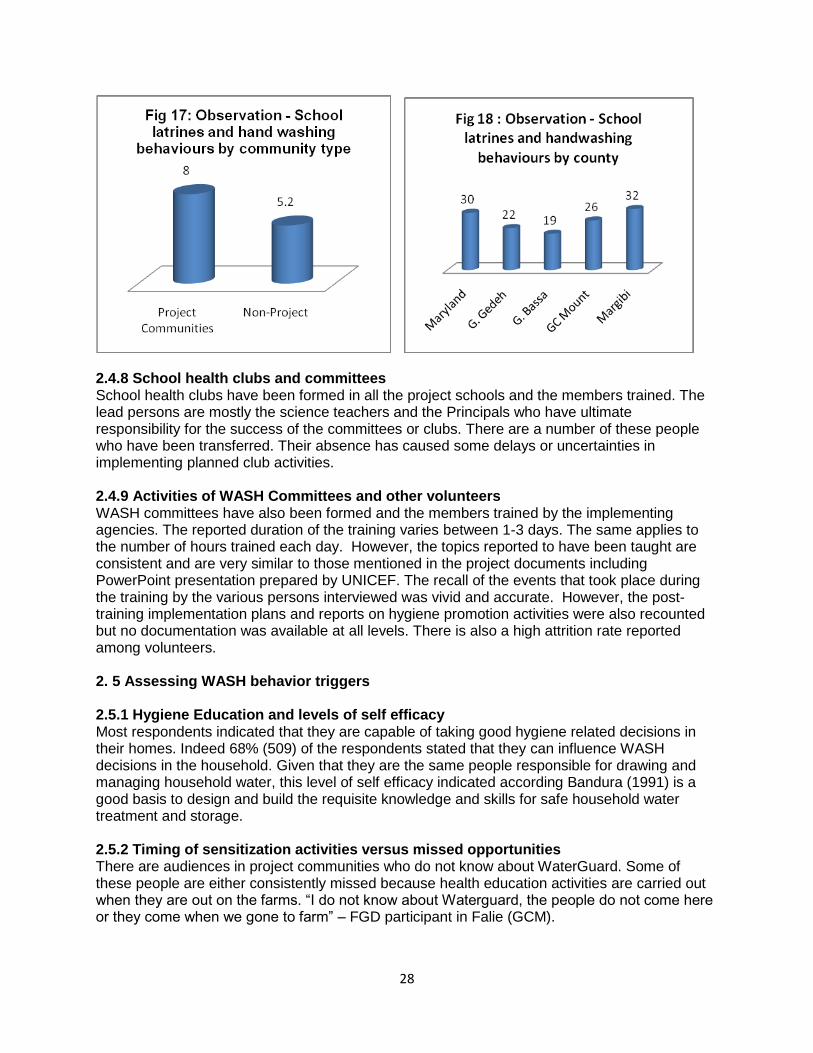
2.4.7 Sanitation and hygiene related behaviors in schools Although the provision of institutional latrines has been very well received by the school populations and communities alike, a lot more work has to be done if the facilities and their current conditions are not to slide below acceptable standards. Most people observed did wash their hand properly. Some of the facilities do not have water or soap to facilitate proper hand washing. The performance of project schools is higher than non-project schools but could have been better (Refer to fig 17 for details). General results of the observation by county have been presented in fig 18. Specific observations have been made after using a 12-point criterion (including filter questions) administered by non technical persons. School-specific data has been submitted to the WASH section for follow-up and monitoring purposes.
Box 1: Results of schools latrine observation and hand washing
About one third of school hand washing facilities are close to the latrines.
Only one third of the facilities have soap but 2 others had the soap somewhere on the school premises.
One third of the latrines are reported as not having clean environment.
A little below half of the school latrines are report to emit odor. Grand Gedeh has the highest numbers.
More than one third of the structures housing the latrines are reported to having some defects that attracted the untrained eye of enumerators. For example, damaged doors or no doors at all.
5 out of 14 latrines did not have water for hand washing on site during the time of visit.
Less than half of the persons observed (6 out of 14), washed their hands properly after using the facility.
Less than half of the school facilities had demonstrated a system for monitoring or ensuring regular cleansing and maintenance.
28
2.4.8 School health clubs and committees School health clubs have been formed in all the project schools and the members trained. The lead persons are mostly the science teachers and the Principals who have ultimate responsibility for the success of the committees or clubs. There are a number of these people who have been transferred. Their absence has caused some delays or uncertainties in implementing planned club activities. 2.4.9 Activities of WASH Committees and other volunteers WASH committees have also been formed and the members trained by the implementing agencies. The reported duration of the training varies between 1-3 days. The same applies to the number of hours trained each day. However, the topics reported to have been taught are consistent and are very similar to those mentioned in the project documents including PowerPoint presentation prepared by UNICEF. The recall of the events that took place during the training by the various persons interviewed was vivid and accurate. However, the post-training implementation plans and reports on hygiene promotion activities were also recounted but no documentation was available at all levels. There is also a high attrition rate reported among volunteers. 2. 5 Assessing WASH behavior triggers 2.5.1 Hygiene Education and levels of self efficacy Most respondents indicated that they are capable of taking good hygiene related decisions in their homes. Indeed 68% (509) of the respondents stated that they can influence WASH decisions in the household. Given that they are the same people responsible for drawing and managing household water, this level of self efficacy indicated according Bandura (1991) is a good basis to design and build the requisite knowledge and skills for safe household water treatment and storage. 2.5.2 Timing of sensitization activities versus missed opportunities There are audiences in project communities who do not know about WaterGuard. Some of these people are either consistently missed because health education activities are carried out when they are out on the farms. “I do not know about Waterguard, the people do not come here or they come when we gone to farm” – FGD participant in Falie (GCM).

29
2.5.3 Dependency syndrome As an “outsider” some phrases connote perceptions of dependency. These are early signals likely to undermine the sustainability of WASH facilities and services if nothing is done now to confront and address the issues openly. Statements such us those captured below are selected reference points.
“We want toilet room, pump and you are to bring everything” – FGD participant. “When you bring the toilet room and pump the way you want us, it is the way we will use it” – says another FGD participant.
2.5.4 Identifying secondary audiences In order to compile a list of secondary audiences, respondents were asked to mention persons who matter or are likely to influence WASH decisions in households. Majority 71% (527) mentioned head of family. Other responses are captured in Table 9 below. Table 9: Potential list for secondary audiences
Who influences HH WASH decisions? % Frequency
Government Officials 8.9 66
Political Representative 0.7 5
Head of Family 70.9 527
Traditional leader 31.4 233
Religious Leader 15.1 112
Landlady 17.4 129
Others 21.3 158
2.5.5 Preferred communication channels According to respondents, community volunteers and local FM radio stations are their preferred and most trusted channels respectively for receiving information and education on WASH. There are slight variations between community types. The details are contained in tables 10 and 11 below.
Table 10: Trusted source of information.
Which of the following is your most trusted source of information?
Community Type
Total Project Community
Non-Project Community
Gov’t Partner Community
Freq % Freq % Freq % Freq %
Total 743 100 516 100 177 100 50 100
Friends 40 5.4 25 5 14 7.9 1 2
Radio 214 28.8 122 24 77 43.5 15 30
Community/Traditional 138 18.6 83 16 50 28.2 5 10
Community health volunteers 249 33.5 210 41 11 6.2 28 56
Religious leaders 6 0.8 4 1 2 1.1 0 0
Posters 10 1.3 7 1 3 1.7 0 0
Billboards 2 0.3 2 0 0 0 0 0
Politicians 0 0 0 0 0 0 0 0
Other 84 11.3 63 12 20 11.3 1 2

30
Table 11: Favorite radio station
What is your favorite radio station?
Community Type
Total Project Community
Non-Project Community
Gov’t Partner Community
Freq % Freq % Freq % Freq %
Local FM 195 26.2 124 24 48 27.1 23 46
FM station outside the community
155 20.9 114 22.1 34 19.2 7 14
I do not have a favorite FM station
100 13.5 63 12.2 36 20.3 1 2
I do not have access to a radio 268 36.1 196 38 55 31.1 17 34
Others 25 3.4 19 3.7 4 2.3 2 4
Total 743 100 516 100 177 100 50 100
2.5.6 Other innovative approaches suggested Some existing and innovative approaches have also been proposed by the communities;
- Organize war dances and use the opportunity as rallying point for education. - Gatherings at funerals. - Church/group meetings.
2.6 Program implementation and management arrangements This section provides information on the implementation and management arrangements, logistic support, outputs and related outcomes. 2.6.1 Program management arrangements The WASH package program is implemented by five NGO partners and the County Health Team of Ground Bassa following an initial assessment of WASH facilities and services in the sampled counties/districts. This was followed by costing and provisional budgets which becomes the basis for developing a Program Cooperation Agreement (PCA) and the guiding documents for implementation the project. There is however, no assessment of current behaviors and profiling of the communities. UNICEF transfers funds early to facilitate speedy implementation of program activities. They also carried out monthly monitoring visits to all sites. There is a pre-project briefing / workshop organized for all partners involved with the project including sector, ministries and collaborating agencies. 2.6.2 Internal Coordination The link between HIV/AIDS and access to WASH has long been established but this link is yet to profoundly influence the choice and selection of communities for WASH within the Child Survival section of UNICEF. The management has initiated discussions on this subject. This is likely to result in joint planning and coordination. 2.6.3 Monitoring and support visits A team of line ministry officials (Ministry of Public Works and Ministry of Health and Social Welfare) carry out regular technical and supervisory support trips to verify different project communities. The aim is to assess progress, provide technical guidance and verify field reports presented by implementing partners.

31
At least one monitoring and support visit is made to each implementing agency by the WASH team in UNICEF. The aim is to understand any challenges, bring timely intervention and support to the partner organization. Feedback is provided by the WASH unit via formal and semi-formal channels. These are followed by tailor-made support for each partner to improve effectiveness and efficiency. Copies of monitoring trip reports and specific actions including follow-ups requested by the Chief of WASH and Head of section have been cited. The NGOs also undertake monitoring and retraining activities in project communities. During such visits they perform water quality tests to measure the presence and use of WaterGuard. 2.6.4 Coordination and collaboration The entry point for all agencies involved with the implementation of the program has been the County Health Teams (CHTs), Town Chiefs and agencies found to be implementing similar projects on the counties or districts. Examples mentioned include; Concern Worldwide, Danish Refugee Council (DRC), Population Services International (PSI), Solidarity, Ministry of Education, Ministry of Health and Social welfare. The County Superintendents and District Commissioners are usually contacted to satisfy administrative procedures at the country and district levels. There are monthly stakeholder coordination meetings where plans and progress reports from the different agencies or actors in the sector are shared. Others reported weekly meetings at the district level but a stakeholder / member of the Consortium of international NGOs asserts that such coordination meeting helps implementers to comply but does not necessarily bring out the best in the agencies. Another member of the Consortium suggests that there be monitoring of WASH activities and sharing of information and to avoid geographical duplication among implementing agencies in the counties. 2.6.5 Outputs and outcomes of WASH package All outputs planned under the WASH Package Approach program have been met although some of these outputs fell behind the stipulated dates for various reasons. The list of outputs included;
1. Rehabilitated Hand-dug-wells 2. Construction of new hand dug wells. 3. Construction and Rehabilitation of institutional latrines. 4. Training of Community Animators, Community health Volunteers, members of school
Health Clubs/committee members. 5. Construction tippy taps. 6. Sensitization of communities to stop open defecation and post triggering monitoring
visits. 7. Supply and construction of hand washing facilities in schools. 8. Distribution/sale and monitoring the use of WaterGuard to improve water quality
household drinking water. Appendix 3 contains a table of physical outputs completed under the program.
2.6.6 Achievements
1. All the partners mentioned they have learnt a lot. They also stated that their capacities have been built in diverse ways.
2. Most targets of the project have been met on schedule or earlier than the scheduled date.

32
3. Communities are generally satisfied with outputs and level services delivered and are asking for more facilities where the opportunity exists.
4. Ten communities have been sensitized or “triggered”. Out of these, eight (8) of them are on track to be declared open defecation free (ODF) communities.
5. Some equipment like water quality test kits and motorbikes have also been procured and allocated to partners as part of strengthening their capacities provide sanitation and hygiene education.
6. Reports of diarrhea on the decline. “We feel good about it (the program), we can‟t see sick people, the sickness can‟t come around all again” Gambo – Grand Gedeh.
2.6.7 Challenges Some challenges have been encountered during the implementation process. These have been reported at all levels and by different actors. The purpose of compiling these is to documents the difficult circumstances under which all actors are operating so that stakeholders can appreciate better the contribution of others towards achievement of project goals. They include:
NGO partners; o Difficult to replenish stocks when WaterGuard runs out. In the county (Maryland) o The change from contracts works with UNICEF to PCAs has been a real problem
for us. o In the past UNICEF used to give us too much stress, … they are up there and we
are down there” o Inadequate resources for the activities ”The budget is too tight”
Collaborating Agencies o There is duplication of work by other NGOs on the field. o Clash of approaches (CLTS & Subsidy – driven promotion of household latrines.) o Weekly coordination meetings can be unwieldy and sometimes burdensome.
Community based volunteers and NGO staff o “There is little preparation for us” - said a Community Health Volunteer o “ ... people want to see structures and not listen to talks” o High turnover of staff. o Tippy taps easily run out of water. o Post-triggering activities are a challenge, the people do not listen. o Communities have difficulties in keeping to their plans. o High emigration in communities. o Frequent breakdown of hand pumps. o The roads are bad and it takes long time to get to our destinations (project
communities).
Key Informants/Community leaders/Other respondents o “We have been drinking water from the creek since childhood, nothing happened
to us” o The price of WaterGuard is too high.
There too many and sometimes conflicting messages from different people (agencies).

33
Chapter Three (3): Conclusions and Recommendations 3.1 Direct program activities and outcomes 3.1.1 The extent to which program targets have been met As a program, the WASH package approach has implemented all planned activities for the period and has met most objectives set within the national sector policy framework of the Republic of Liberia (2009). Access to safe drinking water has improved among the project communities compared with non-project communities. The percentage of households that reported treating drinking water with WaterGuard and proper storage of same has increased over and above the set targets. The number of respondents who reported defecating in the open has declined drastically compared with those in non-project communities. Existing records and results presented in previous sections of this document suggest that program activities are implemented in counties which needed them most. Despite the high levels of achievements, some program potentials remain untapped. Other aspects have attracted marginal attention. They include; garbage disposal, mainstreaming gender into WASH and development of behavior profiles for expected hygiene promotion beneficiaries. These should eventually lead to the formulation of appropriate and realistic program objectives. Education and Communication for hygiene behavior change components of the program are yet to translate community readiness into increased access to latrines and adequate sanitation in general.
Recommendations
Garbage (refuse) disposal. It will be cost effective to strengthen household garbage storage and disposal components of WASH package program than is currently the situation. Perhaps a few notes added to the orientation pack for NGO‟s and to regularly train volunteers will optimize returns on resources invested as well as increase health outcomes in the project communities.
Mainstreaming gender and the needs of PLWHA into WASH program. UNICEF and partners should integrate gender, equity and the primary needs of other vulnerable populations more prominently. This should be applied more vigorously at the level of selecting project communities although it is currently the case at the county selection levels. It may only require a bit of attention at the stages of design, planning and monitoring. At the end of such intricately planned programs, the impact on the most vulnerable women, children and PLWHA would have been optimized.
Profiling expected hygiene behaviors at the design stage It is understood that the WASH Section of UNICEF is already inclined to conduct relevant baseline information including behavior change components. It can only be commended.
3.1.2 WASH in Schools The school WASH program has made a marked difference between schools in the program communities and their non-program counterparts. Whereas this is a successful outcome, the level is yet to attract the marks for Child Friendly School (CFS) standards. Some schools have staff limitations or transfer issues, others have leadership and administrative challenges which

34
prevent them from effectively using the WASH facilities provided them. Some structural defects have also reported. These can threaten the sustained use of the facilities over a long time. Some unscrupulous members of communities have also encroached or sometimes vandalized the facilities so painstakingly provided.
Recommendations
School Health Committee/Clubs (SHC) committees should be assisted and encouraged to display SHC action plans by placing them on school notice boards or walls. They should compile updates on these activities as part of routine school reports.
The District Education authorities should also make school WASH an integral part of routine school inspections.
UNICEF and partners should institute a scheme for school authorities to ensure proper use the WASH facilities in general and hand washing facilities in particular. They should also Include WASH in school inspection checklist and initiate best school or best SHC competition. These issues should be made items on WASH –UNICEF monitoring checklist liaising with Education Section in UNICEF may be helpful in seeking the support of education authorities in Liberia to support the initiative for scale up.
3.2 Program management and institutional arrangements 3.2.1 Program Management Program management and collaboration with other stakeholders has been very effective. This partly explains the very successful outcomes recorded during implementation. The regular consultation and involvement of line Ministry representatives and other stakeholders in developing program objects, pre-implementation briefs and orientation provided to partners, the participatory approach in developing PCAs, regular monitoring and feedback, regular review and timely implementation of management decisions, as well as persistent follow-ups on planned actions have contributed immensely are the contributing factors. They stand out as lessons for the future. These notwithstanding, there are limitations to be to be dealt with. There are internal benefits and support from other units and sections within UNICEF that can be leveraged to strengthen WASH. These are yet to be utilized. The distances and the ragged nature of the roads to some of the counties and project communities makes it difficult carry out effective monitoring and supportive visits. Practically, there can only be two days left for effective work if an officer travels by road to Maryland on a one week monitoring and support trip. Also, due the structure and bureaucracy, it difficult for some government partners to act swiftly. Sometimes, resources are not transferred because funds previously disbursed have not been accounted for or not “liquidated”. Recommendations
WASH unit in UNICEF should initiate joint planning and implementation arrangements within and with other sections. This action is already high on the agenda of the Child Survival section and is highly recommended although there may be initial setbacks. The first step will be the strengthening of intra-CS sectional coordination and inter sectional coordination with the Communication and Education sections who have clearly defined roles.

35
A review and documentation of WASH program planning and management processes will be necessary to validate the strengths as lessons to inform future programs and facilitate sector learning.
Officers in the WASH unit performing monitoring visits should continue with their current arrangement of carrying out purposive trips aimed at spending more days with partners who may be in distress and so require prolonged periods. It may have to be extended to partners who are performing very well so that best practices may be captured and shared with others.
WASH unit should collaborate with other international NGOs to monitor projects on behalf of WASH-UNICEF in the difficult to reach counties or communities. Some members of the Consortium have declared their willingness to do this within a mutually beneficial framework.
Recommendation for improving partnerships
The combination of both government and NGO partners as implementing agencies and how these have been effectively combined to produce program deliverables has to be shared as lessons with other sections/stakeholders.
The WASH unit has evolved interesting and innovative strategies in addressing inertia and delays during program implementation. These are good lessons to be shared with others stakeholders. Examples include:
o Persistent but very polite reminders to the schedule Officers In-Charge. These can be described as diplomatic “harassments”
o Timely reminders about their (partners) inability to access further funds until the liquidation is done and suggesting practical approaches to overcome genuine challenges.
o Gentle reminders sent up to the more senior government officials responsible for the program when other measures fail.
3.2.2 Community management structures and sustainability Individual members of the WASH committees have given a good account of themselves. Perhaps it is early days yet to judge as there are indications that all is not well with some of them. Some volunteers and WASH committee members are expecting rewards short of which they may not remain active members. Although this phenomenon is not unique, it is a pointer to the disbandment of such community based structures. It has been observed in other developing countries by Mansuri and Rao (2004). This can also be linked to the disintegration of the committees and subsequent breakdown and abandoned water points. There will always be dissatisfaction along the way, volunteers would always aspire and are likely to move on in life. When any of these happen, there program should not suffer. Recommendations
It is recommended that WASH section of UNICEF in collaboration with Government and NGO partners work closely with communities leaders to develop a criteria for selecting volunteers for training within the broader guidelines of government‟s guidelines. One

36
important proposition is for volunteers to have definite term to serve and be engaged. There should also be plans to replace them.
At any point in their service, potential volunteers should be identified and waiting to be trained. The thinking that volunteerism is forever must be revised.
Regular meetings and training programs should be organized for WASH committee members. They should be made to present themselves for scrutiny and be accountable to the wider community. Such opportunities should help volunteers present challenges associated with their responsibilities as volunteers and to receive support.

37
References
Ajen, I and Fishbein, M. (1980). Understanding attitudes and predicting social behavior. New Jersey: Prentice-Hall, Inc. Bandura, A. (1991). Self-efficacy mechanism in physiological activation and health-promoting behavior. In J. Madden, IV (Ed.), Neurobiology of learning, emotion and affect (pp. 229- 270). New York: Raven. Blanton. Liz, (2008). Baseline Report. Knowledge, Attitudes, and Practices Associated with Water Treatment, Hygiene, Diarrheal Diseases, and ORS/ORT - Liberia. Danish Refugee Council (March 2007). Report on Knowledge, Attitude and Practice (KAP) Baseline Survey On Watsan And Hygiene Conducted In Selected Communities Of The Counties Of Grand Kru, Maryland And River Gee, Liberia. Mansuri, G., and V. Rao. (2004). “Community-Based and –Driven Development: A Critical Review.” The World Bank Research Observer, Vol. 19, No. 1. Republic of Liberia (2008). Poverty Reduction Strategy Republic of Liberia (2001). Core Welfare Indicators Questionnaire. Republic of Liberia (2009). Water Supply and Sanitation Policy Ministry Of Lands, Mines And Energy In Collaboration With The Ministry Of Health And Social Welfare (MoH), Ministry of Public Works (MPW), Liberia Water And Sewer Corporation (LWSC), UNICEF, WaterAid and Consortium of OXFam-Led NGOs. Rosenstock I., Strecher, V., and Becker, M. (1994) Health Belief Model. Tones, K., and Tilford, S. (1994) HEALTH EDUCATION: Effectiveness, efficiency and efficacy. CHAPMAN & HALL. London. Based on: UNICEF (2009). Community based Household Water Treatment and Storage in cholera affected Counties in Liberia. United Nations Children's Fund & International Water and Sanitation Centre (1998). Towards Better Programming: A manual on school sanitation and hygiene UNICEF (2009a). Proposal for the Government of Japan Improved Food Security And nutrition status in post-conflict. Liberia. USAID (2007). Best practices in social marketing safe water solution for household water treatment: Lessons learned from population services international field programs.

38
Appendixes 1: Data Collection Tools: Questionnaire
GOVERNMENT OF LIBERIA - UNICEF WASH PACKAGE ASSESSMENT HOUSEHOLD
QUESTIONNAIRE FOR MOTHERS WITH CHILDREN FIVE YEARS OR LESS A. Introduction UNICEF has implemented a WASH program in selected counties over the past 6-9 months to facilitate the decline in cholera and other diarrhea diseases especially among children. You have been selected as a member of an evaluation team charged with the responsibility to gather relevant information using this questionnaire. This questionnaire will require that you follow instructions to households systematically and then select a mother with at least one child less than five years old in each household. You will need to be thorough, polite and diligent in administering the questions as you were thought during the enumerators’ training session. Read the questions and instructions carefully and draw a circle around the appropriate response. You must also write additional responses where it is needed legibly. Refer to you supervisor when you encounter any challenge or when you are in doubt.
1. Initials of Enumerator:_____________ 2. Date (DD/MM/YY): ____/____/2010 3. County:________________________ 4. District: __________________ 5. Name of Community______________ 6. Community Type1: 1-P 2-NP 3-GPP 7. Questionnaire number:____________ 8. Time: Started: ____/____/ (hh/mm)_
B. Background Information: Good morning/afternoon. My name is ……………………….. and I am part of a team collecting information on behalf of UNINEF - Liberia. UNICEF is implementing a project in this area aimed at improving access Water, Sanitation and Hygiene situation. I would like to speak with a mother who has a child not more than five years old about the water, sanitation and Hygiene situation in your household and also in this community. I will be grateful if you take some time to answer them. You are under no obligation to answer any of the questions. However, if you choose to participate, nothing you say will be used against you now or in the future. I also promise that the information you give will be used solely for the purposes of the project only. Do I have your permission to proceed with the discussion?
a. Yes, agreed (continue with Interview) b. No, (Discontinue and look for respondent).
How old is your youngest child? …………. a. 5 years or less (Continue with interview). b. No child or more than 5 years (Discontinue and find another respondent).
1 P - Project community
NP - Non-Project Community
GPP - Government Partner Project Community

39
1. Name of Respondent:____________________________
2. No. of household members: ____________
3. State of occupancy 1. Owner occupied 3. Squatter 2. Tenant 4. Others
4. Highest Educational level:
1. None 2. Primary 3. Secondary 4. College or 5. University 6. Others (Specify).............................
5. How long have you lived in this community? ____/(yy)
6. Occupation: 1-Farmer. 2-Trader. 3-Teacher. 4-Public Servant. 5- Unemployed. 6-Others (specify)………..
7. What is your estimated income a day, week or month? LD_______ (Convert to monthly): (LD 70 =US$1) _________
8. What is your marital status? 1-Single; 2-Married; 3-Separated; 4- Co-habitation; 5-Widow; 6-Others
C. Safe treatment and storage of household drinking water
1. Who fetches/draws drinking water for your household?
1. Myself 2. Children 3. My partner 4. Siblings/Family members or friends 5. Others; (Specify)…………………………………………………………………………
2. What is your source of drinking water?
1. Hand-dug-well fitted with hand pump. 2. Unprotected wells 3. Surface water (River/stream etc) 4. Other; (Specify) …………………………………………………………………………
3. How/where do you store your household‟s drinking water? (Select all that apply) (Note for EA: Verify container before you select an answer).
1. Bucket with cover 2. Jerry can (5 gallon containers) with cover 3. Jerry can (5 gallon containers) without lid. 4. Wide containers with lid 5. 5. Others (specify) …………………………………………………………………………
4. How easy is it for you to acquire a jerry can (5 gallon container) for storing water? 1. It is easy so I have one

40
2. It is not easy because it is expensive 3. It is not easy because I do not have space to keep it. 4. It is not easy because it is inconvenient to be pouring water. 5. It is not easy because the jerry can (gallons) is not easily available in the community 6. Other; (specify)……………………………….
5. Do you perceive yourself at risk due to the nature of your household drinking water? 1. Yes (Explain why?.............................................................) 2. No. (explain why?.............................................................)
6. You can do something on your own to improve the quality of your drinking water for you and your dependents to prevent cholera and other diarrheal diseases?
1. Yes 2. No 3. Not sure
7. Do you treat household drinking water with WaterGuard? 1. Yes (skip to Q9) 2. No
8. Why do you not treat your drinking water with WaterGuard? (Select all that apply) 1. WaterGuard is not easily available? 2. I cannot afford it. 3. It takes too much time 4. It gives the water a strong smell of a chemical 5. It give the water a different taste Note!! (Skip to question to 10 if you answered question 8)
9. How often do you treat your household drinking water?
1. Each time I fill the container with in fresh water. 2. As often as I feel there is a need. 3. Anytime I have access to the WaterGuard. 4. I do not treat my drinking water. 5. Others (Specify).
10. Are you willing and able to buy and use WaterGuard to treat your drinking water always?
1. Willing but not able due to lack of resources / finances 2. Willing and able 3. Unwilling due to taste and smell of the chemical. 4. It is not my priority
11. Are you willing and able to buy an appropriate jerry can (5 gallon container) for storing your household drinking water safely?
1. Willing but not able due to lack of resources finances 2. Willing and able 3. Unwilling due to the inconvenience of having lift and pour out water. 4. It is not my priority. 5. Others (Specify)………………………………………………………………..

41
12. What are you doing differently to your drinking water because of the education on WASH package?
1. Acquired jerry can. 2. Treat drinking water with WaterGuard. 3. Bleach powder 4. Others (Specify)…………………………………………………………………..
13. What were you told the last time somebody visited your house to test the quality of water in the past few months (three to six) months?
1. I was told to use WaterGurad. 2. I was asked to obtain a jerry can 3. I was not told anything. 4. There was no such visit in the past year.
D. Sanitation - Towards open defecation free (ODF) 1. Where do you and your household members defecate regularly?
1. Household latrine 2. Household latrine with hand washing facility 3. Public / Communal latrine 4. Public/Communal latrine with hand washing facility 5. Dig and bury. ----------------------------------------------------------(Skip to Q 5) 6. Open defecation; beach, bush, poly bags, street corners. (Skip to Q 5) 7. Others (Explain)? ……………………………………………….(Skip to Q 5)
2. Do you have separate latrines for males and females?
1. Yes 2. No
3. Do you have hand washing facilities close to the latrine? (Note for EA: Verify the availability of HWF before you select an answer).
1. Yes 2. No 3. Not Applicable
4. Who cleans or maintains the latrine you use? / Who is likely to clean / maintaining latrines?
1. Female adults in the community 2. Male adults in the community 3. Children 4. Other members of the family 5. The community or community groups. (specify) 6. Not Applicable
5. Where do you dispose of children‟s feces (toilet) in this household? 1. Throw it along bath water into the open
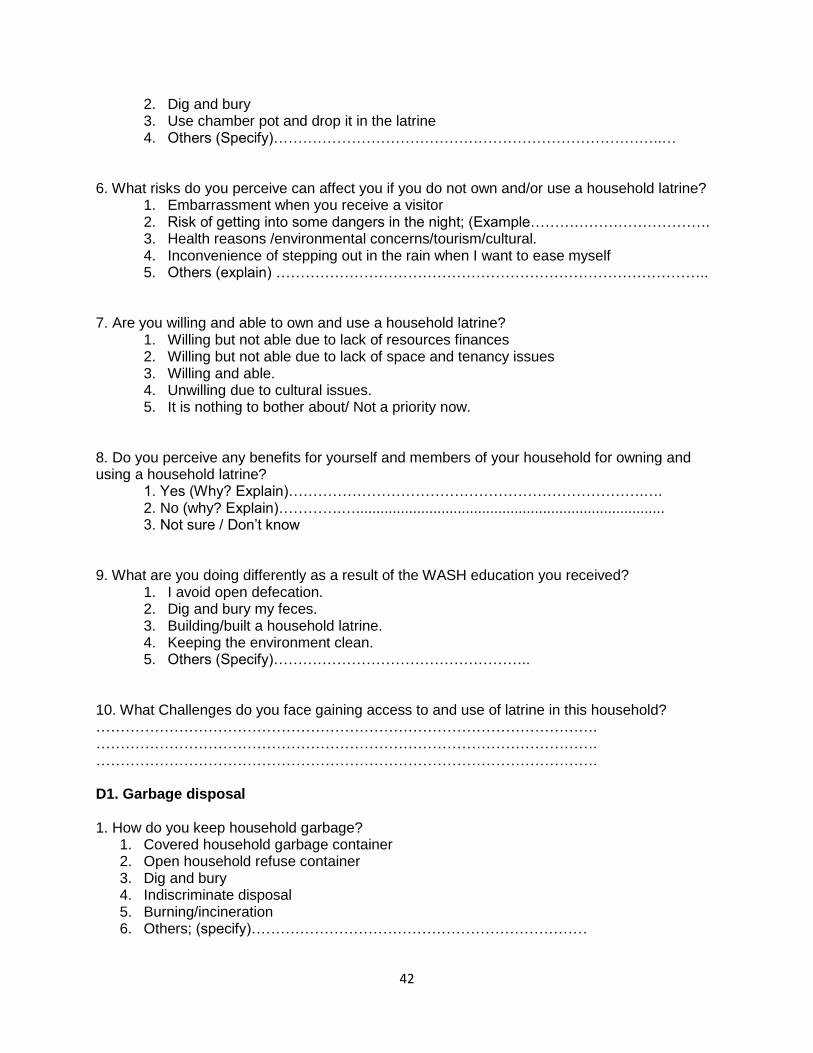
42
2. Dig and bury 3. Use chamber pot and drop it in the latrine 4. Others (Specify)……………………………………………………………………..…
6. What risks do you perceive can affect you if you do not own and/or use a household latrine?
1. Embarrassment when you receive a visitor 2. Risk of getting into some dangers in the night; (Example………………………………. 3. Health reasons /environmental concerns/tourism/cultural. 4. Inconvenience of stepping out in the rain when I want to ease myself 5. Others (explain) ……………………………………………………………………………..
7. Are you willing and able to own and use a household latrine?
1. Willing but not able due to lack of resources finances 2. Willing but not able due to lack of space and tenancy issues 3. Willing and able. 4. Unwilling due to cultural issues. 5. It is nothing to bother about/ Not a priority now.
8. Do you perceive any benefits for yourself and members of your household for owning and using a household latrine?
1. Yes (Why? Explain)……………………………………………………………….…. 2. No (why? Explain)………….…............................................................................ 3. Not sure / Don‟t know
9. What are you doing differently as a result of the WASH education you received?
1. I avoid open defecation. 2. Dig and bury my feces. 3. Building/built a household latrine. 4. Keeping the environment clean. 5. Others (Specify)……………………………………………..
10. What Challenges do you face gaining access to and use of latrine in this household? …………………………………………………………………………………………. …………………………………………………………………………………………. …………………………………………………………………………………………. D1. Garbage disposal 1. How do you keep household garbage?
1. Covered household garbage container 2. Open household refuse container 3. Dig and bury 4. Indiscriminate disposal 5. Burning/incineration 6. Others; (specify)……………………………………………………………

43
2. Where do you dispose off your household garbage? 1. Public garbage container/place 2. Dig and bury 3. Burn 4. Throw away in the open 5. Others; (specify) …………………………………………………………..
3. Are you comfortable with how you dispose of garbage in this household?
1. Yes 2. No. (Why Explain? …………………………………………………
4. What challenges confront your household on garbage disposal?
1. Dirty surroundings 2. Fly nuisance 3. Smelling neighborhood 4. No challenge 5. Others; (specify)
5. Do you perceive the community is willing and able to do something towards proper waste disposal?
1. Yes 2. No 3. Not sure / Don‟t Know.
E. Hand Washing With Soap (HWWS) 1. Do you have a hand washing facility with soap at home.
1. Yes 2. No 3. Not sure / Don‟t Know
2. Do you perceive any dangers for which you will need a hand washing facility with soap?
1. Yes, to avoid infection 2. Yes, to avoid passing on germs to others 3. No.
3. Do you perceive any benefits from washing your hands regularly with soap? 1. Yes 2. No 3. Not Sure/Don‟t Know
4. Is it convenient for you and other members of your household to wash your hands regularly with soap?
1. Yes (Explain ……………………………………………………………… 2. No (Explain) ……………………………………………………………….
5. Under what circumstances would you wash your hands? (Select all that apply) (Do not prompt!!)
1. Before meals, 2. Feeding a child. 3. Preparing/serving a meal. 4. After latrine 5. After cleaning a child‟s feces or changing dippers

44
6. After meals 7. Others (Specify) …………………………………………………………….
6. Are you willing and able to own and use a household hand washing facility?
1. Willing but not able due to lack of resources to by soap. 2. Willing but the landlord will not allow it. 3. Willing and able. 4. It is not my priority now.
7. What are you doing differently as a result of the WASH education? (Select all that apply)
1. Wash hands regularly. 2. Build/world buy hand washing facilities. 3. Educate child(ren) to wash hands regularly. 4. I was not educated/Don‟t know. 5. Others (Specify) ……………………………………………
8. How many episodes of diarrhea has you child (under five years experienced in the past six months? 1. None 2. Once
3. twice 4. thrice 5. More than thrice. 6. Others (Specify) ………………………………………………………...
9. How many episodes of diarrhea has you child (under five years) experienced six months previously (Note: previous to the period referred to above)? 1. None 2. Once 3. Twice 4. Thrice 5. More than thrice 6. Others (Specify) ………………………………………………………... F. Assessing behavior triggers 1. You are capable of making good hygiene decisions in your household.
1. True 2. False 3. Not sure / Don‟t Know
2. Who matters to you when it comes to taking household WASH related decisions? (Select all that apply)
1. Landlord/lady 2. Religious leader 3. Traditional leader 4. Head of family 5. Political representatives 6. Government Officials 7. Others (Specify)…………………………………………………………………..
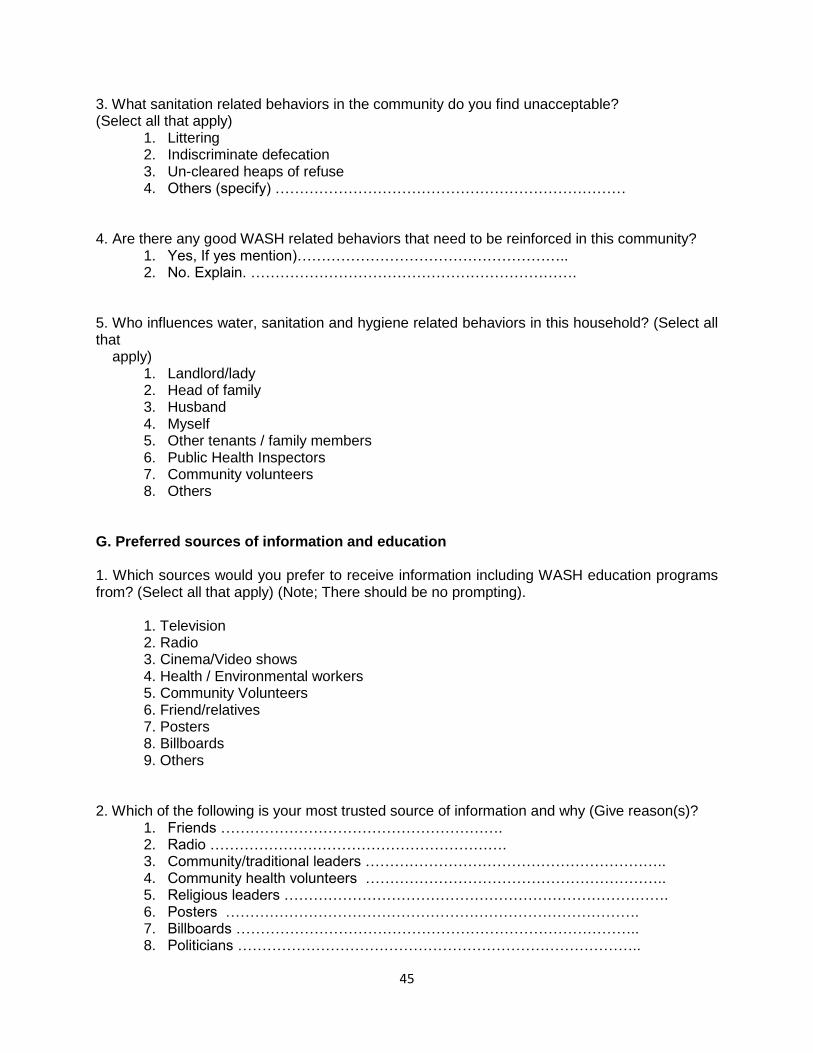
45
3. What sanitation related behaviors in the community do you find unacceptable? (Select all that apply)
1. Littering 2. Indiscriminate defecation 3. Un-cleared heaps of refuse 4. Others (specify) ………………………………………………………………
4. Are there any good WASH related behaviors that need to be reinforced in this community? 1. Yes, If yes mention)……………………………………………….. 2. No. Explain. ………………………………………………………….
5. Who influences water, sanitation and hygiene related behaviors in this household? (Select all that apply)
1. Landlord/lady 2. Head of family 3. Husband 4. Myself 5. Other tenants / family members 6. Public Health Inspectors 7. Community volunteers 8. Others
G. Preferred sources of information and education 1. Which sources would you prefer to receive information including WASH education programs from? (Select all that apply) (Note; There should be no prompting).
1. Television 2. Radio 3. Cinema/Video shows 4. Health / Environmental workers 5. Community Volunteers 6. Friend/relatives 7. Posters 8. Billboards 9. Others
2. Which of the following is your most trusted source of information and why (Give reason(s)?
1. Friends …………………………………………………. 2. Radio ……………………………………………………. 3. Community/traditional leaders …………………………………………………….. 4. Community health volunteers …………………………………………………….. 5. Religious leaders ……………………………………………………………………. 6. Posters …………………………………………………………………………. 7. Billboards ……………………………………………………………………….. 8. Politicians ………………………………………………………………………..

46
9. Others (Specify)…………………………………………………………………. 3. What is your favorite radio station?
1. Local FM . (Mention the name and location) …………………………………… 2. FM station outside the community (Specify)……………………………………. 3. I do not have a favorite FM station. 4. I do not have access to a radio. 5. Others specify………………………………………………………………………..
4. Is there any formation you feel like passing on to help you access WASH facilities and services ……………………………………………………… ……………………………… ………………………………………………………. ……………………………… ………………………………………………………. ……………………………… End of the interview. Thank You very much. Time Ended: ____/____/ (hh/mm/) Supervisor‟s Initials: ……………………………………… Date:……………………………….. Conduct Latrine, Wand washing and hand washing facility observation with the aid of checklist on next page:

47
WASH PACKAGE ASSESSMENT HOUSEHOLD WASH OBSERVATION GUIDE
County: ………………………………… District………………………….. Community……………………… Type: ……………………………
(Household/Community/school) Enumerators initial………………….. H. Observation Guide: Observation Comments 1. Hand washing facility near latrine 1. Yes 2. No. (…………………………) 2. Hand washing facility with soap 1. Yes 2. No (…………………………) 3. State of latrine ( Describe the state of latrine); a. Neatness
Immediate environment 1. Yes 2. No (…………………………)
Disposal of anal cleansing materials 1. Yes 2. No. (……………………….) b. Odor. 1. Yes 2.No (…………………………..) d. Access to children 1. Yes 2. No (…………………………..)
f. Any defects with the structure; 1. Yes 2. No (……………………………) 4. Hand washing facility 1. Yes 2. No (…………………………..)
a. Attached to facility or immediately in sight? 1.Yes 2. No (……………………………) b. Availability of water 1. Yes . No (……………………………) c. Availability of soap on site 1. Yes 2. No (……………………………) d. Other observations; ……………………………………………………………………….. e. The person using the latrine wash hands? 1. Yes 2. No (……………………………)
(ensure you observe one hand washing event)
5. Evidence of cleansing and maintenance? 1. Yes 2. No (………………………….)
1. Who/Roaster? …………………………………………………………….. 2. When? ……………………………………………………………………… 3. How? ……………………………………………………………………….. 4. How often? …………………………………………………………………
Supervisor‟s Initials: ………………….. Date: …………………………………

48
Appendix 2 Water Quality (Pool Test Results)
County Maryland Grand Gedeh Grand Bassa G. Cape Mt. Margibi
C O M M U N I T Y
G B O N
W E T C H E K E N
T U G B A K E N
D U G B O K E N
K R A H T O W N
K U M A H T O W N
G A M B O
Z L E H
B U C H A N A N
G I O
N Y O N B E N
G O R Z H N
Q U E D A G A H
B E H N T O W N
F A L I X
S E G B E H U M
T U S O R
D O L O 'S T O W N
G I B I
P A Y E T O W N
J E N E T A
T I E N E
Serial #
1 0 0 0 0 1 1 1 0 0 0 0 1 0 0 0 1 1 1 0 1 1 1 0
2 0 0 1 0 1 1 0 0 0 0 1 1 1 0 0 1 1 1 0 0 1 1 0
3 0 1 1 0 1 0 0 0 0 1 0 0 1 0 0 1 1 1 0 1 1 1 0
4 1 0 0 0 1 1 1 0 0 1 0 1 1 1 0 1 1 1 0 0 1 1 0
5 1 1 1 0 1 1 1 0 0 1 1 0 0 0 0 1 1 1 0 1 1 1 0
6 1 0 0 0 1 0 1 0 0 1 0 0 1 0 0 1 1 0 0 1 1 1 0
7 1 0 0 0 1 1 1 0 0 1 0 0 1 0 0 1 1 x 0 0 1 1 0
8 1 0 0 0 1 1 0 0 0 0 0 x x 0 0 1 1 x 0 0 1 1 0
9 1 0 0 0 1 0 1 0 1 0 0 x x 0 0 1 0 x 0 x 1 1 0
10 1 0 0 0 1 0 1 0 0 0 1 x x 0 0 1 1 x 0 x 1 1 0
11 1 0 0 0 1 0 1 0 1 0 0 x x x 0 1 1 x 0 x 1 1 0
12 1 0 0 0 1 0 1 0 1 0 0 x x x 0 1 1 x 0 x 1 1 0
13 1 0 0 0 1 0 1 0 0 0 0 x x x 0 1 1 x 0 x 1 1 0
14 1 1 0 0 1 1 1 0 1 0 0 x x x 0 1 1 x 0 x 1 1 0
15 1 0 0 0 1 0 0 0 0 0 0 x x x 0 1 1 x 0 x 1 1 0
Total 12 3 3 0 15 7 11 0 4 5 3 3 5 1 0 15 14 5 0 4 15 15 0
n= 15 15 15 15 15 15 15 15 15 15 15 7 7 10 15 15 6 15 8 15 15 15

49
Appendix 3: Table of physical outputs completed under WASH Package Approach program
No.
Output/Activity CODES
ERS (ML)
SCODES
FAAL (GCM)
ECRIP
(GB-CHT)
Total
1 Number of communities
32 57 39 14 53 195
2 Contruction of latrines
40 15 23 10 88
3 Rehabilitation of latrines
30 34 43 10 117
4 Hand washing facilities
20 36 37 10 103
5 Rehabilitation of hand dug wells
6 5 6 3 20
6 Construction of hand dug wells
3 2 0 5
7 Tippy taps 328 500 953 1781
8 WaterGuard distributed
3393 9600 100 6,600 19693
9 Locally made soap distributed
204 204
10 Branded T shirts distributed
200 200
11 Caps distributed 197 197
12 Participants tranined in CHAST
89 78 105 272
13 Number of communities triggered
8 10 10 28

50

51
Appendix – 4: List of Key Informants and Persons Contacted
No. Name Organization Telephone
Mr. Haile W. Hailemichael DRC, Harper 0687-8667
Ms. Jane Stuttard – Nutritionist DRC Harper
Syner Nah ERS
Tablah ERS
Dr. Odell Kumeh and CHO- Maryland
Anita Krugar (EHT), Maryland - CHT
Fabien Cassan – Field Coordinator – Cel: 0681-1021
Solidarity
Denis VanHortegem Solidarity
Abraham Powell ECRIP
Amos Gborie SCODES
Tamba Mulba CODES
Samson Nizze ERS
Hassan Fahnsulleh FAAL
Dehwehn Paul Yeabaa Director, Division of Environment and Occupational Health

52
Appendix 5: LIST OF PARTICIPANTS AT THE DISSEMINATION / VALIDATION WORKSHOP - 03/11/2010
Chantal Richey OXFAM 077591139
Emily Harris PSI 06784799
Hamidou Maiga UNICEF 06308570
Tamba W. Bundor CODES 06514325
Henry Twe H ERS 06527388
D. Hassan Fahnsulleh FAAL 06570700
Wataku Kortimai UNICEF 06532431
Paul C Jablai UNICEF 06417064
G. Abraham Powell ECRIP 06551390
Gayflod Jallah MOH/DEOH 077972712
G. Woloba Karwee MPW 06455530
Winifred H. Doe PEACE 076382585
Francis P. Baar CIPORD 06836882
Aaron K. Gbancon CIPORD 06417815
Stephen Ntow WASHealth Solutions +233-244-802265